Embed Size (px)
Citation preview
Review ArticleA Review on Automatic Mammographic Density andParenchymal Segmentation
Wenda He,1 Arne Juette,2 Erika R. E. Denton,2 Arnau Oliver,3
Robert Martí,3 and Reyer Zwiggelaar1
1Department of Computer Science, Aberystwyth University, Aberystwyth SY23 3DB, UK2Department of Radiology, Norfolk & Norwich University Hospital, Norwich NR4 7UY, UK3Department of Architecture and Computer Technology, University of Girona, 17071 Girona, Spain
Correspondence should be addressed to Wenda He; [email protected] and Reyer Zwiggelaar; [email protected]
Received 13 January 2015; Revised 21 April 2015; Accepted 17 May 2015
Academic Editor: Mireille Broeders
Copyright © 2015 Wenda He et al. This is an open access article distributed under the Creative Commons Attribution License,which permits unrestricted use, distribution, and reproduction in any medium, provided the original work is properly cited.
Breast cancer is themost frequently diagnosed cancer inwomen.However, the exact cause(s) of breast cancer still remains unknown.Early detection, precise identification of women at risk, and application of appropriate disease prevention measures are by far themost effectiveway to tackle breast cancer.There aremore than 70 common genetic susceptibility factors included in the current non-image-based risk predictionmodels (e.g., the Gail and the Tyrer-Cuzickmodels). Image-based risk factors, such as mammographicdensities and parenchymal patterns, have been established as biomarkers but have not been fully incorporated in the risk predictionmodels used for risk stratification in screening and/or measuring responsiveness to preventive approaches. Within computeraided mammography, automatic mammographic tissue segmentation methods have been developed for estimation of breast tissuecomposition to facilitatemammographic risk assessment.This paper presents a comprehensive review of automaticmammographictissue segmentation methodologies developed over the past two decades and the evidence for risk assessment/density classificationusing segmentation. The aim of this review is to analyse how engineering advances have progressed and the impact automaticmammographic tissue segmentation has in a clinical environment, as well as to understand the current research gaps with respectto the incorporation of image-based risk factors in non-image-based risk prediction models.
1. Introduction
Breast cancer is the most common cause of death in femalecancer sufferers in both developed and developing countries[1]. The exact cause(s) of the majority of breast cancers stillremains unknown [2]. By far the most effective way to tacklethe disease is through early detection, precise identification ofwomen at risk, and applying preventative measures. Withinscreening mammography, both mammographic density andparenchymal pattern have been established as image-basedrisk factors [2]. Current studies suggest that mammographicdensity is a major risk factor, even though it adds only little tothe Gail model [3], and it is still not clear how to incorporatethe factors as biomarkers into the risk prediction models [4].
Substantial advances have been made with computeraided mammography in breast cancer research and treat-ment. Mammographic risk can be assessed in a clinical
environment based on subjective appraisal of mammogramsusing protocols such as BI-RADS (American College ofRadiology’s Breast Imaging Reporting and Data System)[5], which can lead to inter- and intraobserver variability[6]. Within computer aided mammography, the idea ofdeveloping a fully automatic and repeatable breast tissuesegmentation using computer vision and machine learningtechniques is to facilitate cancer risk classification.Themajorchallenge is to segment a given mammogram according todensity and/or parenchymal patterns so that the distributionand characteristic mixture of the breast tissue can be deter-mined, leading to an accurate and objective breast cancerrisk estimation. Many studies have been conducted in anattempt to achieve this; however there are still significantgaps in translating the newly acquired knowledge into clinicalimprovements [2]. In the recent publication, Harvey et al.[7] evaluated mammograms for approximately 3400 women.
Hindawi Publishing CorporationInternational Journal of Breast CancerVolume 2015, Article ID 276217, 31 pageshttp://dx.doi.org/10.1155/2015/276217
2 International Journal of Breast Cancer
Breast density was calculated using automated software andused as an additional image-based risk factor for cancerrisk prediction. Results indicated that reading of individualrisk can be more accurate by incorporating image-based riskfactors into established non-image-based risk model (e.g.,the Gail [8] and the Tyrer-Cuzick [9] models). The initialresults, based on a limited dataset, are promising; however,more investigations and evidence are required in order tofully establish and incorporate density into risk models in aclinical environment and to establish their place in changingclinical practice. A recent case-control study [10] comparedsix established digital mammographic density assessmentmethods and their ability to predict breast cancer risk. Theselected approaches included three area based approachesand three fully automated volumetric methods. Area basedapproaches are referred to as mammographic image analysisover 2D breast tissue projection, whilst volumetric methodsfocus on assessment of the true physical volume of breastcomposition. With respect to patient care and economic sus-tainability, it is critical to have an effective and cost-effectiveanalysis to evaluate the potential for personalised screen-ing and prevention programmes and reduce anxiety andstress to the patient resulting from overscreening/treatment[11].
This paper presents a comprehensive review on automaticmammographic breast density and parenchymal segmenta-tion methodologies developed over the past two decades,from its infancy in the early 90s to date. Note that mam-mographic breast density and parenchymal segmentation isreferred to as mammographic tissue segmentation in therest of the paper. The aim of this review is to analysehow engineering advances have progressed over these twodecades and the impact automatic mammographic tissuesegmentation has had in the clinical environment. Automaticmammographic tissue segmentation and measuring breasttissue composition for risk stratification (to adapt screeninginterval to risk) may be of prognostic value in distinguishingwomen with certain mammographic appearance likely todevelop breast cancer, leading to a successful preventionand/or treatment. It should be noted that the focus of thisreview is to discuss how automated (as opposite to manualand semiautomated) segmentation of breast density andparenchyma is able to assist in the prediction of risk ofdeveloping cancer. These techniques do not aim to assess therisk of increased density masking breast cancer [12] whenpresent although the two issues are clearly related. Note thatthe review does not cover aspects of abnormality detection orabnormality segmentation.
The remainder of the paper is organised as follows:Section 2 describes the established breast parenchymal pat-terns as seen in breast images and their interconnected rela-tionships between different schemes, Section 3 briefly dis-cusses mammograms and variations, Section 4 criticallyreviews the existing automatic mammographic tissue seg-mentation strategies in the literature, Section 5 provides dis-cussion with respect to the development of automatic mam-mographic tissue segmentation, its progress, current state,and future beyond translational research in clinical practices,and Section 6 concludes the review.
2. Breast Parenchymal Patterns andDensity Categories
Within screening mammography, a number of (mammo-graphic risk assessment) schemes have been developed toestimate the likelihood of women developing breast cancer:Wolfe (1976) [13, 14], Tabar (1982) [15, 16], Boyd (1995) [17, 18],and BI-RADS (1993) [5, 19].
2.1. Wolfe. Wolfe [13] empirically categorised mammogramsinto four parenchymal patterns:
(1) N1 (primarily fatty): mammogram is composed of fatand a few fibrous tissue strands.
(2) P1 (≤25% prominent ducts): mammogram shows aprominent duct pattern and a beaded appearance canbe found either in the subareolar or the upper axillaryquadrant.
(3) P2 (>25% prominent ducts): mammogram indicatessevere involvement of a prominent duct pattern,which may occupy from one-half up to all of thevolume of the parenchyma.
(4) DY (dense fibrovascular tissue): mammographic fea-tures show an increase in density of the parenchyma,whichmay be homogeneouswith aminor componentof prominent ducts.
Wolfe’s classification was found to be associated with breastcancer risk, and data analysis has revealed a progressiveincrease of asmuch as 37 times higher future cancer risk fromN1 (the lowest risk) to DY (the highest risk) [14, 20]. Wolfe’spioneering study generated considerable controversy due tothe (first) randomised controlled mammographic screeningtrial [21] and limited mammographic capability (e.g., breastpositioning and compression) of the early 70s [14]. It shouldbe noted that Wolfe’s method cannot be repeated for itssubjectivity of assessment. Wolfe’s 1976 conclusions [13]have been criticised as erroneous and unrealistic, but therealisation of the association between parenchymal patternsand mammographic risk is indisputable, which contributedtremendously in research of image-based mammographicrisk classification and leads the way for future clinicaladvances. The reader is referred to [14] for the key aspects ofthis study which caused debate of the controversies [13].
2.2. Tabar. Strongly influenced by Wolfe’s work [21], Tabarand Dean [15] proposed a model based on a mixture offour mammographic building blocks composing the normalbreast anatomy: nodular (N) densities mainly correspondto terminal ductal lobular units; linear (L) structures corre-spond to either ducts or fibrous or blood vessels; homoge-neous (H) structureless densities correspond to fibrous tis-sues; radiolucent (R) areas are related to adipose fatty tissues.Mammogramswere subdivided into five risk categories basedon the distributions of the four building blocks (e.g., [N%,L%, H%, R%]) [16]:
(1) TI is composed of [25%, 15%, 35%, 25%], the low-est risk. Mammogram shows normal fibroglandular
International Journal of Breast Cancer 3
tissue with partial fatty replacement, where patholog-ical changes can be easily perceived despite the factthat the breast may be “dense” radiologically.
(2) TII is composed of [2%, 14%, 2%, 82%]. Mammogramis characterised by the overrepresentation of radiolu-cent fatty tissue, which provides excellent backgroundfor radiologists to detect abnormalities.
(3) TIII is similar in composition to TII, except thatthe retroareolar prominent ducts are often associatedwith periductal fibrosis. Neither of these patterns (i.e.,TII and TIII) has nodular densities or diffuse fibrosis,and the overrepresentation of radiolucent fatty tissuemakes pathological lesions relatively easier to detectthrough mammography.
(4) TIV is composed of [49%, 19%, 15%, 17%]. Mammo-gram is dominated by prominent nodular, linear den-sities and appears to be resistant to the process ofinvolution, which makes perception of pathologicallesions difficult on mammograms.
(5) TV is composed of [2%, 2%, 89%, 7%], the highestrisk. Mammogram is dominated by extensive homo-geneous structureless fibrous tissue, which limitsthe capabilities of mammography to demonstratethe normal anatomy and reveal small pathologicallesions.
Tabar’s approach is based onmammographic anatomic (path-ologic) correlations rather than pattern reading alone (e.g.,Wolfe classification), and the primary difference betweenWolfe and Tabar’s classification is Tabar’s TI [22, 23]. Tabar’sdefinitions of mammographic risk patterns are more dis-criminatory than Wolfe’s, helping to increase reproductiveaccuracy of the classification.The reader is referred to [23, 24]for a detailed comparison with respect to these two riskschemes.
2.3. Boyd. In a subsequent study to [13], Wolfe et al. [85]described a stronger association between mammographicdensity and breast cancer risk. This led Boyd et al. [17] todevelop a method to measure mammographic percentagedensity using a computer aided technique, which markedmovement away from describing patterns to objective assess-ment using tissue percentages. In particular, the risk cate-gories are defined using a thresholding method [86], alsoknown as the Cumulus interactive threshold software (Uni-versity of Toronto), which is considered to be the “goldstandard” tool for density measurement [81, 87]. With theCumulus, the reader can identify the boundaries of thebreast tissue, define the threshold for dense tissue on themammogram, and measure the total area of the breast. Thepercentage of mammographic density is examined to esti-mate the proportion of fibroglandular tissue (as opposed tofat) of the breast and is divided into six class categories (SCC):
(1) SCC1, density = 0%,(2) SCC2, density < 10%,(3) SCC3, 10% ≤ density < 25%,
(4) SCC4, 25% ≤ density < 50%,(5) SCC5, 50% ≤ density < 75%,(6) SCC6, density ≥ 75%.
Subsequent follow-up studies [17, 88] have established asignificant independent association between overall breastdensity and future breast cancer risk, which indicated amuch lowermagnitude (4-5 times increase) than the 37 timesincrease initially proposed by Wolfe [13].
2.4. BI-RADS. A series of studies (e.g., [85, 88, 89]) indicatedthat the percentage of dense breast tissue is highly associatedwith breast cancer risk. BI-RADS [5]was designed as a qualityassurance tool to standardise mammography reporting, inorder to reduce confusion in breast imaging interpretationsand to facilitate outcome monitoring. Four breast composi-tions were identified as follows:
(1) B1, the breast being almost entirely fat (<25% glandu-lar);
(2) B2 (25%–50% scattered fibroglandular densities);(3) B3 (50%–75% heterogeneously dense breast tissue);(4) B4, the breast being extremely dense (>75% glandu-
lar).
BI-RADS, widely used throughout North America andmuchof Europe [90], covers the significant relationship betweenincreased breast density and decreased mammographic sen-sitivity in detecting cancer [14, 91].
Area based assessments can be subjective and impre-cise. Volumetric density is a relatively new concept. Thedeveloped volumetric measuring techniques work out whatkind of tissues must have been present by assessing breastcomposition at each pixel by calculating theX-ray attenuationbetween that pixel and the X-ray source [83]. Volumetricbreast density and visual assessment are strongly correlated[10]; however, visual density categories as described in BI-RADS based on 2D projection cannot be directly used forvolumetric breast density assessments. For example, visualdensity areas as shown in side on views of breasts undercompression can be the same/similar due to superimposition;the measurements can be very different if measured based onvolumetric breast density. The fifth edition of BI-RADS Atlas[92] included changes in breast density reporting categorieswith emphasis on volumetric assessments. The updated BI-RADS helps clarify what breast density assessment should beand distinguishes density from other BI-RADS assessments.The latest edition indicates that, in a clinical environment,focus of density as a risk factor has now moved towardsdensity as a masking factor.
2.5. Correlations between Different Schemes. Muhimmahet al. [24] investigated the (Spearman’s) correlations (𝑟
𝑠)
between the four different schemes (i.e., Wolfe, Boyd, BI-RADS, and Tabar) using the MIAS (Mammographic ImageAnalysis Society) database [93], which is a publicly available,digitised database. Results indicate risk classification map-pings between the four schemes as follows.
4 International Journal of Breast Cancer
(i) Wolfe → Boyd: N1 → SCC1, P1-2 → SCC2–5, and
DY → SCC6; 𝑟𝑠 = 0.93; this is in line with reportedresults (𝑟
𝑠= 0.81) by Brisson et al. [91];
(ii) Wolfe → BI-RADS: N1 → B1, P1 → B2, P2 → B3,and DY → B4; 𝑟𝑠 = 0.93.
(iii) Wolfe → Tabar: N1 → TII, P1 → TIII, P2 → TIV,and DY → TV; 𝑟𝑠 = 0.93 excluding TI due to theweak correlation with any of the Wolfe patterns [24];this is in line with results in [22, 23];
(iv) Boyd → BI-RADS: SCC1 → B1, SCC2-3 → B2,SCC4-5 → B3, and SCC6 → B4; 𝑟𝑠 = 0.91;
(v) Boyd → Tabar: SCC1 → TII, SCC2-3 → TIII,SCC4-5 → TIV, and SCC6 → TV; 𝑟𝑠 = 0.93;
(vi) BI-RADS → Tabar: B1 → TII, B2 → TIII, B3 →TIV, and B4 → TV; 𝑟𝑠 = 0.96 excluding TI [24];a recent study [94] indicated a strong direct corre-lation between these two schemes with TI taken intoaccount, where B1 → TII/III, B2 → TI, B3 → TIV,and B4 → TV; 𝑟𝑠 = 0.92; note that Tabar’s TII and TIIIhave the same tissue composition; see Section 2.2.
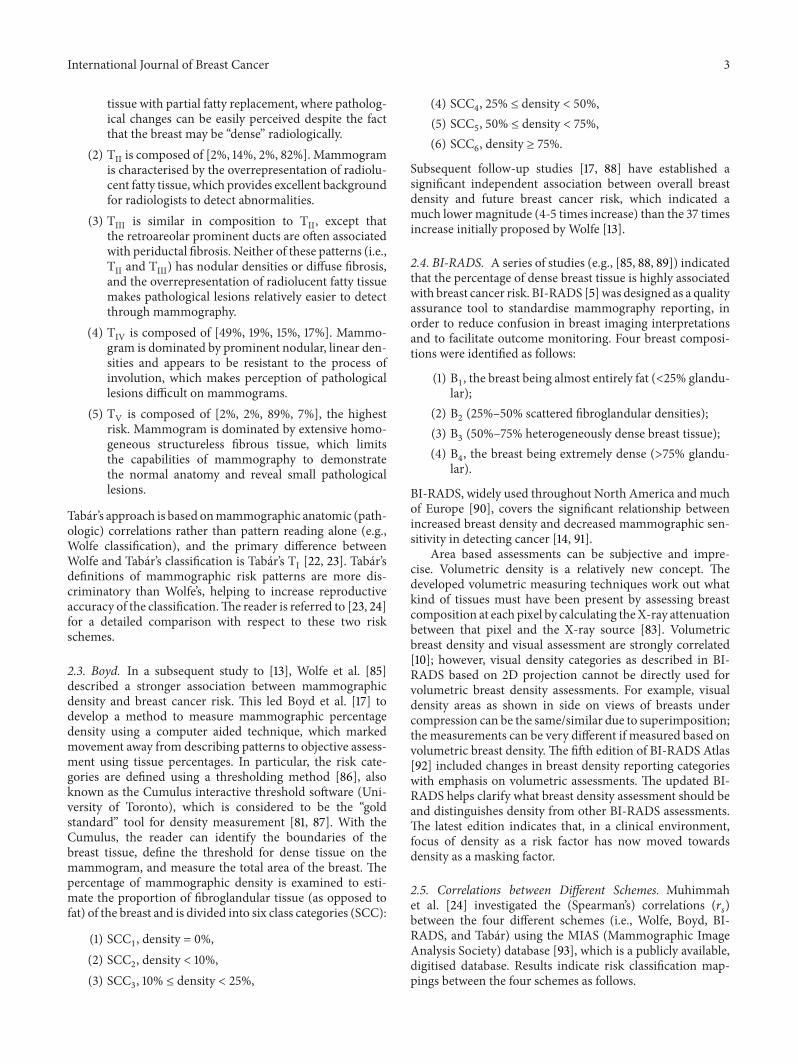
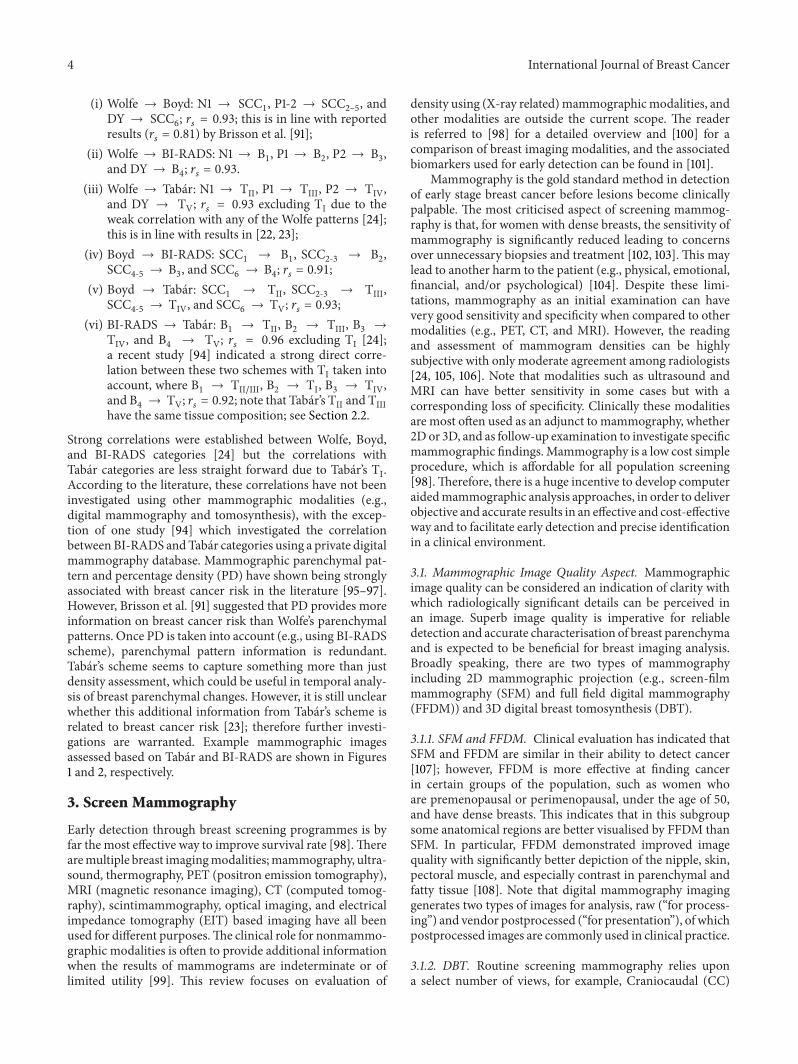
Strong correlations were established between Wolfe, Boyd,and BI-RADS categories [24] but the correlations withTabar categories are less straight forward due to Tabar’s TI.According to the literature, these correlations have not beeninvestigated using other mammographic modalities (e.g.,digital mammography and tomosynthesis), with the excep-tion of one study [94] which investigated the correlationbetween BI-RADS andTabar categories using a private digitalmammography database. Mammographic parenchymal pat-tern and percentage density (PD) have shown being stronglyassociated with breast cancer risk in the literature [95–97].However, Brisson et al. [91] suggested that PD provides moreinformation on breast cancer risk than Wolfe’s parenchymalpatterns. Once PD is taken into account (e.g., using BI-RADSscheme), parenchymal pattern information is redundant.Tabar’s scheme seems to capture something more than justdensity assessment, which could be useful in temporal analy-sis of breast parenchymal changes. However, it is still unclearwhether this additional information from Tabar’s scheme isrelated to breast cancer risk [23]; therefore further investi-gations are warranted. Example mammographic imagesassessed based on Tabar and BI-RADS are shown in Figures1 and 2, respectively.
3. Screen Mammography
Early detection through breast screening programmes is byfar the most effective way to improve survival rate [98].Therearemultiple breast imagingmodalities;mammography, ultra-sound, thermography, PET (positron emission tomography),MRI (magnetic resonance imaging), CT (computed tomog-raphy), scintimammography, optical imaging, and electricalimpedance tomography (EIT) based imaging have all beenused for different purposes.The clinical role for nonmammo-graphic modalities is often to provide additional informationwhen the results of mammograms are indeterminate or oflimited utility [99]. This review focuses on evaluation of
density using (X-ray related)mammographicmodalities, andother modalities are outside the current scope. The readeris referred to [98] for a detailed overview and [100] for acomparison of breast imaging modalities, and the associatedbiomarkers used for early detection can be found in [101].
Mammography is the gold standard method in detectionof early stage breast cancer before lesions become clinicallypalpable. The most criticised aspect of screening mammog-raphy is that, for women with dense breasts, the sensitivity ofmammography is significantly reduced leading to concernsover unnecessary biopsies and treatment [102, 103]. This maylead to another harm to the patient (e.g., physical, emotional,financial, and/or psychological) [104]. Despite these limi-tations, mammography as an initial examination can havevery good sensitivity and specificity when compared to othermodalities (e.g., PET, CT, and MRI). However, the readingand assessment of mammogram densities can be highlysubjective with only moderate agreement among radiologists[24, 105, 106]. Note that modalities such as ultrasound andMRI can have better sensitivity in some cases but with acorresponding loss of specificity. Clinically these modalitiesare most often used as an adjunct to mammography, whether2Dor 3D, and as follow-up examination to investigate specificmammographic findings. Mammography is a low cost simpleprocedure, which is affordable for all population screening[98].Therefore, there is a huge incentive to develop computeraidedmammographic analysis approaches, in order to deliverobjective and accurate results in an effective and cost-effectiveway and to facilitate early detection and precise identificationin a clinical environment.
3.1. Mammographic Image Quality Aspect. Mammographicimage quality can be considered an indication of clarity withwhich radiologically significant details can be perceived inan image. Superb image quality is imperative for reliabledetection and accurate characterisation of breast parenchymaand is expected to be beneficial for breast imaging analysis.Broadly speaking, there are two types of mammographyincluding 2D mammographic projection (e.g., screen-filmmammography (SFM) and full field digital mammography(FFDM)) and 3D digital breast tomosynthesis (DBT).
3.1.1. SFM and FFDM. Clinical evaluation has indicated thatSFM and FFDM are similar in their ability to detect cancer[107]; however, FFDM is more effective at finding cancerin certain groups of the population, such as women whoare premenopausal or perimenopausal, under the age of 50,and have dense breasts. This indicates that in this subgroupsome anatomical regions are better visualised by FFDM thanSFM. In particular, FFDM demonstrated improved imagequality with significantly better depiction of the nipple, skin,pectoral muscle, and especially contrast in parenchymal andfatty tissue [108]. Note that digital mammography imaginggenerates two types of images for analysis, raw (“for process-ing”) and vendor postprocessed (“for presentation”), of whichpostprocessed images are commonly used in clinical practice.
3.1.2. DBT. Routine screening mammography relies upona select number of views, for example, Craniocaudal (CC)
International Journal of Breast Cancer 5
TI/B2 TII/B1 TIII/B1 TIV/B4 TV/B5
Figure 1: Example mammographic images with Tabar (T) risk classifications from low to high and their equivalent according to BI-RADS(B) scheme.
B1/TII B2/TI B3/TIII B4/TIV
Figure 2: Example mammographic images with BI-RADS (B) density categories from low to high and their equivalent according to Tabar(T) risk classification.
andMediolateral Oblique (MLO) view, to assess breast tissuestructures [109]. With 2D projections, it can be difficult toseparate normal glandular tissue from tumours. One of thebiggest challenges to screening radiologists is to interpretsuperimposed fibroglandular tissue (anatomical noise) in theimage, in which pathological structures can be obscured andremain undetected. In some cases this canmimic lesions lead-ing to false positive results, unnecessary recalls for additionalscreening, and/or biopsy. DBT is a recent advanced imageacquisition technology, in which the conventional mammog-raphy technique has been modified to acquire a 3D view ofthe breast; a series of thin-resolution images are aggregatedto generate a 3D image of the breast. The reconstructedformat eliminates image superimposition and allows imagesof submillimetre cross sections to be analysed, increasing theconspicuity of features that are often obscured by overlappingstructure in a single-projection view [110]. A newly developed2D imaging “modality” called C-View (synthetic 2D view)can be generated from the 3D DBT data during the mam-mography exam [111], eliminating the need for additional 2Dexposures. Initial clinical studies have shown that screeningwith C-View imaging may result in clinical performancesuperior to that of a conventional 2D mammogram [112].However, further evaluation and validation are needed toverify the usage of C-View in a clinical environment. Note
that density assessment between area based 2D projectionand 3D DBT can be very different. Clinical investigation iscurrently under way to establish the relationships betweendensity assessment using these two very different modalities.
4. Automatic Breast Density andParenchymal Segmentation
In principle, there are three approaches to mammographictissue segmentation, manual, semiautomatic (interactive),and fully automatic. Although more effective than manualsegmentation with respect to speed and efficiency, semiauto-matic methods have several limitations; the interactive seg-mentation and labelling of mammograms can still be sub-jective and time consuming and require operator training.Such approaches make large studies and clinical usage costly.Defining parameters in a subjective manner could introduceobserver bias. However, manual and semiautomatic ap-proaches can sometimes be a good idea for obtaining “groundtruth” to facilitate other studies.The focus of this review is onfully automatic approaches tomammographic tissue segmen-tation, withmanual and semiautomatic approaches excluded.
A large quantity of literature was reviewed in order toillustrate the progress and advances in mammographic tissuesegmentation; this section is separated into four categories
6 International Journal of Breast Cancer
Mammographic tissue segmentation
4.1: 2D projection based approaches using density
4.1.1: Threshold
Global thresholding
Adaptive/dynamic thresholding
4.1.2: Clustering
4.1.3: Statistical model building
Texture statistical variation
Texture descriptor
4.1.4: Collective multiple measurements
4.1.5: Other methods
4.2: 2D projection based approaches using parenchymal pattern
4.2.1: Statistical model building
Texture statistical variation
Texture descriptor
4.3: 2D projection based volumetric approaches
4.3.1: Prior calibration
4.3.2: In-image reference phantom based calibration
4.3.3: Physical image formation model
4.4: 3D reconstruction based volumetric approaches
K-means
Fuzzy C-means
Adaptive/modified fuzzy C-means
Figure 3: A tree representation for mammographic tissue segmentation categorisation based on combination (e.g., shaded in light purple)of technological advances and image modalities. Subcategorisation (e.g., shaded in light grey) is based on core segmentation principles.
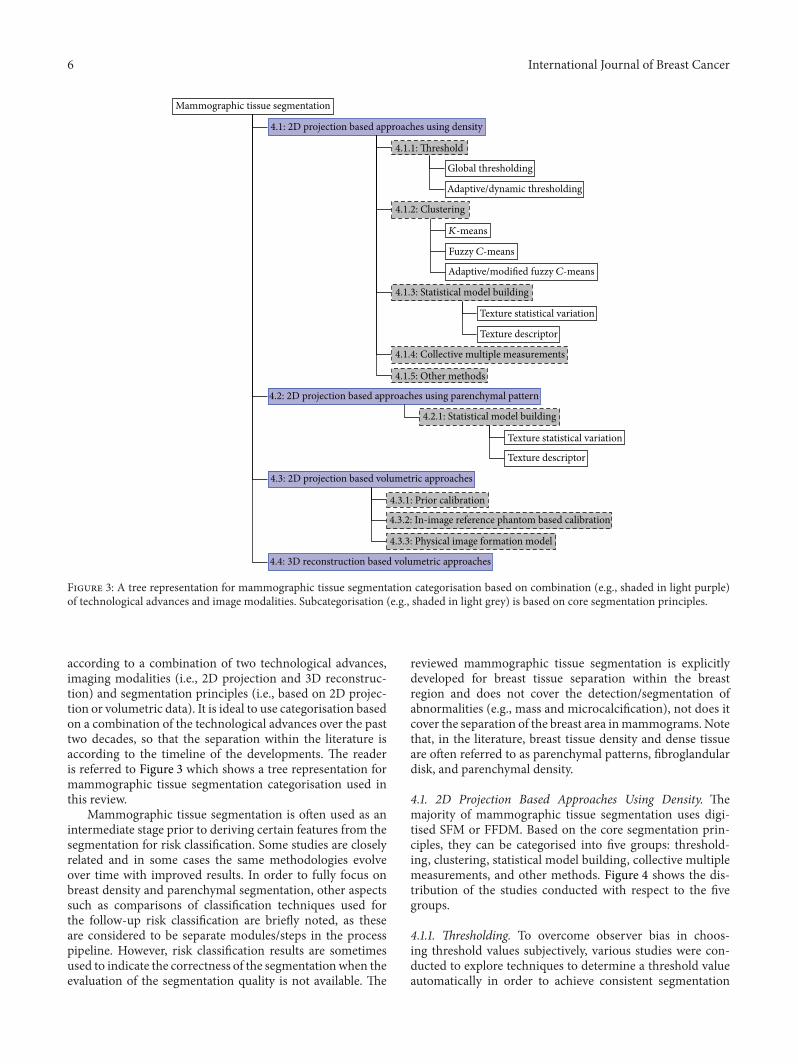
according to a combination of two technological advances,imaging modalities (i.e., 2D projection and 3D reconstruc-tion) and segmentation principles (i.e., based on 2D projec-tion or volumetric data). It is ideal to use categorisation basedon a combination of the technological advances over the pasttwo decades, so that the separation within the literature isaccording to the timeline of the developments. The readeris referred to Figure 3 which shows a tree representation formammographic tissue segmentation categorisation used inthis review.
Mammographic tissue segmentation is often used as anintermediate stage prior to deriving certain features from thesegmentation for risk classification. Some studies are closelyrelated and in some cases the same methodologies evolveover time with improved results. In order to fully focus onbreast density and parenchymal segmentation, other aspectssuch as comparisons of classification techniques used forthe follow-up risk classification are briefly noted, as theseare considered to be separate modules/steps in the processpipeline. However, risk classification results are sometimesused to indicate the correctness of the segmentationwhen theevaluation of the segmentation quality is not available. The
reviewed mammographic tissue segmentation is explicitlydeveloped for breast tissue separation within the breastregion and does not cover the detection/segmentation ofabnormalities (e.g., mass and microcalcification), not does itcover the separation of the breast area inmammograms. Notethat, in the literature, breast tissue density and dense tissueare often referred to as parenchymal patterns, fibroglandulardisk, and parenchymal density.
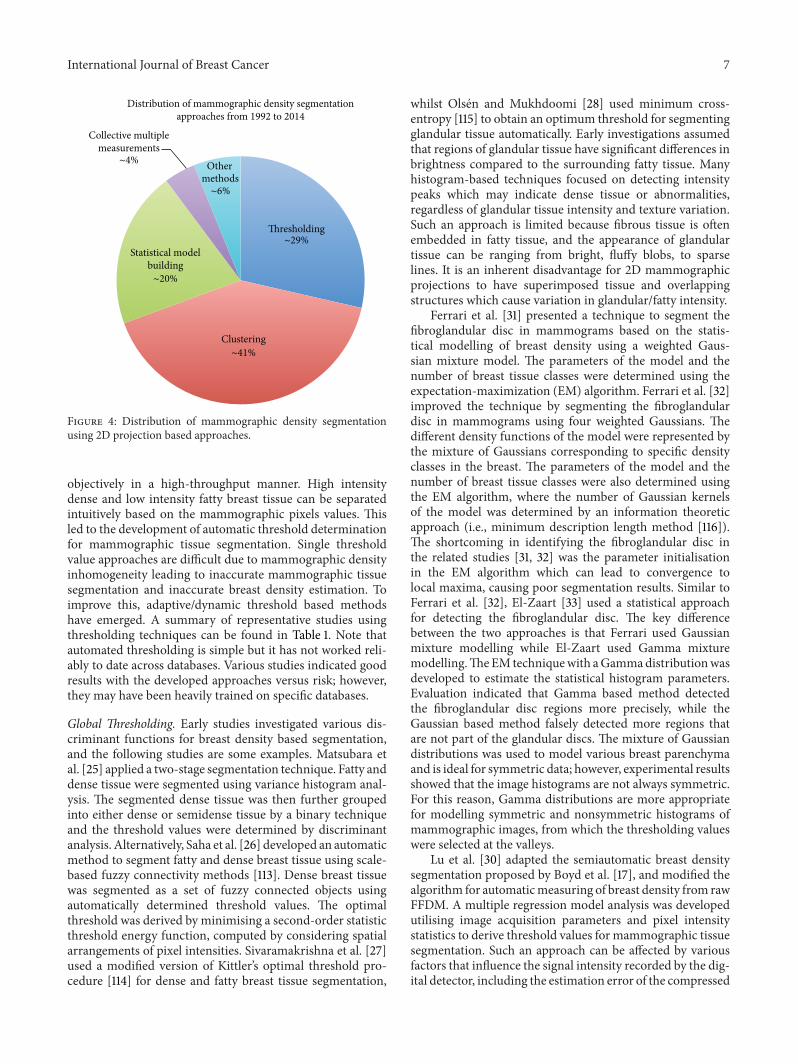
4.1. 2D Projection Based Approaches Using Density. Themajority of mammographic tissue segmentation uses digi-tised SFM or FFDM. Based on the core segmentation prin-ciples, they can be categorised into five groups: threshold-ing, clustering, statistical model building, collective multiplemeasurements, and other methods. Figure 4 shows the dis-tribution of the studies conducted with respect to the fivegroups.
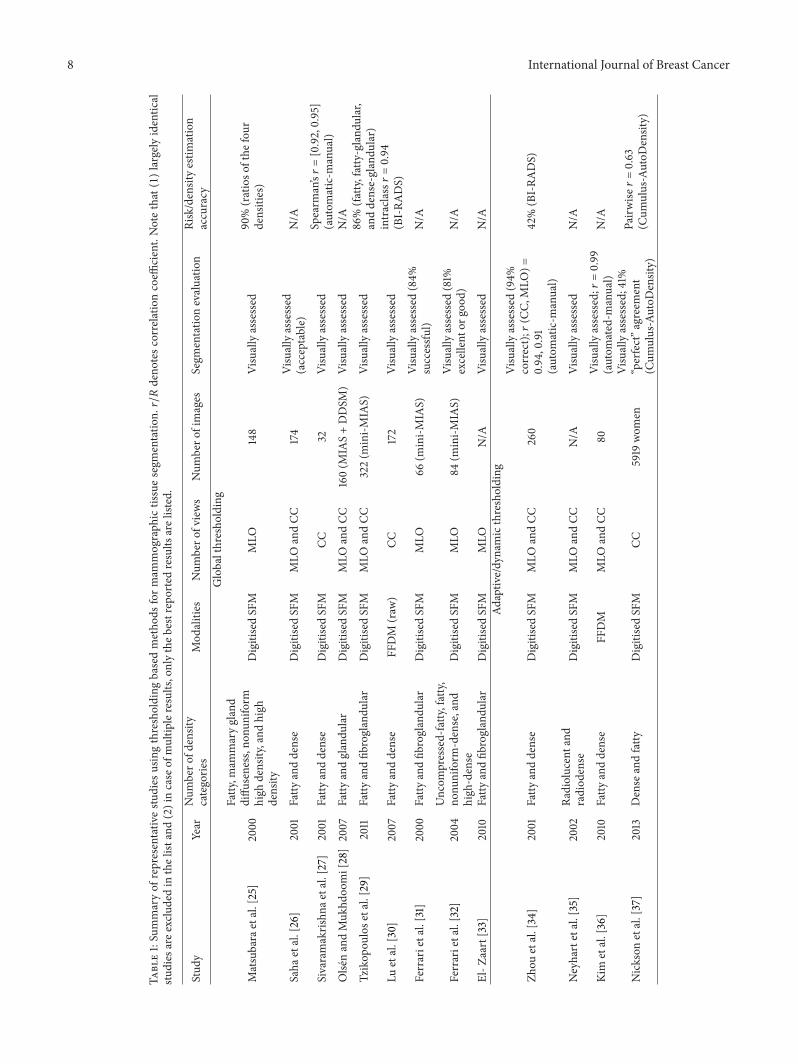
4.1.1. Thresholding. To overcome observer bias in choos-ing threshold values subjectively, various studies were con-ducted to explore techniques to determine a threshold valueautomatically in order to achieve consistent segmentation
International Journal of Breast Cancer 7
Thresholding
Clustering
Statistical modelbuilding
Collective multiplemeasurements
Other methods
Distribution of mammographic density segmentationapproaches from 1992 to 2014
∼20%
∼41%
∼29%
∼4%
∼6%
Figure 4: Distribution of mammographic density segmentationusing 2D projection based approaches.
objectively in a high-throughput manner. High intensitydense and low intensity fatty breast tissue can be separatedintuitively based on the mammographic pixels values. Thisled to the development of automatic threshold determinationfor mammographic tissue segmentation. Single thresholdvalue approaches are difficult due to mammographic densityinhomogeneity leading to inaccurate mammographic tissuesegmentation and inaccurate breast density estimation. Toimprove this, adaptive/dynamic threshold based methodshave emerged. A summary of representative studies usingthresholding techniques can be found in Table 1. Note thatautomated thresholding is simple but it has not worked reli-ably to date across databases. Various studies indicated goodresults with the developed approaches versus risk; however,they may have been heavily trained on specific databases.
Global Thresholding. Early studies investigated various dis-criminant functions for breast density based segmentation,and the following studies are some examples. Matsubara etal. [25] applied a two-stage segmentation technique. Fatty anddense tissue were segmented using variance histogram anal-ysis. The segmented dense tissue was then further groupedinto either dense or semidense tissue by a binary techniqueand the threshold values were determined by discriminantanalysis. Alternatively, Saha et al. [26] developed an automaticmethod to segment fatty and dense breast tissue using scale-based fuzzy connectivity methods [113]. Dense breast tissuewas segmented as a set of fuzzy connected objects usingautomatically determined threshold values. The optimalthreshold was derived by minimising a second-order statisticthreshold energy function, computed by considering spatialarrangements of pixel intensities. Sivaramakrishna et al. [27]used a modified version of Kittler’s optimal threshold pro-cedure [114] for dense and fatty breast tissue segmentation,
whilst Olsen and Mukhdoomi [28] used minimum cross-entropy [115] to obtain an optimum threshold for segmentingglandular tissue automatically. Early investigations assumedthat regions of glandular tissue have significant differences inbrightness compared to the surrounding fatty tissue. Manyhistogram-based techniques focused on detecting intensitypeaks which may indicate dense tissue or abnormalities,regardless of glandular tissue intensity and texture variation.Such an approach is limited because fibrous tissue is oftenembedded in fatty tissue, and the appearance of glandulartissue can be ranging from bright, fluffy blobs, to sparselines. It is an inherent disadvantage for 2D mammographicprojections to have superimposed tissue and overlappingstructures which cause variation in glandular/fatty intensity.
Ferrari et al. [31] presented a technique to segment thefibroglandular disc in mammograms based on the statis-tical modelling of breast density using a weighted Gaus-sian mixture model. The parameters of the model and thenumber of breast tissue classes were determined using theexpectation-maximization (EM) algorithm. Ferrari et al. [32]improved the technique by segmenting the fibroglandulardisc in mammograms using four weighted Gaussians. Thedifferent density functions of the model were represented bythe mixture of Gaussians corresponding to specific densityclasses in the breast. The parameters of the model and thenumber of breast tissue classes were also determined usingthe EM algorithm, where the number of Gaussian kernelsof the model was determined by an information theoreticapproach (i.e., minimum description length method [116]).The shortcoming in identifying the fibroglandular disc inthe related studies [31, 32] was the parameter initialisationin the EM algorithm which can lead to convergence tolocal maxima, causing poor segmentation results. Similar toFerrari et al. [32], El-Zaart [33] used a statistical approachfor detecting the fibroglandular disc. The key differencebetween the two approaches is that Ferrari used Gaussianmixture modelling while El-Zaart used Gamma mixturemodelling.TheEMtechniquewith aGammadistributionwasdeveloped to estimate the statistical histogram parameters.Evaluation indicated that Gamma based method detectedthe fibroglandular disc regions more precisely, while theGaussian based method falsely detected more regions thatare not part of the glandular discs. The mixture of Gaussiandistributions was used to model various breast parenchymaand is ideal for symmetric data; however, experimental resultsshowed that the image histograms are not always symmetric.For this reason, Gamma distributions are more appropriatefor modelling symmetric and nonsymmetric histograms ofmammographic images, from which the thresholding valueswere selected at the valleys.
Lu et al. [30] adapted the semiautomatic breast densitysegmentation proposed by Boyd et al. [17], and modified thealgorithm for automaticmeasuring of breast density from rawFFDM. A multiple regression model analysis was developedutilising image acquisition parameters and pixel intensitystatistics to derive threshold values for mammographic tissuesegmentation. Such an approach can be affected by variousfactors that influence the signal intensity recorded by the dig-ital detector, including the estimation error of the compressed
8 International Journal of Breast Cancer
Table1:Summaryof
representativ
estu
dies
usingthresholding
basedmetho
dsform
ammograph
ictissuesegm
entatio
n.𝑟/𝑅deno
tesc
orrelationcoeffi
cient.Notethat(1)largelyidentic
alstu
dies
aree
xcludedin
thelist
and(2)incase
ofmultip
leresults,onlytheb
estreportedresults
arelisted.
Stud
yYear
Num
bero
fdensity
categorie
sMod
alities
Num
bero
fviews
Num
bero
fimages
Segm
entatio
nevaluatio
nRisk/densityestim
ation
accuracy
Globalthresho
lding
Matsubara
etal.[25]
2000
Fatty,m
ammarygland
diffu
seness,n
onun
iform
high
density,and
high
density
DigitisedSFM
MLO
148
Visuallyassessed
90%(ratioso
fthe
four
densities)
Saha
etal.[26]
2001
Fatty
anddense
DigitisedSFM
MLO
andCC
174
Visuallyassessed
(acceptable)
N/A
Sivaramakris
hnae
tal.[27]
2001
Fatty
anddense
DigitisedSFM
CC32
Visuallyassessed
Spearm
an’s𝑟=[0.92,0.95]
(autom
atic-m
anual)
Olse
nandMuk
hdoo
mi[28]2007
Fatty
andglandu
lar
DigitisedSFM
MLO
andCC
160(M
IAS+DDSM
)Visuallyassessed
N/A
Tzikop
oulose
tal.[29]
2011
Fatty
andfib
roglandu
lar
DigitisedSFM
MLO
andCC
322(m
ini-M
IAS)
Visuallyassessed
86%(fa
tty,fatty-gland
ular,
anddense-glandu
lar)
Luetal.[30]
2007
Fatty
anddense
FFDM
(raw
)CC
172
Visuallyassessed
intraclass𝑟=0.94
(BI-RA
DS)
Ferrarietal.[31]
2000
Fatty
andfib
roglandu
lar
DigitisedSFM
MLO
66(m
ini-M
IAS)
Visuallyassessed
(84%
successfu
l)N/A
Ferrarietal.[32]
2004
Uncom
pressed-fatty,fatty,
nonu
niform
-dense,and
high
-dense
DigitisedSFM
MLO
84(m
ini-M
IAS)
Visuallyassessed
(81%
excellent
orgood
)N/A
El-Z
aart[33]
2010
Fatty
andfib
roglandu
lar
DigitisedSFM
MLO
N/A
Visuallyassessed
N/A
Adaptiv
e/dynamicthresholding
Zhou
etal.[34]
2001
Fatty
anddense
DigitisedSFM
MLO
andCC
260
Visuallyassessed
(94%
correct);𝑟(C
C,MLO
)=0.94,0.91
(autom
atic-m
anual)
42%(BI-RA
DS)
Neyhartetal.[35]
2002
Radiolucentand
radiod
ense
DigitisedSFM
MLO
andCC
N/A
Visuallyassessed
N/A
Kim
etal.[36]
2010
Fatty
anddense
FFDM
MLO
andCC
80Visuallyassessed;𝑟
=0.99
(autom
ated-m
anual)
N/A
Nickson
etal.[37]
2013
Dense
andfatty
DigitisedSFM
CC5919
wom
enVisuallyassessed;41%
“perfect”a
greement
(Cum
ulus-AutoD
ensity)
Pairw
ise𝑟=0.63
(Cum
ulus-AutoD
ensity)
International Journal of Breast Cancer 9
breast height, the heel effect, quantum mottle (noise), beamhardening, and detector nonuniformity. A FFDM unit mayexhibit temporal changes due to ageing of the X-ray tubesand variation between FFDM unit manufacturers; moreoverdifferences between radiology facilities can also be an issue.The approach can be problematic as the parameters andparameter estimates of regression models may change frominstallation to installation, site to site, and analyst to analyst.
Adaptive/DynamicThresholding. Zhou et al. [34] investigatedan approach in which the image was first classified by handaccording to the characteristic features of the grey-levelhistogram into one of the BI-RADS density categories usinga rule based classification. With the known BI-RADS densitycategory and the shape of the histogram (e.g., unimodal,bimodal, or multimodal), the density segmentation wasachieved by using combined discriminant analysis [117] andmaximum entropy principle [118] based threshold selectionmethods. Successful segmentation strongly depended ona correctly classified mammogram, which would result inselecting the optimal threshold. The developed method wasused in a clinical study [119], and results suggested thatmisclassified histograms occurred more often on extremelydense and fatty mammograms, but the overall breast densityestimation was more accurate than the radiologists’ visualestimation. However, because the configured parameters forthreshold determination were dataset specific and the seg-mentation was performed after density classification, it wasconcluded in [119] that such an automatic approach cannotyet be used as a stand-alone density measurement tool.
Kim et al. [36] developed a scheme for breast densityestimation using statistical (e.g., standard deviation) andboundary information (e.g., edge magnitude) to compute anoptimal intensity threshold between dense and fatty tissue inorder to define dense andnondense areas.One key hypothesisin the study is that boundaries between the dense and fattyportions of the breast usually have high values of gradi-ent magnitude. Therefore an iterative search was used andthe optimal threshold was determined by combining thesefeatures to best divide the fat and dense regions. Nicksonet al. [37] adopted this method for mammographic densitysegmentation and noticed that often a false optimal thresholdis produced, which separates a narrow band of low intensitiesalong the breast skin line from the rest of the breast. Nicksonet al. modified the method, named AutoDensity, to convergeto an intensity level that separates dense from fatty tissues.This is achieved by performing an iterative search for theoptimal threshold while decreasing a region of interest withinthe breast until a stopping condition is met. The modifiedmethod was used on a large population screening pro-gramme, and the automated measurement of breast densityfrom digitised SFM using AutoDensity performs similarly(modest correlation) to the Cumulus (a semiautomated user-assisted PD estimation method) [17].
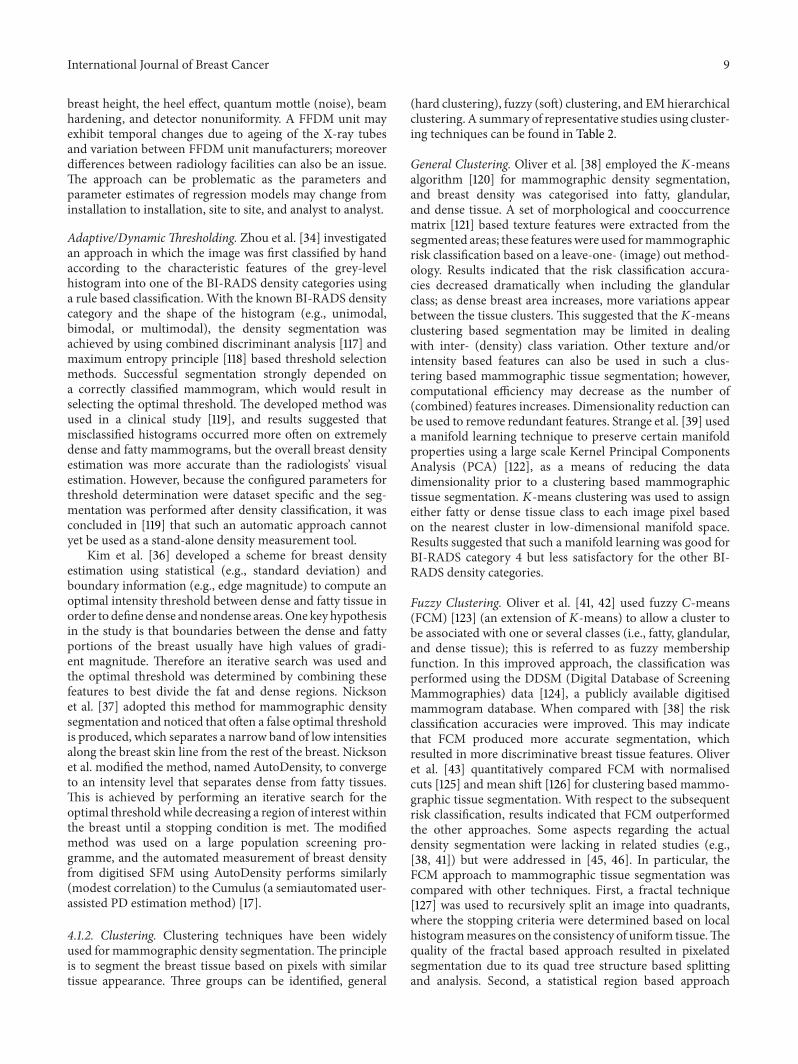
4.1.2. Clustering. Clustering techniques have been widelyused for mammographic density segmentation.The principleis to segment the breast tissue based on pixels with similartissue appearance. Three groups can be identified, general
(hard clustering), fuzzy (soft) clustering, and EMhierarchicalclustering. A summary of representative studies using cluster-ing techniques can be found in Table 2.
General Clustering. Oliver et al. [38] employed the 𝐾-meansalgorithm [120] for mammographic density segmentation,and breast density was categorised into fatty, glandular,and dense tissue. A set of morphological and cooccurrencematrix [121] based texture features were extracted from thesegmented areas; these featureswere used formammographicrisk classification based on a leave-one- (image) out method-ology. Results indicated that the risk classification accura-cies decreased dramatically when including the glandularclass; as dense breast area increases, more variations appearbetween the tissue clusters. This suggested that the 𝐾-meansclustering based segmentation may be limited in dealingwith inter- (density) class variation. Other texture and/orintensity based features can also be used in such a clus-tering based mammographic tissue segmentation; however,computational efficiency may decrease as the number of(combined) features increases. Dimensionality reduction canbe used to remove redundant features. Strange et al. [39] useda manifold learning technique to preserve certain manifoldproperties using a large scale Kernel Principal ComponentsAnalysis (PCA) [122], as a means of reducing the datadimensionality prior to a clustering based mammographictissue segmentation. 𝐾-means clustering was used to assigneither fatty or dense tissue class to each image pixel basedon the nearest cluster in low-dimensional manifold space.Results suggested that such a manifold learning was good forBI-RADS category 4 but less satisfactory for the other BI-RADS density categories.
Fuzzy Clustering. Oliver et al. [41, 42] used fuzzy 𝐶-means(FCM) [123] (an extension of 𝐾-means) to allow a cluster tobe associated with one or several classes (i.e., fatty, glandular,and dense tissue); this is referred to as fuzzy membershipfunction. In this improved approach, the classification wasperformed using the DDSM (Digital Database of ScreeningMammographies) data [124], a publicly available digitisedmammogram database. When compared with [38] the riskclassification accuracies were improved. This may indicatethat FCM produced more accurate segmentation, whichresulted in more discriminative breast tissue features. Oliveret al. [43] quantitatively compared FCM with normalisedcuts [125] and mean shift [126] for clustering based mammo-graphic tissue segmentation. With respect to the subsequentrisk classification, results indicated that FCM outperformedthe other approaches. Some aspects regarding the actualdensity segmentation were lacking in related studies (e.g.,[38, 41]) but were addressed in [45, 46]. In particular, theFCM approach to mammographic tissue segmentation wascompared with other techniques. First, a fractal technique[127] was used to recursively split an image into quadrants,where the stopping criteria were determined based on localhistogrammeasures on the consistency of uniform tissue.Thequality of the fractal based approach resulted in pixelatedsegmentation due to its quad tree structure based splittingand analysis. Second, a statistical region based approach
10 International Journal of Breast Cancer
Table2
:Sum
maryo
frepresentativestudiesusingc
luste
ringb
ased
metho
dsform
ammograph
ictissuesegmentatio
n.𝑟/𝑅deno
tescorrelationcoeffi
cient.Notethat(1)largelyidentic
alstu
dies
aree
xcludedin
thelist
and(2)incase
ofmultip
leresults,onlytheb
estreportedresults
arelisted.
Stud
yYear
Num
bero
fdensity
categorie
sMod
alities
Num
bero
fview
sNum
bero
fimages
Segm
entatio
nevaluatio
nRisk/densityestim
ation
accuracy
Generalclu
sterin
g
Oliver
etal.[38]
2005
Fatty
anddense
DigitisedSFM
MLO
180(M
IAS)
N/A
73%(fa
tty,gland
ular,and
dense)
Strangee
tal.[39]
2013
Dense
andfatty
FFDM
CC12
Visuallyassessed
N/A
Mariase
tal.[40]
2005
Dense,sem
idense,and
fatty
DigitisedSFM
MLO
146
Visuallyassessed
65%(BI-RA
DSIand
II)
86%(BI-RA
DSIIIand
IV)
Oliver
etal.[41]
2005
Dense
andfatty
DigitisedSFM
MLO
300(D
DSM
)N/A
47%(BI-RA
DS)
Oliver
etal.[42]
2005
Dense
andfatty
DigitisedSFM
MLO
320(M
IAS)
and300
(DDSM
)N/A
48%MIAS,47%DDSM
(BI-RA
DS)
Oliver
etal.[43]
2007
Dense
andfatty
DigitisedSFM
MLO
322(M
IAS)
N/A
78%(BI-RA
DS)
Oliver
etal.[44
]2008
Dense
andfatty
DigitisedSFM
MLO
andCC
322(M
IAS)
and831
(DDSM
)Visuallyassessed
77%MIAS,86%DDSM
(BI-RA
DS)
Oliver
etal.[45]
2006
Dense
andfatty
DigitisedSFM
MLO
322(M
IAS)
Visuallyassessed
82%(BI-RA
DS)
Torrentetal.[46]
2008
Dense
andfatty
FFDM
MLO
andCC
300
Visuallyassessed
82%MLO
,75%
CC(BI-RA
DS)
Tortajadae
tal.[47]
2012
Dense
andfatty
DigitisedSFM
andFF
DM
MLO
andCC
322(M
IAS),831
(DDSM
),and236(digita
lDB)
Visuallyassessed
86%MIAS,77%DDSM
,and92%digitalD
B(BI-RA
DS)
Adaptiv
e/mod
ified
fuzzy𝐶-m
eans
Chen
and
Zwiggelaar
[48]
2010
4densities
DigitisedSFM
MLO
N/A
Visuallyassessed
N/A
Kellere
tal.[49]
2011
2–9densities
FFDM
(processed)
MLO
160
Visuallyassessed;𝑟
=0.75
(autom
atic-m
anual)
N/A
Kellere
tal.[50]
2012
2–13
densities
FFDM
(processed
andraw)
MLO
160
Visuallyassessed;𝑟
(raw
,processed)
=0.82,0.85
(autom
atic-m
anual)
N/A
Expectation-maxim
isatio
n
Aylwardetal.[51]
1998
Dense,fatty,and
uncompressed-fatty
DigitisedSFM
MLO
andCC
70Visuallyassessed
N/A
Zwiggelaar
etal.
[52]
2002
4–6densities
DigitisedSFM
MLO
263(M
IAS)
Visuallyassessed
67%(SCC
)
Zwiggelaar
etal.
[53]
2003
4–6densities
DigitisedSFM
MLO
263(M
IAS)
Visuallyassessed
86%(SCC
)
Zwiggelaar
etal.
[54]
2003
4–6densities
DigitisedSFM
MLO
263(M
IAS)
N/A
86%(BI-RA
DS)
Zwiggelaar
and
Denton[55]
2004
4densities
DigitisedSFM
MLO
36(M
IAS)
Visuallyassessed
75%(4
densities:0%–10%
,11%–25%
,26%
–50%
,and
51%–75%
)
Selvan
etal.[56]
2006
5/8densities
DigitisedSFM
MLO
112(m
ini-M
IAS)
Visuallyassessed
(92%
good
/excellent)
N/A
International Journal of Breast Cancer 11
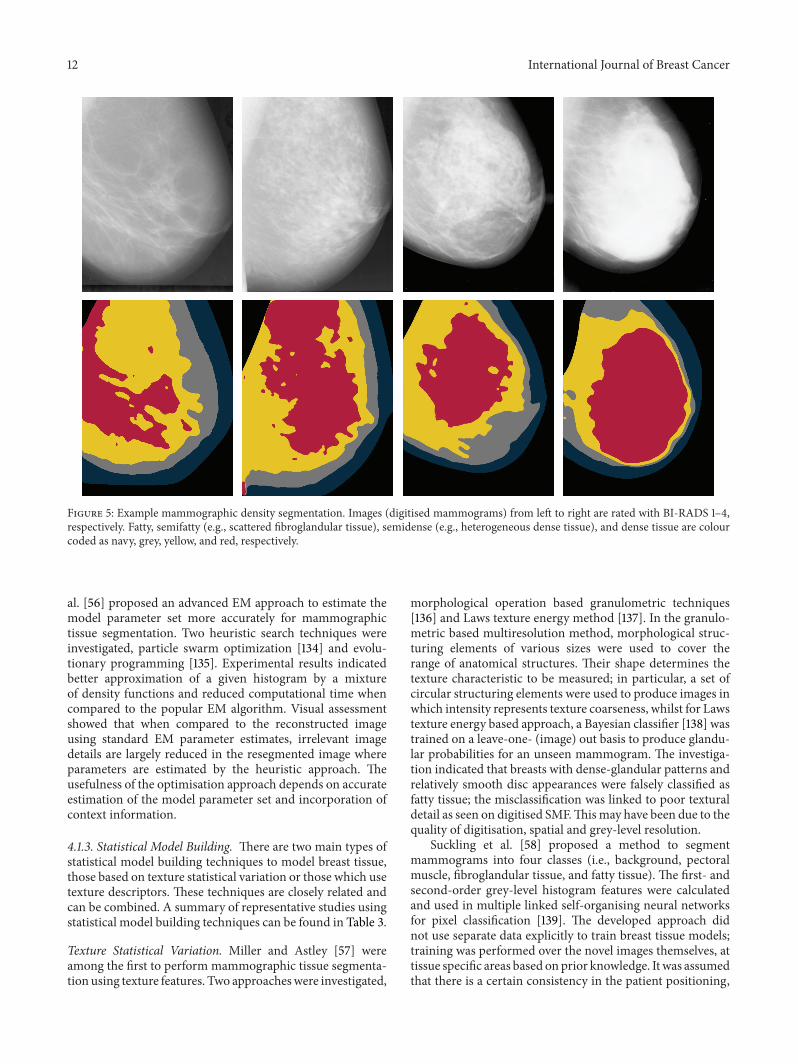
supported by the Fisherfaces algorithm [128] was used, inwhich a set of mammographic patches containing eitherdense or fatty tissue was used to model breast tissue. Subse-quently, a model driven mammographic tissue segmentationwas performed. Such an approach resembles rather large andcoarse segmentation due to the block tissue analysis thatcould be less effective when tissue variations are small.Third,a multiple thresholding based on information theory (i.e.,excess entropy [129]) was investigated. The excess entropybased algorithm loses accuracy in areas where the dense andfatty tissue boundary is less clear.The FCMoutperformed theother approaches and produced more anatomically realisticsegmentation, which led to satisfactory risk classifications.Tortajada et al. [47] extended and consolidated the seg-mentation framework in [46] for mammographic densitysegmentation using FFDM. A novel peripheral enhancementtechnique was developed to enhance texture appearance ofuncompressed-fatty tissue near the breast skin line. Mam-mographic segmentation was significantly improved nearthe breast peripheral areas, leading to more correct featuresderived from the segmented dense tissue, and higher riskclassification accuracies were achieved. Example mammo-graphic segmentation can be found in Figure 5.
Adaptive/Modified FuzzyC-Means.Chen andZwiggelaar [48]proposed a modified FCM algorithm for mammographicdensity segmentation using the EPIC (European ProspectiveInvestigation on Cancer) database [130]. The modified FCMincorporates local spatial and intensity information based onan adaptive local window filter; the weighting coefficientswithin the local window are used to differentiate the neigh-bouring pixels. The clustering performance on the intensityhistogram of the filtered image is faster than conventionalFCM.The conventional FCMalgorithmuses grey-level infor-mation at a single pixel as the feature space and this containsno spatial contextual information, which makes it very sen-sitive to noise and intensity inhomogeneities. Segmentationresults indicated the robustness of the modified FCM indealing with intensity inhomogeneities with different densitycategories. Visual assessment indicated that local windowfiltering was able to eliminate intensity inhomogeneities andavoid excessive blur.
Keller et al. [49] presented a novel multiclass FCMalgorithm for automated identification and quantification ofbreast density, which is optimised for the imaging charac-teristics of digital mammography. The proposed algorithminvolves an adaptive histogram-based method to estimatethe number of clusters, which uses the tissue properties ofthe specific mammogram followed by segmentation throughclustering using linear-discriminant analysis (LDA). Theclassifier combines imaging and patient characteristics toachieve optimal segmentation through cluster merging. A setof FFDMwas used in the evaluation, and a strong correlationwas observed between the estimated PD and radiological“ground truth” using BI-RADS density categories. Resultsalso indicated relatively poor performance when comparedto identifying breast dense tissue based on two-class FCMparadigm using digitised SFM. This may be due to the factthat the majority of grey-level intensity profiles of breast
tissue as extracted from FFDM tend to be multimodal. Thisfinding is not in line with the results reported in [46], inwhich a good visual agreement was observed between FCMand expert annotations. This may be due to the fact that theclustered features are different; cooccurrence matrices andgrey-level intensities features were used in [46] and [49],respectively. Keller et al. [50] extended the adaptivemulticlus-ter FCMapproach to estimate breast PD in both raw andpost-processed FFDM images. This is expected to be beneficial interms of direct clinical application and retrospective analysis.
Expectation-Maximisation. Aylward et al. [51] investigated amixture modelling technique to differentiate fatty and densebreast tissue. The statistical modelling of the breast com-ponents was based on pixel intensity distribution sampling,using Gaussian mixture models, but no texture aspects weretaken into account. The parameters of the mixture wereiteratively determined using the EM algorithm, maximisingthe log-likelihood of the data representing the distribution[131]. To quantify accuracy, automatic dense tissue estimateswere compared with the “ground truth” provided by experts.A set of images from three differentmammography unitman-ufacturers was used in the evaluation. Whilst breast densityestimates were satisfactory, in some cases, the separation offat and dense tissue was not achieved. Nevertheless, resultsfrom this early study showed possible intensity distributiondiscrepancy (e.g., variation in breast tissue contrast) whenusing images acquired from different manufacturers.
Zwiggelaar et al. [52] investigated a combination ofstatistical modelling and EM algorithm for a texture basedapproach to mammographic tissue segmentation. The inves-tigation consists of basic grey-level information and spatialcorrelation information, both combined to achieve texturemodelling. The statistical modelling was used for datageneralisation and noise removal purposes. Segmentationwas derived using an information theoretic approach [132].The segmented breast parenchyma is in line with breastanatomical structures, and the accuracy was influenced bythe size and shape of the local neighbourhood. In a follow-upstudy, Zwiggelaar et al. [53] incorporated a set permutation-occurrence matrices to encode texture features. The studyemphasised that, for texture based mammographic tissuesegmentation, it is important to incorporate both grey-levelvalue and spatial correlation information. The use of cooc-currence matrices in texture based segmentation has a majordisadvantage, because in principle the dimensionality for thederived texture features is infinite, leading to redundant fea-tures and time consuming analysis. Zwiggelaar and Denton[55] addressed this issue by qualitatively selecting a subset of alarge set of cooccurrence matrices. A transportation measure[133] was used to determine the difference between cooc-currence matrix based texture features. Segmentation resultsshowed improvements over tissue specific areas when com-pared to previous studies [52–54].This indicated that the seg-mentation performance is directly related to the transporta-tion measure of an ordered set of cooccurrence matrices.
When using the conventional EM based segmentation,the efficiency of the stochastic model depends on the accu-racy of estimation of the model’s parameter set. Selvan et
12 International Journal of Breast Cancer
Figure 5: Example mammographic density segmentation. Images (digitised mammograms) from left to right are rated with BI-RADS 1–4,respectively. Fatty, semifatty (e.g., scattered fibroglandular tissue), semidense (e.g., heterogeneous dense tissue), and dense tissue are colourcoded as navy, grey, yellow, and red, respectively.
al. [56] proposed an advanced EM approach to estimate themodel parameter set more accurately for mammographictissue segmentation. Two heuristic search techniques wereinvestigated, particle swarm optimization [134] and evolu-tionary programming [135]. Experimental results indicatedbetter approximation of a given histogram by a mixtureof density functions and reduced computational time whencompared to the popular EM algorithm. Visual assessmentshowed that when compared to the reconstructed imageusing standard EM parameter estimates, irrelevant imagedetails are largely reduced in the resegmented image whereparameters are estimated by the heuristic approach. Theusefulness of the optimisation approach depends on accurateestimation of the model parameter set and incorporation ofcontext information.
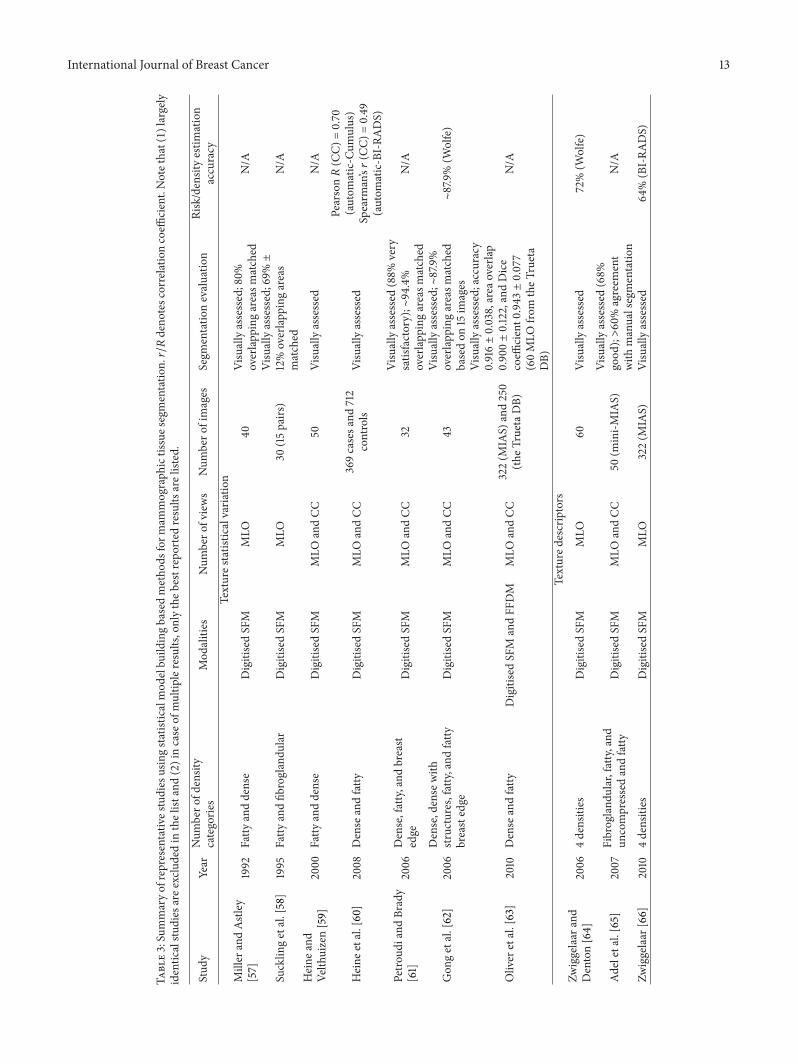
4.1.3. Statistical Model Building. There are two main types ofstatistical model building techniques to model breast tissue,those based on texture statistical variation or those which usetexture descriptors. These techniques are closely related andcan be combined. A summary of representative studies usingstatistical model building techniques can be found in Table 3.
Texture Statistical Variation. Miller and Astley [57] wereamong the first to perform mammographic tissue segmenta-tion using texture features. Two approacheswere investigated,
morphological operation based granulometric techniques[136] and Laws texture energy method [137]. In the granulo-metric based multiresolution method, morphological struc-turing elements of various sizes were used to cover therange of anatomical structures. Their shape determines thetexture characteristic to be measured; in particular, a set ofcircular structuring elements were used to produce images inwhich intensity represents texture coarseness, whilst for Lawstexture energy based approach, a Bayesian classifier [138] wastrained on a leave-one- (image) out basis to produce glandu-lar probabilities for an unseen mammogram. The investiga-tion indicated that breasts with dense-glandular patterns andrelatively smooth disc appearances were falsely classified asfatty tissue; the misclassification was linked to poor texturaldetail as seen on digitised SMF.Thismay have been due to thequality of digitisation, spatial and grey-level resolution.
Suckling et al. [58] proposed a method to segmentmammograms into four classes (i.e., background, pectoralmuscle, fibroglandular tissue, and fatty tissue). The first- andsecond-order grey-level histogram features were calculatedand used in multiple linked self-organising neural networksfor pixel classification [139]. The developed approach didnot use separate data explicitly to train breast tissue models;training was performed over the novel images themselves, attissue specific areas based onprior knowledge. It was assumedthat there is a certain consistency in the patient positioning,
International Journal of Breast Cancer 13
Table3:Summaryo
frepresentativestudiesusingstatisticalmod
elbu
ildingbasedmetho
dsform
ammograph
ictissues
egmentatio
n.𝑟/𝑅deno
tescorrelationcoeffi
cient.Notethat(1)largely
identic
alstu
dies
aree
xcludedin
thelist
and(2)incase
ofmultip
leresults,onlytheb
estreportedresults
arelisted.
Stud
yYear
Num
bero
fdensity
categorie
sMod
alities
Num
bero
fviews
Num
bero
fimages
Segm
entatio
nevaluatio
nRisk/densityestim
ation
accuracy
Textures
tatistic
alvaria
tion
Miller
andAs
tley
[57]
1992
Fatty
anddense
DigitisedSFM
MLO
40Visuallyassessed;80%
overlap
ping
areasm
atched
N/A
Sucklin
getal.[58]
1995
Fatty
andfib
roglandu
lar
DigitisedSFM
MLO
30(15pairs
)Visuallyassessed;69%±
12%overlapp
ingareas
matched
N/A
Heine
and
Velth
uizen[59]
2000
Fatty
anddense
DigitisedSFM
MLO
andCC
50Visuallyassessed
N/A
Heine
etal.[60]
2008
Dense
andfatty
DigitisedSFM
MLO
andCC
369casesa
nd712
controls
Visuallyassessed
Pearson𝑅(C
C)=0.70
(autom
atic-C
umulus)
Spearm
an’s𝑟(C
C)=0.49
(autom
atic-BI-RA
DS)
Petro
udiand
Brady
[61]
2006
Dense,fatty,and
breast
edge
DigitisedSFM
MLO
andCC
32Visuallyassessed
(88%
very
satisfactory);∼
94.4%
overlap
ping
areasm
atched
N/A
Gon
getal.[62]
2006
Dense,dense
with
structures,fatty,and
fatty
breastedge
DigitisedSFM
MLO
andCC
43Visuallyassessed;∼
87.9%
overlap
ping
areasm
atched
basedon
15im
ages
∼87.9%(W
olfe)
Oliver
etal.[63]
2010
Dense
andfatty
DigitisedSFM
andFF
DM
MLO
andCC
322(M
IAS)
and250
(theT
ruetaD
B)
Visuallyassessed;accuracy
0.916±0.038,area
overlap
0.900±0.122,andDice
coeffi
cient0
.943±0.077
(60MLO
from
theT
rueta
DB)
N/A
Textured
escriptors
Zwiggelaar
and
Denton[64]
2006
4densities
DigitisedSFM
MLO
60Visuallyassessed
72%(W
olfe)
Adeletal.[65]
2007
Fibrogland
ular,fatty,and
uncompressedandfatty
DigitisedSFM
MLO
andCC
50(m
ini-M
IAS)
Visuallyassessed
(68%
good
);>60%agreem
ent
with
manualsegmentatio
nN/A
Zwiggelaar
[66]
2010
4densities
DigitisedSFM
MLO
322(M
IAS)
Visuallyassessed
64%(BI-RA
DS)
14 International Journal of Breast Cancer
and the positioning of anatomical structures is in the sameregions. Segmentation results indicated that breast peripheralboundaries were difficult to identify due to X-ray photonpenetration which is almost complete over these areas. Visualassessment indicated reasonably good segmentation with atendency of oversegmentation; however, anatomic structureswith variable appearance of the fibroglandular tissue were notidentified correctly. The position of the parenchyma altersdramatically across the series of images, but the algorithmdoes seem to produce consistent parenchymal shape overseveral images. It was concluded that high density tissue wasfound to be more prone to misclassification, and the numberof neurons used had a direct effect on the performance ofthe network. This early study indicated that potential imageacquisition related information (e.g., the thickness of thecompressed beast, the attenuation coefficients of the breasttissue, and breast anatomical models) may be useful for thetask but was difficult or unattainable when using digitisedSFM.
Petroudi and Brady [61] proposed a statistical modellingapproach to mammographic tissue segmentation based ona framework previously developed for mammographic riskclassification [140]. The approach focused on texture analysisover a more localised area, and a pixel based classificationcan be used as a means of segmenting breast parenchymalinto different densities. To incorporate both contextual andspatial neighbourhood (structural) information, multivectorGaussian HMRF (Hidden Markov Random Field) [141] andtexton (texture primitives) [140] technique were used. Themultivector image representation [142] is achieved using afilter bank [143], whilst all the parameters were estimatedusing the EM algorithm. The key aspect in the study is theuse of texton based statistical modelling for rotation invariantmammographic texture. The hypothesis is that pixels fromsimilar breast tissue have similar texture properties, evenwhen there are relatively large anatomical changes due toinvolution and use of hormone replacement therapy. How-ever, issues still remain with the automatic determination ofthe appropriate filter bank, the number of textons, and thesize of the neighbourhood. The texton selection aspect wasinvestigated in a related study [62], which again used textonsand HMRF for mammogram tissue segmentation. Similarsegmentation results were achieved when a greedy algorithmwas incorporated in the textons learning process to removesimilar textons.
Oliver et al. [63] presented a mammographic densitysegmentation which utilises modelling of a set of patches ofeither fatty or dense parenchyma and statistical analysis. Twomodelling strategies were investigated; one is a Karhunen-Loeve-based model with PCA [144] and the other is a linear-discriminant-based model using LDA [128]. Once the tissuemodels are learnt, pixel based two-class (i.e., fatty and dense)segmentation was performed using a nearest neighbourclassifier. The evaluation was performed using both digitisedSFM and FFDM. There were noticeable variations observedin tissue appearance for the two databases; therefore, thebreast tissue modelling was independently performed forboth databases.The study indicated that the number of patchsamples used is vitally important in the training process; it
should be large enough to provide sufficient data variationper tissue class but small enough to avoid overfitting of theclassifier. It may be difficult to subsample the square or rect-angular patches with the precision needed within a mixtureof tissue, leading to oversegmentation. A further detailedannotation over patches could be employed to address thisissue; however, this procedure can be labour intensive andtime consuming. It was also noticed that the algorithm maynot be able to correctly identify fatty tissue, some ducts,and linear structures that are much brighter than the fattybreast tissue. This is due to texture modelling variation whenusing digitised and digital mammograms. Many of the issuesrelated to patch based breast tissue modelling are in line witha number of studies reviewed in Section 4.2.
Texture Descriptors. Zwiggelaar and Denton [64] developeda texture classification approach using contrast information,based on the concept that texture can be discriminatedfrom the contrast between key structural elements and theirrepeating patterns. The developed texture analysis method isrelated to local binary patterns (LBP) [145] and is similar toSUSAN [146]. Mammographic texture is modelled by esti-mating local aspects using a set of binary images which can begenerated by thresholding using the corresponding grey-levelbands. Unlike the LBP and SUSAN approaches, this methoddoes not utilise histogram information to extract textureinformation, only one model per grey-level band exists, andthese models can be compared directly. A hybrid metricbased on probability density distributions and transportationestimation was used to classify unseen pixels as a means ofsegmentation. Results showed a strong correlation betweenthe various texture regions in themammographic images andthe segmented areas. The region boundary effects seem toplay a significant role, as most segmented areas were mainlyoccupied by two classes; this is partly due to unbalanceddistribution over the density classes.
Zwiggelaar [66] investigated a breast tissue segmen-tation methodology based on local grey-level appearancehistograms. The mammographic texture modelling incorpo-rated both grey-level and spatial aspects. Variation in localgrey-level appearance is represented in histogram format forwhich the distribution varies with BI-RADS breast densitycategories. Visual assessment indicated realistic mammo-graphic tissue segmentation but is predominately two-classsegmentation associated with BI-RADS II and III, whilst thebreast boundary regions are often associated with high riskBI-RADS III and IV. It should be noted that the underlyinginformation within the local window is the same as thatbeing used in texton based approaches [61], where the texturemodels are formed by cluster centre related histograms. Adistinct difference compared to LBP based texture analysis isthat the developedmethodology uses the full grey-level rangeinstead of reduction to binary patterns, which means theresulting histograms might contain more sparsely populatedtexture information.
4.1.4. Collective Multiple Measurements. According to the lit-erature, different approaches to breast density estimation canbe performed equally well. However, manual/semiautomatic
International Journal of Breast Cancer 15
segmentation can remain superior despite some of the inher-ited limitations (e.g., losing accuracy due to fatigue and timeconsuming process). It may be that a human observer is ableto combine context, morphology, and textural information,whereas many automated methods only focus on one ofthese characteristics [67].Therefore, it is conceivable to utilisevarious principles for mammographic tissue segmentation. Asummary of representative studies using collective multiplemeasurements can be found in Table 4.
Kallenberg et al. [67] developed a breast density segmen-tationmethod based on pixel classification, in which differentapproaches known in the literature to segment breast densityare integrated and extended. The features used include, forexample, location of clustered high density tissue in relationto the skin line and nipple, dense tissue intensity information,Gaussian derivatives, cooccurrence matrix based Haralicktexture features, and global context features calculated fromthe whole image. A neural network classifier was trainedbased on segmentations obtained using the Cumulus. Thesequential floating forward selection (SFFS) algorithm [147]was applied to select the optimal subset from a large pool offeatures, which removed irrelevant and redundant featuresfrom the data, and a threshold was defined for the classifieroutput to obtain a dense tissue segmentation. The PD resultsshow a high correlation (𝑟 = 0.9) between the automaticmeasurements and the Cumulus results. It was concludedthat a combination of segmentation strategies outperformsthe application of single segmentation techniques.
Li et al. [68] investigated image-processing software basedon ImageJ [148] for automated analysis of mammographicdensity and penalised regression to construct a measurethat mimics the Cumulus. A set of automated thresholdingmethods were applied to separate the dense breast tissue, andthese vary according to the type of pixel intensity information(e.g., histogram shape, clustering, and entropy). A watershedalgorithm was employed to subdivide dense tissue areas intosmaller objects from which a variety of measurements wereobtained for the breast as awhole, aswell as for the “objects” ofdense tissue. A total of 1008 measurements were obtained asoutput from ImageJ, but only 772 variables were informative.The feature dimensionality was further reduced to 123 usingPCA.To compare breast density asmeasured by theCumulus,a large dataset containing cases (having condition/disease)and controls (not having condition/disease) was used for theevaluation. Results indicated that themammographic densitymeasurement has a correlation equal to 𝑟 = 0.875 which wassimilar to that reported by Kallenberg et al. [67] (𝑟 = 0.895)and substantially higher than the work done by Heine et al.[60] (𝑟 = 0.70). Note that generalisation of the developedmethod is currently limited toMLO images. So far, this studyprovided the strongest evidence that mammographic imagescontain additional information to percentage density whichimproves the ability to discriminate between breast cancerdisease statuses.
4.1.5. Other Methods. There are some methods in the litera-ture which have not been widely adopted, most conducted asproof of concept or feasibility studies. Although no quantita-tive and qualitative evaluations were performed with respect
to mammographic tissue segmentation, some of the ideas areworth noting which may inspire further improvements andinvestigations. A summary of representative studies can befound in Table 4.
Lao and Huo [149] developed a hierarchical approachto segment breast dense tissue from mammographic imagesbased on unsupervised learning and multiple levels of detail.The method initially segments the breast based on entropymaximum thresholding. Next, the resultant dense and fattytissue segmentation was used to facilitate FCM member-ship function initialisation, followed by clustering basedsegmentation. Finally, the grouped dense tissue was used togenerate dense tissue intensity and homogeneity features; apixel based thresholding technique was used to produce thefinal dense breast segmentation. Chen et al. [70] developeda mammographic tissue segmentation method using topo-graphic maps of breast regions at multiple intensity levelsthat represent both topological and geometrical structuresof different dense breast tissue. A topographic map is amorphological and multiscale decomposition of an imagerelying on the connected components of level sets. Thetopological and geometric structures are represented by ashape tree, from which dense tissue regions are detectedby analysing the saliency and independency of the shapes.This is an unsupervised method as it does not require alearning stage or prior knowledge. The analysis is based oncomponents of the topographic map instead of the imagepixels, which could significantly reduce the dimensionality ofthe data to be analysed. Postprocessing is required to computegeometric moments of the level sets in order to removeincorrect dense regions. Visual assessment indicated that thederived segmentation resembled the results obtained usingthreshold based methods; however, segmentation seems toomit anatomical structures which do not appear as dense asthey should be.
4.2. 2D Projection Based Approaches Using ParenchymalPattern. Another group of mammographic tissue segmenta-tion approaches focuses on breast tissue separation beyonddifferent densities (e.g., dense and fatty) and using Tabar’stissue modelling instead to group breast tissue into fourclasses (i.e., linear, nodular, homogeneous, and radiolucent);see Section 2.2 for details of this scheme.
4.2.1. StatisticalModel Building. Thesemethods are all relatedto statistical model building using texture statistical variationor descriptors. A summary of representative studies withrespect to Tabar’s tissue modelling can be found in Table 5.
Texture Statistical Variation. Muhimmah et al. [71] applieda texton related technique for mammographic tissue seg-mentation based on Tabar’s tissue modelling. A textonselection strategy was incorporated using a combination ofvisual assessment and minimum spanning tree topologicalinformation. The textons for each tissue type (i.e., nodular,linear, homogeneous, and radiolucent) were generated frommammographic patches containing tissue specific samples.In the texton selection process, the (Euclidean) minimumspanning tree was used to indicate a topologically probable
16 International Journal of Breast Cancer
Table4:
Summaryof
representativ
estu
dies
usingotherless
popu
larmetho
ds(e.g.,collectivemultip
lemeasurements)
formam
mograph
ictissuesegm
entatio
n.𝑟/𝑅deno
tescorrelation
coeffi
cient;AU
Cdeno
tesa
reau
nder
ROCcurve.Notethat(1)largelyidentic
alstu
dies
aree
xcludedin
thelist
and(2)incase
ofmultip
leresults,onlytheb
estreportedresults
arelisted.
Stud
yYear
Num
bero
fdensitycategorie
sMod
alities
Num
bero
fviews
Num
bero
fimages
Segm
entatio
nevaluatio
nRisk/density
estim
ationaccuracy
Collectivem
ultip
lemeasurements
Kallenb
ergetal.[67]
2011
Dense
andfatty
DigitisedSFM
MLO
1300
Visuallyassessed;Pearson
𝑅(percent
density,dense
area)=
0.911,0.895
(autom
atic-C
umulus)
N/A
Lietal.[68]
2012
Dense
andfatty
DigitisedSFM
MLO
765casesa
nd747
controls
Visuallyassessed;𝑟
=0.884
(autom
atic-C
umulus);
AUC=0.589(fo
urdensities:<
5%,25%
–50%
,50%–75%
,and>75%)
N/A
Other
metho
dsCh
enetal.[69]
2012
Dense
andfatty
DigitisedSFM
MLO
321(MIAS)
Visuallyassessed
70%(BI-RA
DS)
Chen
etal.[70]
2013
Dense
andfatty
DigitisedSFM
MLO
andCC
321(MIAS)
and831
(DDSM
)Visuallyassessed
76%MIAS,81%
DDSM
(BI-RA
DS)
International Journal of Breast Cancer 17
Table5:Summaryo
frepresentativestudiesusings
tatistic
almod
elbu
ildingm
etho
dsform
ammograph
ictissuesegmentatio
n.Notethat(1)thislist
consistso
fstudiesmainlyr
elated
toTabar
tissuem
odellin
gand(2)incase
ofmultip
leresults,onlytheb
estreportedresults
arelisted.
Stud
yYear
Num
bero
fmam
mograph
icbu
ilding
blocks
Mod
alities
Num
bero
fviews
Num
bero
fimages
Segm
entatio
nevaluatio
nRisk/densityestim
ation
accuracy
Textures
tatistic
alvaria
tion
Muh
immah
etal.[71]
2007
Linear,nod
ular,hom
ogeneous,and
radiolucent
DigitisedSFM
MLO
320(M
IAS)
Visuallyassessed
N/A
Hee
tal.[72]
2008
Linear,nod
ular,hom
ogeneous,and
radiolucent
DigitisedSFM
MLO
320(M
IAS)
Visuallyassessed
N/A
Hee
tal.[73]
2009
Linear,nod
ular,hom
ogeneous,and
radiolucent
DigitisedSFM
MLO
320(M
IAS)
Visuallyassessed
(65%
good
/verygood
)Tabar
(38%
good
/verygood
)BI-RADS
53%(Tabar),70%
(BI-RA
DS)
Hee
tal.[74]
2011
Linear,nod
ular,hom
ogeneous,and
radiolucent
DigitisedSFM
MLO
320(M
IAS)
Visuallyassessed
53%(Tabar)
Hee
tal.[75]
2012
Linear,nod
ular,hom
ogeneous,and
radiolucent
DigitisedSFM
MLO
320(M
IAS)
Visuallyassessed
85%(Tabar),78%
(BI-RA
DS)
Hee
tal.[76]
2014
Nod
ular,hom
ogeneous,and
radiolucent
FFDM
MLO
andCC
360
Visuallyassessed
79%(Tabar),80%
(BI-RA
DS)
Textured
escriptors
Hee
tal.[77]
2010
Linear,nod
ular,hom
ogeneous,and
radiolucent
DigitisedSFM
MLO
320(M
IAS)
Visuallyassessed
78%(Tabar),75%
(BI-RA
DS)
Hea
ndZw
iggelaar
[78]
2013
Nod
ular,hom
ogeneous,and
radiolucent
FFDM
MLO
andCC
360
Visuallyassessed
N/A
18 International Journal of Breast Cancer
correct connectivity, in high dimensional space. Distincttextons (higher discriminative power) tend to be situatedtowards the outer edges of the tree, whilst common texture,noise, and intensity aspects tend to be modelled by textonsin the central part of the tree. Subsequently, a model drivenbased mammographic tissue segmentation was performedusing the selected textons. An alternative texton selectionprocess using texton ranking, outlier detection, and visualassessment can be found in [150]. Both studies partiallyaddressed the texton selection issue discussed in [61] andshowed realistic segmentation results.
He et al. [73, 74] investigated amammographic tissue seg-mentation based on spatial moments and prior information(e.g., shape related texture features) of mammographic build-ing blocks. A set of geometric moments (spatial moments) ofdifferent orders were computed over local textures.Theywereused as global shape descriptors to encode different spatialcharacteristics of mammographic texture intensity distribu-tion. Visual assessment indicated that the spatial momentsbased texture features are able to capture orientation sensitivetexture properties, as well as more complicated texturalproperties, resulting in realistic mammographic tissue seg-mentation. However, the segmentation has a tendency ofoversegmenting linear structures and undersegmenting smallareas from nodular and homogeneous regions. Note that alow intensity background (e.g., low or zero grey-level values)can lead to “meaningless moments” [151] which can causemisclassification between high density homogeneous tissueand low density radiolucent tissue.The developed methodol-ogy is capable of modelling complex mammographic imagesand can deal with intraclass variation and noise aspects. Itis particularly suitable for modelling Tabar’s mammographicbuilding blocks as different breast tissue types have texturepatterns related not only to their periodicity but also to shapefeatures.
Clinical observations indicated that breast peripheralareas may not be fully compressed which may cause unex-pected intensity and texture variation within these areas.Such breast parenchymal appearance discrepancies may notbe desirable for tissue modelling within computer aidedmammography. He et al. [76] developed a mammographicimage preprocessing (peripheral enhancement) method toimprove the image quality before analysis (similar issue wasaddressed in [152]). Visual assessment indicated significantimprovement on segmented anatomical structures and tissuespecific areas when using the processed images.
Texture Descriptors. He et al. [77] developed a texture signa-ture [153] based methodology for mammographic tissue seg-mentation in an attempt to incorporate spatial and geometrictexture features. The framework is similar to the momentsbased approach [74], but for each pixel a texture signatureis generated which consists of three distinct subsignatures. Itis effectively a stack of three 2D histograms, encoding direc-tional texture features (e.g., intensity, orientation, and elon-gation variation). Visual assessment indicated good and con-sistent segmentation results, and it was robust in dealing withthe “meaningless moments” issues encountered in [74]. Twoaspects were investigated in subsequent studies [75, 78] to
further improve the framework. First, a binary model match-ing pattern based Bayes classifier was investigated in [75]. Anidea similar to “fuzzy membership” was used to allow a pixelto be associated with multiple classes at the same time. Theprocess generates a binary pattern of the “fuzzy membership”throughmodelmatching and is subsequently used in trainingthe Bayes classifier. Second, a feature and classifier selectiontechnique was proposed in [78]. Results indicated that atthe tissue modelling stage, over- and/or undertraining cancause tissue composition fluctuation between nodular andhomogeneous tissue, whilst the percentages of radiolucenttissuewere less sensitive to the algorithm’s parameter configu-rations.This resulted in inadequate compositions for nodularand homogeneous tissue according to Tabar’s parenchymalpatterns. Despite the shortcomings in some cases, theseimprovements helped to producemore realistic segmentationand improved risk classification accuracies. Example mam-mographic segmentation can be found in Figure 6.
4.3. 2D Projection Based Volumetric Approaches. Due totechnological limitations, 2D projection area measures areknown to be flawed [154, 155] as they do not providemeasures of the fibroglandular tissue volume (FVG).With X-ray mammograms, the brightness at any given point in theimage is dependent on the thickness of glandular and otherdense tissues projected onto that point. The arrangement ofglandular tissue within the breast depends on the way inwhich the breast is compressed. Therefore, measures of theprojected dense tissue area vary depending on compression.Substantial efforts have been directed towards volumetricbreast density estimation techniques which may allow forimproved assessment of breast fibroglandular tissue; this mayin turn lead to improved breast cancer risk assessment [156].Three groups of 2D projection based volumetric approachescan be identified, prior calibration, in-image phantom basedcalibration, and physical image formation models. A sum-mary of representative studies using 2D projection basedvolumetric approaches can be found in Table 6.
4.3.1. Prior Calibration. Highnam and Brady [157] devel-oped the Standard Mammogram Form (SMF) to measureglandular tissue composition objectively, with the details inSection 4.3.3. However, only “relative” tissue measurementswere obtained unless a careful calibration was performed.Following their study, Kaufhold et al. [158] proposed a cali-bration approach to glandular tissue composition estimationin digital mammography. The approach was evaluated usingbreast phantoms of varying thickness and FFDM. From theseimages, mean signal, noise levels, and computed calibrationcurves were extracted for quantitatively estimating tissuecomposition on a pixel-wise basis. In terms of different errorsources on the estimates of tissue composition, the initialstudy concluded that these error sources include compressedbreast height estimation error, residual scattered radiation,quantum noise, and beam hardening. Errors in the estimatedcompressed breast height contributed themost error in tissuecomposition. Heine et al. [79] proposed a calibrationmethodas an extension to [158] which coupled with first-order his-togram statistics as an automated surrogate for breast density
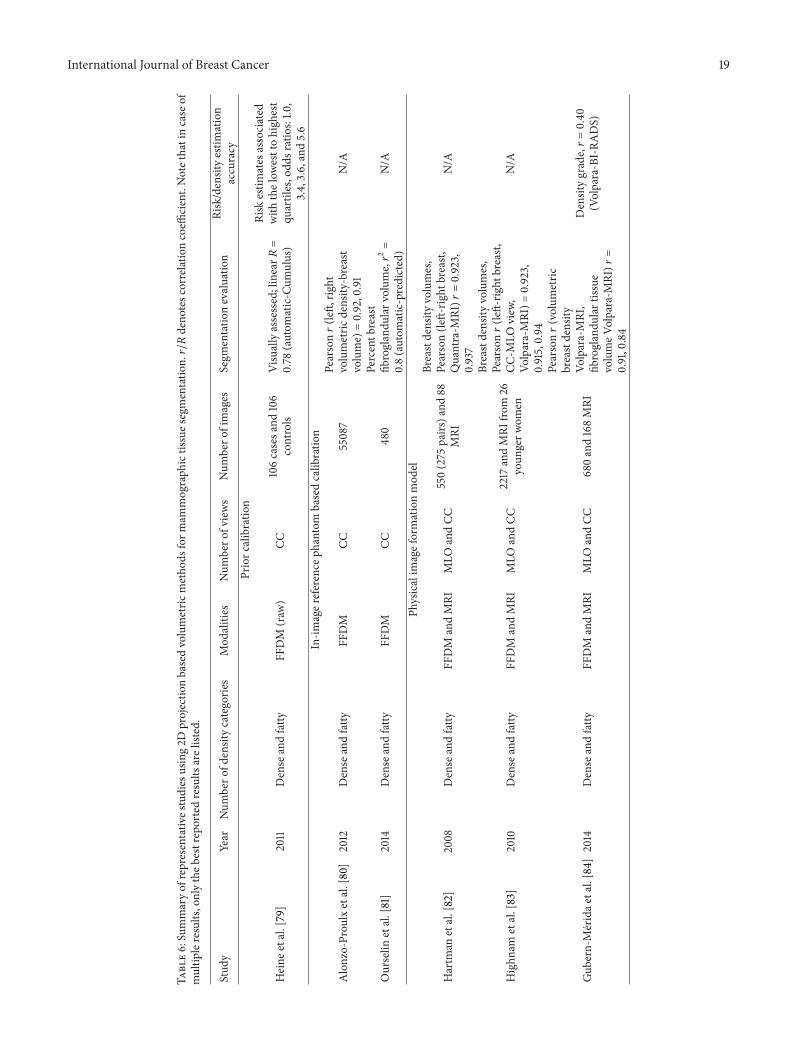
International Journal of Breast Cancer 19
Table6:Summaryof
representativ
estudies
using2D
projectio
nbasedvolumetric
metho
dsform
ammograph
ictissues
egmentatio
n.𝑟/𝑅deno
tesc
orrelationcoeffi
cient.Notethatincase
ofmultip
leresults,onlytheb
estreportedresults
arelisted.
Stud
yYear
Num
bero
fdensitycategorie
sMod
alities
Num
bero
fviews
Num
bero
fimages
Segm
entatio
nevaluatio
nRisk/densityestim
ation
accuracy
Priorc
alibratio
n
Heine
etal.[79]
2011
Dense
andfatty
FFDM
(raw
)CC
106casesa
nd106
controls
Visuallyassessed;linear𝑅
=0.78
(autom
atic-C
umulus)
Risk
estim
ates
associated
with
thelow
esttohigh
est
quartiles,odd
sratios:1.0
,3.4,3.6,and5.6
In-im
ager
eference
phantom
basedcalib
ratio
n
Alonzo-Prou
lxetal.[80]
2012
Dense
andfatty
FFDM
CC55087
Pearson𝑟(le
ft,rig
htvolumetric
density
-breast
volume)=0.92,0.91
N/A
Ourselin
etal.[81]
2014
Dense
andfatty
FFDM
CC480
Percentb
reast
fibroglandu
larv
olum
e,𝑟2=
0.8(autom
atic-predicted)
N/A
Physicalim
ageformationmod
el
Hartm
anetal.[82]
2008
Dense
andfatty
FFDM
andMRI
MLO
andCC
550(275
pairs
)and
88MRI
Breastdensity
volumes,
Pearson(le
ft-rig
htbreast,
Quantra-M
RI)𝑟
=0.923,
0.937
N/A
Highn
ametal.[83]
2010
Dense
andfatty
FFDM
andMRI
MLO
andCC
2217
andMRI
from
26youn
gerw
omen
Breastdensity
volumes,
Pearson𝑟(le
ft-rig
htbreast,
CC-M
LOview
,Vo
lpara-MRI)=
0.923,
0.915,0.94
N/A
Gub
ern-Meridae
tal.[84]
2014
Dense
andfatty
FFDM
andMRI
MLO
andCC
680and168MRI
Pearson𝑟(volum
etric
breastdensity
Volpara-MRI,
fibroglandu
lartissue
volumeV
olpara-M
RI)𝑟
=0.91,0.84
Densitygrade,𝑟=0.40
(Volpara-BI-RA
DS)
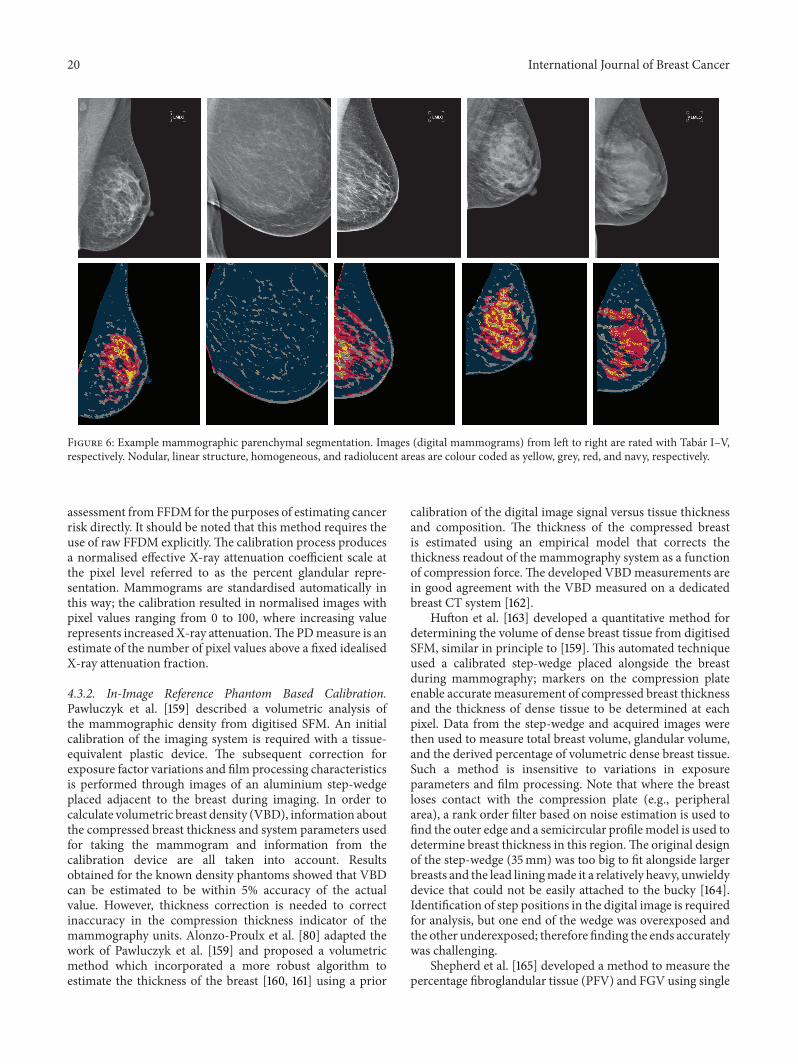
20 International Journal of Breast Cancer
Figure 6: Example mammographic parenchymal segmentation. Images (digital mammograms) from left to right are rated with Tabar I–V,respectively. Nodular, linear structure, homogeneous, and radiolucent areas are colour coded as yellow, grey, red, and navy, respectively.
assessment fromFFDM for the purposes of estimating cancerrisk directly. It should be noted that this method requires theuse of raw FFDM explicitly. The calibration process producesa normalised effective X-ray attenuation coefficient scale atthe pixel level referred to as the percent glandular repre-sentation. Mammograms are standardised automatically inthis way; the calibration resulted in normalised images withpixel values ranging from 0 to 100, where increasing valuerepresents increased X-ray attenuation.The PDmeasure is anestimate of the number of pixel values above a fixed idealisedX-ray attenuation fraction.
4.3.2. In-Image Reference Phantom Based Calibration.Pawluczyk et al. [159] described a volumetric analysis ofthe mammographic density from digitised SFM. An initialcalibration of the imaging system is required with a tissue-equivalent plastic device. The subsequent correction forexposure factor variations and film processing characteristicsis performed through images of an aluminium step-wedgeplaced adjacent to the breast during imaging. In order tocalculate volumetric breast density (VBD), information aboutthe compressed breast thickness and system parameters usedfor taking the mammogram and information from thecalibration device are all taken into account. Resultsobtained for the known density phantoms showed that VBDcan be estimated to be within 5% accuracy of the actualvalue. However, thickness correction is needed to correctinaccuracy in the compression thickness indicator of themammography units. Alonzo-Proulx et al. [80] adapted thework of Pawluczyk et al. [159] and proposed a volumetricmethod which incorporated a more robust algorithm toestimate the thickness of the breast [160, 161] using a prior
calibration of the digital image signal versus tissue thicknessand composition. The thickness of the compressed breastis estimated using an empirical model that corrects thethickness readout of the mammography system as a functionof compression force.The developed VBDmeasurements arein good agreement with the VBD measured on a dedicatedbreast CT system [162].
Hufton et al. [163] developed a quantitative method fordetermining the volume of dense breast tissue from digitisedSFM, similar in principle to [159]. This automated techniqueused a calibrated step-wedge placed alongside the breastduring mammography; markers on the compression plateenable accurate measurement of compressed breast thicknessand the thickness of dense tissue to be determined at eachpixel. Data from the step-wedge and acquired images werethen used to measure total breast volume, glandular volume,and the derived percentage of volumetric dense breast tissue.Such a method is insensitive to variations in exposureparameters and film processing. Note that where the breastloses contact with the compression plate (e.g., peripheralarea), a rank order filter based on noise estimation is used tofind the outer edge and a semicircular profilemodel is used todetermine breast thickness in this region.The original designof the step-wedge (35mm) was too big to fit alongside largerbreasts and the lead liningmade it a relatively heavy, unwieldydevice that could not be easily attached to the bucky [164].Identification of step positions in the digital image is requiredfor analysis, but one end of the wedge was overexposed andthe other underexposed; therefore finding the ends accuratelywas challenging.
Shepherd et al. [165] developed a method to measure thepercentage fibroglandular tissue (PFV) and FGV using single
International Journal of Breast Cancer 21
X-ray absorptiometry (SXA) in order to obtain tissue volu-metric measures during image acquisition using a referencephantom. This can generate an accurate thickness profile ofthe breast at each image position and calculate an imagespecific calibration of the pixel grey scale values to breastcomposition. It is a promising method which may be utilisedin commercial breast image equipment. Closely related workcan be found in [166, 167]. A modified calibration approachfor the SXA was proposed in [168]. The method takes intoaccount both geometric and image related factors that impactthe calibration of grey-level into absolute tissue composition.Breast density is calculated using the thickness correctionfactors and recalibration procedures, where all necessaryparameters are extracted automatically. Note that it is essen-tial to conduct weekly phantom scanning as part of qualitycontrol monitoring, with a specially designed calibrationphantom to control thickness and grey-level conversionstability. This weekly maintenance could be a limitation tothe SXA approach. To address this, Ourselin et al. [81] devel-oped a method to automatically quantify volumetric breastdensity without the use of phantoms. It applies a shape andappearance model to digital mammograms and combinesvolumetric density measures derived by the SXA method tobuild a statistical model based on image parameters extractedfrom the image.
4.3.3. Physical Image FormationModels. Highnam and Brady[157] proposed a normalised representation of the breastwhich was referred to as the Standard Mammogram Form(SMF). Such an approach transforms digitised SFM to an“interesting” tissue representation. The key assumption inthe normalisation method is that the X-ray attenuationcoefficients of fibroglandular and abnormal tissue are almostequal and are quite different from that of fatty tissue. Thetechnique utilises mammographic information which relatesto the physical volume of the breast; the height of nonfattytissue under compression that corresponds to each pixel iscalculated in order to estimate the volume of “interesting”tissue. The volumetric values of “interesting” tissue have agood anatomical correspondence with the expected tissuedensity of each mammographic risk. A mammogram correc-tion is required for scattered radiation and the dependencyof image formation parameters (e.g., tube voltage (kVp),spectrum, and exposure time (mAs)). Nevertheless, such avolumetric breast density estimation is fully automated and isable to compensate for calibration data errors (e.g., mAs, kVp,and spectra) by using image-based calibration [169]. Due torelativelyweak control over the image acquisition process, it isdifficult to eliminate variability in image characteristics (e.g.,contrast and brightness), leading to variation in the mam-mographic intensity distribution, and increased difficultyin identification of grey-level texture based mammographicpatterns [170]. However, closely related studies [171, 172]noted that possible errors can occur in the calculation oftissue height, which influences the overall accuracy of themeasures. The main disadvantage of SMF is that a completeand substantial set of calibration data would be needed togenerate realistic breast composition measures and yet thereare many trials that have retrospectively collected images
with no calibration data. The issue of measuring breastcomposition using retrospective digitised SMF with little orno calibration data availablewas later addressed in [169]. Sucha volumetric technique was criticised as less reliable than 2Dthreshold basedmethods [173] and did not provide a strongerpredictor of breast cancer risk [174].
van Engeland et al. [175] presented a method for esti-mation of dense breast tissue volume using FFDM. Suchan approach maps the thickness of dense tissue to a pixel,determined using a physical model of image acquisition.Linear attenuation coefficients of breast tissues were derivedfrom empirical data as a function of tube voltage, anodemate-rial, filtration, and compressed breast thickness. The devel-oped volumetric breast density estimation can be severelyhampered or rendered impossible for contrast enhancementimages, because such images violated the assumption madethat pixel values are proportional to exposure. Results weresignificantly worse when applied to images after logarithmtransformation (“for presentation/processed” images) thanthose obtained from the raw images. Over- or underes-timation of breast density volume can be seen when themethod was applied to thickness corrected images, whilstvery dense breasts can cause difficulty in obtaining a reliablecalibration location. In contrast to the SMF approach [157],many aspects of the image formation process and parametersrelated to the acquisition procedure were required, whilst in[175] many calibration parameters can be obtained from theDICOM header. Note that all volumetric techniques from2D projection data assume two components (i.e., fatty anddense tissue) in the breast; however, more recent volumetricdevelopments (e.g., van Engeland’s work) are far less relianton the image physics, although there is still some sensitivityto compressed breast thickness [176].
4.3.4. Commercial Software. Hartman et al. [82] presented avolumetric breast density technique as an extension to SMF[157]. The software is named Quantra, which significantlyimproves Highnam and Brady’s SMF approach [157]. Theperformance of SFM based volumetric breast density estima-tion and breast cancer risk has been reported to be equal tovisual assessment methods (e.g., Wolfe and SCC) but poorerthan the Cumulus. This may be due to error compensationin the calibration data by finding the breasts fatty peripheralareas which is difficult for very dense breasts, leading tounderestimation in volumetric density and underminingbreast cancer risk predictions [169].
Highnam et al. [83] built upon the work in [175] anddeveloped software named Volpara that uses relative physicsmodelling together with additional information derived fromthe image to substantially reduce dependence on imagingphysics data. The volume of dense tissue is found by a ratioof integrated (dense tissue) values over the breast areas, andthe volume is calculated by multiplying the area of the breastusing the recorded breast thickness. One of the difficultiesin volumetric based breast density estimation, as pointed outin [173], is in finding a reference area of the breast which isentirely fat, especially when the breast is very dense.
Both commercial software programmes have been underscrutiny, and reports from different studies are not always
22 International Journal of Breast Cancer
in line with each other. For example, a validation study[84] objectively evaluated Volpara breast density assessmenton FFDM using measurements obtained from breast MRI.It was concluded that accurate volumetric breast densityassessment is feasible in FFDM and has potential to beused in objective breast cancer risk models and screeningstratification. Similarly, Wang et al. [177] assessed agreementof three techniques (i.e., SXA, Quantra, and Volpara) withMRI for PFG, absolute FGV, and total breast volume. It wasconcluded that automated volumetric fibroglandular tissuemeasures from FFDM were in substantial agreement withMRI and if associated with breast cancer could be used inclinical practice to enhance risk assessment and prevention.However, Jeffreys et al. [178] compared the new volumetricbreast density method using Volpara with the Cumulus.Results indicated that there is a very strong correlationbetween the Cumulus PD and VBD, but there is less relation-ship between the Cumulus PD and the absolute volume ofdense tissue. A recent study [179] has shown disagreementin measured volumetric density when using Quantra andVolpara based technologies. To date there are no reports ofbreast cancer associations for Volpara or Quantra measuresof volumetric breast density techniques. Therefore furthervalidations of these new methods against breast cancer out-comes are needed. It should be noted that volumetric breastdensity can be measured from 2D projections, but the preciselocation of the dense tissue cannot be identified.Therefore, todate there are no volumetric segmentation results available.However, Volpara can produce a “density map” which allowsdense mammography patterns to be visualised. Promisingresults [10, 180] emerged recently showing that volumetricdensity measures have the potential to surpass area basedmeasures in breast cancer risk assessment.
4.4. 3D Reconstruction Based Volumetric Approaches. A lim-ited number of studies exist regarding mammographic tissuesegmentation using 3D DBT; so far there are few inves-tigations in the literature which lead to developing “true”3D dense tissue segmentation algorithms for estimatingvolumetric breast density.
Kontos et al. [181] conducted a feasibility study to distin-guish dense and fatty tissue in DBT using texture features(e.g., skewness, coarseness, contrast, energy, homogeneity,and fractal dimension). The selected texture features havebeen used in previous mammographic tissue segmentationstudies (e.g., [44]) and indicated that these features tendto correlate to breast density when computed from DBTimages [182]. When computing grey-level texture statistics,the conventional 2D texture descriptors were extended to3D by considering 3D voxel neighbourhoods rather than 2Dpixel neighbourhoods. The study concluded that the fractaldimension was superior in DBT, while contrast was best in2D projections. It was suggested that for 2D tomographicseparation of the breast tissue layers in DBT, the dominantcontribution to the grey-level values in the images is the X-ray attenuation at the specific voxel in the breast volume.This indicated that volumetric parenchymal properties suchas self-similarity reflected by fractal dimension could bemore accurately estimated by the corresponding DBT texture
features. Recent improvements on Kontos’s method have ledto fully automated 3D fibroglandular tissue segmentation andVBD estimation from DBT images, and the study showedstrong agreement with existing volumetric techniques basedon FFDM and MRI images [183]. The updated algorithmexploits the geometry of the acquisition of DBT sequencesas well as the relationship between image intensity andtissue density; 3D segmentation of the fibroglandular tissue isachieved by analysing both 2D projection images and recon-structed DBT slices. Results indicated that VBD estimationswere highly correlated for DBT and FFDM (𝑟 = 0.88), DBTandMRI (𝑟 = 0.76), and FFDM andMRI (𝑟 = 0.73). In termsof clinical relevance, such a fully automated quantitativeVBD estimation from DBT could result into more accuratemeasures of the fibroglandular tissue in the breast which maylead to more accurate measure of breast cancer risk.
Shafer et al. [184, 185] conducted a multimodality studywhich utilised a 3D hidden-Markov model (HMM) basedbreast tissue modelling technique for DBT segmentation ofadipose and glandular tissue. Much work has been donepreviously using 2D HMRF to estimate density and otherfeatures from mammograms [61, 186]. Glandular segmentedMRI were used in training a 3D HMM; the model wasvalidated and used to segment DBT breast volumes. Thebreast density for DBT images is calculated as the ratio ofglandular voxels to all voxels in the breast volume. All MRand DBT images were processed to optimise the availablerange of values for the breast tissue segmentation task. It wasalso assumed that the possible tissue type of each DBT voxelis either adipose or glandular. The evaluation showed mixedresults; some are encouraging and others are dissatisfactory.This indicated that the cross-modality training and testingscheme usingHMMneeds to be further investigated to refinethe process and increase accuracy and reliability for breastDBT segmentation.
5. Discussion
This review coversmammographic tissue segmentation exist-ing in the literature covering the period from 1992 to 2014,focusing on automatic approaches, and excluding man-ual and semiautomatic approaches. Only a fully automaticapproach can deliver consistent, standardised, fully repro-ducible, and comparable measurements for high-throughputbreast screening programmes across sites. Figure 7 shows thedistribution of various mammographic tissue segmentationapproaches, and Figure 8 shows the trend lines for areaand volumetric based mammographic density/parenchymalsegmentation approaches. This indicates a decline in thenumber of studies using 2D projection and an increasein the number of studies in 3D volumetric segmentation.Without automation and accurate estimation of breast den-sity/parenchymal patterns, mammographic segmentationdeveloped in a research environment is unlikely to becomeuseful in clinical practices for assessing mammographic riskor in clinical trials evaluating the influence of different vari-ables (drugs) on breast tissue [187]. Eng et al. [10] concludedthat fully automated methods are valid alternatives to thelabour intensive “gold standard” Cumulus for quantifying
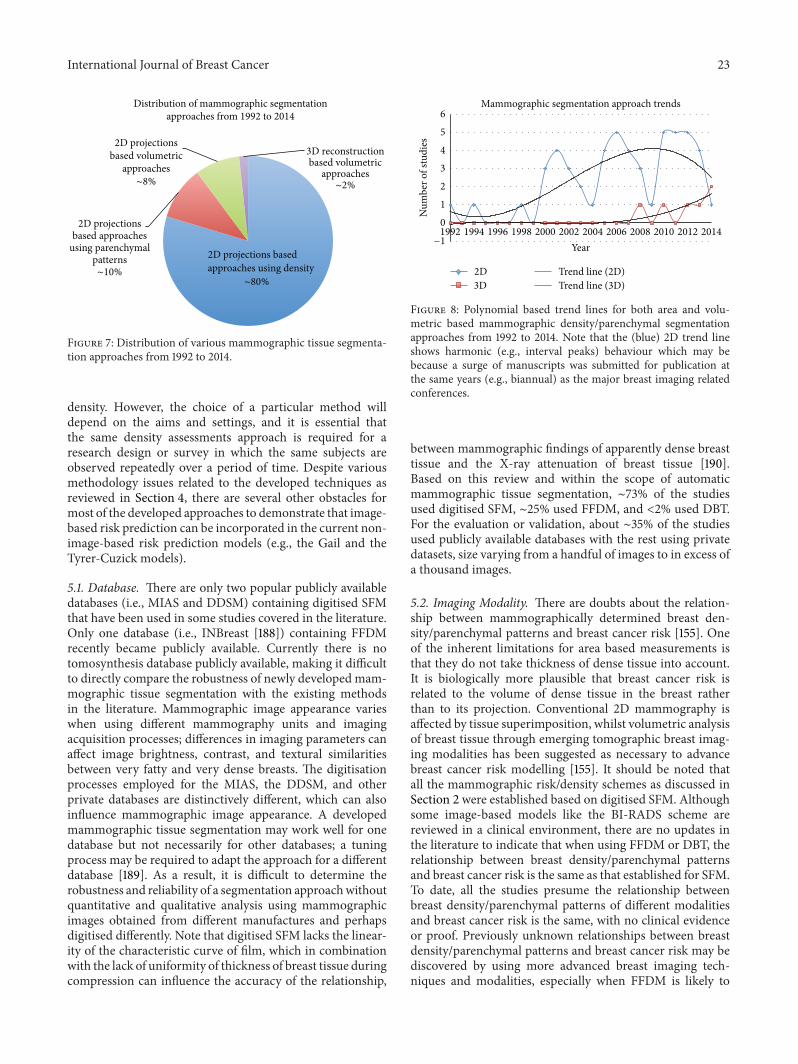
International Journal of Breast Cancer 23
Distribution of mammographic segmentationapproaches from 1992 to 2014
2D projections basedapproaches using density
2D projectionsbased volumetric
approaches∼8%
2D projectionsbased approaches
using parenchymalpatterns∼10%
3D reconstructionbased volumetric
approaches∼2%
∼80%
Figure 7: Distribution of various mammographic tissue segmenta-tion approaches from 1992 to 2014.
density. However, the choice of a particular method willdepend on the aims and settings, and it is essential thatthe same density assessments approach is required for aresearch design or survey in which the same subjects areobserved repeatedly over a period of time. Despite variousmethodology issues related to the developed techniques asreviewed in Section 4, there are several other obstacles formost of the developed approaches to demonstrate that image-based risk prediction can be incorporated in the current non-image-based risk prediction models (e.g., the Gail and theTyrer-Cuzick models).
5.1. Database. There are only two popular publicly availabledatabases (i.e., MIAS and DDSM) containing digitised SFMthat have been used in some studies covered in the literature.Only one database (i.e., INBreast [188]) containing FFDMrecently became publicly available. Currently there is notomosynthesis database publicly available, making it difficultto directly compare the robustness of newly developed mam-mographic tissue segmentation with the existing methodsin the literature. Mammographic image appearance varieswhen using different mammography units and imagingacquisition processes; differences in imaging parameters canaffect image brightness, contrast, and textural similaritiesbetween very fatty and very dense breasts. The digitisationprocesses employed for the MIAS, the DDSM, and otherprivate databases are distinctively different, which can alsoinfluence mammographic image appearance. A developedmammographic tissue segmentation may work well for onedatabase but not necessarily for other databases; a tuningprocess may be required to adapt the approach for a differentdatabase [189]. As a result, it is difficult to determine therobustness and reliability of a segmentation approachwithoutquantitative and qualitative analysis using mammographicimages obtained from different manufactures and perhapsdigitised differently. Note that digitised SFM lacks the linear-ity of the characteristic curve of film, which in combinationwith the lack of uniformity of thickness of breast tissue duringcompression can influence the accuracy of the relationship,
0
1
2
3
4
5
6
1992 1994 1996 1998 2000 2002 2004 2006 2008 2010 2012 2014
Num
ber o
f stu
dies
Year
Mammographic segmentation approach trends
2D3D
Trend line (2D)Trend line (3D)
−1
Figure 8: Polynomial based trend lines for both area and volu-metric based mammographic density/parenchymal segmentationapproaches from 1992 to 2014. Note that the (blue) 2D trend lineshows harmonic (e.g., interval peaks) behaviour which may bebecause a surge of manuscripts was submitted for publication atthe same years (e.g., biannual) as the major breast imaging relatedconferences.
between mammographic findings of apparently dense breasttissue and the X-ray attenuation of breast tissue [190].Based on this review and within the scope of automaticmammographic tissue segmentation, ∼73% of the studiesused digitised SFM, ∼25% used FFDM, and <2% used DBT.For the evaluation or validation, about ∼35% of the studiesused publicly available databases with the rest using privatedatasets, size varying from a handful of images to in excess ofa thousand images.
5.2. Imaging Modality. There are doubts about the relation-ship between mammographically determined breast den-sity/parenchymal patterns and breast cancer risk [155]. Oneof the inherent limitations for area based measurements isthat they do not take thickness of dense tissue into account.It is biologically more plausible that breast cancer risk isrelated to the volume of dense tissue in the breast ratherthan to its projection. Conventional 2D mammography isaffected by tissue superimposition, whilst volumetric analysisof breast tissue through emerging tomographic breast imag-ing modalities has been suggested as necessary to advancebreast cancer risk modelling [155]. It should be noted thatall the mammographic risk/density schemes as discussed inSection 2 were established based on digitised SFM. Althoughsome image-based models like the BI-RADS scheme arereviewed in a clinical environment, there are no updates inthe literature to indicate that when using FFDM or DBT, therelationship between breast density/parenchymal patternsand breast cancer risk is the same as that established for SFM.To date, all the studies presume the relationship betweenbreast density/parenchymal patterns of different modalitiesand breast cancer risk is the same, with no clinical evidenceor proof. Previously unknown relationships between breastdensity/parenchymal patterns and breast cancer risk may bediscovered by using more advanced breast imaging tech-niques and modalities, especially when FFDM is likely to
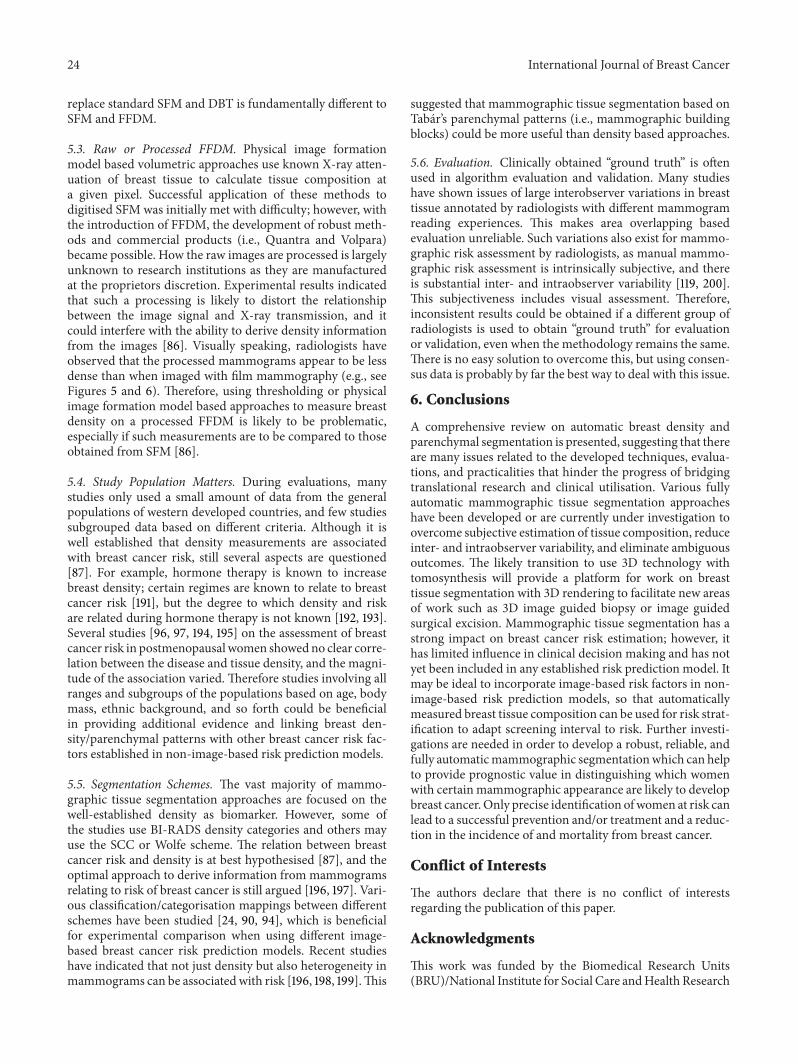
24 International Journal of Breast Cancer
replace standard SFM and DBT is fundamentally different toSFM and FFDM.
5.3. Raw or Processed FFDM. Physical image formationmodel based volumetric approaches use known X-ray atten-uation of breast tissue to calculate tissue composition ata given pixel. Successful application of these methods todigitised SFM was initially met with difficulty; however, withthe introduction of FFDM, the development of robust meth-ods and commercial products (i.e., Quantra and Volpara)became possible. How the raw images are processed is largelyunknown to research institutions as they are manufacturedat the proprietors discretion. Experimental results indicatedthat such a processing is likely to distort the relationshipbetween the image signal and X-ray transmission, and itcould interfere with the ability to derive density informationfrom the images [86]. Visually speaking, radiologists haveobserved that the processed mammograms appear to be lessdense than when imaged with film mammography (e.g., seeFigures 5 and 6). Therefore, using thresholding or physicalimage formation model based approaches to measure breastdensity on a processed FFDM is likely to be problematic,especially if such measurements are to be compared to thoseobtained from SFM [86].
5.4. Study Population Matters. During evaluations, manystudies only used a small amount of data from the generalpopulations of western developed countries, and few studiessubgrouped data based on different criteria. Although it iswell established that density measurements are associatedwith breast cancer risk, still several aspects are questioned[87]. For example, hormone therapy is known to increasebreast density; certain regimes are known to relate to breastcancer risk [191], but the degree to which density and riskare related during hormone therapy is not known [192, 193].Several studies [96, 97, 194, 195] on the assessment of breastcancer risk in postmenopausal women showedno clear corre-lation between the disease and tissue density, and the magni-tude of the association varied. Therefore studies involving allranges and subgroups of the populations based on age, bodymass, ethnic background, and so forth could be beneficialin providing additional evidence and linking breast den-sity/parenchymal patterns with other breast cancer risk fac-tors established in non-image-based risk prediction models.
5.5. Segmentation Schemes. The vast majority of mammo-graphic tissue segmentation approaches are focused on thewell-established density as biomarker. However, some ofthe studies use BI-RADS density categories and others mayuse the SCC or Wolfe scheme. The relation between breastcancer risk and density is at best hypothesised [87], and theoptimal approach to derive information from mammogramsrelating to risk of breast cancer is still argued [196, 197]. Vari-ous classification/categorisation mappings between differentschemes have been studied [24, 90, 94], which is beneficialfor experimental comparison when using different image-based breast cancer risk prediction models. Recent studieshave indicated that not just density but also heterogeneity inmammograms can be associated with risk [196, 198, 199].This
suggested that mammographic tissue segmentation based onTabar’s parenchymal patterns (i.e., mammographic buildingblocks) could be more useful than density based approaches.
5.6. Evaluation. Clinically obtained “ground truth” is oftenused in algorithm evaluation and validation. Many studieshave shown issues of large interobserver variations in breasttissue annotated by radiologists with different mammogramreading experiences. This makes area overlapping basedevaluation unreliable. Such variations also exist for mammo-graphic risk assessment by radiologists, as manual mammo-graphic risk assessment is intrinsically subjective, and thereis substantial inter- and intraobserver variability [119, 200].This subjectiveness includes visual assessment. Therefore,inconsistent results could be obtained if a different group ofradiologists is used to obtain “ground truth” for evaluationor validation, even when the methodology remains the same.There is no easy solution to overcome this, but using consen-sus data is probably by far the best way to deal with this issue.
6. Conclusions
A comprehensive review on automatic breast density andparenchymal segmentation is presented, suggesting that thereare many issues related to the developed techniques, evalua-tions, and practicalities that hinder the progress of bridgingtranslational research and clinical utilisation. Various fullyautomatic mammographic tissue segmentation approacheshave been developed or are currently under investigation toovercome subjective estimation of tissue composition, reduceinter- and intraobserver variability, and eliminate ambiguousoutcomes. The likely transition to use 3D technology withtomosynthesis will provide a platform for work on breasttissue segmentation with 3D rendering to facilitate new areasof work such as 3D image guided biopsy or image guidedsurgical excision. Mammographic tissue segmentation has astrong impact on breast cancer risk estimation; however, ithas limited influence in clinical decision making and has notyet been included in any established risk prediction model. Itmay be ideal to incorporate image-based risk factors in non-image-based risk prediction models, so that automaticallymeasured breast tissue composition can be used for risk strat-ification to adapt screening interval to risk. Further investi-gations are needed in order to develop a robust, reliable, andfully automaticmammographic segmentationwhich can helpto provide prognostic value in distinguishing which womenwith certain mammographic appearance are likely to developbreast cancer.Only precise identification ofwomen at risk canlead to a successful prevention and/or treatment and a reduc-tion in the incidence of and mortality from breast cancer.
Conflict of Interests
The authors declare that there is no conflict of interestsregarding the publication of this paper.
Acknowledgments
This work was funded by the Biomedical Research Units(BRU)/National Institute for Social Care andHealth Research
International Journal of Breast Cancer 25
(NISCHR). The authors would like to thank the reviewer(s)for providing paper feedback/comments as well as for usefuldiscussions.
References
[1] J. Ferlay, H.-R. Shin, F. Bray, D. Forman, C. Mathers, and D.M. Parkin, “Estimates of worldwide burden of cancer in 2008:GLOBOCAN2008,” International Journal of Cancer, vol. 127, no.12, pp. 2893–2917, 2010.
[2] S. A. Eccles, E. Aboagye, S. Ali et al., “Critical research gapsand translational priorities for the successful prevention andtreatment of breast cancer,” Breast Cancer Research, vol. 15,article R92, 2013.
[3] H. Darabi, K. Czene,W. Zhao, J. Liu, P. Hall, and K. Humphreys,“Breast cancer risk prediction and individualised screeningbased on common genetic variation and breast density mea-surement,” Breast Cancer Research, vol. 14, no. 1, article R25,2012.
[4] N. F. Boyd, L. J. Martin, M. J. Yaffe, and S. Minkin, “Mammo-graphic density and breast cancer risk: current understandingand future prospects,” Breast Cancer Research, vol. 13, no. 6,article 223, 2011.
[5] American College of Radiology, Breast Imaging Reportingand Data System (BI-RADS), American College of Radiology,Reston, Va, USA, 2003.
[6] A. Karellas, “Mammographic pattern analysis: an emerging riskassessment tool,” Academic Radiology, vol. 14, no. 5, pp. 511–512,2007.
[7] J. A. Harvey, G. J. Stukenborg, W. F. Cohn et al., “Volumetricbreast density improves breast cancer risk prediction,”OncologyTimes, vol. 37, no. 6, p. 33, 2015, Proceedings of the San AntonioBreast Cancer Symposium 2014.
[8] M. H. Gail, L. A. Brinton, D. P. Byar et al., “Projectingindividualized probabilities of developing breast cancer forwhite females who are being examined annually,” Journal of theNational Cancer Institute, vol. 81, no. 24, pp. 1879–1886, 1989.
[9] J. Tyrer, S. W. Duffy, and J. Cuzick, “A breast cancer predictionmodel incorporating familial and personal risk factors,” Statis-tics in Medicine, vol. 23, no. 7, pp. 1111–1130, 2004.
[10] A. Eng, Z. Gallant, J. Shepherd et al., “Volumetric breast densityimproves breast cancer risk prediction,” Breast Cancer Research,vol. 16, no. 5, article 439, 2014.
[11] D. G. R. Evans, J. Warwick, S. M. Astley et al., “Assessingindividual breast cancer risk within the U.K. National HealthService Breast Screening Program: a new paradigm for cancerprevention,” Cancer Prevention Research, vol. 5, no. 7, pp. 943–951, 2012.
[12] C. H. van Gils, J. D. M. Otten, A. L. M. Verbeek, and J. H.C. L. Hendriks, “Mammographic breast density and risk ofbreast cancer: masking bias or causality?” European Journal ofEpidemiology, vol. 14, no. 4, pp. 315–320, 1998.
[13] J. N. Wolfe, “Breast patterns as an index of risk for developingbreast cancer,” American Journal of Roentgenology, vol. 126, no.6, pp. 1130–1139, 1976.
[14] E. A. Sickles, “Wolfe mammographic parenchymal patterns andbreast cancer risk,” American Journal of Roentgenology, vol. 188,no. 2, pp. 301–303, 2007.
[15] L. Tabar and P. B. Dean, “Mammographic parenchymal pat-terns: risk indicator for breast cancer?” The Journal of theAmerican Medical Association, vol. 247, no. 2, pp. 185–189, 1982.
[16] L. Tabar, T. Tot, and P. B. Dean, The Art and Science ofEarly Detection with Mamography: Perception, Interpretation,Histopatholigic Correlation, GeorgThieme, 1st edition, 2004.
[17] N. F. Boyd, J. W. Byng, R. A. Jong et al., “Quantitative classifica-tion of mammographic densities and breast cancer risk: resultsfrom the Canadian National Breast Screening Study,” Journal ofthe National Cancer Institute, vol. 87, no. 9, pp. 670–675, 1995.
[18] N. F. Boyd, L. J.Martin, L. Sun et al., “Body size,mammographicdensity, and breast cancer risk,” Cancer Epidemiology Biomark-ers & Prevention, vol. 15, no. 11, pp. 2086–2092, 2006.
[19] E. S. Burnside, E. A. Sickles, L. W. Bassett et al., “The ACRBI-RADS c experience: learning from history,” Journal of theAmerican College of Radiology, vol. 6, no. 12, pp. 851–860, 2009.
[20] E. Sala, R. Warren, J. McCann, S. Duffy, N. Day, and R. Luben,“Mammographic parenchymal patterns andmode of detection:implications for the breast screening programme,” Journal ofMedical Screening, vol. 5, no. 4, pp. 207–212, 1998.
[21] J. C. Bailar III, “Mammography: a contrary view,” Annals ofInternal Medicine, vol. 84, no. 1, pp. 77–84, 1976.
[22] I. T. Gram, E. Funkhouser, and L. Tabar, “The Tabar classi-fication of mammographic parenchymal patterns,” EuropeanJournal of Radiology, vol. 24, no. 2, pp. 131–136, 1997.
[23] I. T. Gram, Y. Bremnes, G. Ursin, G. Maskarinec, N. Bjurstam,and E. Lund, “Percentage density, Wolfe’s and Tabar’s mammo-graphic patterns: agreement and associationwith risk factors forbreast cancer,” Breast Cancer Research, vol. 7, no. 5, pp. R854–R861, 2005.
[24] I. Muhimmah, A. Oliver, E. R. E. Denton, J. Pont, E. Perez, andR. Zwiggelaar, “Comparison between wolfe, boyd, BI-RADSand Tabar based mammographic risk assessment,” in DigitalMammography, vol. 4046 of Lecture Notes in Computer Science,pp. 407–415, Springer, 2006.
[25] T. Matsubara, D. Yamazaki, H. Fujita, T. Hara, T. Iwase, and T.Endo, “An automated classification method for mammogramsbased on evaluation of fibroglandular breast tissue density,” inProceedings of the International Workshop on Digital Mammog-raphy, pp. 737–741, 2000.
[26] P. K. Saha, J. K. Udupa, E. F. Conant, D. P. Chakraborty, andD. Sullivan, “Breast tissue density quantification via digitizedmammograms,” IEEE Transactions on Medical Imaging, vol. 20,no. 8, pp. 792–803, 2001.
[27] R. Sivaramakrishna, N. A. Obuchowski, W. A. Chilcote, andK. A. Powell, “Automatic segmentation of mammographic den-sity,” Academic Radiology, vol. 8, no. 3, pp. 250–256, 2001.
[28] C. Olsen and A. Mukhdoomi, “Automatic segmentation offibroglandular tissue,” in Image Analysis, vol. 4522 of LectureNotes in Computer Science, pp. 679–688, Springer, Berlin,Germany, 2007.
[29] S. D. Tzikopoulos, M. E. Mavroforakis, H. V. Georgiou, N.Dimitropoulos, and S. Theodoridis, “A fully automated schemefor mammographic segmentation and classification based onbreast density and asymmetry,” Computer Methods and Pro-grams in Biomedicine, vol. 102, no. 1, pp. 47–63, 2011.
[30] L.-J. W. Lu, T. K. Nishino, T. Khamapirad, J. J. Grady, M. H.Leonard Jr., and D. G. Brunder, “Computing mammographicdensity from a multiple regression model constructed withimage-acquisition parameters from a full-field digital mammo-graphic unit,” Physics inMedicine and Biology, vol. 52, no. 16, pp.4905–4921, 2007.
[31] R. J. Ferrari, R. M. Rangayyan, J. E. L. Desautels, and A. F.Frere, “Segmentation of mammograms: identification of the
26 International Journal of Breast Cancer
skin-air boundary, pectoral muscle, and fibroglandular disc,”in Proceedings of the 5th International Workshop on DigitalMammography (IWDM ’00), pp. 573–579, Toronto, Canada,June 2000.
[32] R. J. Ferrari, R. M. Rangayyan, R. A. Borges, and A. F. Frere,“Segmentation of the fibro-glandular disc in mammogramsusing Gaussian mixture modelling,” Medical and BiologicalEngineering and Computing, vol. 42, no. 3, pp. 378–387, 2004.
[33] A. El-Zaart, “Expectation-maximization technique for fibro-glandular discs detection inmammography images,”Computersin Biology and Medicine, vol. 40, no. 4, pp. 392–401, 2010.
[34] C. Zhou, H. P. Chan, N. Petrick et al., “Computerized imageanalysis: estimation of breast density on mammograms,”Medi-cal Physics, vol. 28, no. 6, pp. 1056–1069, 2001.
[35] J. T. Neyhart, M. Kirlakovsky, L. M. Coleman, R. Polikar, M.Tseng, and S. A. Mandayam, “Automated segmentation andquantitative characterization of radiodense tissue in digitizedmammograms,” AIP Conference Proceedings, vol. 615, no. 1, pp.1866–1873, 2002.
[36] Y. Kim, C. Kim, and J. H. Kim, “Automated estimation of breastdensity on mammogram using combined information of his-togram statistics and boundary gradients,” in Medical Imaging2010: Computer-Aided Diagnosis, vol. 7624 of Proceedings ofSPIE, p. 76242F, San Diego, Calif, USA, March 2010.
[37] C. Nickson, Y. Arzhaeva, Z. Aitken et al., “AutoDensity: anautomated method to measure mammographic breast densitythat predicts breast cancer risk and screening outcomes,” BreastCancer Research, vol. 15, no. 5, article R80, 2013.
[38] A. Oliver, J. Freixenet, A. Bosch, D. Raba, and R. Zwiggelaar,“Automatic classification of breast tissue,” in Proceedings ofthe 2nd Iberian Conference on Pattern Recognition and ImageAnalysis (IbPRIA ’05), vol. 3523 of Lecture Notes in ComputerScience, pp. 431–438, June 2005.
[39] H. Strange, E. R. E. Denton, M. Kibiro, and R. Zwiggelaar,“Manifold learning for density segmentation in high risk mam-mograms,” in Pattern Recognition and Image Analysis, vol. 7887of Lecture Notes in Computer Science, pp. 245–252, Springer,Berlin, Germany, 2013.
[40] K. Marias, M. G. Linguraru, M. A. G. Ballester, S. Petroudi, M.Tsiknakis, and S. M. Brady, “Automatic labelling and BI-RADScharacterisation of mammogram densities,” in Proceedings ofthe 27th Annual International Conference of the Engineering inMedicine and Biology Society (EMBS ’05), pp. 6394–6398, IEEE,September 2005.
[41] A. Oliver, J. Freixenet, and R. Zwiggelaar, “Automatic classifica-tion of breast density,” in Proceedings of the IEEE InternationalConference on Image Processing (ICIP ’05), vol. 2, pp. 1258–1261,September 2005.
[42] A. Oliver, J. Martı, J. Freixenet, J. Pont, and R. Zwiggelaar,“Automatic classification of breast density according BIRADScategories using a clustering approach,” in Proceedings of theComputed Aided Radiology and Surgery (CARS ’05), Berlin,Germany, June 2005.
[43] A. Oliver, X. Llado, R. Martı, J. Freixenet, and R. Zwigge-laar, “Classifying mammograms using texture information,” inProceedings of the Medical Image Understanding and AnalysisConference, pp. 223–227, July 2007.
[44] A. Oliver, J. Freixenet, R. Martı et al., “A novel breast tissuedensity classificationmethodology,” IEEE Transactions on Infor-mation Technology in Biomedicine, vol. 12, no. 1, pp. 55–65, 2008.
[45] A. Oliver, J. Freixenet, R. Martı, and R. Zwiggelaar, “A com-parison of breast tissue classification techniques,” in Med-ical Image Computing and Computer-Assisted Intervention—MICCAI 2006, vol. 4191 of Lecture Notes in Computer Science,pp. 872–879, Springer, Berlin, Germany, 2006.
[46] A. Torrent, A. Bardera, A. Oliver et al., “Breast density segmen-tation: a comparison of clustering and region based techniques,”inDigital Mammography, vol. 5116 of Lecture Notes in ComputerScience, pp. 9–16, Springer, Berlin, Germany, 2008.
[47] M. Tortajada, A. Oliver, R. Martı et al., “Adapting breast densityclassification from digitized to full-field digital mammograms,”inBreast Imaging, vol. 7361 ofLectureNotes inComputer Science,pp. 561–568, Springer, Berlin, Germany, 2012.
[48] Z. Chen and R. Zwiggelaar, “A modified fuzzy c-means algo-rithm for breast tissue density segmentation in mammograms,”in Proceedings of the 10th International Conference on Informa-tion Technology and Applications in Biomedicine (ITAB ’10), pp.1–4, IEEE, Corfu, Greece, November 2010.
[49] B. Keller, D. Nathan, Y. Wang et al., “Adaptive multi-clusterfuzzy c-means segmentation of breast parenchymal tissuein digital mammography,” in Medical Image Computing andComputer-Assisted Intervention—MICCAI 2011, vol. 6893 ofLecture Notes in Computer Science, pp. 562–569, Springer, 2011.
[50] B. M. Keller, D. L. Nathan, Y. Wang et al., “Estimation ofbreast percent density in raw and processed full field digitalmammography images via adaptive fuzzy c-means clusteringand support vector machine segmentation,” Medical Physics,vol. 39, no. 8, pp. 4903–4917, 2012.
[51] S. R. Aylward, B. M. Hemminger, and E. D. Pisano, “Mixturemodeling for digital mammogram display and analysis,” inProceedings of the International Workshop on Digital Mammog-raphy, pp. 305–312, 1998.
[52] R. Zwiggelaar, P. Planiol, J. Martı et al., “EM texture seg-mentation of mammographic images,” in Proceedings of theInternational Workshop on Digital Mammography, pp. 223–227,Bremen, Germany, June 2002.
[53] R. Zwiggelaar, L. Blot, D. Raba, and E. R. E. Denton, “Set-permutation-occurrence matrix based texture segmentation,”in Pattern Recognition and Image Analysis, vol. 2652 of LectureNotes in Computer Science, pp. 1099–1107, Springer, Berlin,Germany, 2003.
[54] R. Zwiggelaar, L. Blot, D. Raba, and D. R. E. Erika, “Texture seg-mentation in mammograms,” in Medical Image Understandingand Analysis, 2003.
[55] R. Zwiggelaar and E. R. E. Denton, “Optimal segmentationof mammographic images,” in Proceedings of the InternationalWorkshop on Digital Mammography, pp. 751–757, 2004.
[56] S. E. Selvan, C. C. Xavier, N. Karssemeijer, J. Sequeira, R. A.Cherian, and B. Y. Dhala, “Parameter estimation in stochasticmammogram model by heuristic optimization techniques,”IEEE Transactions on Information Technology in Biomedicine,vol. 10, no. 4, pp. 685–695, 2006.
[57] P. Miller and S. Astley, “Classification of breast tissue by textureanalysis,” Image and Vision Computing, vol. 10, no. 5, pp. 277–282, 1992.
[58] J. Suckling, D. R. Dance, E. Moskovic, D. J. Lewis, and S. G.Blacker, “Segmentation of mammograms using multiple linkedself-organizing neural networks,”Medical Physics, vol. 22, no. 2,pp. 145–152, 1995.
[59] J. J. Heine and R. P. Velthuizen, “A statistical methodology formammographic density detection,”Medical Physics, vol. 27, no.12, pp. 2644–2651, 2000.
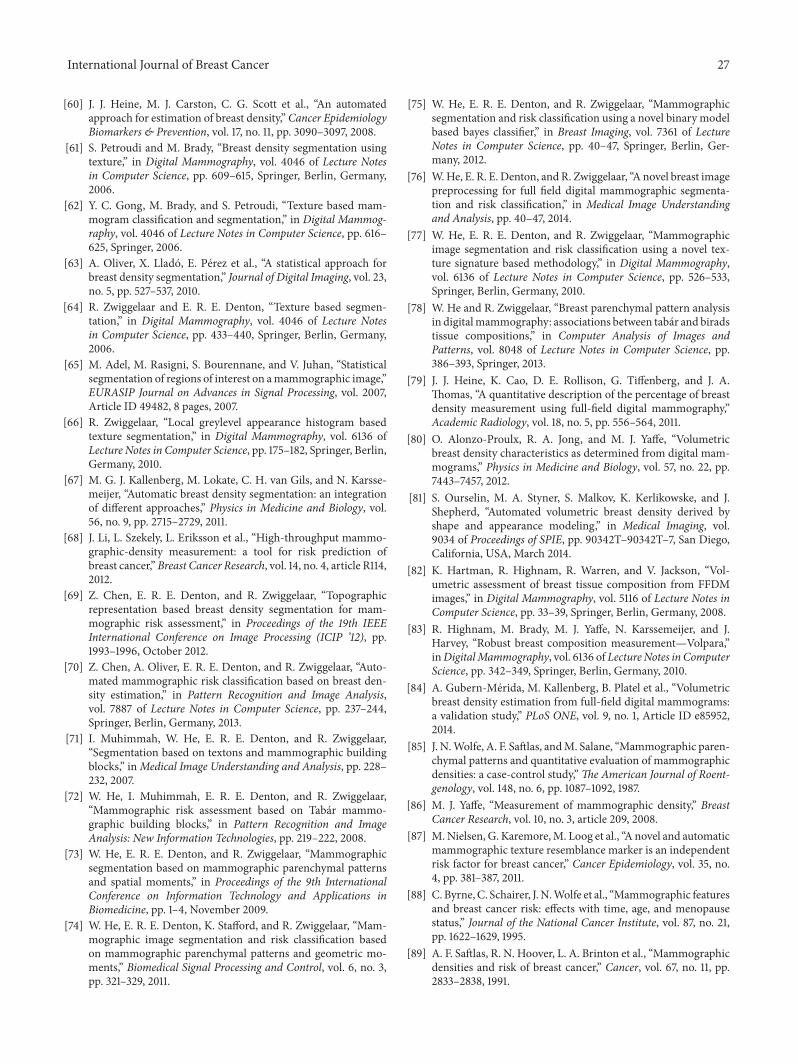
International Journal of Breast Cancer 27
[60] J. J. Heine, M. J. Carston, C. G. Scott et al., “An automatedapproach for estimation of breast density,” Cancer EpidemiologyBiomarkers & Prevention, vol. 17, no. 11, pp. 3090–3097, 2008.
[61] S. Petroudi and M. Brady, “Breast density segmentation usingtexture,” in Digital Mammography, vol. 4046 of Lecture Notesin Computer Science, pp. 609–615, Springer, Berlin, Germany,2006.
[62] Y. C. Gong, M. Brady, and S. Petroudi, “Texture based mam-mogram classification and segmentation,” in Digital Mammog-raphy, vol. 4046 of Lecture Notes in Computer Science, pp. 616–625, Springer, 2006.
[63] A. Oliver, X. Llado, E. Perez et al., “A statistical approach forbreast density segmentation,” Journal of Digital Imaging, vol. 23,no. 5, pp. 527–537, 2010.
[64] R. Zwiggelaar and E. R. E. Denton, “Texture based segmen-tation,” in Digital Mammography, vol. 4046 of Lecture Notesin Computer Science, pp. 433–440, Springer, Berlin, Germany,2006.
[65] M. Adel, M. Rasigni, S. Bourennane, and V. Juhan, “Statisticalsegmentation of regions of interest on amammographic image,”EURASIP Journal on Advances in Signal Processing, vol. 2007,Article ID 49482, 8 pages, 2007.
[66] R. Zwiggelaar, “Local greylevel appearance histogram basedtexture segmentation,” in Digital Mammography, vol. 6136 ofLecture Notes in Computer Science, pp. 175–182, Springer, Berlin,Germany, 2010.
[67] M. G. J. Kallenberg, M. Lokate, C. H. van Gils, and N. Karsse-meijer, “Automatic breast density segmentation: an integrationof different approaches,” Physics in Medicine and Biology, vol.56, no. 9, pp. 2715–2729, 2011.
[68] J. Li, L. Szekely, L. Eriksson et al., “High-throughput mammo-graphic-density measurement: a tool for risk prediction ofbreast cancer,” Breast Cancer Research, vol. 14, no. 4, article R114,2012.
[69] Z. Chen, E. R. E. Denton, and R. Zwiggelaar, “Topographicrepresentation based breast density segmentation for mam-mographic risk assessment,” in Proceedings of the 19th IEEEInternational Conference on Image Processing (ICIP ’12), pp.1993–1996, October 2012.
[70] Z. Chen, A. Oliver, E. R. E. Denton, and R. Zwiggelaar, “Auto-mated mammographic risk classification based on breast den-sity estimation,” in Pattern Recognition and Image Analysis,vol. 7887 of Lecture Notes in Computer Science, pp. 237–244,Springer, Berlin, Germany, 2013.
[71] I. Muhimmah, W. He, E. R. E. Denton, and R. Zwiggelaar,“Segmentation based on textons and mammographic buildingblocks,” inMedical Image Understanding and Analysis, pp. 228–232, 2007.
[72] W. He, I. Muhimmah, E. R. E. Denton, and R. Zwiggelaar,“Mammographic risk assessment based on Tabar mammo-graphic building blocks,” in Pattern Recognition and ImageAnalysis: New Information Technologies, pp. 219–222, 2008.
[73] W. He, E. R. E. Denton, and R. Zwiggelaar, “Mammographicsegmentation based on mammographic parenchymal patternsand spatial moments,” in Proceedings of the 9th InternationalConference on Information Technology and Applications inBiomedicine, pp. 1–4, November 2009.
[74] W. He, E. R. E. Denton, K. Stafford, and R. Zwiggelaar, “Mam-mographic image segmentation and risk classification basedon mammographic parenchymal patterns and geometric mo-ments,” Biomedical Signal Processing and Control, vol. 6, no. 3,pp. 321–329, 2011.
[75] W. He, E. R. E. Denton, and R. Zwiggelaar, “Mammographicsegmentation and risk classification using a novel binary modelbased bayes classifier,” in Breast Imaging, vol. 7361 of LectureNotes in Computer Science, pp. 40–47, Springer, Berlin, Ger-many, 2012.
[76] W.He, E. R. E. Denton, and R. Zwiggelaar, “A novel breast imagepreprocessing for full field digital mammographic segmenta-tion and risk classification,” in Medical Image Understandingand Analysis, pp. 40–47, 2014.
[77] W. He, E. R. E. Denton, and R. Zwiggelaar, “Mammographicimage segmentation and risk classification using a novel tex-ture signature based methodology,” in Digital Mammography,vol. 6136 of Lecture Notes in Computer Science, pp. 526–533,Springer, Berlin, Germany, 2010.
[78] W. He and R. Zwiggelaar, “Breast parenchymal pattern analysisin digitalmammography: associations between tabar and biradstissue compositions,” in Computer Analysis of Images andPatterns, vol. 8048 of Lecture Notes in Computer Science, pp.386–393, Springer, 2013.
[79] J. J. Heine, K. Cao, D. E. Rollison, G. Tiffenberg, and J. A.Thomas, “A quantitative description of the percentage of breastdensity measurement using full-field digital mammography,”Academic Radiology, vol. 18, no. 5, pp. 556–564, 2011.
[80] O. Alonzo-Proulx, R. A. Jong, and M. J. Yaffe, “Volumetricbreast density characteristics as determined from digital mam-mograms,” Physics in Medicine and Biology, vol. 57, no. 22, pp.7443–7457, 2012.
[81] S. Ourselin, M. A. Styner, S. Malkov, K. Kerlikowske, and J.Shepherd, “Automated volumetric breast density derived byshape and appearance modeling,” in Medical Imaging, vol.9034 of Proceedings of SPIE, pp. 90342T–90342T–7, San Diego,California, USA, March 2014.
[82] K. Hartman, R. Highnam, R. Warren, and V. Jackson, “Vol-umetric assessment of breast tissue composition from FFDMimages,” in Digital Mammography, vol. 5116 of Lecture Notes inComputer Science, pp. 33–39, Springer, Berlin, Germany, 2008.
[83] R. Highnam, M. Brady, M. J. Yaffe, N. Karssemeijer, and J.Harvey, “Robust breast composition measurement—Volpara,”inDigitalMammography, vol. 6136 of LectureNotes in ComputerScience, pp. 342–349, Springer, Berlin, Germany, 2010.
[84] A. Gubern-Merida, M. Kallenberg, B. Platel et al., “Volumetricbreast density estimation from full-field digital mammograms:a validation study,” PLoS ONE, vol. 9, no. 1, Article ID e85952,2014.
[85] J. N.Wolfe, A. F. Saftlas, andM. Salane, “Mammographic paren-chymal patterns and quantitative evaluation of mammographicdensities: a case-control study,”The American Journal of Roent-genology, vol. 148, no. 6, pp. 1087–1092, 1987.
[86] M. J. Yaffe, “Measurement of mammographic density,” BreastCancer Research, vol. 10, no. 3, article 209, 2008.
[87] M.Nielsen, G. Karemore,M. Loog et al., “A novel and automaticmammographic texture resemblance marker is an independentrisk factor for breast cancer,” Cancer Epidemiology, vol. 35, no.4, pp. 381–387, 2011.
[88] C. Byrne, C. Schairer, J.N.Wolfe et al., “Mammographic featuresand breast cancer risk: effects with time, age, and menopausestatus,” Journal of the National Cancer Institute, vol. 87, no. 21,pp. 1622–1629, 1995.
[89] A. F. Saftlas, R. N. Hoover, L. A. Brinton et al., “Mammographicdensities and risk of breast cancer,” Cancer, vol. 67, no. 11, pp.2833–2838, 1991.
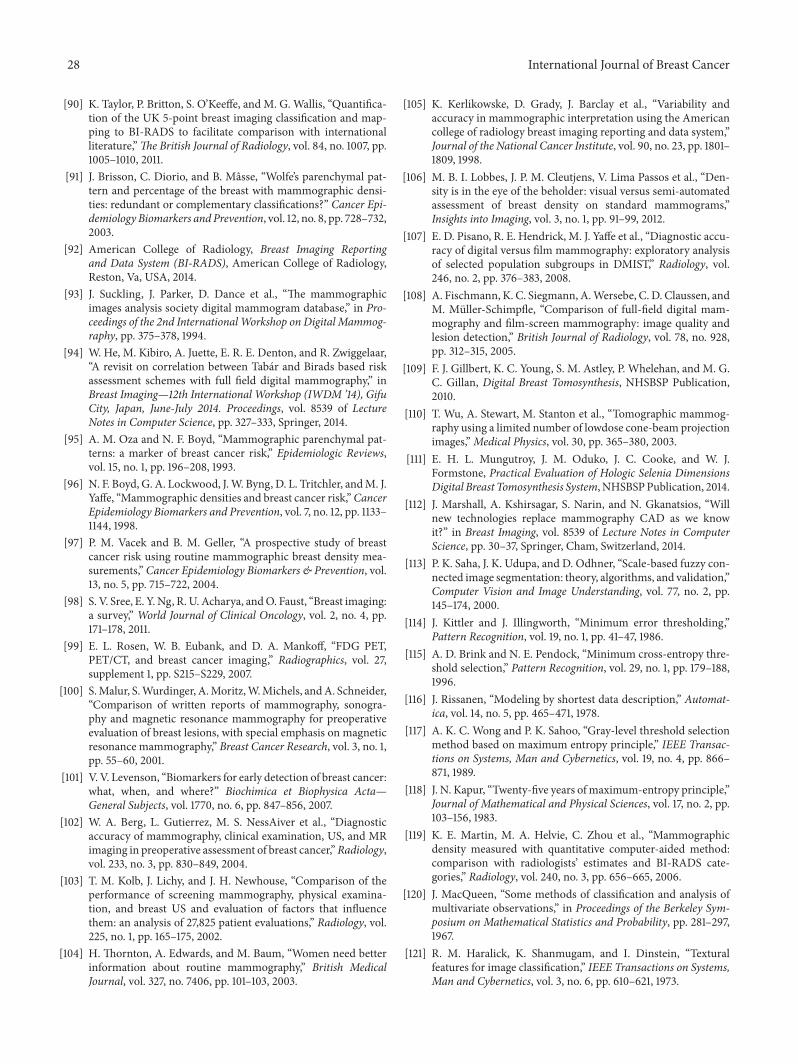
28 International Journal of Breast Cancer
[90] K. Taylor, P. Britton, S. O’Keeffe, and M. G. Wallis, “Quantifica-tion of the UK 5-point breast imaging classification and map-ping to BI-RADS to facilitate comparison with internationalliterature,”The British Journal of Radiology, vol. 84, no. 1007, pp.1005–1010, 2011.
[91] J. Brisson, C. Diorio, and B. Masse, “Wolfe’s parenchymal pat-tern and percentage of the breast with mammographic densi-ties: redundant or complementary classifications?” Cancer Epi-demiology Biomarkers and Prevention, vol. 12, no. 8, pp. 728–732,2003.
[92] American College of Radiology, Breast Imaging Reportingand Data System (BI-RADS), American College of Radiology,Reston, Va, USA, 2014.
[93] J. Suckling, J. Parker, D. Dance et al., “The mammographicimages analysis society digital mammogram database,” in Pro-ceedings of the 2nd InternationalWorkshop on Digital Mammog-raphy, pp. 375–378, 1994.
[94] W. He, M. Kibiro, A. Juette, E. R. E. Denton, and R. Zwiggelaar,“A revisit on correlation between Tabar and Birads based riskassessment schemes with full field digital mammography,” inBreast Imaging—12th International Workshop (IWDM ’14), GifuCity, Japan, June-July 2014. Proceedings, vol. 8539 of LectureNotes in Computer Science, pp. 327–333, Springer, 2014.
[95] A. M. Oza and N. F. Boyd, “Mammographic parenchymal pat-terns: a marker of breast cancer risk,” Epidemiologic Reviews,vol. 15, no. 1, pp. 196–208, 1993.
[96] N. F. Boyd, G. A. Lockwood, J.W. Byng, D. L. Tritchler, andM. J.Yaffe, “Mammographic densities and breast cancer risk,”CancerEpidemiology Biomarkers and Prevention, vol. 7, no. 12, pp. 1133–1144, 1998.
[97] P. M. Vacek and B. M. Geller, “A prospective study of breastcancer risk using routine mammographic breast density mea-surements,” Cancer Epidemiology Biomarkers & Prevention, vol.13, no. 5, pp. 715–722, 2004.
[98] S. V. Sree, E. Y. Ng, R. U. Acharya, andO. Faust, “Breast imaging:a survey,” World Journal of Clinical Oncology, vol. 2, no. 4, pp.171–178, 2011.
[99] E. L. Rosen, W. B. Eubank, and D. A. Mankoff, “FDG PET,PET/CT, and breast cancer imaging,” Radiographics, vol. 27,supplement 1, pp. S215–S229, 2007.
[100] S.Malur, S.Wurdinger, A.Moritz,W.Michels, andA. Schneider,“Comparison of written reports of mammography, sonogra-phy and magnetic resonance mammography for preoperativeevaluation of breast lesions, with special emphasis on magneticresonance mammography,” Breast Cancer Research, vol. 3, no. 1,pp. 55–60, 2001.
[101] V. V. Levenson, “Biomarkers for early detection of breast cancer:what, when, and where?” Biochimica et Biophysica Acta—General Subjects, vol. 1770, no. 6, pp. 847–856, 2007.
[102] W. A. Berg, L. Gutierrez, M. S. NessAiver et al., “Diagnosticaccuracy of mammography, clinical examination, US, and MRimaging in preoperative assessment of breast cancer,”Radiology,vol. 233, no. 3, pp. 830–849, 2004.
[103] T. M. Kolb, J. Lichy, and J. H. Newhouse, “Comparison of theperformance of screening mammography, physical examina-tion, and breast US and evaluation of factors that influencethem: an analysis of 27,825 patient evaluations,” Radiology, vol.225, no. 1, pp. 165–175, 2002.
[104] H. Thornton, A. Edwards, and M. Baum, “Women need betterinformation about routine mammography,” British MedicalJournal, vol. 327, no. 7406, pp. 101–103, 2003.
[105] K. Kerlikowske, D. Grady, J. Barclay et al., “Variability andaccuracy in mammographic interpretation using the Americancollege of radiology breast imaging reporting and data system,”Journal of the National Cancer Institute, vol. 90, no. 23, pp. 1801–1809, 1998.
[106] M. B. I. Lobbes, J. P. M. Cleutjens, V. Lima Passos et al., “Den-sity is in the eye of the beholder: visual versus semi-automatedassessment of breast density on standard mammograms,”Insights into Imaging, vol. 3, no. 1, pp. 91–99, 2012.
[107] E. D. Pisano, R. E. Hendrick, M. J. Yaffe et al., “Diagnostic accu-racy of digital versus film mammography: exploratory analysisof selected population subgroups in DMIST,” Radiology, vol.246, no. 2, pp. 376–383, 2008.
[108] A. Fischmann, K. C. Siegmann, A.Wersebe, C. D. Claussen, andM. Muller-Schimpfle, “Comparison of full-field digital mam-mography and film-screen mammography: image quality andlesion detection,” British Journal of Radiology, vol. 78, no. 928,pp. 312–315, 2005.
[109] F. J. Gillbert, K. C. Young, S. M. Astley, P. Whelehan, and M. G.C. Gillan, Digital Breast Tomosynthesis, NHSBSP Publication,2010.
[110] T. Wu, A. Stewart, M. Stanton et al., “Tomographic mammog-raphy using a limited number of lowdose cone-beam projectionimages,”Medical Physics, vol. 30, pp. 365–380, 2003.
[111] E. H. L. Mungutroy, J. M. Oduko, J. C. Cooke, and W. J.Formstone, Practical Evaluation of Hologic Selenia DimensionsDigital Breast Tomosynthesis System, NHSBSPPublication, 2014.
[112] J. Marshall, A. Kshirsagar, S. Narin, and N. Gkanatsios, “Willnew technologies replace mammography CAD as we knowit?” in Breast Imaging, vol. 8539 of Lecture Notes in ComputerScience, pp. 30–37, Springer, Cham, Switzerland, 2014.
[113] P. K. Saha, J. K. Udupa, and D. Odhner, “Scale-based fuzzy con-nected image segmentation: theory, algorithms, and validation,”Computer Vision and Image Understanding, vol. 77, no. 2, pp.145–174, 2000.
[114] J. Kittler and J. Illingworth, “Minimum error thresholding,”Pattern Recognition, vol. 19, no. 1, pp. 41–47, 1986.
[115] A. D. Brink and N. E. Pendock, “Minimum cross-entropy thre-shold selection,” Pattern Recognition, vol. 29, no. 1, pp. 179–188,1996.
[116] J. Rissanen, “Modeling by shortest data description,” Automat-ica, vol. 14, no. 5, pp. 465–471, 1978.
[117] A. K. C. Wong and P. K. Sahoo, “Gray-level threshold selectionmethod based on maximum entropy principle,” IEEE Transac-tions on Systems, Man and Cybernetics, vol. 19, no. 4, pp. 866–871, 1989.
[118] J. N. Kapur, “Twenty-five years of maximum-entropy principle,”Journal of Mathematical and Physical Sciences, vol. 17, no. 2, pp.103–156, 1983.
[119] K. E. Martin, M. A. Helvie, C. Zhou et al., “Mammographicdensity measured with quantitative computer-aided method:comparison with radiologists’ estimates and BI-RADS cate-gories,” Radiology, vol. 240, no. 3, pp. 656–665, 2006.
[120] J. MacQueen, “Some methods of classification and analysis ofmultivariate observations,” in Proceedings of the Berkeley Sym-posium on Mathematical Statistics and Probability, pp. 281–297,1967.
[121] R. M. Haralick, K. Shanmugam, and I. Dinstein, “Texturalfeatures for image classification,” IEEE Transactions on Systems,Man and Cybernetics, vol. 3, no. 6, pp. 610–621, 1973.
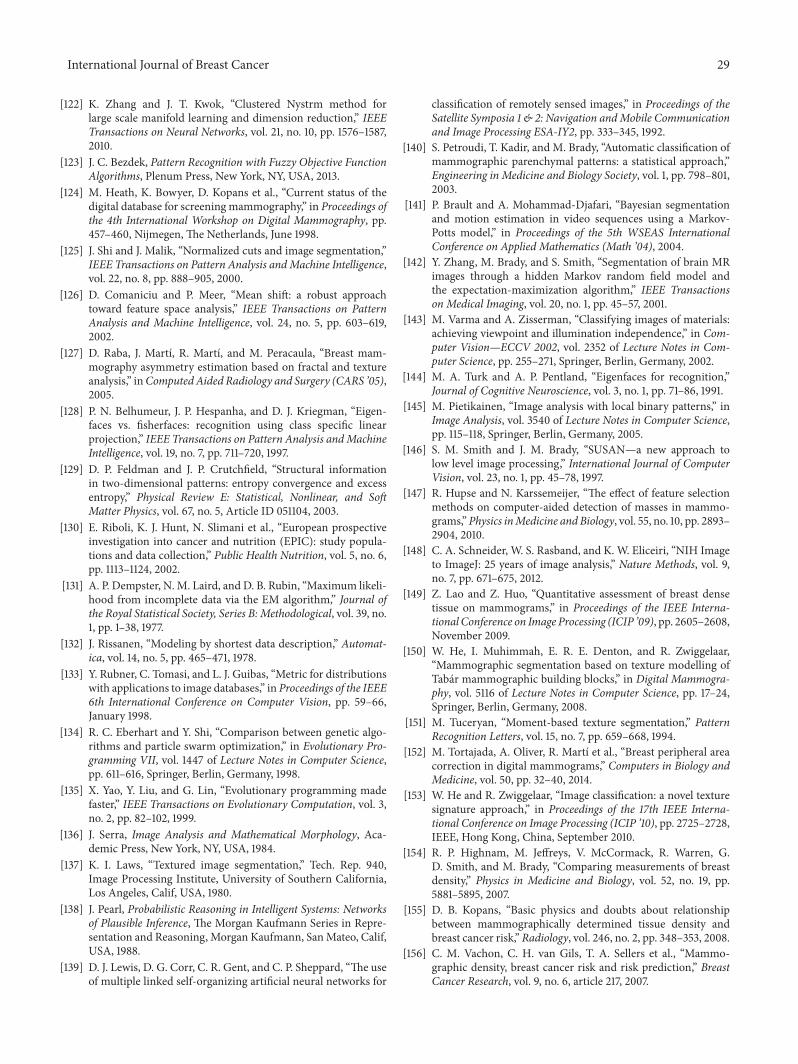
International Journal of Breast Cancer 29
[122] K. Zhang and J. T. Kwok, “Clustered Nystrm method forlarge scale manifold learning and dimension reduction,” IEEETransactions on Neural Networks, vol. 21, no. 10, pp. 1576–1587,2010.
[123] J. C. Bezdek, Pattern Recognition with Fuzzy Objective FunctionAlgorithms, Plenum Press, New York, NY, USA, 2013.
[124] M. Heath, K. Bowyer, D. Kopans et al., “Current status of thedigital database for screening mammography,” in Proceedings ofthe 4th International Workshop on Digital Mammography, pp.457–460, Nijmegen, The Netherlands, June 1998.
[125] J. Shi and J. Malik, “Normalized cuts and image segmentation,”IEEE Transactions on Pattern Analysis andMachine Intelligence,vol. 22, no. 8, pp. 888–905, 2000.
[126] D. Comaniciu and P. Meer, “Mean shift: a robust approachtoward feature space analysis,” IEEE Transactions on PatternAnalysis and Machine Intelligence, vol. 24, no. 5, pp. 603–619,2002.
[127] D. Raba, J. Martı, R. Martı, and M. Peracaula, “Breast mam-mography asymmetry estimation based on fractal and textureanalysis,” inComputed Aided Radiology and Surgery (CARS ’05),2005.
[128] P. N. Belhumeur, J. P. Hespanha, and D. J. Kriegman, “Eigen-faces vs. fisherfaces: recognition using class specific linearprojection,” IEEE Transactions on Pattern Analysis andMachineIntelligence, vol. 19, no. 7, pp. 711–720, 1997.
[129] D. P. Feldman and J. P. Crutchfield, “Structural informationin two-dimensional patterns: entropy convergence and excessentropy,” Physical Review E: Statistical, Nonlinear, and SoftMatter Physics, vol. 67, no. 5, Article ID 051104, 2003.
[130] E. Riboli, K. J. Hunt, N. Slimani et al., “European prospectiveinvestigation into cancer and nutrition (EPIC): study popula-tions and data collection,” Public Health Nutrition, vol. 5, no. 6,pp. 1113–1124, 2002.
[131] A. P. Dempster, N. M. Laird, and D. B. Rubin, “Maximum likeli-hood from incomplete data via the EM algorithm,” Journal ofthe Royal Statistical Society, Series B: Methodological, vol. 39, no.1, pp. 1–38, 1977.
[132] J. Rissanen, “Modeling by shortest data description,” Automat-ica, vol. 14, no. 5, pp. 465–471, 1978.
[133] Y. Rubner, C. Tomasi, and L. J. Guibas, “Metric for distributionswith applications to image databases,” in Proceedings of the IEEE6th International Conference on Computer Vision, pp. 59–66,January 1998.
[134] R. C. Eberhart and Y. Shi, “Comparison between genetic algo-rithms and particle swarm optimization,” in Evolutionary Pro-gramming VII, vol. 1447 of Lecture Notes in Computer Science,pp. 611–616, Springer, Berlin, Germany, 1998.
[135] X. Yao, Y. Liu, and G. Lin, “Evolutionary programming madefaster,” IEEE Transactions on Evolutionary Computation, vol. 3,no. 2, pp. 82–102, 1999.
[136] J. Serra, Image Analysis and Mathematical Morphology, Aca-demic Press, New York, NY, USA, 1984.
[137] K. I. Laws, “Textured image segmentation,” Tech. Rep. 940,Image Processing Institute, University of Southern California,Los Angeles, Calif, USA, 1980.
[138] J. Pearl, Probabilistic Reasoning in Intelligent Systems: Networksof Plausible Inference, The Morgan Kaufmann Series in Repre-sentation and Reasoning, Morgan Kaufmann, SanMateo, Calif,USA, 1988.
[139] D. J. Lewis, D. G. Corr, C. R. Gent, and C. P. Sheppard, “The useof multiple linked self-organizing artificial neural networks for
classification of remotely sensed images,” in Proceedings of theSatellite Symposia 1 & 2: Navigation andMobile Communicationand Image Processing ESA-IY2, pp. 333–345, 1992.
[140] S. Petroudi, T. Kadir, and M. Brady, “Automatic classification ofmammographic parenchymal patterns: a statistical approach,”Engineering in Medicine and Biology Society, vol. 1, pp. 798–801,2003.
[141] P. Brault and A. Mohammad-Djafari, “Bayesian segmentationand motion estimation in video sequences using a Markov-Potts model,” in Proceedings of the 5th WSEAS InternationalConference on Applied Mathematics (Math ’04), 2004.
[142] Y. Zhang, M. Brady, and S. Smith, “Segmentation of brain MRimages through a hidden Markov random field model andthe expectation-maximization algorithm,” IEEE Transactionson Medical Imaging, vol. 20, no. 1, pp. 45–57, 2001.
[143] M. Varma and A. Zisserman, “Classifying images of materials:achieving viewpoint and illumination independence,” in Com-puter Vision—ECCV 2002, vol. 2352 of Lecture Notes in Com-puter Science, pp. 255–271, Springer, Berlin, Germany, 2002.
[144] M. A. Turk and A. P. Pentland, “Eigenfaces for recognition,”Journal of Cognitive Neuroscience, vol. 3, no. 1, pp. 71–86, 1991.
[145] M. Pietikainen, “Image analysis with local binary patterns,” inImage Analysis, vol. 3540 of Lecture Notes in Computer Science,pp. 115–118, Springer, Berlin, Germany, 2005.
[146] S. M. Smith and J. M. Brady, “SUSAN—a new approach tolow level image processing,” International Journal of ComputerVision, vol. 23, no. 1, pp. 45–78, 1997.
[147] R. Hupse and N. Karssemeijer, “The effect of feature selectionmethods on computer-aided detection of masses in mammo-grams,”Physics inMedicine and Biology, vol. 55, no. 10, pp. 2893–2904, 2010.
[148] C. A. Schneider, W. S. Rasband, and K. W. Eliceiri, “NIH Imageto ImageJ: 25 years of image analysis,” Nature Methods, vol. 9,no. 7, pp. 671–675, 2012.
[149] Z. Lao and Z. Huo, “Quantitative assessment of breast densetissue on mammograms,” in Proceedings of the IEEE Interna-tional Conference on Image Processing (ICIP ’09), pp. 2605–2608,November 2009.
[150] W. He, I. Muhimmah, E. R. E. Denton, and R. Zwiggelaar,“Mammographic segmentation based on texture modelling ofTabar mammographic building blocks,” in Digital Mammogra-phy, vol. 5116 of Lecture Notes in Computer Science, pp. 17–24,Springer, Berlin, Germany, 2008.
[151] M. Tuceryan, “Moment-based texture segmentation,” PatternRecognition Letters, vol. 15, no. 7, pp. 659–668, 1994.
[152] M. Tortajada, A. Oliver, R. Martı et al., “Breast peripheral areacorrection in digital mammograms,” Computers in Biology andMedicine, vol. 50, pp. 32–40, 2014.
[153] W. He and R. Zwiggelaar, “Image classification: a novel texturesignature approach,” in Proceedings of the 17th IEEE Interna-tional Conference on Image Processing (ICIP ’10), pp. 2725–2728,IEEE, Hong Kong, China, September 2010.
[154] R. P. Highnam, M. Jeffreys, V. McCormack, R. Warren, G.D. Smith, and M. Brady, “Comparing measurements of breastdensity,” Physics in Medicine and Biology, vol. 52, no. 19, pp.5881–5895, 2007.
[155] D. B. Kopans, “Basic physics and doubts about relationshipbetween mammographically determined tissue density andbreast cancer risk,” Radiology, vol. 246, no. 2, pp. 348–353, 2008.
[156] C. M. Vachon, C. H. van Gils, T. A. Sellers et al., “Mammo-graphic density, breast cancer risk and risk prediction,” BreastCancer Research, vol. 9, no. 6, article 217, 2007.
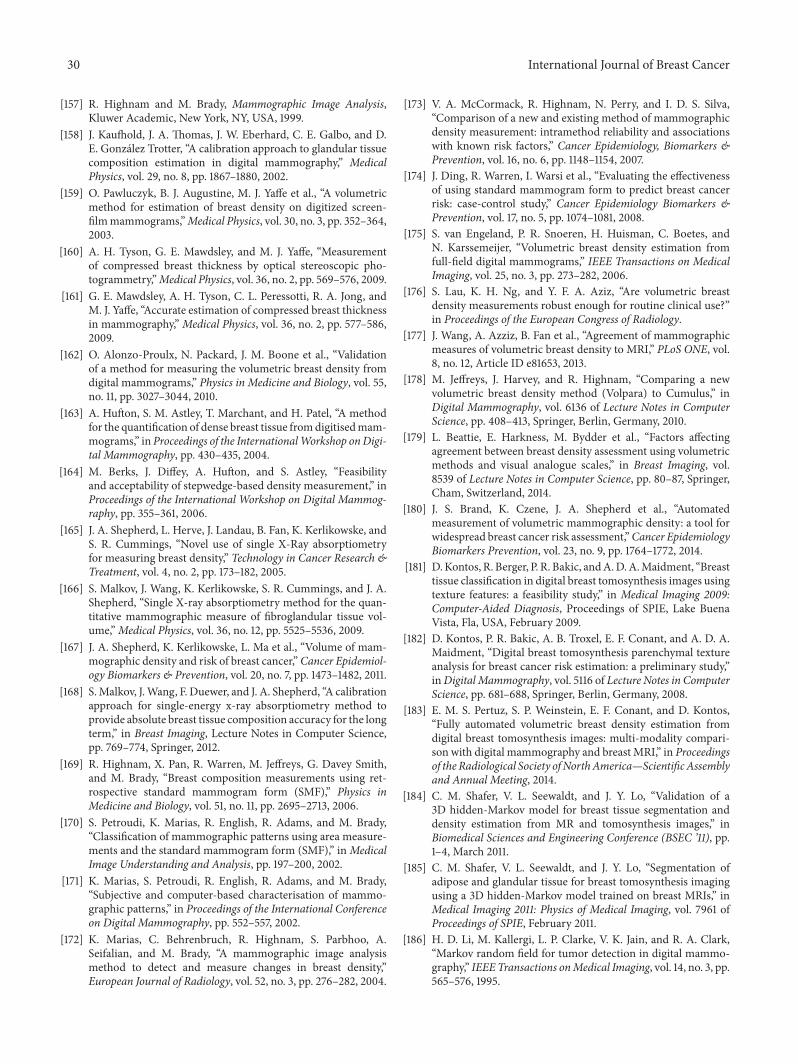
30 International Journal of Breast Cancer
[157] R. Highnam and M. Brady, Mammographic Image Analysis,Kluwer Academic, New York, NY, USA, 1999.
[158] J. Kaufhold, J. A. Thomas, J. W. Eberhard, C. E. Galbo, and D.E. Gonzalez Trotter, “A calibration approach to glandular tissuecomposition estimation in digital mammography,” MedicalPhysics, vol. 29, no. 8, pp. 1867–1880, 2002.
[159] O. Pawluczyk, B. J. Augustine, M. J. Yaffe et al., “A volumetricmethod for estimation of breast density on digitized screen-filmmammograms,”Medical Physics, vol. 30, no. 3, pp. 352–364,2003.
[160] A. H. Tyson, G. E. Mawdsley, and M. J. Yaffe, “Measurementof compressed breast thickness by optical stereoscopic pho-togrammetry,”Medical Physics, vol. 36, no. 2, pp. 569–576, 2009.
[161] G. E. Mawdsley, A. H. Tyson, C. L. Peressotti, R. A. Jong, andM. J. Yaffe, “Accurate estimation of compressed breast thicknessin mammography,”Medical Physics, vol. 36, no. 2, pp. 577–586,2009.
[162] O. Alonzo-Proulx, N. Packard, J. M. Boone et al., “Validationof a method for measuring the volumetric breast density fromdigital mammograms,” Physics in Medicine and Biology, vol. 55,no. 11, pp. 3027–3044, 2010.
[163] A. Hufton, S. M. Astley, T. Marchant, and H. Patel, “A methodfor the quantification of dense breast tissue fromdigitisedmam-mograms,” in Proceedings of the InternationalWorkshop onDigi-tal Mammography, pp. 430–435, 2004.
[164] M. Berks, J. Diffey, A. Hufton, and S. Astley, “Feasibilityand acceptability of stepwedge-based density measurement,” inProceedings of the International Workshop on Digital Mammog-raphy, pp. 355–361, 2006.
[165] J. A. Shepherd, L. Herve, J. Landau, B. Fan, K. Kerlikowske, andS. R. Cummings, “Novel use of single X-Ray absorptiometryfor measuring breast density,” Technology in Cancer Research &Treatment, vol. 4, no. 2, pp. 173–182, 2005.
[166] S. Malkov, J. Wang, K. Kerlikowske, S. R. Cummings, and J. A.Shepherd, “Single X-ray absorptiometry method for the quan-titative mammographic measure of fibroglandular tissue vol-ume,”Medical Physics, vol. 36, no. 12, pp. 5525–5536, 2009.
[167] J. A. Shepherd, K. Kerlikowske, L. Ma et al., “Volume of mam-mographic density and risk of breast cancer,” Cancer Epidemiol-ogy Biomarkers & Prevention, vol. 20, no. 7, pp. 1473–1482, 2011.
[168] S.Malkov, J.Wang, F. Duewer, and J. A. Shepherd, “A calibrationapproach for single-energy x-ray absorptiometry method toprovide absolute breast tissue composition accuracy for the longterm,” in Breast Imaging, Lecture Notes in Computer Science,pp. 769–774, Springer, 2012.
[169] R. Highnam, X. Pan, R. Warren, M. Jeffreys, G. Davey Smith,and M. Brady, “Breast composition measurements using ret-rospective standard mammogram form (SMF),” Physics inMedicine and Biology, vol. 51, no. 11, pp. 2695–2713, 2006.
[170] S. Petroudi, K. Marias, R. English, R. Adams, and M. Brady,“Classification of mammographic patterns using area measure-ments and the standard mammogram form (SMF),” inMedicalImage Understanding and Analysis, pp. 197–200, 2002.
[171] K. Marias, S. Petroudi, R. English, R. Adams, and M. Brady,“Subjective and computer-based characterisation of mammo-graphic patterns,” in Proceedings of the International Conferenceon Digital Mammography, pp. 552–557, 2002.
[172] K. Marias, C. Behrenbruch, R. Highnam, S. Parbhoo, A.Seifalian, and M. Brady, “A mammographic image analysismethod to detect and measure changes in breast density,”European Journal of Radiology, vol. 52, no. 3, pp. 276–282, 2004.
[173] V. A. McCormack, R. Highnam, N. Perry, and I. D. S. Silva,“Comparison of a new and existing method of mammographicdensity measurement: intramethod reliability and associationswith known risk factors,” Cancer Epidemiology, Biomarkers &Prevention, vol. 16, no. 6, pp. 1148–1154, 2007.
[174] J. Ding, R. Warren, I. Warsi et al., “Evaluating the effectivenessof using standard mammogram form to predict breast cancerrisk: case-control study,” Cancer Epidemiology Biomarkers &Prevention, vol. 17, no. 5, pp. 1074–1081, 2008.
[175] S. van Engeland, P. R. Snoeren, H. Huisman, C. Boetes, andN. Karssemeijer, “Volumetric breast density estimation fromfull-field digital mammograms,” IEEE Transactions on MedicalImaging, vol. 25, no. 3, pp. 273–282, 2006.
[176] S. Lau, K. H. Ng, and Y. F. A. Aziz, “Are volumetric breastdensity measurements robust enough for routine clinical use?”in Proceedings of the European Congress of Radiology.
[177] J. Wang, A. Azziz, B. Fan et al., “Agreement of mammographicmeasures of volumetric breast density to MRI,” PLoS ONE, vol.8, no. 12, Article ID e81653, 2013.
[178] M. Jeffreys, J. Harvey, and R. Highnam, “Comparing a newvolumetric breast density method (Volpara) to Cumulus,” inDigital Mammography, vol. 6136 of Lecture Notes in ComputerScience, pp. 408–413, Springer, Berlin, Germany, 2010.
[179] L. Beattie, E. Harkness, M. Bydder et al., “Factors affectingagreement between breast density assessment using volumetricmethods and visual analogue scales,” in Breast Imaging, vol.8539 of Lecture Notes in Computer Science, pp. 80–87, Springer,Cham, Switzerland, 2014.
[180] J. S. Brand, K. Czene, J. A. Shepherd et al., “Automatedmeasurement of volumetric mammographic density: a tool forwidespread breast cancer risk assessment,”Cancer EpidemiologyBiomarkers Prevention, vol. 23, no. 9, pp. 1764–1772, 2014.
[181] D.Kontos, R. Berger, P. R. Bakic, andA.D.A.Maidment, “Breasttissue classification in digital breast tomosynthesis images usingtexture features: a feasibility study,” in Medical Imaging 2009:Computer-Aided Diagnosis, Proceedings of SPIE, Lake BuenaVista, Fla, USA, February 2009.
[182] D. Kontos, P. R. Bakic, A. B. Troxel, E. F. Conant, and A. D. A.Maidment, “Digital breast tomosynthesis parenchymal textureanalysis for breast cancer risk estimation: a preliminary study,”inDigital Mammography, vol. 5116 of Lecture Notes in ComputerScience, pp. 681–688, Springer, Berlin, Germany, 2008.
[183] E. M. S. Pertuz, S. P. Weinstein, E. F. Conant, and D. Kontos,“Fully automated volumetric breast density estimation fromdigital breast tomosynthesis images: multi-modality compari-son with digital mammography and breast MRI,” in Proceedingsof the Radiological Society ofNorthAmerica—ScientificAssemblyand Annual Meeting, 2014.
[184] C. M. Shafer, V. L. Seewaldt, and J. Y. Lo, “Validation of a3D hidden-Markov model for breast tissue segmentation anddensity estimation from MR and tomosynthesis images,” inBiomedical Sciences and Engineering Conference (BSEC ’11), pp.1–4, March 2011.
[185] C. M. Shafer, V. L. Seewaldt, and J. Y. Lo, “Segmentation ofadipose and glandular tissue for breast tomosynthesis imagingusing a 3D hidden-Markov model trained on breast MRIs,” inMedical Imaging 2011: Physics of Medical Imaging, vol. 7961 ofProceedings of SPIE, February 2011.
[186] H. D. Li, M. Kallergi, L. P. Clarke, V. K. Jain, and R. A. Clark,“Markov random field for tumor detection in digital mammo-graphy,” IEEETransactions onMedical Imaging, vol. 14, no. 3, pp.565–576, 1995.
International Journal of Breast Cancer 31
[187] J. A. Harvey and V. E. Bovbjerg, “Quantitative assessment ofmammographic breast density: relationship with breast cancerrisk,” Radiology, vol. 230, no. 1, pp. 29–41, 2004.
[188] I. C. Moreira, I. Amaral, I. Domingues, A. Cardoso, M. J.Cardoso, and J. S. Cardoso, “INbreast: toward a full-field digitalmammographic database,” Academic Radiology, vol. 19, no. 2,pp. 236–248, 2012.
[189] W. He, E. R. E. Denton, and R. Zwiggelaar, “A study on mam-mographic image modelling and classification using multipledatabases,” in Breast Imaging, vol. 8539 of Lecture Notes inComputer Science, pp. 696–701, Springer, 2014.
[190] H. F. Boehm, T. Schneider, S. M. Buhmann-Kirchhoff et al.,“Automated classification of breast parenchymal density: topo-logic analysis of X-ray attenuation patterns depicted with digitalmammography,” American Journal of Roentgenology, vol. 191,no. 6, pp. W275–W282, 2008.
[191] R. T. Chlebowski, L. H. Kuller, R. L. Prentice et al., “Breastcancer after use of estrogen plus progestin in postmenopausalwomen,” The New England Journal of Medicine, vol. 360, no. 6,pp. 573–587, 2009.
[192] C. M. Vachon, V. S. Pankratz, C. G. Scott et al., “Longitudinaltrends in mammographic percent density and breast cancerrisk,” Cancer Epidemiology Biomarkers and Prevention, vol. 16,no. 5, pp. 921–928, 2007.
[193] N. F. Boyd, L. J. Martin, Q. Li et al., “Mammographic density asa surrogate marker for the effects of hormone therapy on risk ofbreast cancer,” Cancer Epidemiology Biomarkers & Prevention,vol. 15, no. 5, pp. 961–966, 2006.
[194] B. Threatt, J. M. Norbeck, N. S. Ullman, R. Kummer, andP. Roselle, “Association between mammographic parenchymalpattern classification and incidence of breast cancer,” Cancer,vol. 45, no. 10, pp. 2550–2556, 1980.
[195] D. B. Thomas, R. A. Carter, W. H. Bush Jr. et al., “Risk ofsubsequent breast cancer in relation to characteristics of screen-ing mammograms from women less than 50 years of age,” Can-cer Epidemiology Biomarkers & Prevention, vol. 11, no. 6, pp.565–571, 2002.
[196] A. Manduca, M. J. Carston, J. J. Heine et al., “Texture featuresfrom mammographic images and risk of breast cancer,” CancerEpidemiology, Biomarkers & Prevention, vol. 18, no. 3, pp. 837–845, 2009.
[197] J. Couzin, “Dissecting a hidden breast cancer risk,” Science, vol.309, no. 5741, pp. 1664–1666, 2005.
[198] G. Torres-Mejıa, B. de Stavola, D. S. Allen et al., “Mam-mographic features and subsequent risk of breast cancer: acomparison of qualitative and quantitative evaluations in theguernsey prospective studies,” Cancer Epidemiology Biomarkers& Prevention, vol. 14, no. 5, pp. 1052–1059, 2005.
[199] H. Li, M. L. Giger, O. I. Olopade, and L. Lan, “Fractal analysisof mammographic parenchymal patterns in breast cancer riskassessment,” Academic Radiology, vol. 14, no. 5, pp. 513–521,2007.
[200] B. T. Nicholson, A. P. LoRusso, M. Smolkin, V. E. Bovbjerg, G.R. Petroni, and J. A. Harvey, “Accuracy of Assigned BI-RADSBreast Density Category Definitions,” Academic Radiology, vol.13, no. 9, pp. 1143–1149, 2006.

Submit your manuscripts athttp://www.hindawi.com
Stem CellsInternational
Hindawi Publishing Corporationhttp://www.hindawi.com Volume 2014
Hindawi Publishing Corporationhttp://www.hindawi.com Volume 2014
MEDIATORSINFLAMMATION
of
Hindawi Publishing Corporationhttp://www.hindawi.com Volume 2014
Behavioural Neurology
EndocrinologyInternational Journal of
Hindawi Publishing Corporationhttp://www.hindawi.com Volume 2014
Hindawi Publishing Corporationhttp://www.hindawi.com Volume 2014
Disease Markers
Hindawi Publishing Corporationhttp://www.hindawi.com Volume 2014
BioMed Research International
OncologyJournal of
Hindawi Publishing Corporationhttp://www.hindawi.com Volume 2014
Hindawi Publishing Corporationhttp://www.hindawi.com Volume 2014
Oxidative Medicine and Cellular Longevity
Hindawi Publishing Corporationhttp://www.hindawi.com Volume 2014
PPAR Research
The Scientific World JournalHindawi Publishing Corporation http://www.hindawi.com Volume 2014
Immunology ResearchHindawi Publishing Corporationhttp://www.hindawi.com Volume 2014
Journal of
ObesityJournal of
Hindawi Publishing Corporationhttp://www.hindawi.com Volume 2014
Hindawi Publishing Corporationhttp://www.hindawi.com Volume 2014
Computational and Mathematical Methods in Medicine
OphthalmologyJournal of
Hindawi Publishing Corporationhttp://www.hindawi.com Volume 2014
Diabetes ResearchJournal of
Hindawi Publishing Corporationhttp://www.hindawi.com Volume 2014
Hindawi Publishing Corporationhttp://www.hindawi.com Volume 2014
Research and TreatmentAIDS
Hindawi Publishing Corporationhttp://www.hindawi.com Volume 2014
Gastroenterology Research and Practice
Hindawi Publishing Corporationhttp://www.hindawi.com Volume 2014
Parkinson’s Disease
Evidence-Based Complementary and Alternative Medicine
Volume 2014Hindawi Publishing Corporationhttp://www.hindawi.com