Embed Size (px)
Citation preview
Reverse-Phase Protein Microarrays:Biomarker Validation and Discovery
Mark Basik MDAdriana Aguilar PhD, André Nantel PhD, Maureen O’Connor PhD, Christiane Cantin
PhD, Jean Sebastien Denault PhD
Segal Cancer CenterMcGill University
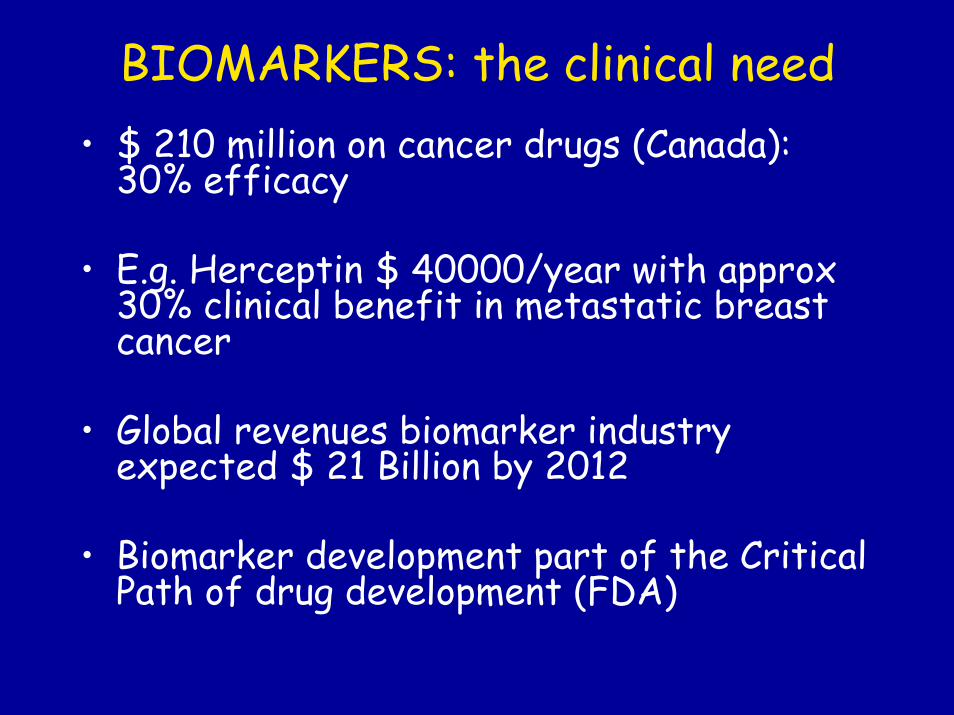
BIOMARKERS: the clinical need• $ 210 million on cancer drugs (Canada):
30% efficacy
• E.g. Herceptin $ 40000/year with approx 30% clinical benefit in metastatic breast cancer
• Global revenues biomarker industry expected $ 21 Billion by 2012
• Biomarker development part of the Critical Path of drug development (FDA)
GENOMICS TO THE CLINIC
• Multiple “secreted” markers
• High-throughput screening of diagnostic potential missing!

BLOOD BIOMARKERS• Accessible
• Patients very willing to undergo blood test: least invasive procedure
• Proven biomarkers (CEA, PSA) that anticipate disease recurrence in cancers
• Host-factor: e.g. SDF-1 in breast cancer
• Endothelial bathes pathological tissues
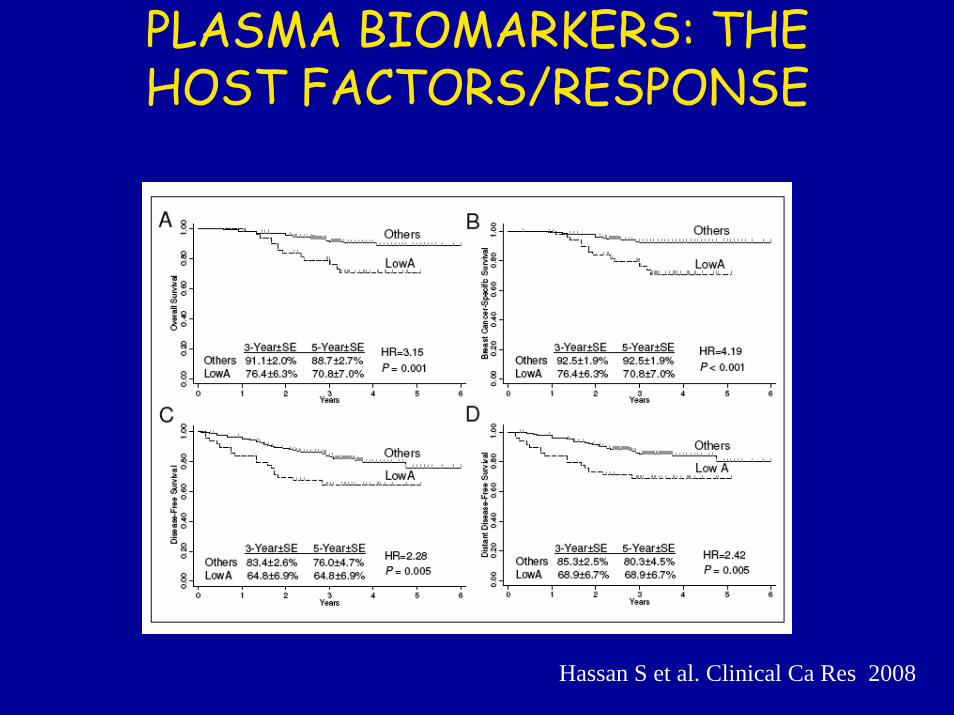
PLASMA BIOMARKERS: THE HOST FACTORS/RESPONSE
Hassan S et al. Clinical Ca Res 2008

PROTEOMICS AND BIOMARKERS
• POST-TRANSLATIONAL MODIFICATIONS• UNBIASED• CLINICALLY VALIDATED?
0

WHY?
• DISCOVERY: Dynamic range and high abundance proteins
• VALIDATION: The bottleneck
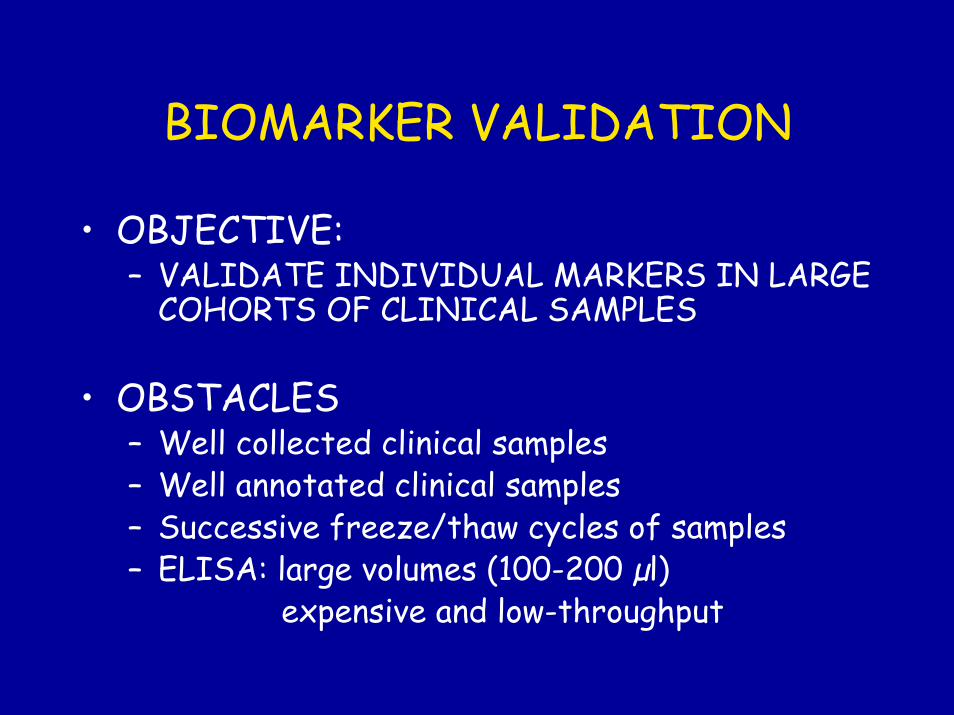
BIOMARKER VALIDATION
• OBJECTIVE:– VALIDATE INDIVIDUAL MARKERS IN LARGE
COHORTS OF CLINICAL SAMPLES
• OBSTACLES– Well collected clinical samples– Well annotated clinical samples– Successive freeze/thaw cycles of samples – ELISA: large volumes (100-200 µl)
expensive and low-throughput
SOLUTIONS
• High-throughput validation
– Bead platform
– Microfluidics
– Microarray• Uniformity• Enhanced sample accessibility
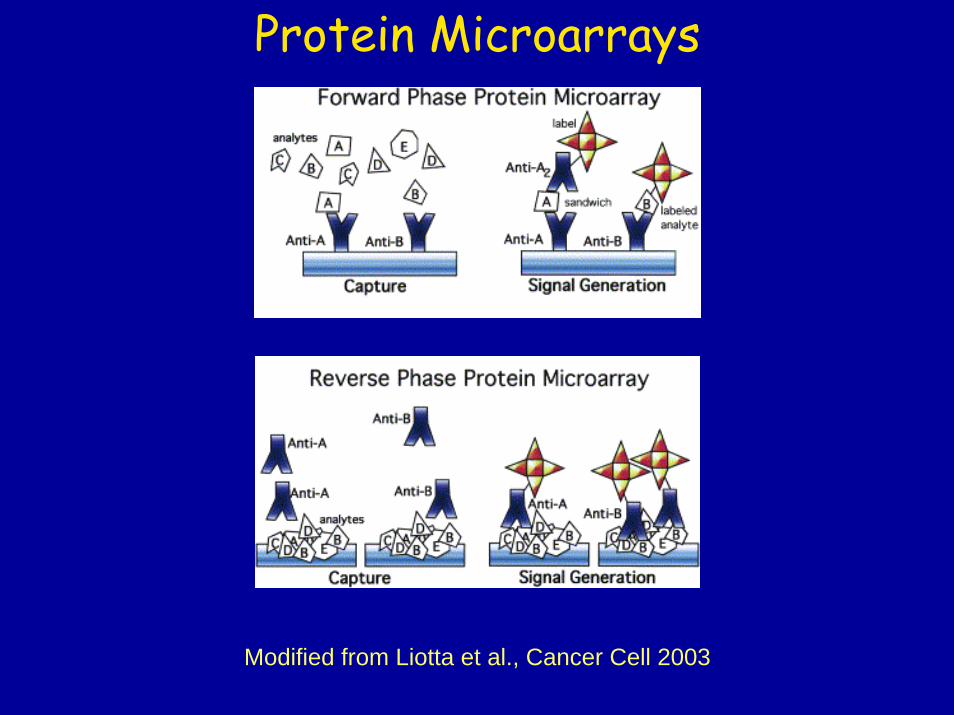
Protein Microarrays
Modified from Liotta et al., Cancer Cell 2003
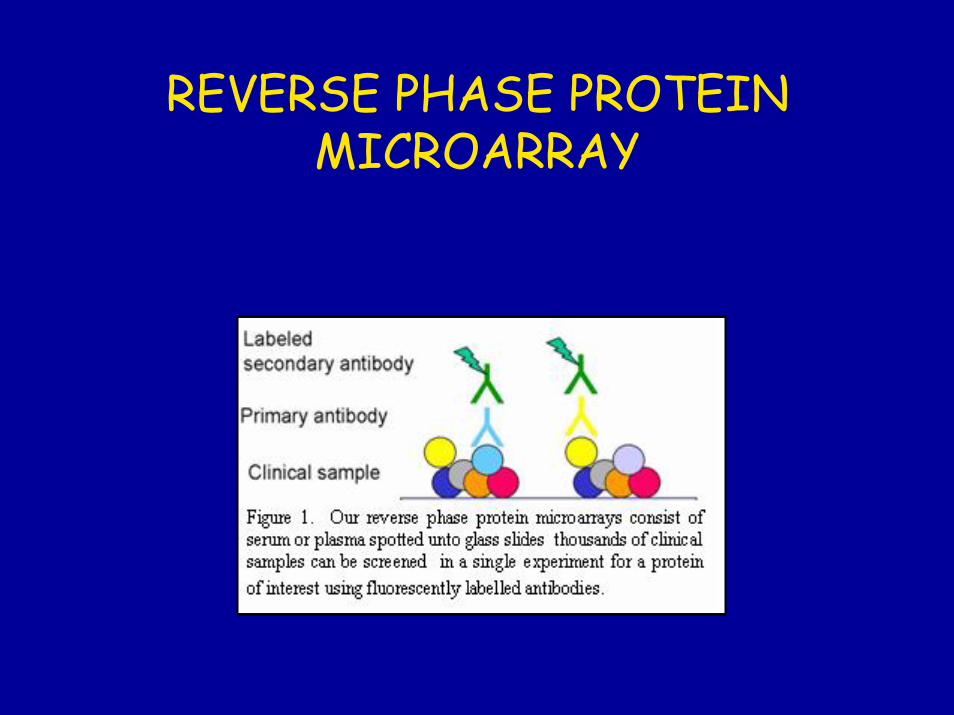
REVERSE PHASE PROTEIN MICROARRAY
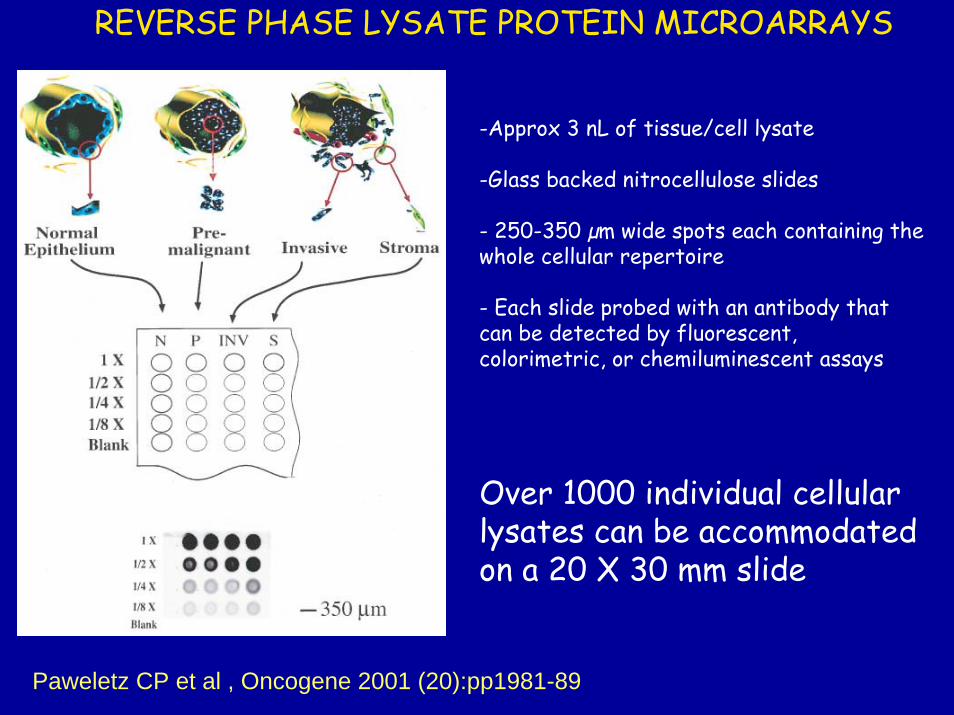
-Approx 3 nL of tissue/cell lysate
-Glass backed nitrocellulose slides
- 250-350 µm wide spots each containing the whole cellular repertoire
- Each slide probed with an antibody that can be detected by fluorescent, colorimetric, or chemiluminescent assays
Over 1000 individual cellular lysates can be accommodated on a 20 X 30 mm slide
Paweletz CP et al , Oncogene 2001 (20):pp1981-89
REVERSE PHASE LYSATE PROTEIN MICROARRAYS
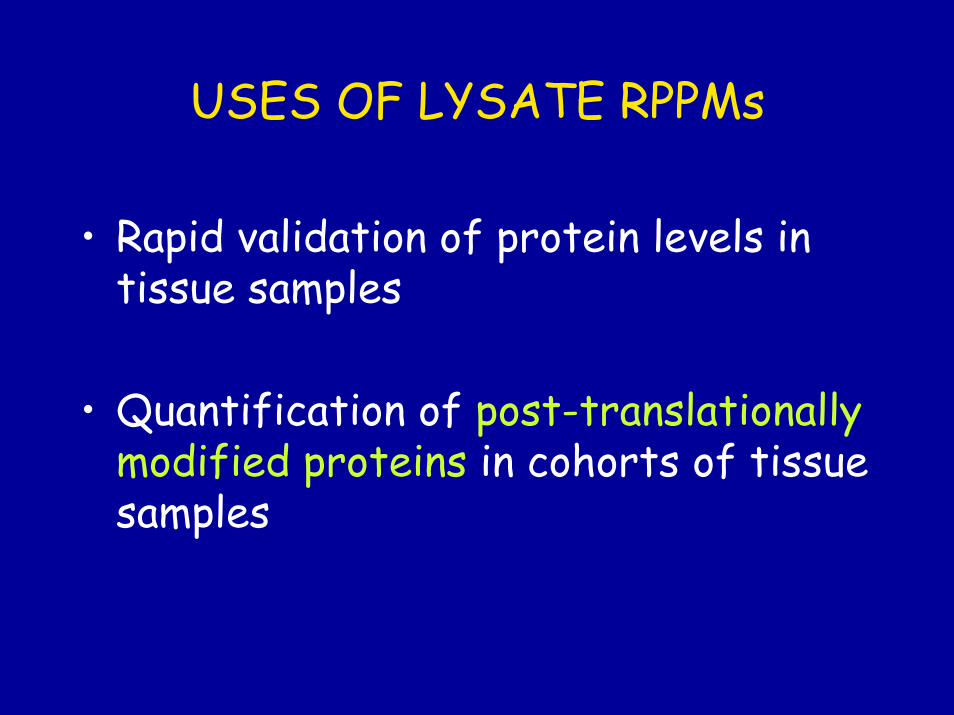
USES OF LYSATE RPPMs
• Rapid validation of protein levels in tissue samples
• Quantification of post-translationally modified proteins in cohorts of tissue samples

PHOSPHO-PROTEIN PROFILING
• A map of known cell signaling networks or pathways for an individual patient
• Allows comparison across patients in a cohort
• Availability of reliable phospho-antibodies
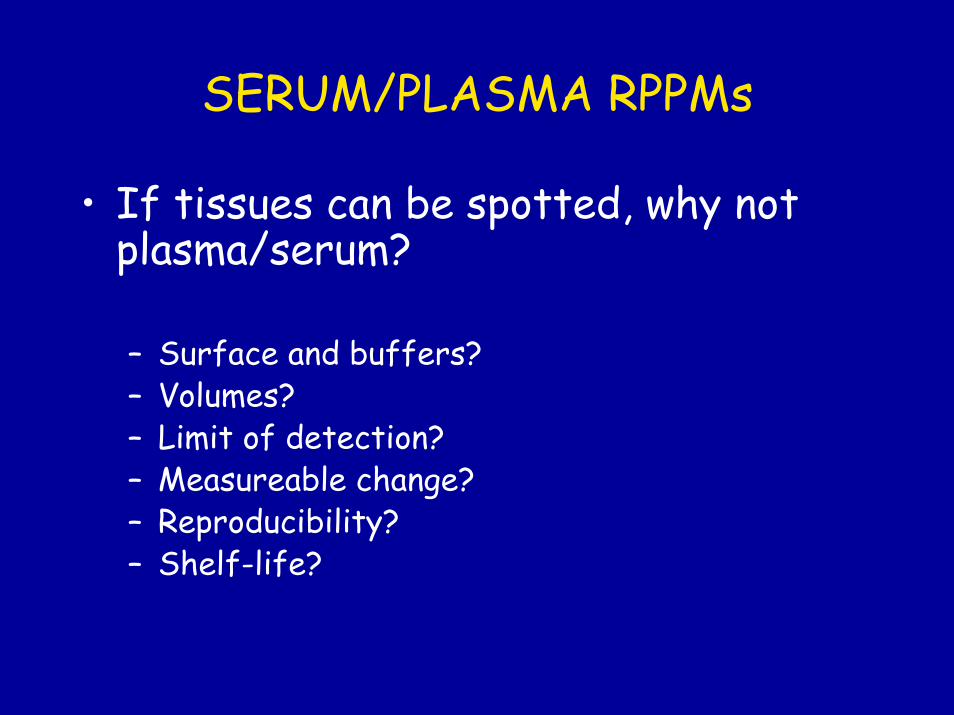
SERUM/PLASMA RPPMs
• If tissues can be spotted, why not plasma/serum?
– Surface and buffers?– Volumes?– Limit of detection?– Measureable change?– Reproducibility?– Shelf-life?
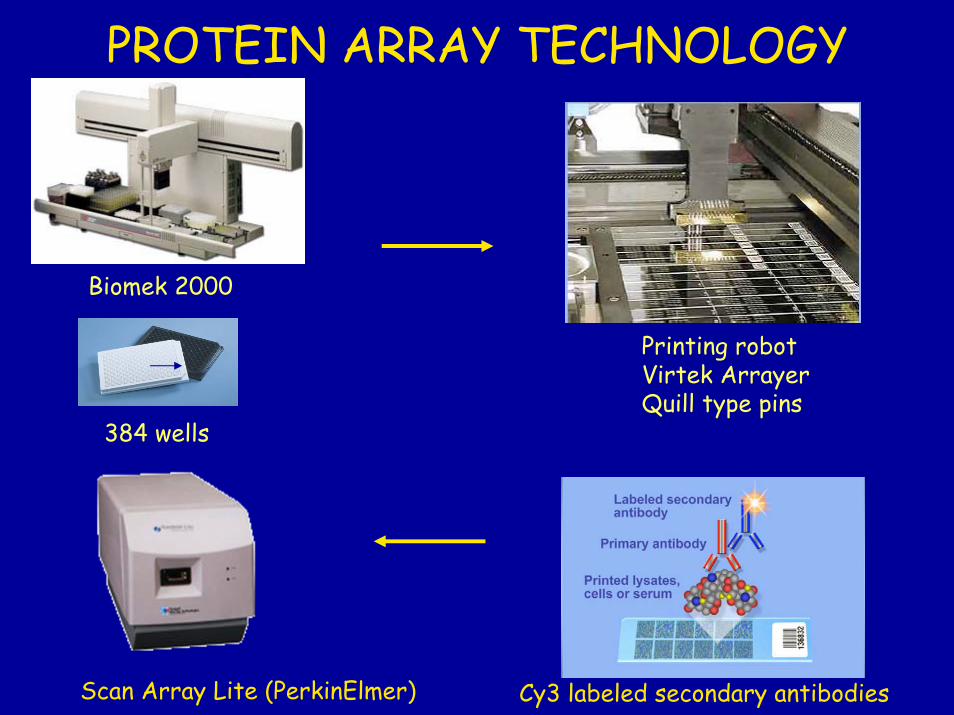
PROTEIN ARRAY TECHNOLOGY
Biomek 2000
Printing robotVirtek ArrayerQuill type pins
384 wells
Scan Array Lite (PerkinElmer) Cy3 labeled secondary antibodies
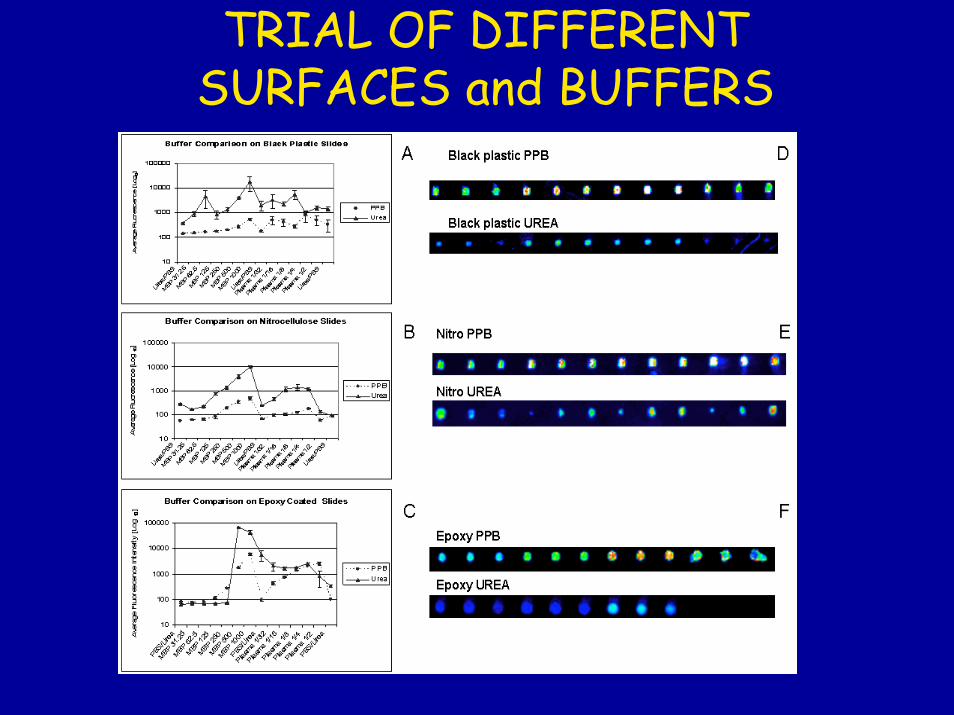
TRIAL OF DIFFERENT SURFACES and BUFFERS
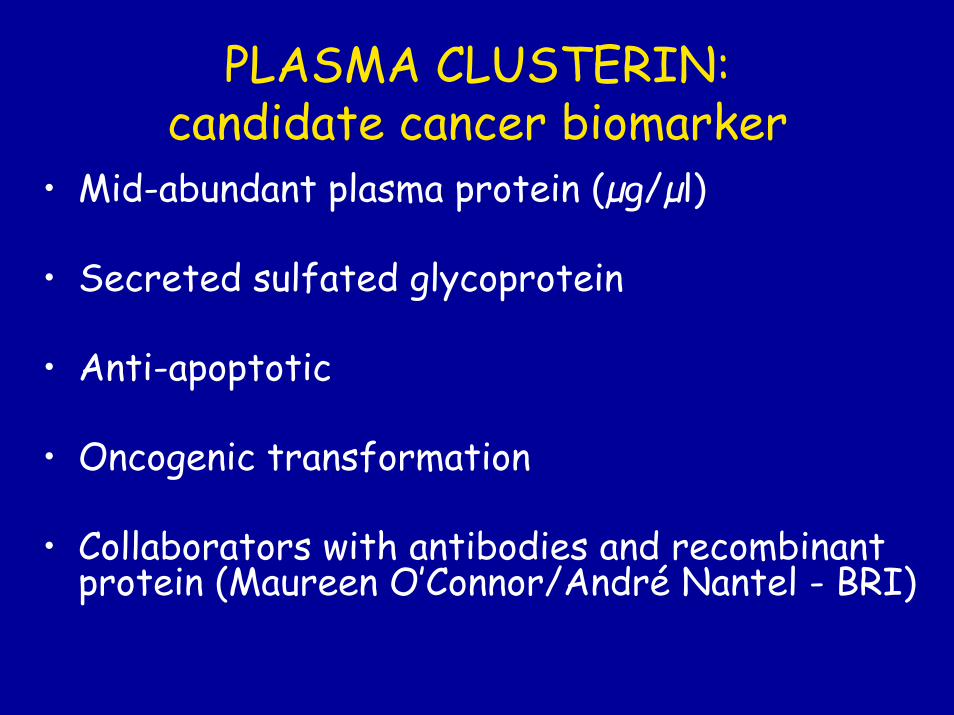
PLASMA CLUSTERIN: candidate cancer biomarker
• Mid-abundant plasma protein (µg/µl)
• Secreted sulfated glycoprotein
• Anti-apoptotic
• Oncogenic transformation
• Collaborators with antibodies and recombinant protein (Maureen O’Connor/André Nantel - BRI)
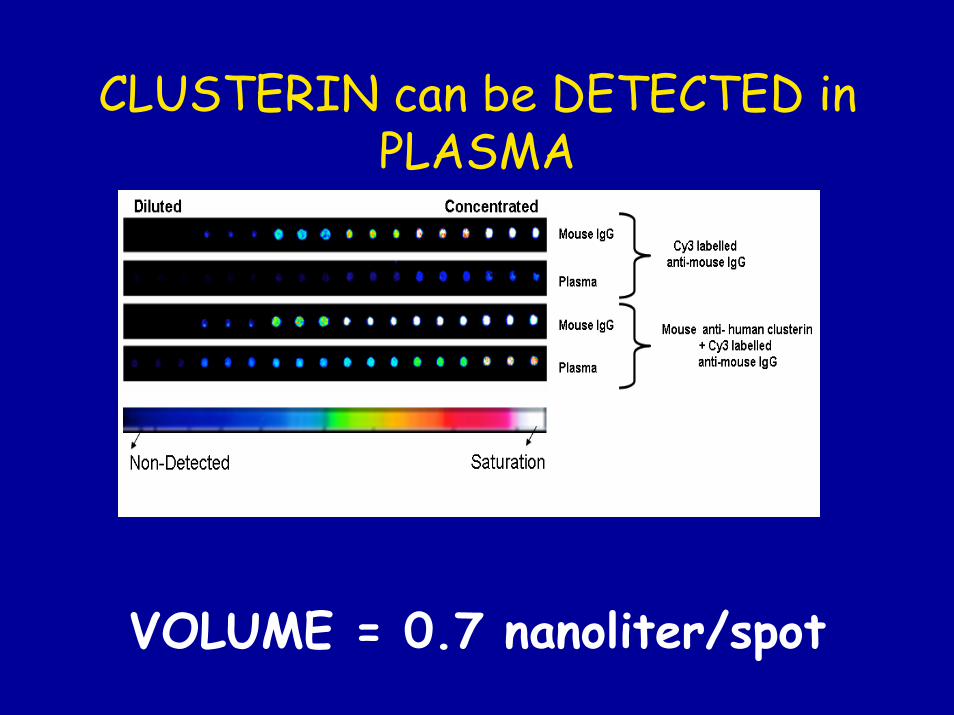
CLUSTERIN can be DETECTED in PLASMA
VOLUME = 0.7 nanoliter/spot
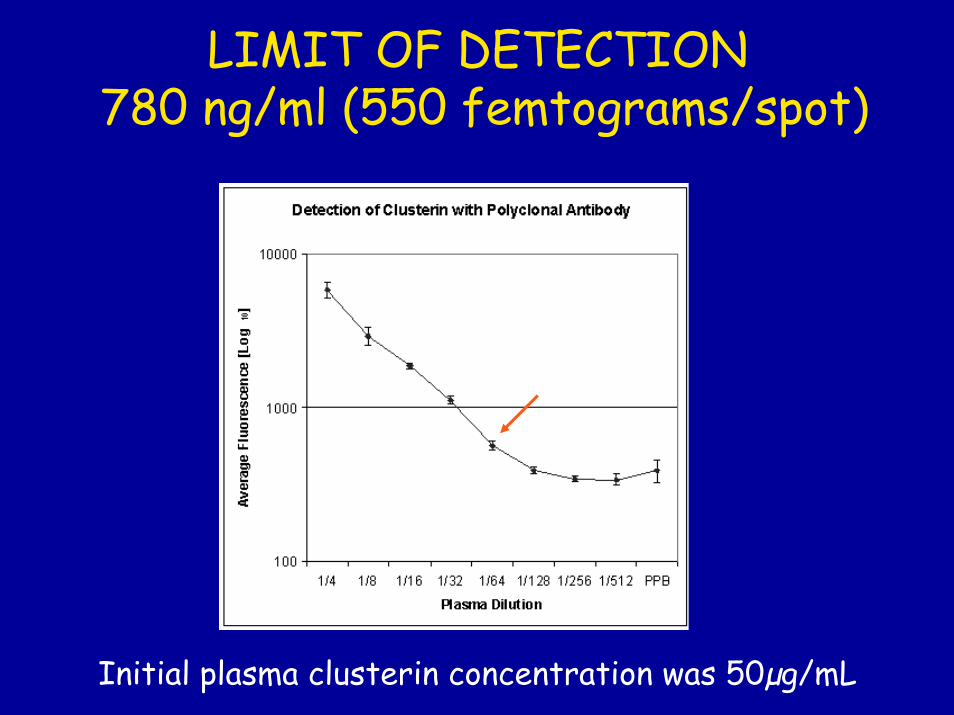
LIMIT OF DETECTION 780 ng/ml (550 femtograms/spot)
Initial plasma clusterin concentration was 50µg/mL
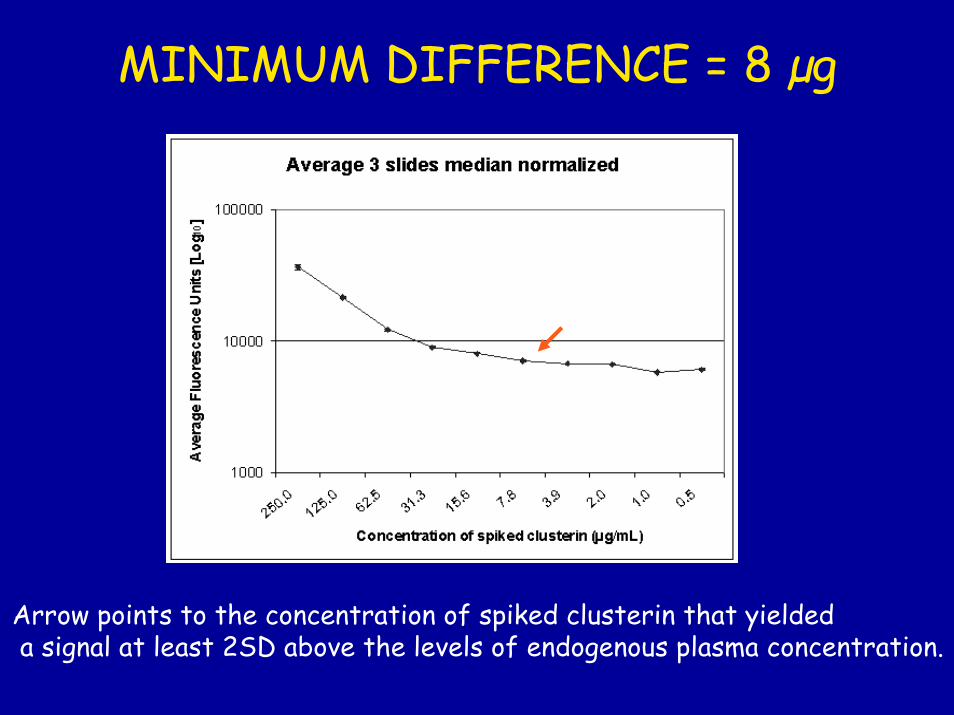
MINIMUM DIFFERENCE = 8 µg
Arrow points to the concentration of spiked clusterin that yieldeda signal at least 2SD above the levels of endogenous plasma concentration.

CORRELATION OF RPPM WITH ELISA (spiked clusterin)
Correlation ELISA vs RPPM
0
100
200
300
400
500
600
700
800
900
10000 30000 50000 70000 90000 110000
Fluorescence
ELIS
A k
U/m
L
r=0.98

RPPM PLATFORM is HIGHLY REPRODUCIBLE
• Spot to spot variability: Average %CV was 5%
• Array to array variability:Average %CV was 2.2% followingnormalization
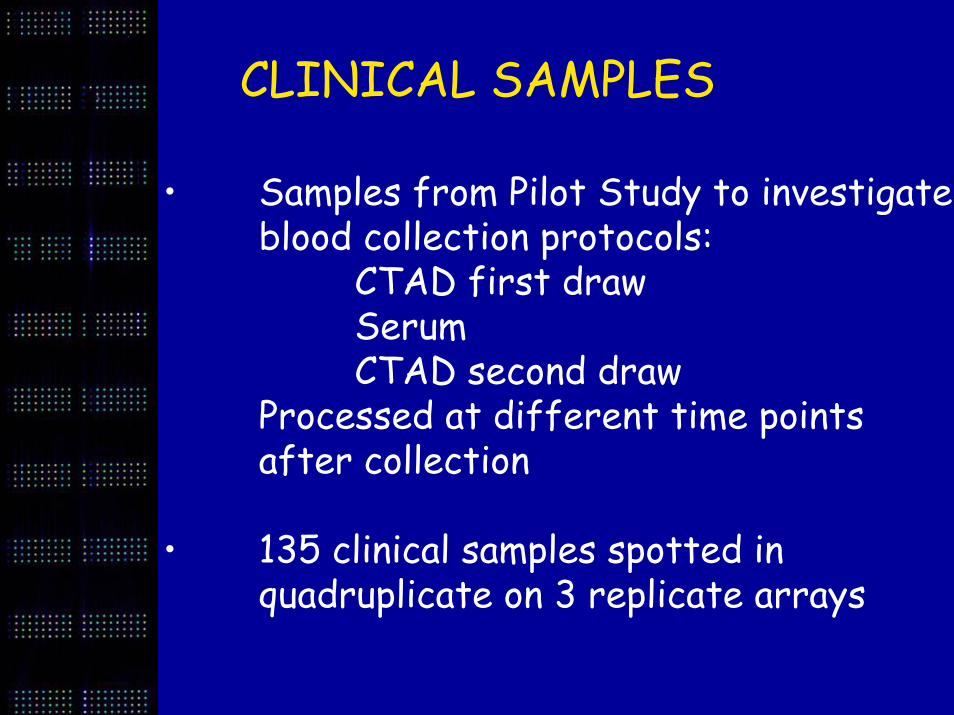
CLINICAL SAMPLES
• Samples from Pilot Study to investigate blood collection protocols:
CTAD first drawSerumCTAD second draw
Processed at different time points after collection
• 135 clinical samples spotted in quadruplicate on 3 replicate arrays
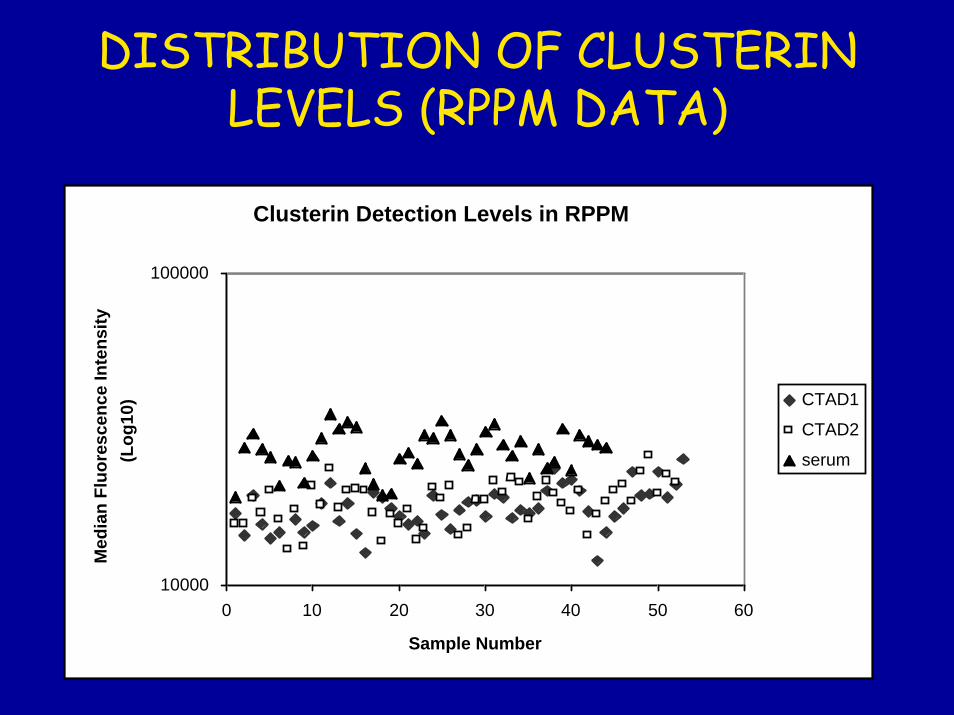
Clusterin Detection Levels in RPPM
10000
100000
0 10 20 30 40 50 60
Sample Number
Med
ian
Fluo
resc
ence
Inte
nsity
(L
og10
) CTAD1
CTAD2
serum
DISTRIBUTION OF CLUSTERIN LEVELS (RPPM DATA)
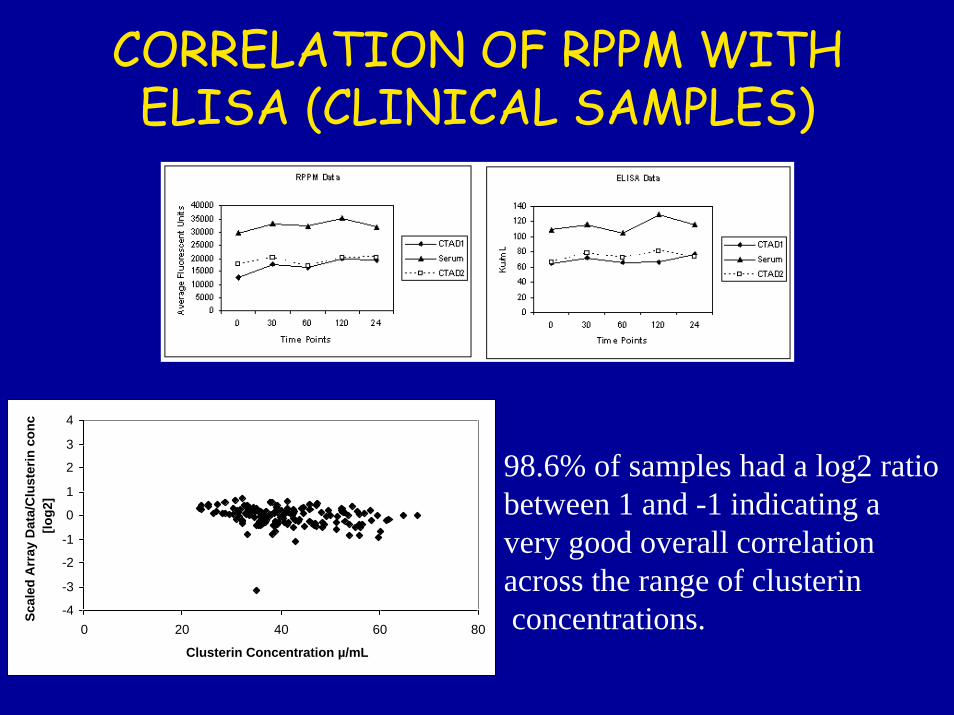
CORRELATION OF RPPM WITH ELISA (CLINICAL SAMPLES)
-4
-3
-2
-1
0
1
2
3
4
0 20 40 60 80
Clusterin Concentration µ/mL
Scal
ed A
rray
Dat
a/C
lust
erin
con
c [lo
g2]
98.6% of samples had a log2 ratio between 1 and -1 indicating a very good overall correlation across the range of clusterinconcentrations.
CONCLUSION
• Serum/Plasma RPPM feasible and reproducible
• LOD ng/ml (780 ng/ml)
• Medium abundance proteins
LIMITATIONS OF SERUM/PLASMA RPPMs
• Not a sandwich technique (only one antibody): – requires much greater specificity of
antibodies– AND greater sensitivity
FUTURE DIRECTIONS
• Increase sensitivity of detection
– Planar wage guide technology
– DNA/antibody conjugates

THE RPPM PLATFORM
• Genome Quebec Technology Consortium awarded Oct 2004– Batist, Schipper, Beliveau, Desrosiers, Gotlieb,
O’Connor, Nantel
• Platform for larger projects, clinical trials
• Service to research community and to pharmaceutical industry

THANKS
• Adriana Aguilar
• Min Wu• Marie Claude Huneau
BRI:• Maureen O’Connor• André Nantel• Christiane Cantin• Jean Sebastien
Déneault