Embed Size (px)
Citation preview

COPYRIGHT AND CITATION CONSIDERATIONS FOR THIS THESIS/ DISSERTATION
o Attribution — You must give appropriate credit, provide a link to the license, and indicate ifchanges were made. You may do so in any reasonable manner, but not in any way thatsuggests the licensor endorses you or your use.
o NonCommercial — You may not use the material for commercial purposes.
o ShareAlike — If you remix, transform, or build upon the material, you must distribute yourcontributions under the same license as the original.
How to cite this thesis
Surname, Initial(s). (2012) Title of the thesis or dissertation. PhD. (Chemistry)/ M.Sc. (Physics)/ M.A. (Philosophy)/M.Com. (Finance) etc. [Unpublished]: University of Johannesburg. Retrieved from: https://ujcontent.uj.ac.za/vital/access/manager/Index?site_name=Research%20Output (Accessed: Date).
Recovery of hematite from fluorspar
tailings using reverse cationic flotation
By
Thembelihle Portia Lubisi
A Master’s Research dissertation submitted in fulfilment of the
requirements for the degree of Magister technologiae
in
Chemical Engineering
in the
Faculty of Engineering and the Built Environment
at the
UNIVERSITY OF JOHANNESBURG
SUPERVISOR: Dr Willie Nheta
CO-SUPERVISOR: Prof Freeman Ntuli
22 February 2017

i
Dedication
This thesis is dedicated to my loving husband. I am grateful for his support throughout the
project. I thank him for his continuous understanding and listening to me on my frustration
days, my overenthusiastic days and everything in between. I thank my helper for taking care
of my children when I came home late and exhausted. I thank my sister for her continuous
encouragement, ensuring I don’t quit.
ii
Declaration
I, THEMBELIHLE PORTIA LUBISI hereby declare that this master’s research dissertation is
wholly my own work and has not been submitted anywhere else for academic credit either by
myself or another person. I understand what plagiarism implies and declare that this proposal
is my own ideas, words, phrase, arguments, graphics, figures, results and organisation except
where reference is explicitly made to other authors’ work. I understand further that any
unethical academic behaviour, which includes plagiarism, is seen in a serious light by the
University of Johannesburg and is punishable by disciplinary action.
Signed………………...... Date: 22 February 2017

iii
Acknowledgements
I am grateful and wish to acknowledge the following persons for their contributions towards
the successful completion of this research work:
Doctor W. Nheta of Metallurgy Department (University of JHB)
I thank my project supervisor for giving me an opportunity to embark on a project that is outside
my Chemical Engineering field. I am grateful for his continuous encouragement, guidance,
good supervisory skills, his timely feedbacks, his open door policy and his interest on my
progress. He fast tracked my familiarity with the topic by sharing with me his in depth
knowledge of the research area, ensured I got all I needed for the project and pushed me in
times when I slacked.
Prof F. Ntuli of Chemical Engineering (University of JHB)
I thank my co-supervisor for referring me to Dr Nheta. He has also ensured I had all I needed
for the success of the project, including arranging office space. I thank his commitment to the
project and his interest in my timely completion of the degree.
Mineral Processing laboratory staff
I would like to thank the staff of mineral processing laboratory for providing me with required
PPE during the test work, teaching me how to use laboratory equipment at University of
Johannesburg, bearing with my highly staining red sample during lengthy period of
experiments and their kindness. I thank Mr Abram for his understanding and his stories made
laboratory a good place to visit. I thank Ms Mapilane for the ladies talks we shared, it
brightened heavy days.
Analytical laboratory staff
I would like to thank the lab technician, Mr Edward Malenga for his timely testing of samples.
I thank him for the “un-official” brainstorming sessions that he has allowed me to have with
him. His support is greatly appreciated - God bless him. I would also like to thank the lab
technician, Mrs Nomsa Baloyi for the advices she gave. Her commitment to assisting students
and her friendliness was uplifting.

iv
Project sponsors
I thank CSIR for giving me a scholarship and Department of Higher Education and Training
for funding the project. I thank University of JHB for purchasing of consumables and
equipment required for timely completion of my project.
Suppliers
I thank Betachem Company for kindly supplying reagents (Betacol 373, Betachem 30D and
Dow 200 frother) and Vergenoeg Mine for kindly supplying me with the sample.
v
Publications
Papers published and submitted on the contents of this dissertation are as follows:
Status Title Published in;
Published Beneficiation of hematite from fluorspar
tailings by reverse flotation
Proceedings of the World
Congress on Mechanical,
Chemical and Materia
Engineering, 2015
Published Physical, chemical and mineralogical
characterization of fluorspar flotation
tailings
Proceedings of Materials,
Minerals and Energy, 2016
Published Effect of different binders on
mechanical properties of iron flotation
concentrates briquettes.
Proceedings of Materials,
Minerals and Energy, 2016
Submitted Optimization of reverse cationic
flotation of low grade oxide from
fluorspar tails using Taguchi method.
Arabian Journal for Science and
Engineering
vi
Abstract
The exploration of fluorspar ore in mining results in large amount of unrecovered valuable
products found associated with fluorspar in the ore, representing 60% of the run of mine.
Several million tons of valuable minerals are discarded every year into tailings ponds, incurring
disposal costs, loss of potential company revenue and environmental pollution. This study was
undertaken to identify the valuable mineral in the fluorspar tails with an aim of recovering such
minerals, thus contributing to an ongoing treatment of waste minerals.
A representative sample was received from Vergenoeg Mine, South Africa, in 2014.
Characterisation of the sample was conducted to determine physical, chemical and
mineralogical properties. Particle size distribution analysis using Micratrac Particle Size
Analyser showed that the sample was of fine texture, with 80% passing 120µm. Chemical
analysis using X-ray fluorescent spectrometer (XRF) showed that the major element was Fe
assaying 48.9%Fe. Major gangue minerals were SiO2 (16.8%) and minor presence of CaO
(3.8%) and F (2.25%) while all other components were reported at <1%. The metal distribution
showed that iron was concentrating in the finer size range with 33.59%Fe reported in the
+150µm and 52.09%Fe in the <38µm size fraction. The mineral phase test using X-ray powder
diffraction (XRD) showed that iron was abundantly (>50%) found in the form of hematite
while minor presence (3-10%) of iron in a form of goethite and magnetite was observed. The
Quantitative evaluation of minerals by scanning electron microscopy (QEMSCAN) results
showed that the largest portion of iron oxides (12.04wt%) occurred between the 40-50µm
particle size range and the majority of Fe-oxide in the sample occurred between 10-70µm size
range. Mineral liberation analysis showed that 81% of the iron oxide is liberated, while 16%
and 3% were middling and locked Fe-oxide respectively. The locked particles were found to
be in the <20µm size range. From the characterization results the sample was classed as low
grade iron oxide and reverse cationic flotation was selected as the best concentration method.
This study used reverse cationic flotation to concentrate the iron, whereby two types of
depressants and amine collectors were studied. The objective was to concentrate the low grade
iron into quality standards required for blast furnace feed; ≥63%Fe, alumina to silica ratio of
≤1% with alumina <2%. The collectors investigated were the primary mono-amine
(Dodecylamine) and tertiary amine (Betacol 373). The investigated depressants were soluble
starch and a dextrin (Betachem 30D). The flotation parameters investigated were collector
dosage, depressant dosage, pH, solids content, conditioning time, agitation speed, air rate and
vii
effect of de-sliming. The Taguchi design of experiments was used to statistically provide a
predictive knowledge of this complex and multi-variable process using few trials since the
experiments would be lengthy if all possible combinations were to be considered. A
combination of L25, L16 and L9 orthogonal array matrices were used depending on the number
of parameters and levels investigated. The analysis of data was done using the Signal to Noise
ratio and ANOVA. The SN ration was used to determine optimum conditions and analyse the
relative significance of parameters studied. Analysis of data using ANOVA was done to
identify and quantify the errors resulting from deviations of a set of results. The ranking of
parameters using Signal to Noise ratio indicated that pH is the most significant parameter in
achieving higher Fe grade. Depressant dosage and collector dosage were also important control
factors in the flotation performance.
Flotation kinetics was conducted, using the optimum condition predicted by Taguchi, to
compare the performance of depressants where DDA was used as the collector. The results
showed that though both type of depressants were good for iron oxide, soluble starch gave
superior results. However due to high cost of soluble starch, Betachem 30D was the preferred
depressant. The optimum conditions for the selected Betachem 30D – DDA system used the
optimum conditions; pH 10, Betachem 30D dosage of 500g/t, DDA dosage of 500g/t, solids
content of 50%, conditioning time of 6 minutes, agitation speed of 1300rpm and air rate of
valve ¾ open. Flotation using Betachem 30D – DDA yielded 60.41%Fe, hence removal of
slimes was conducted with an aim to reduce possible metal loss as a result of slime coating;
reagent consumption and sludge formation.
Notably, the removal of slimes resulted in 13% metal loss. Reduction in collector consumption
was observed since the process was able to achieve a 62.62%Fe using 300g/t DDA, when
compared to the 60.41%Fe achieved using 500g/t on feed with slimes. The highest 63.84%Fe
grade at 75.16% recovery was achieved at 500g/t, when de-slimed feed was used. However,
coupling the 24.84% metal loss during flotation and the 13% loss due to action of slime
removal, the high metal loss in de-slimed feed made this process not beneficial. Conditioning
time of the un-de-slimed feed was then increased from 6 minutes to 15 minutes and flotation
conducted on the Betachem 30D – DDA, using the selected optimum conditions. The results
showed a 63.79%Fe at 70.78% recovery, which was well in the required concentrate quality.
The Al2O3 content was at 0.87% and SiO2 at 3.8%.

viii
The trial of Betachem 30D - Betacol 373 system showed that the optimum conditions for this
system were at 3328g/t collector dosage, 500g/t Betachem 30D dosage, pH 10, 35% solids
content, ¾ air valve opening, 1300rpm agitation speed and 15 minutes conditioning time. The
Betacol 373 results showed a concentrate with 62.04%Fe at 69.07% recovery, where Al2O3
content of 0.6% was obtained and SiO2 at 3.39%.
When comparing the collectors, Betacol 373 and DDA it was concluded that both reagents
were good quartz collectors. They were able to concentrate the Fe in fluorspar feed significantly
though DDA showed superior results under the investigated conditions. Betacol 373 required
higher reagent dosage. It must be mentioned that Betacol 373 cost was much lower than DDA
and it is manufactured locally. However, for the objectives within the scope of this project a
conclusion was made that Betachem 30D – DDA system performed well, since the required
≥63%Fe was achieved. Since the best results were obtained using a rougher stage only in
concentration of Fe in fluorspar tails, it was recommended that a cleaner stage be investigated
with an aim to improve Fe assay and lower silica level.
Taguchi method was able to show optimum conditions required to achieve the highest Fe grade
in the concentrate using the minimum number of experiments. The repeatability tests were
conducted and the one way repeated measures ANOVA proved a null hypothesis which
assumed no significant change between repeated experimental results. ANOVA further showed
a 95% confidence levels on the results. This laboratory investigation proved it is possible to
concentrate the low grade iron oxide, using reverse cationic flotation. Taguchi DOE method
is suitable for optimization of reverse cationic flotation.
Keywords: Fluorspar tails, characterisation, reverse cationic flotation, Taguchi design of
experiments, signal-noise ratio and ANOVA.
ix
List of abbreviations
Abbreviation Meaning
DDA Dodecylamine
SN Signal to noise ratio
ANOVA Analysis of variance
SS Soluble starch
DOE Design of experiments
XRD
XRF
NWA
NEMA
OHSA
X-ray diffractometer
X-ray fluorescence
National Water Act
National Environmental Management
Occupational Health and Safety Act
Bet 30D Betachem 30D
Bet 373 Betacol 373
OA Orthogonal array
SEM Scanning electron microscopy
EDS Energy dispersive x-ray spectroscopy
BMA Bulk modal analysis
PMA Particle Mineralogical Analysis
QEMSCAN Quantitative evaluation of minerals by scanning
electron microscopy
µm micron
CT Conditioning time
CD Collector dosage
SD Soluble starch dosage
SPSS Statistical Package for Social Sciences
DMS Dense medium separation
SG Specific gravity
x
Contents
Dedication ............................................................................................................................. i
List of tables ...................................................................................................................... xiv
CHAPTER 1: INTRODUCTION ........................................................................................ 1
1.1 Background .............................................................................................................. 1
1.2 Problem statement ................................................................................................... 4
1.3 Research aim ............................................................................................................ 6
1.4 Research objectives ................................................................................................. 7
1.5 Research justification .............................................................................................. 7
1.6 Dissertation layout ................................................................................................. 12
CHAPTER 2: LITERATURE REVIEW............................................................................... 13
2.1 Review of iron oxide beneficiation methods ......................................................... 13
2.1.1 Gravity separation method ............................................................................. 13
2.1.2 Magnetic Separation method .......................................................................... 17
2.2 Principles of froth flotation.................................................................................... 20
2.2.1 Selective attachment of mineral to the bubble ............................................... 21
2.2.2 Hydrophobicity created by addition of flotation reagents .............................. 23
2.2.3 Mechanism of reagent adsorption on oxide mineral surface.......................... 28
2.3 Important factors affecting flotation ...................................................................... 30
2.3.1 pH modifiers ................................................................................................... 30
2.3.2 Collector type and dosage .............................................................................. 30
2.3.3 The particle size ............................................................................................. 31
2.3.4 Conditioning time ........................................................................................... 32
2.3.5 Pulp density .................................................................................................... 32
2.4 Flotation routes for iron oxides ............................................................................. 33
2.4.1 Direct anionic flotation................................................................................... 33
2.4.2 Reverse anionic flotation ................................................................................ 33
xi
2.5 Design of experiments – Taguchi Method ............................................................ 35
CHAPTER 3: METHODOLOGY ..................................................................................... 38
3.1 Materials ................................................................................................................ 38
3.2 Methods ................................................................................................................. 39
3.2.1 Characterization of fluorspar tails .................................................................. 39
3.2.2 Flotation experiment method ......................................................................... 41
3.3 Taguchi Method - Design of experiments ............................................................. 43
3.3.1 DOE setup for the Soluble starch – DDA system ............................................. 44
3.3.2 DOE setup for the Betachem 30D – DDA system ............................................ 46
3.3.3. DOE setup for the Betachem 30D – Betacol 373 system ................................. 47
CHAPTER 4: RESULTS AND DISCUSSION ................................................................. 48
4.1 Characterisation of fluorspar tailings .................................................................... 48
4.1.1 Particle size analysis....................................................................................... 48
4.1.2 Chemical assay results ................................................................................... 49
4.1.3 Mineral distribution analysis results .............................................................. 49
4.1.4 Loss on ignition results .................................................................................. 50
4.1.5 Chemical and mineralogical composition using XRD ................................... 51
4.1.6 QEMSCAN Bulk Modal Analysis ................................................................. 53
4.1.7 Iron oxide distribution in grain size ............................................................... 54
4.1.8 Mineral exposure and mineral liberation analysis.......................................... 55
4.2 Flotation Results .................................................................................................... 57
4.2.1 Optimum conditions predictions for soluble starch - DDA system ............... 57
Soluble starch dosage - SN ratio trend ............................................................... 58
DDA dosage – SN ratio trend ............................................................................ 58
Pulp pH – SN ratio trend .................................................................................... 58
Solids content – SN ratio trend .......................................................................... 59
Conditioning time – SN ratio trend .................................................................... 59
xii
Ranking of parameters ....................................................................................... 59
Confirmation test for SS-DDA system .............................................................. 60
4.2.2 Optimum condition prediction for Betachem 30D and DDA system ............ 60
Dextrin dosage – SN ratio trend ......................................................................... 61
DDA dosage – SN ratio trend ............................................................................ 61
Air rate and agitation speed – SN ratio trend ..................................................... 62
Ranking of parameters (Betachem 30D and DDA) ........................................... 62
Confirmations tests results for Betachem 30D – DDA system.......................... 62
4.2.3 Comparing soluble starch and Betachem 30D depressants ............................ 63
4.2.4 Further optimisation of Betachem 30D – DDA system ................................. 65
De-sliming of feed ............................................................................................. 65
Increasing conditioning time.............................................................................. 66
4.2.5 Optimum conditions prediction for Betachem 30D- Betacol 373 system ..... 67
4.2.6 Further optimisation of BET 30D – BET 373 system .................................... 67
Collector dosage variation ................................................................................. 67
4.2.7 Comparing cationic amines (DDA and Betacol 373) results ......................... 68
4.3 ANOVA analysis ................................................................................................... 70
CHAPTER 5: CONCLUSIONS AND RECOMMENDATIONS ..................................... 72
5.1 Conclusions ........................................................................................................... 72
5.2 Recommendations ................................................................................................. 73
6 REFERENCE ............................................................................................................ 74
7 APPENDIX ............................................................................................................ - 1 -
7.1 Laboratory activities risk analysis ...................................................................... - 1 -
7.2 Characterization data .......................................................................................... - 2 -
7.2.1 Detailed chemical analysis of feed .............................................................. - 2 -
7.2.2 Conversion of oxides values to element values .......................................... - 2 -
7.2.3 Mineral distribution data ............................................................................. - 4 -

xiii
7.2.4 QEMSCAN Particle Map Analysis (PMA) ................................................ - 5 -
7.3 Flotation of fluorspar tails .................................................................................. - 8 -
7.3.1 Mass Balance calculation ............................................................................ - 8 -
7.3.2 Metal recovery calculation .......................................................................... - 9 -
7.3.3 Calculations example: DDA and Betachcem 30D system .......................... - 9 -
7.3.4 Recovery calculation ................................................................................. - 10 -
7.3.5 Taguchi DOE for flotation using soluble starch- DDA............................. - 11 -
7.3.6 Confirmation test for SS-DDA system...................................................... - 13 -
7.3.7 Betachem 30D- DDA system .................................................................... - 14 -
7.3.8 Soluble starch – DDA system final confirmation test ............................... - 15 -
7.3.9 Flotation kinetics of soluble starch and Betachem 30D ............................ - 16 -
7.4 Further optimization experiments ..................................................................... - 18 -
7.4.1 Effect of feed de-sliming ........................................................................... - 18 -
7.4.2 Effect of DDA concentration variation ..................................................... - 19 -
7.4.3 Effect of increased conditioning time ....................................................... - 20 -
7.4.4 Comparing results of increased conditioning time and de-slimed feed ........ - 22 -
7.4.5 Betachem 30D - Betacol 373 system ............................................................ - 23 -
7.4.6. Comparison between Betacol 373 and DDA ............................................... - 24 -
xiv
List of figures
Figure 1.1: General beneficiation flowsheet of low grade iron ore ..................................... 2
Figure 1.2: Typical liberation classes ................................................................................ 2
Figure 1.3: General fluorspar recovery flowsheet .............................................................. 4
Figure 1.4: Tailings pond .................................................................................................... 5
Figure 1.5: Important South African minerals ..................................................................... 8
Figure 1.6: Steel consumption trend in China and the world .............................................. 8
Figure 1.7: Top iron ore producing countries in 2014 ........................................................ 9
Figure 1.8: Monthly iron ore prices for Jan 2008 – Jan 2015 ........................................... 10
Figure 2.1: Basic construction of the jig . .......................................................................... 15
Figure 2.2: Diagram showing spiral operation ................................................................. 17
Figure 2.3: Magnetic separation operation . ...................................................................... 17
Figure 2.4: Effective particle size range for various mineral separation techniques ........ 19
Figure 2.5: Conventional flotation cell ............................................................................. 20
Figure 2.6: Bubble-air contact angle in an aqueous medium. ............................................ 22
Figure 2.7: Hematite – starch interaction structure. .......................................................... 23
Figure 2.8: Action of the frother ....................................................................................... 24
Figure 2.9: Collector adsorption on mineral surface . ....................................................... 25
Figure 2.10: Classification of collectors ............................................................................ 26
Figure 2.11: Cationic amine collectors. ............................................................................ 27
Figure 2.12: Schematic representation of the electrical double layer and potential drop
across the double layer at a solid-water interface. The planes represent the inner and outer
Stern planes ........................................................................................................................ 29
Figure 2.13: Typical view of flotation of different size fractions. ..................................... 32
Figure 3.1: Structure of a primary and tertiary amine, respectively ................................. 38
Figure 3.2: Denver D12 conventional flotation equipment ............................................... 42
Figure 3.3: Flowsheet depicting flotation procedure ......................................................... 43
Figure 3.4: Taguchi method steps . .................................................................................... 44
Figure 4.1:Particle size distribution – 2014 ....................................................................... 48
Figure 4.2: Mineral distribution in fluorspar sample collected .......................................... 49
Figure 4.3: XRD pattern for fluorspar tails ........................................................................ 52
Figure 4.4: Iron oxide distribution per grain size dimension ............................................. 54
xv
Figure 4.5: (a) Results of exposure characteristics of Fe-oxides (b) Mineral liberation
analysis results ...................................... 55
Figure 4.6: Exposure and association categories ............................................................... 56
Figure 4.7: SN ratio response for soluble starch-DDA system .......................................... 57
Figure 4.8: SN ratio response for Betachem 30D-DDA system ........................................ 61
Figure 4.9: Effect of dextrin dosage on flotation performance .......................................... 63
Figure 4.10: Flotation kinetics of dextrin and soluble starch systems ............................... 64
Figure 4.11: Impact of de-sliming on iron grade .............................................................. 65
Figure 4.12: Impact of collector dosage on iron grade ...................................................... 67
Figure 4.13: Impact of increasing solids content on iron grade ......................................... 68
xvi
List of tables
Table 1: Top 10 iron ore mining companies (2014) .......................................................... 11
Table 2: Experimental parameters and their levels. ........................................................... 44
Table 3: L25 orthogonal array matrix for DDA and soluble starch experiments .............. 45
Table 4: Betachem 30D - DDA system parameters setting ............................................... 46
Table 5 : L9 orthogonal array matrix for DDA and Betachem 30D experiments ............. 47
Table 6: Semi-quantitative mineral abundances determined from XRD. .......................... 51
Table 7: Bulk Modal Analysis composition (mass%) ....................................................... 53
Table 8: Parameter ranking results using SN ratio ............................................................ 59
Table 9: Parameter ranking results using SN ratio. ........................................................... 62
Table 10: Comparison between de-sliming and increased conditioning time ................... 66
Table 11: Dodecylamine and Betacol 373 comparison ..................................................... 69
Table 12: Mean results ....................................................................................................... 70
Table 13: Results for multivariate tests ............................................................................. 71
xvii
List of tables in the appendix
Table A 1: Risk assessment ............................................................................................ - 1 -
Table A 2: Chemical analysis of fluorspar tails sample ................................................. - 2 -
Table A 3: Element-to-stoichiometric oxide conversion factors (James Cook University,
2005) ............................................................................................................................... - 3 -
Table A 4: Mineral distribution data ............................................................................... - 4 -
Table A 5: Exposure and mineral association characteristics of Fe-oxides .................... - 7 -
Table A 6: Flotation operating conditions ...................................................................... - 9 -
Table A 7: Taguchi data spreadsheet ............................................................................ - 12 -
Table A 8: Confirmation test results for SS-DDA concentrate stream ......................... - 13 -
Table A 9: Impact of varied depressant concentration on concentrate quality ............. - 14 -
Table A 10: Detailed results for final SS-DDA system ................................................ - 15 -
Table A 11: Flotation kinetics for BET30D-DDA systems .......................................... - 16 -
Table A 12: Flotation kinetics of soluble starch – DDA system .................................. - 17 -
Table A 13: Quantification of metal loss due to feed de-sliming ................................. - 18 -
Table A 14: Effect of DDA dosage variation using de-slimed feed ............................. - 19 -
Table A 15: Effect of increased conditioning time on concentrate quality .................. - 21 -
Table A 16: Comparison between concentrate of de-slimed feed and that of increased
conditioning time .......................................................................................................... - 22 -
Table A 17: Impact of collector changes on flotation ................................................... - 23 -
Table A 18: Comparison between Betacol 373 and DDA ............................................ - 24 -
1
1 CHAPTER 1: INTRODUCTION
1.1 Background
Iron is the fourth common mineral on earth’s crust mainly found as a compound due to its high
reactivity (Wills, 2006). It is primarily found as an oxide (hematite and magnetite), hydroxide
(goethite and limonite) and to a lesser extent as a carbonate (e.g. side rite) (Filippov, et al.,
2014). Metallic minerals are generally found associated with other minerals in igneous rocks
or sedimentary rocks. The most common gangue minerals in iron ores are quartz, feldspar,
clays, where the most undesirable constituents are alumina, silica and phosphorus (Wilson &
Anhaeusser, 1998).
Mineral processing is therefore conducted to extract/concentrate the valuable minerals from
gangue to produce a commercial end product. For a high grade ore (>65%Fe and minimum
impurities) this simply includes crushing the ore to the required particle size, screening and
directly feeding the screened ore into the blast furnace. Gradual depletion of high grade iron
ore has necessitated miners to develop strategies for beneficiation of low grade iron ores, which
normally is present at purities as low as <50%Fe.
Beneficiation of low grade ores has resulted in a need to grind the ores finer (even <250µm) in
order to liberate the valuable mineral Low grade iron ore is characterised by low iron content
(<60%Fe), high content of impurities and fine texture. These ores require a concentration
method prior to feeding into the blast furnace. The general beneficiation process for low grade
ores often includes excavation of sedimentary rock, crushing, grinding, subjecting to separation
method to concentrate the valuable mineral, drying of the valuable mineral and rejecting of the
gangue into the tailings pond, as shown in Figure 1.1. The first step of iron ore processing is
comminution, where the ore is reduced to the required size with an aim to liberate valuables
from gangue minerals and provide desired size range for the selected metallurgical treatment
(Jain, 1985).
2
Figure 1.1: General beneficiation flowsheet of low grade iron ore
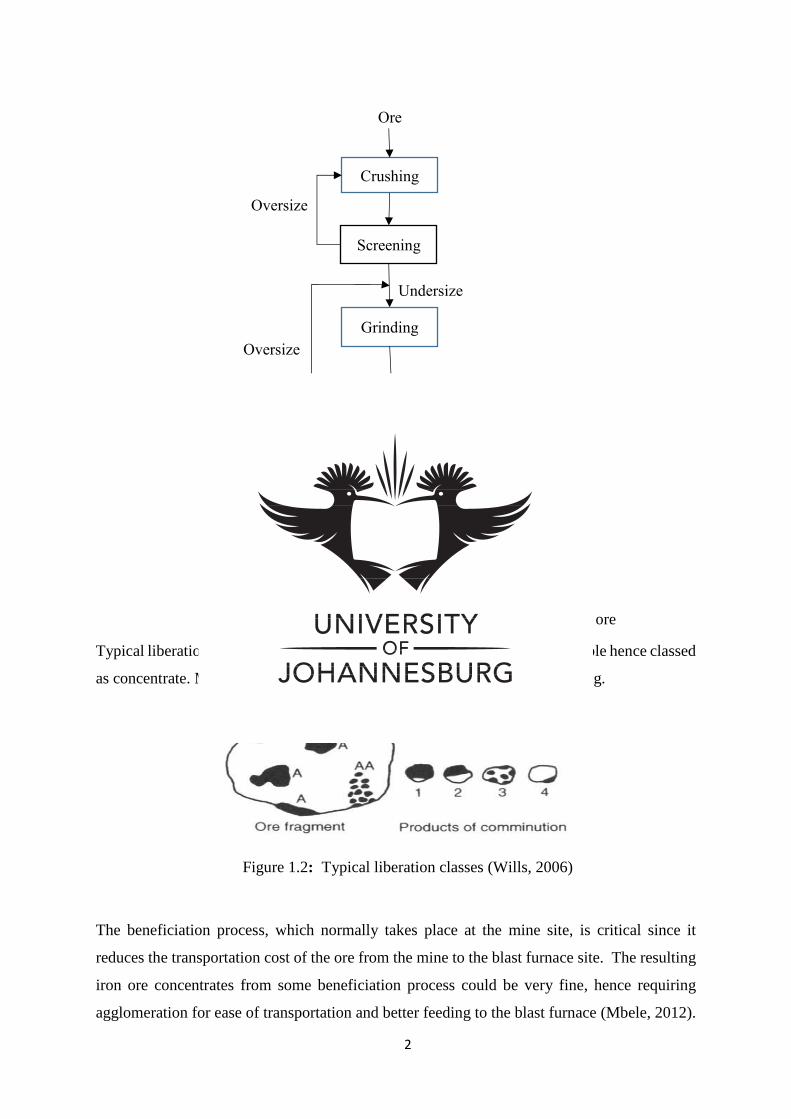
Typical liberations classes shown in Figure 1.2 where 1 is fully liberated valuable hence classed
as concentrate. Minerals classed as 2 and 3 are termed middling and 4 is tailing.
Figure 1.2: Typical liberation classes (Wills, 2006)
The beneficiation process, which normally takes place at the mine site, is critical since it
reduces the transportation cost of the ore from the mine to the blast furnace site. The resulting
iron ore concentrates from some beneficiation process could be very fine, hence requiring
agglomeration for ease of transportation and better feeding to the blast furnace (Mbele, 2012).
Crushing
Ore
Screening
Grinding
Classification
Concentration
Undersize
Oversize
Oversize
Undersize
Concentrates Tailing

3
Quality requirements for blast furnace feed is >63%Fe, alumina to silica ratio of <1, silica <3%,
alumina <2%, calcium oxide to silica ratio of around 1, lumpy particles of size -32+6.3mm, for
better blast furnace productivity and slag flow ability (Singh, et al., 2015; Zogo, 2009). Slag
composition is critical in determining the physicochemical characteristics which affect coke
consumption, slag handling, smoothness of operation, hot metal productivity and quality of the
metal produced. Abbassi, et al., 2007 investigated the impact of phosphorus content in gray
cast iron, where it was found that levels in phosphorus content changes the mechanical strength,
hardness and other properties of the product. Different types of iron are produced for different
end use e.g. pig iron, cast iron, wrought iron and iron alloy such as steel, hence grade
requirements may vary.
The beneficiation method for low grade iron ores is selected based on the physical, chemical
and mineralogical properties of the ore. The general separation methods for low grade iron ore
are gravity separation, magnetic separation and flotation. Upon selection of the appropriate
mineral separation method, experiments are conducted to obtain optimum conditions that
would repeatedly obtain the required quality of iron concentrate. Due to a large number of
parameters influencing a separation method, it would be difficult to study all possible
combinations of factors as it would lead to uneconomically lengthy experiments and high
consumption of resource (Bendell, et al., 1989).
It is thus imperative to approach the experimental activities with a well-designed plan to ensure
focus, relevance and reliability of results. Statistical design of experiments is used for planning
the experiments so that appropriate data will be collected and analysed by statistical methods,
resulting in valid and objective conclusion (Montgomery, 2009). Experimental plan covers the
selection of the sample, clear setting of the objectives, hypothesis, careful pairing of parameters
under investigation and levels to which they will be varied, systemic execution of the
experiments and collection of data. It also includes conducting repeatability tests to ascertain
experimental errors, and considering the acceptable confidence levels required to deem results
reliable (Fisher, 1942). Design of experiments (DOE) methods are used to statistically provide
a predictive knowledge of a complex, multi-variable process using few trials (Hicks & Turner,
1999). DOE is largely used in the areas such as optimization of manufacturing processes;
screening and identification of important factors and robustness testing of methods. Examples
of DOE methods include full factorial design, fractional factorial design and Taguchi method.
(Athreya & Venkatesh, 2012; Ryan, 2007).
4
1.2 Problem statement
Vergenoeg Mine, located 65km North East of Pretoria, South Africa, is the largest fluorspar
mine in the world with production capacity currently at 240 000 tons per year (Vergenoeg
Mining Company, 2016). Fluorspar is mined as the mineral fluorite (CaF2) and is generally
found associated with metallic minerals (such as hematite, magnetite, etc.) and other gangue
minerals such as quartz, calcite, zinc sulphides, etc.
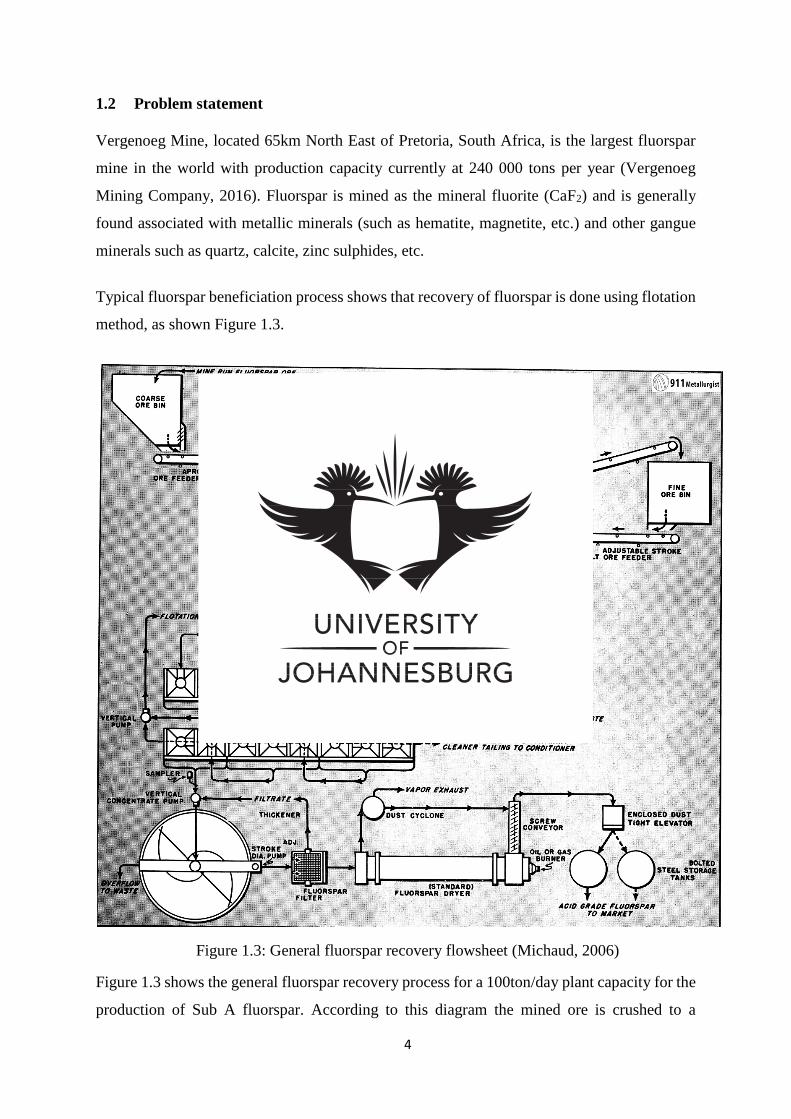
Typical fluorspar beneficiation process shows that recovery of fluorspar is done using flotation
method, as shown Figure 1.3.
Figure 1.3: General fluorspar recovery flowsheet (Michaud, 2006)
Figure 1.3 shows the general fluorspar recovery process for a 100ton/day plant capacity for the
production of Sub A fluorspar. According to this diagram the mined ore is crushed to a
5
manageable size followed by grinding to -297µm+ 230µm in order to liberate calcium fluoride
from gangue particles. Thickening of the classifier overflow is necessary, to maintain proper
density and feed regulation to flotation, in larger plants and where fine grinding is done.
Conditioning of pulp is then conducted prior to the flotation process. The flotation circuit is
arranged depending on the required product grade. The final product is filtered, dried and
stored. The mine produces acid grade fluorspar and various metallurgical grades for domestic
and export needs. Fluorspar is an important commodity with uses in areas such as the chemical
industry, metallurgical and ceramic processes, e.g. manufacture of hydrofluoric acid, as a flux
in smelting operations, manufacture of enamels, and optical products such as lenses amongst
others (Wilson & Anhaeusser, 1998).
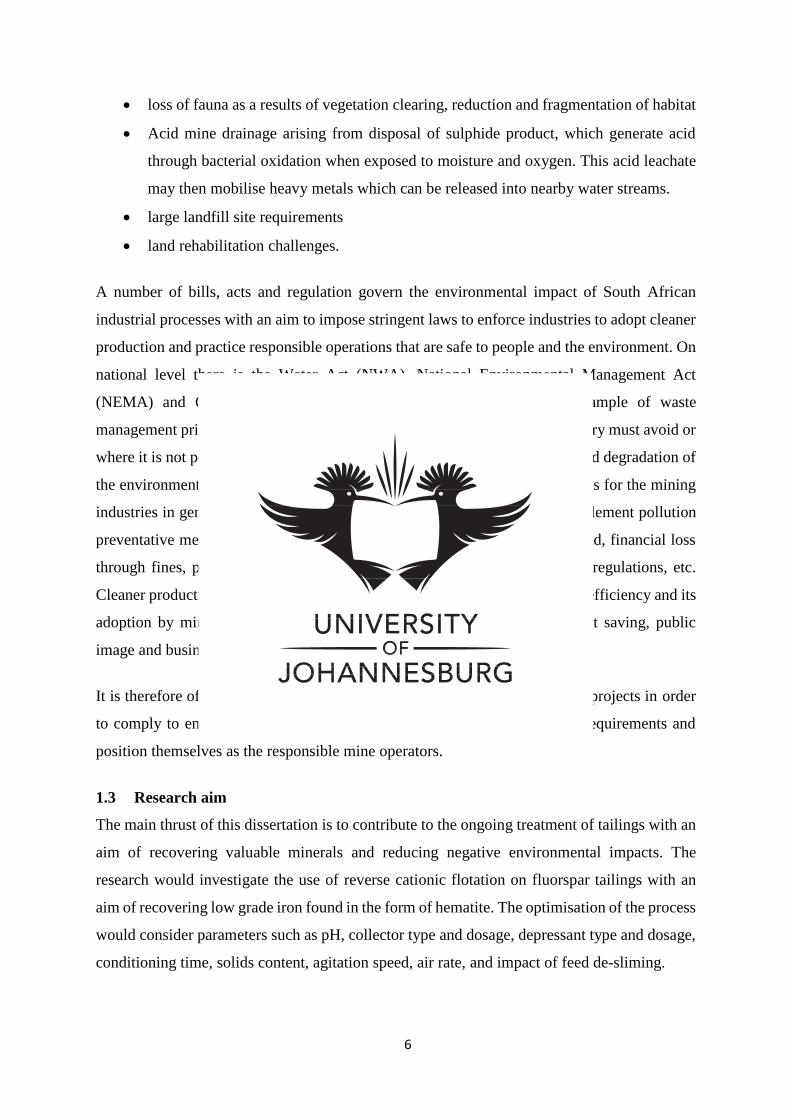
The final waste produced from the processing is disposed into the tailings ponds, as shown in
Figure 1.4.
Figure 1.4: Tailings pond (Florian Neukirchen, 2016)
An estimated 480000 tons of tailings are annually disposed, by Vergenoeg Mine, into the
tailing ponds. Mining and disposal of waste minerals have the potential to cause a number of
environmental problems such as:
loss of flora including direct losses through clearing
6
loss of fauna as a results of vegetation clearing, reduction and fragmentation of habitat
Acid mine drainage arising from disposal of sulphide product, which generate acid
through bacterial oxidation when exposed to moisture and oxygen. This acid leachate
may then mobilise heavy metals which can be released into nearby water streams.
large landfill site requirements
land rehabilitation challenges.
A number of bills, acts and regulation govern the environmental impact of South African
industrial processes with an aim to impose stringent laws to enforce industries to adopt cleaner
production and practice responsible operations that are safe to people and the environment. On
national level there is the Water Act (NWA), National Environmental Management Act
(NEMA) and Occupational Health and Safety Act (OSH Act). An example of waste
management principle is section 2(4)(a)(ii) of NEMA, which states that industry must avoid or
where it is not possible to avoid altogether, minimise and remedy pollution and degradation of
the environment (Barclay, et al., 2011). Waste disposal therefore carries costs for the mining
industries in general, which include; operational measures undertaken to implement pollution
preventative measures, loss of profit, company image, management time, land, financial loss
through fines, possible company closure as a results of non-compliance to regulations, etc.
Cleaner production refers to waste minimisation, pollution prevention or eco-efficiency and its
adoption by mining industries is vital for compliance with regulations, cost saving, public
image and business sustainability.
It is therefore of interest for Vergenoeg Mine to explore waste minimization projects in order
to comply to environmental laws, increase company revenue, reduce land requirements and
position themselves as the responsible mine operators.
1.3 Research aim
The main thrust of this dissertation is to contribute to the ongoing treatment of tailings with an
aim of recovering valuable minerals and reducing negative environmental impacts. The
research would investigate the use of reverse cationic flotation on fluorspar tailings with an
aim of recovering low grade iron found in the form of hematite. The optimisation of the process
would consider parameters such as pH, collector type and dosage, depressant type and dosage,
conditioning time, solids content, agitation speed, air rate, and impact of feed de-sliming.
7
Due to the number of parameters investigated, this research will make use of the Taguchi DOE
method for optimisation of the flotation process. Taguchi is a well-accepted technique founded
in 1966 by Genichi Taguchi. Taguchi method is based on Ronald’s Fischer factorial design
work, and is widely applied for product design and process optimization in manufacturing,
marketing and engineering sectors worldwide. (Altan, 2010; Kumar et al 2015; du Plessis
2007).
1.4 Research objectives
The specific project objectives are to:
Perform physical, chemical and mineralogical analysis of fluorspar tailings to
identify the mineral phases and chemical contents in order to ascertain the
appropriate method of concentrating the low grade iron.
Develop a reverse cationic flotation procedure for experiments conducted using
available laboratory equipment.
Optimize the reverse cationic flotation of low grade iron oxide found in fluorspar
tailings using Taguchi design of experiments.
Determine the critical factors affecting the performance of reverse cationic flotation
in achieving the required iron grade.
1.5 Research justification
Iron is an essential ingredient in steel making for domestic and foreign market consumption,
with demand greatly increased in developing countries worldwide (Zogo, 2009). It is amongst
the four most important minerals in the South African mining industry contributing to the
country’s economy, as shown in Figure 1.5. According to year 2012 sales contribution, iron
ore sales contributed 14%, with coal leading mineral contributing 26% to the mineral sales.
8
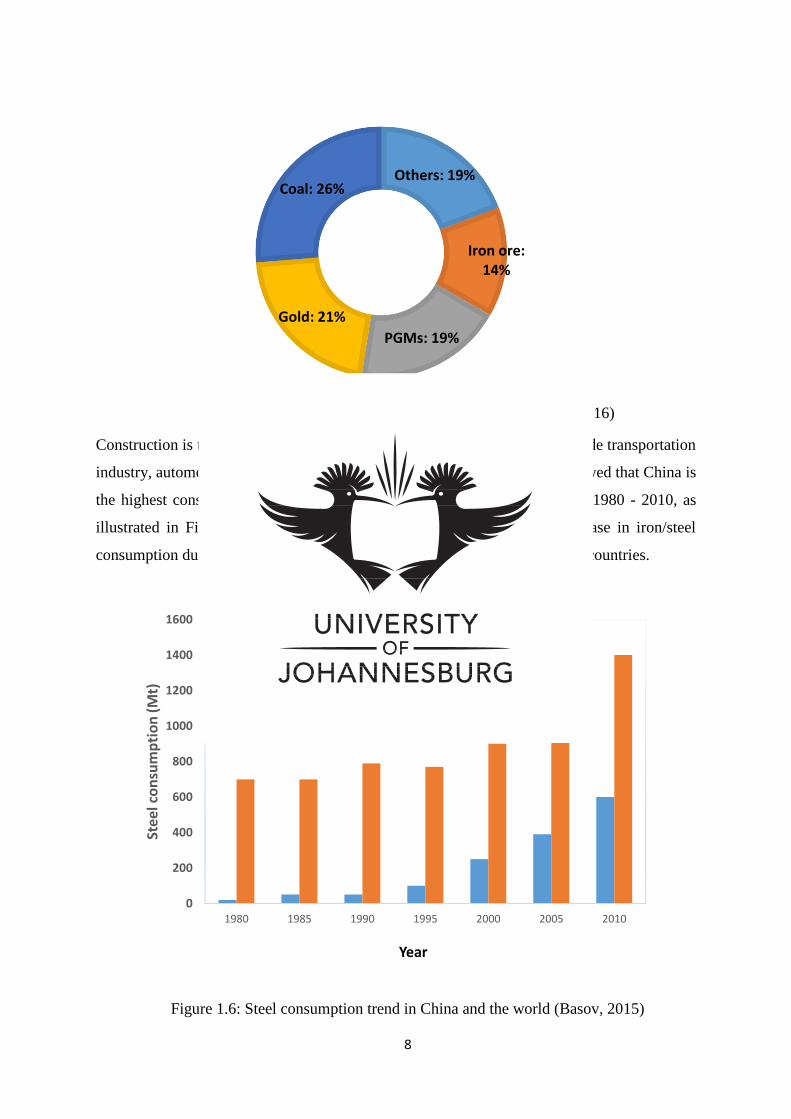
Figure 1.5: Important South African minerals (STATSSA, 2016)
Construction is the leading consumer of steel and iron where other uses include transportation
industry, automotive, chemical industry, etc. Work done by Basov, 2015 showed that China is
the highest consumer of steel with steel consumption increasing from year 1980 - 2010, as
illustrated in Figure 1.6. It is further shown that there was a global increase in iron/steel
consumption during 1995-2010, which is attributed to development of many countries.
Figure 1.6: Steel consumption trend in China and the world (Basov, 2015)
Others: 19%
Iron ore: 14%
PGMs: 19%
Gold: 21%
Coal: 26%
0
200
400
600
800
1000
1200
1400
1600
1980 1985 1990 1995 2000 2005 2010
Stee
l co
nsu
mp
tio
n (
Mt)
Year
China Rest of world

9
Transparency Market Research, 2016 showed that China is the leader of global iron and steel
market in terms of production with >50% of global volume with South Africa being number 7,
as illustrated in Figure 1.7.
Figure 1.7: Top iron ore producing countries in 2014 (Transparency Market Research, 2016)
Since China is the largest consumer and producer of iron and steel (as shown in Figure 1.6 and
1.7), dynamics in the global market are therefore greatly defined by China. South Africa is the
7th largest producer of iron globally with production of 80.8Mt iron ore in 2014, however,
production fell by 8.6% to 73Mt in 2015 (Statics, 2016). Large volatility in iron price over
January 2008-January 2015 period is cited as the cause of poor performance in the iron mining
industry. Data from International Monetary Fund (IMF) reflected in Figure 1.8 showed a 55%
fall in iron price between Jan 2013- Jan 2015 (Kario & Brown, 2015). China’s economic
slowdown and subsequent weaker demand for iron are cited as the main cause of this price
drop (Innace, 2016).
0
200
400
600
800
1000
1200
1400
1600
Iro
n o
ree
pro
du
ctio
n (
Mt)
Country
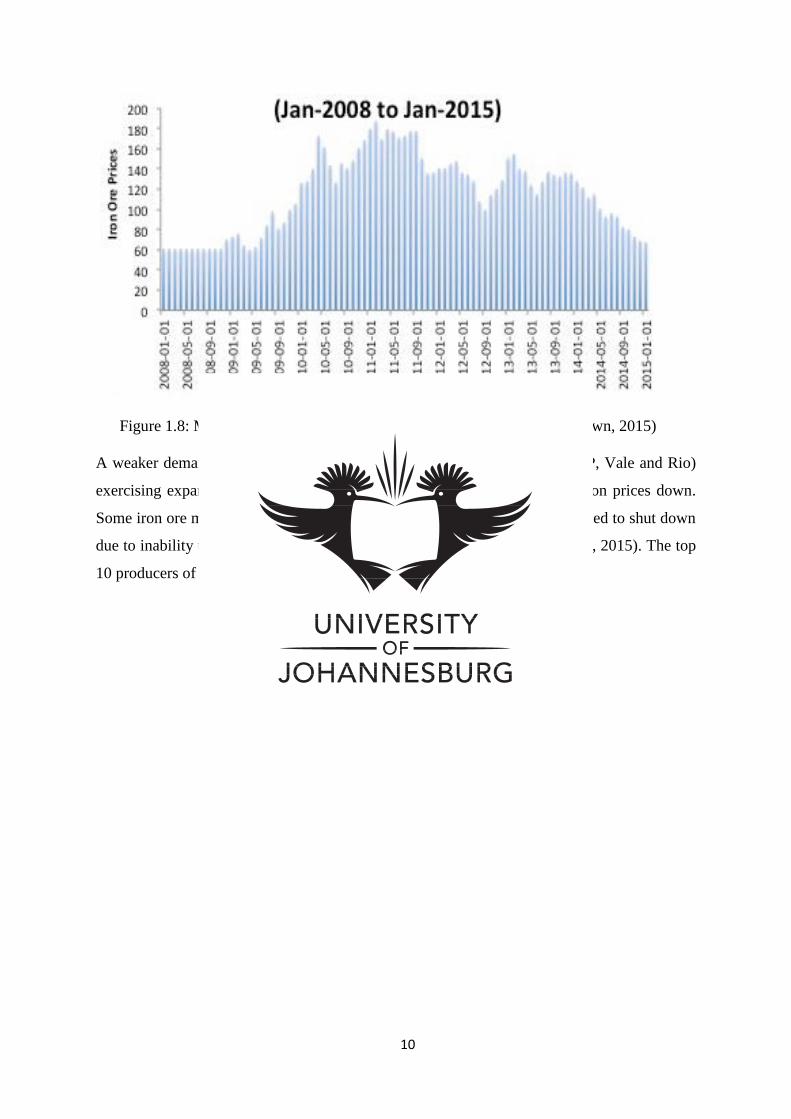
10
Figure 1.8: Monthly iron ore prices for Jan 2008 – Jan 2015 (Kario & Brown, 2015)
A weaker demand in iron has also been attributed to major companies (BHP, Vale and Rio)
exercising expansion strategies that flooded the iron market, thus driving iron prices down.
Some iron ore mines particularly in Africa, China and Canada have been forced to shut down
due to inability to compete in such a low price environment (Kario & Brown, 2015). The top
10 producers of iron are tabulated in Table 1.

11
Table 1: Top 10 iron ore mining companies (2014)
Major owner Country Province/State Iron ore
production, Mt
Hamersley Rio Tinto Australia Western Australia 163
Carajas Vale Brazil Para 120
Chichester
Hub
Fortescue
Metals
Australia Western Australia 90
Yandi BHP Billiton Australia Western Australia 79
Mount
Whaleback
BHP Billiton Australia Western Australia 77
Solomon Hub Fortescue
Metals
Australia Western Australia 58
Area C BHP Billiton Australia Western Australia 57
Hope Downs Rio
Tinto/Hancock
Australia Western Australia 43
Mariana Hub Vale Brazil Minas Gerais 39
Sishen Anglo
American
South Africa Northen Cape 36
Despite significant decline in iron prices, a demand for iron will exist for many years because
iron is necessary for an economy to function and remain productive. There are predictions that
iron demand will peak by year 2025-2030 (Innace, 2016). In fact, iron price has been reported
to be on a steady increase, where iron price increased from $39.6 per Mt in December 2015 to
$56.7per Mt in September 2016 (Statista, 2016). Large companies are already planning to
increase supply taking market share from small miners in anticipation of major market growth
as undeveloped countries develop and more urbanization of various areas occurs (Innace,
2016). Producers with operation costs that are far below current iron ore prices are well
positioned to take market share.
Treatment of flotation tailings is generally cheaper than the conventional beneficiation process
due to the activity of mining and comminution being omitted in the process (Wills & Finch,
2016). Iron ore mining is generally done using surface mining operations (open pit and open
cut mining method), however a few underground iron ore mines are in operation around the
globe. Recovery of low grade iron from the fluorspar tails would have the following benefits:
12
reduced fluorspar tails disposal costs,
reduced fluorspar tails quantities thus reducing landfill site requirement.
increase company revenue at reduced operating costs, with elimination of mining and
grinding step in the iron beneficiation process.
reduce heavy metals content in the fluorspar tailing ponds and associated
environmental risks such as acid mine drainage.
elimination of risks associated with iron ore mining, which include drilling, blasting,
land vibrations, and other safety risks (Golosinski, 2000).
Position the company as the environmentally cautious thus improving its public image.
1.6 Dissertation layout
This dissertation consists of 5 chapters. Chapter 1 provides a background to low grade iron
oxides, their treatment options, the aim and objectives of the project, as well as research
justifications. Chapter 2 provides literature review of iron oxide separation techniques, with
more focus on the principles of the selected reverse cationic flotation method and the Taguchi
DOE method. The literature review also mentions some previous work done by various authors
on different iron oxide flotation routes. Chapter 3 describes the experimental methods; which
includes characterization of fluorspar tails, reverse cationic flotation experiments using
Taguchi DOE and approach used in applying Taguchi DOE method. Chapter 4 presents and
discusses characterisation and flotation results using SN ratio and ANOVA. Chapter 5 reflects
on conclusions drawn from the research and recommendations. References are on Section 6
and the Appendices is reflected on Section 7.

13
2 CHAPTER 2: LITERATURE REVIEW
This chapter provides literature review for various beneficiation methods for low grade iron
oxides with a focus on flotation. Principles of flotation are discussed with more focus on
reverse cationic flotation used in this study. The importance of design of experiments (DOE)
is highlighted with more emphasis on the studied Taguchi DOE.
2.1 Review of iron oxide beneficiation methods
Physical, chemical and mineralogical analysis of minerals are critical in the selection of
appropriate separation method for concentrating valuable mineral. Generally, the upgrading
of iron oxide ore is achieved using one or a combination of gravity separation, magnetic
separation or flotation (Araujo, et al., 2005). The performance of the selected separation
method is measured based on the achieved valuable mineral grade and recovery. Feasibility
studies are further performed comparing the cost of production, losses incurred and price of
the valuable commodity.
2.1.1 Gravity separation method
The gravity concentration method is the oldest technique used in mineral separation including
that of iron ores. It is defined as the method used for separation of two or more minerals of
different specific gravity, by their relative movement in response to the force of gravity and
resistance to motion by viscous fluid such as water or any other suitable fluid (Burt, 1984).
Gravity separation is suitable for processing iron ores – quartz minerals since there exists
sufficient specific gravity difference between hematite and quartz (Voges, 1975). Besides
specific gravity, this method is also affected by factors like weight, size and shape as they affect
particle movement. It is efficient when a marked density difference exists between the mineral
and the gangue (Das, et al., 2007).
Gravity separators are generally cheaper due to their simplicity and very low power
requirements. Their environmental impact is lower due to the absence of organic chemicals.
The limitation for gravity separators is that they are not efficient for the treatment of complex
ores and fines (Rao, et al., 2009). A common problem in minerals processing is the efficient
recovery of mineral values in the fines fraction, usually <75µm. In the fine size ranges, the fluid
and viscous forces become dominant relative to the gravity and this in turn affects the separation
efficiency. According to Wills & Finch, 2016 gravity separators are sensitive to presence of
slimes (<10µm) due to increased slurry viscosity hence reduced separation efficiency and

14
obscure visual cut point for operators. The performance of gravity concentration generally
increases with increased particle size. To reduce the size effect and to make the relative motion of
the particles specific gravity dependent, a closely sized feed is desirable. However, significant
development has been made in this field by introduction of enhanced gravity separators like
Knelson, Falcon, Kelsey Jig, Multigravity separator, etc. Such equipment’s generate higher gravity
by application of centrifugal force and are capable of concentrating fines and ultrafine particles.
The suitability of gravity concentration method for the processed minerals is determined by the
difference in specific gravity (SG) of minerals and is measured using the concentration criterion
(CC) (Wills, 2006):
fluidlm
fluidhm
SGSG
SGSGCC
…………………………………….eqn 1.1
Where SGhm is heavy mineral’s specific gravity, SGfluid is specific gravity of the fluid and SGlm
is that of the light mineral. The concentration criterion is interpreted as follows;
CC > 2.5, suitable for separation of particles above 75µm in size
1.75 < CC < 2.5, suitable for separation of particles above 150 µm
1.50 < CC < 1.75, suitable for separation of particles above 1.7 mm
1.25 < CC < 1.50, suitable for separation of particles above 6.35 mm
CC < 1.25, not suitable for any size
Generally, when the quotient is >2.5 then gravity separation is relatively easy. The final gravity
concentrate often needs cleaning by magnetic separation or some other method. Seifelnassr, et
al. (2013) found that it was possible to upgrade iron ore using two stages (rougher and cleaner)
of a gravity separation technique followed by magnetic separation or using two magnetic
separation techniques. Examples of gravity concentrators for iron ores include dense media
separation, jig concentrator, spirals, shaking tables, etc. (Wills & Finch, 2016).
Dense media separators (DMS): A fluid of specific gravity (SG) between the specific
gravities of valuable and gangue mineral is used to float the lighter particles and the heavy
particles settle, thus effecting separation of feed into gangue and concentrates. This process
is applicable where there is adequate difference in specific gravities, liberated particles of
+0.3mm size (Jain, 1985). Wills & Finch, 2016 recommended the use of DMS when
processing coarse material of >4mm, in which case separation can be effected even on a
15
<0.1 difference in specific gravity. However, separation down to 500µm can be effected
by inclusion of centrifugal separators.
The DMS is mainly used in laboratory for appraisal of gravity separation techniques on
ores. DMS can be used in separation of hematite from mainly quartz gangue, however,
consideration on selection of the fluid media is critical (Voges, 1975; Bosman, 2014).
Generally, toxicity of the fluid media increases with increased SG which also impose
limitations on the use of DMS. Sishen Iron Ore Mine used DMS to upgrade A-grade
hematite ore (>60% Fe) of -90mm particle size to a final product grade of 66% Fe in lump
and 65% Fe in the fine ore. However, its use on the B-grade (between 50% and 60% Fe)
and C-grade material (between 35% and 50% Fe) was abandoned, owing to the inability of
the existing DMS plant to beneficiate material at densities higher than 3600 kg/m3
(Myburgh & Nortje, 2014). Instead, Sishen Mine considered jigging for B grade material.
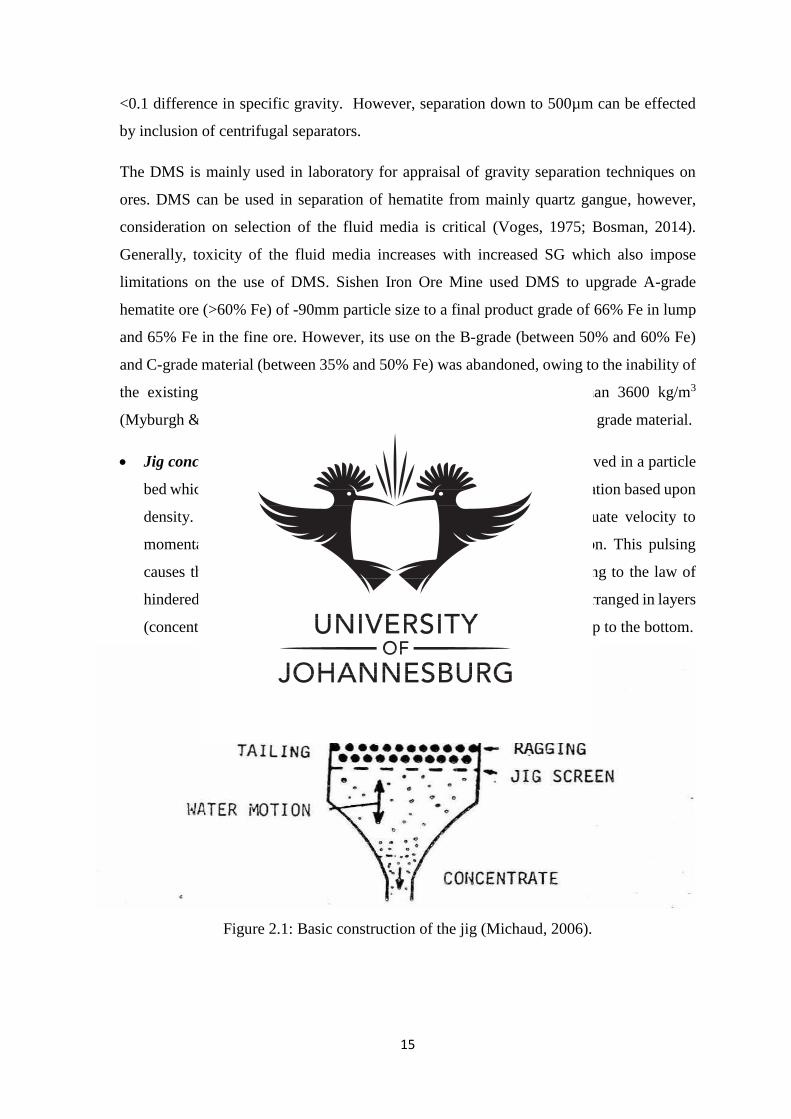
Jig concentrators: The separation of minerals of different SG is achieved in a particle
bed which is fluidized by pulsating current of water producing stratification based upon
density. A pulsation forces water up through the screen with adequate velocity to
momentarily suspend all the particles resulting in fluidised condition. This pulsing
causes the minerals with differing SG to arrange themselves according to the law of
hindered settling (Jain, 1985). The stratification causes particles to be arranged in layers
(concentrate, middling and tailing) with increasing density from the top to the bottom.
Figure 2.1: Basic construction of the jig (Michaud, 2006).
16
The size fraction of the required feed to the jigs is normally 0.5-30mm, however feed size
as low as 75µm is possible with enhanced jigs. The jig is normally used to concentrate
relatively coarse material and if the feed is fairly close-sized (e.g. 3-10mm) a good
separation can be achieved even when a narrow difference in SG exists (Wills & Finch,
2016). The jig has advantages of low capital and operational costs, however, it is not
suitable for fines. The presence of fines affects the jig performance in that fines tend to
float thus reporting with the light/tailing layer. Sishen Iron Ore Mine investigated factors
affecting jigging, studying a concentrate B-grade (50-60%Fe) hematite ore of coarse (-
25+8mm), medium (-8+3mm) and fine (-3+1mm) texture (Myburgh & Nortje, 2014). Jigs
are environmentally friendly with no use of reagents and cheaper to run. Das, et al. (2007)
successfully used jigging to treat low grade iron of <5mm and 56-58%Fe into a concentrate
of 63.7%Fe at 73.6% recovery.
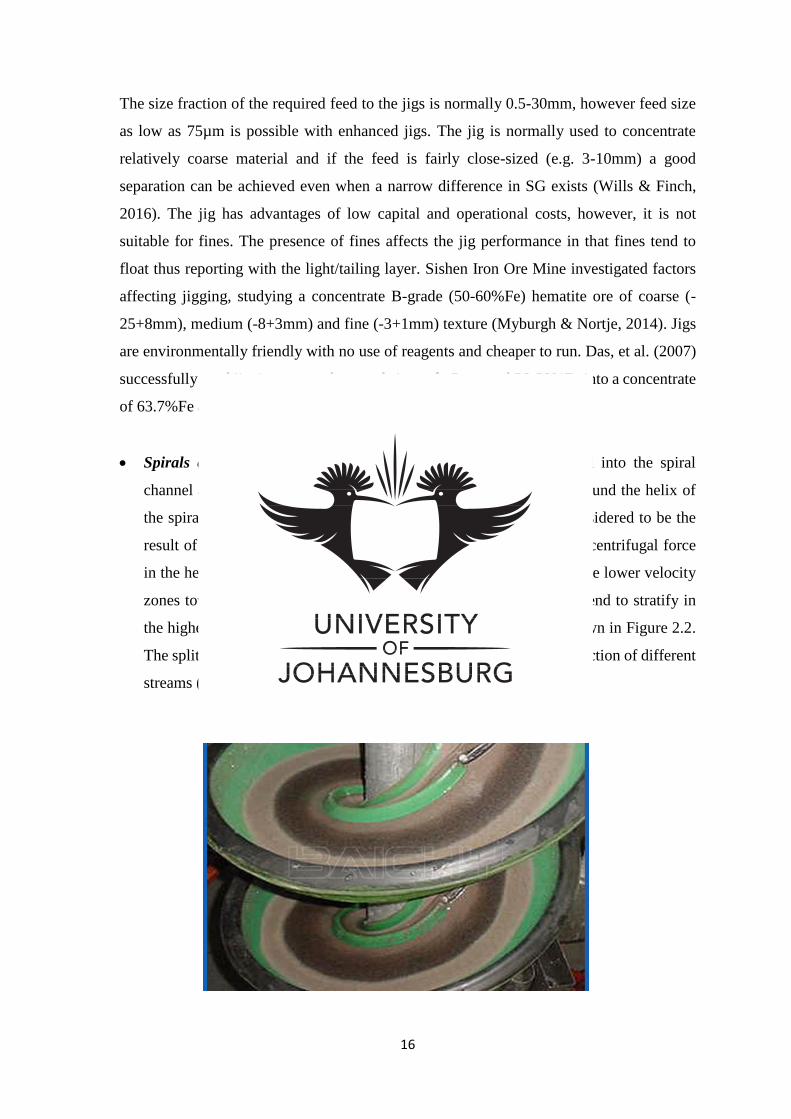
Spirals concentrators: The homogeneous feed slurry is introduced into the spiral
channel and stratification occurs in a vertical plane as pulp flows around the helix of
the spiral concentrator (Jain, 1985). This stratification is usually considered to be the
result of a combination of hindered settling, interstitial trickling and centrifugal force
in the helical trough (Wills & Finch, 2016). The heavies proceed to the lower velocity
zones towards the inner side of the trough surface, while the lights tend to stratify in
the higher velocity zones towards the outer side of the trough, as shown in Figure 2.2.
The splitters are position at different locations on the through for collection of different
streams (concentrate, middlings and tails)
17
Figure 2.2: Diagram showing spiral operation (Alibaba.com, 1999-2016)
The challenges of spirals concentrators have made industrial application of this process
not fully utilized, though significant progress in the modelling of spiral concentrator
has been made during the last decades (Vermaak, et al., 2008). These challenges include
difficulty of splitter position adjustment to accommodate changes in feed parameters,
low throughput (thus requiring large banks of spirals and large footprints), and large
recycles due inefficiencies (Ramsaywok, et al., 2010).
2.1.2 Magnetic Separation method
This method uses magnetic intensity to separate paramagnetic minerals from diamagnetic
minerals. The paramagnetic materials are those materials attracted along the lines of the
magnetic field force to the point of greater magnetic field intensity. While diamagnetic
materials are those repelled from the regions of greater field intensity along the magnetic field
force lines to points of smaller magnetic field intensity (Jain, 1985). Figure 2.3 shows a
powdered ore consisting of paramagnetic and ferromagnetic minerals being separated using
magnetic rollers. The more magnetic susceptible mineral will stick to the roller until magnet is
disable then it will fall off, while the less/none magnetic mineral will not stick to the roll hence
drop off earlier.
Figure 2.3: Magnetic separation operation (Tutorvista, 2016).
The magnetic response property of a target material to a magnetic field is therefore the
determining factor in the efficiency of this process. The diamagnetic materials are concentrated
using high intensity magnetic separators, while low intensity magnetic separators are used for
paramagnetic minerals since these are greatly attracted to the magnetic force (Wills, 2006). The
18
other factors influencing separation is particle size, specific gravity of particles and freedom of
movement of particles relative to moving stream (Jain, 1985). Magnetic separation is said to
produce concentrates of superior physical nature for the blast furnace and achieves fairly
complete recovery of iron, however, capital costs are high. Magnetic separators have lower
capacity when compared to flotation method. Dworzanowski (2012) stated that recovery of
fine iron ore by magnetic separation decreases with decreasing particle size because the
magnetic susceptibility of magnetic particles decreases with a decrease in particle mass. Iron
ore with low magnetic susceptible product (e.g. hematite) would require de-sliming while high
magnetic affinity product (magnetite) would not require de-sliming. This is due to the fact that
magnetic susceptibility of magnetite is on average 100 times greater than that of haematite for
an equivalent mass of particle and that magnetite is ferromagnetic which means the mechanism
of magnetic flocculation will apply (Dworzanowski, 2012).
Umadevi, et al. (2013) investigated the use of hydrocyclone, wet high intensity magnetic
separator (WHIMS) and reverse flotation to concentrate low grade iron ore (≤50% Fe) slimes
of d80= <45µm. The findings revealed that gravity separation was unable to provide the
required high grade concentrate possibly due to fine texture of the feed. WHIMS method was
able to provide the high grade concentrate at reduced recovery and reverse flotation achieved
high Fe recovery at lower grade.
Filippov, et al. (2014) recommended wet low-intensity for separation of magnetite and WHIMS
as the best methods to process hematite ores with a high iron content, high liberation degree of
iron oxide and where quartz is the major gangue mineral. Generally, gravity and magnetic
separation methods are restricted to coarse grain size particles (Tripathy, et al., 2013). Rao, et
al. (2009) recommend use of magnetic separation for magnetite/hematite ore that is not too fine
and recommended flotation for ores that contain fine grains.
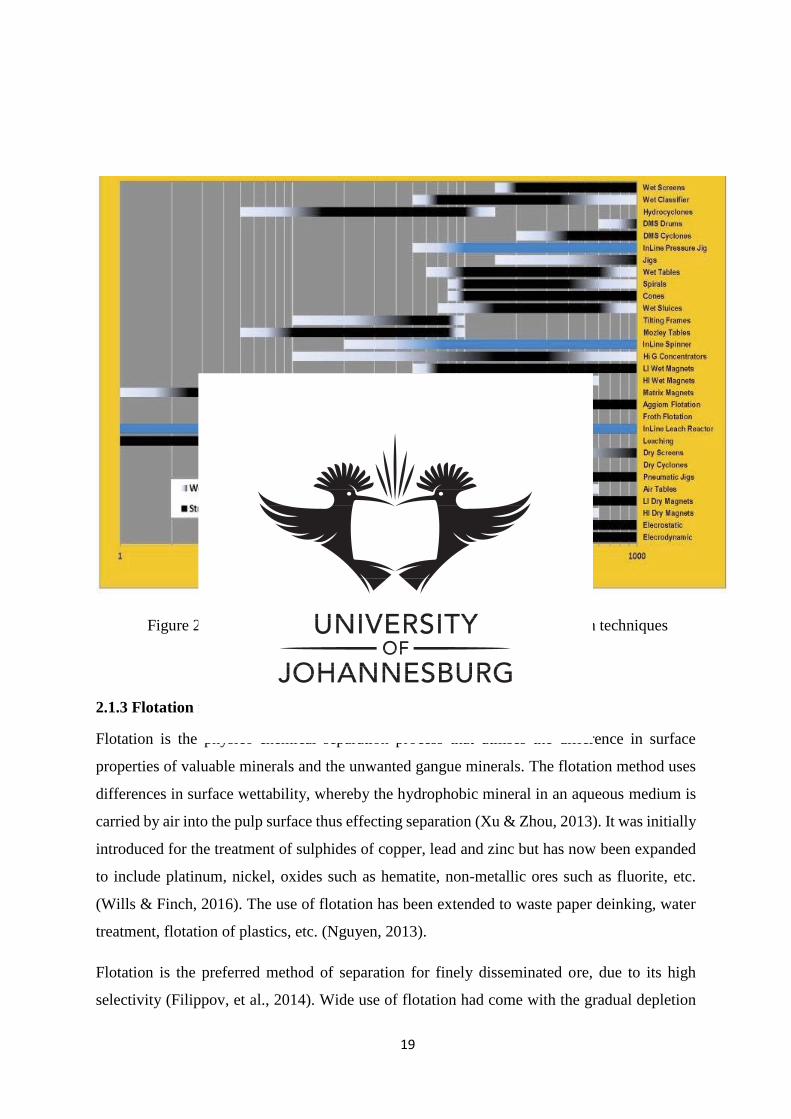
Figure 2.4 shows a guideline to the separation method recommended for a particular range of
particle size. It is reflected that froth flotation is applicable for particle as fine as 5µm, whereas
high intensity magnetic separation and gravity separation require minimum particle size of
20µm and 80µm respectively. This graph further shows that separation process efficiency
generally increases with coarse particles, where in the lighter shade means the process is not
as efficient in that size range and the darker shade reflects size ranges where the process
performs well.
19
Figure 2.4: Effective particle size range for various mineral separation techniques
(Gekko, n.d.)
2.1.3 Flotation method
Flotation is the physico-chemical separation process that utilises the difference in surface
properties of valuable minerals and the unwanted gangue minerals. The flotation method uses
differences in surface wettability, whereby the hydrophobic mineral in an aqueous medium is
carried by air into the pulp surface thus effecting separation (Xu & Zhou, 2013). It was initially
introduced for the treatment of sulphides of copper, lead and zinc but has now been expanded
to include platinum, nickel, oxides such as hematite, non-metallic ores such as fluorite, etc.
(Wills & Finch, 2016). The use of flotation has been extended to waste paper deinking, water
treatment, flotation of plastics, etc. (Nguyen, 2013).
Flotation is the preferred method of separation for finely disseminated ore, due to its high
selectivity (Filippov, et al., 2014). Wide use of flotation had come with the gradual depletion

20
of high grade ore bodies internationally, which has resulted in a need to grind ores into finer
size (<149µm) in order to enable improved liberation of valuable mineral (Araujo, et al., 2005).
Wide use of flotation has also come with increased processing of tailings as industries attempt
to increase company revenue and lower environmental risks associated with heavy metals
disposal (Wei, et al., 2015). Flotation is the recommended separation method for concentration
of low grade iron ores (Kumar, et al., 2010). The general flotation routes for iron oxides are
direct anionic flotation, reverse cationic flotation and reverse anionic flotation. Some work has
been done on these flotation routes (Quast, 2005; Filippov, et al., 2014; Ma, et al., 2011).
Recent development on flotation is concentration of iron oxide minerals using column flotation.
(Lin, et al., 2009; Preas, et al., 2013).
2.2 Principles of froth flotation
Froth flotation is a recommended separation method for upgrading low grade iron oxide due to
its high selectivity and therefore ability to produce super concentrates (Filippov, et al., 2014).
Separation of solid particles is achieved using differences in their affinity for air bubbles in an
aqueous solution (Parrent, 2012). Figure 2.5 shows a schematic diagram of the conventional
froth flotation cell.
Figure 2.5: Conventional flotation cell (Trade Channel, 2014)
The flotation feed is crushed to an optimum size (10-250µm) that allows for sufficient
liberation of valuable mineral from gangue (Filippov, et al., 2014). The feed is mixed with
21
water where the solids content is typically 20-40%, though solid content of up to 55% have
also been reported (Wills, 2006). The pulp is introduced into the flotation cell and agitated at a
specific speed for specific time while stage wise addition of flotation reagents is done. Reagents
are added to effect apparent difference in surface properties for effective separation to occur.
After the condition period has lapsed, air is introduced into the cell to start flotation. Small
bubbles used in froth flotation produce very high specific area per unit volume of the gas-liquid
interface for particles attachment, which makes flotation the most efficient technique for
separation of especially low grade ores of fine texture (Nguyen, 2013).
The valuable hydrophobic mineral attaches to the bubble upon contact and is carried into the
froth phase where it is collected as “concentrate”. The froth layer contains inter-bubble water,
hydrophobic particles and a small fraction of hydrophilic particles which get into froth by
entrainment. The gangue mineral, being hydrophilic, is left in solution and is discharged as
“tailings” at the bottom of the cell. This is termed direct flotation, where the valuable mineral
is in the floats. Reverse flotation is when the valuable mineral is collected in sinks and is
recommended when the amount of valuables exceeds that of gangue which is prevalent in iron
oxides ores (Wills & Finch, 2016).
The theory of froth flotation is complex as it involves three phases viz; solids, liquid and gas.
The process of recovering material from pulp by flotation comprises three mechanisms, viz:
(a) Selective attachment of target solids to air bubbles (or true flotation)
(b) Entrainment of solids in the water which passes through the froth
(c) Physical entrainment of solids between particles in the froth attached to air bubbles.
2.2.1 Selective attachment of mineral to the bubble
Selective attachment of target solids to air bubbles is the most important and dominant
mechanism in flotation. Both valuable and gangue mineral can be transported to the froth area
by entrainment and entrapment thus these mechanisms are not selective (Wills, 2006). The
ability of a mineral surface to displace water and attach to air bubble is described by the contact
angle, as shown in Figure 2.6.
22
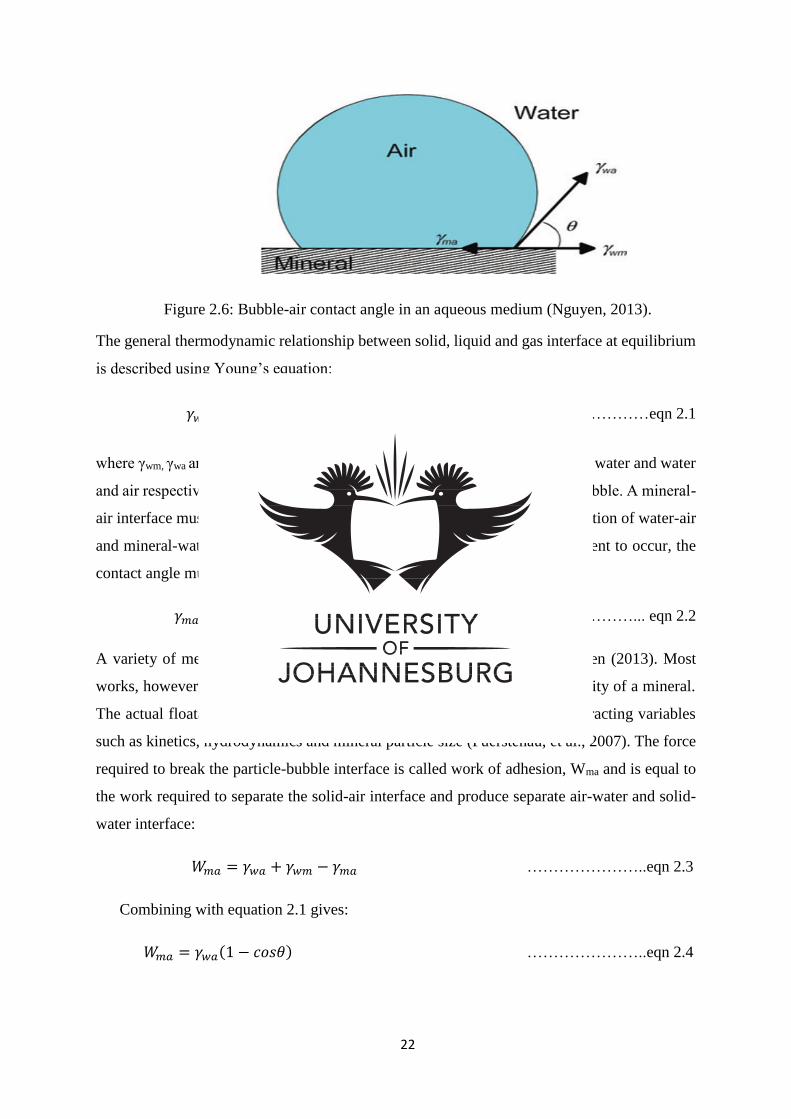
Figure 2.6: Bubble-air contact angle in an aqueous medium (Nguyen, 2013).
The general thermodynamic relationship between solid, liquid and gas interface at equilibrium
is described using Young’s equation:
𝛾𝑤𝑚 + 𝛾𝑤𝑎𝑐𝑜𝑠𝜃 = 𝛾𝑚𝑎 ∴ cosθ =𝛾𝑤𝑚−𝛾𝑚𝑎
𝛾𝑤𝑎 ……………eqn 2.1
where γwm, γwa and γma are the surface energies between solid and air, solid and water and water
and air respectively, and θ is the contact angle between mineral surface and bubble. A mineral-
air interface must be created, for flotation to occur, with simultaneous destruction of water-air
and mineral-water interfaces of equal area. Thus for bubble-mineral attachment to occur, the
contact angle must be finite and equation 2.1 gives
𝛾𝑚𝑎 − 𝛾𝑤𝑚 ≤ 𝛾𝑤𝑎 ……………... eqn 2.2
A variety of methods used to measure contact angle are explained in Nguyen (2013). Most
works, however, agree that contact angle does not fully describe the floatability of a mineral.
The actual floatation of mineral particles depends on a large number of interacting variables
such as kinetics, hydrodynamics and mineral particle size (Fuerstenau, et al., 2007). The force
required to break the particle-bubble interface is called work of adhesion, Wma and is equal to
the work required to separate the solid-air interface and produce separate air-water and solid-
water interface:
𝑊𝑚𝑎 = 𝛾𝑤𝑎 + 𝛾𝑤𝑚 − 𝛾𝑚𝑎 …………………..eqn 2.3
Combining with equation 2.1 gives:
𝑊𝑚𝑎 = 𝛾𝑤𝑎(1 − 𝑐𝑜𝑠𝜃) …………………..eqn 2.4
23
It is seen that the greater the contact angle the greater is the work of adhesion between particle
and bubble and the more resilient the system is towards disruptive forces. The hydrophobicity
of a mineral therefore increases with the contact angle (Wills, 2006).
2.2.2 Hydrophobicity created by addition of flotation reagents
Flotation reagents are added into the system to effect selectivity of the process by adsorbing on
the mineral surface thus modifying/intensifying the surface properties of a target mineral,
making valuable mineral more hydrophobic or hydrophilic (Xu & Zhou, 2013). Reagents are
also added to stabilise the froth phase so it retains the targeted mineral until it is collected thus
minimizing mineral detachment. Reagents used in flotation can be classified into the following
four categories:
Depressants: They are those reagents that increase selectivity of flotation by rendering
certain mineral hydrophilic thus preventing their flotation. Starch is the mostly used
depressant for iron oxides due to its wide availability as it can be extracted from several
vegetables such as corn, potato, wheat, cassava (Araujo, et al., 2005). Turrer & Peres (2010)
suggested that the depressant action of starch on iron oxide is due to coating of a natural
low energy hydrophilic surface with a hydrophobic film thus preventing attachment of air
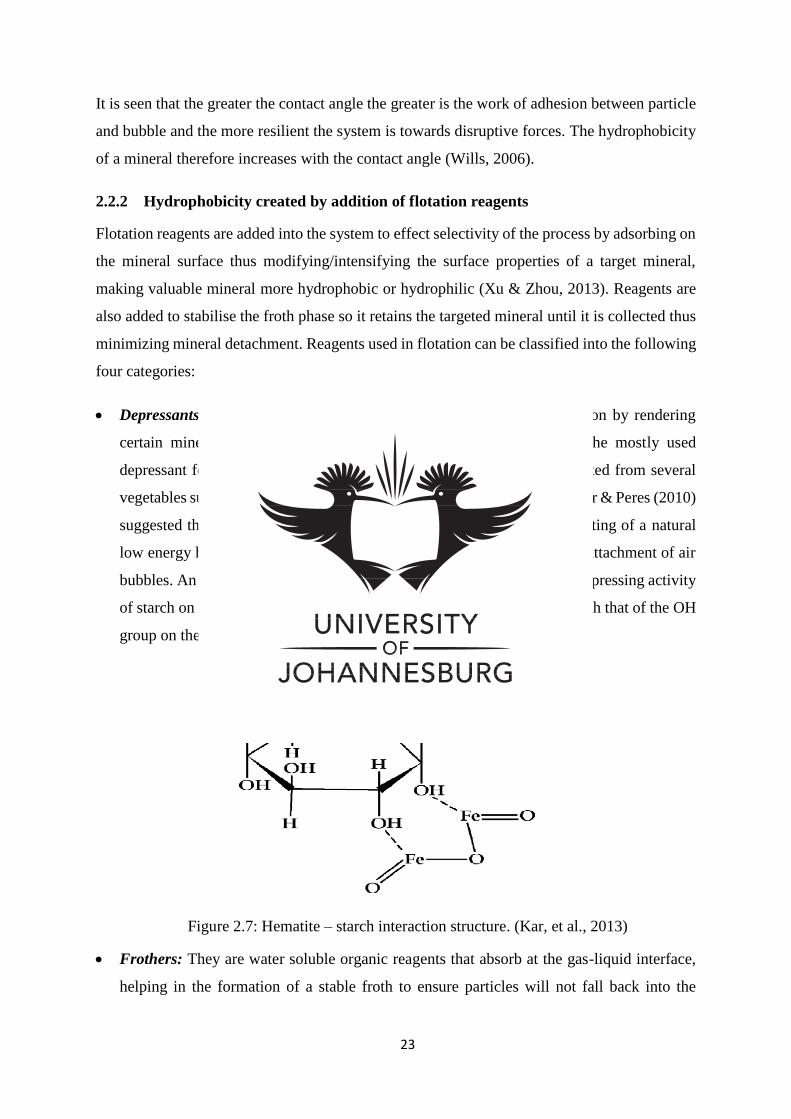
bubbles. An investigation conducted by Kar, et al. (2013) indicated that depressing activity
of starch on hematite is due to interaction of hydroxyl groups of starch with that of the OH
group on the hematite surface as per Figure 2.7.
Figure 2.7: Hematite – starch interaction structure. (Kar, et al., 2013)
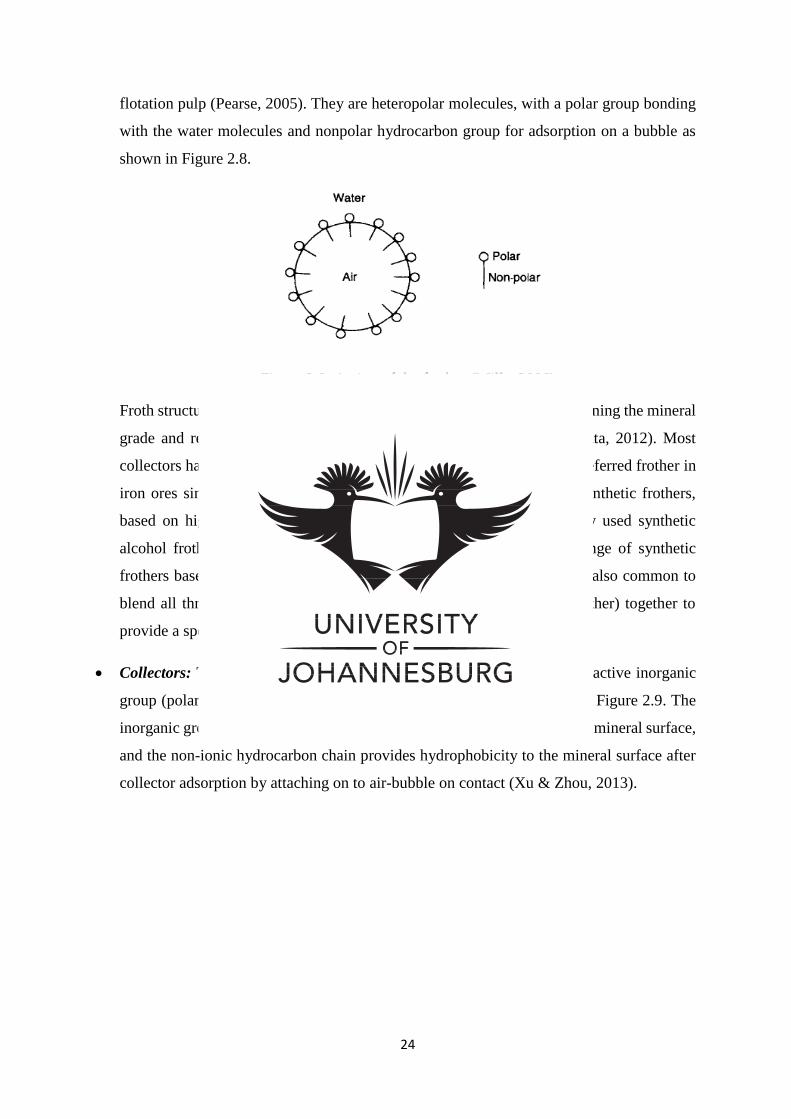
Frothers: They are water soluble organic reagents that absorb at the gas-liquid interface,
helping in the formation of a stable froth to ensure particles will not fall back into the
24
flotation pulp (Pearse, 2005). They are heteropolar molecules, with a polar group bonding
with the water molecules and nonpolar hydrocarbon group for adsorption on a bubble as
shown in Figure 2.8.
Figure 2.8: Action of the frother (Wills, 2006)
Froth structure and stability are known to play a significant role in determining the mineral
grade and recovery achieved from froth flotation (Farrokhpay, 2011; Ata, 2012). Most
collectors have frothing power. Alcohols are the most widely used and preferred frother in
iron ores since they display no collector properties. A wide range of synthetic frothers,
based on high molecular weight alcohols, are used in plants. A widely used synthetic
alcohol frother is methyl isobutyl carbinol (MIBC), however, other range of synthetic
frothers based on polyglycol ethers have been found very effective. It is also common to
blend all three chemical groups (alcohols, polyglycols and polyglycol ether) together to
provide a specific frother for a particular flotation circuit. (Araujo, 2005)
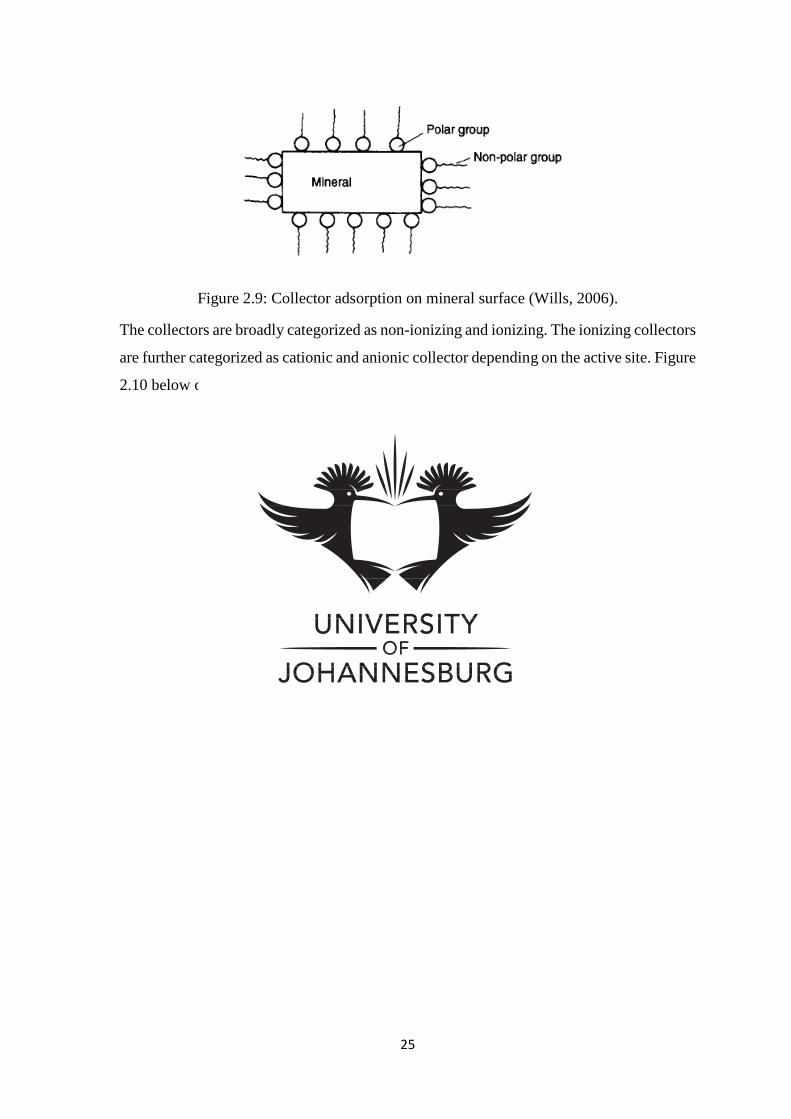
Collectors: These are heterogeneous organic compounds that contain an active inorganic
group (polar) coupled with a hydrocarbon chain (non-polar), as shown in Figure 2.9. The
inorganic group is the portion of the collector molecule that adsorbs on the mineral surface,
and the non-ionic hydrocarbon chain provides hydrophobicity to the mineral surface after
collector adsorption by attaching on to air-bubble on contact (Xu & Zhou, 2013).
25
Figure 2.9: Collector adsorption on mineral surface (Wills, 2006).
The collectors are broadly categorized as non-ionizing and ionizing. The ionizing collectors
are further categorized as cationic and anionic collector depending on the active site. Figure
2.10 below depicts classification of collectors.
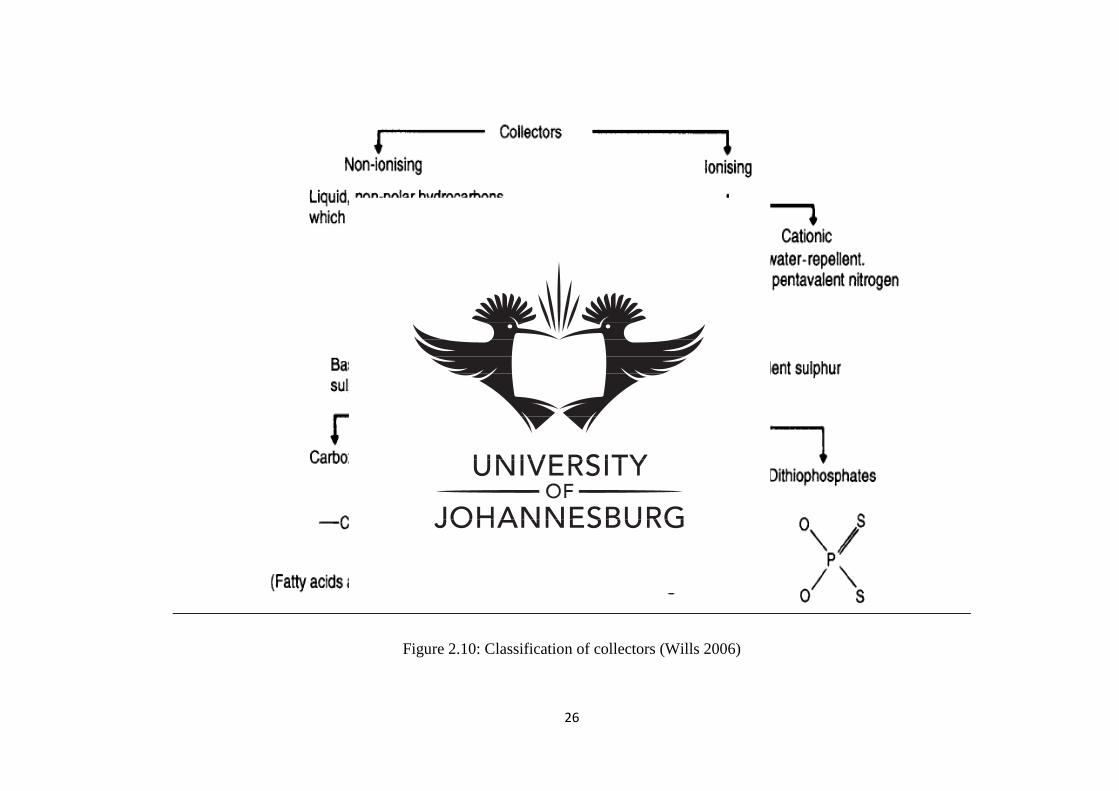
26
Figure 2.10: Classification of collectors (Wills 2006)
27
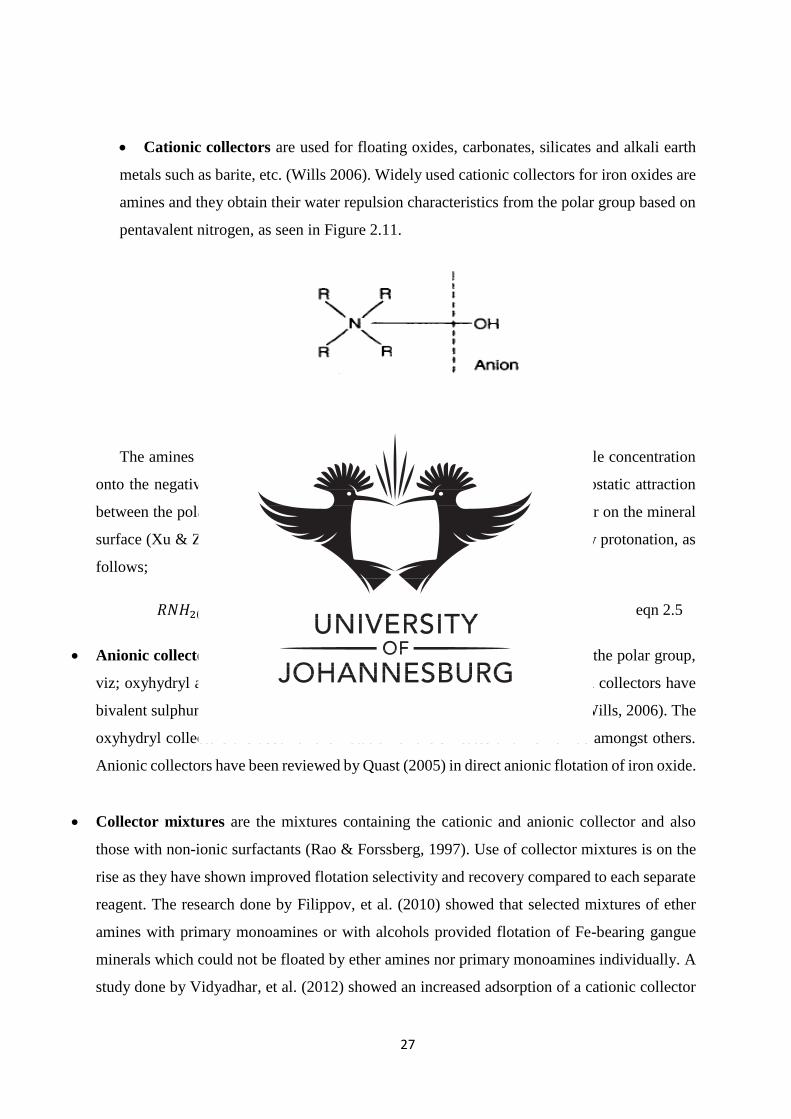
Cationic collectors are used for floating oxides, carbonates, silicates and alkali earth
metals such as barite, etc. (Wills 2006). Widely used cationic collectors for iron oxides are
amines and they obtain their water repulsion characteristics from the polar group based on
pentavalent nitrogen, as seen in Figure 2.11.
Figure 2.11: Cationic amine collectors. (Wills, 2006)
The amines are considered to adsorb from a solution below critical micelle concentration
onto the negatively charged oxide or silicate surface primarily due to electrostatic attraction
between the polar head of the collector and the charged electrical double layer on the mineral
surface (Xu & Zhou, 2013). Cationic collectors ionize in aqueous solution by protonation, as
follows;
𝑅𝑁𝐻2(𝑎𝑞) + 𝐻2𝑂 ↔ 𝑅𝑁𝐻3+ + 𝑂𝐻− eqn 2.5
Anionic collectors are classified into two types according to the structure of the polar group,
viz; oxyhydryl and sulphydryl type, as shown in Figure 2.10. The sulphydryl collectors have
bivalent sulphur as a polar group and are powerful in flotation of sulphides (Wills, 2006). The
oxyhydryl collectors are used for the flotation of the silicates and iron oxide amongst others.
Anionic collectors have been reviewed by Quast (2005) in direct anionic flotation of iron oxide.
Collector mixtures are the mixtures containing the cationic and anionic collector and also
those with non-ionic surfactants (Rao & Forssberg, 1997). Use of collector mixtures is on the
rise as they have shown improved flotation selectivity and recovery compared to each separate
reagent. The research done by Filippov, et al. (2010) showed that selected mixtures of ether
amines with primary monoamines or with alcohols provided flotation of Fe-bearing gangue
minerals which could not be floated by ether amines nor primary monoamines individually. A
study done by Vidyadhar, et al. (2012) showed an increased adsorption of a cationic collector
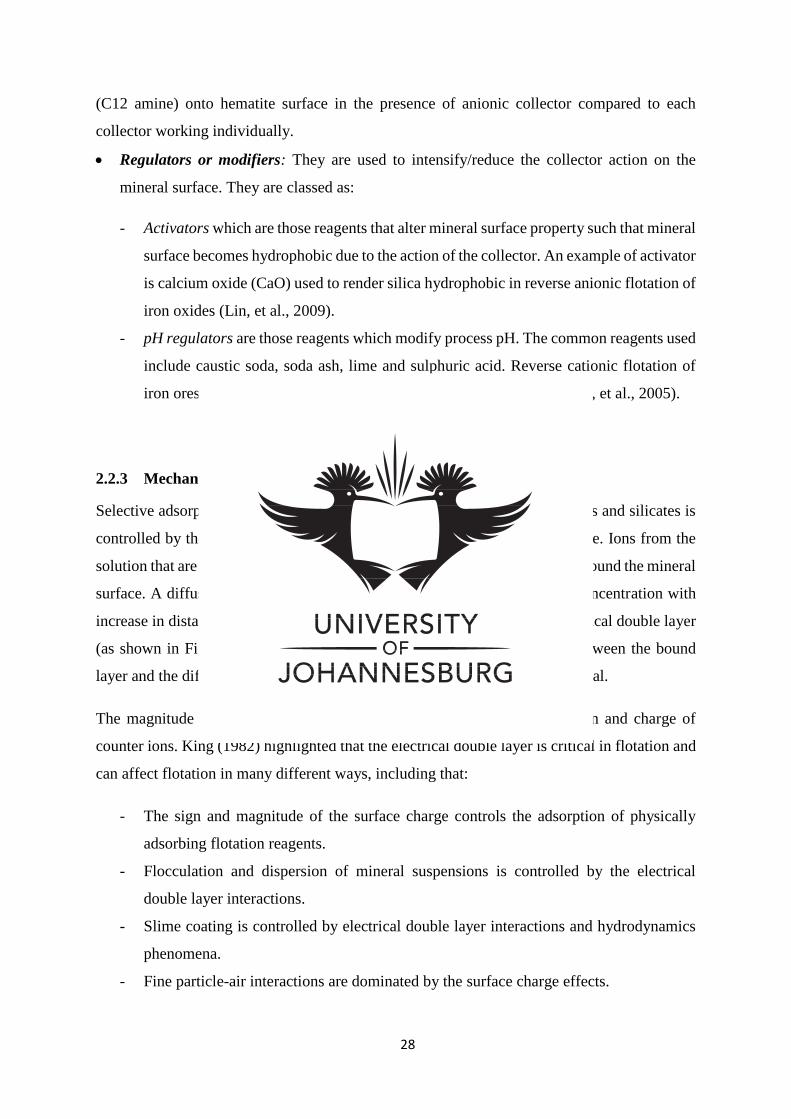
28
(C12 amine) onto hematite surface in the presence of anionic collector compared to each
collector working individually.
Regulators or modifiers: They are used to intensify/reduce the collector action on the
mineral surface. They are classed as:
- Activators which are those reagents that alter mineral surface property such that mineral
surface becomes hydrophobic due to the action of the collector. An example of activator
is calcium oxide (CaO) used to render silica hydrophobic in reverse anionic flotation of
iron oxides (Lin, et al., 2009).
- pH regulators are those reagents which modify process pH. The common reagents used
include caustic soda, soda ash, lime and sulphuric acid. Reverse cationic flotation of
iron ores is usually conducted at basic condition (pH 10-10.5) (Araujo, et al., 2005).
2.2.3 Mechanism of reagent adsorption on oxide mineral surface
Selective adsorption of collector and modifying reagents in flotation of oxides and silicates is
controlled by the electrical double layer at the mineral-water interface surface. Ions from the
solution that are oppositely charged will be attracted and form a bound layer around the mineral
surface. A diffuse layer of counter ions is also formed and it decreases in concentration with
increase in distance (Carlson, 2010). These layers of ions constitute the electrical double layer
(as shown in Figure 2.12) and each time particle moves there is a shear between the bound
layer and the diffuse layer and that the plane of shear is called the zeta potential.
The magnitude of zeta potential depends on surface potential, concentration and charge of
counter ions. King (1982) highlighted that the electrical double layer is critical in flotation and
can affect flotation in many different ways, including that:
- The sign and magnitude of the surface charge controls the adsorption of physically
adsorbing flotation reagents.
- Flocculation and dispersion of mineral suspensions is controlled by the electrical
double layer interactions.
- Slime coating is controlled by electrical double layer interactions and hydrodynamics
phenomena.
- Fine particle-air interactions are dominated by the surface charge effects.
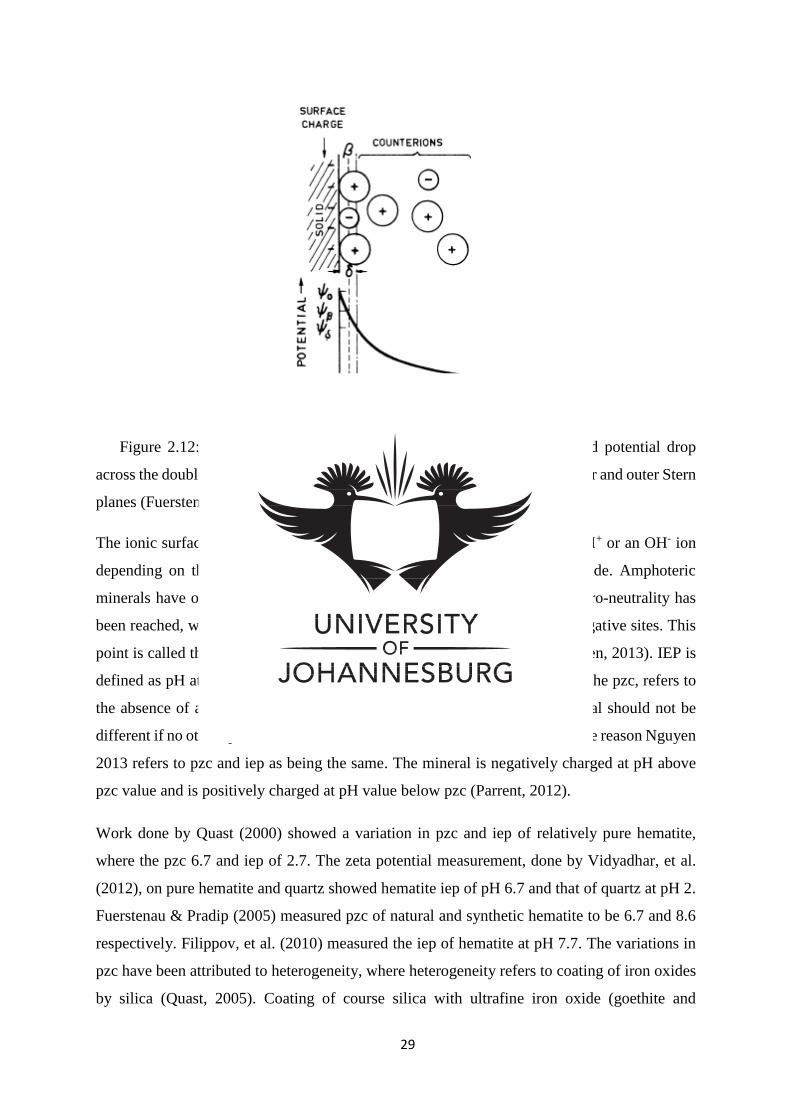
29
Figure 2.12: Schematic representation of the electrical double layer and potential drop
across the double layer at a solid-water interface. The planes represent the inner and outer Stern
planes (Fuerstenau & Pradip, 2005)
The ionic surfaces of oxide minerals are amphoteric and can take up either H+ or an OH- ion
depending on the pH, which will determine the surface charge on the oxide. Amphoteric
minerals have one particular pH at which the potential is zero because electro-neutrality has
been reached, which means the density of positive sites is equal to that of negative sites. This
point is called the point of zero charge (pzc) or iso-electric point (iep) (Nguyen, 2013). IEP is
defined as pH at which particles carries neutral net surface charge. Whereas the pzc, refers to
the absence of any type of charge. Ideally pzc and iep of the specific mineral should not be
different if no other species has been adsorbed on the mineral surface, hence the reason Nguyen
2013 refers to pzc and iep as being the same. The mineral is negatively charged at pH above
pzc value and is positively charged at pH value below pzc (Parrent, 2012).
Work done by Quast (2000) showed a variation in pzc and iep of relatively pure hematite,
where the pzc 6.7 and iep of 2.7. The zeta potential measurement, done by Vidyadhar, et al.
(2012), on pure hematite and quartz showed hematite iep of pH 6.7 and that of quartz at pH 2.
Fuerstenau & Pradip (2005) measured pzc of natural and synthetic hematite to be 6.7 and 8.6
respectively. Filippov, et al. (2010) measured the iep of hematite at pH 7.7. The variations in
pzc have been attributed to heterogeneity, where heterogeneity refers to coating of iron oxides
by silica (Quast, 2005). Coating of course silica with ultrafine iron oxide (goethite and
30
hematite) was investigated by Rusch, et al. (2010) and it was observed that surface reactivity
and pzc value were modified by presence of such coatings. Typical approximate pH ranges of
the pzc of silica and hematite are pH 2-3 and pH 5-8 respectively (Nguyen, 2013).
2.3 Important factors affecting flotation
2.3.1 pH modifiers
These reagents are critical but yet their role is complex (Wills, 2006). In non-sulfide mineral
flotation, the importance of pH is that hydroxyl and hydrogen ions modify the electrical double
layer and zeta potential surrounding the mineral particle hence the hydration of the mineral
surface and their floatability is affected. The variation of pH therefore affects the sign and the
magnitude of charge of oxide. Flotation is often carried out under alkaline conditions since
most collectors are stable under these conditions and metal corrosion is minimised. Sodium
hydroxide is used in iron ore flotation, as a pH modifier, to limit effects of calcium (Wills &
Finch, 2016).
Ma, et al. (2009) reported that cationic flotation of silica and iron oxides is stronger at alkaline
medium, due to surface charge growing more negative as pH increases. The importance of pH
is also demonstrated by work done by Ma, et al. (2011), which showed that reverse anionic
flotation is less sensitive to the presence of fines when compared to reverse cationic flotation.
This was shown by better recoveries of Fe observed in the ultrafine range of <10µm when
using reverse anionic flotation. Reverse anionic flotation is typically conducted at pH 11.5,
which makes hematite and quartz ultrafine particles highly negatively charged and repelling
each other thus preventing heterogeneity. Unlike in reverse cationic flotation conducted at pH
10.5, where the hematite surface is only slightly negatively charged since its pzc is around pH
8 (Ma, et al., 2011).
2.3.2 Collector type and dosage
The choice of collector is determined by the mineral surface charge, collector’s ability to
dissolve in water and its hydrocarbon chain length and structure (Filippov, et al., 2014). Quast
(2006) investigated the use of C6-C18 saturated fatty acids in hematite direct anionic flotation.
It was discovered that the gradation increases with increase in collector carbon chain length,
however, reduced solubility of longer carbon chain fatty acid make these reagents ineffective
31
as flotation reagents. Filippov, et al. (2014) reported that flotation of silicates from iron ores is
mainly conducted using amines with hydrocarbon chain length of C10-C16. The hydrocarbon
chain length of a collector is important because the chain to chain association enhances the
adsorption once the surfactant ions aggregate to form hemi-micelles at the surface (Fuerstenau
& Pradip, 2005).
The collector dosage is important for flotation as an increase in collector dosage will increase
the process selectivity until a point when the recovery will plummet as the collector starts
precipitating out of solution (Wen-gang, et al., 2009). Another cause of poor recoveries at
excessive collector concentrations is the formation of a surfactant hemi-micelles on the mineral
surface thus reducing the proportion of hydrocarbon radicals oriented into the bulk solution
(Wills, 2006; Fuerstenau, et al., 2007).
2.3.3 The particle size
The mineral particle size plays a critical role in flotation. Particle recovery by true flotation
involves collision, attachment and formation of a stable attachment to bubbles. Flotation
behaviour of particles is therefore driven by hydrodynamic conditions and chemical
environment and the behaviour of the froth zone (Nyambayo, 2014). Fine particles have
insufficient inertia to cross the streamlines around the coursing bubble thus lead to decreased
rate of flotation hence lowered recovery. Increased exposure of the fine particles to bubbles
will however favour flotation of fine particles. This can be achieved by increasing air or
increasing impeller speed (Wills, 2016). High presence of fines (<20µm) reduces selectivity of
the flotation process as they tend to agglomerate on the target mineral thus altering surface
properties. Too fine particles also tend to increase reagent consumption due to increased
adsorption area (Ma, et al., 2011)
On the other hand, coarse particles may signal reduced liberation of the targeted mineral. The
mineral size must be sufficient to allow for bubbles to lift the weight of the mineral until
mineral is collected in the froth phase. Some strategies have been implemented to
accommodate the different needs of fine and coarse particles, e.g. low collector concentration
at the head of the bank is sufficient for the fast floating intermediate size particles followed by
further collector dosage down the bank to recover the slow floating coarse particles (Wills,
2016). Typical recovery trend as a function of particle size is given in Figure 2.13.
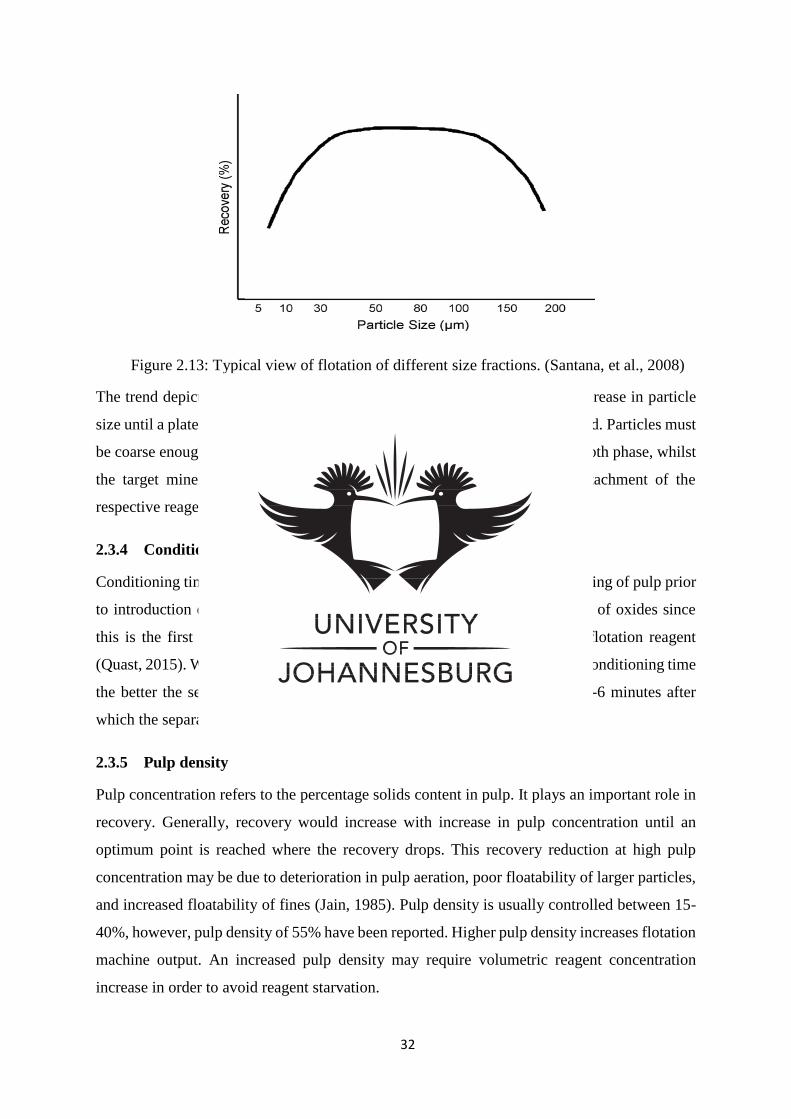
32
Figure 2.13: Typical view of flotation of different size fractions. (Santana, et al., 2008)
The trend depicted in Figure 2.13 shows that the recovery increases with increase in particle
size until a plateau is reached after which a sudden drop in recovery is observed. Particles must
be coarse enough to allow for bubble to lift the weight of the particle to the froth phase, whilst
the target mineral must be liberated sufficiently to allow for selective attachment of the
respective reagents onto the mineral surface (Santana, et al., 2008).
2.3.4 Conditioning time
Conditioning time refers to the time allocated for addition of reagents and stirring of pulp prior
to introduction of air. Conditioning time has a significant effect on flotation of oxides since
this is the first point of interaction between the targeted minerals and the flotation reagent
(Quast, 2015). Work done by Molwa, et al. (2008) showed that the longer the conditioning time
the better the separation efficiency of hematite until an optimum point of 5-6 minutes after
which the separation efficiency plummets.
2.3.5 Pulp density
Pulp concentration refers to the percentage solids content in pulp. It plays an important role in
recovery. Generally, recovery would increase with increase in pulp concentration until an
optimum point is reached where the recovery drops. This recovery reduction at high pulp
concentration may be due to deterioration in pulp aeration, poor floatability of larger particles,
and increased floatability of fines (Jain, 1985). Pulp density is usually controlled between 15-
40%, however, pulp density of 55% have been reported. Higher pulp density increases flotation
machine output. An increased pulp density may require volumetric reagent concentration
increase in order to avoid reagent starvation.
33
2.4 Flotation routes for iron oxides
The three flotation routes for iron ores are direct anionic flotation, reverse anionic flotation and
reverse cationic flotation.
2.4.1 Direct anionic flotation
Direct flotation achieves separation of iron from gangue by floating iron oxide using anionic
collectors such as fatty acids, hydroxamates and petroleum sulphonates. Direct flotation
method is generally used for processing ores with vast amount of quartz, such as those in
tailings (Quast, 2005). The use of direct flotation of iron oxides is still attractive in processing
of low grade ores, and also in the recovery of material stored in tailings which contain vast
amounts of quartz (Ma, et al., 2012). However, several laboratory investigations show that use
of direct anionic flotation yields concentrates with high silica content (Araujo, et al., 2005).
The challenges of direct flotation include its negative impact on the wettability of the iron
during agglomeration process (Ivesona, et al., 2004).
2.4.2 Reverse anionic flotation
Reverse anionic flotation concentrates the iron mineral by first activating quartz with the use
of lime, and then floating the quartz using mostly anionic fatty acids as collectors. Calcium
oxide is added to activate quartz via ionization of CaO in water into Ca2+ and H+ ions, whereby
Ca2+ will react with quartz at pH>11 (Lin, et al., 2009). NaOH is used to adjust the pH value
of pulp, change surface potential of mineral and to provide stable conditions for other reagents.
Starch is adsorbed on the surface of the iron mineral and is used as a depressant for iron mineral.
The advantages of reverse anionic flotation in comparison with reverse cationic flotation
include its lower sensitivity to the presence of slimes (<10µm) and lower reagent costs since
fatty acids are the main component from waste paper (Ma, et al., 2011). However, despite the
success of reverse anionic flotation of iron ore in China, reverse cationic flotation remains the
most popular flotation route used in the iron ore industry (Ma, 2012). Vidyadhar, et al. (2012)
found quartz not responding to flotation with anionic collectors and that its response to C12
amine was observed to be pH and collector concentration dependent.

34
2.4.3 Reverse cationic flotation
Reverse cationic flotation refers to concentration of iron oxide by floating the gangue mineral
(SiO2 in this case) using cationic collector and depressing the valuable mineral (Fe-oxide in
this case) thus recovering the iron oxide in the sinks. Reverse cationic flotation of low grade
iron oxide is normally conducted at pH 10-10.5 (Ma, et al., 2011). Polymeric depressant mainly
such as starch is used to depress the iron oxide mineral and cationic collectors such as amines
adsorb on the negatively charged quartz. Starch absorbs extensively on hematite and has lower
affinity for quartz at higher pH, while the amine adsorbs strongly on quartz than on hematite
(Pavlovic & Brandao, 2003). Research show that there are numerous alternative depressants
used in hematite separation. These include humic acid as a better depressant for hematite, when
compared to starch, in the presence of dodecylamine (DDA) collector (Santos & Oliveira,
2007). Research done by Kar (2013) on usage of corn starch, potato starch, rice starch and
soluble starch as depressants indicated that all starches are good depressants for hematite,
however, quartz was better floated in the presence soluble starch and DDA collector.
Various amines are used as cationic collectors during reverse flotation of iron oxides. Amines
are alky-derivatives of ammonia (NH3). Primary amines are those where one hydrogen atom is
replaced by the alkyl group and tertiary amines are those where all three hydrogen atoms are
replaced by alkyl groups, which enables higher molecular weight in tertiary amines. Primary
amines are said to have higher basicity than tertiary amines and are said to form hydrogen
bonds easier and are more stable than tertiary amines when dissolved in water (Matthews,
1992). Hydrolysed reagents are the most efficient cationic collectors as they present both ionic
and molecular species in the aqueous phase where this is will depend on system pH (Filippov
et al., 2014). However, solubility of amines in water is reduced with increased length of the
carbon chain.
Use of DDA in reverse cationic flotation of iron oxides has produced reputable results and is
well published however has a challenge of low solubility (Kar, et al., 2013; Ma, et al., 2012).
In early years the primary amines such as DDA were used as quartz collectors, however due to
their low solubility in pulp they were replaced by the more soluble ether amines (Ma, et al.,
2012). The insertion of a hydrophilic group in ethers improves solubility thus facilitating access
to solid-liquid and liquid-gas interfaces and also enhances the elasticity of the liquid film
around the bubbles (Araujo, et al., 2005). Quaternary ammonium salts have in recent years
been reported to be more selective than primary amines. Filippov, et al. (2010) compared
35
primary monoamine (DDA) with an ether diamine and observed that ether diamine is a stronger
collector for quartz than the primary monoamine. However, the amines are generally costly
compared to fatty acids used in anionic flotation. Yuhua & Jianweig, (2005) conducted an
investigation using combined quaternary ammonium salt for flotation of quartz and observed
that it was a better collector for quartz in iron ore separation when compared to primary amines.
Research done by Filippov, et al. (2014) showed that reverse cationic flotation of iron ores is
the best separation method when compared to anionic flotation due to higher process selectivity
and flotation rate as well as satisfactory results when hard water is used. The work done by Ma,
et al. (2011) showed that the reverse cationic flotation is sensitive to the presence of ultrafine
particles (<10µm) while its performance was slightly better than reverse anionic flotation at
coarse particle range (>210µm). Reverse anionic flotation is conducted at pH 11 where both
hematite and quartz are highly negatively charged thus the fines having sufficient repulsion to
prevent hetero-coagulation (Wills & Finch, 2016). The importance of de-sliming fines <20µm
was emphasized by Fillipov, et al. (2014), however, it led to hematite loss of 7.6-16.6%. Lima,
et al. (2013) recommended that the reverse cationic flotation feed particle size must range
between 10-150µm, the slimes (<10µm) to be removed and the top size limited to 5-10%
>150µm as wide range of particle size impairs process selectivity. The impaired selectivity
may be due to differences in hydrophobicity, specific surface area and weight.
Flotation rate is significantly faster in reverse cationic flotation than reverse anionic flotation
(Ma, et al., 2011). Reverse cationic flotation has also been investigated by Peres & Mapa (2008)
who suggested that reverse cationic flotation is critical for producing pellets feed fines at all
iron ore processing plants in Brazil.
2.5 Design of experiments – Taguchi Method
Due to multiple parameters influencing flotation, it is difficult to study all possible
combinations of factors as it would lead to uneconomically lengthy experiments and high
consumption of resources (Bendell, et al., 1989). Design of experiments (DOE) is a statistical
approach that attempts to provide a predictive knowledge of a complex, multi-variable process
with few trials (Athreya & Venkatesh, 2012). There are various DOE methods available such
as full factorial design, fractional factorial design and Taguchi method. The minimum number
of observations (N) required for the above-mentioned DOE methods is given by equations 2.5-
2.7:
36
Full factorial doe, N = lk ……………….eqn 2.5
Fractional factorial doe, N = lk-p ……………….eqn 2.6
Taguchi doe, N = 1+k(l-1) ………………..eqn 2.7
Where l is the number of levels, k is the number of parameters and p is the number of generators.
Unlike full factorial design which tests all possible combinations, the fractional factorial design
tests a fraction of the full factorial design. The Taguchi DOE method test a fraction of the
fractional factorial design by testing pairs of combinations using orthogonal arrays to organize
the parameters affecting the process and the levels at which they are varied (Athreya &
Venkatesh, 2012). The Taguchi therefore allows for a small number of observation required to
find the main factors effects on output while all the parameters and their levels appear the same
amount of time in the orthogonal matrix. Due to the number of parameters investigated, this
research will study use of Taguchi DOE method for optimisation of the flotation process.
Taguchi is a well-accepted technique founded in 1966 by Genichi Taguchi. This method is
based on Ronald’s Fischer factorial design work, and is widely applied for product design and
process optimization in manufacturing, marketing and engineering sectors worldwide (Altan,
2010; Kumar et al 2015; du Plessis 2007). Taguchi method was used in optimization of nickel
– copper sulphide ore flotation (Masiya & Nheta, 2014). Taguchi method has applications in
various processes such as welding, marketing, etc.
It uses orthogonal arrays to arrange parameters and levels to which they shall be varied such
that it tests pairs of combinations thus allowing for a smaller number of required observations.
(Athreya & Venkatesh, 2012). Taguchi is recommended for processes with intermediate
number of variable (3-50) where there are few interactions between variables and where only
a few variables contribute significantly. The analysis of data is conducted using tools such as
signal-noise ratio (SN ratio) and analysis of variance (ANOVA). Taguchi method uses the
Signal-Noise ratio to show optimum conditions for the desired output response, where the
system is robust (less sensitive to variations). Higher values of the signal-to-noise ratio (SN)
would identify control factor settings that minimize the effects of the noise factors (Sapakal &
Telsang, 2012). The SN ratio is able to also rank the parameter according to relative
significance. ANOVA is a tool used to determine the relative importance of each factor under
investigation (Tofighy & Mohammadi, 2012). It is also used to identify and quantify the errors
resulting from deviations of a set of results (Altan, 2010). A variety of software that can be

37
used for fractional factorial DOE can also be used for computing/analysis of Taguchi DOE
results. These include Minitab 17 and Statistical Package for the Social Science (SPSS).
38
3 CHAPTER 3: METHODOLOGY
This chapter describes the steps followed in characterisation of the tailing sample and
concentration of the valuable mineral found using flotation. These include sample preparation,
sample characterisation analysis procedures and flotation experiments. It further explains the
use of Taguchi DOE method for the selected parameters and levels investigated. Variety of
hazards exist in the laboratory. Specific risk assessment, as in Table 1 of the appendix, was
conducted before commencement of flotation experiments to ensure compliance to safe work
procedures
3.1 Materials
Laboratory testing of a concept prior to implementation on a large scale is critical in mineral
processing industry. Approximately 400kg wet fluorspar tails sample was received from
Vergenoeg Mine in plastic bags. Random bags of wet sample, measuring total of 120kg, were
selected. This sample was oven dried at 70oC, de-lumped, mixed and sub sampled using a
combination of random sampling, cone-quartering and rotary splitting. The sample was dried
at 70oC to ensure that the sample composition is not changed due to loss of organics or
denatured due to high heat.
Batch rougher reverse cationic flotation experiments were conducted on the fluorspar tails
using two amine collectors, 98% pure Dodecylamine (DDA) and 99% Betacol 373. Betacol
373 is composed of a mixture of octa-dodecane, tri-ethoxydecane and di-alkyl ammonium
chloride. The difference between the two amines is that DDA is a primary monoamine and
Betacol 373 is a tertiary amine. The general structures of primary and tertiary amines are shown
in Figure 3.1.
Figure 3.1: Structure of a primary and tertiary amine, respectively (Matthews, 1992)
Though Araujo et al., 2005 recommended the use of ether amines over mono amines, the cost
of ether amines was found to be very high. Preliminary test were conducted to check the
feasibility of the reagents. This included investigating the use of the anionic reagent Betacol
290, dodecyl amine. From the pre-liminary results it was observed that cationic reagent was a
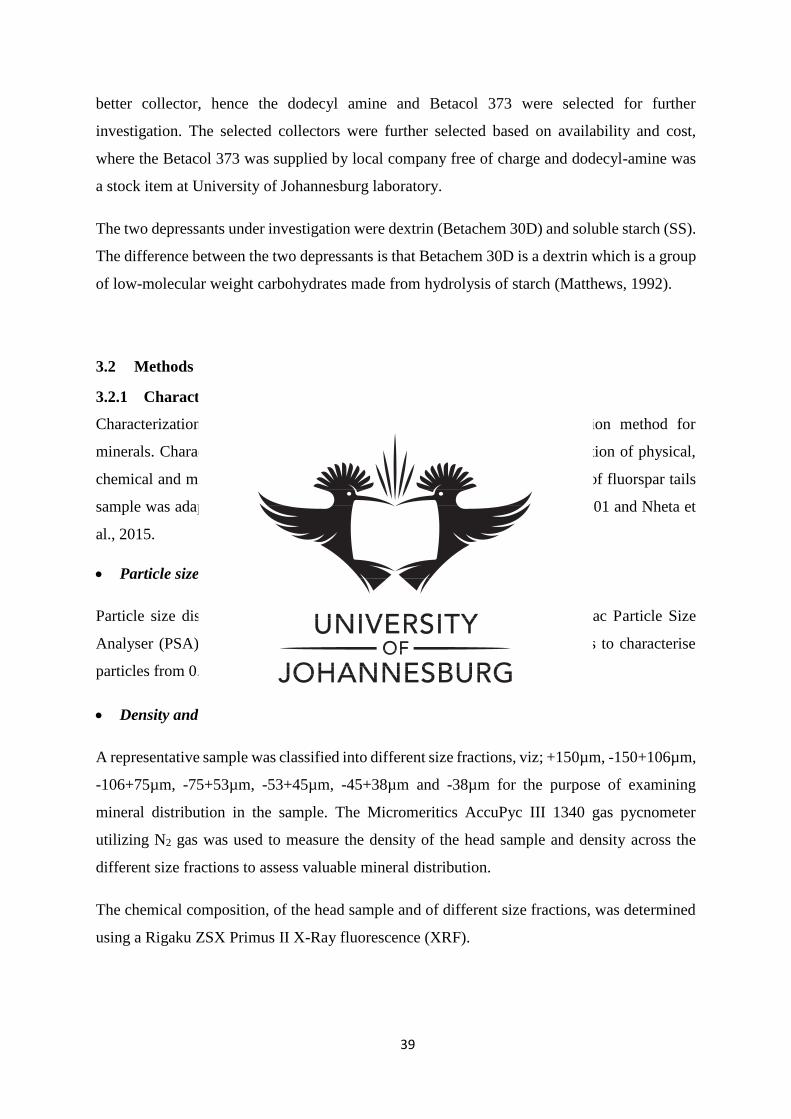
39
better collector, hence the dodecyl amine and Betacol 373 were selected for further
investigation. The selected collectors were further selected based on availability and cost,
where the Betacol 373 was supplied by local company free of charge and dodecyl-amine was
a stock item at University of Johannesburg laboratory.
The two depressants under investigation were dextrin (Betachem 30D) and soluble starch (SS).
The difference between the two depressants is that Betachem 30D is a dextrin which is a group
of low-molecular weight carbohydrates made from hydrolysis of starch (Matthews, 1992).
3.2 Methods
3.2.1 Characterization of fluorspar tails
Characterization results are essential in selection of appropriate separation method for
minerals. Characterisation of fluorspar tails was conducted using a combination of physical,
chemical and mineralogical analysis. The analysis done for characterisation of fluorspar tails
sample was adapted from works of Tripathy et al., 2013; Srivastava et al., 2001 and Nheta et
al., 2015.
Particle size distribution analysis
Particle size distribution in the head sample was determined using Microtrac Particle Size
Analyser (PSA), which makes use of the three precisely placed laser diodes to characterise
particles from 0.02-2800µm.
Density and chemical analysis
A representative sample was classified into different size fractions, viz; +150µm, -150+106µm,
-106+75µm, -75+53µm, -53+45µm, -45+38µm and -38µm for the purpose of examining
mineral distribution in the sample. The Micromeritics AccuPyc III 1340 gas pycnometer
utilizing N2 gas was used to measure the density of the head sample and density across the
different size fractions to assess valuable mineral distribution.
The chemical composition, of the head sample and of different size fractions, was determined
using a Rigaku ZSX Primus II X-Ray fluorescence (XRF).
40
Loss on ignition analysis
The moisture, organic and carbonates content was determined in the head sample using the loss
on ignition (LOI) method published by National Lacustrine Core Facility, 2013. Three 1.7g
sample were placed in weighed crucibles and weighed. The samples were heated at 100oC for
8 hours to remove moisture. The samples were removed from the oven and cooled down in a
desiccator. The samples were heated at 550oC for four hours in a furnace to remove organic
matter. The samples were removed from the furnace, cooled and weighed. The samples were
heated to 1000ºC for two hours to remove carbonates, after which, the samples were cooled in
a desiccator and weighed.
The moisture, organics, carbonates and loss on ignition (LOI) was calculated as follows:
100)(
)()(,% 100
gmassInitial
gmassFinalgmassInitialcontentMoisture
oC
……... eqn 2.8
100)(
)()(,%
100
550100
gmassFinal
gmassFinalgmassFinalcontentOrganics
oC
oCoC
……... eqn 2.9
100)(
)()(,%
550
1000550
gmassFinal
gmassFinalgmassFinalcontentCarbonates
oC
oCoC
……... eqn 2.10
100)(
)()(,% 1000
gmassInitial
gmassFinalgmassInitialignitiononLoss
oC
……... eqn 2.11
Mineral phases analysis
The mineralogical phases present in the sample were determined using the Rigaku Ultima IV
X-ray diffractometer (XRD).
Mineral abundance using QEMSCAN
QEMSCAN was used in combination with x-ray powder diffraction (XRD) and geochemical
analyses to identify and quantify mineralogical characteristics of the tailings. X-Ray diffraction
is only a semi-quantitative technique which identifies crystalline minerals with concentrations
>3mass% in the sample. QEMSCAN BMA was conducted on two traverse-cut polished
sections from the sample in order to quantify their mineral. In addition, QEMSCAN Particle

41
Map Analysis (PMA) was conducted on the polished section with an aim of characterising Fe-
oxides in terms of the Fe-oxide grain size dimension, Fe-oxide liberation, Fe-oxide exposure
and mineral association.
3.2.2 Flotation experiments method
Reverse cationic flotation using rougher stage only was use to concentrate the valuable mineral
(iron). The optimization of the process considered parameters such as collector type and
dosage, depressant type and dosage, pH, solids concentration, conditioning time, agitation
speed, air rate and presence of fines. Taguchi method was employed for planning and
arrangement of experiments. Minitab 17 was used as a software to compute data and analysis
of results using signal-to-noise ratio and ANOVA.
The performance of the flotation test was measured by measuring the iron grade in the
concentrate, calculating metal recovery and metal loss as follows:
𝑀𝑒𝑡𝑎𝑙 𝑟𝑒𝑐𝑜𝑣𝑒𝑟𝑦, 𝑅 = 100Ff
Cc ………………eqn 2.12
RMlossMetal 100, ……………….eqn 2.13
Where C is the concentrates mass in grams, c is the iron assay in the concentrates (mass %), F
is the feed mass in grams and f is iron assay in the feed (mass%). Metal loss refers to metal in
the tails and also miscellaneous losses (e.g. losses due to spillages, washings, materials left in
filter papers, etc). Related measures to grade and recovery include: the ratio of concentration,
the weight recovery/yield, the enrichment ratio and separation efficiency. (Wills & Finch,
2016).
Reagents preparation
De-ionised water was used for reagents preparations. The 98% dodecylamine (DDA) from
Merc was prepared to 1%weight solution, heated to 40oC while mixing and addition of few
drops of hydrochloric acid was done to ensure a dissolved solution. Lumps in the collector
solution lead to uneven distribution of the collector (Araujo et al., 2005). The second cationic
collector used, Betacol 373, was kindly supplied by Betachem in a liquid form hence required
no preparation. Sodium hydroxide was prepared to 5% weight solution and HCl to 5% solution.
The depressants, Soluble Starch (SS) and dextrin Betachem 30D, were prepared to 3% solution.
The dextrin was heated to 40oC while mixing was done to ensure a dissolved solution. The
42
frother, Dowfroth 200 was supplied by Betachem. All reagents were prepared on the day of
experiment.
Flotation equipment description
Flotation was carried out in Laboratory Denver D12 mechanical flotation machine with 2.5lt
cell capacity, shown in Figure 3.2. The Denver D12 machine is fitted with the variable speed
agitator, and air pipe.
Figure 3.2: Denver D12 conventional flotation equipment
Flotation experiment description
A combination of L25, L16, L9 orthogonal arrays and full factorial designs were used
throughout the project depending on the number of parameters and levels to which they were
varied. The flotation procedure followed is depicted in Figure 3.3.

43
Figure 3.3: Flowsheet depicting flotation procedure
The required pulp was prepared in the flotation cell using domestic water, where solid content
was varied from 35-55%. The rotor was started and speed varied between 1200-1400rpm. The
measured depressant was poured into the pulp, whereby soluble starch was varied from 750-
2000g/t and 300-2000g/t Betachem 30D. Pulp pH was measured using Hannah pH meter and
adjusted to the required value, between 4-12, using NaOH/HCl. The collector was then added
and a few drops of frother were then added while agitating for the required conditioning time
of 3-20 minutes. The DDA collector dosage was varied from 200-600g/t, Betacol 373 from
2500-8000g/t and few drops of frother. The pulp level was kept at about 10-15mm below the
froth overflow launder. Collection plate was placed for the collection of froth. After the desired
conditioning time had lapsed the desired air was opened into the cell to create bubbles for
attachment of hydrophobic minerals. Froth was collected into the drip tray using froth paddles
to scrap the froth into the collection plate. Flotation was carried out for 2 minutes after which
the floats and sinks were filtered and oven dried at 70oC. The dried floats and sinks were cooled,
weighed and analysed for oxide content using XRF machine.
3.3 Taguchi Method - Design of experiments
The approach to planning of experiments using Taguchi was done according to Figure 3.4,
where control and noise factors under investigation and the levels to which they will be varied
were identified (du Plessis & de Villiers, 2007). The choice of orthogonal arrays matrix
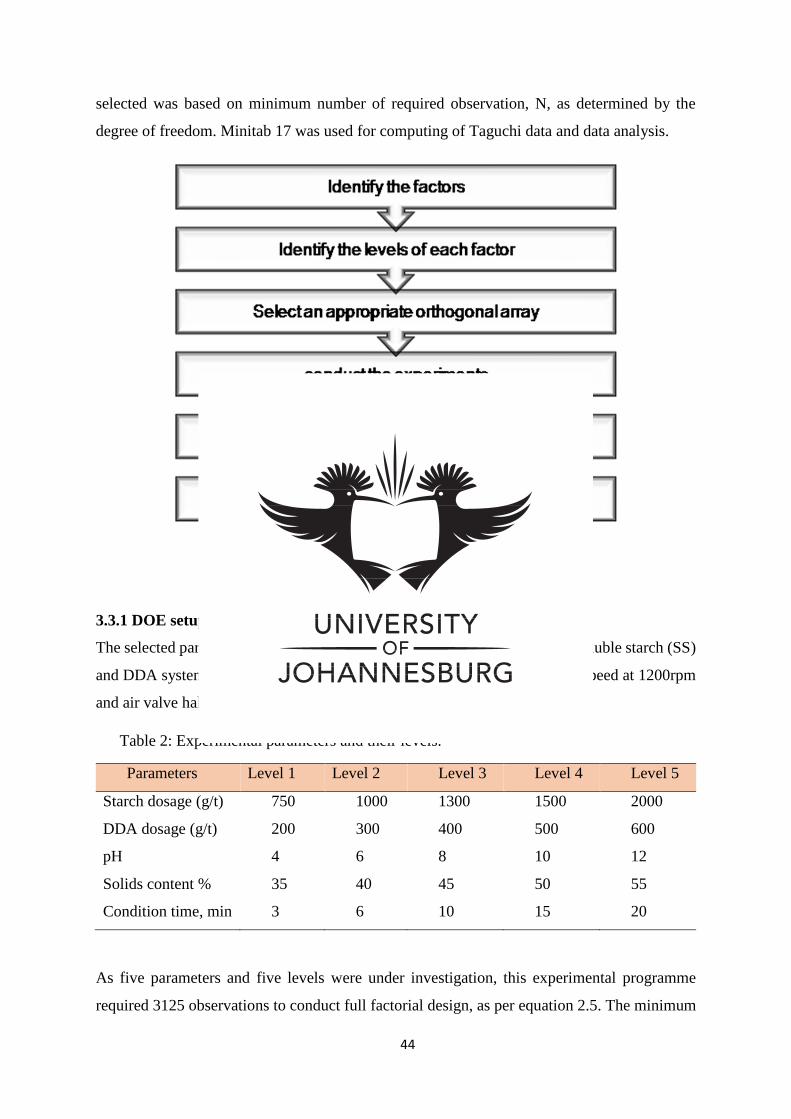
44
selected was based on minimum number of required observation, N, as determined by the
degree of freedom. Minitab 17 was used for computing of Taguchi data and data analysis.
Figure 3.4: Taguchi method steps (Bendell, et al., 1989).
3.3.1 DOE setup for the Soluble starch – DDA system
The selected parameters and the levels to which variation was made for the soluble starch (SS)
and DDA system, is shown in Table 2. The fixed parameters were agitation speed at 1200rpm
and air valve half open.
Table 2: Experimental parameters and their levels.
Parameters Level 1 Level 2 Level 3 Level 4 Level 5
Starch dosage (g/t) 750 1000 1300 1500 2000
DDA dosage (g/t) 200 300 400 500 600
pH 4 6 8 10 12
Solids content % 35 40 45 50 55
Condition time, min 3 6 10 15 20
As five parameters and five levels were under investigation, this experimental programme
required 3125 observations to conduct full factorial design, as per equation 2.5. The minimum
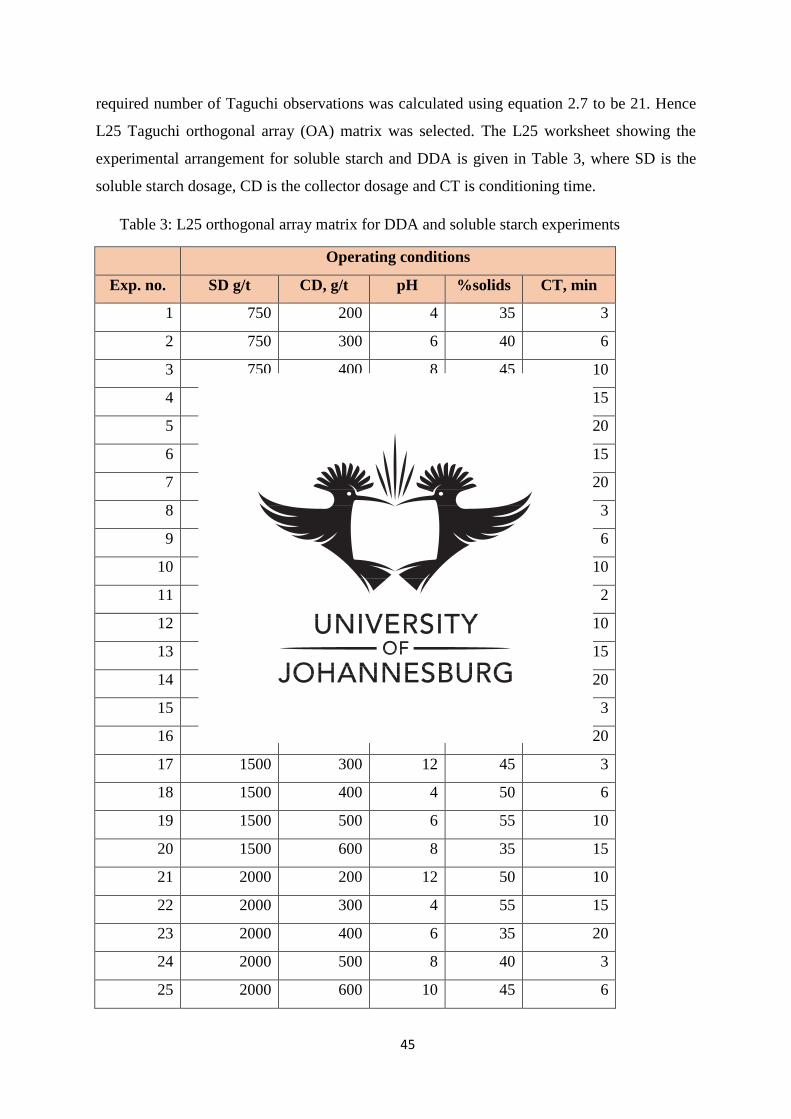
45
required number of Taguchi observations was calculated using equation 2.7 to be 21. Hence
L25 Taguchi orthogonal array (OA) matrix was selected. The L25 worksheet showing the
experimental arrangement for soluble starch and DDA is given in Table 3, where SD is the
soluble starch dosage, CD is the collector dosage and CT is conditioning time.
Table 3: L25 orthogonal array matrix for DDA and soluble starch experiments
Operating conditions
Exp. no. SD g/t CD, g/t pH %solids CT, min
1 750 200 4 35 3
2 750 300 6 40 6
3 750 400 8 45 10
4 750 500 10 50 15
5 750 600 12 55 20
6 1000 200 6 45 15
7 1000 300 8 50 20
8 1000 400 10 55 3
9 1000 500 12 35 6
10 1000 600 4 40 10
11 1300 200 8 55 2
12 1300 300 10 35 10
13 1300 400 12 40 15
14 1300 500 4 45 20
15 1300 600 6 50 3
16 1500 200 10 40 20
17 1500 300 12 45 3
18 1500 400 4 50 6
19 1500 500 6 55 10
20 1500 600 8 35 15
21 2000 200 12 50 10
22 2000 300 4 55 15
23 2000 400 6 35 20
24 2000 500 8 40 3
25 2000 600 10 45 6
46
The output columns (Fe grade) were added into the worksheet and tests repeated randomly.
The optimization was conducted by studying the control factors only, with the targeted output
being “highest Fe grade”, with SN ratio is given as follows:
𝑆
𝑁= − 10 log [
∑(1𝑦𝑖
2⁄ )
𝑛] …………………eqn 2.14
Higher values of the signal-to-noise (SN) ratio would identify control factor settings that
facilitate desired output results (Sapakal & Telsang, 2012). The signal – noise ratio was also
used to rank parameters according to relative significance. A confirmation test was conducted
at the optimum conditions predicted by Taguchi SN ratio.
Further optimization exercises were conducted until the required result was obtained. Analysis
of data using ANOVA was done to identify and quantify the errors resulting from deviations
of a set of results (Altan, 2010). ANOVA can also be used to determine the relative importance
of each factor under investigation (Tofighy & Mohammadi, 2012).
3.3.2 DOE setup for the Betachem 30D – DDA system
The information obtained from the SS - DDA experiments was used in planning experiments
for Betachem 30D and DDA. This experiment used L9 OA matrix whereby the Betachem 30D
dosage, DDA dosage, air rate and agitation speed were studied. The parameters such as pH,
solids content and conditioning time were fixed at 10, 50% and 6 minutes respectively. The
varied parameters and their levels is shown in Table 4.
Table 4: Betachem 30D - DDA system parameters setting
Parameters Level 1 Level 2 Level 3
Betachem 30D (g/t) 300 1000 2000
DDA (g/t) 200 400 500
Agitation speed (rpm) 1200 1300 1400
Air ½ open ¾ open Fully open
L9 orthogonal array matrix was used since there were four parameters and three levels, as
shown in Table 5.

47
Table 5 : L9 orthogonal array matrix for DDA and Betachem 30D experiments
Betachem 30D
(g/t)
DDA (g/t) Air rate Agitation speed
(rpm)
300 200 1/2 1200
300 300 3/4 1300
300 500 1 1400
1000 200 3/4 1400
1000 300 1 1200
1000 500 1/2 1300
2000 200 1 1300
2000 300 1/2 1400
2000 500 3/4 1200
The flotation experiments were conducted, as per Figure 3.3, then the SN ratio was used to
determine optimum operating conditions for achievement of higher Fe grade and ranking of
parameters.
3.3.3. DOE setup for the Betachem 30D – Betacol 373 system
The L9 orthogonal array matrix was used to determine optimum conditions for high iron grade.
The parameters investigated were Betachem 30D dosage, Betacol 373 dosage and solid
content. Dextrin dosage was varied 300-2000g/t, Betacol 373 dosage 380 – 3328g/t and solid
content 35-55%. The parameters pH, agitation speed, air rate and conditioning time were fixed
at 10, 1300rpm, ¾ air vale open and 15minutes as adapted from the SS-DDA system.
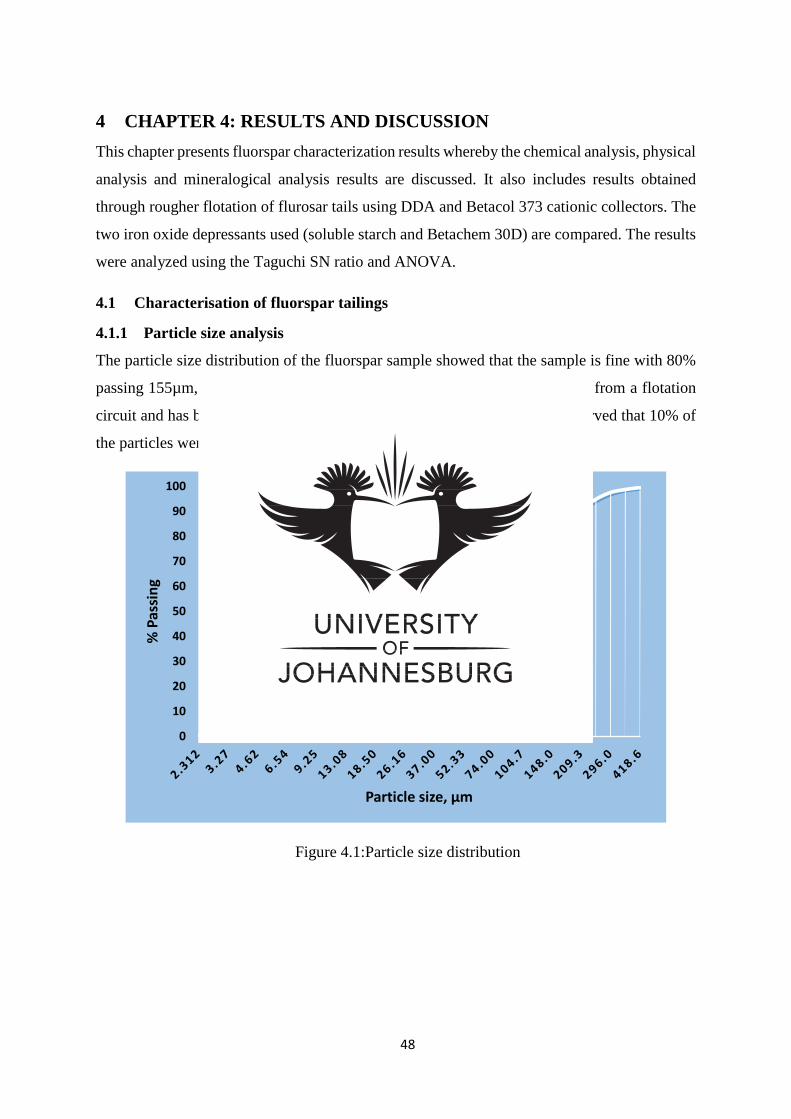
48
4 CHAPTER 4: RESULTS AND DISCUSSION
This chapter presents fluorspar characterization results whereby the chemical analysis, physical
analysis and mineralogical analysis results are discussed. It also includes results obtained
through rougher flotation of flurosar tails using DDA and Betacol 373 cationic collectors. The
two iron oxide depressants used (soluble starch and Betachem 30D) are compared. The results
were analyzed using the Taguchi SN ratio and ANOVA.
4.1 Characterisation of fluorspar tailings
4.1.1 Particle size analysis
The particle size distribution of the fluorspar sample showed that the sample is fine with 80%
passing 155µm, as illustrated in Figure 4.1. This confirms that the sample is from a flotation
circuit and has been already milled since it is of fine texture. It was also observed that 10% of
the particles were slimes, <20µm.
Figure 4.1:Particle size distribution
0
10
20
30
40
50
60
70
80
90
100
% P
assi
ng
Particle size, µm
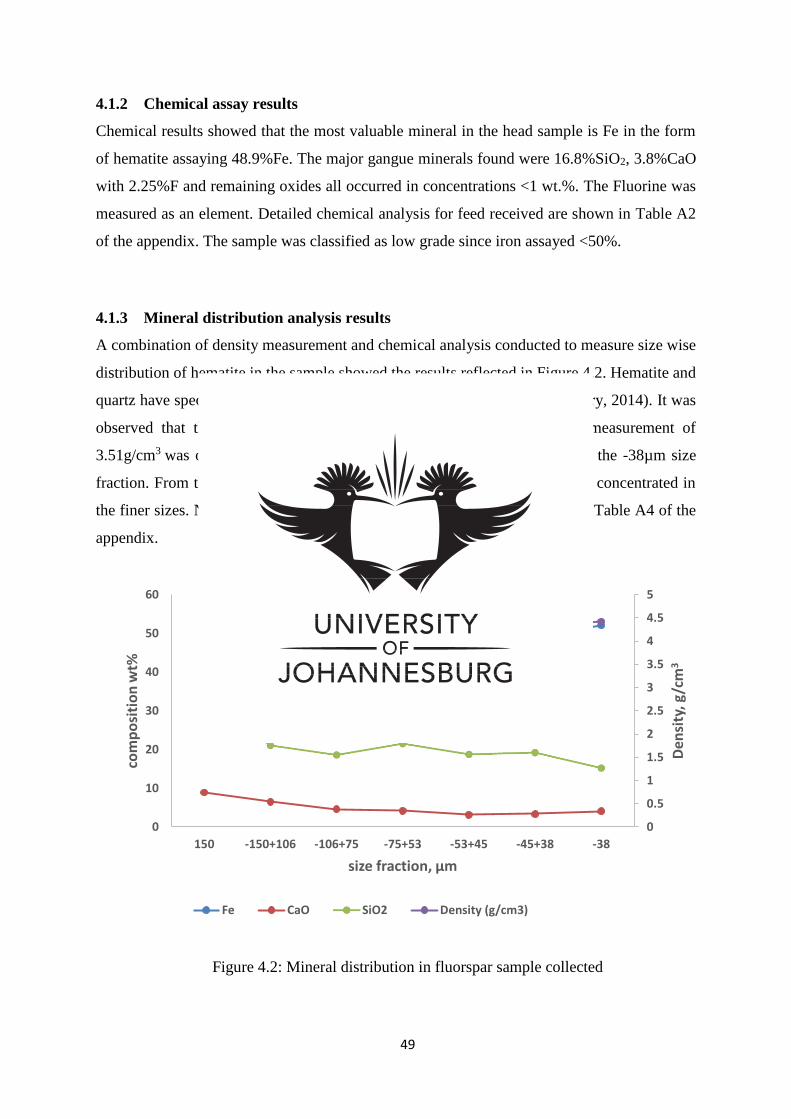
49
4.1.2 Chemical assay results
Chemical results showed that the most valuable mineral in the head sample is Fe in the form
of hematite assaying 48.9%Fe. The major gangue minerals found were 16.8%SiO2, 3.8%CaO
with 2.25%F and remaining oxides all occurred in concentrations <1 wt.%. The Fluorine was
measured as an element. Detailed chemical analysis for feed received are shown in Table A2
of the appendix. The sample was classified as low grade since iron assayed <50%.
4.1.3 Mineral distribution analysis results
A combination of density measurement and chemical analysis conducted to measure size wise
distribution of hematite in the sample showed the results reflected in Figure 4.2. Hematite and
quartz have specific gravity of 5.1g/cm3 and 2.65g/cm3 respectively (McMurry, 2014). It was
observed that the density increases as particles becomes finer. Density measurement of
3.51g/cm3 was obtained at +150µm size fraction and 4.42g/cm3 obtained in the -38µm size
fraction. From these results it was anticipated that the hematite will be more concentrated in
the finer sizes. Numerical details of mineral distribution results are shown in Table A4 of the
appendix.
Figure 4.2: Mineral distribution in fluorspar sample collected
0
0.5
1
1.5
2
2.5
3
3.5
4
4.5
5
0
10
20
30
40
50
60
150 -150+106 -106+75 -75+53 -53+45 -45+38 -38
Den
sity
, g/c
m3
com
po
siti
on
wt%
size fraction, µm
Fe CaO SiO2 Density (g/cm3)
50
The prediction was confirmed by chemical analysis results where a concentration of iron was
observed to be increasing in the finer size range, as shown in Figure 4.2. A lower concentration
33.59%Fe was found in the +150µm and higher concentration of 52.09%Fe in the -38µm,
which collaborated with density results. The silica and calcium oxide content was observed
dropping in the finer size range. It must be noted that frequent flooding problems were
experienced during size classification using vibrating wet screening, hence the mass
distribution across the selected size fraction was not studied.
The concentration ratio of 2.48 was calculated using equation 1.1. Generally, a concentration
ratio of 2.5 implies the mineral can be separated with ease using gravity separation for minerals
that are >75µm in size. However, since chemical analysis shown in Figure 4.2 illustrated that
iron is more concentrated in the finer ranges (<75µm), gravity separation (specifically jigs,
spirals and DMS) does not become an ideal separation method for this product. According to
effective range of mineral processing techniques application shown in Figure 2.4, gravity
separation is efficient at >80µm size particles. High intensity magnetic separation is another
option for enrichment of hematite-quartz system, however, magnetic separation is not
recommended for low grade iron oxides and for ores that are too fine (Filippov, et al., 2014;
Rao, et al., 2009).
The results depicted by chemical assay analysis that iron is richer in the fines, eliminated the
use of gravity separation and magnetic separation techniques since the fluorspar tailings will
require uneconomic settling times during gravity separation and is not coarse enough for
effective magnetic separation.
4.1.4 Loss on ignition results
The head sample total LOI obtained, using equation 2.11, was 2.7wt%. From these results it
was anticipated that the iron would be present in predominantly anhydrous oxide form. Leonel
& Peres, 2013 investigated the impact of high LOI in the pelletizing of iron ores. Their research
concluded that low grade iron ores with LOI above 3.5wt% present challenges of decreased
yield in the beneficiation stage and high loss of productivity in the pelletizing process. The
resulting LOI of 2.7wt% would permit the use of flotation as a better Fe concentration method,
since negligible presence of hydrated oxides and carbonated oxides is anticipated.
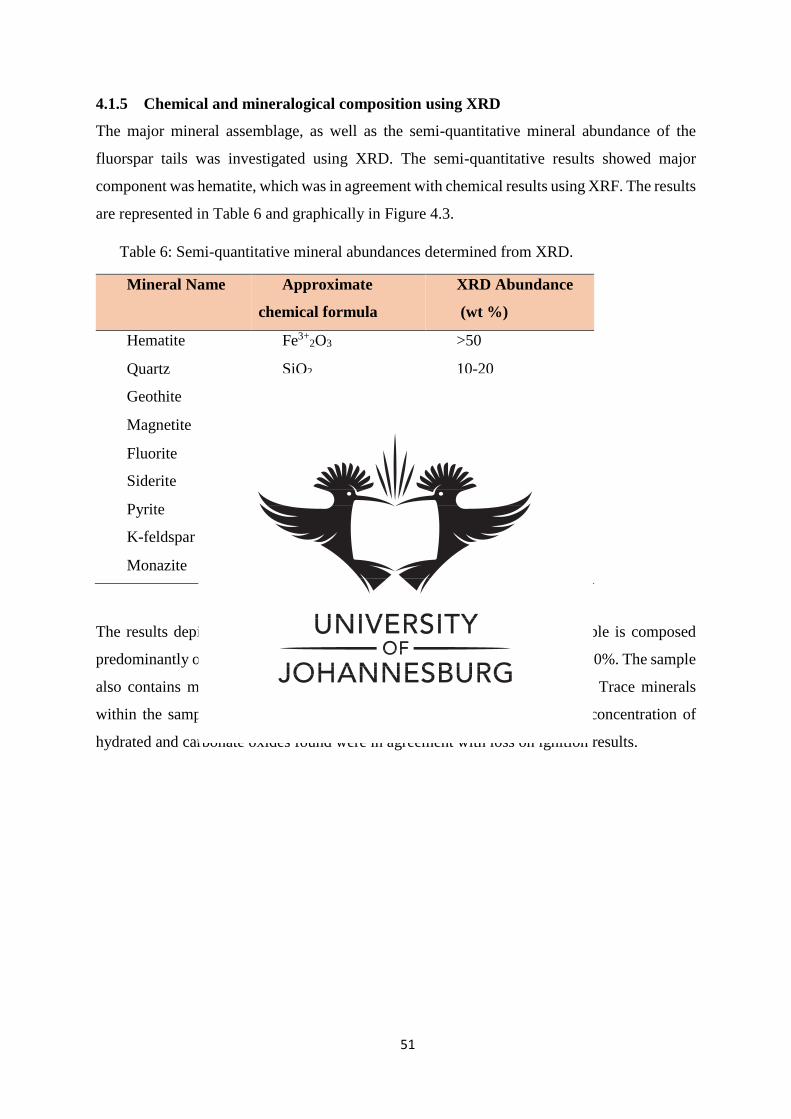
51
4.1.5 Chemical and mineralogical composition using XRD
The major mineral assemblage, as well as the semi-quantitative mineral abundance of the
fluorspar tails was investigated using XRD. The semi-quantitative results showed major
component was hematite, which was in agreement with chemical results using XRF. The results
are represented in Table 6 and graphically in Figure 4.3.
Table 6: Semi-quantitative mineral abundances determined from XRD.
Mineral Name Approximate
chemical formula
XRD Abundance
(wt %)
Hematite Fe3+2O3 >50
Quartz SiO2 10-20
Geothite Fe3+O(OH) 3-10
Magnetite Fe3+2Fe2+O4 3-10
Fluorite CaF2 3-10
Siderite Fe2+(CO3) ≤3
Pyrite Fe2+S2 ≤3
K-feldspar KAlSi3O8 ≤3
Monazite (Ce,La,Nd,Th)PO4 ≤3
The results depicted in Table 6 and Figure 4.5 indicated that the head sample is composed
predominantly of hematite at >50%, with quartz being the main gangue at 10-20%. The sample
also contains minor amounts of goethite, magnetite and fluorite, at 3-10%. Trace minerals
within the sample are made up of pyrite, K-feldspar and monazite. Minor concentration of
hydrated and carbonate oxides found were in agreement with loss on ignition results.

52
Figure 4.3: XRD pattern for fluorspar tails
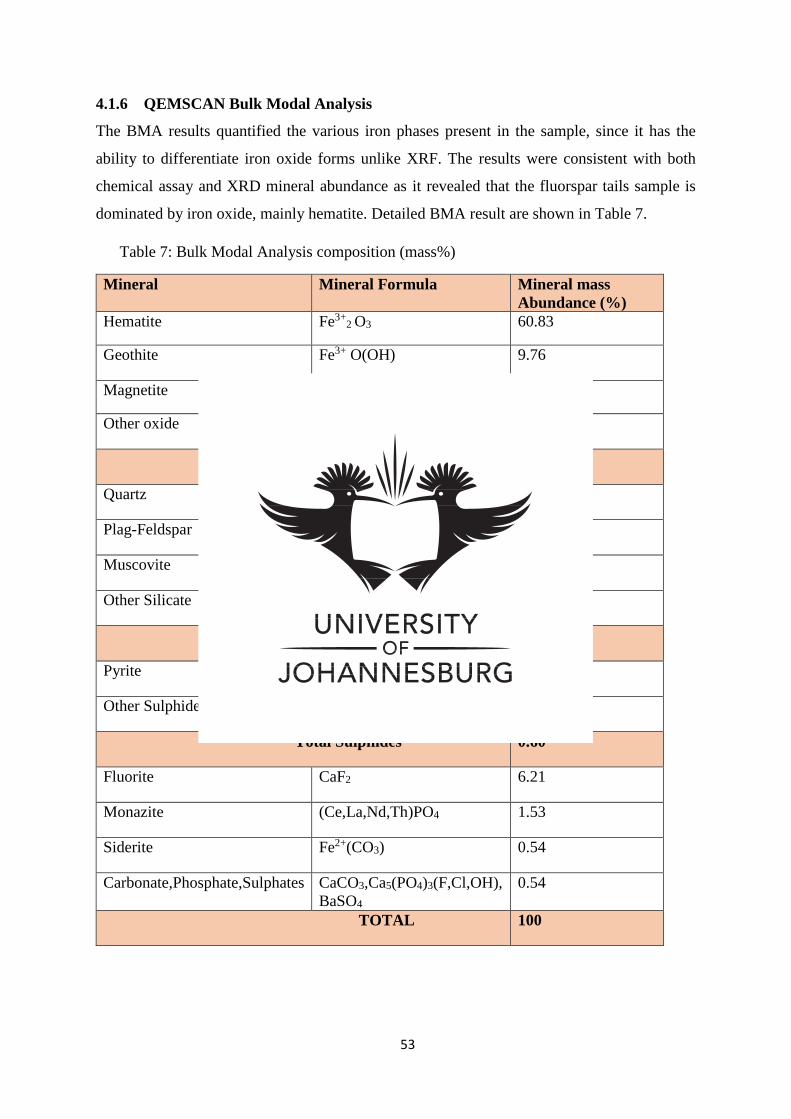
53
4.1.6 QEMSCAN Bulk Modal Analysis
The BMA results quantified the various iron phases present in the sample, since it has the
ability to differentiate iron oxide forms unlike XRF. The results were consistent with both
chemical assay and XRD mineral abundance as it revealed that the fluorspar tails sample is
dominated by iron oxide, mainly hematite. Detailed BMA result are shown in Table 7.
Table 7: Bulk Modal Analysis composition (mass%)
Mineral Mineral Formula Mineral mass
Abundance (%)
Hematite Fe3+2 O3 60.83
Geothite Fe3+ O(OH) 9.76
Magnetite Fe3+2 Fe2+O4 5.91
Other oxide Fe2+ TiO3,Fe2+ Cr2O4 0.10
Total Oxide 76.60
Quartz SiO2 12.52
Plag-Feldspar (Ca,Na) AlSi3O-KAlSi3O8 0.74
Muscovite KAl2(AlSi3O10)(OH)2 0.42
Other Silicate 0.70
Total silicate 14.38
Pyrite Fe2+ S2 0.57
Other Sulphides _ 0.03
Total Sulphides 0.60
Fluorite CaF2 6.21
Monazite (Ce,La,Nd,Th)PO4 1.53
Siderite Fe2+(CO3) 0.54
Carbonate,Phosphate,Sulphates CaCO3,Ca5(PO4)3(F,Cl,OH),
BaSO4
0.54
TOTAL 100
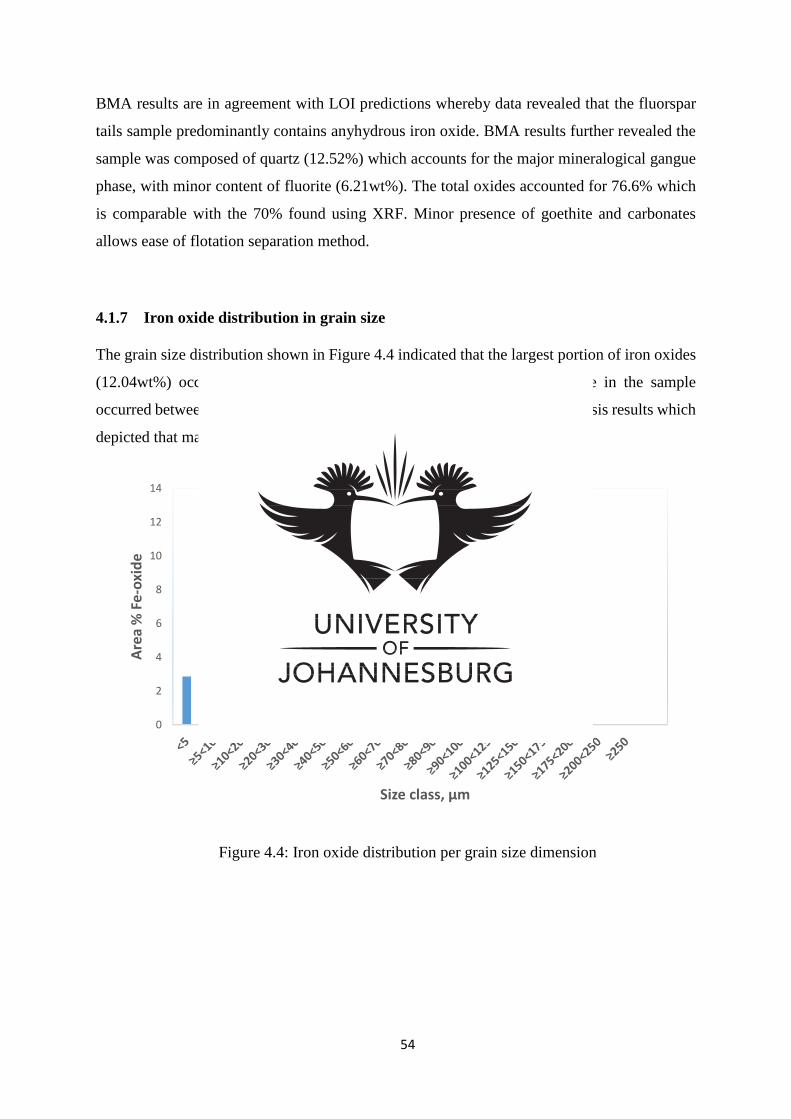
54
BMA results are in agreement with LOI predictions whereby data revealed that the fluorspar
tails sample predominantly contains anyhydrous iron oxide. BMA results further revealed the
sample was composed of quartz (12.52%) which accounts for the major mineralogical gangue
phase, with minor content of fluorite (6.21wt%). The total oxides accounted for 76.6% which
is comparable with the 70% found using XRF. Minor presence of goethite and carbonates
allows ease of flotation separation method.
4.1.7 Iron oxide distribution in grain size
The grain size distribution shown in Figure 4.4 indicated that the largest portion of iron oxides
(12.04wt%) occurred between 40-50µm and that the majority of Fe-oxide in the sample
occurred between 10-70µm. These results agree with size wise chemical analysis results which
depicted that majority of Fe-oxide in finer size ranges.
Figure 4.4: Iron oxide distribution per grain size dimension
0
2
4
6
8
10
12
14
Are
a %
Fe
-oxi
de
Size class, µm
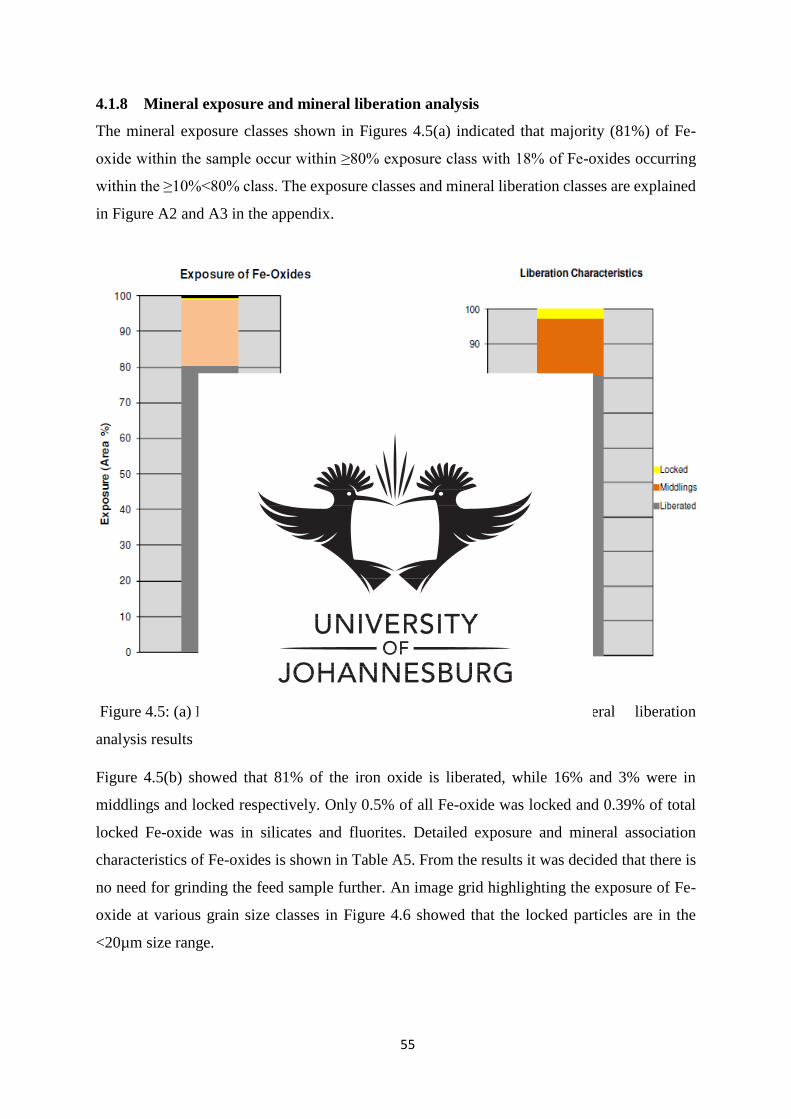
55
4.1.8 Mineral exposure and mineral liberation analysis
The mineral exposure classes shown in Figures 4.5(a) indicated that majority (81%) of Fe-
oxide within the sample occur within ≥80% exposure class with 18% of Fe-oxides occurring
within the ≥10%<80% class. The exposure classes and mineral liberation classes are explained
in Figure A2 and A3 in the appendix.
Figure 4.5: (a) Results of exposure characteristics of Fe-oxides (b) Mineral liberation
analysis results
Figure 4.5(b) showed that 81% of the iron oxide is liberated, while 16% and 3% were in
middlings and locked respectively. Only 0.5% of all Fe-oxide was locked and 0.39% of total
locked Fe-oxide was in silicates and fluorites. Detailed exposure and mineral association
characteristics of Fe-oxides is shown in Table A5. From the results it was decided that there is
no need for grinding the feed sample further. An image grid highlighting the exposure of Fe-
oxide at various grain size classes in Figure 4.6 showed that the locked particles are in the
<20µm size range.
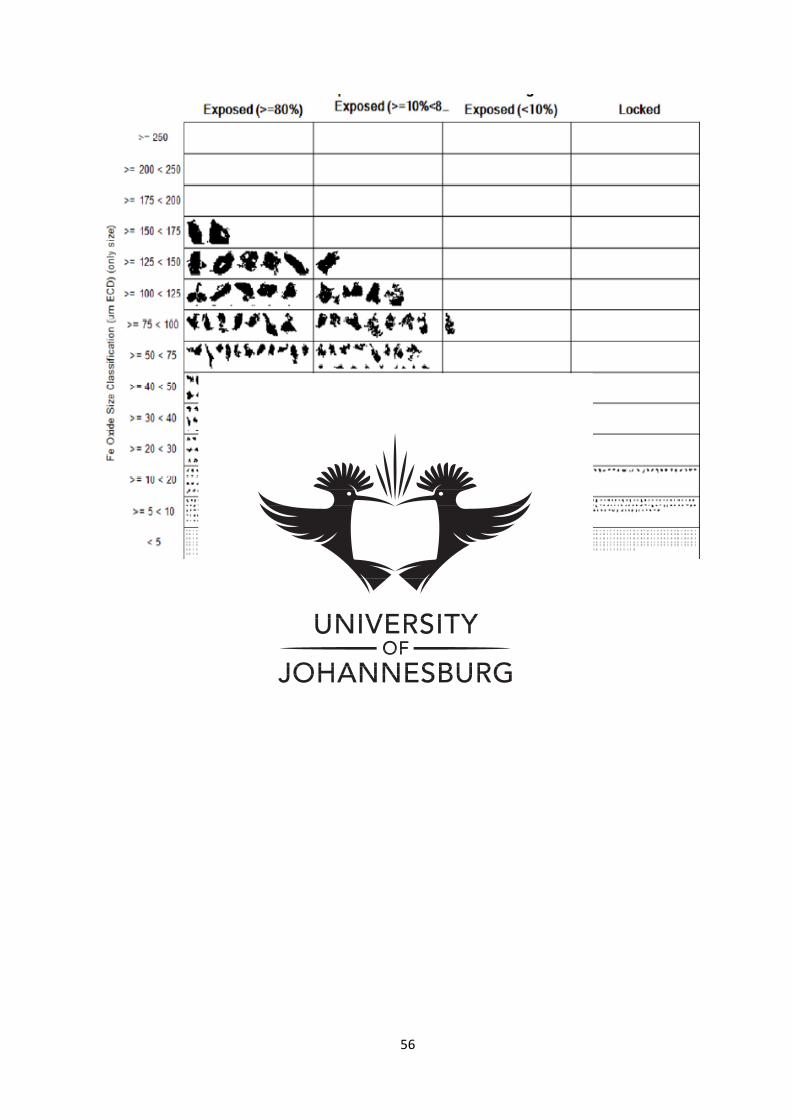
56
Figure 4.6: Exposure and association categories
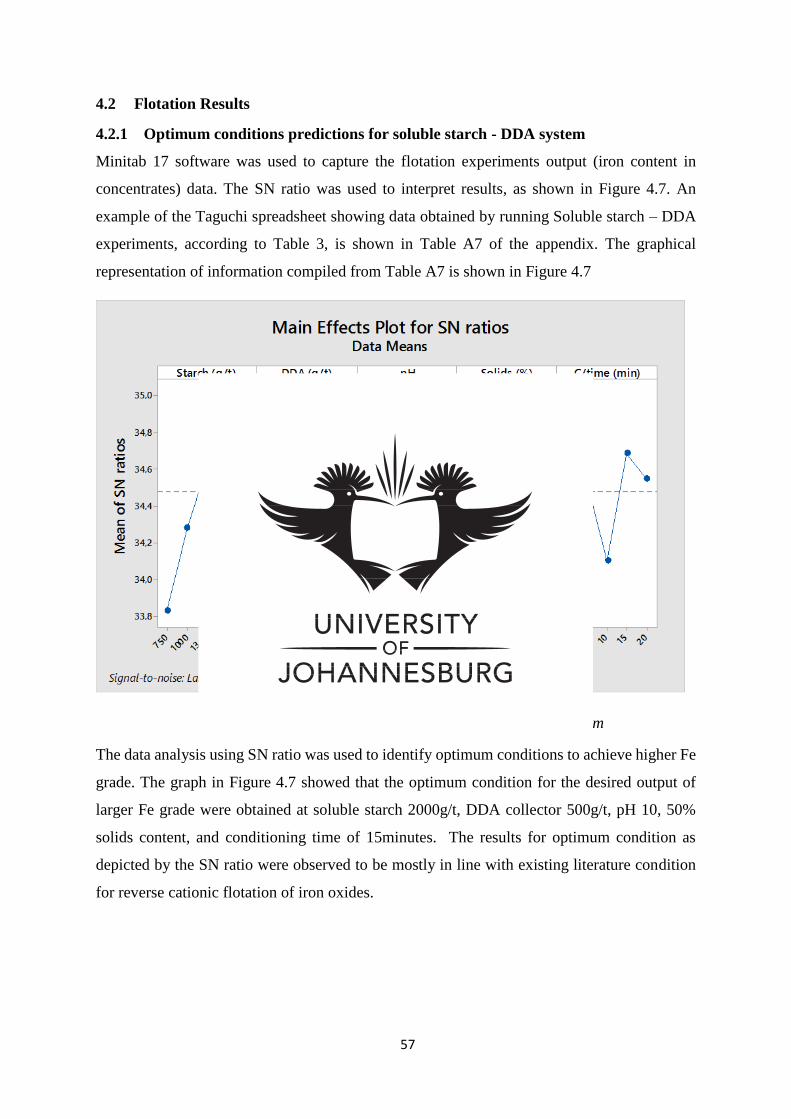
57
4.2 Flotation Results
4.2.1 Optimum conditions predictions for soluble starch - DDA system
Minitab 17 software was used to capture the flotation experiments output (iron content in
concentrates) data. The SN ratio was used to interpret results, as shown in Figure 4.7. An
example of the Taguchi spreadsheet showing data obtained by running Soluble starch – DDA
experiments, according to Table 3, is shown in Table A7 of the appendix. The graphical
representation of information compiled from Table A7 is shown in Figure 4.7
Figure 4.7: SN ratio response for soluble starch-DDA system
The data analysis using SN ratio was used to identify optimum conditions to achieve higher Fe
grade. The graph in Figure 4.7 showed that the optimum condition for the desired output of
larger Fe grade were obtained at soluble starch 2000g/t, DDA collector 500g/t, pH 10, 50%
solids content, and conditioning time of 15minutes. The results for optimum condition as
depicted by the SN ratio were observed to be mostly in line with existing literature condition
for reverse cationic flotation of iron oxides.
58
Soluble starch dosage - SN ratio trend
The soluble starch dosage – SN ratio trend in Figure 4.7 showed that the efficiency of the
process generally increases with increased starch dosage. The highest SN ratio was predicted
at 2000g/t starch dosage. Work done by Kar, et al. (2013) showed that depressing action of
hematite increased with increase in starch dosage. It was noted that the 2000g/t soluble starch
obtained as the optimum soluble starch dosage in this study is much higher than the previously
recorded dosages of 400-600g/t reported by Nheta, et al. (2015) and Kar, et al. (2013). Due to
general high cost of soluble starch, a decision was made not to investigate higher soluble starch
dosage.
DDA dosage – SN ratio trend
The DDA collector dosage-SN ratio trend in Figure 4.7 showed that flotation performance
increased with increasing collector dosage from 300-500g/t after which a sudden decline was
observed at 600g/t. Generally, the floatability of quartz increases with increased collector
dosage until an optimum point is reached where a decline occurs possibly due to formation of
hemi-micelles at the solid-liquid interface (Filippov, et al., 2014). The optimum collector
dosage of 500g/t depicted by the SN ratio is more that of 300g/t depicted by preliminary results
of Nheta, et al. (2015) and the 48g/t depicted by Kar, et al. (2013). The higher collector dosage
requirement could be attributed to differences in feed quality, water quality, etc.
Pulp pH – SN ratio trend
The pH – SN ratio trend in Figure 4.7 showed that the efficiency of the flotation experiments
increased with increasing pH whereby the highest SN ratio was reached at pH 10. Work done
by Ma, et al. (2011) conducted reverse cationic flotation at pH 10.5. It is normal practice to
conduct reverse cationic flotation of iron ore at pH 10-10.5 (Turrer and Peres, 2010; Kumar, et
al., 2010). The pH-SN ratio trend statistically predicts a sudden drop in system efficiency at
pH>10. A similar trend was reported by Huang, et al. (2014), where it was observed that
flotation of quartz increased gradually with increasing pH but decreased at pH > 10. The
flotation of quartz is said to increase with increasing pH as the quartz becomes more negatively
charged when the point of zero charge (pzc) of pH 2-3 is passed.
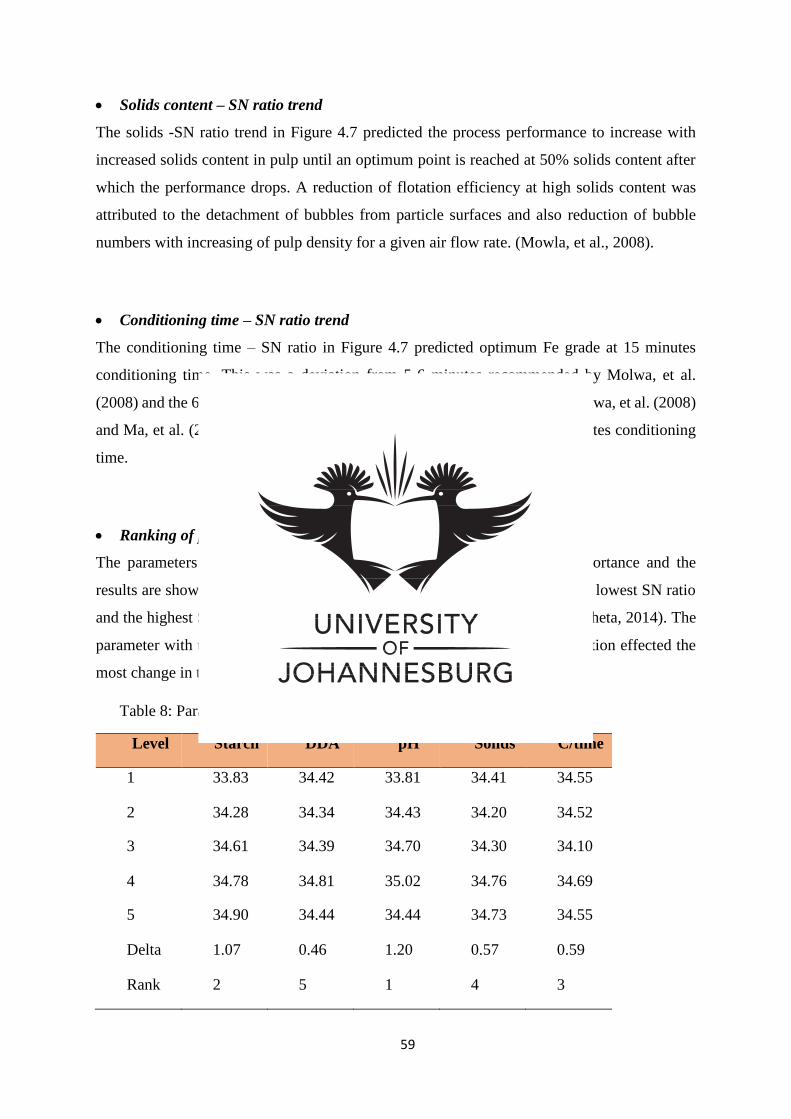
59
Solids content – SN ratio trend
The solids -SN ratio trend in Figure 4.7 predicted the process performance to increase with
increased solids content in pulp until an optimum point is reached at 50% solids content after
which the performance drops. A reduction of flotation efficiency at high solids content was
attributed to the detachment of bubbles from particle surfaces and also reduction of bubble
numbers with increasing of pulp density for a given air flow rate. (Mowla, et al., 2008).
Conditioning time – SN ratio trend
The conditioning time – SN ratio in Figure 4.7 predicted optimum Fe grade at 15 minutes
conditioning time. This was a deviation from 5-6 minutes recommended by Molwa, et al.
(2008) and the 6 minutes used by Ma, et al. (2011). Based on the works of Molwa, et al. (2008)
and Ma, et al. (2011), a decision was made to conduct experiments at 6 minutes conditioning
time.
Ranking of parameters
The parameters under investigation were ranked according to relative importance and the
results are shown in Table 8. The ranking looks at the difference between the lowest SN ratio
and the highest SN ratio as the parameter setting level is varied (Masiya & Nheta, 2014). The
parameter with the highest difference is deemed the most critical as its variation effected the
most change in the output response.
Table 8: Parameter ranking results using SN ratio
Level Starch DDA pH Solids C/time
1 33.83 34.42 33.81 34.41 34.55
2 34.28 34.34 34.43 34.20 34.52
3 34.61 34.39 34.70 34.30 34.10
4 34.78 34.81 35.02 34.76 34.69
5 34.90 34.44 34.44 34.73 34.55
Delta 1.07 0.46 1.20 0.57 0.59
Rank 2 5 1 4 3
60
The response table of SN ratio to higher iron grade was conducted to rank the parameters
according to significance. The ranking of process parameter, indicated in Table 8, showed that
the relative significance of the parameter was in the order of pH being the most significant
parameter followed by starch dosage, conditioning time, solids content and collector dosage
respectively. This means that the system is most sensitive to pH changes. This finding is in line
with literatures since pH is known to be critical in flotation of iron oxides as it affects the
surface charge of oxide minerals (Fuerstenau & Pradip, 2005)
Confirmation test for SS-DDA system
A confirmation test for soluble starch and DDA was conducted at predicted optimum
conditions. With soluble starch at 2000g/t, DDA dosage of 500g/t, pH 10, solids content of
50% and conditioning time of 6 minutes. The result showed a 56.87%Fe grade in the
concentrate stream. The metal recovery of 78% was obtained when using equation 2.12 and
metal loss was 22% when using equation 2.13. This iron assay was far below the required
≥63%Fe for pellets making. Detailed chemical analysis of this SS-DDA confirmation test are
shown in Table A8 of the appendix.
4.2.2 Optimum condition prediction for Betachem 30D and DDA system
Figure 4.8 showed that the optimum condition for the desired output of larger Fe grade were
obtained at dextrin (Betachem 30D) 300g/t, DDA collector 500g/t, ¾ air valve opening and
1300rpm agitation speed. The results for optimum condition as depicted by the SN ratio were
observed to be mostly in line with existing literature condition for reverse cationic flotation of
oxides.

61
Figure 4.8: SN ratio response for Betachem 30D-DDA system
Dextrin dosage – SN ratio trend
Betachem 30D dosage – SN ratio, in Figure 4.8, showed the optimum dextrin dosage for lager
Fe grade output is at 300g/t, which is much lower than the 2000g/t predicted when soluble
starch is used. The SN ratio graph showed a decline in flotation performance at increased
dextrin dosage, which could be due to clathrate. This is when quartz hydrophobicity is reduced
at increased starch and amine dosage due to the interaction of free starch molecules with amine
molecules thus resulting in amine acting rather as a depressant (Lima et al., 2013)
DDA dosage – SN ratio trend
It was observed that the optimum DDA dosage was not reduced by the introduction of
parameter such as air rate, agitation speed and a different type of depressant. The DDA dosage
– SN ratio in Figure 4.8 showed an increase in flotation efficiency with increased collector
dosage with optimum dosage being 500g/t.

62
Air rate and agitation speed – SN ratio trend
The air rate – SN ration graph in Figure 4.8 showed an improvement in system efficiency as
air rate is increased from valve half open to valve 3/4 open and a sudden drop when the air
valve is fully open. A similar trend was observed with agitation speed – SN ratio graph where
the performance is seen to increase when the agitation speed is increased from 1200-1300rpm
and it dropped suddenly when the speed is increased to 1400rpm. Air rate and agitation speed
are critical for efficient performance in flotation as high air rate increase the available area for
attachment of targeted mineral and the increased agitation speed increases contact opportunities
of air with the target mineral. With flotation rate driven by factors; collision, adhesion and
detachment, increased performance is anticipated as agitation speed is increased due to
increased rate of collision and adhesion between particles and bubbles (Abd El-Rahiem, et al.,
2009). However, at the highest impeller speed of 1400rpm the rate of detachment could be
greater than that of collision and adhesion leading to poor flotation of quartz thus reduction in
the sinks iron grade.
Ranking of parameters (Betachem 30D and DDA)
The response table of SN ratio to higher the better iron grade was conducted to rank the
parameters according to significance. The ranking of process parameter, indicated in Table 9,
showed that the relative significance of the parameter was in the order of collector dosage being
the critical parameter followed by depressant dosage, air rate and agitation speed.
Table 9: Parameter ranking results using SN ratio.
Level Betachem
30D
DDA Air rate Speed
1 35.50 34.98 35.25 35.26
2 35.34 35.38 35.44 35.34
3 35.05 35.53 35.20 35.29
Delta 0.45 0.55 0.24 0.08
Rank 2 1 3 4
Confirmations tests results for Betachem 30D – DDA system
A confirmation test for the dextrin Betachem 30D and DDA was conducted at predicted
optimum conditions. With Betachem 30D at 300g/t, DDA dosage of 500g/t, pH 10, solids
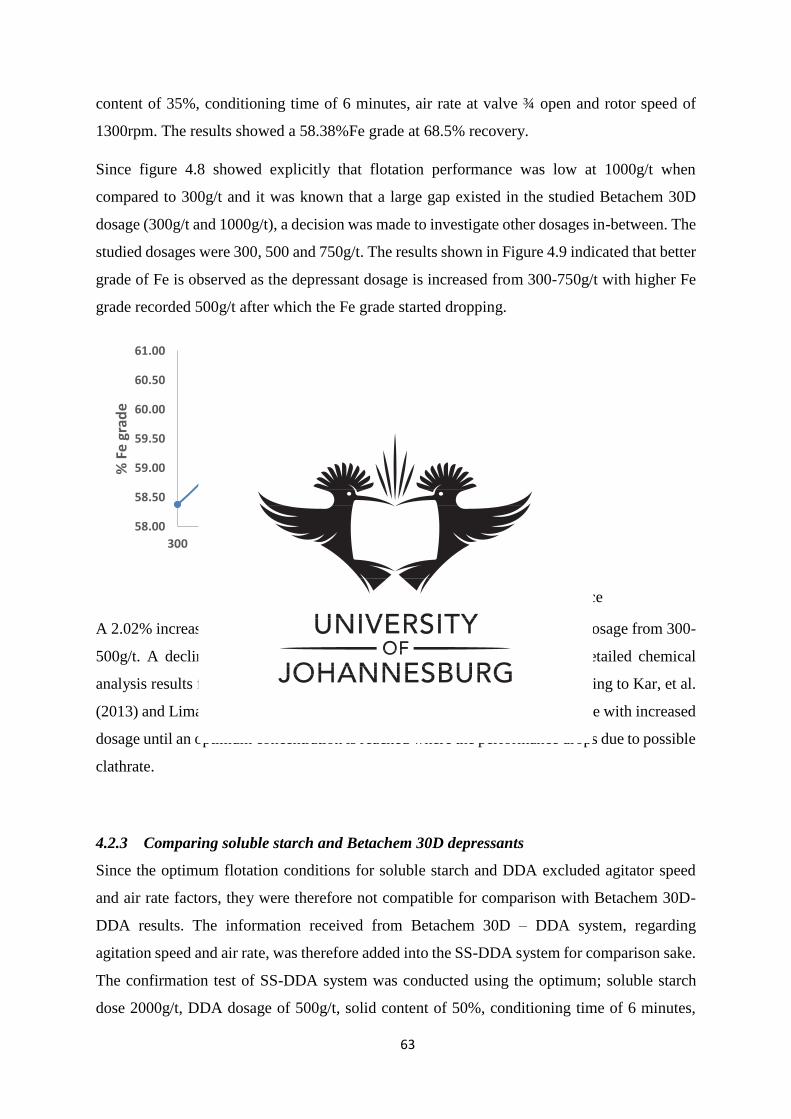
63
content of 35%, conditioning time of 6 minutes, air rate at valve ¾ open and rotor speed of
1300rpm. The results showed a 58.38%Fe grade at 68.5% recovery.
Since figure 4.8 showed explicitly that flotation performance was low at 1000g/t when
compared to 300g/t and it was known that a large gap existed in the studied Betachem 30D
dosage (300g/t and 1000g/t), a decision was made to investigate other dosages in-between. The
studied dosages were 300, 500 and 750g/t. The results shown in Figure 4.9 indicated that better
grade of Fe is observed as the depressant dosage is increased from 300-750g/t with higher Fe
grade recorded 500g/t after which the Fe grade started dropping.
Figure 4.9: Effect of dextrin dosage on flotation performance
A 2.02% increase in Fe grade was observed when increasing Betachem 30D dosage from 300-
500g/t. A decline in iron grade was observed at 750g/t dextrin dosage. Detailed chemical
analysis results for Figure 4.9 are shown in Table A9 of the appendix. According to Kar, et al.
(2013) and Lima, et al. (2013) depressing action of a depressant would increase with increased
dosage until an optimum concentration is reached where the performance drops due to possible
clathrate.
4.2.3 Comparing soluble starch and Betachem 30D depressants
Since the optimum flotation conditions for soluble starch and DDA excluded agitator speed
and air rate factors, they were therefore not compatible for comparison with Betachem 30D-
DDA results. The information received from Betachem 30D – DDA system, regarding
agitation speed and air rate, was therefore added into the SS-DDA system for comparison sake.
The confirmation test of SS-DDA system was conducted using the optimum; soluble starch
dose 2000g/t, DDA dosage of 500g/t, solid content of 50%, conditioning time of 6 minutes,
58.00
58.50
59.00
59.50
60.00
60.50
61.00
300 400 500 600 700 800
% F
e gr
ade
Betachem 30D dosage, g/t
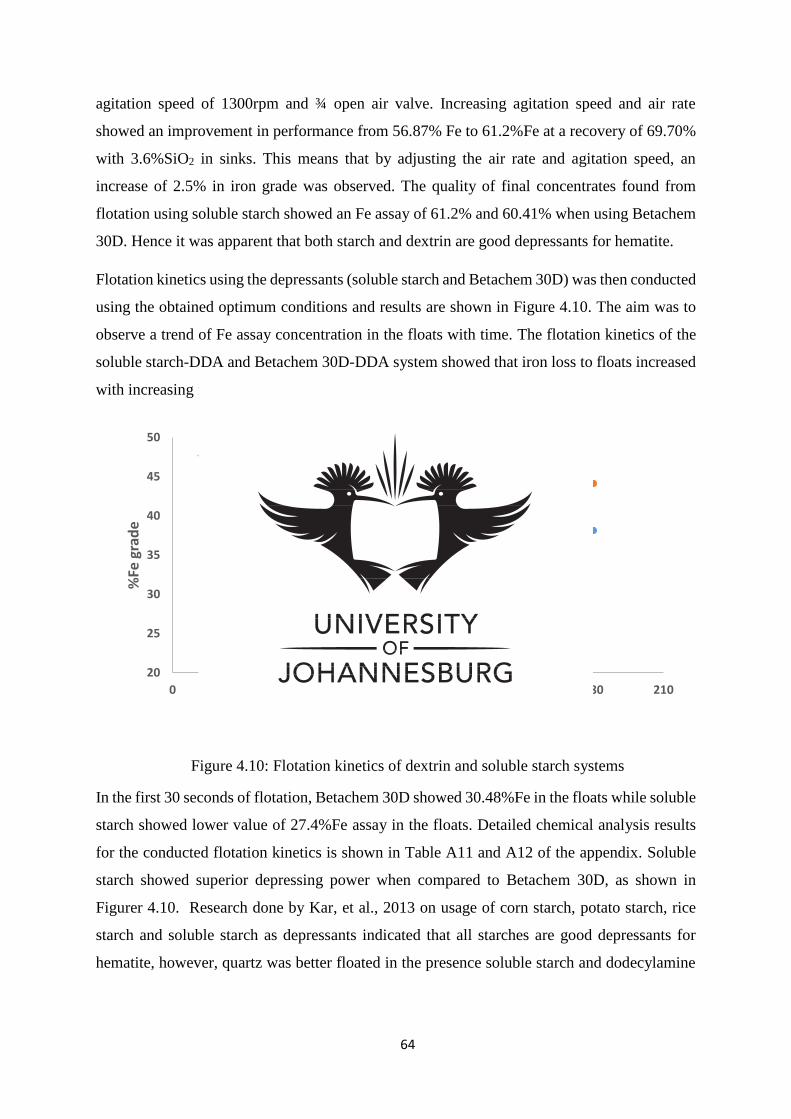
64
agitation speed of 1300rpm and ¾ open air valve. Increasing agitation speed and air rate
showed an improvement in performance from 56.87% Fe to 61.2%Fe at a recovery of 69.70%
with 3.6%SiO2 in sinks. This means that by adjusting the air rate and agitation speed, an
increase of 2.5% in iron grade was observed. The quality of final concentrates found from
flotation using soluble starch showed an Fe assay of 61.2% and 60.41% when using Betachem
30D. Hence it was apparent that both starch and dextrin are good depressants for hematite.
Flotation kinetics using the depressants (soluble starch and Betachem 30D) was then conducted
using the obtained optimum conditions and results are shown in Figure 4.10. The aim was to
observe a trend of Fe assay concentration in the floats with time. The flotation kinetics of the
soluble starch-DDA and Betachem 30D-DDA system showed that iron loss to floats increased
with increasing flotation period for both depressants.
Figure 4.10: Flotation kinetics of dextrin and soluble starch systems
In the first 30 seconds of flotation, Betachem 30D showed 30.48%Fe in the floats while soluble
starch showed lower value of 27.4%Fe assay in the floats. Detailed chemical analysis results
for the conducted flotation kinetics is shown in Table A11 and A12 of the appendix. Soluble
starch showed superior depressing power when compared to Betachem 30D, as shown in
Figurer 4.10. Research done by Kar, et al., 2013 on usage of corn starch, potato starch, rice
starch and soluble starch as depressants indicated that all starches are good depressants for
hematite, however, quartz was better floated in the presence soluble starch and dodecylamine
20
25
30
35
40
45
50
0 30 60 90 120 150 180 210
%Fe
gra
de
Float collection period, s
Fe - SS Fe -Dex
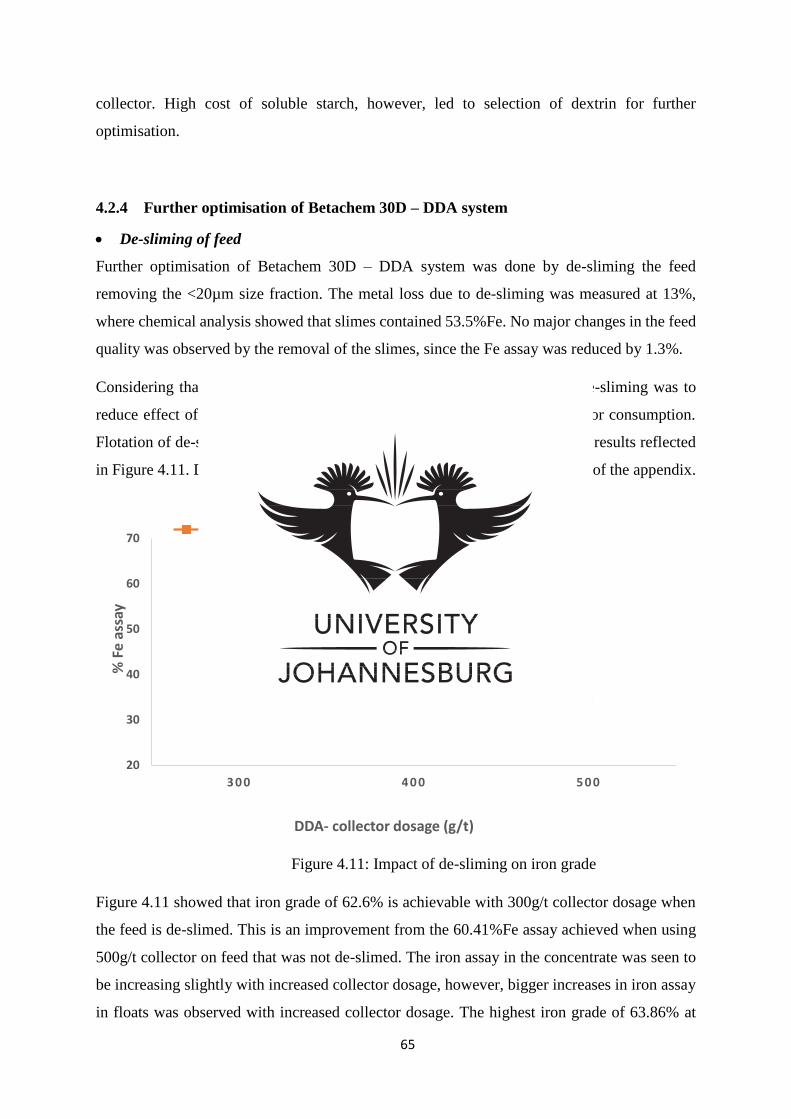
65
collector. High cost of soluble starch, however, led to selection of dextrin for further
optimisation.
4.2.4 Further optimisation of Betachem 30D – DDA system
De-sliming of feed
Further optimisation of Betachem 30D – DDA system was done by de-sliming the feed
removing the <20µm size fraction. The metal loss due to de-sliming was measured at 13%,
where chemical analysis showed that slimes contained 53.5%Fe. No major changes in the feed
quality was observed by the removal of the slimes, since the Fe assay was reduced by 1.3%.
Considering that the iron oxide in this size range was locked, the aim of de-sliming was to
reduce effect of slime coating, sludge formation and possibly reduce collector consumption.
Flotation of de-slimed feed was conducted at varied collector dosage and the results reflected
in Figure 4.11. Detailed chemical analysis results are illustrated in Table A14 of the appendix.
Figure 4.11: Impact of de-sliming on iron grade
Figure 4.11 showed that iron grade of 62.6% is achievable with 300g/t collector dosage when
the feed is de-slimed. This is an improvement from the 60.41%Fe assay achieved when using
500g/t collector on feed that was not de-slimed. The iron assay in the concentrate was seen to
be increasing slightly with increased collector dosage, however, bigger increases in iron assay
in floats was observed with increased collector dosage. The highest iron grade of 63.86% at
20
30
40
50
60
70
3 0 0 4 0 0 5 0 0
% F
e as
say
DDA- collector dosage (g/t)
%Fe float %Fe sinks
66
75.16% recovery, was, observed at 500g/t collector dosage. The metal loss at 500g/t collector
dosage using de-slimed feed were at 25% and 38% when adding the 13% lost by action of de-
sliming alone.
Though some reagent saving was observed with de-sliming, high metal losses were however
observed hence it was decided that the action of de-sliming was not beneficial for this project.
Increasing conditioning time
Further optimisation of dextrin-DDA system was done by increasing the conditioning time of
the original feed without de-sliming, from 6 minutes to 15minutes. This resulted in the better
performance of the system whereby the iron grade was increased from 60.83%Fe to 63.79%Fe,
which indicated a 3% grade increase. The comparison between concentrate quality obtained
from processing de-slimed feed and that obtained from increasing the conditioning time gave
the results tabulated in Table 10.
Table 10: Comparison between de-sliming and increased conditioning time
Concentrate at 15min
conditioning time
Concentrate from de-
slimed feed
Fe assay 63.79% 63.84%
SiO2 3.76% 3%
CaO 1.01% 1.97%
F 0.65% 1.02%
Al2O3 0.87% 0.63%
Recovery 72.44% 75.16%
Total metal loss 27.56% 38%
It must be noted that reflected in this table are only those components at concentrations
>0.5mass%, detailed chemical analysis results are shown in Table A15. From the results above,
it was decided to accept Betachem 30D – DDA at 15 minutes as the final optimum results for
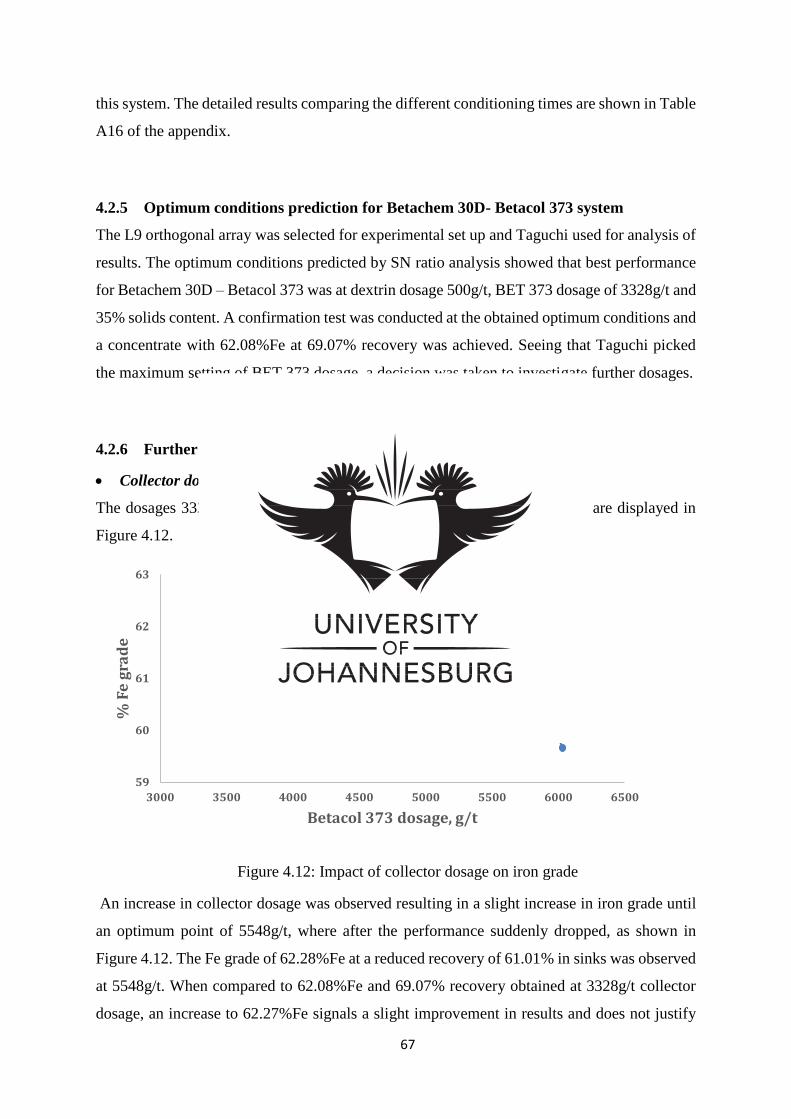
67
this system. The detailed results comparing the different conditioning times are shown in Table
A16 of the appendix.
4.2.5 Optimum conditions prediction for Betachem 30D- Betacol 373 system
The L9 orthogonal array was selected for experimental set up and Taguchi used for analysis of
results. The optimum conditions predicted by SN ratio analysis showed that best performance
for Betachem 30D – Betacol 373 was at dextrin dosage 500g/t, BET 373 dosage of 3328g/t and
35% solids content. A confirmation test was conducted at the obtained optimum conditions and
a concentrate with 62.08%Fe at 69.07% recovery was achieved. Seeing that Taguchi picked
the maximum setting of BET 373 dosage, a decision was taken to investigate further dosages.
4.2.6 Further optimisation of BET 30D – BET 373 system
Collector dosage variation
The dosages 3328g/t, 5548g/t and 7770g/t were investigated and the results are displayed in
Figure 4.12.
Figure 4.12: Impact of collector dosage on iron grade
An increase in collector dosage was observed resulting in a slight increase in iron grade until
an optimum point of 5548g/t, where after the performance suddenly dropped, as shown in
Figure 4.12. The Fe grade of 62.28%Fe at a reduced recovery of 61.01% in sinks was observed
at 5548g/t. When compared to 62.08%Fe and 69.07% recovery obtained at 3328g/t collector
dosage, an increase to 62.27%Fe signals a slight improvement in results and does not justify
59
60
61
62
63
3000 3500 4000 4500 5000 5500 6000 6500
% F
e g
rad
e
Betacol 373 dosage, g/t
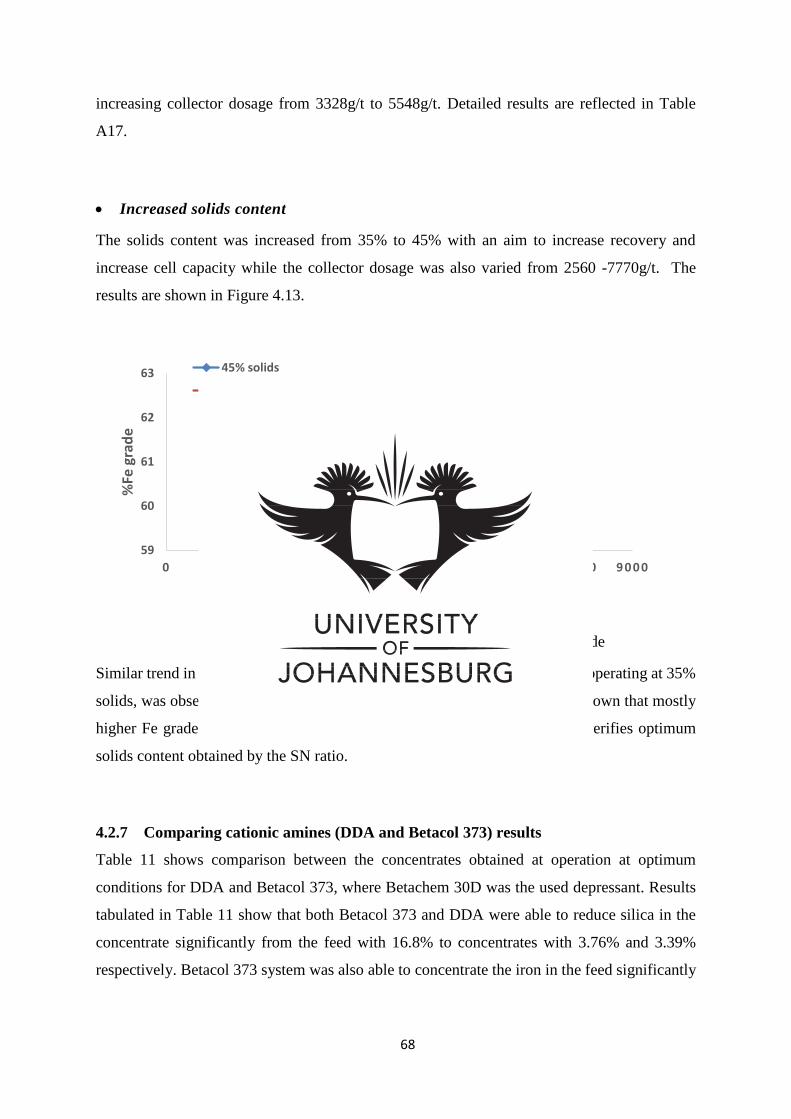
68
increasing collector dosage from 3328g/t to 5548g/t. Detailed results are reflected in Table
A17.
Increased solids content
The solids content was increased from 35% to 45% with an aim to increase recovery and
increase cell capacity while the collector dosage was also varied from 2560 -7770g/t. The
results are shown in Figure 4.13.
Figure 4.13: Impact of increasing solids content on iron grade
Similar trend in iron grade with increased collector dosage, as observed with operating at 35%
solids, was observed at 45% solids content as shown in Figure 4.13. It was shown that mostly
higher Fe grade was achieved when operation at 35% solids content. This verifies optimum
solids content obtained by the SN ratio.
4.2.7 Comparing cationic amines (DDA and Betacol 373) results
Table 11 shows comparison between the concentrates obtained at operation at optimum
conditions for DDA and Betacol 373, where Betachem 30D was the used depressant. Results
tabulated in Table 11 show that both Betacol 373 and DDA were able to reduce silica in the
concentrate significantly from the feed with 16.8% to concentrates with 3.76% and 3.39%
respectively. Betacol 373 system was also able to concentrate the iron in the feed significantly
59
60
61
62
63
0 1 0 0 0 2 0 0 0 3 0 0 0 4 0 0 0 5 0 0 0 6 0 0 0 7 0 0 0 8 0 0 0 9 0 0 0
%Fe
gra
de
Betacol 373 dosage, g/t
45% solids
35% solids
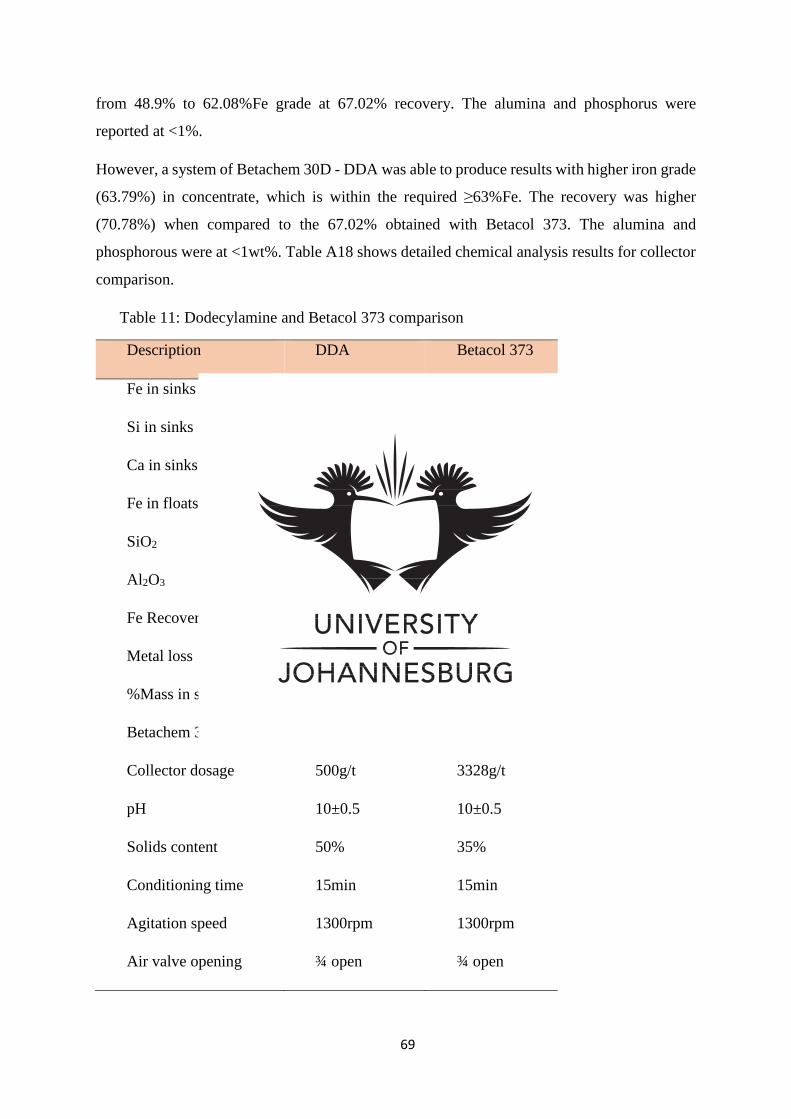
69
from 48.9% to 62.08%Fe grade at 67.02% recovery. The alumina and phosphorus were
reported at <1%.
However, a system of Betachem 30D - DDA was able to produce results with higher iron grade
(63.79%) in concentrate, which is within the required ≥63%Fe. The recovery was higher
(70.78%) when compared to the 67.02% obtained with Betacol 373. The alumina and
phosphorous were at <1wt%. Table A18 shows detailed chemical analysis results for collector
comparison.
Table 11: Dodecylamine and Betacol 373 comparison
Description DDA Betacol 373
Fe in sinks 63.79% 62.08%
Si in sinks 1.76% 1.58%
Ca in sinks 0.71% 2.2%
Fe in floats 40.43% 40.07%
SiO2 3.76% 3.39%
Al2O3 0.87% 0.60%
Fe Recovery 70.78% 67.02%
Metal loss 29.22% 32.98%
%Mass in sinks 54.26% 53.15%
Betachem 30D dosage 500g/t 500g/t
Collector dosage 500g/t 3328g/t
pH 10±0.5 10±0.5
Solids content 50% 35%
Conditioning time 15min 15min
Agitation speed 1300rpm 1300rpm
Air valve opening ¾ open ¾ open
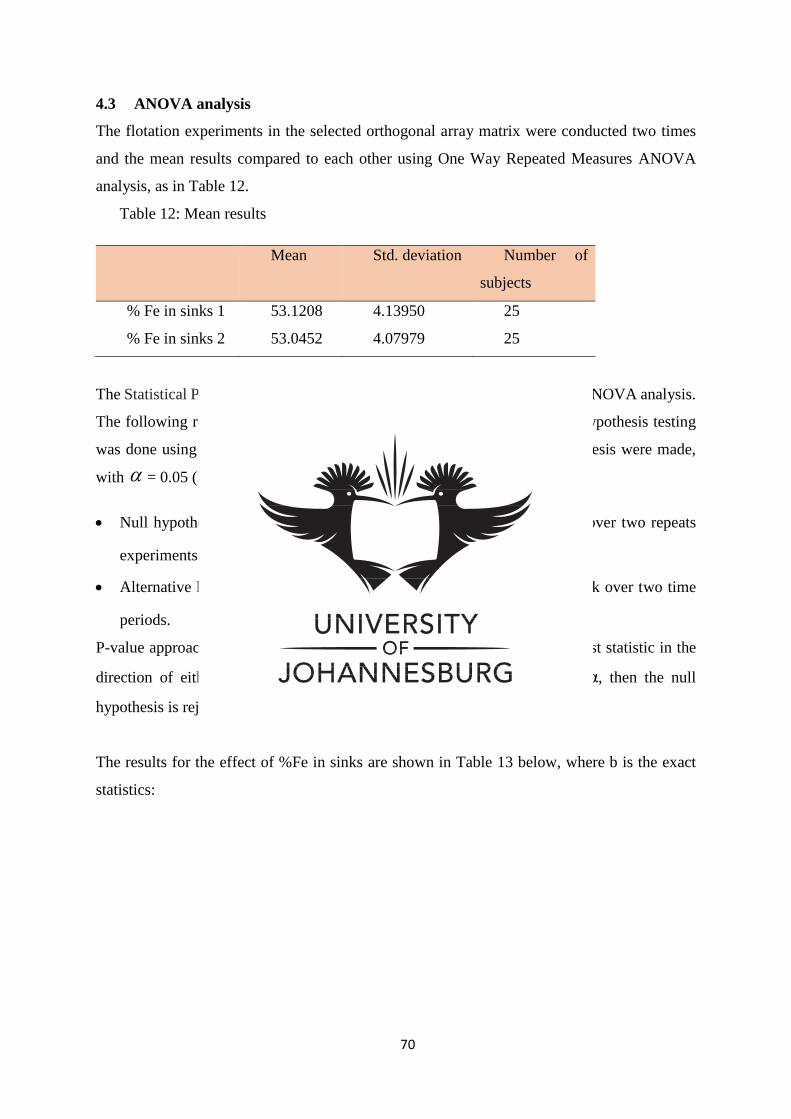
70
4.3 ANOVA analysis
The flotation experiments in the selected orthogonal array matrix were conducted two times
and the mean results compared to each other using One Way Repeated Measures ANOVA
analysis, as in Table 12.
Table 12: Mean results
Mean Std. deviation Number of
subjects
% Fe in sinks 1 53.1208 4.13950 25
% Fe in sinks 2 53.0452 4.07979 25
The Statistical Package for the Social Science (SPSS) software was used for ANOVA analysis.
The following results were obtained for Soluble starch and DDA system. Hypothesis testing
was done using the P-value approach (Pallant, 2010). The following hypothesis were made,
with = 0.05 (Level of significance);
Null hypothesis,0H : There is no change in percentage of iron in sink over two repeats
experiments.
Alternative hypothesis,AH : There is change in percentage of iron in sink over two time
periods.
P-value approach determines the likeliness or un-likeliness of observing a test statistic in the
direction of either a null nor am alternative hypothesis. If P-value is ≤ α, then the null
hypothesis is rejected in favour of the alternative hypothesis.
The results for the effect of %Fe in sinks are shown in Table 13 below, where b is the exact
statistics:
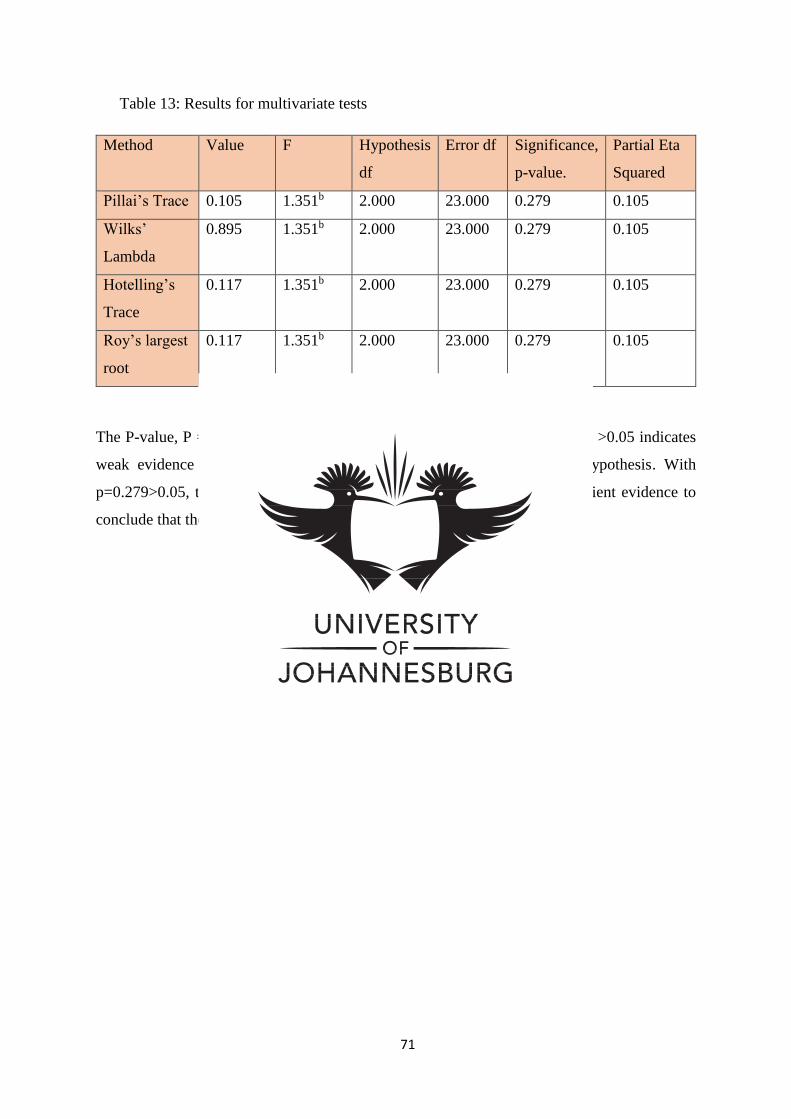
71
Table 13: Results for multivariate tests
Method Value F Hypothesis
df
Error df Significance,
p-value.
Partial Eta
Squared
Pillai’s Trace 0.105 1.351b 2.000 23.000 0.279 0.105
Wilks’
Lambda
0.895 1.351b 2.000 23.000 0.279 0.105
Hotelling’s
Trace
0.117 1.351b 2.000 23.000 0.279 0.105
Roy’s largest
root
0.117 1.351b 2.000 23.000 0.279 0.105
The P-value, P = 0.279, was obtained. According to Ramsey, 2011 a p value >0.05 indicates
weak evidence against the null hypothesis hence failure to reject null hypothesis. With
p=0.279>0.05, the null hypothesis was not rejected, hence, there was sufficient evidence to
conclude that there is no change in percentage of iron in the sinks.
72
5 CHAPTER 5: CONCLUSIONS AND RECOMMENDATIONS
5.1 Conclusions
It was concluded that the fluorspar waste is of fine texture, with a grind size of 80% passing
155µm. Hematite was the main Fe-oxide with minor presence of goethite and magnetite. Silica
was found as the main gangue mineral. Majority of Fe-oxide grains within the sample occur
between the sizes of 10-70μm. The sample was classified as low grade iron oxide since
chemical analysis results using XRF showed that the sample had low iron content 48.9%Fe and
high impurity content of 16.8% SiO2, minor content of fluorine (2.25%) and CaO (3.8%) with
all other elements at <1% composition. There was no need for grinding of the sample since
mineral liberation analysis results showed that 81% of all Fe-oxide were liberated while the
locked Fe-oxide occurred in the <20µm particle size. From the characterisation results it was
concluded that reverse flotation is the suitable separation process to concentrate the Fe in the
fluorspar tailings to acceptable levels of >63wt%Fe required for pig iron production in the
blasting furnaces. Reverse cationic flotation is generally recommended for beneficiation of low
grade iron ores due to its high flotation rates and high selectivity. (Filippov et al., 2014)
Reverse cationic flotation was conducted using amine collector (DDA and Betacol 373) and
two types of depressants (Betachem 30D and soluble starch). The relative significance of
flotation parameters using SN ratio indicated that pH has the most significant effect on iron
grade during reverse cationic flotation. Reverse cationic flotation efficiency increases with
increased pH, however, it drops at alkaline conditions (pH12). Depressant dosage and
conditioning time also play a significant role in increasing flotation performance.
Soluble starch was the best iron depressant, however, when considering a combination of
factors (e.g. performance, cost and availability) Betachem 30D was the preferred depressant.
Both Betacol 373 and DDA performed well in concentrating iron in fluorspar tails, however,
DDA showed superior results under the investigated conditions. A concentrate of 63.79%Fe at
70.78% recovery was achievable using BET 30D – DDA for flotation. The obtained SiO2 and
Al2O3 levels achieved in the concentrate were 3.78% and 0.87% respectively.
This was achieved at DDA dosage of 500g/t, Betachem 30D dosage of 500g/t, 50% solids
content, pH 10, agitation speed of 1300rpm and air valve ¾ open. It was concluded that reverse
cationic flotation is suitable for concentration of iron in fluorspar tailings to acceptable quality
required for agglomeration.
73
It was concluded that use of Taguchi method in optimization of flotation process is effective
and produces reliable results. ANOVA showed that results obtained had acceptable levels of
error with 95% confidence level.
5.2 Recommendations
Further trials using a cheaper and locally available cationic reagents are recommended
due to high cost of DDA.
Agglomeration process is recommended to make the concentrate suitable for blast
furnace feed.
Bentonite is the common binder for iron oxide concentrate. It however contains SiO2
which will affect the pellets quality, since it would increase impurities in the product.
It is there recommended that an investigation into organic binders must be considered
for agglomeration of the Fe concentrate.
Production of a higher Fe grade and lower silica grade by introduction of cleaner cells
is recommended.
The project can be investigated at pilot plant level.
74
6 References
Abbasi, H. R., Bazdar, M. & Halvaee, A., 2007. Effect of phosphorus as an alloying
element on microstructure and mechanical properties of pearlitic gray cast iron. Materials
Science and Engineering A, Volume 444, pp. 314-317.
Abd El-Rahiem, F., Selim, K. & Abdel-Khalek, N., 2009. Some parameters affecting
beneficiation of fine Kaolin particles. The Journal of ORE DRESSING, 11(21), pp. 1-8.
Altan, M., 2010. Reducing shrinkage in injection moldings via the Taguchi, ANOVA and
neural network methods. Materials and Design , Volume 31, pp. 599-604.
Amikiya, C. A., 2014. Characterisation of iron ore - A case study of Mount Tokadeh,
Western Nimba area, Liberia, Liberia: Kwame Nkrumah University of Science and
Technology.
Arantes, R. & Lima, R., 2013. Influence of sodium silicate modulus on iron ore flotation
with sodium oleate. International Journal of Minerals Processing, Volume 125, pp. 157-160.
Araujo, A., Viana, P. & Peres, A., 2005. Reagents in iron ores flotation. Minerals
Engineering , Volume 18, pp. 219-224.
Ata, S., 2012. Phenomena in the froth phase of flotation — A review. International Journal
of Mineral Processing, Volume 102-103, pp. 1-12.
Athreya, S. & Venkatesh, Y., 2012. Application of Taguchi Method for optimization of
process parameters in improving the surface roughness of Lathe facing operation. International
Refereed Journal of Engineering and Science, 1(3), pp. 13-19.
Barclay, S., Trusler, G., von Blottnitz, H. & Buckely, C. A. K. B. J. C., 2011. Cleaner
production: A guidance document for the mining industry in South Africa, Gezina: Water
Research Commision.
Basov, V., 2015. True giants of mining: World's top 10 iron ore mines. [Online]
Available at: http://www.mining.com/true-giants-of-mining-worlds-top-10-iron-ore-mines/
[Accessed 12 November 2016].
Bendell, A., Disney, J. & Pridmore, W., 1989. Taguchi methods: Application in world
industry. New York: IFS Publications.
Bosman, J., 2014. The art and science of dense medium separation. The Journal of The
Southern African Institute of Mining and Metallurgy, Volume 114, pp. 529-536.
Burt, R. O., 1984. Gravity concentration technology. New York: Elsevier.
Carlson, J. J., 2010. Surface chemistry of hematite slurries, Michigan Technological
university: Joshua James Carlson.
Das, B., Prakash, S., Das, S. & Reddy, P., 2007. Effective Beneficiation of low grade iron
ore through jigging operation. Journal of Minerals & Materials Characterization &
Engineering, 7(1), pp. 27-37.
75
Dobbins, M., Dunn, P. & Sherrell, I., 2009. Recent advances in magnetic separator designs
and applications. 7th International Heavy Minerals Conference. The Southern African Institute
of Mining and Metallurgy, pp. 63-70.
du Plessis, B. J. & de Villiers, G., 2007. The application of the Taguchi method in the
evaluation of mechanical flotation in waste activated sludge thickening. Resources,
Conservation and Recycling , Volume 50, pp. 202-210.
Dworzanowski, M., 2012. Maximizing the recovery of fine iron ore using magnetic
separation. The Southern African Institute of Mining and Metallurgy, 112(3).
Filippov, L., Filippova, I. & Severov, V., 2010. The use of collectors mixture in the reverse
cationic flotation of magnetite ore: The role of Fe-bearing silicates. Minerals Engineering,
Volume 23, pp. 91-98.
Filippov, L., Severov, V. & Filippova, I., 2014. An overview of the beneficiation of iron
ores via reverse cationic flotation. International Journal of Minerals Processing, Volume 127,
pp. 62-69.
Fisher, R., 1942. The design of experiments. 3 ed. London: Oliver and Boyd.
Forsmo, S., Björkman, B. & Samskog, P., 2008. Studies on the influence of a flotation
collector reagent on iron ore green pellet properties. Powder Technology , Volume 182, pp.
444-452.
Fuerstenau, D. & Pradip, T., 2005. Zeta potentials in the flotation of oxide and silicate
minerals. Advances in Colloid and Interface Science, Volume 114-115, pp. 9-26.
Fuerstenau, M. C., Jameson, G. & Yoon, R.-H., 2007. Froth flotation: A century of
innovation. Johannesburg: Society for Mining Metallurgy and Exploration Inc.
Golosinski, T. S., 2000. Mining in the new millenium: Challenges and opportunities. Las
Vegas: A.A. Balkema.
Hicks, C. R. & Turner, K. V. J., 1999. Fundamental concepts in the design of experiments.
5 ed. New York: Oxford University Press Inc..
Huang, Z. et al., 2014. Investigations on reverse cationic flotation of iron ore by using a
Gemini surfactant: Ethane-1,2-bis(dimethyl-dodecyl-ammonium bromide). Chemical
Engineering Journal, Volume 257, pp. 218-258.
Innace, J., 2016. S&P Global Platts 2016: Global metal trends. [Online]
Available at: http://platts.com
[Accessed 02 November 2016].
Ivesona, S., Holt, S. & Biggs, S., 2004. Advancing contact angle of iron ores as a function
of their hematite and goethite content: implications for pelletising and sintering. International
Journal of Mineral Processing, Volume 74, pp. 281-287.
Jain, S., 1985. Mineral processing. 2 ed. New Dehli: CBS Publishers.
James Cook University, 2005. Element-to-stoichiometric oxide conversion factors.
[Online]
76
Available at: https://www.jcu.edu.au
[Accessed 12 January 2017].
John, P. W., 1971. Statistical design and analysis of experiments. First printing ed. New
York: Collier-Macmillan Ltd.
Kamaruddin, S., Khan, Z. A. & Wan, K., 2004. The use of the Taguchi method in
determining the optimum plastic injection moulding parameters for the production of a
consumer product. Jurnal Mekanikal, Volume 18, pp. 98-110.
Kar, B., Sahoo, H., Rath, S. S. & Das, B., 2013. Investigations on different starches as
depressants for iron ore flotation. Minerals Engineering, Volume 49, pp. 1-6.
Kario, P. & Brown, A., 2015. How the iron ore market works: Supply and market share.
[Online]
[Accessed 02 November 2016].
King, R., 1982. Principles of flotation. Jhb: South African Institute of Mining and
Metallurgy.
Krishna, S. J. G. et al., 2014. Characterisation and Processing of Some Iron Ores of India.
J. Inst. Eng. India Ser. D, 94(2), pp. 113-120.
Kumar, T. et al., 2010. Reverse flotation studies on an Indian low grade iron ore slimes.
International Journal of Engineering Science and Technology, 2(4), pp. 637-648.
LacCore, N. L. C. F., 2013. Loss on Ignition Standard Operating Procedure, s.l.: LacCore,
National Lacustrine Core Facility.
Lima, N. P., Valadão, G. E. & E.C.Peres, A., 2013. Effect of amine and starch dosages on
the reverse cationic flotation of an iron ore. Minerals Engineering, Volume 45, pp. 180-184.
Limited, S., 2016. Sepfluor. [Online]
Available at: http://sepfuor.co.za/fluorspar
[Accessed 11 November 2016].
Lina, L. et al., 2009. Experimental research on anionic reverse flotation of hematite with a
flotation column. Procedia Earth and Planetary Science , Volume 1, pp. 791-798.
Lin, L. et al., 2009. Experimental research on anionic reverse flotation of hematite with a
flotation column. Procedia Earth and Planetary Science , Volume 1, pp. 791-798.
Liu, W., Moran, C. & Vink, S., 2013. A review of the effect of water quality on flotation.
Minerals Engineering , Volume 53, pp. 91-100.
Loenel, C. & Peres, A., 2013. Calcination as additional unit operation in the pelletizing of
iron ores presenting high contents of loss on ignition. Revista De La Facultad De Ingeniera,
Volume 29, pp. 1-12.
Lubisi, T. P., Nheta, W. & Ntuli, F., 2016. Physical, Chemical and Mineralogical
Characterization of Fluorspar. Proceedings of Materials, Minerals and Energy, South Africa,
Elsevier.
77
Ma, M., 2012. Froth flotation of iron ores. International Journal of Mining Engineering
and Mineral Processing, 1(2), pp. 56-61.
Masiya, T. T. & Nheta, W., 2014. Flotation of Nickel-Copper Sulphide Ore: Optimisation
of Process Parameters Using Taguchi Method. Czech Republic.
Matthews, P. S., 1992. Advanced chemistry. Cambridge: Cambridge University Press.
Ma, X., Marques, M. & Gontijo, C., 2011. Comparative studies of reverse cationic/anionic
flotation of Vale iron ore. International Journal of Minerals Processing, Volume 100, pp. 179-
183.
Mbele, P., 2012. Pelletizing of Sishen concentrate. Journal of Southern African Institute of
Mining and Metallurgy, 112(3), pp. 221-228.
McMurry, J., 2014. General chemistry : atoms first. 2 ed. Boston: Pearson.
Mead, R., 1988. The design of experiments - Statistical principles for practical application.
New York: Press Syndicate of the University of Cambridge.
Michaud, L., 2006. 911 Metallurgist. [Online]
Available at: https://www.911metallurgist.com/blog/fluorspar-beneficiation-process-flotation-
plant
[Accessed 21 November 2016].
Montes-Sotomayor, S., Houot, R. & Kongolo, M., 1998. Technical note flotation of
silicated gangue iron ores: Mechanism and effecte of starch. Minerals Engineering, 11(1), pp.
71-76.
Montgomery, D. C., 2009. Design and analysis of experiments. 7 ed. Arizona: John Wiley
and Sons.
Mowla, D., Karimi, G. & Ostadnezhad, K., 2008. Removal of hematite from silica sand ore
by reverse flotation technique. Separation and Purification Technology , Volume 58, pp. 419-
423.
Myburgh, H. A. & Nortje, A., 2014. Operation and performance of the Sishen jig plant.
The Journal of The Southern African Institute of Mining and Metallurgy, Volume 114, p. 574.
Nayak, N. P., November 2013. Mineralogical Constraints in Beneficiation Of Low Grade
Iron Ores of Barsua, Eastern India. International Journal of Engineering and Innovative
Technology, 3(5), pp. 1096-113.
Nguyen, A., 2013. Froth Flotation, The University of Queensland, Australia: Elsevier.
Ng, W. S., Sonsie, R., Forbes, E. & Franks, G. V., 2015. Flocculation/flotation of hematite
fines with anionic temperature-responsive polymer acting as a selective flocculant and
collector. Minerals Engineering, Volume 77, pp. 64-71.
Nheta, W., Lubisi, T. P., Masemola, S. & Makhatha, M. E., 2015. Beneficiation of
Haematite from Fluorspar Tailings by Reverse Flotation. Proceedings of the World Congress
on Mechanical, Chemical and Materia Engineering, Paper no 346, page 1-6.
78
Nyambayo, C. K., 2014. The use of mixed thiol collectors in the flotation of Nkomati sulfide
ore, Cape town: University of Cape Town.
Pallant, J., 2010. SPSS survival manual : a step by step guide to data analysis using SPSS.
4th ed. Maidenhead: Open University Press.
Parrent, M., 2012. Separation of pyrolusite and hematite by froth flotation, Edmonton:
University of Alberta..
Pavlovic, S. & Brandao, P., 2003. Adsorption of starch, amylose, amylopectin and glucose
monomerand their effect on the flotation of hematite and quartz. Minerals Engineering,
Volume 16, pp. 1117-1122.
Pearse, M., 2005. An overview of the use of chemical reagents in mineral processing.
Minerals Engineering , Volume 18, pp. 139-149.
Quast, K., 2005. Flotation of hematite using C6–C18 saturated fatty acids. Minerals
Engineering , 19(6-8), pp. 582-597.
Quast, K., 2015. Use of conditioning time to investigate the mechanisms of interactions of
selected fatty acids on hematite. Part 1: Literature survey. Minerals Engineering, Volume 79,
pp. 295-300.
Rachappa, S., Prakash, Y. & Amit, 2015. Iron ore recovery from low grades by using
advanced methods. Procedia Earth and Planetary Science, Volume 11, pp. 195-197.
Ramsaywok, P., Vermaak. M., K. G. & Viljoen, R., 2010. Case study: high capacity spiral
concentrators. The Journal of The Southern African Institute of Mining and Metallurgy,
Volume 110, pp. 637-642.
Rao, D. S. et al., 2009. Mineralogy and Geochemistry of a low grade iron ore sample from
Bellary-Hospet Sector, India and their implications on beneficiation. Journal of Mineral &
MaterialsCharacterization & Engineering, 8(2), pp. 115-132.
Rao, H. K. & Forssberg, K., 1997. Mixed collector systems in flotation. International
Journal of Mineral Processing, Volume 51, pp. 67-79.
Rusch, B., Hanna, K. & Humbert, B., 2010. Coating of quartz silica with iron oxides:
Characterization and surface reactivity of iron coating phases. Colloids and Surfaces A:
Physicochem and Engineering Aspects, Volume 353, pp. 172-180.
Santana, R. C., Anna C.C., Farnese, Marilia C.B. Fortes, Carlos, H. Aaide, Marcos. A.B.
Barrozo. 2008. Influence of particle size and reagent dosage on the performance of apatite
flotation. Separation and Purification Technology , Volume 64, pp. 8-15.
Santos, I. D. & Oliveira, J. F., 2007. Utilization of humic acid as a depressant for hematite
in the reverse flotation of iron ore. Mineral Engineering, Volume 20, pp. 1003-1007.
Sapakal, S. & Telsang, M., 2012. Parametric optimization of MIG welding using Taguchi
design method. International Journal of Advanced Engineering Research and Studies, 1(4),
pp. 28-30.
79
Seifelnassr, A. A. S., Moslim, E. M. & Abouzeid, A.-Z. M., 2013. Concentration of a
Sudanese low-grade iron ore. International Journal of Mineral Processing, Volume 122, pp.
59-62.
Singh, G. et al., 2015. Iron Ore Pelletization Technology and its Environmental Impact
Assessment in Eastern Region of India - A Case study. Procedia Earth and Planetary Science,
Volume 11, pp. 582-597.
Srivastava, M., Pan, S., Prasad, N. & Mishra, B., 2001. Characterization and processing of
iron ore fines of Kiriburu deposit of India. International Journal of Mineral Processing ,
Volume 61, pp. 93-107.
Statics, S. A., 2016. Statics South Africa - Iron ore. [Online]
Available at: http://www.statssa.gov.za
[Accessed Thursday September 2016].
Statista, 2016. Iron ore prices from September 2015 to September 2016. [Online]
Available at: https://www.statista.com/statistics/300419/monthly-iron-ore-prices/
[Accessed 12 November 2016].
Tofighy, M. A. & Mohammadi, T., 2012. Application of Taguchi experimental design in
optimization of desalination using purified carbon nanotubes as adsorbent. Materials research
bulletin, Volume 47, pp. 2389-2395.
Tombell, D., 2011. Flotation of cobalt bearing minerals from a copper mixed copper-
cobalt oxidised ore, SA: University of JHB.
Transparency Market Research, 2016. Iron and steel market - Global industry analysis,
seze, share, growth, trends and forecast 2016-2024. [Online]
Available at: http://www.transparencymarketresearch.com/iron-steel-market.html
[Accessed 02 November 2016].
Tripathy, S. K., Murthy, Y. R. & Singh, V., 2013. Characterisation and separation studies
of Indian chromite beneficiation plant tailing. International Journal of Mineral Processing ,
Volume 122, pp. 47-53.
Turrer, H. & Peres, A., 2010. Investigation on alternative depressants for iron ore flotation.
Minerals Engineering, Volume 23, pp. 1066-1069.
Tutorvista, 2016. Concentration - Enrichment of Ores. [Online]
Available at: http://www.tutorvista.com/content/science/science-ii/metals-non-
metals/enrichment-ores.php
[Accessed 11 November 2016].
Umadevi, T. et al., 2013. Recovery of Iron Bearing Minerals from Beneficiation Plant 2
Thickner Underflow of JSW Steel Limited. Journal of Minerals and Materials
Characterization and Engineering, 2013, 1, 55-60, Volume 1, pp. 55-60.
Vergenoeg Mining Company, 2016. MinerSA group. [Online]
Available at: http://www.minersa.com/eng/vergenoeg_mining.php
[Accessed 11 November 2016].
80
Vermaak, M. K. G., Visser, H. J. & Bosman, J. B., 2008. A simple process control model
for spiral concentrators. The Journal of The Southern African Institute of Mining and
Metallurgy, Volume 108, pp. 147-153.
Vidyadhar, A., Kumari, N. & Bhagat, R., 2012. Adsorption mechanism of mixed collector
systems on hematite flotation. Minerals Engineering, Volume 26, pp. 102-104.
Vidyadhar, A., Kumari, N. & Bhagat, R. P., 2012. Flotation of quartz and hematite:
Adsorption mechanism of mixed cationic/anionic collector systems, India: IMPC, New Dehli.
Voges, H., 1975. The use of heavy-medium separation in the processing of iron ore. Journal
of the South African Institute of Mining and Metallurgy, pp. 303-306.
Wei, S. N., Rowan, S., Forbes, E. & Franks, G. V., 2015. Flocculation/flotation of hematite
fines with anionic temperature responsive polymer acting as a selective flocculant and
collector. Minerals Engineering, Volume 77, pp. 64-71.
Wen-gang, L. et al., 2009. A new collector used for flotation of oxide minerals.
Transactions of Nonferrous Metals Society of China, Volume 19, pp. 1326-1330.
Wills, B.A, 2006. Will's Mineral Processing Technology: an introduction to the practical
aspects of ore treatement and mineral recovery. 6 ed. Canada: Elsevier.
Wills, B.A & Finch, J., 2016. Will's Mineral Processing Technology: An introduction to
the practical aspects of ore treatement and mineral recovery. 8 ed. Canada: Elsevier.
Wilson, M. G. C. & Anhaeusser, C. R., 1998. The mineral resources of South Africa:
Handbook. 6 ed. Pretoria: Council for Geoscience.
Xu, Z. & Zhou, Z., 2013. FLOTATION | Historical Development, Canada: Elsevier.
Yuhua, W. & Jianwei, R., 2005. The flotation of quartz from iron minerals with a combined
quaternary ammonium salt. International Journal of Mineral Processing, Volume 77, pp. 116-
122.
Zhou, Y. et al., 2014. Comparative study on the adsorption interactions of humic acid onto
natural magnetite, hematite and quartz: Effect of initial HA concentration. Powder Technology,
Volume 251, pp. 1-8.
Zogo, J.-C. B., 2009. Beneficiation potential of low grade iron-ore from a discard lumpy
stockpile and fines tailings dam at Beeshoek Mine, Northern Cape Province, South Africa,
University of Jhb.
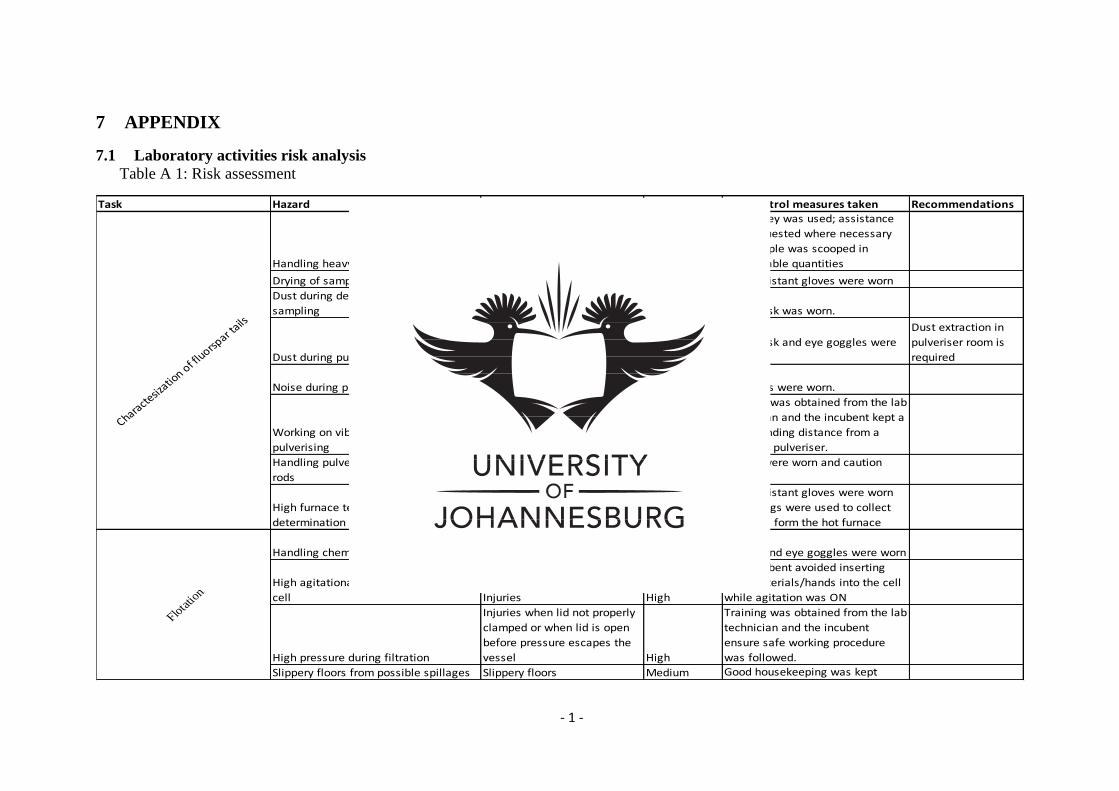
- 1 -
7 APPENDIX
7.1 Laboratory activities risk analysis
Table A 1: Risk assessment
Task Hazard Risk Risk rating Risk control measures taken Recommendations
Handling heavy sample bags Back injuries High
Flat trolley was used; assistance
was requested where necessary
and sample was scooped in
manageable quantities
Drying of sample at 70oC Burns Low Heat resistant gloves were worn
Dust during delumping and sub-
sampling Dust inhalation Medium Dust musk was worn.
Dust during pulvurising of sample
Dust inhalation and eye
irritation Medium
Dust musk and eye goggles were
worn
Dust extraction in
pulveriser room is
required
Noise during pulverising of sample
Hearing problems due to
prolong exposures Medium Ear muffs were worn.
Working on vibrating machinery during
pulverising
Injuries due machinery de-
coupling Medium
Training was obtained from the lab
technician and the incubent kept a
safe standing distance from a
vibrating pulveriser.
Handling pulveriser metal rings and
rods Possible pintching of fingers Low
Gloves were worn and caution
applied
High furnace temperature during LOI
determination Injuries due to burns High
Heat resistant gloves were worn
and thongs were used to collect
crucibles form the hot furnace
Characte
sizatio
n of fluorsp
ar tails
Handling chemicals such as HCl, NaOH Eye irritation and skin burns Medium Gloves and eye goggles were worn
High agitational speed in the flotation
cell Injuries High
The incubent avoided inserting
rigid materials/hands into the cell
while agitation was ON
High pressure during filtration
Injuries when lid not properly
clamped or when lid is open
before pressure escapes the
vessel High
Training was obtained from the lab
technician and the incubent
ensure safe working procedure
was followed.
Slippery floors from possible spillages Slippery floors Medium Good housekeeping was kept
Flota
tion
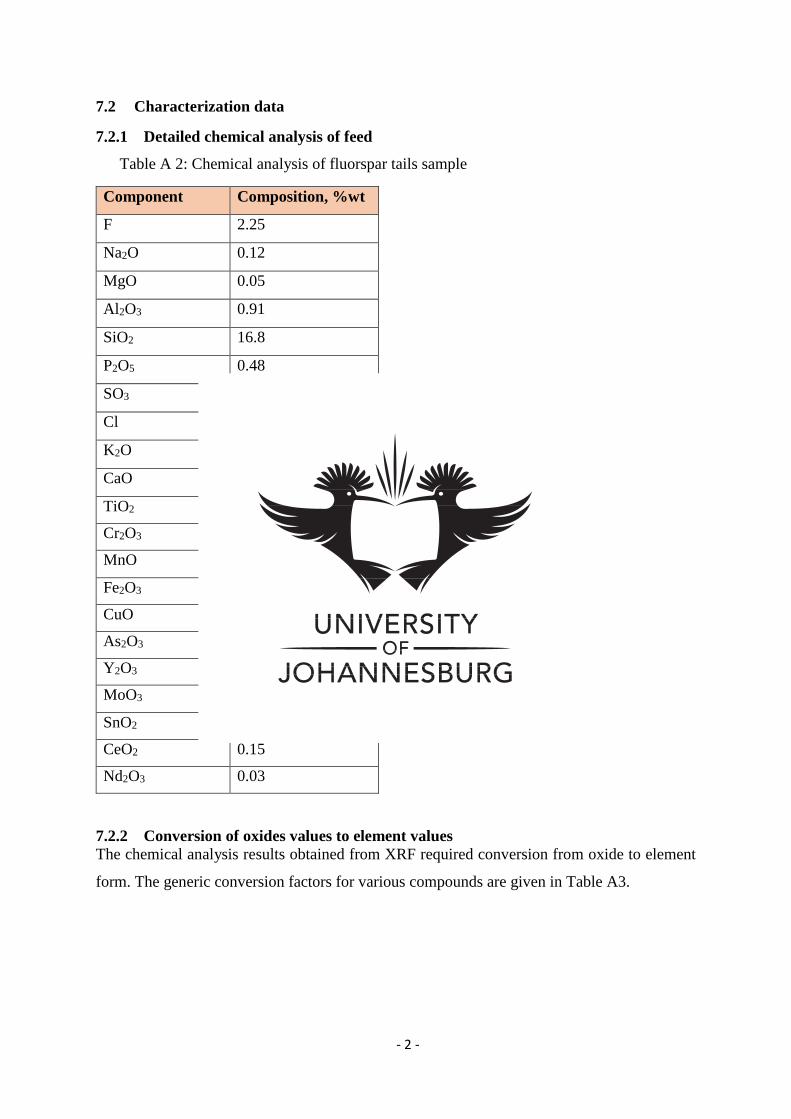
- 2 -
7.2 Characterization data
7.2.1 Detailed chemical analysis of feed
Table A 2: Chemical analysis of fluorspar tails sample
Component Composition, %wt
F 2.25
Na2O 0.12
MgO 0.05
Al2O3 0.91
SiO2 16.8
P2O5 0.48
SO3 0.06
Cl 0.21
K2O 0.14
CaO 3.80
TiO2 0.11
Cr2O3 0.01
MnO 0.23
Fe2O3 69.9
CuO 0.62
As2O3 0.21
Y2O3 0.11
MoO3 0.11
SnO2 0.32
CeO2 0.15
Nd2O3 0.03
7.2.2 Conversion of oxides values to element values
The chemical analysis results obtained from XRF required conversion from oxide to element
form. The generic conversion factors for various compounds are given in Table A3.
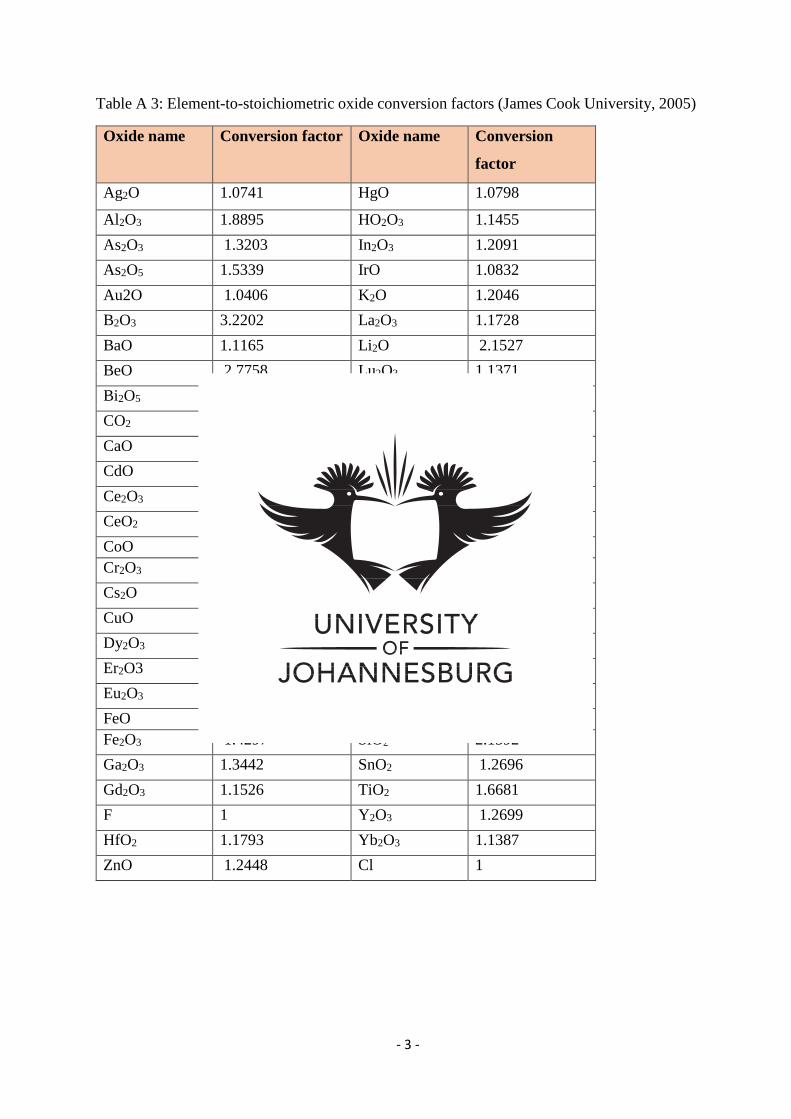
- 3 -
Table A 3: Element-to-stoichiometric oxide conversion factors (James Cook University, 2005)
Oxide name Conversion factor Oxide name Conversion
factor
Ag2O 1.0741 HgO 1.0798
Al2O3 1.8895 HO2O3 1.1455
As2O3 1.3203 In2O3 1.2091
As2O5 1.5339 IrO 1.0832
Au2O 1.0406 K2O 1.2046
B2O3 3.2202 La2O3 1.1728
BaO 1.1165 Li2O 2.1527
BeO 2.7758 Lu2O3 1.1371
Bi2O5 1.1914 MgO 1.6582
CO2 3.6644 MnO 1.2912
CaO 1.3992 MnO2 1.5825
CdO 1.1423 MoO3 1.5003
Ce2O3 1.1713 N2O5 3.8551
CeO2 1.2284 Na2O 1.3480
CoO 1.2715 Nb2O5 1.4305
Cr2O3 1.4615 Nd2O3 1.1664
Cs2O 1.0602 NiO 1.2725
CuO 1.2518 OsO 1.0841
Dy2O3 1.1477 P2O5 2.2916
Er2O3 1.1435 PbO 1.0772
Eu2O3 1.1579 SO3 2.4972
FeO 1.2865 SeO3 1.6079
Fe2O3 1.4297 SiO2 2.1392
Ga2O3 1.3442 SnO2 1.2696
Gd2O3 1.1526 TiO2 1.6681
F 1 Y2O3 1.2699
HfO2 1.1793 Yb2O3 1.1387
ZnO 1.2448 Cl 1
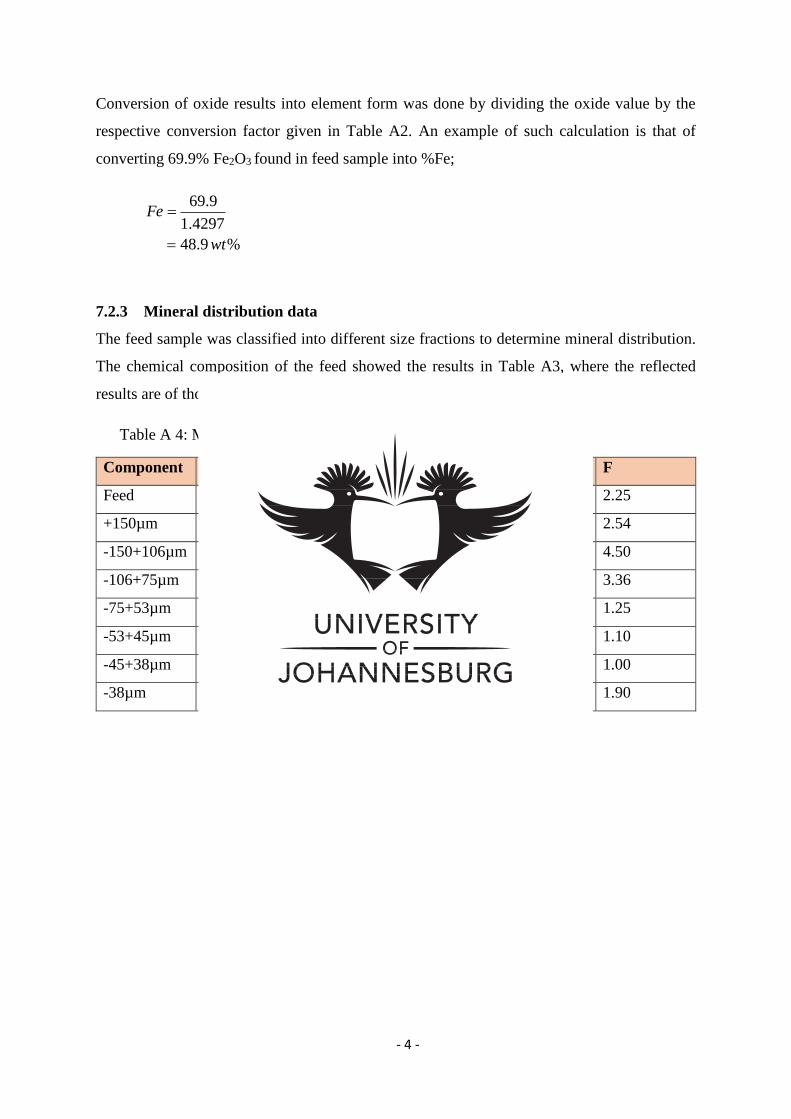
- 4 -
Conversion of oxide results into element form was done by dividing the oxide value by the
respective conversion factor given in Table A2. An example of such calculation is that of
converting 69.9% Fe2O3 found in feed sample into %Fe;
%9.48
4297.1
9.69
wt
Fe
7.2.3 Mineral distribution data
The feed sample was classified into different size fractions to determine mineral distribution.
The chemical composition of the feed showed the results in Table A3, where the reflected
results are of those compounds present in concentrations >0.5%
Table A 4: Mineral distribution data
Component Fe SiO2 CaO Al2O3 F
Feed 48.90 16.80 3.80 1.21 2.25
+150µm 33.59 32.78 8.90 1.27 2.54
-150+106µm 44.61 21.07 6.48 1.23 4.50
-106+75µm 48.91 18.61 4.58 1.08 3.36
-75+53µm 49.42 21.53 4.12 1.25 1.25
-53+45µm 49.66 18.78 3.10 1.02 1.10
-45+38µm 49.55 22.50 3.33 1.25 1.00
-38µm 52.09 15.22 4.09 1.42 1.90
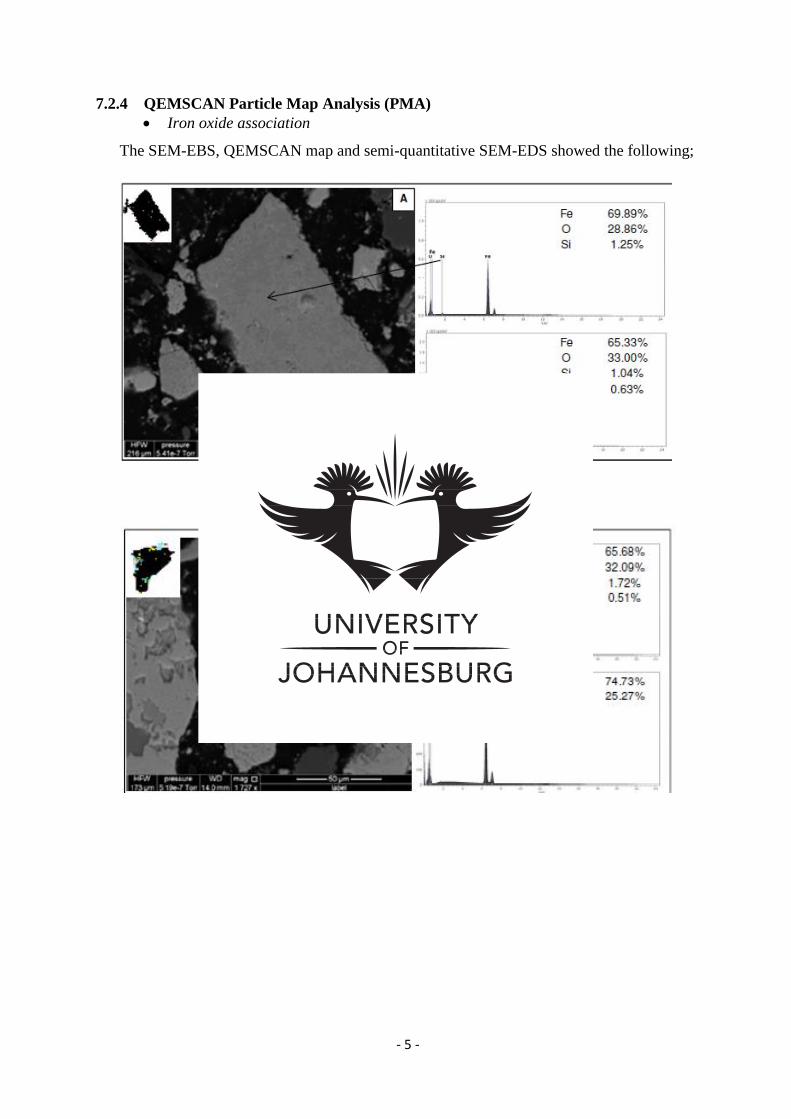
- 5 -
7.2.4 QEMSCAN Particle Map Analysis (PMA)
Iron oxide association
The SEM-EBS, QEMSCAN map and semi-quantitative SEM-EDS showed the following;
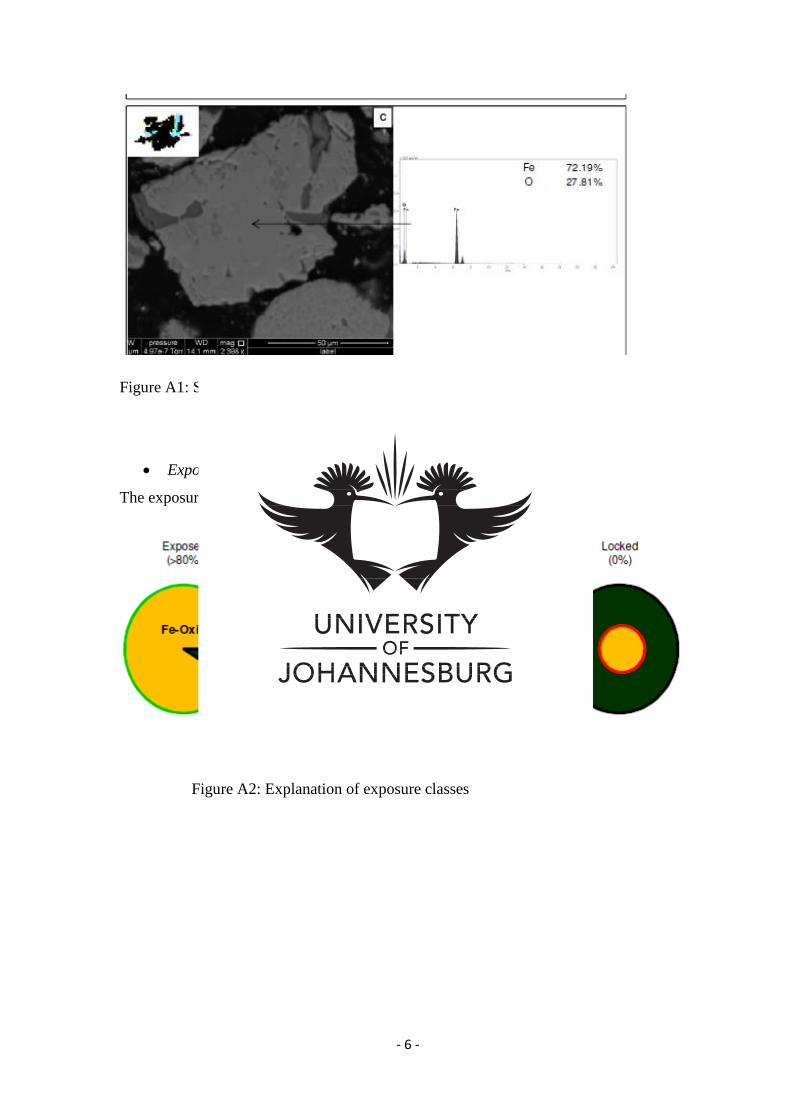
- 6 -
Figure A1: SEM-EDS diagram showing association of Fe-oxide
Exposure characteristics
The exposure classes are explained below;
Figure A2: Explanation of exposure classes

- 7 -
Table A 5: Exposure and mineral association characteristics of Fe-oxides
Class Area of Fe-oxides %
Exposed (≥80%) 80.61
Exposed (≥10%<80) 18.41
Exposed <10% 0.48
Total 99.50
Locked in silicates 0.27
Locked in fluorites 0.06
Locked in sulphides 0.00
Locked in oxides 0.00
Locked in phosphates and carbonates 0.01
Locked in fluorite/silicates 0.12
Locked in sulphides/silicates/fluorite 0.00
Locked on poly-mineral boundary 0.04
Total locked 0.5
Total 100
Liberation characteristic explanation
Figure A3: Explanation of liberation characteristic analysis
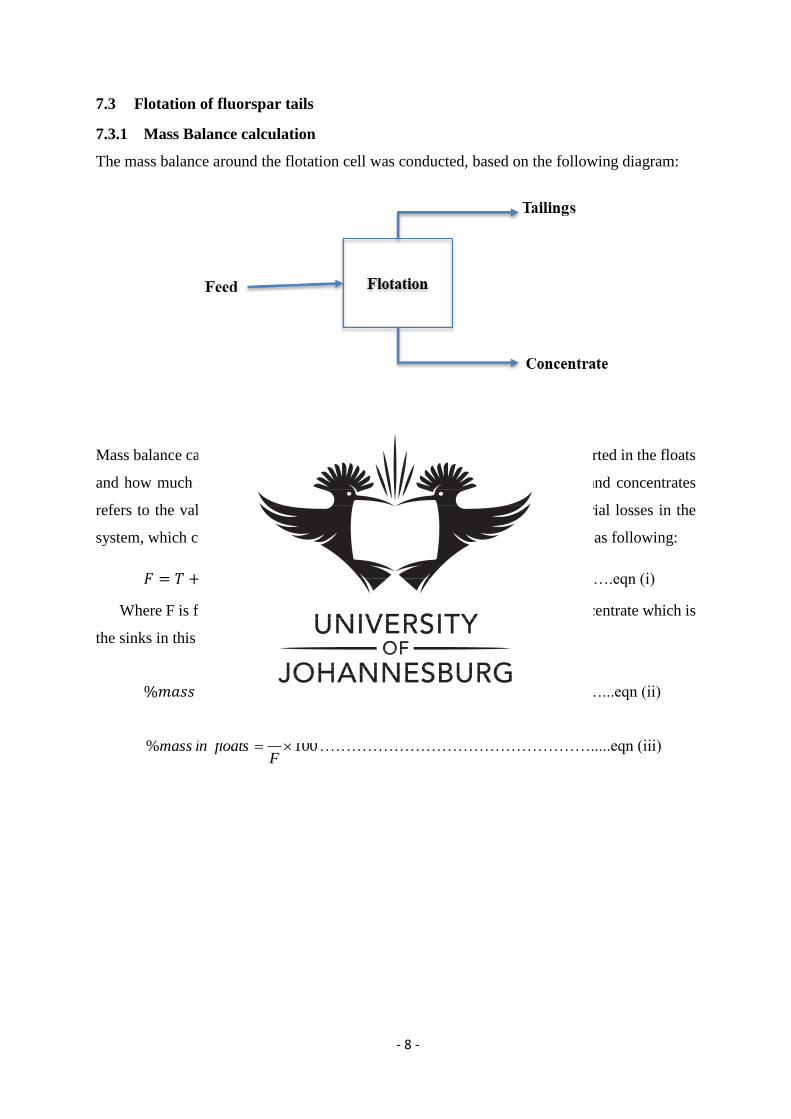
- 8 -
7.3 Flotation of fluorspar tails
7.3.1 Mass Balance calculation
The mass balance around the flotation cell was conducted, based on the following diagram:
Figure A4: Overall flotation diagram
Mass balance calculation are important as they tell how much of the feed reported in the floats
and how much in the sinks. The tailing refers to the waste mineral stream and concentrates
refers to the valuable mineral stream. Mass balance also identifies the material losses in the
system, which could be due to spillages etc. The mass balance was calculated as following:
𝐹 = 𝑇 + 𝐶 …………………………………………………………….….eqn (i)
Where F is feed, T is tailings which is the floats in this study, C is the concentrate which is
the sinks in this study. The mass split was calculated as follows:
%𝑚𝑎𝑠𝑠 𝑖𝑛 𝑠𝑖𝑛𝑘𝑠 = 100F
C………………………….………..………...eqn (ii)
100% F
Tfloatsinmass …………………………………………….....eqn (iii)
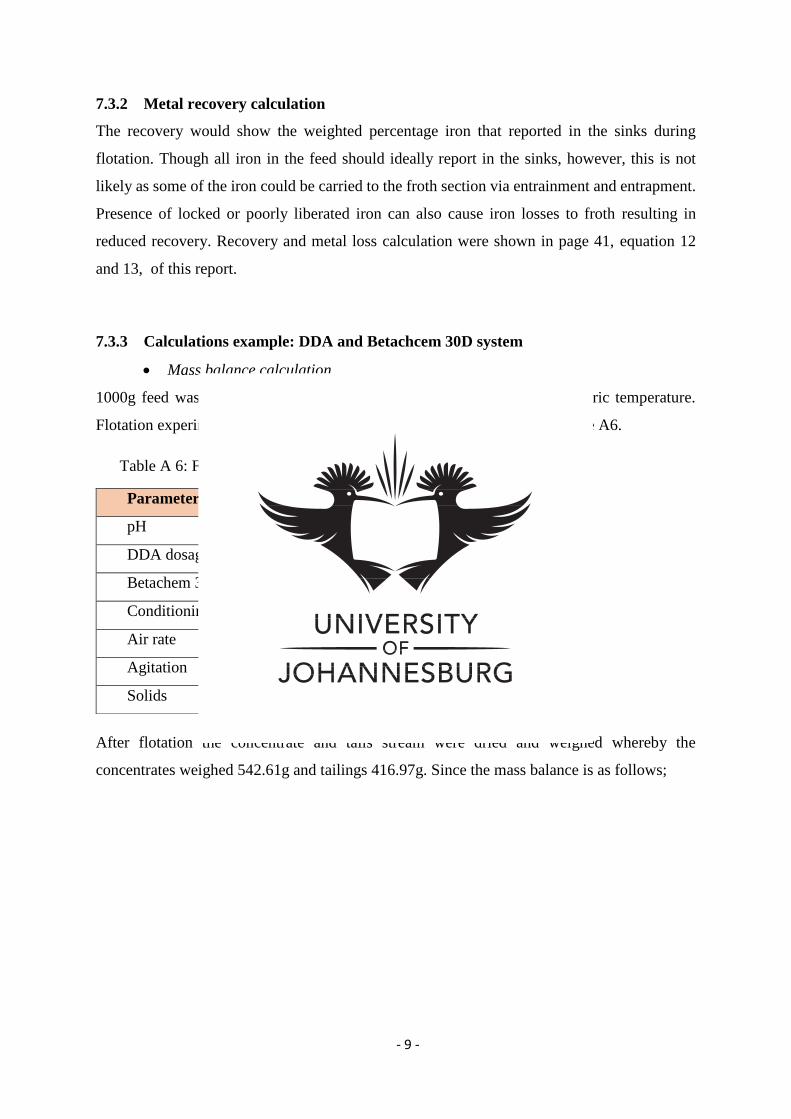
- 9 -
7.3.2 Metal recovery calculation
The recovery would show the weighted percentage iron that reported in the sinks during
flotation. Though all iron in the feed should ideally report in the sinks, however, this is not
likely as some of the iron could be carried to the froth section via entrainment and entrapment.
Presence of locked or poorly liberated iron can also cause iron losses to froth resulting in
reduced recovery. Recovery and metal loss calculation were shown in page 41, equation 12
and 13, of this report.
7.3.3 Calculations example: DDA and Betachcem 30D system
Mass balance calculation
1000g feed was prepared to slurry using 2litre domestic water at atmospheric temperature.
Flotation experiment was conducted at operating conditions reflected in Table A6.
Table A 6: Flotation operating conditions
After flotation the concentrate and tails stream were dried and weighed whereby the
concentrates weighed 542.61g and tailings 416.97g. Since the mass balance is as follows;
Parameter Level
pH 10-10.5
DDA dosage 500g/t
Betachem 30D dosage 500g/t
Conditioning time 15min
Air rate Valve ¾ open
Agitation 1300rpm
Solids 50%
- 10 -
TCFthatobservedwasIt
gTCSince
gTCF
58.95997.41616.542,
1000
The discrepancy when comparing input with output could be due to material loss due to
spillages, during equipment washing and material left in the filter papers. This loss was
calculated as following:
%04.4
10001000
97.41661.5421000
100
F
TCFlossMaterial
Generally material loss of up to 10% is acceptable during flotation, hence 4.04% loss was
deemed to be within acceptable limits.
Mass split calculation
The percentage mass was calculated to determine the mass pull,
%3.54
1001000
61.542
100sinksin %mass
F
C
%7.41
1001000
97.416
100
F
Tfloatsinmass
7.3.4 Recovery calculation
Chemical composition of the feed, tailings and concentrate stream was conducted to determine
iron grade and recovery. The iron assay in concentrate stream was measured 63.79% and 48.9%
Fe in feed. Metal recovery was then calculated according to equation 2.12;
- 11 -
%78.70
100489.01000
6379.061.542
100RRecover,
Ff
Cc
7.3.5 Taguchi DOE for flotation using soluble starch- DDA
The parameters investigated for this system was soluble starch dosage, DDA dosage, pH, solids
content and conditioning time. L25 orthogonal matrix was used for arranging experimental
settings. Minitab 17 was used for computing of data and its analysis thereof. An example of
the resulting data spreadsheet in Table A7.
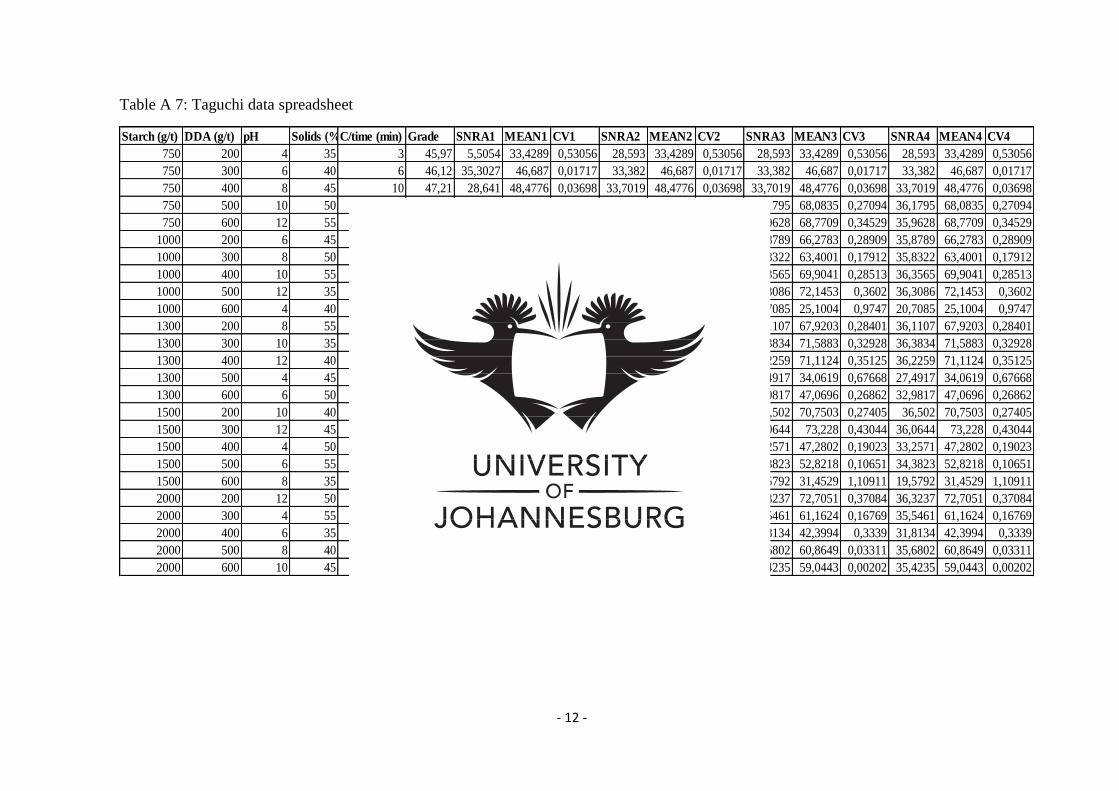
- 12 -
Table A 7: Taguchi data spreadsheet
Starch (g/t) DDA (g/t) pH Solids (%)C/time (min) Grade SNRA1 MEAN1 CV1 SNRA2 MEAN2 CV2 SNRA3 MEAN3 CV3 SNRA4 MEAN4 CV4
750 200 4 35 3 45,97 5,5054 33,4289 0,53056 28,593 33,4289 0,53056 28,593 33,4289 0,53056 28,593 33,4289 0,53056
750 300 6 40 6 46,12 35,3027 46,687 0,01717 33,382 46,687 0,01717 33,382 46,687 0,01717 33,382 46,687 0,01717
750 400 8 45 10 47,21 28,641 48,4776 0,03698 33,7019 48,4776 0,03698 33,7019 48,4776 0,03698 33,7019 48,4776 0,03698
750 500 10 50 15 55,04 11,3427 68,0835 0,27094 36,1795 68,0835 0,27094 36,1795 68,0835 0,27094 36,1795 68,0835 0,27094
750 600 12 55 20 51,98 9,2363 68,7709 0,34529 35,9628 68,7709 0,34529 35,9628 68,7709 0,34529 35,9628 68,7709 0,34529
1000 200 6 45 15 52,73 10,7794 66,2783 0,28909 35,8789 66,2783 0,28909 35,8789 66,2783 0,28909 35,8789 66,2783 0,28909
1000 300 8 50 20 55,37 14,9371 63,4001 0,17912 35,8322 63,4001 0,17912 35,8322 63,4001 0,17912 35,8322 63,4001 0,17912
1000 400 10 55 3 55,81 10,899 69,9041 0,28513 36,3565 69,9041 0,28513 36,3565 69,9041 0,28513 36,3565 69,9041 0,28513
1000 500 12 35 6 53,77 8,8692 72,1453 0,3602 36,3086 72,1453 0,3602 36,3086 72,1453 0,3602 36,3086 72,1453 0,3602
1000 600 4 40 10 42,4 0,2226 25,1004 0,9747 20,7085 25,1004 0,9747 20,7085 25,1004 0,9747 20,7085 25,1004 0,9747
1300 200 8 55 6 54,28 10,9332 67,9203 0,28401 36,1107 67,9203 0,28401 36,1107 67,9203 0,28401 36,1107 67,9203 0,28401
1300 300 10 35 10 54,92 9,6487 71,5883 0,32928 36,3834 71,5883 0,32928 36,3834 71,5883 0,32928 36,3834 71,5883 0,32928
1300 400 12 40 15 53,45 9,0876 71,1124 0,35125 36,2259 71,1124 0,35125 36,2259 71,1124 0,35125 36,2259 71,1124 0,35125
1300 500 4 45 20 50,36 3,3924 34,0619 0,67668 27,4917 34,0619 0,67668 27,4917 34,0619 0,67668 27,4917 34,0619 0,67668
1300 600 6 50 3 56,01 11,4174 47,0696 0,26862 32,9817 47,0696 0,26862 32,9817 47,0696 0,26862 32,9817 47,0696 0,26862
1500 200 10 40 20 57,04 11,2433 70,7503 0,27405 36,502 70,7503 0,27405 36,502 70,7503 0,27405 36,502 70,7503 0,27405
1500 300 12 45 3 50,94 7,3218 73,228 0,43044 36,0644 73,228 0,43044 36,0644 73,228 0,43044 36,0644 73,228 0,43044
1500 400 4 50 6 53,64 14,4145 47,2802 0,19023 33,2571 47,2802 0,19023 33,2571 47,2802 0,19023 33,2571 47,2802 0,19023
1500 500 6 55 10 56,8 19,4523 52,8218 0,10651 34,3823 52,8218 0,10651 34,3823 52,8218 0,10651 34,3823 52,8218 0,10651
1500 600 8 35 15 56,12 -0,8995 31,4529 1,10911 19,5792 31,4529 1,10911 19,5792 31,4529 1,10911 19,5792 31,4529 1,10911
2000 200 12 50 10 53,64 8,6162 72,7051 0,37084 36,3237 72,7051 0,37084 36,3237 72,7051 0,37084 36,3237 72,7051 0,37084
2000 300 4 55 15 53,91 15,5098 61,1624 0,16769 35,5461 61,1624 0,16769 35,5461 61,1624 0,16769 35,5461 61,1624 0,16769
2000 400 6 35 20 52,41 9,5277 42,3994 0,3339 31,8134 42,3994 0,3339 31,8134 42,3994 0,3339 31,8134 42,3994 0,3339
2000 500 8 40 3 59,44 29,6013 60,8649 0,03311 35,6802 60,8649 0,03311 35,6802 60,8649 0,03311 35,6802 60,8649 0,03311
2000 600 10 45 6 58,96 53,8928 59,0443 0,00202 35,4235 59,0443 0,00202 35,4235 59,0443 0,00202 35,4235 59,0443 0,00202
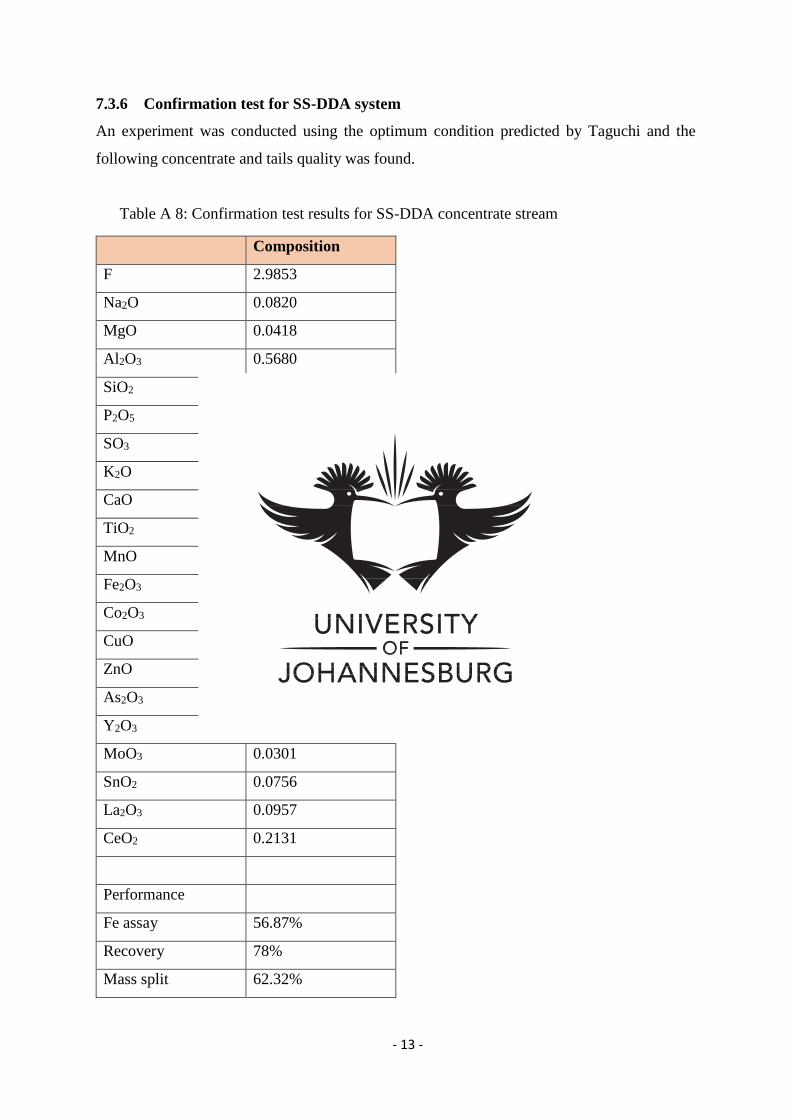
- 13 -
7.3.6 Confirmation test for SS-DDA system
An experiment was conducted using the optimum condition predicted by Taguchi and the
following concentrate and tails quality was found.
Table A 8: Confirmation test results for SS-DDA concentrate stream
Composition
F 2.9853
Na2O 0.0820
MgO 0.0418
Al2O3 0.5680
SiO2 5.3104
P2O5 0.3441
SO3 0.2506
K2O 0.0282
CaO 7.7281
TiO2 0.0433
MnO 0.3821
Fe2O3 81.2976
Co2O3 0.0652
CuO 0.0868
ZnO 0.0123
As2O3 0.0792
Y2O3 0.2807
MoO3 0.0301
SnO2 0.0756
La2O3 0.0957
CeO2 0.2131
Performance
Fe assay 56.87%
Recovery 78%
Mass split 62.32%
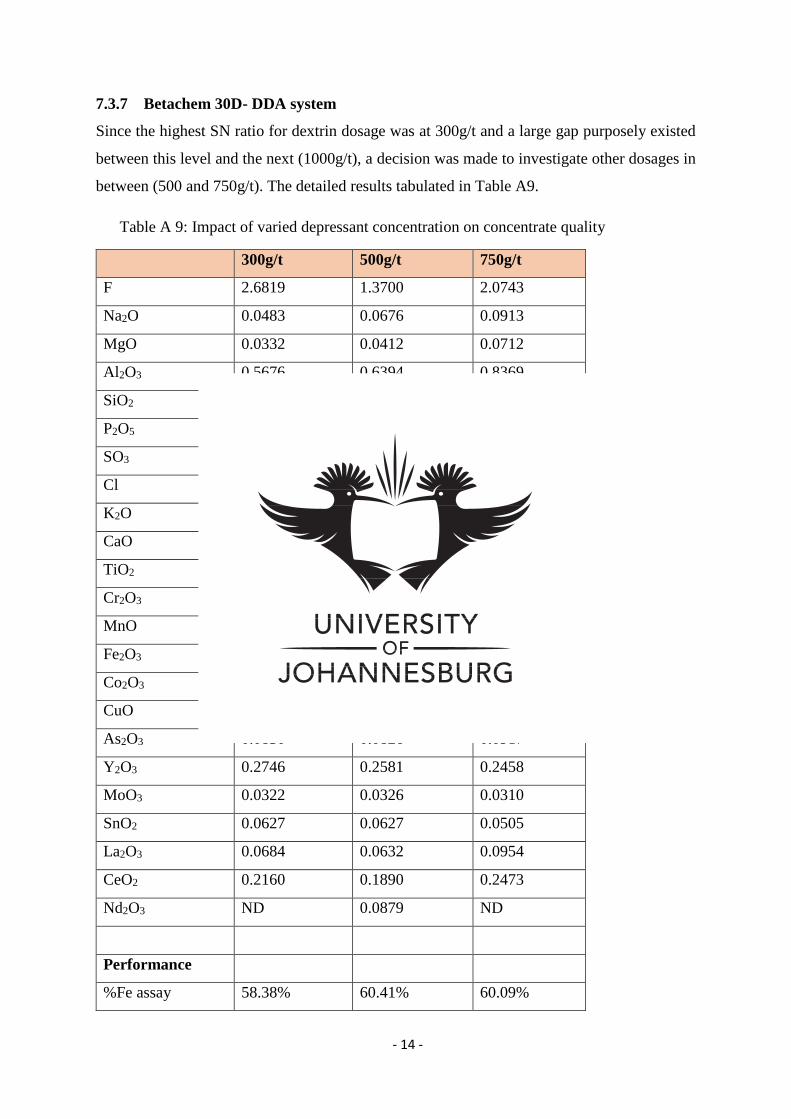
- 14 -
7.3.7 Betachem 30D- DDA system
Since the highest SN ratio for dextrin dosage was at 300g/t and a large gap purposely existed
between this level and the next (1000g/t), a decision was made to investigate other dosages in
between (500 and 750g/t). The detailed results tabulated in Table A9.
Table A 9: Impact of varied depressant concentration on concentrate quality
300g/t 500g/t 750g/t
F 2.6819 1.3700 2.0743
Na2O 0.0483 0.0676 0.0913
MgO 0.0332 0.0412 0.0712
Al2O3 0.5676 0.6394 0.8369
SiO2 5.6834 6.1561 4.4730
P2O5 0.3681 0.3456 0.3644
SO3 0.2203 0.2488 0.3082
Cl 0.0099 0.0183 0.0289
K2O 0.0238 0.0265 0.0228
CaO 5.9548 3.3421 4.4742
TiO2 0.0574 0.0762 0.0599
Cr2O3 ND ND 0.0224
MnO 0.3762 0.4237 0.3877
Fe2O3 83.4602 86.3567 85.9146
Co2O3 ND 0.0936 ND
CuO 0.0930 0.0182 0.1087
As2O3 0.0830 0.0826 0.0917
Y2O3 0.2746 0.2581 0.2458
MoO3 0.0322 0.0326 0.0310
SnO2 0.0627 0.0627 0.0505
La2O3 0.0684 0.0632 0.0954
CeO2 0.2160 0.1890 0.2473
Nd2O3 ND 0.0879 ND
Performance
%Fe assay 58.38% 60.41% 60.09%
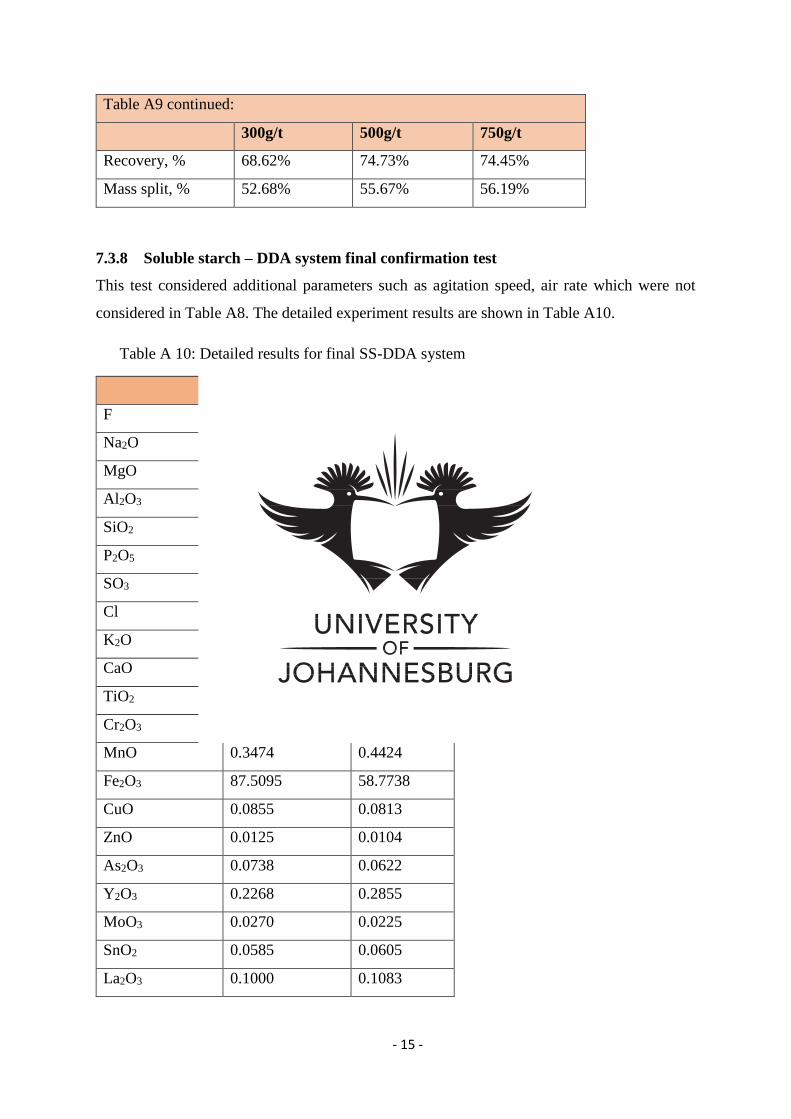
- 15 -
Table A9 continued:
300g/t 500g/t 750g/t
Recovery, % 68.62% 74.73% 74.45%
Mass split, % 52.68% 55.67% 56.19%
7.3.8 Soluble starch – DDA system final confirmation test
This test considered additional parameters such as agitation speed, air rate which were not
considered in Table A8. The detailed experiment results are shown in Table A10.
Table A 10: Detailed results for final SS-DDA system
Sinks Floats
F 2.3332 9.7874
Na2O 0.0718 0.0602
MgO 0.0280 0.0307
Al2O3 0.6712 0.5431
SiO2 3.6006 12.8309
P2O5 0.3645 0.3417
SO3 0.3685 0.5467
Cl 0.0208 0.0199
K2O 0.0174 0.0386
CaO 3.6966 15.5449
TiO2 0.0557 0.0532
Cr2O3 0.0231 0.0276
MnO 0.3474 0.4424
Fe2O3 87.5095 58.7738
CuO 0.0855 0.0813
ZnO 0.0125 0.0104
As2O3 0.0738 0.0622
Y2O3 0.2268 0.2855
MoO3 0.0270 0.0225
SnO2 0.0585 0.0605
La2O3 0.1000 0.1083
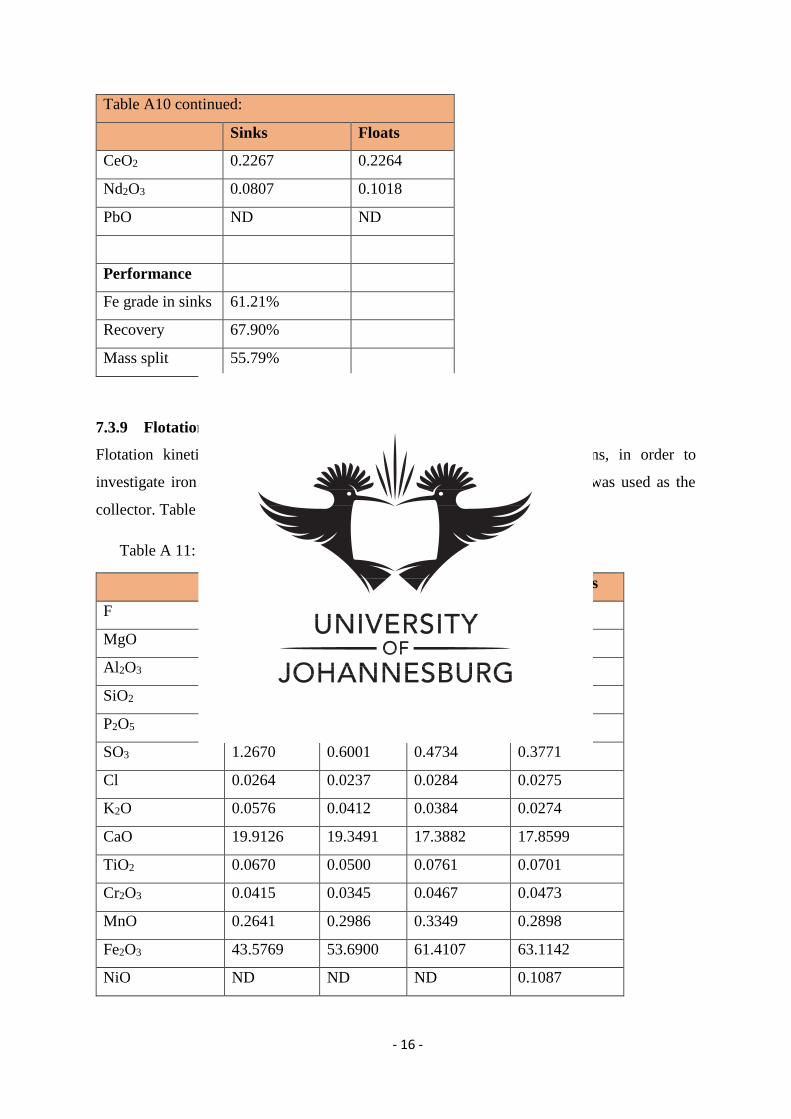
- 16 -
Table A10 continued:
Sinks Floats
CeO2 0.2267 0.2264
Nd2O3 0.0807 0.1018
PbO ND ND
Performance
Fe grade in sinks 61.21%
Recovery 67.90%
Mass split 55.79%
7.3.9 Flotation kinetics of soluble starch and Betachem 30D
Flotation kinetics was conducted, using the detected optimum conditions, in order to
investigate iron depression ability of soluble starch and the dextrin. DDA was used as the
collector. Table A11 shown the detailed chemical analysis results.
Table A 11: Flotation kinetics for BET30D-DDA systems
30 seconds 60 seconds 120 seconds 180 seconds
F 11.1283 10.7006 8.7516 9.6434
MgO ND 0.0386 0.0292 0.0208
Al2O3 0.5609 0.4920 0.5356 0.4591
SiO2 21.7970 13.3499 9.3115 6.3386
P2O5 0.3058 0.3266 0.3624 0.3853
SO3 1.2670 0.6001 0.4734 0.3771
Cl 0.0264 0.0237 0.0284 0.0275
K2O 0.0576 0.0412 0.0384 0.0274
CaO 19.9126 19.3491 17.3882 17.8599
TiO2 0.0670 0.0500 0.0761 0.0701
Cr2O3 0.0415 0.0345 0.0467 0.0473
MnO 0.2641 0.2986 0.3349 0.2898
Fe2O3 43.5769 53.6900 61.4107 63.1142
NiO ND ND ND 0.1087
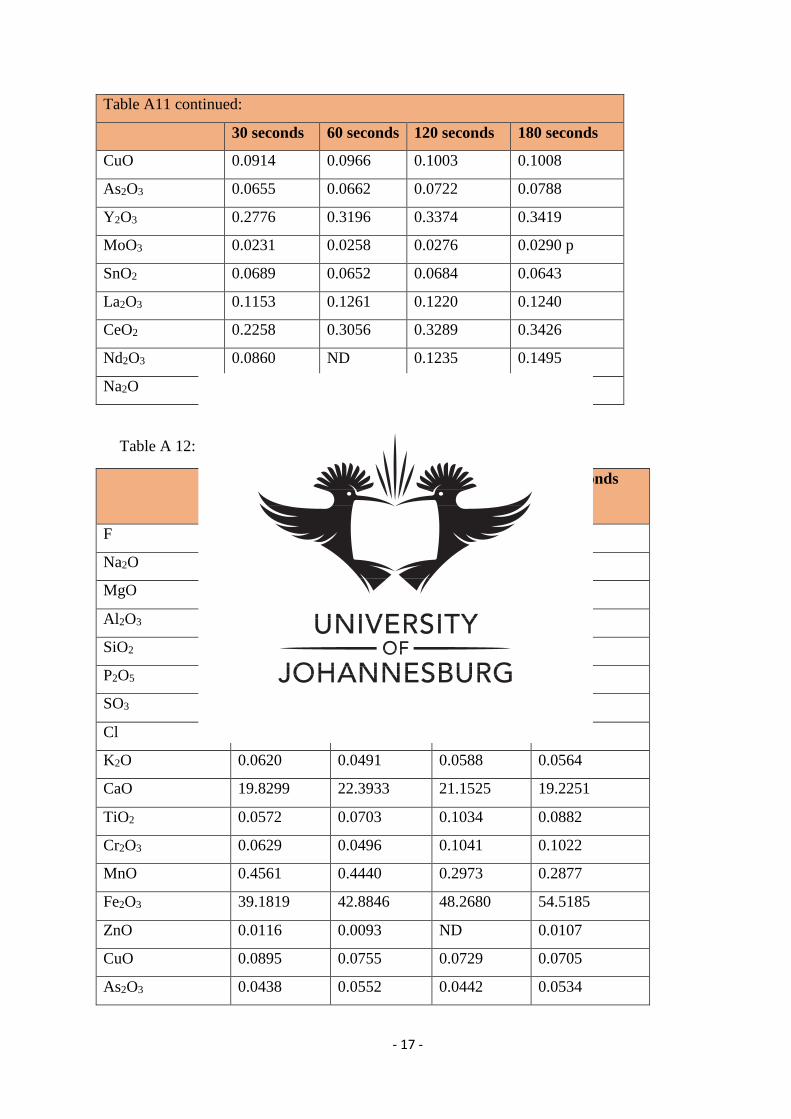
- 17 -
Table A11 continued:
30 seconds 60 seconds 120 seconds 180 seconds
CuO 0.0914 0.0966 0.1003 0.1008
As2O3 0.0655 0.0662 0.0722 0.0788
Y2O3 0.2776 0.3196 0.3374 0.3419
MoO3 0.0231 0.0258 0.0276 0.0290 p
SnO2 0.0689 0.0652 0.0684 0.0643
La2O3 0.1153 0.1261 0.1220 0.1240
CeO2 0.2258 0.3056 0.3289 0.3426
Nd2O3 0.0860 ND 0.1235 0.1495
Na2O 0.0413 ND 0.0325 ND
Table A 12: Flotation kinetics of soluble starch – DDA system
30 seconds 60 seconds 120 seconds 180 seconds
F 10.7372 12.8326 11.2930 9.7905
Na2O 0.0381 0.0533 0.0495 0.0497
MgO 0.0497 0.0434 0.0747 0.0774
Al2O3 0.5942 0.5270 0.6243 0.6421
SiO2 26.8179 18.6673 16.1353 13.2862
P2O5 0.3007 0.3225 0.3311 0.3355
SO3 0.8370 0.6208 0.4799 0.4797
Cl 0.0114 0.0106 ND 0.0108
K2O 0.0620 0.0491 0.0588 0.0564
CaO 19.8299 22.3933 21.1525 19.2251
TiO2 0.0572 0.0703 0.1034 0.0882
Cr2O3 0.0629 0.0496 0.1041 0.1022
MnO 0.4561 0.4440 0.2973 0.2877
Fe2O3 39.1819 42.8846 48.2680 54.5185
ZnO 0.0116 0.0093 ND 0.0107
CuO 0.0895 0.0755 0.0729 0.0705
As2O3 0.0438 0.0552 0.0442 0.0534
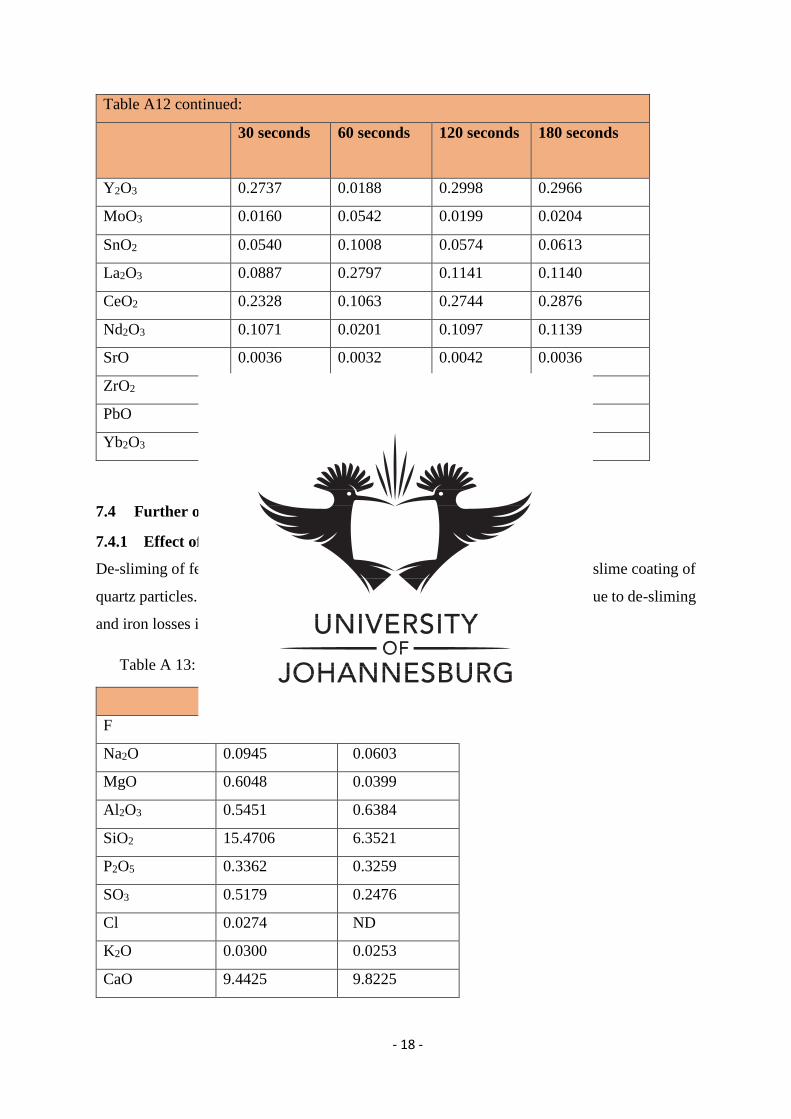
- 18 -
Table A12 continued:
30 seconds 60 seconds 120 seconds 180 seconds
Y2O3 0.2737 0.0188 0.2998 0.2966
MoO3 0.0160 0.0542 0.0199 0.0204
SnO2 0.0540 0.1008 0.0574 0.0613
La2O3 0.0887 0.2797 0.1141 0.1140
CeO2 0.2328 0.1063 0.2744 0.2876
Nd2O3 0.1071 0.0201 0.1097 0.1139
SrO 0.0036 0.0032 0.0042 0.0036
ZrO2 0.0034 0.0039 0.0065 0.0051
PbO 0.0138 0.0111 0.0157 0.0129
Yb2O3 0.0258 0.0242 ND ND
7.4 Further optimization experiments
7.4.1 Effect of feed de-sliming
De-sliming of feed was conducted with objective of reducing iron loss due to slime coating of
quartz particles. Table A13 shows the chemical composition changes in feed due to de-sliming
and iron losses in slimes.
Table A 13: Quantification of metal loss due to feed de-sliming
De-slimed feed -20µm (slimes)
F 5.5938 4.0495
Na2O 0.0945 0.0603
MgO 0.6048 0.0399
Al2O3 0.5451 0.6384
SiO2 15.4706 6.3521
P2O5 0.3362 0.3259
SO3 0.5179 0.2476
Cl 0.0274 ND
K2O 0.0300 0.0253
CaO 9.4425 9.8225
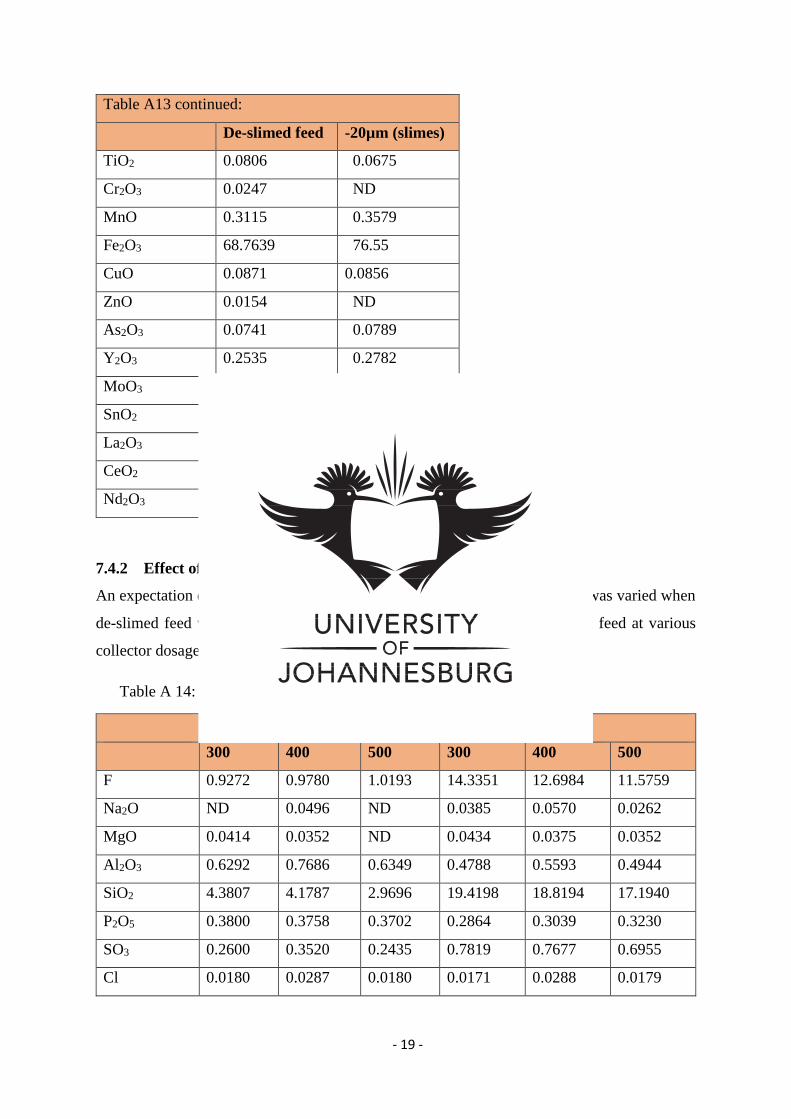
- 19 -
Table A13 continued:
De-slimed feed -20µm (slimes)
TiO2 0.0806 0.0675
Cr2O3 0.0247 ND
MnO 0.3115 0.3579
Fe2O3 68.7639 76.55
CuO 0.0871 0.0856
ZnO 0.0154 ND
As2O3 0.0741 0.0789
Y2O3 0.2535 0.2782
MoO3 0.0276 0.0291
SnO2 0.0585 0.0791
La2O3 0.1017 0.1348
CeO2 0.2377 0.2053
Nd2O3 0.1009 ND
7.4.2 Effect of DDA concentration variation
An expectation of reduced reagent consumption was made; collector dosage was varied when
de-slimed feed was used. This resulted in conduction flotation of de-slimed feed at various
collector dosage, as shown in Table A14.
Table A 14: Effect of DDA dosage variation using de-slimed feed
Sinks Floats
300 400 500 300 400 500
F 0.9272 0.9780 1.0193 14.3351 12.6984 11.5759
Na2O ND 0.0496 ND 0.0385 0.0570 0.0262
MgO 0.0414 0.0352 ND 0.0434 0.0375 0.0352
Al2O3 0.6292 0.7686 0.6349 0.4788 0.5593 0.4944
SiO2 4.3807 4.1787 2.9696 19.4198 18.8194 17.1940
P2O5 0.3800 0.3758 0.3702 0.2864 0.3039 0.3230
SO3 0.2600 0.3520 0.2435 0.7819 0.7677 0.6955
Cl 0.0180 0.0287 0.0180 0.0171 0.0288 0.0179
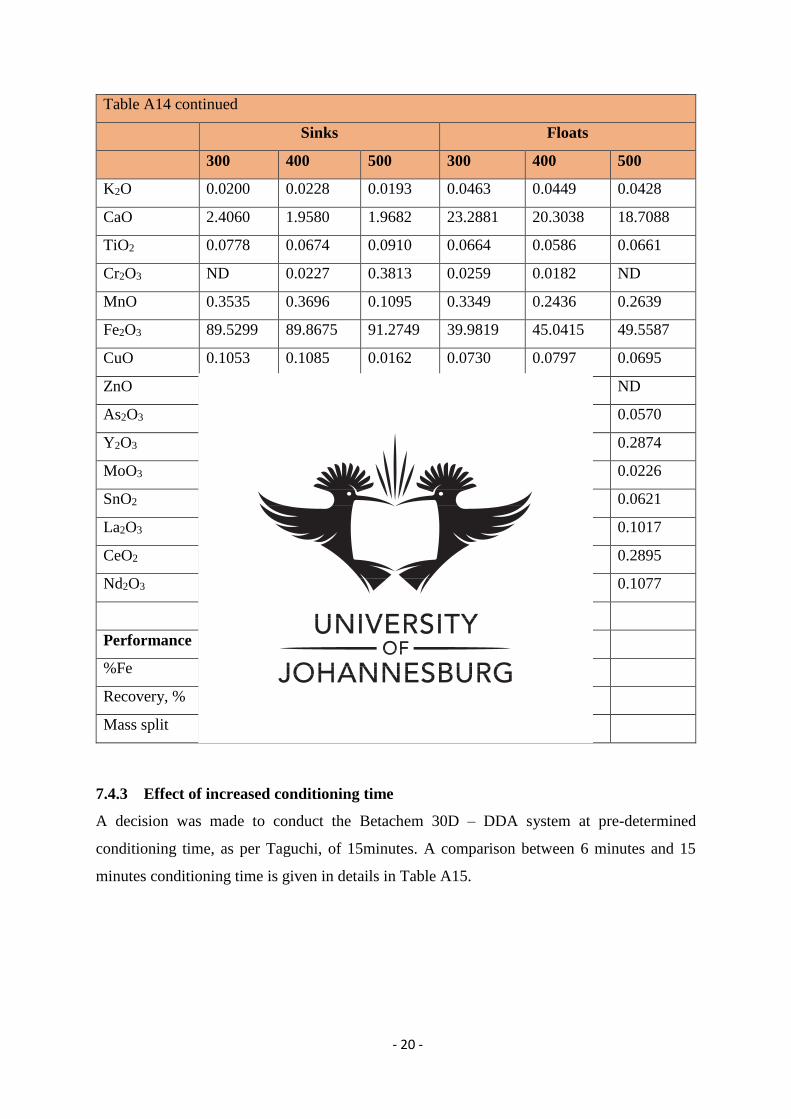
- 20 -
Table A14 continued
Sinks Floats
300 400 500 300 400 500
K2O 0.0200 0.0228 0.0193 0.0463 0.0449 0.0428
CaO 2.4060 1.9580 1.9682 23.2881 20.3038 18.7088
TiO2 0.0778 0.0674 0.0910 0.0664 0.0586 0.0661
Cr2O3 ND 0.0227 0.3813 0.0259 0.0182 ND
MnO 0.3535 0.3696 0.1095 0.3349 0.2436 0.2639
Fe2O3 89.5299 89.8675 91.2749 39.9819 45.0415 49.5587
CuO 0.1053 0.1085 0.0162 0.0730 0.0797 0.0695
ZnO ND 0.0169 0.0892 ND ND ND
As2O3 0.0878 0.0855 0.2376 0.0485 0.0563 0.0570
Y2O3 0.2605 0.2466 0.0259 0.2799 0.2806 0.2874
MoO3 0.0339 0.0346 0.0715 0.0071 0.0206 0.0226
SnO2 0.0572 0.0683 ND 0.0183 0.0698 0.0621
La2O3 0.1077 0.0624 0.1128 0.0586 0.0936 0.1017
CeO2 0.2278 0.2234 0.2426 0.2559 0.2887 0.2895
Nd2O3 0.0961 0.0794 0.1047 0.1142 0.1282 0.1077
Performance
%Fe 62.62% 62.86% 63.84%
Recovery, % 69.14% 73.45% 75.16%
Mass split 52.78% 60.25% 58.25%
7.4.3 Effect of increased conditioning time
A decision was made to conduct the Betachem 30D – DDA system at pre-determined
conditioning time, as per Taguchi, of 15minutes. A comparison between 6 minutes and 15
minutes conditioning time is given in details in Table A15.
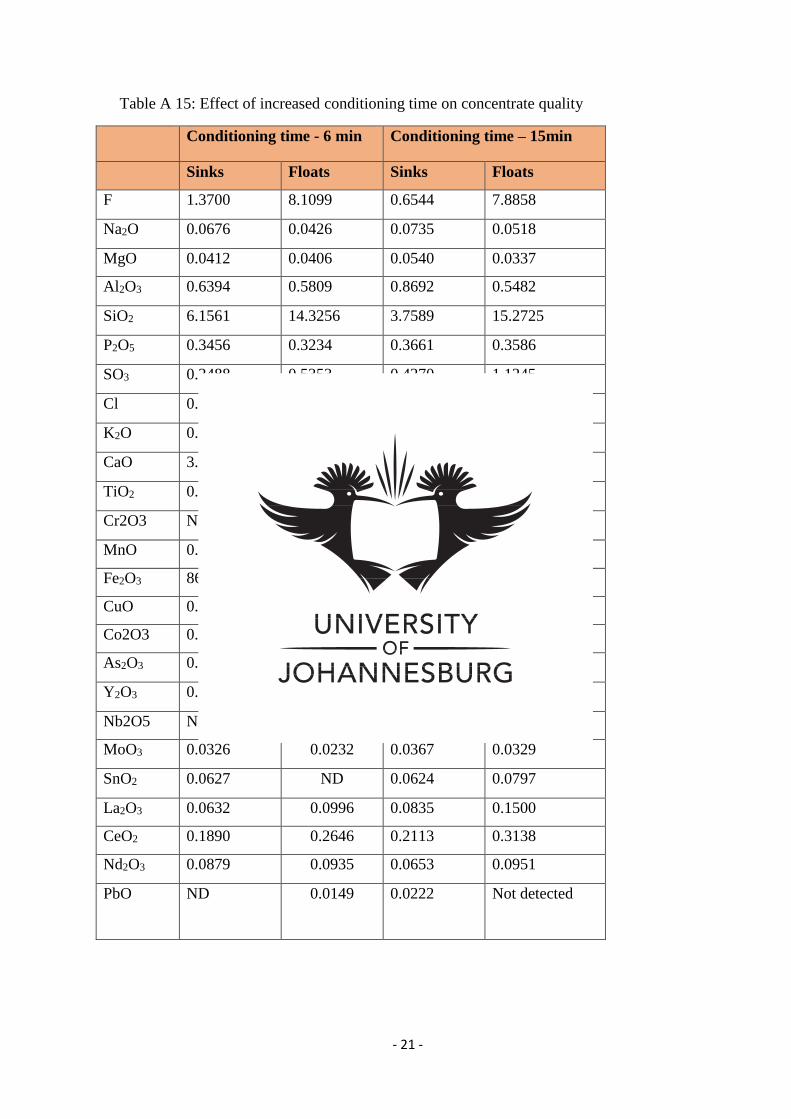
- 21 -
Table A 15: Effect of increased conditioning time on concentrate quality
Conditioning time - 6 min Conditioning time – 15min
Sinks Floats Sinks Floats
F 1.3700 8.1099 0.6544 7.8858
Na2O 0.0676 0.0426 0.0735 0.0518
MgO 0.0412 0.0406 0.0540 0.0337
Al2O3 0.6394 0.5809 0.8692 0.5482
SiO2 6.1561 14.3256 3.7589 15.2725
P2O5 0.3456 0.3234 0.3661 0.3586
SO3 0.2488 0.5353 0.4270 1.1245
Cl 0.0183 0.0173 0.0275 0.0353
K2O 0.0265 0.0407 0.0341 0.0481
CaO 3.3421 18.4977 1.0098 15.3652
TiO2 0.0762 0.0572 0.0704 0.0714
Cr2O3 ND 0.0303 ND 0.0208
MnO 0.4237 0.5078 0.4556 0.2514
Fe2O3 86.3567 55.7907 91.2363 57.7931
CuO 0.0182 0.0834 0.1192 0.0944
Co2O3 0.0936 ND ND ND
As2O3 0.0826 ND 0.1095 0.0804
Y2O3 0.2581 0.3082 0.2153 0.2933
Nb2O5 ND ND 0.0380 ND
MoO3 0.0326 0.0232 0.0367 0.0329
SnO2 0.0627 ND 0.0624 0.0797
La2O3 0.0632 0.0996 0.0835 0.1500
CeO2 0.1890 0.2646 0.2113 0.3138
Nd2O3 0.0879 0.0935 0.0653 0.0951
PbO ND 0.0149 0.0222
Not detected
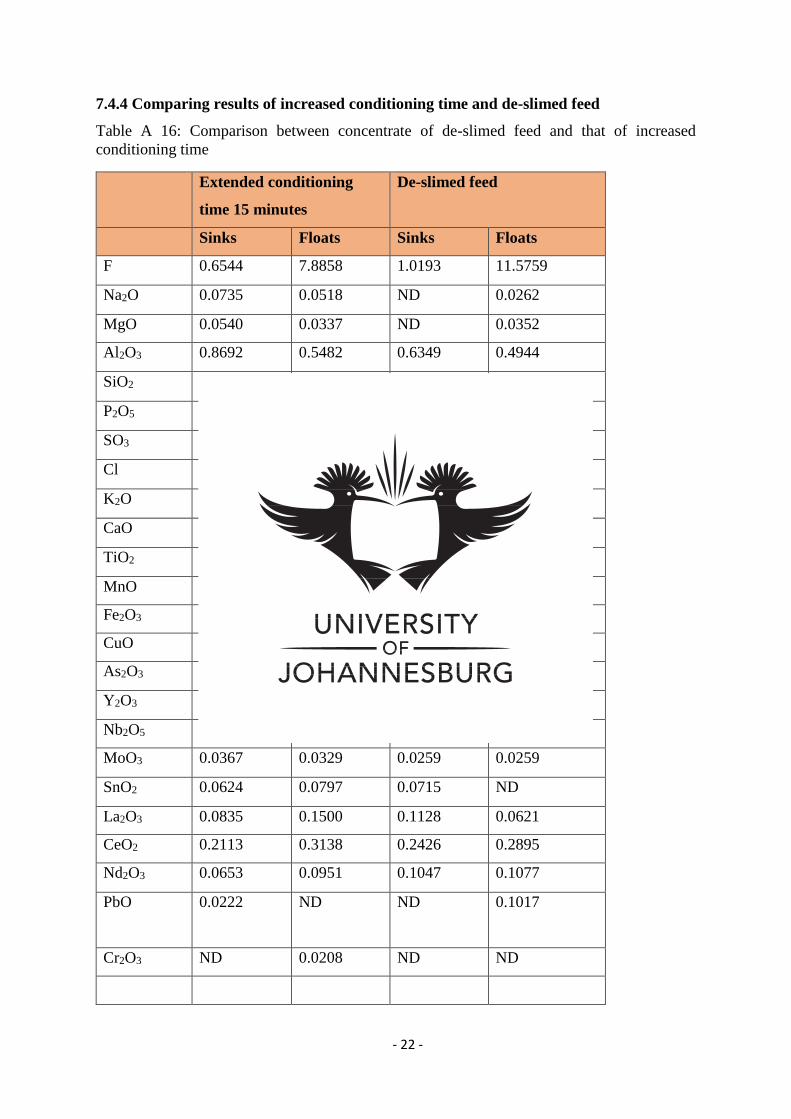
- 22 -
7.4.4 Comparing results of increased conditioning time and de-slimed feed
Table A 16: Comparison between concentrate of de-slimed feed and that of increased
conditioning time
Extended conditioning
time 15 minutes
De-slimed feed
Sinks Floats Sinks Floats
F 0.6544 7.8858 1.0193 11.5759
Na2O 0.0735 0.0518 ND 0.0262
MgO 0.0540 0.0337 ND 0.0352
Al2O3 0.8692 0.5482 0.6349 0.4944
SiO2 3.7589 15.2725 2.9696 17.1940
P2O5 0.3661 0.3586 0.3702 0.3230
SO3 0.4270 1.1245 0.2435 0.6955
Cl 0.0275 0.0353 0.0180 0.0179
K2O 0.0341 0.0481 0.0193 0.0428
CaO 1.0098 15.3652 1.9682 18.7088
TiO2 0.0704 0.0714 0.0910 0.0661
MnO 0.4556 0.2514 0.3813 0.2639
Fe2O3 91.2363 57.7931 91.2749 49.5587
CuO 0.1192 0.0944 0.1095 0.0695
As2O3 0.1095 0.0804 0.0162 0.0570
Y2O3 0.2153 0.2933 0.0892 0.2874
Nb2O5 0.0380 ND 0.2376 0.0226
MoO3 0.0367 0.0329 0.0259 0.0259
SnO2 0.0624 0.0797 0.0715 ND
La2O3 0.0835 0.1500 0.1128 0.0621
CeO2 0.2113 0.3138 0.2426 0.2895
Nd2O3 0.0653 0.0951 0.1047 0.1077
PbO 0.0222
ND ND 0.1017
Cr2O3 ND 0.0208 ND ND
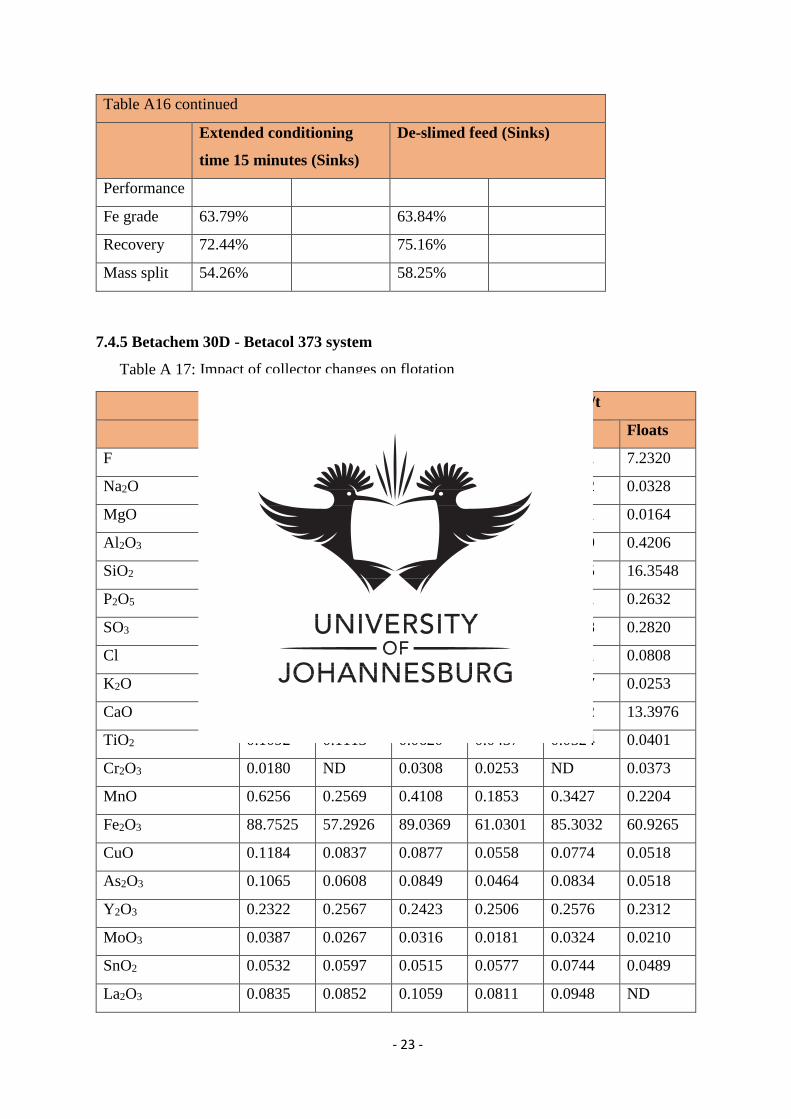
- 23 -
Table A16 continued
Extended conditioning
time 15 minutes (Sinks)
De-slimed feed (Sinks)
Performance
Fe grade 63.79% 63.84%
Recovery 72.44% 75.16%
Mass split 54.26% 58.25%
7.4.5 Betachem 30D - Betacol 373 system
Table A 17: Impact of collector changes on flotation
3328g/t 5548g/t 7770g/t
Sink Float Sinks Floats Sinks Floats
F 1.5662 7.8480 0.8566 7.3116 1.6301 7.2320
Na2O 0.0545 0.0247 0.0444 0.0363 0.0422 0.0328
MgO 0.0341 0.0512 0.0841 0.0311 0.0164
Al2O3 0.6040 0.5021 0.7425 0.6904 0.6090 0.4206
SiO2 3.3911 17.2593 5.0477 15.6610 6.9465 16.3548
P2O5 0.3573 0.3102 0.3622 0.2997 0.3621 0.2632
SO3 0.4476 0.7287 0.4157 0.2972 0.3888 0.2820
Cl ND 0.0216 0.1258 0.0944 0.1111 0.0808
K2O 0.0279 0.0402 0.0279 0.0295 0.0297 0.0253
CaO 3.1022 14.6373 1.8380 13.3820 3.2552 13.3976
TiO2 0.1092 0.1113 0.0620 0.0457 0.0524 0.0401
Cr2O3 0.0180 ND 0.0308 0.0253 ND 0.0373
MnO 0.6256 0.2569 0.4108 0.1853 0.3427 0.2204
Fe2O3 88.7525 57.2926 89.0369 61.0301 85.3032 60.9265
CuO 0.1184 0.0837 0.0877 0.0558 0.0774 0.0518
As2O3 0.1065 0.0608 0.0849 0.0464 0.0834 0.0518
Y2O3 0.2322 0.2567 0.2423 0.2506 0.2576 0.2312
MoO3 0.0387 0.0267 0.0316 0.0181 0.0324 0.0210
SnO2 0.0532 0.0597 0.0515 0.0577 0.0744 0.0489
La2O3 0.0835 0.0852 0.1059 0.0811 0.0948 ND
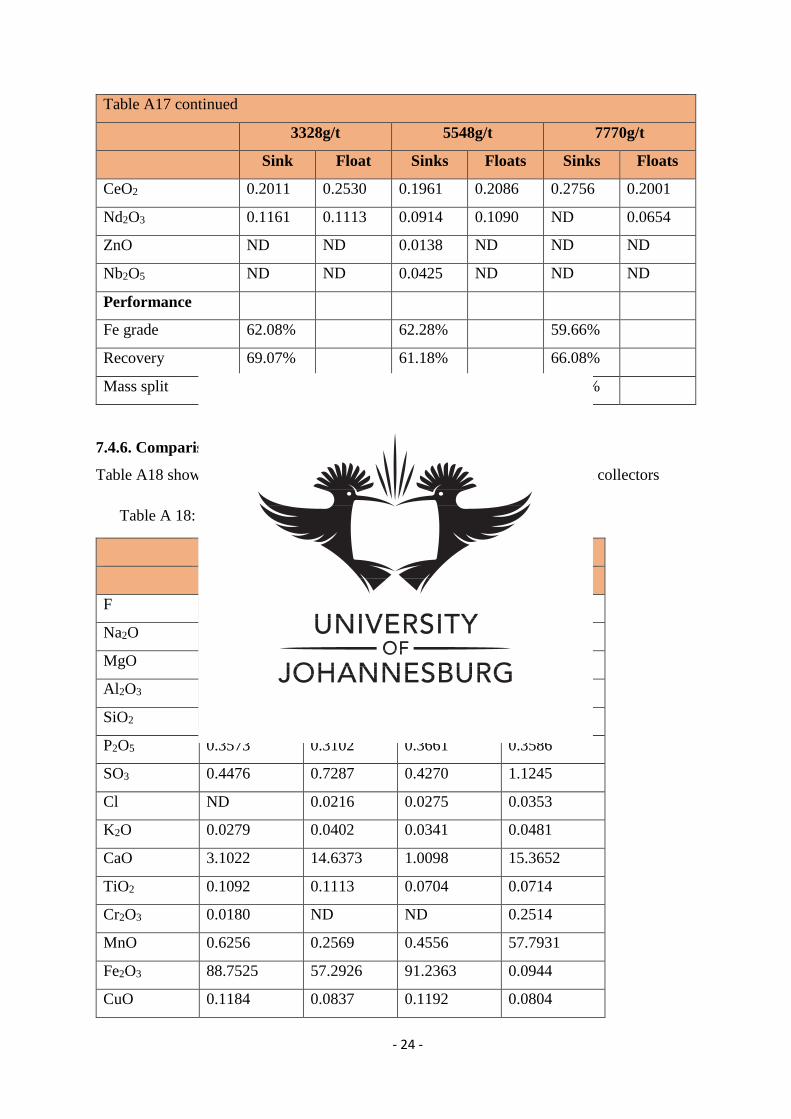
- 24 -
Table A17 continued
3328g/t 5548g/t 7770g/t
Sink Float Sinks Floats Sinks Floats
CeO2 0.2011 0.2530 0.1961 0.2086 0.2756 0.2001
Nd2O3 0.1161 0.1113 0.0914 0.1090 ND 0.0654
ZnO ND ND 0.0138 ND ND ND
Nb2O5 ND ND 0.0425 ND ND ND
Performance
Fe grade 62.08% 62.28% 59.66%
Recovery 69.07% 61.18% 66.08%
Mass split 53.15% 46.93% 52.91%
7.4.6. Comparison between Betacol 373 and DDA
Table A18 shows detailed chemical analysis results for Betacol 373 and DDA collectors
Table A 18: Comparison between Betacol 373 and DDA
Final Betacol 373 Final DDA
Sink Float Sinks Floats
F 1.5662 7.8480 0.6544 7.8858
Na2O 0.0545 0.0247 0.0735 0.0518
MgO 0.0341 0.0540 0.0337
Al2O3 0.6040 0.5021 0.8692 0.5482
SiO2 3.3911 17.2593 3.7589 15.2725
P2O5 0.3573 0.3102 0.3661 0.3586
SO3 0.4476 0.7287 0.4270 1.1245
Cl ND 0.0216 0.0275 0.0353
K2O 0.0279 0.0402 0.0341 0.0481
CaO 3.1022 14.6373 1.0098 15.3652
TiO2 0.1092 0.1113 0.0704 0.0714
Cr2O3 0.0180 ND ND 0.2514
MnO 0.6256 0.2569 0.4556 57.7931
Fe2O3 88.7525 57.2926 91.2363 0.0944
CuO 0.1184 0.0837 0.1192 0.0804
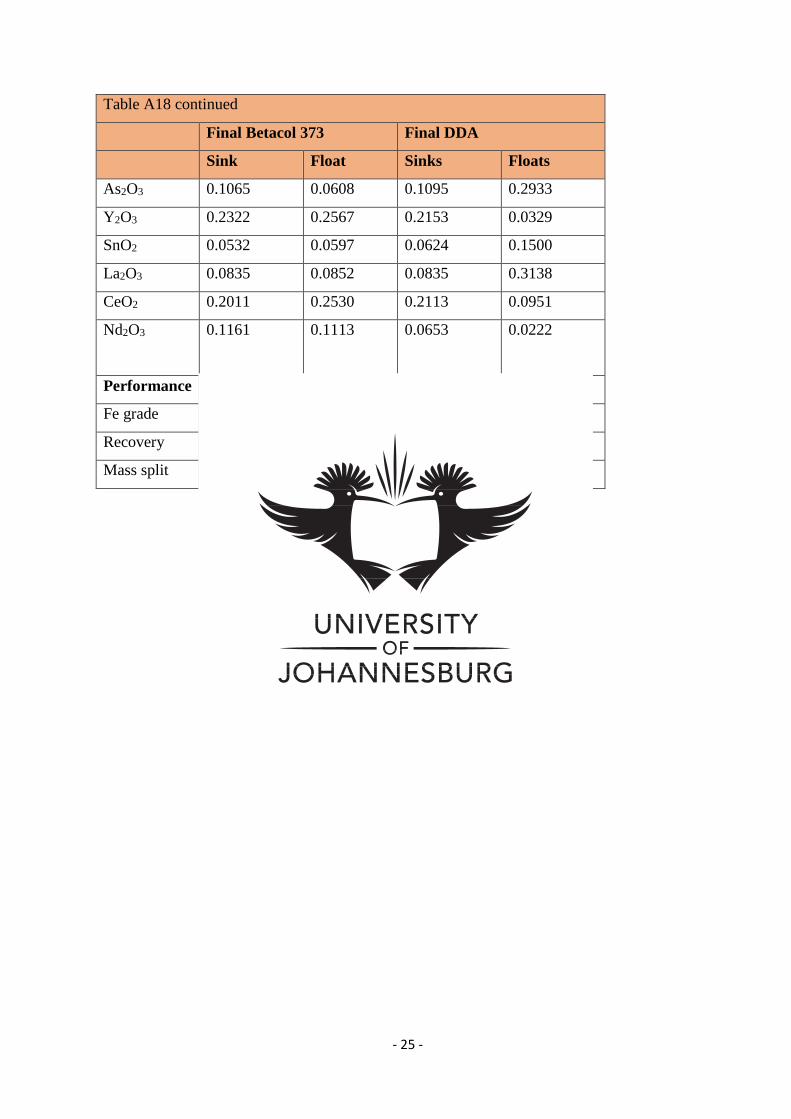
- 25 -
Table A18 continued
Final Betacol 373 Final DDA
Sink Float Sinks Floats
As2O3 0.1065 0.0608 0.1095 0.2933
Y2O3 0.2322 0.2567 0.2153 0.0329
SnO2 0.0532 0.0597 0.0624 0.1500
La2O3 0.0835 0.0852 0.0835 0.3138
CeO2 0.2011 0.2530 0.2113 0.0951
Nd2O3 0.1161 0.1113 0.0653 0.0222
Performance
Fe grade 62.08% 63.79%
Recovery 69.07% 72.44%
Mass split 53.15% 54.26%