Embed Size (px)
Citation preview

8/8/2019 Revenues, Outlays, Deficits, Surpluses, and Debt Held by the Public, 1970-2009
http://slidepdf.com/reader/full/revenues-outlays-deficits-surpluses-and-debt-held-by-the-public-1970-2009 1/13
JANUARY 2010 BUDGET AND ECONOMIC OUTLOOK: HISTORICAL BUDGET DATA
C
Table F-1.
Revenues, Outlays, Deficits, Surpluses, and Debt Held by the Public,1970 to 2009, in Billions of Dollars
Sources: Congressional Budget Office; Office of Management and Budget.
Note: n.a. = not applicable; * = between -$50 million and $50 million.
a. End of year.
1970 192.8 195.6 -8.7 5.9 n.a. -2.8 283.2
1971 187.1 210.2 -26.1 3.0 n.a. -23.0 303.0
1972 207.3 230.7 -26.1 3.1 -0.4 -23.4 322.4
1973 230.8 245.7 -15.2 0.5 -0.2 -14.9 340.9
1974 263.2 269.4 -7.2 1.8 -0.8 -6.1 343.7
1975 279.1 332.3 -54.1 2.0 -1.1 -53.2 394.7
1976 298.1 371.8 -69.4 -3.2 -1.1 -73.7 477.4
1977 355.6 409.2 -49.9 -3.9 0.2 -53.7 549.1
1978 399.6 458.7 -55.4 -4.3 0.5 -59.2 607.1
1979 463.3 504.0 -39.6 -2.0 0.9 -40.7 640.3
1980 517.1 590.9 -73.1 -1.1 0.4 -73.8 711.9
1981 599.3 678.2 -73.9 -5.0 -0.1 -79.0 789.4
1982 617.8 745.7 -120.6 -7.9 0.6 -128.0 924.6
1983 600.6 808.4 -207.7 0.2 -0.3 -207.8 1,137.3
1984 666.4 851.8 -185.3 0.3 -0.4 -185.4 1,307.0
1985 734.0 946.3 -221.5 9.4 -0.1 -212.3 1,507.3
1986 769.2 990.4 -237.9 16.7 * -221.2 1,740.6
1987 854.3 1,004.0 -168.4 19.6 -0.9 -149.7 1,889.8
1988 909.2 1,064.4 -192.3 38.8 -1.7 -155.2 2,051.6
1989 991.1 1,143.7 -205.4 52.4 0.3 -152.6 2,190.7
1990 1,032.0 1,253.0 -277.6 58.2 -1.6 -221.0 2,411.6
1991 1,055.0 1,324.2 -321.4 53.5 -1.3 -269.2 2,689.0
1992 1,091.2 1,381.5 -340.4 50.7 -0.7 -290.3 2,999.7
1993 1,154.3 1,409.4 -300.4 46.8 -1.4 -255.1 3,248.4
1994 1,258.6 1,461.8 -258.8 56.8 -1.1 -203.2 3,433.1
1995 1,351.8 1,515.8 -226.4 60.4 2.0 -164.0 3,604.4
1996 1,453.1 1,560.5 -174.0 66.4 0.2 -107.4 3,734.1
1997 1,579.2 1,601.1 -103.2 81.3 * -21.9 3,772.3
1998 1,721.7 1,652.5 -29.9 99.4 -0.2 69.3 3,721.1
1999 1,827.5 1,701.8 1.9 124.7 -1.0 125.6 3,632.4
2000 2,025.2 1,789.0 86.4 151.8 -2.0 236.2 3,409.8
2001 1,991.1 1,862.9 -32.4 163.0 -2.3 128.2 3,319.6
2002 1,853.1 2,010.9 -317.4 159.0 0.7 -157.8 3,540.4
2003 1,782.3 2,159.9 -538.4 155.6 5.2 -377.6 3,913.4
2004 1,880.1 2,292.9 -568.0 151.1 4.1 -412.7 4,295.5
2005 2,153.6 2,472.0 -493.6 173.5 1.8 -318.3 4,592.22006 2,406.9 2,655.1 -434.5 185.2 1.1 -248.2 4,829.0
2007 2,568.0 2,728.7 -342.2 186.5 -5.1 -160.7 5,035.1
2008 2,524.0 2,982.6 -641.9 186.4 -3.1 -458.6 5,803.1
2009 2,104.6 3,518.2 -1,550.6 137.3 -0.3 -1,413.6 7,544.0
Deficit (-) or SurplusSocial Postal Debt Held by the
Revenues Outlays On-Budget Security Service Total Publica

8/8/2019 Revenues, Outlays, Deficits, Surpluses, and Debt Held by the Public, 1970-2009
http://slidepdf.com/reader/full/revenues-outlays-deficits-surpluses-and-debt-held-by-the-public-1970-2009 2/13
BUDGET AND ECONOMIC OUTLOOK: HISTORICAL BUDGET DATA
Table F-2.
1970 to 2009, as a Percentage of Gross Domestic Product
Congressional Budget Office; Office of Management and Budget.
Note: n.a. = not applicable; * = between -0.05 percent and 0.05 percent.
a. End of year.
Debt Held by the
Revenues Outlays Publica
1970 19.0 19.3 -0.9 0.6 n.a. -0.3 28.0
1971 17.3 19.5 -2.4 0.3 n.a. -2.1 28.1
1972 17.6 19.6 -2.2 0.3 * -2.0 27.4
1973 17.6 18.7 -1.2 * * -1.1 26.0
1974 18.3 18.7 -0.5 0.1 -0.1 -0.4 23.9
1975 17.9 21.3 -3.5 0.1 -0.1 -3.4 25.3
1976 17.1 21.4 -4.0 -0.2 -0.1 -4.2 27.5
1977 18.0 20.7 -2.5 -0.2 * -2.7 27.8
1978 18.0 20.7 -2.5 -0.2 * -2.7 27.4
1979 18.5 20.2 -1.6 -0.1 * -1.6 25.6
1980 19.0 21.7 -2.7 * * -2.7 26.1
1981 19.6 22.2 -2.4 -0.2 * -2.6 25.8
1982 19.2 23.1 -3.7 -0.2 * -4.0 28.7
1983 17.5 23.5 -6.0 * * -6.0 33.1
1984 17.3 22.2 -4.8 * * -4.8 34.0
1985 17.7 22.8 -5.3 0.2 * -5.1 36.4
1986 17.5 22.5 -5.4 0.4 * -5.0 39.5
1987 18.4 21.6 -3.6 0.4 * -3.2 40.6
1988 18.2 21.3 -3.8 0.8 * -3.1 41.0
1989 18.4 21.2 -3.8 1.0 * -2.8 40.6
1990 18.0 21.9 -4.8 1.0 * -3.9 42.1
1991 17.8 22.3 -5.4 0.9 * -4.5 45.3
1992 17.5 22.1 -5.5 0.8 * -4.7 48.1
1993 17.5 21.4 -4.6 0.7 * -3.9 49.3
1994 18.0 21.0 -3.7 0.8 * -2.9 49.2
1995 18.4 20.6 -3.1 0.8 * -2.2 49.1
1996 18.8 20.2 -2.3 0.9 * -1.4 48.4
1997 19.2 19.5 -1.3 1.0 * -0.3 45.9
1998 19.9 19.1 -0.3 1.1 * 0.8 43.0
1999 19.8 18.5 * 1.4 * 1.4 39.4
2000 20.6 18.2 0.9 1.5 * 2.4 34.7
2001 19.5 18.2 -0.3 1.6 * 1.3 32.5
2002 17.6 19.1 -3.0 1.5 * -1.5 33.6
2003 16.2 19.7 -4.9 1.4 * -3.4 35.6
2004 16.1 19.6 -4.9 1.3 * -3.5 36.8
2005 17.3 19.9 -4.0 1.4 * -2.6 36.9
2006 18.2 20.1 -3.3 1.4 * -1.9 36.5
2007 18.5 19.6 -2.5 1.3 * -1.2 36.2
2008 17.5 20.7 -4.4 1.3 * -3.2 40.2
2009 14.8 24.7 -10.9 1.0 * -9.9 53.0
Total
Deficit (-) or SurplusSocial Postal
On-Budget Security Service
8/8/2019 Revenues, Outlays, Deficits, Surpluses, and Debt Held by the Public, 1970-2009
http://slidepdf.com/reader/full/revenues-outlays-deficits-surpluses-and-debt-held-by-the-public-1970-2009 3/13
BUDGET AND ECONOMIC OUTLOOK: HISTORICAL BUDGET DATA
Table F-3.
Revenues by Major Source, 1970 to 2009, in Billions of Dollars
Congressional Budget Office; Office of Management and Budget.
Excise
Taxes
1970 90.4 32.8 44.4 15.7 3.6 2.4 3.4 192.8
1971 86.2 26.8 47.3 16.6 3.7 2.6 3.9 187.1
1972 94.7 32.2 52.6 15.5 5.4 3.3 3.6 207.3
1973 103.2 36.2 63.1 16.3 4.9 3.2 3.9 230.8
1974 119.0 38.6 75.1 16.8 5.0 3.3 5.4 263.2
1975 122.4 40.6 84.5 16.6 4.6 3.7 6.7 279.1
1976 131.6 41.4 90.8 17.0 5.2 4.1 8.0 298.1
1977 157.6 54.9 106.5 17.5 7.3 5.2 6.5 355.6
1978 181.0 60.0 121.0 18.4 5.3 6.6 7.4 399.6
1979 217.8 65.7 138.9 18.7 5.4 7.4 9.3 463.3
1980 244.1 64.6 157.8 24.3 6.4 7.2 12.7 517.1
1981 285.9 61.1 182.7 40.8 6.8 8.1 13.8 599.3
1982 297.7 49.2 201.5 36.3 8.0 8.9 16.2 617.81983 288.9 37.0 209.0 35.3 6.1 8.7 15.6 600.6
1984 298.4 56.9 239.4 37.4 6.0 11.4 17.0 666.4
1985 334.5 61.3 265.2 36.0 6.4 12.1 18.5 734.0
1986 349.0 63.1 283.9 32.9 7.0 13.3 19.9 769.2
1987 392.6 83.9 303.3 32.5 7.5 15.1 19.5 854.3
1988 401.2 94.5 334.3 35.2 7.6 16.2 20.2 909.2
1989 445.7 103.3 359.4 34.4 8.7 16.3 23.2 991.1
1990 466.9 93.5 380.0 35.3 11.5 16.7 28.0 1,032.0
1991 467.8 98.1 396.0 42.4 11.1 15.9 23.6 1,055.0
1992 476.0 100.3 413.7 45.6 11.1 17.4 27.2 1,091.2
1993 509.7 117.5 428.3 48.1 12.6 18.8 19.4 1,154.3
1994 543.1 140.4 461.5 55.2 15.2 20.1 23.1 1,258.6
1995 590.2 157.0 484.5 57.5 14.8 19.3 28.5 1,351.8
1996 656.4 171.8 509.4 54.0 17.2 18.7 25.5 1,453.11997 737.5 182.3 539.4 56.9 19.8 17.9 25.4 1,579.2
1998 828.6 188.7 571.8 57.7 24.1 18.3 32.6 1,721.7
1999 879.5 184.7 611.8 70.4 27.8 18.3 34.9 1,827.5
2000 1,004.5 207.3 652.9 68.9 29.0 19.9 42.8 2,025.2
2001 994.3 151.1 694.0 66.2 28.4 19.4 37.8 1,991.1
2002 858.3 148.0 700.8 67.0 26.5 18.6 33.9 1,853.1
2003 793.7 131.8 713.0 67.5 22.0 19.9 34.5 1,782.3
2004 809.0 189.4 733.4 69.9 24.8 21.1 32.6 1,880.1
2005 927.2 278.3 794.1 73.1 24.8 23.4 32.8 2,153.6
2006 1,043.9 353.9 837.8 74.0 27.9 24.8 44.6 2,406.9
2007 1,163.5 370.2 869.6 65.1 26.0 26.0 47.6 2,568.0
2008 1,145.7 304.3 900.2 67.3 28.8 27.6 50.0 2,524.0
2009 915.3 138.2 890.9 62.5 23.5 22.5 51.7 2,104.6
Customs Miscellaneous Total
Taxes Taxes Taxes Taxes Duties Receipts Revenues
Income Income Insurance and Gift
Individual Corporate Social Estate

8/8/2019 Revenues, Outlays, Deficits, Surpluses, and Debt Held by the Public, 1970-2009
http://slidepdf.com/reader/full/revenues-outlays-deficits-surpluses-and-debt-held-by-the-public-1970-2009 4/13
JANUARY 2010 BUDGET AND ECONOMIC OUTLOOK: HISTORICAL BUDGET DATA
Table F-4.
! "
Gross Domestic Product
Congressional Budget Office; Office of Management and Budget.
Corporate Social Estate Income Insurance Excise and Gift Customs Miscellaneous Total
Taxes Taxes Taxes Taxes Duties Receipts Revenues
1970 8.9 3.2 4.4 1.6 0.4 0.2 0.3 19.0
1971 8.0 2.5 4.4 1.5 0.3 0.2 0.4 17.3
1972 8.1 2.7 4.5 1.3 0.5 0.3 0.3 17.6
1973 7.9 2.8 4.8 1.2 0.4 0.2 0.3 17.6
1974 8.3 2.7 5.2 1.2 0.4 0.2 0.4 18.3
1975 7.8 2.6 5.4 1.1 0.3 0.2 0.4 17.9
1976 7.6 2.4 5.2 1.0 0.3 0.2 0.5 17.1
1977 8.0 2.8 5.4 0.9 0.4 0.3 0.3 18.0
1978 8.2 2.7 5.5 0.8 0.2 0.3 0.3 18.0
1979 8.7 2.6 5.6 0.7 0.2 0.3 0.4 18.5
1980 9.0 2.4 5.8 0.9 0.2 0.3 0.5 19.0
1981 9.4 2.0 6.0 1.3 0.2 0.3 0.5 19.6
1982 9.2 1.5 6.3 1.1 0.2 0.3 0.5 19.2
1983 8.4 1.1 6.1 1.0 0.2 0.3 0.5 17.5
1984 7.8 1.5 6.2 1.0 0.2 0.3 0.4 17.3
1985 8.1 1.5 6.4 0.9 0.2 0.3 0.4 17.7
1986 7.9 1.4 6.4 0.7 0.2 0.3 0.5 17.5
1987 8.4 1.8 6.5 0.7 0.2 0.3 0.4 18.4
1988 8.0 1.9 6.7 0.7 0.2 0.3 0.4 18.2
1989 8.3 1.9 6.7 0.6 0.2 0.3 0.4 18.4
1990 8.1 1.6 6.6 0.6 0.2 0.3 0.5 18.0
1991 7.9 1.7 6.7 0.7 0.2 0.3 0.4 17.8
1992 7.6 1.6 6.6 0.7 0.2 0.3 0.4 17.5
1993 7.7 1.8 6.5 0.7 0.2 0.3 0.3 17.5
1994 7.8 2.0 6.6 0.8 0.2 0.3 0.3 18.0
1995 8.0 2.1 6.6 0.8 0.2 0.3 0.4 18.4
1996 8.5 2.2 6.6 0.7 0.2 0.2 0.3 18.8
1997 9.0 2.2 6.6 0.7 0.2 0.2 0.3 19.2
1998 9.6 2.2 6.6 0.7 0.3 0.2 0.4 19.9
1999 9.6 2.0 6.6 0.8 0.3 0.2 0.4 19.8
2000 10.2 2.1 6.6 0.7 0.3 0.2 0.4 20.6
2001 9.7 1.5 6.8 0.6 0.3 0.2 0.4 19.5
2002 8.1 1.4 6.6 0.6 0.3 0.2 0.3 17.6
2003 7.2 1.2 6.5 0.6 0.2 0.2 0.3 16.2
2004 6.9 1.6 6.3 0.6 0.2 0.2 0.3 16.1
2005 7.5 2.2 6.4 0.6 0.2 0.2 0.3 17.3
2006 7.9 2.7 6.3 0.6 0.2 0.2 0.3 18.2
2007 8.4 2.7 6.3 0.5 0.2 0.2 0.3 18.5
2008 7.9 2.1 6.2 0.5 0.2 0.2 0.3 17.52009 6.4 1.0 6.3 0.4 0.2 0.2 0.4 14.8
Income
Taxes

8/8/2019 Revenues, Outlays, Deficits, Surpluses, and Debt Held by the Public, 1970-2009
http://slidepdf.com/reader/full/revenues-outlays-deficits-surpluses-and-debt-held-by-the-public-1970-2009 5/13
JANUARY 2010 BUDGET AND ECONOMIC OUTLOOK: HISTORICAL BUDGET DATA
Table F-5.
Outlays for Major Categories of Spending, 1970 to 2009, in Billions of Dollars
Congressional Budget Office; Office of Management and Budget.
a. Excludes offsetting receipts.
1970 120.3 72.4 -11.5 14.4 195.6
1971 122.5 86.9 -14.1 14.8 210.2
1972 128.5 100.8 -14.1 15.5 230.7
1973 130.4 116.0 -18.0 17.3 245.7
1974 138.2 130.9 -21.2 21.4 269.4
1975 158.0 169.5 -18.3 23.2 332.3
1976 175.6 189.1 -19.6 26.7 371.8
1977 197.1 203.7 -21.5 29.9 409.2
1978 218.7 227.4 -22.8 35.5 458.7
1979 240.0 247.0 -25.6 42.6 504.0
1980 276.3 291.3 -29.2 52.5 590.9
1981 307.9 339.4 -37.9 68.8 678.2
1982 326.0 370.8 -36.0 85.0 745.71983 353.3 410.6 -45.3 89.8 808.4
1984 379.4 405.6 -44.2 111.1 851.8
1985 415.8 448.2 -47.1 129.5 946.3
1986 438.5 461.8 -45.9 136.0 990.4
1987 444.2 474.2 -52.9 138.6 1,004.0
1988 464.4 505.1 -56.8 151.8 1,064.4
1989 488.8 545.8 -59.9 169.0 1,143.7
1990 500.6 625.1 -57.0 184.3 1,253.0
1991 533.3 701.5 -105.0 194.4 1,324.2
1992 533.8 716.9 -68.5 199.3 1,381.5
1993 539.4 736.1 -64.8 198.7 1,409.4
1994 541.4 785.7 -68.2 202.9 1,461.8
1995 544.9 816.8 -78.0 232.1 1,515.8
1996 532.7 857.1 -70.4 241.1 1,560.51997 547.2 895.2 -85.2 244.0 1,601.1
1998 552.1 942.5 -83.2 241.1 1,652.5
1999 572.0 979.2 -79.1 229.8 1,701.8
2000 614.8 1,031.8 -80.5 222.9 1,789.0
2001 649.3 1,096.1 -88.7 206.2 1,862.9
2002 734.3 1,195.6 -89.9 170.9 2,010.9
2003 825.4 1,282.0 -100.6 153.1 2,159.9
2004 895.5 1,346.2 -109.0 160.2 2,292.9
2005 968.5 1,447.3 -127.8 184.0 2,472.0
2006 1,016.7 1,552.2 -140.5 226.6 2,655.1
2007 1,040.9 1,628.3 -177.6 237.1 2,728.7
2008 1,134.8 1,788.1 -193.1 252.8 2,982.6
2009 1,237.0 2,288.7 -194.7 187.3 3,518.2
Net Total
Spending Spendinga
Receipts Interest Outlays
Mandatory Spending
Discretionary Programmatic Offsetting
8/8/2019 Revenues, Outlays, Deficits, Surpluses, and Debt Held by the Public, 1970-2009
http://slidepdf.com/reader/full/revenues-outlays-deficits-surpluses-and-debt-held-by-the-public-1970-2009 6/13
BUDGET AND ECONOMIC OUTLOOK: HISTORICAL BUDGET DATA
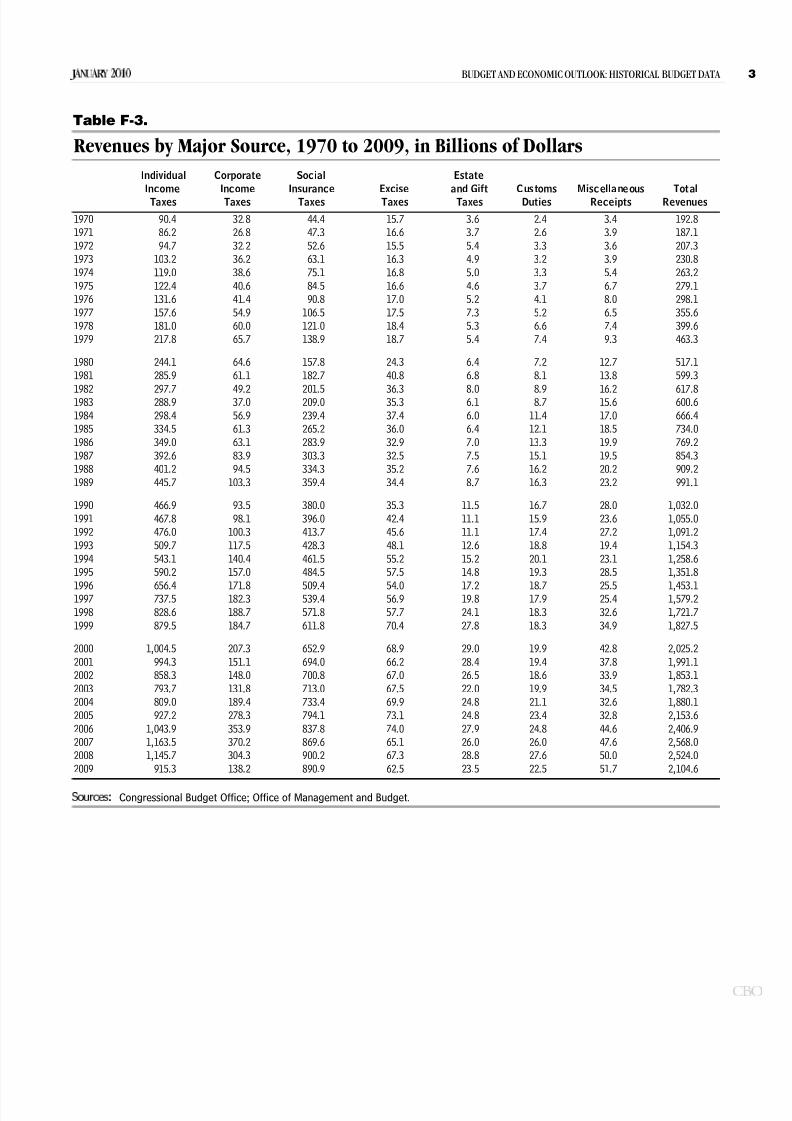
Table F-6.
# " " ! "
Gross Domestic Product
Congressional Budget Office; Office of Management and Budget.
a. Excludes offsetting receipts.
Offsetting Net Total
Receipts Interest Outlays
1970 11.9 7.2 -1.1 1.4 19.3
1971 11.3 8.1 -1.3 1.4 19.5
1972 10.9 8.6 -1.2 1.3 19.6
1973 9.9 8.9 -1.4 1.3 18.7
1974 9.6 9.1 -1.5 1.5 18.7
1975 10.1 10.9 -1.2 1.5 21.3
1976 10.1 10.9 -1.1 1.5 21.4
1977 10.0 10.3 -1.1 1.5 20.7
1978 9.9 10.3 -1.0 1.6 20.7
1979 9.6 9.9 -1.0 1.7 20.2
1980 10.1 10.7 -1.1 1.9 21.7
1981 10.1 11.1 -1.2 2.3 22.2
1982 10.1 11.5 -1.1 2.6 23.1
1983 10.3 11.9 -1.3 2.6 23.5
1984 9.9 10.5 -1.2 2.9 22.2
1985 10.0 10.8 -1.1 3.1 22.8
1986 10.0 10.5 -1.0 3.1 22.5
1987 9.5 10.2 -1.1 3.0 21.6
1988 9.3 10.1 -1.1 3.0 21.3
1989 9.1 10.1 -1.1 3.1 21.2
1990 8.7 10.9 -1.0 3.2 21.9
1991 9.0 11.8 -1.8 3.3 22.3
1992 8.6 11.5 -1.1 3.2 22.1
1993 8.2 11.2 -1.0 3.0 21.4
1994 7.8 11.3 -1.0 2.9 21.01995 7.4 11.1 -1.1 3.2 20.6
1996 6.9 11.1 -0.9 3.1 20.2
1997 6.7 10.9 -1.0 3.0 19.5
1998 6.4 10.9 -1.0 2.8 19.1
1999 6.2 10.6 -0.9 2.5 18.5
2000 6.3 10.5 -0.8 2.3 18.2
2001 6.3 10.7 -0.9 2.0 18.2
2002 7.0 11.3 -0.9 1.6 19.1
2003 7.5 11.7 -0.9 1.4 19.7
2004 7.7 11.5 -0.9 1.4 19.6
2005 7.8 11.6 -1.0 1.5 19.9
2006 7.7 11.7 -1.1 1.7 20.1
2007 7.5 11.7 -1.3 1.7 19.6
2008 7.9 12.4 -1.3 1.8 20.72009 8.7 16.1 -1.4 1.3 24.7
Mandatory SpendingDiscretionary Programmatic
Spending Spendinga
8/8/2019 Revenues, Outlays, Deficits, Surpluses, and Debt Held by the Public, 1970-2009
http://slidepdf.com/reader/full/revenues-outlays-deficits-surpluses-and-debt-held-by-the-public-1970-2009 7/13
BUDGET AND ECONOMIC OUTLOOK: HISTORICAL BUDGET DATA
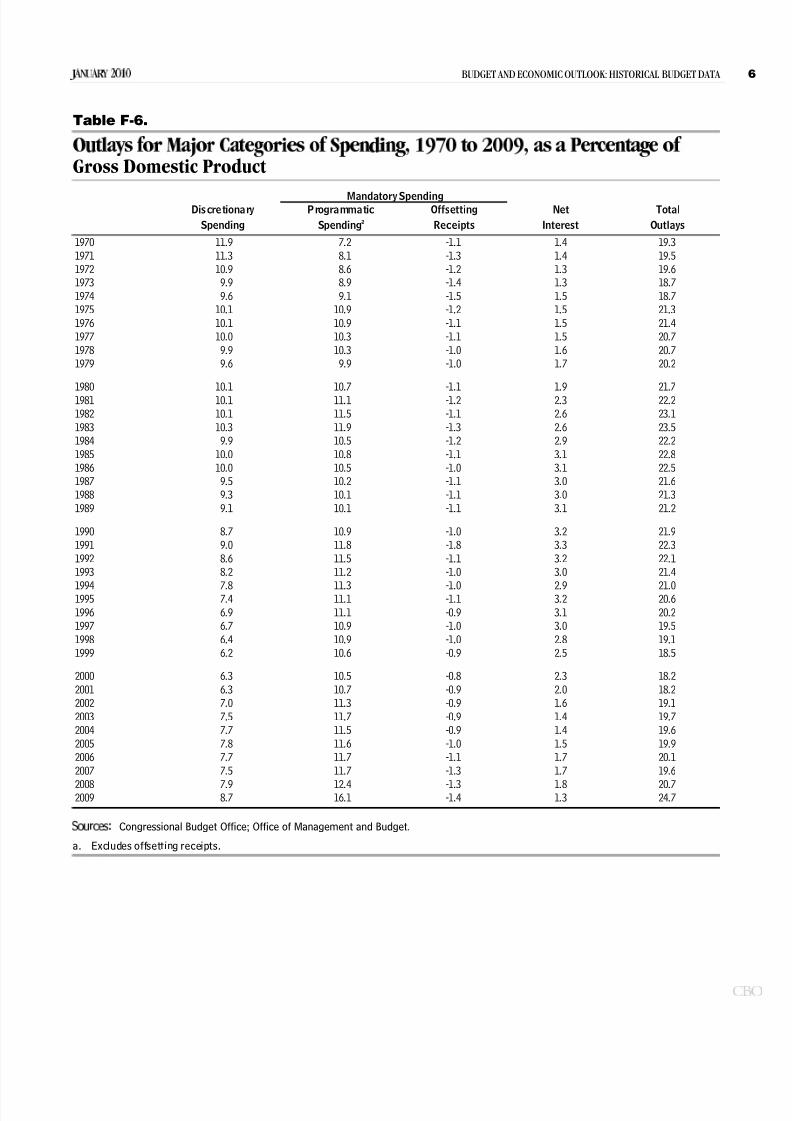
Table F-7.
! $
Congressional Budget Office; Office of Management and Budget.
1970 81.9 4.0 34.4 120.31971 79.0 3.8 39.7 122.5
1972 79.3 4.6 44.6 128.5
1973 77.1 4.8 48.5 130.4
1974 80.7 6.2 51.3 138.2
1975 87.6 8.2 62.2 158.0
1976 89.9 3.3 82.4 175.6
1977 97.5 8.0 91.6 197.1
1978 104.6 8.5 105.6 218.7
1979 116.8 9.1 114.1 240.0
1980 134.6 12.8 128.9 276.3
1981 158.0 13.6 136.3 307.9
1982 185.9 12.9 127.2 326.0
1983 209.9 13.6 129.8 353.3
1984 228.0 16.3 135.1 379.41985 253.1 17.4 145.3 415.8
1986 273.8 17.7 147.0 438.5
1987 282.5 15.2 146.5 444.2
1988 290.9 15.7 157.8 464.4
1989 304.0 16.6 168.2 488.8
1990 300.1 19.1 181.4 500.6
1991 319.7 19.7 193.9 533.3
1992 302.6 19.2 212.0 533.8
1993 292.4 21.6 225.4 539.4
1994 282.3 20.8 238.3 541.4
1995 273.6 20.1 251.2 544.9
1996 266.0 18.3 248.4 532.7
1997 271.7 19.0 256.5 547.2
1998 270.2 18.1 263.8 552.11999 275.5 19.5 277.0 572.0
2000 295.0 21.3 298.5 614.8
2001 306.1 22.5 320.7 649.3
2002 349.0 26.2 359.1 734.3
2003 405.0 27.9 392.5 825.4
2004 454.1 33.8 407.6 895.5
2005 493.6 39.0 435.9 968.5
2006 520.0 36.1 460.6 1,016.7
2007 547.9 34.8 458.2 1,040.9
2008 612.4 37.5 484.9 1,134.8
2009 655.8 43.0 538.1 1,237.0
Defense International Domestic Total

8/8/2019 Revenues, Outlays, Deficits, Surpluses, and Debt Held by the Public, 1970-2009
http://slidepdf.com/reader/full/revenues-outlays-deficits-surpluses-and-debt-held-by-the-public-1970-2009 8/13
BUDGET AND ECONOMIC OUTLOOK: HISTORICAL BUDGET DATA
Table F-8.
! " % &
Congressional Budget Office; Office of Management and Budget.
Defense International Domestic
1970 8.1 0.4 3.4 11.91971 7.3 0.3 3.7 11.3
1972 6.7 0.4 3.8 10.9
1973 5.9 0.4 3.7 9.9
1974 5.6 0.4 3.6 9.6
1975 5.6 0.5 4.0 10.1
1976 5.2 0.2 4.7 10.1
1977 4.9 0.4 4.6 10.0
1978 4.7 0.4 4.8 9.9
1979 4.7 0.4 4.6 9.6
1980 4.9 0.5 4.7 10.1
1981 5.2 0.4 4.5 10.1
1982 5.8 0.4 3.9 10.1
1983 6.1 0.4 3.8 10.3
1984 5.9 0.4 3.5 9.91985 6.1 0.4 3.5 10.0
1986 6.2 0.4 3.3 10.0
1987 6.1 0.3 3.1 9.5
1988 5.8 0.3 3.1 9.3
1989 5.6 0.3 3.1 9.1
1990 5.2 0.3 3.2 8.7
1991 5.4 0.3 3.3 9.0
1992 4.8 0.3 3.4 8.6
1993 4.4 0.3 3.4 8.2
1994 4.0 0.3 3.4 7.8
1995 3.7 0.3 3.4 7.4
1996 3.4 0.2 3.2 6.9
1997 3.3 0.2 3.1 6.7
1998 3.1 0.2 3.0 6.41999 3.0 0.2 3.0 6.2
2000 3.0 0.2 3.0 6.3
2001 3.0 0.2 3.1 6.3
2002 3.3 0.2 3.4 7.0
2003 3.7 0.3 3.6 7.5
2004 3.9 0.3 3.5 7.7
2005 4.0 0.3 3.5 7.8
2006 3.9 0.3 3.5 7.7
2007 3.9 0.3 3.3 7.5
2008 4.2 0.3 3.4 7.9
2009 4.6 0.3 3.8 8.7
Total
8/8/2019 Revenues, Outlays, Deficits, Surpluses, and Debt Held by the Public, 1970-2009
http://slidepdf.com/reader/full/revenues-outlays-deficits-surpluses-and-debt-held-by-the-public-1970-2009 9/13
BUDGET AND ECONOMIC OUTLOOK: HISTORICAL BUDGET DATA
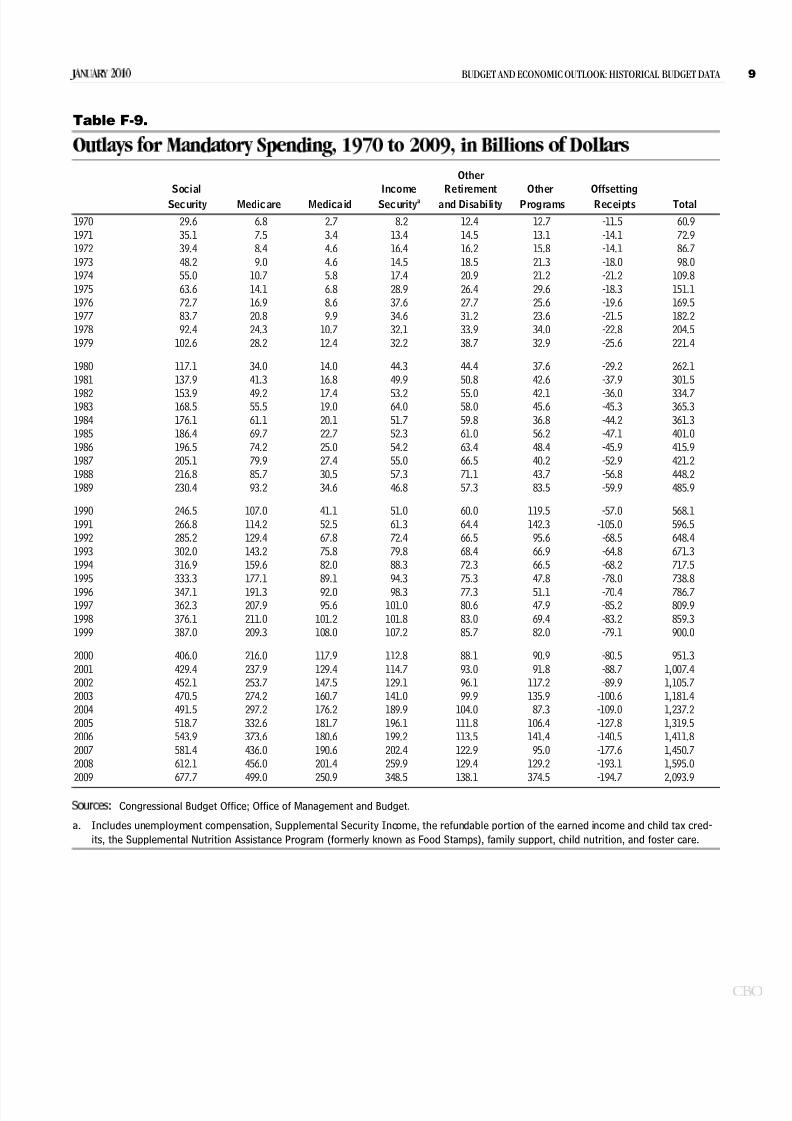
Table F-9.
" ! $
Congressional Budget Office; Office of Management and Budget.
a. Includes unemployment compensation, Supplemental Security Income, the refundable portion of the earned income and child tax cred-
its, the Supplemental Nutrition Assistance Program (formerly known as Food Stamps), family support, child nutrition, and foster care.
1970 29.6 6.8 2.7 8.2 12.4 12.7 -11.5 60.9
1971 35.1 7.5 3.4 13.4 14.5 13.1 -14.1 72.9
1972 39.4 8.4 4.6 16.4 16.2 15.8 -14.1 86.7
1973 48.2 9.0 4.6 14.5 18.5 21.3 -18.0 98.0
1974 55.0 10.7 5.8 17.4 20.9 21.2 -21.2 109.8
1975 63.6 14.1 6.8 28.9 26.4 29.6 -18.3 151.1
1976 72.7 16.9 8.6 37.6 27.7 25.6 -19.6 169.5
1977 83.7 20.8 9.9 34.6 31.2 23.6 -21.5 182.2
1978 92.4 24.3 10.7 32.1 33.9 34.0 -22.8 204.5
1979 102.6 28.2 12.4 32.2 38.7 32.9 -25.6 221.4
1980 117.1 34.0 14.0 44.3 44.4 37.6 -29.2 262.1
1981 137.9 41.3 16.8 49.9 50.8 42.6 -37.9 301.5
1982 153.9 49.2 17.4 53.2 55.0 42.1 -36.0 334.71983 168.5 55.5 19.0 64.0 58.0 45.6 -45.3 365.3
1984 176.1 61.1 20.1 51.7 59.8 36.8 -44.2 361.3
1985 186.4 69.7 22.7 52.3 61.0 56.2 -47.1 401.0
1986 196.5 74.2 25.0 54.2 63.4 48.4 -45.9 415.9
1987 205.1 79.9 27.4 55.0 66.5 40.2 -52.9 421.2
1988 216.8 85.7 30.5 57.3 71.1 43.7 -56.8 448.2
1989 230.4 93.2 34.6 46.8 57.3 83.5 -59.9 485.9
1990 246.5 107.0 41.1 51.0 60.0 119.5 -57.0 568.1
1991 266.8 114.2 52.5 61.3 64.4 142.3 -105.0 596.5
1992 285.2 129.4 67.8 72.4 66.5 95.6 -68.5 648.4
1993 302.0 143.2 75.8 79.8 68.4 66.9 -64.8 671.3
1994 316.9 159.6 82.0 88.3 72.3 66.5 -68.2 717.5
1995 333.3 177.1 89.1 94.3 75.3 47.8 -78.0 738.8
1996 347.1 191.3 92.0 98.3 77.3 51.1 -70.4 786.71997 362.3 207.9 95.6 101.0 80.6 47.9 -85.2 809.9
1998 376.1 211.0 101.2 101.8 83.0 69.4 -83.2 859.3
1999 387.0 209.3 108.0 107.2 85.7 82.0 -79.1 900.0
2000 406.0 216.0 117.9 112.8 88.1 90.9 -80.5 951.3
2001 429.4 237.9 129.4 114.7 93.0 91.8 -88.7 1,007.4
2002 452.1 253.7 147.5 129.1 96.1 117.2 -89.9 1,105.7
2003 470.5 274.2 160.7 141.0 99.9 135.9 -100.6 1,181.4
2004 491.5 297.2 176.2 189.9 104.0 87.3 -109.0 1,237.2
2005 518.7 332.6 181.7 196.1 111.8 106.4 -127.8 1,319.5
2006 543.9 373.6 180.6 199.2 113.5 141.4 -140.5 1,411.8
2007 581.4 436.0 190.6 202.4 122.9 95.0 -177.6 1,450.7
2008 612.1 456.0 201.4 259.9 129.4 129.2 -193.1 1,595.0
2009 677.7 499.0 250.9 348.5 138.1 374.5 -194.7 2,093.9
Total
Social Income Retirement Other
Other
Offsetting
Security Medicare Medica id Securitya
and Disability Programs Receipts

8/8/2019 Revenues, Outlays, Deficits, Surpluses, and Debt Held by the Public, 1970-2009
http://slidepdf.com/reader/full/revenues-outlays-deficits-surpluses-and-debt-held-by-the-public-1970-2009 10/13
BUDGET AND ECONOMIC OUTLOOK: HISTORICAL BUDGET DATA
Table F-10.
" ! "
Gross Domestic Product
Congressional Budget Office; Office of Management and Budget.
a. Includes unemployment compensation, Supplemental Security Income, the refundable portion of the earned income and child tax cred-
its, the Supplemental Nutrition Assistance Program (formerly known as Food Stamps), family support, child nutrition, and foster care.
OtherSocial Income Retirement Other Offsetting
Security Securitya
and Disability Programs Receipts
1970 2.9 0.7 0.3 0.8 1.2 1.3 -1.1 6.0
1971 3.3 0.7 0.3 1.2 1.3 1.2 -1.3 6.7
1972 3.3 0.7 0.4 1.4 1.4 1.3 -1.2 7.4
1973 3.7 0.7 0.4 1.1 1.4 1.6 -1.4 7.5
1974 3.8 0.7 0.4 1.2 1.4 1.5 -1.5 7.6
1975 4.1 0.9 0.4 1.9 1.7 1.9 -1.2 9.7
1976 4.2 1.0 0.5 2.2 1.6 1.5 -1.1 9.8
1977 4.2 1.1 0.5 1.8 1.6 1.2 -1.1 9.2
1978 4.2 1.1 0.5 1.4 1.5 1.5 -1.0 9.2
1979 4.1 1.1 0.5 1.3 1.5 1.3 -1.0 8.9
1980 4.3 1.2 0.5 1.6 1.6 1.4 -1.1 9.61981 4.5 1.4 0.6 1.6 1.7 1.4 -1.2 9.9
1982 4.8 1.5 0.5 1.7 1.7 1.3 -1.1 10.4
1983 4.9 1.6 0.6 1.9 1.7 1.3 -1.3 10.6
1984 4.6 1.6 0.5 1.3 1.6 1.0 -1.2 9.4
1985 4.5 1.7 0.5 1.3 1.5 1.4 -1.1 9.7
1986 4.5 1.7 0.6 1.2 1.4 1.1 -1.0 9.4
1987 4.4 1.7 0.6 1.2 1.4 0.9 -1.1 9.1
1988 4.3 1.7 0.6 1.1 1.4 0.9 -1.1 8.9
1989 4.3 1.7 0.6 0.9 1.1 1.5 -1.1 9.0
1990 4.3 1.9 0.7 0.9 1.0 2.1 -1.0 9.9
1991 4.5 1.9 0.9 1.0 1.1 2.4 -1.8 10.1
1992 4.6 2.1 1.1 1.2 1.1 1.5 -1.1 10.4
1993 4.6 2.2 1.2 1.2 1.0 1.0 -1.0 10.2
1994 4.5 2.3 1.2 1.3 1.0 1.0 -1.0 10.31995 4.5 2.4 1.2 1.3 1.0 0.7 -1.1 10.1
1996 4.5 2.5 1.2 1.3 1.0 0.7 -0.9 10.2
1997 4.4 2.5 1.2 1.2 1.0 0.6 -1.0 9.9
1998 4.3 2.4 1.2 1.2 1.0 0.8 -1.0 9.9
1999 4.2 2.3 1.2 1.2 0.9 0.9 -0.9 9.8
2000 4.1 2.2 1.2 1.1 0.9 0.9 -0.8 9.7
2001 4.2 2.3 1.3 1.1 0.9 0.9 -0.9 9.9
2002 4.3 2.4 1.4 1.2 0.9 1.1 -0.9 10.5
2003 4.3 2.5 1.5 1.3 0.9 1.2 -0.9 10.8
2004 4.2 2.5 1.5 1.6 0.9 0.7 -0.9 10.6
2005 4.2 2.7 1.5 1.6 0.9 0.9 -1.0 10.6
2006 4.1 2.8 1.4 1.5 0.9 1.1 -1.1 10.7
2007 4.2 3.1 1.4 1.5 0.9 0.7 -1.3 10.4
2008 4.2 3.2 1.4 1.8 0.9 0.9 -1.3 11.02009 4.8 3.5 1.8 2.4 1.0 2.6 -1.4 14.7
Medicare Medicaid Total

8/8/2019 Revenues, Outlays, Deficits, Surpluses, and Debt Held by the Public, 1970-2009
http://slidepdf.com/reader/full/revenues-outlays-deficits-surpluses-and-debt-held-by-the-public-1970-2009 11/13
BUDGET AND ECONOMIC OUTLOOK: HISTORICAL BUDGET DATA
!
Congressional Budget Office; Department of Commerce, Bureau of Economic Analysis; Office of Management and Budget.
a. CBO calculated fiscal year numbers from seasonally adjusted quarterly national income and product account data from the Bureau of Eco-
nomic Analysis.
1970 -3 -6 283 -0.3 -0.6 28.1 1,013 1,009
1971 -23 -19 303 -2.1 -1.7 27.7 1,080 1,095
1972 -23 -22 322 -2.0 -1.9 27.3 1,177 1,181
1973 -15 -27 341 -1.2 -2.2 26.8 1,311 1,272
1974 -6 -16 344 -0.4 -1.2 24.4 1,438 1,411
1975 -53 -36 395 -3.3 -2.2 24.4 1,560 1,617
1976 -74 -51 477 -4.1 -2.9 26.7 1,738 1,791
1977 -54 -42 549 -2.7 -2.1 27.4 1,974 2,002
1978 -59 -61 607 -2.7 -2.8 27.5 2,217 2,211
1979 -41 -50 640 -1.6 -2.0 25.9 2,501 2,476
1980 -74 -59 712 -2.7 -2.1 25.7 2,724 2,7711981 -79 -58 789 -2.5 -1.9 25.4 3,057 3,109
1982 -128 -68 925 -3.8 -2.0 27.1 3,224 3,412
1983 -208 -124 1,137 -5.7 -3.4 31.0 3,441 3,671
1984 -185 -159 1,307 -4.7 -4.1 33.3 3,844 3,921
1985 -212 -199 1,507 -5.1 -4.8 36.0 4,146 4,182
1986 -221 -212 1,741 -5.0 -4.8 39.3 4,404 4,424
1987 -150 -138 1,890 -3.2 -2.9 40.3 4,651 4,687
1988 -155 -163 2,052 -3.1 -3.3 41.1 5,008 4,988
1989 -153 -175 2,191 -2.9 -3.3 41.0 5,399 5,342
1990 -221 -234 2,412 -3.9 -4.1 42.3 5,734 5,707
1991 -269 -216 2,689 -4.4 -3.5 44.1 5,930 6,092
1992 -290 -214 3,000 -4.5 -3.3 46.8 6,242 6,414
1993 -255 -193 3,248 -3.8 -2.9 48.3 6,587 6,7271994 -203 -163 3,433 -2.9 -2.3 48.6 6,977 7,059
1995 -164 -138 3,604 -2.2 -1.9 48.6 7,341 7,418
1996 -107 -78 3,734 -1.4 -1.0 47.9 7,718 7,790
1997 -22 -28 3,772 -0.3 -0.3 46.1 8,212 8,183
1998 69 29 3,721 0.8 0.3 43.5 8,663 8,563
1999 126 38 3,632 1.4 0.4 40.5 9,208 8,978
2000 236 102 3,410 2.5 1.1 36.0 9,821 9,484
2001 128 48 3,320 1.3 0.5 33.0 10,225 10,070
2002 -158 -133 3,540 -1.5 -1.3 33.4 10,544 10,601
2003 -378 -306 3,913 -3.4 -2.7 35.0 10,980 11,166
2004 -413 -372 4,296 -3.5 -3.2 36.5 11,686 11,767
2005 -318 -313 4,592 -2.6 -2.5 36.9 12,446 12,451
2006 -248 -264 4,829 -1.9 -2.0 36.6 13,225 13,193
2007 -161 -162 5,035 -1.2 -1.2 36.2 13,896 13,922
2008 -459 -408 5,803 -3.1 -2.8 39.7 14,439 14,608
2009 -1414 -1105 7,544 -9.3 -7.3 49.7 14,236 15,168
Gross Domestic ProductCyclically Adjusted Cyclically Adjusted
Billions of Dollars
Deficit (-) Debt Held Deficit (-) Deficit (-) Debt Held
Percentage of Potential GDP
(Billions of dollars)
Actuala
Potentialor Surplus or Surplus by the Public or Surplus or Surplus by the Public
Deficit (-)
8/8/2019 Revenues, Outlays, Deficits, Surpluses, and Debt Held by the Public, 1970-2009
http://slidepdf.com/reader/full/revenues-outlays-deficits-surpluses-and-debt-held-by-the-public-1970-2009 12/13
BUDGET AND ECONOMIC OUTLOOK: HISTORICAL BUDGET DATA
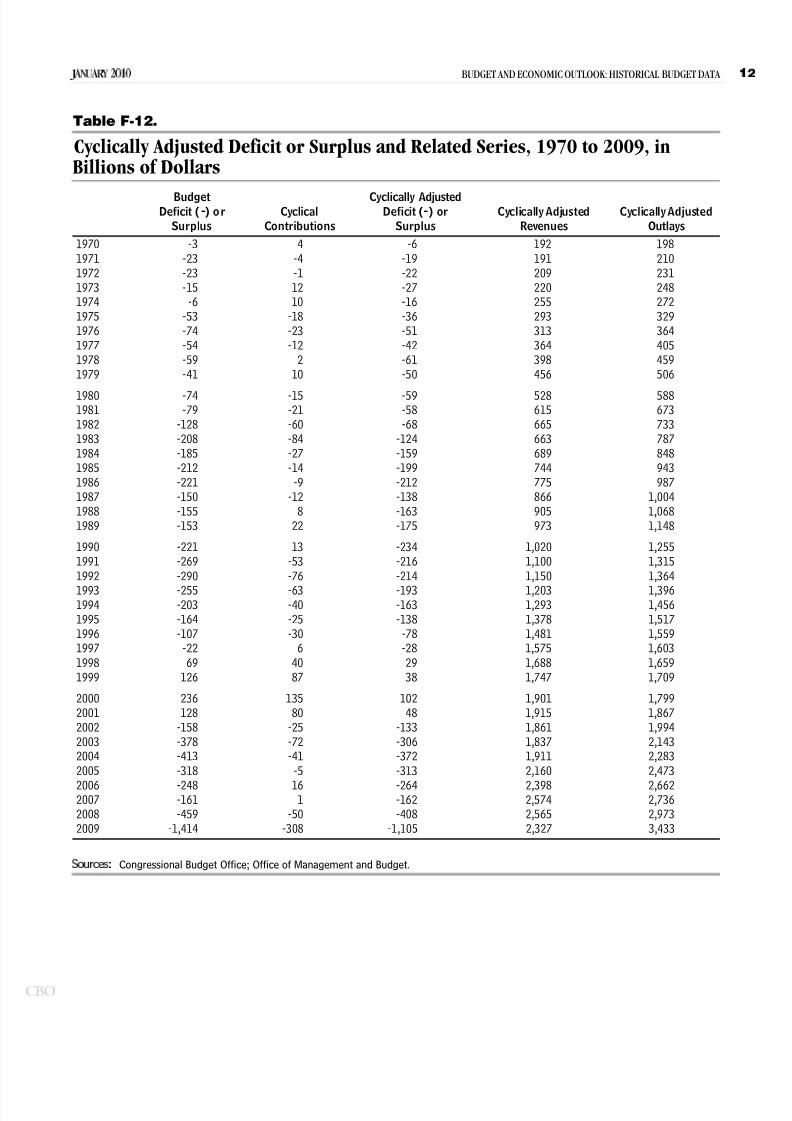
Table F-12.
Cyclically Adjusted Deficit or Surplus and Related Series, 1970 to 2009, inBillions of Dollars
Congressional Budget Office; Office of Management and Budget.
1970 -3 4 -6 192 198
1971 -23 -4 -19 191 210
1972 -23 -1 -22 209 231
1973 -15 12 -27 220 248
1974 -6 10 -16 255 272
1975 -53 -18 -36 293 329
1976 -74 -23 -51 313 364
1977 -54 -12 -42 364 405
1978 -59 2 -61 398 459
1979 -41 10 -50 456 506
1980 -74 -15 -59 528 5881981 -79 -21 -58 615 673
1982 -128 -60 -68 665 733
1983 -208 -84 -124 663 787
1984 -185 -27 -159 689 848
1985 -212 -14 -199 744 943
1986 -221 -9 -212 775 987
1987 -150 -12 -138 866 1,004
1988 -155 8 -163 905 1,068
1989 -153 22 -175 973 1,148
1990 -221 13 -234 1,020 1,255
1991 -269 -53 -216 1,100 1,315
1992 -290 -76 -214 1,150 1,364
1993 -255 -63 -193 1,203 1,3961994 -203 -40 -163 1,293 1,456
1995 -164 -25 -138 1,378 1,517
1996 -107 -30 -78 1,481 1,559
1997 -22 6 -28 1,575 1,603
1998 69 40 29 1,688 1,659
1999 126 87 38 1,747 1,709
2000 236 135 102 1,901 1,799
2001 128 80 48 1,915 1,867
2002 -158 -25 -133 1,861 1,994
2003 -378 -72 -306 1,837 2,143
2004 -413 -41 -372 1,911 2,283
2005 -318 -5 -313 2,160 2,473
2006 -248 16 -264 2,398 2,6622007 -161 1 -162 2,574 2,736
2008 -459 -50 -408 2,565 2,973
2009 -1,414 -308 -1,105 2,327 3,433
BudgetDeficit (-) or Cyclical
Surplus Contributions Revenues
Cyclically Adjusted Cyclically Adjusted
Outlays
Cyclically AdjustedDeficit (-) or
Surplus

8/8/2019 Revenues, Outlays, Deficits, Surpluses, and Debt Held by the Public, 1970-2009
http://slidepdf.com/reader/full/revenues-outlays-deficits-surpluses-and-debt-held-by-the-public-1970-2009 13/13
BUDGET AND ECONOMIC OUTLOOK: HISTORICAL BUDGET DATA
# ' !
Percentage of Gross Domestic Product
Congressional Budget Office; Office of Management and Budget.
Note: * = between -0.05 percent and 0.05 percent.
970 -0.3 0.4 -0.6 19.0 19.7
971 -2.1 -0.4 -1.7 17.5 19.2
972 -2.0 -0.1 -1.9 17.7 19.5
973 -1.2 1.0 -2.2 17.3 19.5
974 -0.4 0.7 -1.2 18.1 19.3
975 -3.3 -1.1 -2.2 18.1 20.3
976 -4.1 -1.3 -2.9 17.5 20.3
977 -2.7 -0.6 -2.1 18.2 20.2
978 -2.7 0.1 -2.8 18.0 20.8
979 -1.6 0.4 -2.0 18.4 20.4
980 -2.7 -0.5 -2.1 19.1 21.2
981 -2.5 -0.7 -1.9 19.8 21.7
982 -3.8 -1.7 -2.0 19.5 21.5
983 -5.7 -2.3 -3.4 18.1 21.4
984 -4.7 -0.7 -4.1 17.6 21.6
985 -5.1 -0.3 -4.8 17.8 22.5
986 -5.0 -0.2 -4.8 17.5 22.3
987 -3.2 -0.3 -2.9 18.5 21.4
988 -3.1 0.2 -3.3 18.1 21.4
989 -2.9 0.4 -3.3 18.2 21.5
990 -3.9 0.2 -4.1 17.9 22.0
991 -4.4 -0.9 -3.5 18.0 21.6
992 -4.5 -1.2 -3.3 17.9 21.3
993 -3.8 -0.9 -2.9 17.9 20.7994 -2.9 -0.6 -2.3 18.3 20.6
995 -2.2 -0.3 -1.9 18.6 20.4
996 -1.4 -0.4 -1.0 19.0 20.0
997 -0.3 0.1 -0.3 19.2 19.6
998 0.8 0.5 0.3 19.7 19.4
999 1.4 1.0 0.4 19.5 19.0
000 2.5 1.4 1.1 20.0 19.0
001 1.3 0.8 0.5 19.0 18.5
002 -1.5 -0.2 -1.3 17.6 18.8
003 -3.4 -0.6 -2.7 16.5 19.2
004 -3.5 -0.3 -3.2 16.2 19.4
005 -2.6 * -2.5 17.3 19.9
006 -1.9 0.1 -2.0 18.2 20.2007 -1.2 * -1.2 18.5 19.7
008 -3.1 -0.3 -2.8 17.6 20.4
009 -9.3 -2.0 -7.3 15.3 22.6
Cyclically Adjusted
Revenues
Cyclically Adjusted
OutlaysSurplus Contributions
Cyclically AdjustedDeficit (-) or
Surplus
BudgetDeficit (-) or Cyclical