Embed Size (px)
Citation preview

Ch. 14: Fiscal Policy
• Federal budget process and recent history of outlays, tax revenues, deficits, and debts
• Supply-Side Economics• Controversies on effects of deficits on investment,
saving, and economic growth• Redistribution of benefits and costs across generations• Fiscal policy as a stabilization tool

Federal government spending for 2009 (ending in September 2009) is projected to be
approximately
$500 billion $1 trillion $2 trillion $3 trillion
25% 25%25%25%
20
a) $500 billion
b) $1 trillion
c) $2 trillion
d) $3 trillion

In fiscal year 2009, the budget deficit is projected to be
$500 billion $750billion $1 trillion $1.75 trillion
25% 25%25%25%
20
a) $500 billion
b) $750billion
c) $1 trillion
d) $1.75 trillion

The Federal Budget and Fiscal Policy
Federal budget• annual statement of the federal government’s outlays and tax
revenues.• Two purposes
o finance the activities of the federal governmento achieve macroeconomic objectives
Fiscal policy • the use of the federal budget to achieve macroeconomic
objectives
• Employment Act of 1946
it is the continuing policy and responsibility of the Federal Government to use all practicable means . . . to coordinate and utilize all its plans, functions, and resources . . . to promote maximum employment, production, and purchasing power.

Timeline for Budget Process
February to March President submits budget request to Congress.
May-August:House and Senate revise/amend proposals
September House-Senate conference committees resolve differences and agree on final versions of spending bills. President signs or vetoes final bills.
October 1 Beginning of fiscal year.
Congress passes continuing resolutions to maintain funding for any agencies affected by appropriations bills that have not been passed and signed by the beginning of the fiscal year.

Fiscal Policy
The Council of Economic Advisers• Chaired by Christina Romer• monitors the economy • keeps the President and the public well informed about
the current state of the economy • forecasts of where it is heading.• source of data that informs the budget-making process.
Congressional Budget Office• Forecasts effects of legislative changes on budget and
economy
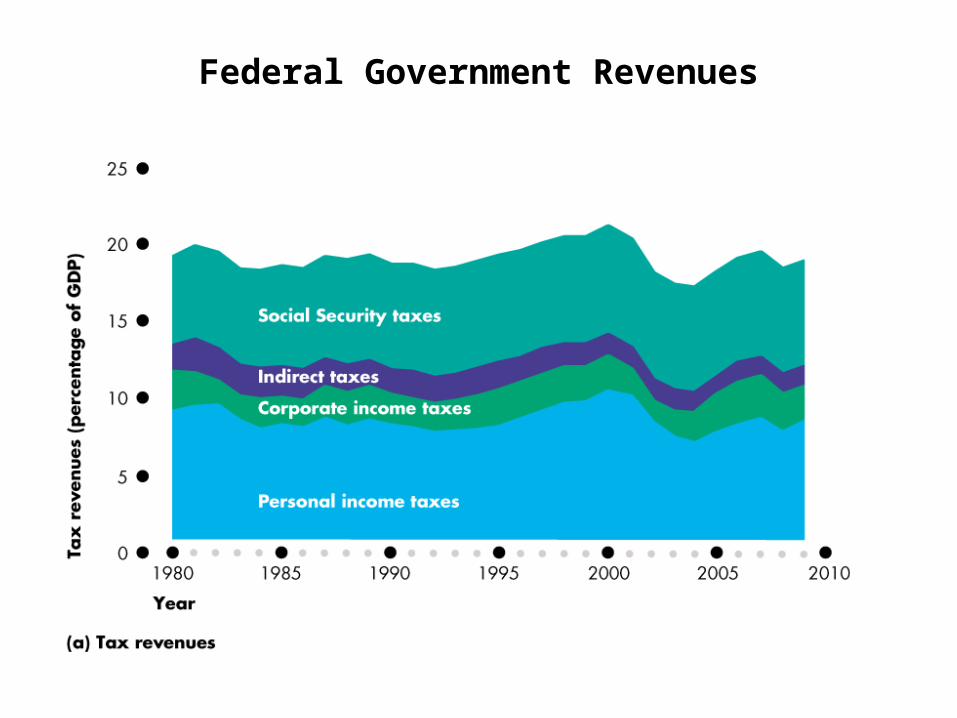
Federal Government Revenues

Federal Government Spending


Federal Deficits and Public Debt
Budgett = revenuet –outlayst
• if Budgett > 0 budget surplus
• if Budgett < 0 budget deficit
Debtt = Debtt-1 - budgett-1
• Budget deficits increase debt• Budget surpluses decrease debt
The national debt clock

The Federal Budget

CBO PROJECTIONS OF OBAMA BUDGET

SOURCE: http://www.cbo.gov/ftpdocs/100xx/doc10014/03-20-PresidentBudget.pdf

The National Debt


• The total government sector includes state and local governments as well as the federal government.
• In 2008, when federal government outlays were about $3,200 billion, state and local outlays were a further $2,000 billion.
• Most of state expenditures were on public schools, colleges, and universities ($550 billion); local police and fire services; and roads.
• Most states have “balanced budget amendments”.
State and Local Budgets
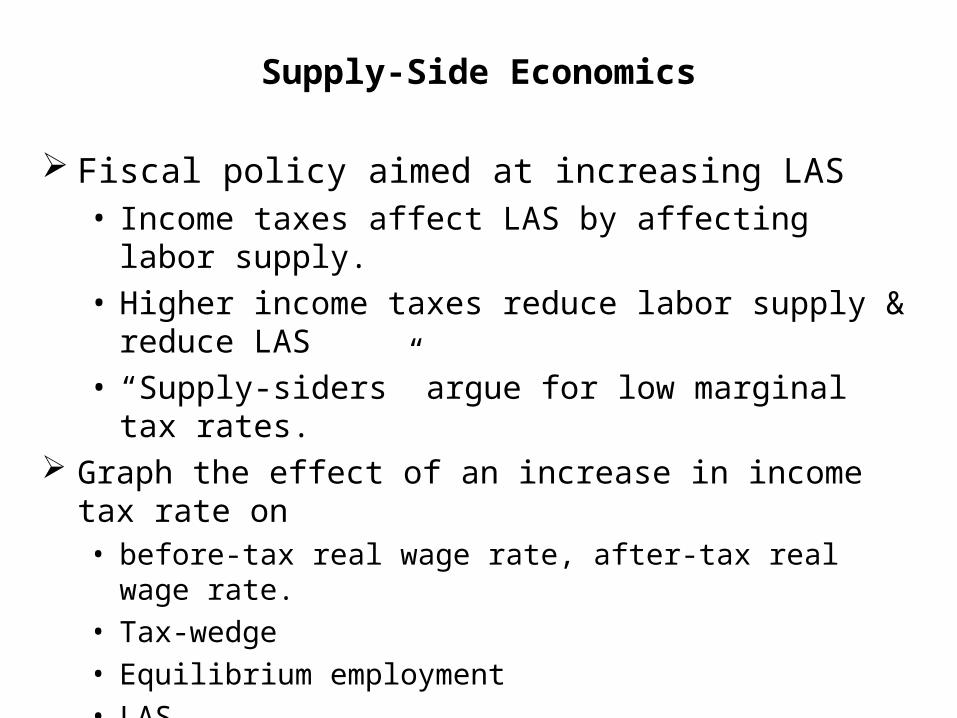
Supply-Side Economics
Fiscal policy aimed at increasing LAS• Income taxes affect LAS by affecting labor supply.• Higher income taxes reduce labor supply & reduce LAS• “Supply-siders” argue for low marginal tax rates.
Graph the effect of an increase in income tax rate on• before-tax real wage rate, after-tax real wage rate.
• Tax-wedge
• Equilibrium employment
• LAS

Effect of an increase in income tax rate

Tax Wedge Comparisons

In 2008, a single person with $10,000 of taxable income would pay federal income taxes of:
$542 $937 $1,526 $1,924
25% 25%25%25%
20
a) $542
b) $937
c) $1526
d) $1924

In 2008, a single person with $100,000 of taxable income would pay federal income taxes
of:
$9,371 $14,268 $17,372 $21,978
25% 25%25%25%
20
a) $9,371
b) $14,268
c) $17,372
d) $21,978

In 2008, a single person with $1,000,000 of taxable income would pay federal income taxes
of:
$221,365 $328,597 $416,317 $527,102
25% 25%25%25%
20
a) $221,365
b) $328,597
c) $416,317
d) $527,102
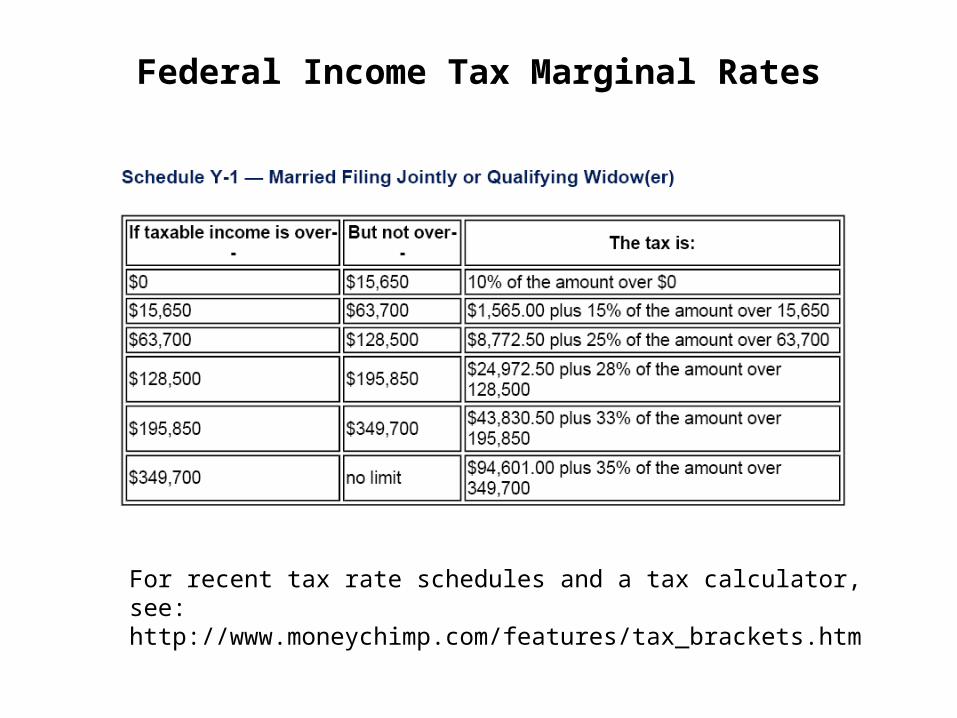
Federal Income Tax Marginal Rates
For recent tax rate schedules and a tax calculator, see:http://www.moneychimp.com/features/tax_brackets.htm

Top Marginal Tax Rates
Source: http://www.taxpolicycenter.org/taxfacts/displayafact.cfm?Docid=213

Historical average tax rates in U.S. by Income Quintile: Income Tax Only
Source: http://www.cbo.gov/doc.cfm?index=6133&type=0Includes individual income tax only
.:

“The lucky duckies”
WSJ, November 2003.
The most recent data from the IRS, in 2000, show that the top 5% coughed up more than half of total tax revenue. Specifically, we are talking about folks with adjusted gross incomes of $128,336 and higher being responsible for 56% of the tax take. Eyebrows raised? There's more. The top 50% of taxpayers accounted for almost all income tax revenue--96% of the total take.
Source: http://www.opinionjournal.com/extra/?id=110002937

Share of Federal Income Taxes Paid by Quintile
Source: http://www.cbo.gov/doc.cfm?index=6133&type=0Includes individual income tax only
.:

The Supply-Side: The Laffer Curve.
Tax Revenue
Tax Rates

The Laffer Curve
As tax rates rise, taxable income may fall because• People reduce work hours• Tax avoidance increases
oLegal tax avoidance– Charities– Tax free bonds– Pension saving– Etc
o Illegal tax avoidance– Under-report income– Inflate deductions

Laffer Curve and Capital Gains Tax
Source: http://time-blog.com/curious_capitalist/2008/01/do_capital_gains_tax_cuts_incr.html

According to the Laffer curve, if tax rates rise, tax revenue
Will
rise
May r
ise or f
a...
Will
fall
33% 33%33%
20
a) Will rise
b) May rise or fall
c) Will fall

The Supply-Side: Investment and Saving
GDP = C + I + G + (X – M) GDP = C + S + T
I + G + (X – M) = S + T I = S + (T – G) + (M – X)
Private saving PS = S + (M – X)
Government Saving GS=T-G
I = PS + GS

The Supply-Side: Investment and Saving

The Supply-Side: Investment and Saving
Fiscal policy influences investment and saving in two ways:• Taxes affect the incentive to save and change the
supply of loanable funds.• Government saving is a component of total saving and
the supply of loanable funds.

The Supply-Side: Investment and Saving
A tax on capital income decreases the supplyof loanable funds
a tax wedge is driven between the interest rate and the after-tax interest rate
Investment and saving decrease.

The Supply-Side: Investment and Saving
Ricardo-Barro Equivalence• In above diagram, it is assumed that government
budget does not shift PSLF curve.• Ricardo-Barro:
oLarger deficits cause households to increase savings in order to cover future tax increases.
oNet effect of larger deficit on SLF curve is zero because PSLF curve shifts right.
oNo effect on investment or interest ratesoAll increases in deficits are offset by increased
saving (decreased consumption).

Assume that deficits do not affect private saving. A larger budget deficit will lead to ___
interest rates and ___ investment
High
er; more
High
er; less
Lower;
more
Lower;
less
25% 25%25%25%
20
a) Higher; more
b) Higher; less
c) Lower; more
d) Lower; less

Assuming Ricardo-Barro effects, an increase in the federal budget deficit will lead to ___ private saving,
___ interest rates, and ____ investment.
No ch
ange in; ..
.
More
; no ch
ang...
More
; lower; m
...
None of t
he ab...
25% 25%25%25%
20
a) No change in; higher; less
b) More; no change in; no change in.
c) More; lower; more.
d) None of the above
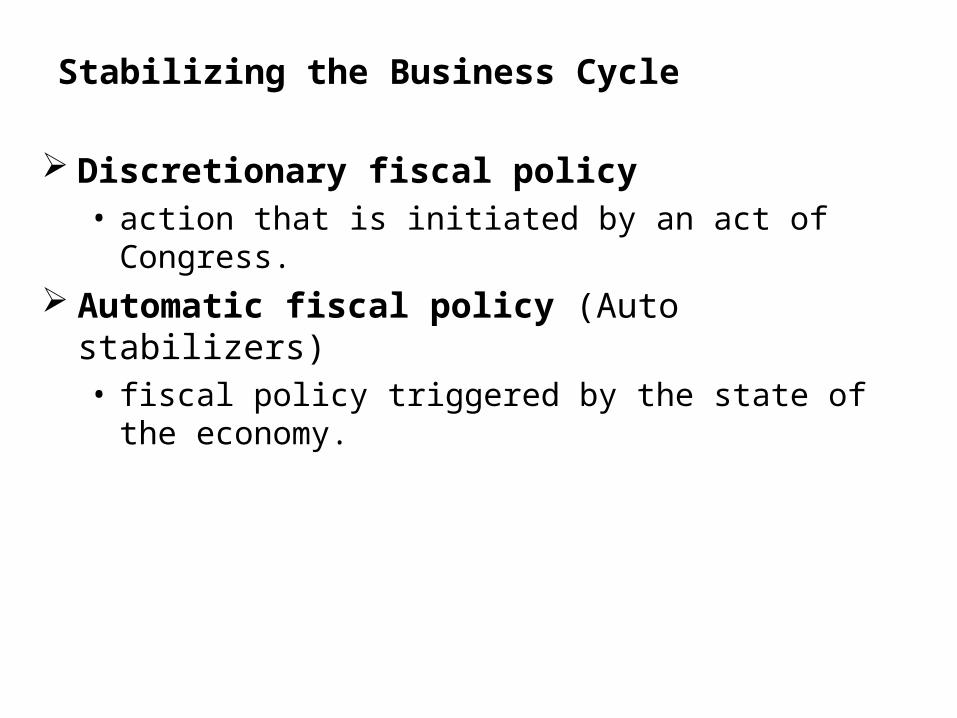
Stabilizing the Business Cycle
Discretionary fiscal policy • action that is initiated by an act of Congress.
Automatic fiscal policy (Auto stabilizers)• fiscal policy triggered by the state of the economy.

Stabilizing the Business Cycle
Discretionary Fiscal Stabilization• An increase in
government expenditure or a tax cut increases aggregate demand.
• The “multiplier process” increases aggregate demand further.
• Size of multiplier is controversial.

Stabilizing the Business Cycle
• A decrease in government expenditure or a tax increase decreases aggregate demand.
• The multiplier process decreases aggregate demand further.

Stabilizing the Business Cycle
Limitations of Discretionary Fiscal Policy• Recognition lag
o time it takes to figure out that fiscal policy action is needed.
oLaw-making lag– time it takes Congress to pass the laws needed to change
taxes or spending.
o Impact lag– time it takes from passing a tax or spending change to its
effect on real GDP being felt.

Stabilizing the Business Cycle
Automatic Stabilizers• mechanisms that stabilize real GDP without explicit
action by the government.• Taxes that rise and fall with GDP taxes and needs-
tested spending are automatic stabilizers.
• When real GDP decreases in a recession• wages and profits fall, so taxes fall• Needs-tested spending rises• Budget deficit grows (surplus shrinks)

The Budget and the Business Cycle
Cyclical and Structural Balances Actual Budget = Cyclical Budget + Structural Budget
• The structural surplus or deficit • the surplus or deficit that would occur if the economy
were at full employment and real GDP were equal to potential GDP.
• The cyclical surplus or deficit • the surplus or deficit that occurs purely because real
GDP does not equal potential GDP.• Cyclical budget < 0 if GDP< potential GDP

Cyclical and Structural Budget

If the structural budget is +$100 billion and the cyclical budget is -$300 billion, we can conclude
that if the economy was at full employment:
there
would be...
There w
ould be...
There w
ould be...
33% 33%33%
20
a) there would be a surplus
b) There would be a deficit.
c) There would be a balanced budget.
If the structural budget is +$100 billion and the cyclical budget is -$300 billion, we can conclude
that the economy is currently producing ____ potential GDP
above
below at
33% 33%33%
20
a) above
b) below
c) at

As the economy recovers from the current recession, the actual budget deficit should
Shrin
k as tax .
..
Shrin
k as tax .
..
Rise as t
ax re...
None of t
he ab...
25% 25%25%25%
20
a) Shrink as tax revenues rise and government spending falls
b) Shrink as tax revenues and government spending fall
c) Rise as tax revenues rise and government spending falls.
d) None of the above.