Embed Size (px)
Citation preview

Africa Region Working Paper Series Number 103
ECOWAS – Fiscal Revenue Implications of the Prospective Economic Partnership Agreement with the EU
Simplice G. Zouhon-BiLynge Nielsen
April 2007
Headquarters1818 H Street, N.W.Washington, D.C. 20433, USA
Telephone: (202) 473-1000Facsimile: (202) 477-6391 RCA248423 WORLDDBK
Working Paper Series web address:http://www.worldbank.org/afr/wps/index.htm
European Office66, avenue d’Iéna75116 Paris, France
Telephone: (1) 40.69.30.00Facsimile: (1) 40.69.30.66Telex: 640661
Tokyo OfficeFukoku Seimei Building, 10th Floor2-2-2 Uchisaiwai-ChoChiyoda-Ku, Tokyo 100-0011 Japan
Telephone: (81-3) 3597-6650Facsimile: (81-3) 3597-6695Telex: 26838
The World Bank
40392
Pub
lic D
iscl
osur
e A
utho
rized
Pub
lic D
iscl
osur
e A
utho
rized
Pub
lic D
iscl
osur
e A
utho
rized
Pub
lic D
iscl
osur
e A
utho
rized
Pub
lic D
iscl
osur
e A
utho
rized
Pub
lic D
iscl
osur
e A
utho
rized
Pub
lic D
iscl
osur
e A
utho
rized
Pub
lic D
iscl
osur
e A
utho
rized
ECOWAS – FISCAL REVENUE IMPLICATIONS OF THE PROSPECTIVE ECONOMIC PARTNERSHIP AGREEMENT WITH THE EU Africa Region Working Paper Series No. 103 April 2007 Abstract
his paper applies a partial equilibrium model (Verdoorn, 1960) to analyze the fiscal revenue implications of the prospective economic partnership agreement (EPA) between ECOWAS and the EU.
We find that, under standard import price and substitution elasticity assumptions, eliminating tariffs on all imports from the EU would increase ECOWAS’ imports from the EU by 10.5–11.5 percent for selected ECOWAS countries, namely Cape Verde, Ghana, Nigeria and Senegal. This increase in imports from the EU would be accompanied by a 2.4–5.6 percent decrease in total government revenues, owing
mainly to lower fiscal revenues. Tariff revenue losses should represent 1.0 percent of GDP in Nigeria, 1.7 percent in Ghana, 2.0 percent in Senegal and 3.6 percent in Cape Verde. However, the revenue losses may be manageable because of several mitigating factors, in particular the likelihood of product exclusions, the length of the EPA implementation period and the scope for reform of exemptions regimes. The large country-by-country differences in fiscal revenue loss suggest that domestic tax reforms and fiscal transfers within ECOWAS could be important complements to EPA implementation.
Authors’ Affiliation and Sponsorship Simplice G. Zouhon-Bi World Bank E-Mail: [email protected]
Lynge Nielsen IMF E-Mail: [email protected]
JEL Classification Numbers: C82, F10, F13, F15, F17, F41 Keywords: Revenue Effects of Trade Liberalization, Regional Trade Agreement, Africa The Africa Region Working Paper Series expedites dissemination of applied research and policy studies with potential for improving economic performance and social conditions in Sub-Saharan Africa. The Series publishes papers at preliminary stages to stimulate timely discussion within the Region and among client countries, donors, and the policy research community. The editorial board for the Series consists of representatives from professional families appointed by the Region’s Sector Directors. For additional information, please contact Paula White, managing editor of the series, (81131), Email: [email protected] or visit the Web site: http://www.worldbank.org/afr/wps/index.htm.
The findings, interpretations, and conclusions expressed in this paper are entirely those of the author(s), they do not necessarily represent the views of the World Bank Group, its Executive Directors, or the countries they represent and should not be attributed to them.
T
ECOWAS FISCAL REVENUE IMPLICATIONS OF THE PROSPECTIVE ECONOMIC PARTNERSHIP AGREEMENT WITH THE EU1
By
Lynge Nielsen
And
Simplice G. Zouhon-Bi
April 2007
1 This paper was written in connection with the IMF Trade Policy Division’s and the World Bank Africa region’s work programs, but is the responsibility of the authors and not their institutions. The authors wish to thank Hans Peter Lankes and Philip English for their insightful comments and suggestions. Comments on an earlier draft by Robert Blake, Nancy Benjamin, Paul Brenton, Manuela Francisco, Mombert Hoppe, Boileau Loko, Emmanuel Pinto Moreira and discussions with other colleagues are gratefully acknowledged. Dustin Smith provided able research assistance. Paula White provided logistical support. The usual disclaimers apply.
2
CONTENTS PAGE I. Introduction......................................................................................................................1
II. ECOWAS—Achievements so far and Challenges Ahead...............................................3
III. The Road to Establishing the ECOWAS Customs Union ...............................................6
IV. The Parameters of an ECOWAS—EU Economic Partnership Agreement .....................8
V. Estimates of EPA Trade and Fiscal Revenue Effects: Methodology and Literature......9
VI. Empirical Results ...........................................................................................................12
VII. Mitigating the Revenue Impact of Integration...............................................................14
VIII. Concluding Remarks......................................................................................................15
IX. References......................................................................................................................17
TABLES
1. Nigeria: October 2005 Tariff Reform....................................................................................7 2. EU-ECOWAS Economic Partnership Agreement...............................................................12 3. Comparing the Results of the IMF/World Bank..................................................................13 4. Efficiency of Import Tariff Revenue Collection, 2001........................................................14
FIGURES
1. EU-ECOWAS EPA: Tariff Revenue Loss in million US$..................................................12
APPENDIXES
I. VERDOORN’S MODEL ....................................................................................................19 II. ECOWAS: EPA trade and fiscal effects .............................................................................24
APPENDIX TABLES
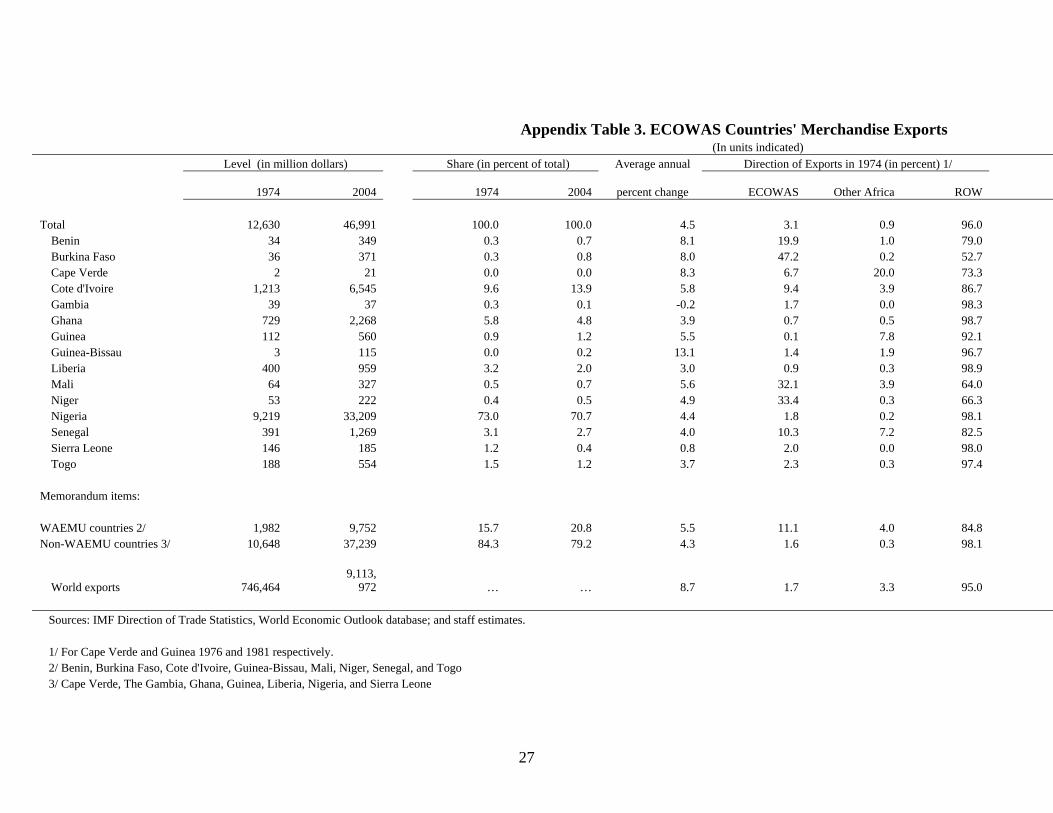
1. ECOWAS Countries’ Gross Domestic Product...................................................................25 2. ECOWAS Countries’ Demographic and Social Indicators .................................................26 3. ECOWAS Countries' Merchandise Exports ........................................................................27 4. ECOWAS Countries’ Bound and Applied Tariff Rates in 2004 .........................................28
I. INTRODUCTION
The Economic Community of West African States (ECOWAS) promotes regional political co-operation and economic integration with the aim of eventually establishing an economic union among West African countries. The treaty establishing the ECOWAS was signed in Lagos, Nigeria on 28 May 1975 and came into force on 20 June 1975. After having celebrated its 30th anniversary, ECOWAS is now faced with the daunting challenge of how to move forward with regional economic integration while at the same time negotiating a major redesign of its trading relationship with the European Union (EU).
Throughout its existence, ECOWAS’ commercial relations with the EU have been framed by the trade policy understandings contained in the partnership agreements that the EU has entered into with developing countries in Africa, the Caribbean, and the Pacific (ACP-countries). From the Lomé I agreement (signed in 1975) through the Lomé IV agreement (signed in 1989) to the current Cotonou Agreement (signed in 2000) these ACP-EU agreements2 have all had as a primary objective to foster the gradual integration of the ACP countries into the world economy. However, it bears stressing that the agreements have not been limited to understandings in the trade policy area, but have also included understandings covering cooperation and collaboration in areas as diverse as human development, migration, environment, emergency assistance, and foreign investment attraction.
Among its trade provisions, the Lomé agreements granted ACP-countries unilateral preferential access to the EU market. This required waivers from the WTO since it implied discrimination against non-ACP developing countries—a contravention of the key Most Favored Nation (MFN) principle. WTO rules allow derogations from the MFN-principle for trade agreements where preferences are reciprocal and covering essentially all goods, or for unilateral market access privileges extended either to all developing countries or uniquely to least developed countries (LDCs). However, the ACP group includes only subsets of LDCs and developing countries.3
The Cotonou Agreement—covering ACP-EU collaboration over the 2000–20 period—recognizes explicitly that the trading arrangements in the Lomé agreements were not WTO-consistent, but notes the need to continue to maintain them during a transitory period while new
2 The signatory to these agreements is the European Community (EC) and not the European Union so strictly speaking these agreements should be refered to as ACP-EC agreements. As all EU member countries are also members of the EC the EU/EC distinction is of no economic significance and throughout this paper the more natural ACP-EU terminology is used. 3 The modalities governing the establishment of derogations to the MFN-principle are laid out in Article XXIV of the General Agreement on Tariffs and Trade, Article V of the General Agreement on Trade in Services, and Article IV of the Agreement on Trade-Related Aspects of Intellectual Property Rights. The Tokyo Round’s “Enabling Clause” provides the legal basis for developed countries’ granting of preferential market access to developing countries/least developing countries.
2
WTO-consistent trade agreements can be negotiated. The Cotonou agreement also includes a firm timetable for finalizing these WTO-consistent agreements by the end of 2007 to ensure that the new agreements can go into effect in January 2008. The timetable for completing WTO-consistent trade agreements was subsequently endorsed by the WTO membership at its 2001 ministerial conference in Doha, Qatar when the EU was granted a waiver of its WTO commitments with respect to the Cotonou agreement through 2007.
The negotiations on WTO-consistent ACP-EU trade agreements—to be named Economic Partnership Agreements (EPA)—are conducted in parallel with six different regional groupings (one for the Caribbean countries, one for the Pacific countries and four country groupings in Africa). The African groupings are centered around the Common Market for Eastern and Southern Africa, the Southern African Development Community, Central African Common Market as well as ECOWAS. Countries that are not members of a regional trade grouping may associate themselves with one of these groupings for the purpose of negotiating the new agreement. In West Africa, Mauritania has taken advantage of this possibility by joining the EU-ECOWAS negotiating group.
While the scope of the EPAs is a matter for negotiation, the parties are aiming at broad framework agreements covering a wide range of areas of common economic interest as also suggested by the name chosen for the new type of agreement. Regardless of what form the EPAs will take, it is however clear that the core of the agreements must be a reciprocal free trade agreement between EU on the one hand and each of the six negotiating groups on the other hand which is the sine qua non of a WTO-consistent EPA.
Among the challenges posed by the prospective ECOWAS-EU EPA is the need to consider fiscal implications and the appropriate sequencing of ECOWAS’ regional, EPA and global integration plans. Thus, completion of a fully functioning ECOWAS customs union prior to the enactment of the EPA would mitigate the chances of a hub-and-spokes pattern emerging in which trade with the EU is encouraged but intra-regional barriers prevent regional trade development within ECOWAS.4 Preferential treatment for one large trading partner may also result in trade diversion from more efficient—but now higher-taxed—MFN sources of supply. Such trade diversion has a welfare cost for ECOWAS, but could be minimized if MFN tariffs are lowered in parallel with the introduction of preferences. Finally, the introduction of trade preferences, with attendant loss of customs revenues on imports both from EU and other ECOWAS trading partners, will require a fiscal response. The fiscal impact would be aggravated to the extent that imports are diverted from non-EU sources to the EU. Given the ECOWAS countries’ fragile economies, precarious fiscal positions, and enormous development needs, other sources of revenue may need to be mobilized to offset such revenue losses.
4 A customs union is not needed for the EPA per se as an ECOWAS free trade area coupled with liberal rules of origin and cumulation rules would suffice. However, ECOWAS decided to form a customs union long before the EPA negotiations commenced and the 2008 timetable for completion of the customs union is not formally linked to the timetable for completion of the EPA negotiations. The same argument applies to trade relations between the six trading groups that are negotiating separate EPAs with the EU. High MFN-barriers in a post-EPA environment would tend to encourage a world-wide hub and spoke system to the detriment of south-south trade prospects.
3
The paper is organized as follows. Following a brief discussion of ECOWAS’ achievements so far in regional economic integration, the paper provides estimates of import and fiscal revenue effects of major tariff reforms in Guinea and Nigeria in 2005 as well as the planned introduction of an ECOWAS customs union in 2008; these estimates are necessary building blocks before one can estimate the effects of the possible EPA but the estimates are also of interest in their own right. The paper then provides estimates of the import and fiscal revenue effects of an ECOWAS-EU EPA and compares and contrasts these estimates with other studies. The paper adds to the literature by incorporating explicitly the different tariff regimes in ECOWAS, conducting the analysis using more recent data on trade flows and fiscal revenue for selected ECOWAS countries, and by discussing factors that could mitigate revenue loss.
II. ECOWAS—ACHIEVEMENTS SO FAR AND CHALLENGES AHEAD
Regional economic integration is never easy in the best of circumstances, and in West Africa integration has been pursued in extraordinarily difficult conditions. West African countries are among the poorest countries in the world and all have weak public institutions. Indeed, all but three countries—Cote d’Ivoire, Ghana, and Nigeria—are LDCs. In addition, the region has suffered from a disproportionate number of devastating civil conflicts including in Cote d’Ivoire, Guinea-Bissau, Liberia, and Sierra Leone. All of these conflicts have had significant adverse repercussions across national borders, which in turn have set back progress towards achieving the economic integration of the region.
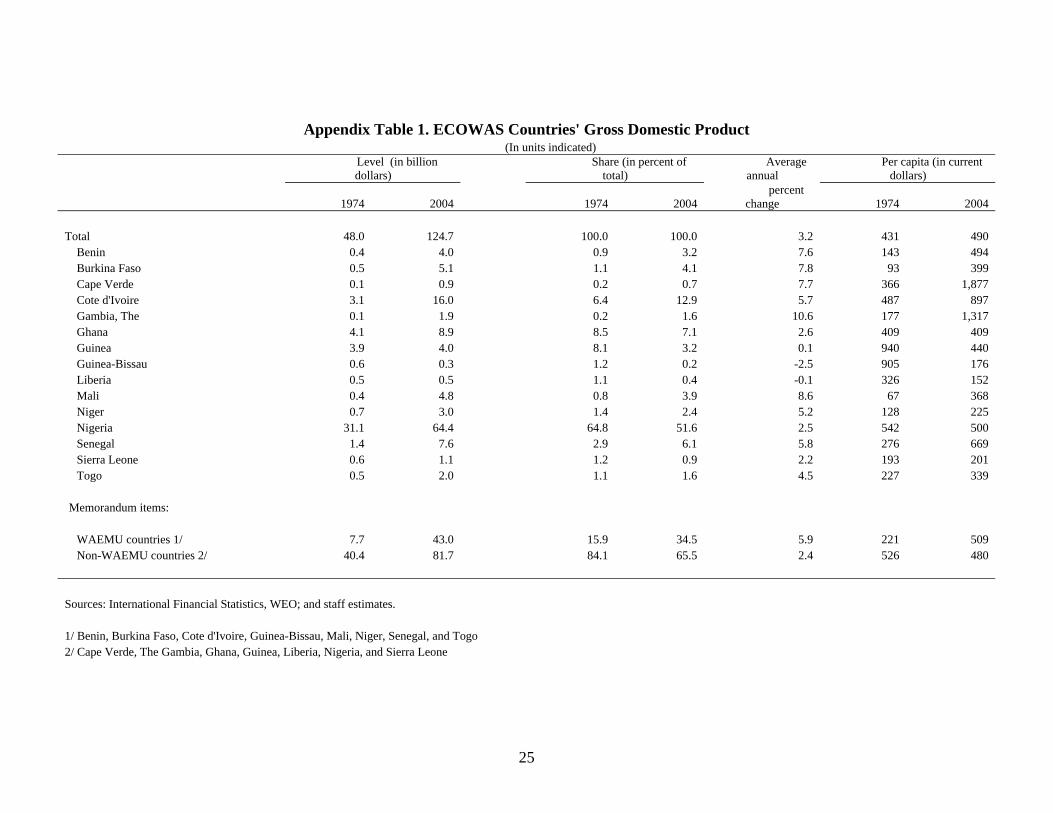
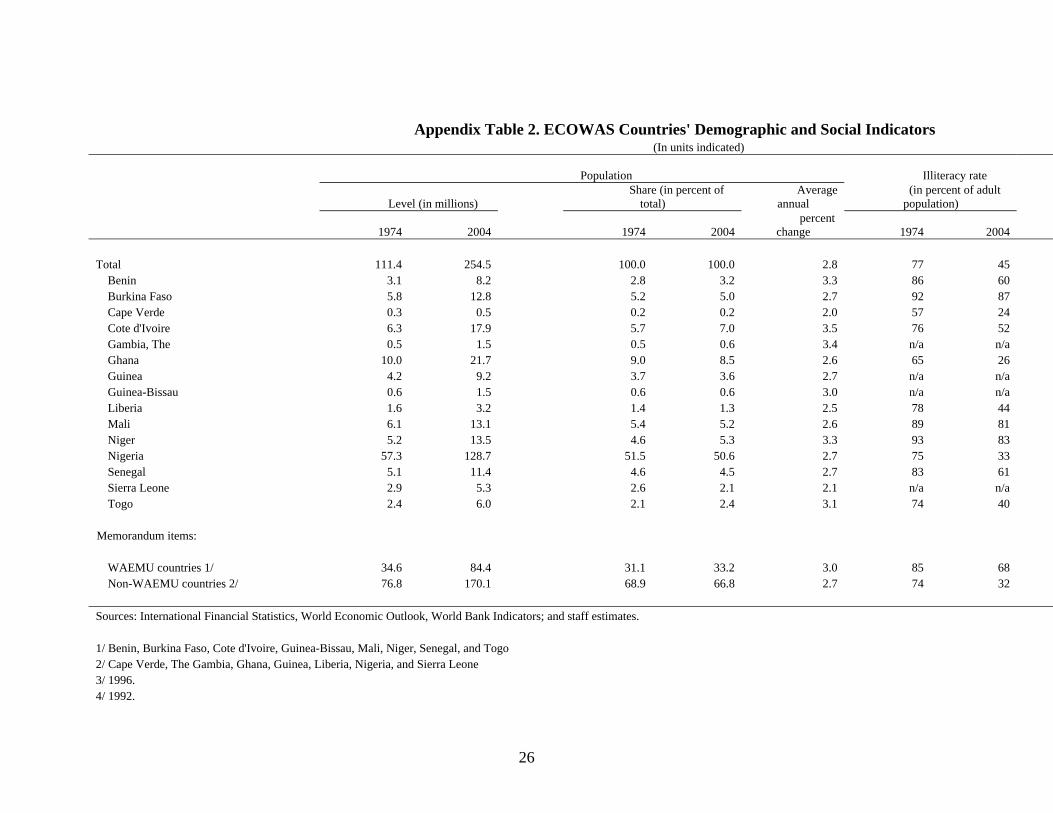
Over the years ECOWAS’ membership has remained very stable with only one new country joining (Cape Verde in 1977) and one withdrawing (Mauritania in 2002). The current membership includes the following 15 countries: Benin, Burkina Faso, Cape Verde, Cote d’Ivoire, The Gambia, Ghana, Guinea, Guinea-Bissau, Liberia, Mali, Niger, Nigeria, Senegal, Sierra Leone, and Togo. The population in ECOWAS is more than 250 million, but its combined economy is only US$125 billion (Appendix Tables 1 and 2). Over the 1974-2004 period, the ECOWAS economy grew 3.2 percent annually (in nominal dollar terms), just slightly ahead of the 2.8 percent annual increase in population. Reflecting the poor economic performance, progress in achieving better social outcomes has also been limited.
One should bear in mind that Nigerians constitute half of ECOWAS’ combined population and that ECOWAS-wide averages are dominated by developments in Nigeria. Against the background of stagnant oil production, the Nigerian economy has trailed economic developments elsewhere in the region and the share of the Nigerian economy in the total ECOWAS economy fell from two-thirds in 1974 to one half in 2004.5 In contrast, vigorous economic growth in Benin, Burkina Faso, Cape Verde, Ghana, Mali and Senegal was significantly higher than in other ECOWAS countries.
5 The Nigerian share in 2004 would have been even smaller had it not been for relatively high oil prices in that year. In 2004—with crude oil production of 2.5 million barrels per day at an average export price ofUS$38 per barrel—the share of oil/gas GDP in total GDP was close to 50 percent. In 1974—with crude oil production of 2.3 million barrels per day at an average export price of US$15 per barrel—the share of oil/gas GDP in total GDP was less than 40 percent.
4
Progress towards regional integration was initially slow and uneven, but renewed momentum was provided by enactment of a revised ECOWAS treaty in July 1993. The revised treaty clarified the community’s economic objectives (establishment of a common market and a single currency) and facilitated the establishment of community-wide bodies such as a parliament, a social council, and court of justice. The 1993 treaty also formally assigned the Community the responsibility of preventing and solving regional conflicts. ECOWAS has pursued a two-pronged integration agenda with broader political objectives being pursued in parallel with those relating to economic integration much along the lines of the European integration model. Arguably, ECOWAS has had greater results on the political front with well-developed mechanisms for peace-keeping and conflict prevention and resolution standing out as notable achievements. With regard to economic integration, results have been slower in coming. An ECOWAS protocol on free movements of persons, the right of residence and establishment was agreed as early as in 1979, but compliance with the protocol’s provisions is spotty.6 Free trade is also very limited in practice.
In 1994 a subgroup of seven member countries—Benin, Burkina Faso, Cote d’Ivoire, Mali, Niger, Senegal, and Togo—established the West African Economic and Monetary Union (WAEMU), which Guinea-Bissau joined in 1997. Already sharing a common currency—the CFA franc—with a regional central bank located in Dakar, Senegal these countries recognized that they could pursue sub-regional integration at a somewhat faster clip than what could be expected for the broader ECOWAS membership. By 1999 the WAEMU countries had adopted a regional pact of convergence, stability, growth, and solidarity aimed at strengthening economic performance through deeper regional integration and in 2000, a customs union was created with the elimination of tariffs on intra-WAEMU trade and establishment of a common external tariff (CET) on imports from outside the WAEMU area.
With WAEMU countries already sharing a common currency, monetary cooperation among non-WAEMU countries (with the exception of Cape Verde and Liberia) takes place within the so-called Second Monetary Zone where the aim is to establish a common non-WAEMU currency that is then subsequently merged with WAEMU’s CFA franc. As monetary unification requires macroeconomic stability, members of the Second Monetary Zone have committed to comply, inter alia, with various fiscal rules and limits on price and exchange rate volatility. In this area compliance has also remained spotty, and the timeline for introducing the common currency has been pushed back on several occasions (the last postponement shifted introduction of the common currency back from 2005 to December 2009).
Establishment of a free trade area in goods among ECOWAS countries has been pursued within the framework of the ECOWAS Trade Liberalization Scheme (ETLS). The ETLS breaks trade in goods into three categories: (1) unprocessed goods, (2) traditional handicraft products, and (3) industrial goods.7 The ETLS provided for the immediate and full liberalization of
6 For instance, so far only Benin and Senegal have issued ECOWAS passports. 7 The TLP defines unprocessed goods as goods in Harmonized System (HS) chapters 1, 2, 4, 6-8,10, 13, 39, 40, 46, and 57, and parts of chapters 3, 9, 11, 12, 15, 18, 22, 24, 25, 26, 27, 31, 41, 44, 53, and 55. Traditional handicraft
(continued…)
5
unprocessed and handicraft products, whereas industrial products were to have been gradually liberalized over the 1990–2000 period. In the event, implementing fully the TLP has proven elusive, but in 2003 ECOWAS adopted new rules of origin and a single customs declaration form, and simplified control procedures with a view towards reinvigorating the TLP (ECOWAS, 2004). The main problem with the ECOWAS free trade area is trade in industrial goods, where approval has to be sought on a product-by-product and enterprise-by-enterprise basis. Although intra-ECOWAS trade in goods is still subject to many tariff and non-tariff restrictions (both official and unofficial), trade barriers are coming down and efforts are ongoing to make further progress towards achieving a unified internal market within ECOWAS.
The region’s modest economic progress to date is also reflected in its export performance, where ECOWAS’ share of world exports now amounts to just 0.5 percent, down from 1.7 percent in the mid-1970s (Appendix Table 3). However, the share of intra-ECOWAS exports in total exports has tripled to 9 percent by 2004 from just 3 percent prior to the establishment of the ECOWAS. While this development does provide evidence of a deepening of commercial relations among member countries, trade relations deepened faster vis-à-vis other African countries (a quadrupling from 1 to 4 percent) and the increase in intra-ECOWAS trade may not have been the result of the political quest for regional economic collaboration, but rather of technological or other developments favoring trade. As expected, the closer economic integration (including monetary union) within the WAEMU has resulted in a higher level of regional trade for ECOWAS countries that are also members of WAEMU. In fact, the difference between WAEMU and non-WAEMU member countries in that regard is striking. In 2004, 14 percent of WAEMU countries’ exports were destined to other WAEMU countries and an additional 10 percent destined to non-WAEMU ECOWAS partners. In contrast, only 5 percent of non-WAEMU countries’ exports were sold within ECOWAS.8
The landlocked nature and small economic size of most West African countries suggest the need for close regional collaboration on trade policy,9 and ECOWAS provides an appropriate institutional setting in that regard. The markedly better economic performance in the subset of countries (WAEMU) that have pursued a more ambitious regional integration points to the benefits that can accrue as ECOWAS moves towards establishing an integrated regional market. The establishment of a customs union by 2008 is a key stepping stone in that process, and it is important that the timetable be adhered to regardless of whether the EPA negotiations will be successfully completed at the same time.
products are defined as goods in HS chapter 58 and parts of chapters 41-44, 55, 62, 64-67, 69, 74, 82, 83, 92, 93, and 95–98. Remaining product categories are classified as industrial goods. 8 Trade in crude oil and products derived from crude oil accounts for about half of all intra-ECOWAS trade, but oil trade plays a very limited role in trade among WAEMU countries and therefore does not explain the relative success of this agreement. 9 One possible exception may be Cape Verde where its geographical location, state of development, and structure of production may suggest a free trade regime would yield greater benefits.
6
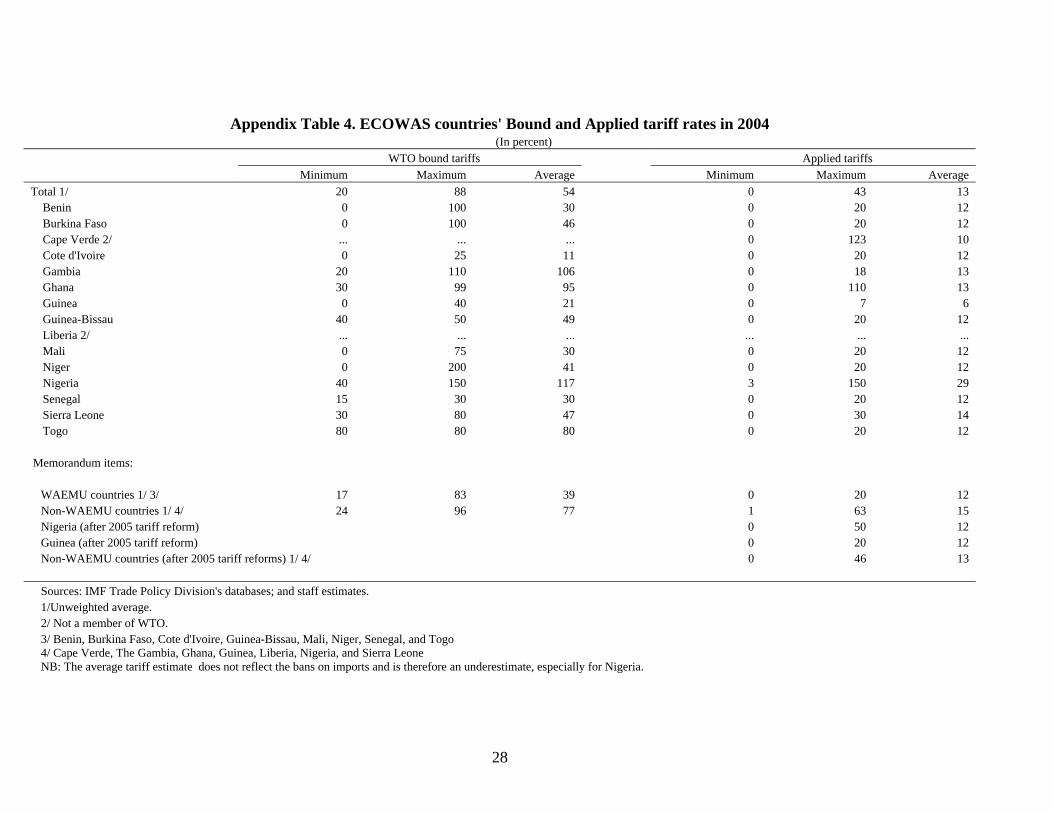
Besides establishment of an integrated internal market for goods and services free of tariffs and non-tariff barriers, the ECOWAS customs union project also requires its member countries to agree on a CET to be applied to imports from outside ECOWAS. In that latter regard, significant progress has already been made. It has been agreed to model ECOWAS’ CET on WAEMU’s CET that uses a four-band system of tariffs of 0, 5, 10, and 20 percent with an average unweighted tariff rate of 12 percent. In recent years tariff reforms in non-WAEMU countries have aimed at harmonizing tariff rates with those prevailing in the WAEMU (Appendix Table 4). Until recently, Guinea and Nigeria were major outliers with a level of tariff protection of less than half (Guinea) or more than twice (Nigeria) that of other ECOWAS countries, but with major tariff reforms in these two countries in 2005 all ECOWAS countries have now broadly similar levels of tariff protection.10
III. THE ROAD TO ESTABLISHING THE ECOWAS CUSTOMS UNION
The establishment of the ECOWAS customs union is a multi-stage process, where the member countries first have to align their tariff schedules with each other, following which they eliminate remaining duties on intra-ECOWAS trade.
The Nigerian 2005 tariff reform
In a major break with past policies, Nigeria, in October 2005 liberalized its import regime. With this first major tariff reform in a decade, the level and dispersion of import tariff protection has fallen significantly.1 The new tariff schedule reduces the number of tariff bands from 19 to 5, lowers average tariffs from 29 percent to 12 percent, and lowers maximum tariffs from 150 percent to 50 percent.
The new tariff schedule is broadly in line with ECOWAS’ proposed common external tariff in that it clusters most tariffs in four bands of 0, 5, 10, and 20 percent with raw materials and intermediate products attracting lower tariffs and consumer goods attracting higher tariffs. An additional 50 percent tariff band has been introduced in order to provide selected items with additional protection for a transitional period. Products in the 50 percent band include rice, vegetable oils, sugar, tobacco, various plastics and steel products, vehicles, and selected electrical appliances. Agricultural tariffs have been lowered significantly more than other tariffs, but agriculture remains the most sheltered sector with average tariff protection in agriculture about 50 percent higher than that in industry (Table 1).
10 With the possible exception of Liberia, for which no information is available.
7
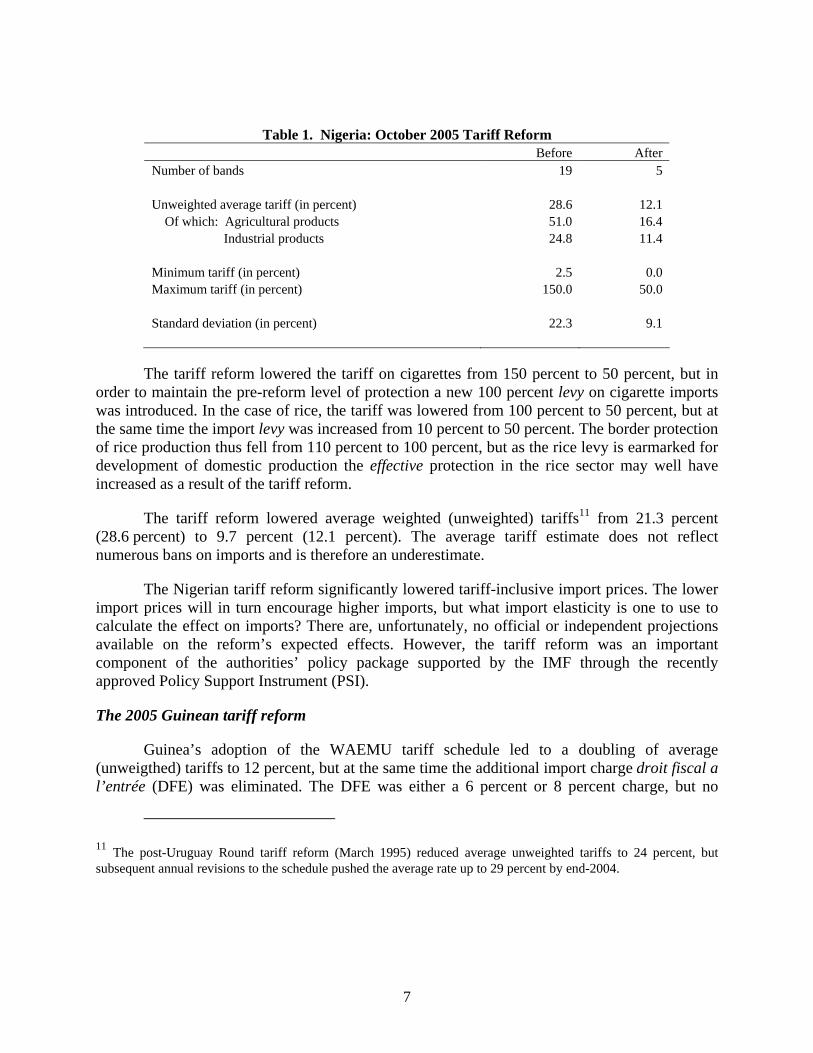
Table 1. Nigeria: October 2005 Tariff Reform
Before After Number of bands 19 5 Unweighted average tariff (in percent) 28.6 12.1
Of which: Agricultural products 51.0 16.4 Industrial products 24.8 11.4
Minimum tariff (in percent) 2.5 0.0 Maximum tariff (in percent) 150.0 50.0 Standard deviation (in percent) 22.3 9.1
The tariff reform lowered the tariff on cigarettes from 150 percent to 50 percent, but in order to maintain the pre-reform level of protection a new 100 percent levy on cigarette imports was introduced. In the case of rice, the tariff was lowered from 100 percent to 50 percent, but at the same time the import levy was increased from 10 percent to 50 percent. The border protection of rice production thus fell from 110 percent to 100 percent, but as the rice levy is earmarked for development of domestic production the effective protection in the rice sector may well have increased as a result of the tariff reform.
The tariff reform lowered average weighted (unweighted) tariffs11 from 21.3 percent (28.6 percent) to 9.7 percent (12.1 percent). The average tariff estimate does not reflect numerous bans on imports and is therefore an underestimate.
The Nigerian tariff reform significantly lowered tariff-inclusive import prices. The lower import prices will in turn encourage higher imports, but what import elasticity is one to use to calculate the effect on imports? There are, unfortunately, no official or independent projections available on the reform’s expected effects. However, the tariff reform was an important component of the authorities’ policy package supported by the IMF through the recently approved Policy Support Instrument (PSI).
The 2005 Guinean tariff reform
Guinea’s adoption of the WAEMU tariff schedule led to a doubling of average (unweigthed) tariffs to 12 percent, but at the same time the additional import charge droit fiscal a l’entrée (DFE) was eliminated. The DFE was either a 6 percent or 8 percent charge, but no
11 The post-Uruguay Round tariff reform (March 1995) reduced average unweighted tariffs to 24 percent, but subsequent annual revisions to the schedule pushed the average rate up to 29 percent by end-2004.
8
information is available on its distribution across tariff lines. However, according to the WTO, the simple average of all tariffs and other duties and charges fell by 1.7 percentage points to 14.9 percent as a result of the tariff reform.12 This decrease in total protection would be consistent with an average DFE of 7.1 percent. It is therefore assumed that a uniform DFA of 7.1 percent was abolished together with the adoption of the higher tariff schedule. It is assumed that the 1 percent decrease in average import prices has no appreciable effect on import levels, resulting in a nine percent decrease in import-related revenues.13
Adoption of the WAEMU CET
With Nigeria’s and Guinea’s 2005 tariff reforms the process of aligning the non-WAEMU countries’ tariff schedules with those of WAEMU is almost complete. For most countries, fully adopting the WAEMU tariff schedule will therefore not lead to any further impact on aggregate non-oil imports or associated tariff revenues.
IV. THE PARAMETERS OF AN ECOWAS—EU ECONOMIC PARTNERSHIP AGREEMENT
The prospective ECOWAS-EU EPA does not have to include a complete and symmetric liberalization of all trade in order for the agreement to be considered WTO-consistent as WTO-consistent PTAs only need to cover “substantially all trade” (GATT: Article XXIV). What “substantial” means in practice is open for interpretation,and practice varies. For example, in The Trade, Development and Co-operation Agreement between the EU and South Africa the EU provides duty-free access to virtually all imports from South Africa, which in return provides duty-free access for an estimated 86 percent of imports from the EU.
Furthermore, implementation can take place over a “reasonable length of time” (GATT: Article XXIV). Here again it is open for interpretation what is to be considered “reasonable.” For example, the EU-South Africa agreement is being implemented over a twelve year period, as is a similar agreement between the EU and Tunisia. Neither of these agreements (nor any others) have been challenged in the WTO on these interpretations. Given that the EPA is slated to go into effect in 2008 and that the umbrella Cotonou Agreement runs through 2020, one may expect that the EPA will provide for a gradual implementation schedule over the 2008–20 period.
12 “Trade Policy Review: Guinea,” WTO, December 2005, page 32. 13 The assumption of zero import price elasticity is inferred from the macroeconomic framework used in the IMF staff-monitored program, which incorporates a decrease in nominal dollar non-oil imports from 2004 to 2006 (“Guinea—Staff Report for the 2005 Article IV Consultation and Staff-Monitored Program,” EBS/05/169, December 5, 2005). However, in that program, the lower import taxes are expected to be associated with an increase in import-related fiscal revenues owing to improved policy effort (¶25 in EBS/05/169).
9
V. ESTIMATES OF EPA TRADE AND FISCAL REVENUE EFFECTS: METHODOLOGY AND LITERATURE
There is an abundant literature analyzing the potential impact of regional trade agreements, of which an EPA is one example. Recent studies have analyzed the likely implications of EPA implementation for ECOWAS or Sub-Saharan Africa from various perspectives, in particular the opportunities and challenges from a development perspective (United Nations Economic Commission for Africa, 2004; Hinkle and Schiff, 2004; Hinkle and Newfarmer, 2005), the trade and budget effects using a partial equilibrium model and/or a general equilibrium model (CAPE, 2002; Busse et al., 2004; UNECA, 2004), and the dynamic gains using a general equilibrium model (UNECA, 2004).
While a general equilibrium model would be desirable to adequately capture the interactions between sectors and elasticities of substitutions, and to simulate dynamic effects in EPA, data availability and practical experience have induced many economists to use the partial equilibrium model as a second-best option.14
Much of the earlier analysis of the effects of trade agreements relies on Viner’s (1950) discussion of trade creation and trade diversion (Robinson et al., 2003). A partial equilibrium model can help estimate trade creation, trade diversion, and welfare effects, as well as fiscal revenue implications of trade policy changes.
We assess the likely impact of EPA tariff changes on trade and the subsequent fiscal revenue changes, using a partial equilibrium model developed by Verdoorn, (1960), following Busse, Borrmann and Grossmann (2004). It is an import demand function which has also been used in previous studies with some variations (Testa, 1997; Laird and Yeats, 1986; UN- ECA, 2004; Koranchelian, 2006).
Verdoorn’s model, which is described in the Annex, is based on the normal assumptions of partial equilibrium analysis. Also, it is assumed that goods imported from different countries are imperfect substitutes ( “the Armington assumption”) and that the supply response to the price reduction, as a result of tariff reduction or elimination, will allow the EU producers and exporters to meet any demand arising in the importing countries as a result of price reduction. That is, EU export supplies are perfectly elastic.
Trade creation captures the trade expanding aspects of liberalization that leads to the displacement of inefficient producers in a given preferential trading area. It is assumed that there is full transmission of price changes when tariff or non-tariff distortions are reduced or eliminated (Laird and Yeats, 1986; Ben Hammouda et al., 2004). That is, the domestic price of goods imported would change with the change in an ad valorem tariff. However, the price might
14 In some cases, a general equilibrium analysis can be usefully complemented with a partial equilibrium analysis as in the UN 2004 study on EU-ECOWAS EPA.
10
not fall as much as the tariff if markets are not very competitive, a common occurrence in small African states.
Trade diversion as opposed to trade creation occurs when imports are diverted away from more efficient producers in non-preferred countries and toward less efficient producers in the free trade area. In the case of EU-ECOWAS, trade diversion would occur if as a result of the implementation of EPA (which implies free trade) more efficient suppliers from Non-EU trading partners into ECOWAS are displaced by inefficient producers from the EU.
The estimate of the fiscal revenue effect of EPA using a partial equilibrium model is simple. The potential change in tariff revenue is equal to the sum of a reduction in tariff revenue collected on imports from the EU, which are facing a lower tariff (zero tariff rate under the EPA), and the loss of tariff revenue due to the substitution of EU imports (for which lower tariff are applied) for non EU imports and domestically— produced goods.
Since a large share of ECOWAS imports originates in the EU and trade revenue constitutes a significant proportion of total revenue, there are concerns that the elimination of customs duties on most EU products in the context of the EPA could lead to a significant decline in government revenue (UNECA, 2004) and add an additional challenge to fiscal management. For nearly all ECOWAS countries, the EU is the single largest trading block. The share of the EU in total imports for each country of the region varies from about 29 percent for Niger to about 74 percent for Cape Verde. Duties on imports from the EU represent 10 to 15 percent of government revenue in Burkina Faso, Ivory Coast, Guinea Bissau, Nigeria and Senegal; 15 to 20 percent in Benin, Ghana, Guinea and Mali; 25 to 30 percent in Cape Verde, the Gambia, Niger and Sierra Leone, and more than 30 percent in Togo.
A study by CAPE15 (2002), commissioned by the WAEMU Commission, finds that, in the case of a complete trade liberalization vis-à-vis the EU, the members of UEMOA could encounter a decline in fiscal revenue ranging from US$3.2 million (1.6 percentof GDP) in Guinea Bissau to US$ 140.6 million (0.5 percent of GDP) in Ivory Coast.
Busse, Borrmann and Grossmann (2004) also examined the (trade and) fiscal revenue effects of EPA on ECOWAS countries, using a partial equilibrium model. They find that, apart from the impact on trade flows, the tariff elimination will lead to a decline in import duties and, hence, total government revenue. Their decline in fiscal revenue ranges from 0.71 percent of GDP in Burkina Faso to 4.1 percent of GDP in Cape Verde for the mean scenario16. The projected decline in fiscal revenue is 1.2 percent of GDP for Nigeria, 1.8 percent of GDP for Ghana and 1.9 percent of GDP for Senegal.
Using a CGE model for Nigeria, Adenikinju and Alaba (2005) find that a zero tariff on EU imports (as envisaged under the EPA) will lead to a decline in government revenue by 1
15 Cellule d’Analyse de Politique Economique, a research institute based in Benin. 16 Using a price elasticity of 0.7 and elasticity of substitution of 2.
11
percent (0.4 percent of GDP17), which includes a second round effect of the EPA, compared with 2.5 percent (1.2 percent of GDP) in Busse et al.’s study (2004), which is based on the normal assumptions of partial equilibrium analysis.
Our analysis focuses on the following four countries of ECOWAS: Nigeria, the single largest economy in the sub-region as well as the largest trading partner with the EU; Ghana, with the lowest tariff collection rate and a projected impact on government revenue exceeding 10 percent according to previous studies; Senegal, with the highest tariff collection rate and a similarly significant impact on government revenue; and Cape Verde, with the highest impact as a share of government revenue.
As outlined above, the implementation of the EPA could lead to a decline in tariff revenue through two channels. First, the (direct) revenue loss as a zero tariff rate will be applied to imports from countries in the free trade area (EU); second, the (indirect) revenue loss arising from displacement of third country (non–EU) imports by countries in the free trade area (EU), following a tariff-induced reduction of prices.
We assume complete trade liberalization at the initial stage of the EPA, as in previous studies, which is consistent with the short term perspective of a partial equilibrium model. Therefore, our results are likely to be upper limits of the estimates of the possible static and budget effects. We examine the impact of EPA implementation on trade and fiscal revenue under different assumptions regarding import demand and trade substitution elasticities, to test the results for sensitivity to underlying assumptions following Busse, Borrmann and Grossmann (2004).
The base year for all estimations is 2004. Aggregate fiscal customs revenue data have been obtained from various IMF staff reports or directly from IMF desk officers.
Finally, we assume that the EPA will be implemented under the current non- uniform external tariff in each ECOWAS member country. However, ECOWAS could well apply a common external tariff (CET) to imports before the implementation of EPA, if Nigeria carries out the implentation of its tariff reform in line with the ECOWAS CET and Ivory Coast recovers rapidly from the ongoing conflict. Under the assumption of a custom union18 in ECOWAS, the EPA trade and tariff revenue effects of the EPA could be re-assessed, using an expanded partial equilibrium model (Appendix 1).
17 Our calculations, to ensure comparability with other studies’ results. 18 USAID (through ECOtrade Project) supported national impact studies of the ECOWAS CET in six countries. Studies were completed in 2004 for four countries: Gambia, Guinea, Nigeria and Sierra Leone, in collaboration with the ECOWAS Executive Secretariat, World Bank and other donors. It should be noted that many obstacles still impede effective implementation of free trade: absence of clear directives from national authorities in most member States; rules of origins; and other non-tariffs barriers, reflecting limited political commitment, a non-operational dispute settlement mechanism (community court of justice is not functional), inadequate compensation mechanism and limited capacity of regional institution to monitor and evaluate progress on the ground in each Member State (World Bank, 2004).
12
VI. EMPIRICAL RESULTS
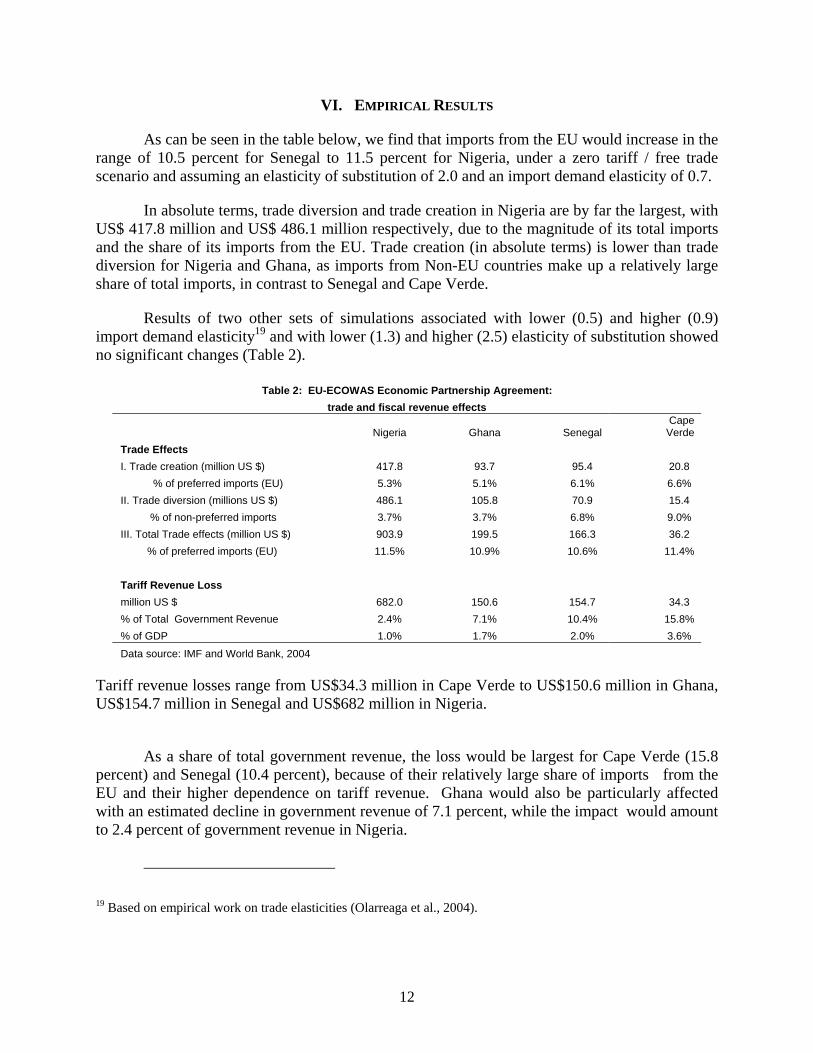
As can be seen in the table below, we find that imports from the EU would increase in the range of 10.5 percent for Senegal to 11.5 percent for Nigeria, under a zero tariff / free trade scenario and assuming an elasticity of substitution of 2.0 and an import demand elasticity of 0.7.
In absolute terms, trade diversion and trade creation in Nigeria are by far the largest, with US$ 417.8 million and US$ 486.1 million respectively, due to the magnitude of its total imports and the share of its imports from the EU. Trade creation (in absolute terms) is lower than trade diversion for Nigeria and Ghana, as imports from Non-EU countries make up a relatively large share of total imports, in contrast to Senegal and Cape Verde.
Results of two other sets of simulations associated with lower (0.5) and higher (0.9) import demand elasticity19 and with lower (1.3) and higher (2.5) elasticity of substitution showed no significant changes (Table 2).
Table 2: EU-ECOWAS Economic Partnership Agreement: trade and fiscal revenue effects
Nigeria Ghana Senegal Cape
Verde Trade Effects I. Trade creation (million US $) 417.8 93.7 95.4 20.8 % of preferred imports (EU) 5.3% 5.1% 6.1% 6.6% II. Trade diversion (millions US $) 486.1 105.8 70.9 15.4 % of non-preferred imports 3.7% 3.7% 6.8% 9.0% III. Total Trade effects (million US $) 903.9 199.5 166.3 36.2 % of preferred imports (EU) 11.5% 10.9% 10.6% 11.4% Tariff Revenue Loss million US $ 682.0 150.6 154.7 34.3 % of Total Government Revenue 2.4% 7.1% 10.4% 15.8% % of GDP 1.0% 1.7% 2.0% 3.6%
Data source: IMF and World Bank, 2004
Tariff revenue losses range from US$34.3 million in Cape Verde to US$150.6 million in Ghana, US$154.7 million in Senegal and US$682 million in Nigeria.
As a share of total government revenue, the loss would be largest for Cape Verde (15.8
percent) and Senegal (10.4 percent), because of their relatively large share of imports from the EU and their higher dependence on tariff revenue. Ghana would also be particularly affected with an estimated decline in government revenue of 7.1 percent, while the impact would amount to 2.4 percent of government revenue in Nigeria.
19 Based on empirical work on trade elasticities (Olarreaga et al., 2004).
13
As a share of GDP, tariff revenue losses amount to 1.0 percent of GDP in Nigeria,1.7 percent in Ghana, 2 percent in Senegal and 3.6 percent in Cape Verde.
The EPA’s impact on total fiscal revenue is lower for Ghana and Cape Verde in our study, compared with Busse, Borrmann and Grossman’s20 2004 study which is based on 2001 data, because of differences in collected (applied) tariff rate, trade flow data (e.g. share of imports from EU) and total government revenue.21.
In percent of GDP, the figures are similar to those of Busse et al. (1.0–2.0 percent of GDP) for Nigeria, Ghana and Senegal, in contrast to Cape Verde where the impact is lower by 0.5 percentage points of GDP in our study.
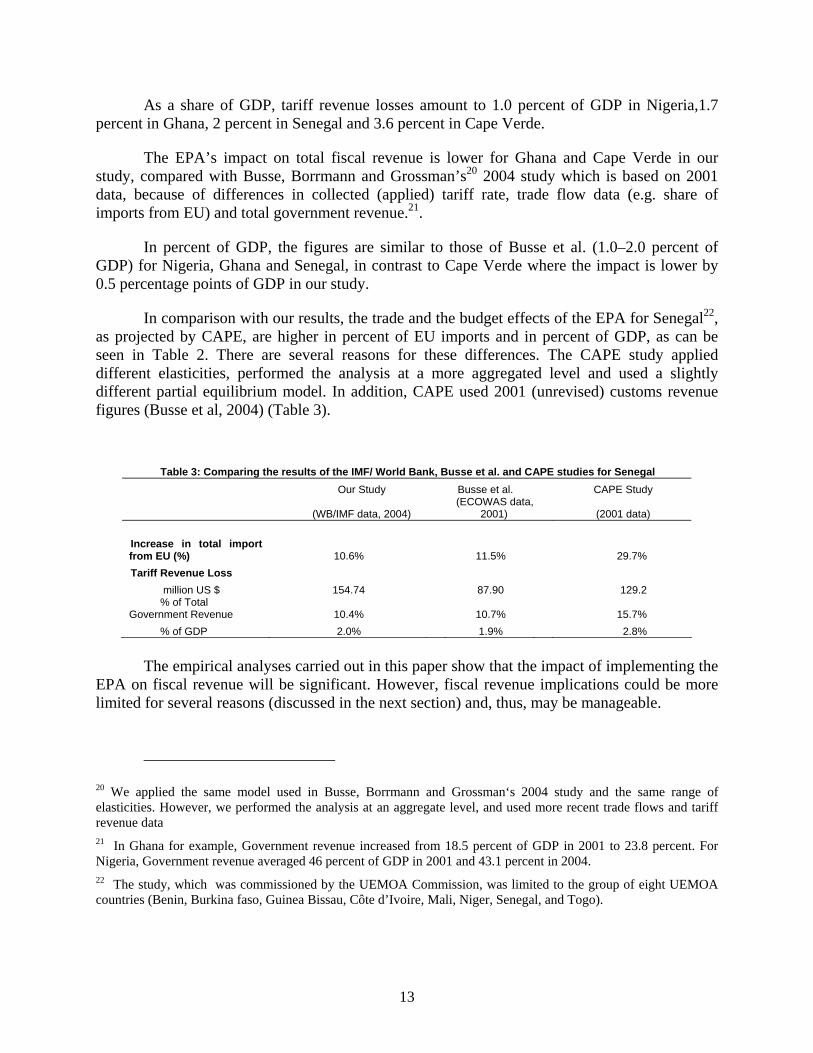
In comparison with our results, the trade and the budget effects of the EPA for Senegal22, as projected by CAPE, are higher in percent of EU imports and in percent of GDP, as can be seen in Table 2. There are several reasons for these differences. The CAPE study applied different elasticities, performed the analysis at a more aggregated level and used a slightly different partial equilibrium model. In addition, CAPE used 2001 (unrevised) customs revenue figures (Busse et al, 2004) (Table 3).
Table 3: Comparing the results of the IMF/ World Bank, Busse et al. and CAPE studies for Senegal Our Study Busse et al. CAPE Study
(WB/IMF data, 2004) (ECOWAS data,
2001) (2001 data)
Increase in total import from EU (%) 10.6% 11.5% 29.7% Tariff Revenue Loss million US $ 154.74 87.90 129.2 % of Total Government Revenue 10.4% 10.7% 15.7% % of GDP 2.0% 1.9% 2.8%
The empirical analyses carried out in this paper show that the impact of implementing the
EPA on fiscal revenue will be significant. However, fiscal revenue implications could be more limited for several reasons (discussed in the next section) and, thus, may be manageable.
20 We applied the same model used in Busse, Borrmann and Grossman‘s 2004 study and the same range of elasticities. However, we performed the analysis at an aggregate level, and used more recent trade flows and tariff revenue data 21 In Ghana for example, Government revenue increased from 18.5 percent of GDP in 2001 to 23.8 percent. For Nigeria, Government revenue averaged 46 percent of GDP in 2001 and 43.1 percent in 2004. 22 The study, which was commissioned by the UEMOA Commission, was limited to the group of eight UEMOA countries (Benin, Burkina faso, Guinea Bissau, Côte d’Ivoire, Mali, Niger, Senegal, and Togo).
14
VII. MITIGATING THE REVENUE IMPACT OF INTEGRATION
The likelihood of product exclusions
First, using a partial equilibrium model, we assumed the abolishment of all tariffs on EU-originating imports at the initial stage of the EPA. As discussed above, one should bear in mind that WTO consistency does not necessarily imply the complete and symmetric liberalization of all trade under the EPA. Certain products that may be sensitive from a fiscal or other perspective could be excluded from the agreement. As a result, the revenue loss would be lower than our estimates.
The length of the implementation period
Second, our estimates report the ultimate effect of a fully phased-in EPA. However, tariff elimination is most likely to take place gradually over 10 years or more, from January 2008 (UNECA, 2004; Busse et al., 2004, Hinkle and Newfarmer, 2005) under the EPA timetable. Therefore, countries would have considerable time to introduce compensatory measures.
Reform of exemptions regimes
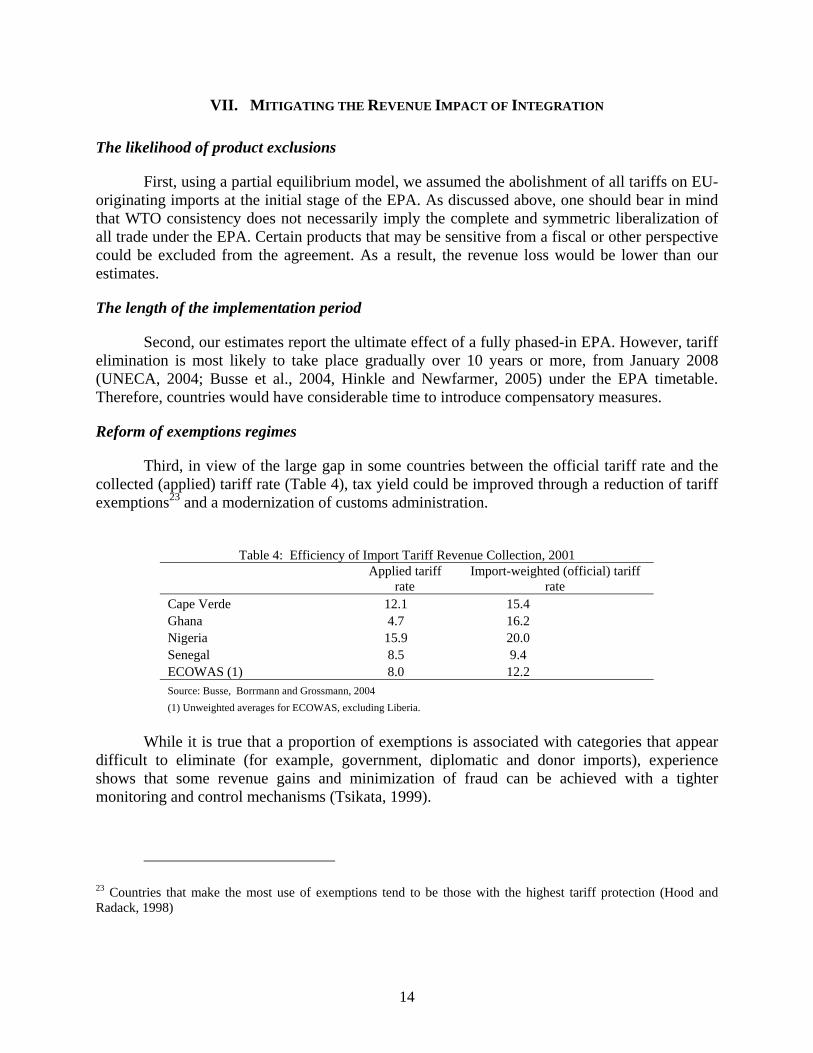
Third, in view of the large gap in some countries between the official tariff rate and the collected (applied) tariff rate (Table 4), tax yield could be improved through a reduction of tariff exemptions23 and a modernization of customs administration.
Table 4: Efficiency of Import Tariff Revenue Collection, 2001
Applied tariff
rate Import-weighted (official) tariff
rate Cape Verde 12.1 15.4 Ghana 4.7 16.2 Nigeria 15.9 20.0 Senegal 8.5 9.4 ECOWAS (1) 8.0 12.2 Source: Busse, Borrmann and Grossmann, 2004 (1) Unweighted averages for ECOWAS, excluding Liberia.
While it is true that a proportion of exemptions is associated with categories that appear
difficult to eliminate (for example, government, diplomatic and donor imports), experience shows that some revenue gains and minimization of fraud can be achieved with a tighter monitoring and control mechanisms (Tsikata, 1999).
23 Countries that make the most use of exemptions tend to be those with the highest tariff protection (Hood and Radack, 1998)
15
Domestic tax reform
Fourth, to alleviate the fiscal effects of the EPA, countries could implement domestic tax reforms, in particular the VAT, with a view to increasing tax yield. Countries that have already implemented a VAT (for example Ghana, Cape Verde, Senegal and other WAEMU countries), and have little scope for increasing the revenues from it, could consider strengthening other components of their tax and revenue systems (Hinkle and Newfarmer, 2005; Doe, 2006). There are precedents for successful replacement of tariff revenue losses even in weak administrative environments.
Trade-induced growth
Fifth, our estimates of the impact of the EPA on government revenue excluded growth effects. Potential higher economic growth rates from the full implementation of the EPA would lead to an increase in imports from EU and non-EU countries, and generate additional tariff and domestic tax revenues. This revenue-enhancing effect of trade-induced growth could be captured in the analysis.
Compensatory mechanisms
Finally, since the EPA studies show large country-by-country differences in fiscal revenue loss, ECOWAS could make more operational its compensatory mechanism among ECOWAS members to redistribute gains and losses in the context of the EPA, building on the experience of WAEMU countries which established in 1999 a mechanism for compensations for tariff revenue losses suffered because of the elimination of customs duties on intra-WAEMU trade24.
VIII. CONCLUDING REMARKS
The first three decades of ECOWAS’ existence was a turbulent political period for most of its members as stagnant economic output left social aspirations unfulfilled. In these trying circumstances, it was difficult to maintain meaningful momentum towards regional integration with the lack of regional integration in turn failing to provide much support to member countries’ economic development. After many false starts over the years, the ECOWAS member countries are currently engaged in an ambitious push towards significantly deeper integration.
24 The WAEMU commission (the administrative body of the Union) collected 85 billion CFA (130 million Euros) over 2001-2003 period, using a community solidarity tax of 1 percent, which is levied on all taxable imports. Compensation for shortfall of customs revenues only concerned the import of industrial products originating from WAEMU and was conditioned on the effective and full implementation of the common external tariff, certified by the Commission. 61 percent of the proceeds from PCS went for the compensation fund, 25 percent to the budget of the WAEMU Commission and 14 percent were used to finance the cost of eliminating regional disparities (Coulibaly, 2004).
16
The empirical analyses carried out in this paper show that the impact of implementing EPA on fiscal revenue for selected ECOWAS countries will be significant. We find that imports from the EU would increase in the range of 10.5 percent for Senegal to 11.5 percent for Nigeria, under a zero tariff / free trade scenario. As a share of total government revenue, revenue loss would be largest for Cape Verde (15.8 percent) and Senegal (10.4 percent), because of their relatively large share of imports from the EU and their higher dependence on tariff revenue. Ghana would also be significantly affected with an estimated decline in government revenue of 7.1 percent, while the impact would amount to only 2.4 percent of government revenue in Nigeria. As a share of GDP, tariff revenue losses amount to 1.0 percent of GDP in Nigeria, 1.7 percent in Ghana, 2.0 percent in Senegal and 3.6 percent in Cape Verde.
However, the fiscal revenue losses may be manageable because of several mitigating factors, in particular the likelihood of product exclusions, the length of the EPA implementation period, the scope for reform of exemptions regimes, domestic tax reform, and the revenue-enhancing effect of trade-induced growth. Consideration might also be given to compensatory mechanisms.
17
IX. REFERENCES
Adenikinju, Adeola and Olumuyiwa Alaba, 2005: “EU-ACP Economic Partnership Agreements: Implication for Trade and Development in West Africa,” TPRTP, University of Ibadan, Nigeria.
Busse, Mathias, Axel Borrmann, and Harold Grossman, 2004. “The Impact of ACP/EU Economic Partnership Agreements on ECOWAS Countries: An Empirical Analysis of Trade and Budget Effects.” HWWA–Hamburg Institute of International Economics, Hamburg, July.
Doe, Lubin, 2006: “Reforming External Tariffs in Central and Western African countries,” Working Paper WP/06/12, IMF.
__________, 2006: “Harmonization of Domestic Consumption Taxes in Central and Western African Countries,” Working Paper WP/06/8, IMF
Ebrill L., Stotsky J, and Gropp Reint, 1999: “Revenue Implications of Trade Liberalization,” IMF.
Hinkle, Lawrence and Richard Newfarmer, 2005: “Risks and Rewards of Regional Trading Arrangements in Africa: Economic Partnership Agreements (EPAs) Between the EU and SSA,” Mimeo, World Bank, 2005.
IMF, 1998: “Trade Reform and Regional Integration in Africa.”
____, 1998: “Impact of EMU on Selected Non-European Union Countries.”
Koranchelian, Taline, 2006: “The Association Agreement between Algeria and the European Union: Economic Implications and Challenges,” IMF.
Massa, Coulibaly 2004: “WAEMU Experiences,” ECOWAS.
Newfarmer, Richard, Lawrence Hinkle and Mombert Hoppe, 2005: “Beyong Cotonou:
Economic Partnership Agreements in Africa,” in Trade, Doha, and Development: A Window into the Issues World Bank, Washington DC.
Olarreaga M., Kee H. L, and Nicita, Alessandro, 2004: “Import Demand Elasticities and Trade Distortions,” World Bank Policy Research Working Paper.
Pritchett, Lant and Geeta Sethi, 1993: “Tariff Rates, Tariff Revenue, and Tariff Reform: Some New Facts,” World Bank Policy Research Paper, 1143.
Robinson, Sherman, Jeffrey Lewis, and Karen Thierfelder: “Free Trade Agreements and the SADC Economies”, Journal of African Economies, Volume 12, Number 2, PP 156–206
Stephens, Christopher and Kennan, Jane, 2005: “EU-ACP Economic Partnership Agreements: The Effects of Reciprocity,” Institute of Development Studies, Sussex.
18
Tsikata, Yvonne, 1999: “Southern Africa: Trade, Liberalization and Implications for a Free Trade Area,” TIPS 1999 Annual Forum.
United Nations Economic Commission for Africa (UNECA), 2004: “Economic Welfare impact of the EU–Africa Economic Partnership Agreements”, Mimeo.
Verdoorn, Petrus, 1960: The Intra-Bloc Trade of Benelux, in E.A.G. Robinson (ed.), The
Economic Consequences of the Size of Nations, New York: Macmillan, pp. 291–329.
Viner, Jacob,1950: The Customs Union Issue, New York: Carnegie Endowment for International Peace.
World Bank, 2001: “The Regional Integration Assistance Strategy for West Africa.”
World Trade Organization, 2005: “Trade Policy Review for Guinea,” Geneva, December.
Zouhon-bi, Gouri Simplice, 1998: “Impact of WAEMU Trade Liberalization on Government Revenue and Manufacturing Sector: Evidence from Mali.” Unpublished paper, IMF, Washington, DC.
19
APPENDIX I: VERDOORN’S MODEL
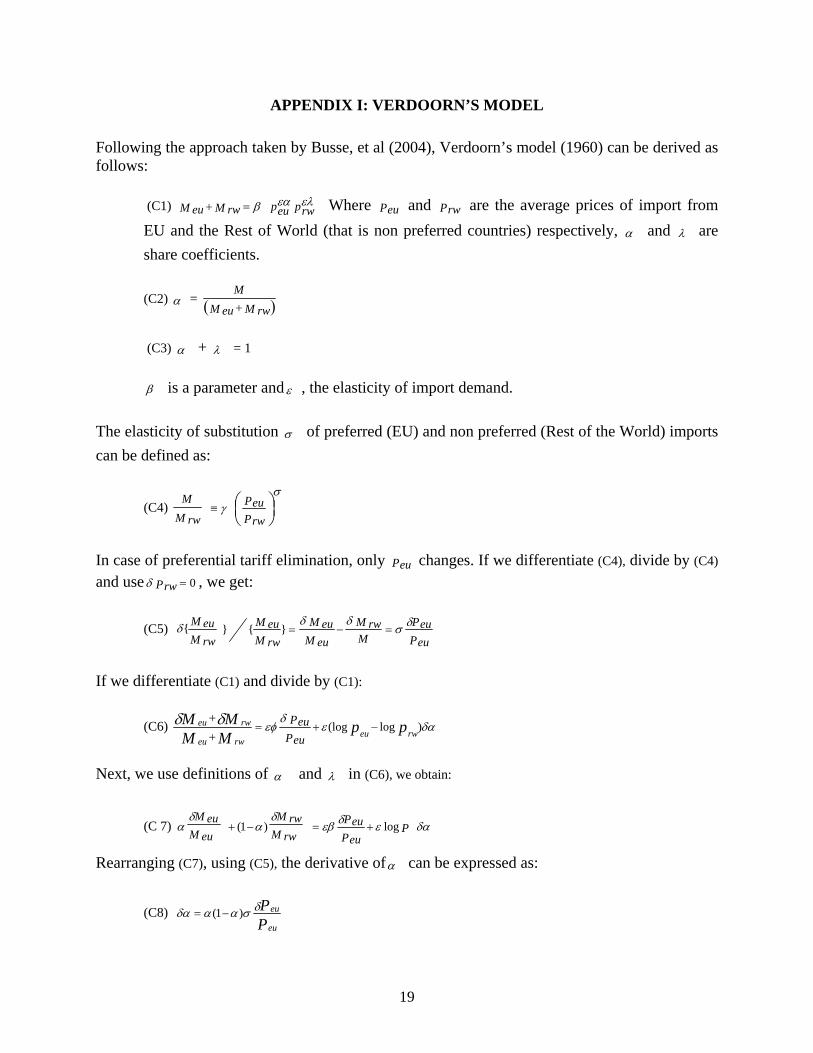
Following the approach taken by Busse, et al (2004), Verdoorn’s model (1960) can be derived as follows:
(C1) prwpeuM rwM euελεαβ=+ Where Peu and Prw are the average prices of import from
EU and the Rest of World (that is non preferred countries) respectively, α and λ are share coefficients. (C2) α = ( )M rwM eu
M+
(C3) α + λ = 1
β is a parameter and ε , the elasticity of import demand.
The elasticity of substitution σ of preferred (EU) and non preferred (Rest of the World) imports can be defined as:
(C4) ⎟⎠⎞⎜
⎝⎛≡
Prw
PeuM rw
M σγ
In case of preferential tariff elimination, only Peu changes. If we differentiate (C4), divide by (C4) and use 0=Prwδ , we get:
(C5) Peu
PeuMM rw
M eu
M euM rw
M euM rw
M eu δσδδδ =−=}{}{
If we differentiate (C1) and divide by (C1):
(C6) δαεδ
εφδδ )log(log ppMMMM
rweurweu
rweu
Peu
Peu −+=+
+
Next, we use definitions of α and λ in (C6), we obtain:
(C 7) δαεδεβδ
αδ
α PPeu
PeuM rw
M rwM eu
M eulog)1( +=−+
Rearranging (C7), using (C5), the derivative ofα can be expressed as:
(C8) PP
eu
euδσααδα )1( −=
20
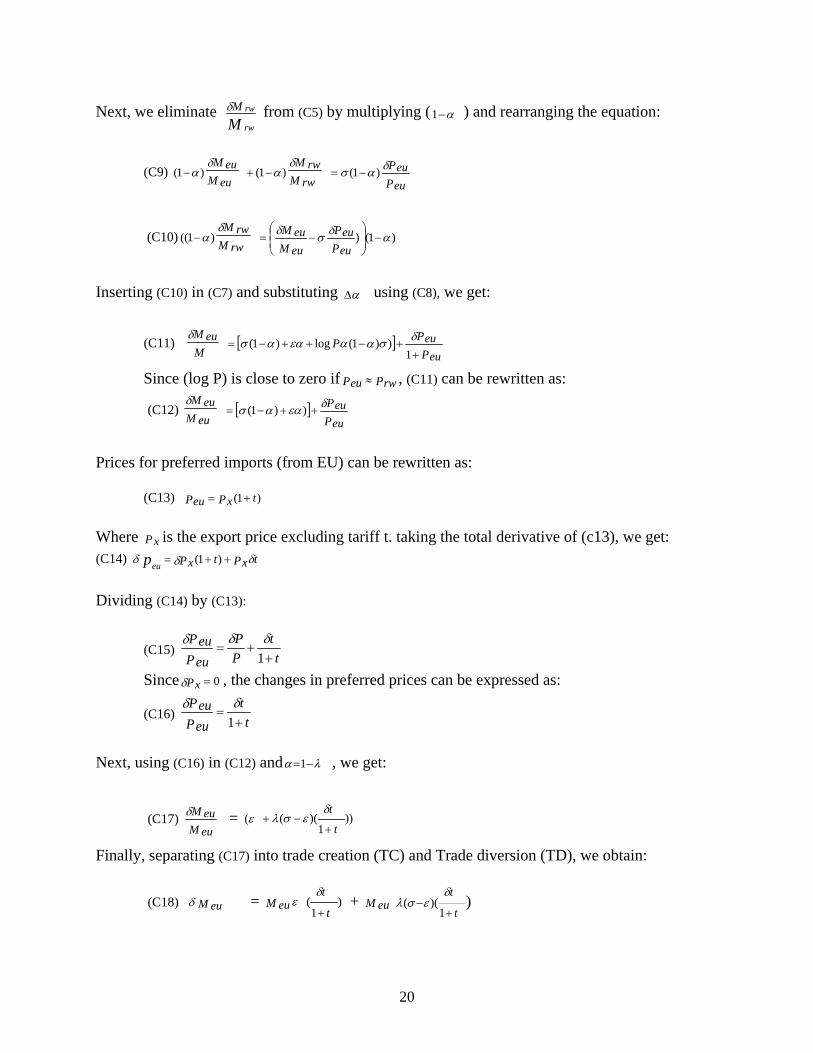
Next, we eliminate M rw
rwMδ from (C5) by multiplying ( α−1 ) and rearranging the equation:
(C9) Peu
PeuM rw
M rwM eu
M eu δασδ
αδ
α )1()1()1( −=−+−
(C10) )1())1(( αδσδδα −⎟
⎟⎠
⎞⎜⎜⎝
⎛−=−
Peu
PeuM eu
M euM rw
M rw
Inserting (C10) in (C7) and substituting αΔ using (C8), we get:
(C11) [ ]Peu
PeuPMM eu
++−++−=
1))1(log)1( δσααεαασ
δ
Since (log P) is close to zero if PrwPeu ≈ , (C11) can be rewritten as:
(C12) [ ]Peu
PeuM eu
M eu δεαασδ
++−= ))1(
Prices for preferred imports (from EU) can be rewritten as:
(C13) )1( tPxPeu += Where Px is the export price excluding tariff t. taking the total derivative of (c13), we get: (C14) tPxtPxpeu δδδ ++= )1( Dividing (C14) by (C13):
(C15) tt
PP
Peu
Peu+
+=1δδδ
Since 0=Pxδ , the changes in preferred prices can be expressed as:
(C16) tt
Peu
Peu+
=1δδ
Next, using (C16) in (C12) and λα −=1 , we get:
(C17) M eu
M euδ = ))1
)(((t
t
+−+
δεσλε
Finally, separating (C17) into trade creation (TC) and Trade diversion (TD), we obtain:
(C18) M euδ = )1
(t
tM eu
+
δε + )
1)((
t
tM eu
+−
δεσλ
21
This total change in EU import, Qeuδ , is the sum of trade creation (TC) and trade diversion (TD). Trade creation is the change in imports from EU due to lower prices following the reduction of tariff; trade diversion is the substitution of EU imports for non EU imports and domestically produced goods due to preferential tariff.
(C19) TC = )1
(t
tM eu
+
δε
(C20) TD = )1
)((t
tM eu
+−
δεσλ
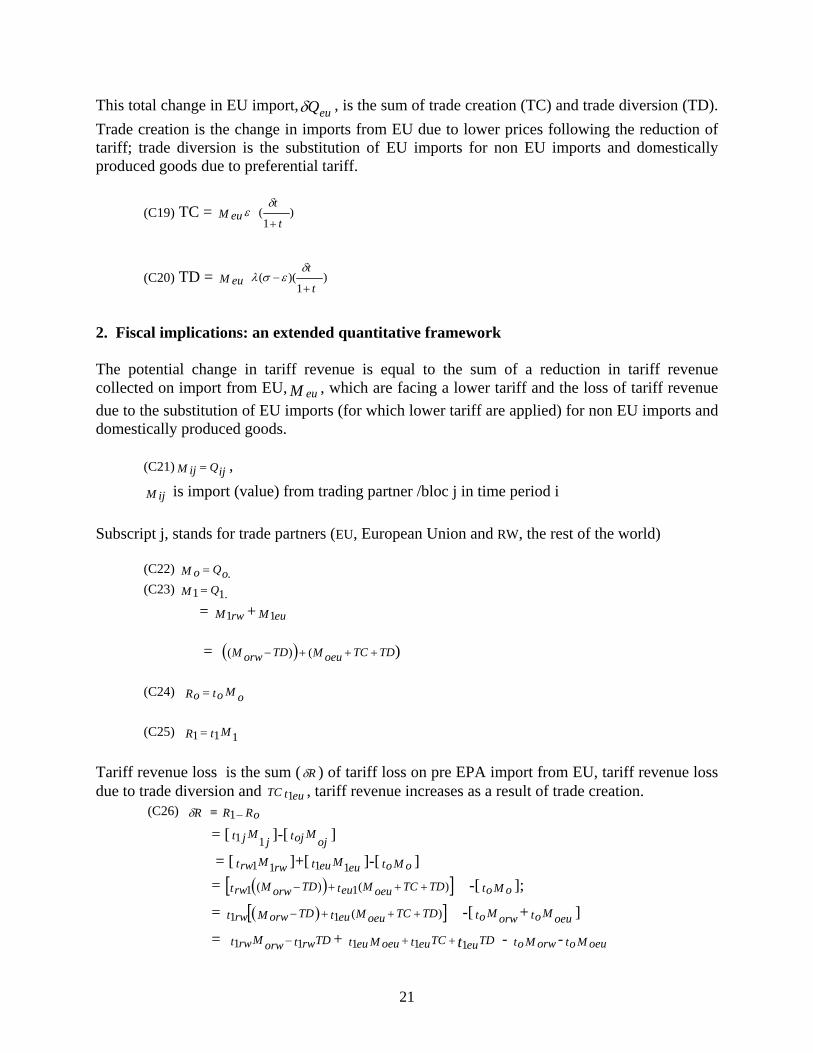
2. Fiscal implications: an extended quantitative framework The potential change in tariff revenue is equal to the sum of a reduction in tariff revenue collected on import from EU, M eu , which are facing a lower tariff and the loss of tariff revenue due to the substitution of EU imports (for which lower tariff are applied) for non EU imports and domestically produced goods.
(C21) QijM ij = ,
M ij is import (value) from trading partner /bloc j in time period i Subscript j, stands for trade partners (EU, European Union and RW, the rest of the world)
(C22) QoM o .= (C23) QM .11 = = M rw1 + M eu1 = ( ) )()( TDTCM oeuTDM orw +++−
(C24) Mto oRo = (C25) MtR 1 11 =
Tariff revenue loss is the sum ( Rδ ) of tariff loss on pre EPA import from EU, tariff revenue loss due to trade diversion and t euTC 1 , tariff revenue increases as a result of trade creation.
(C26) ≡Rδ RoR −1 = [ Mt j j1 1 ]-[ Mtoj oj ]
= [ Mtrw rw1 1 ]+[ Mt eu eu1 1 ]-[ M oto ] = ( )[ ])(1)(1 TDTCM oeuteuTDM orwtrw +++− -[ M oto ];
= ( )[ ])(11 TDTCM oeut euTDM orwt rw +++− -[ Mto orw + Mto oeu ]
= TDt rwMt rw orw 11 − + TDeuTCt euM oeut eu t111 ++ - M orwto - M oeuto
22
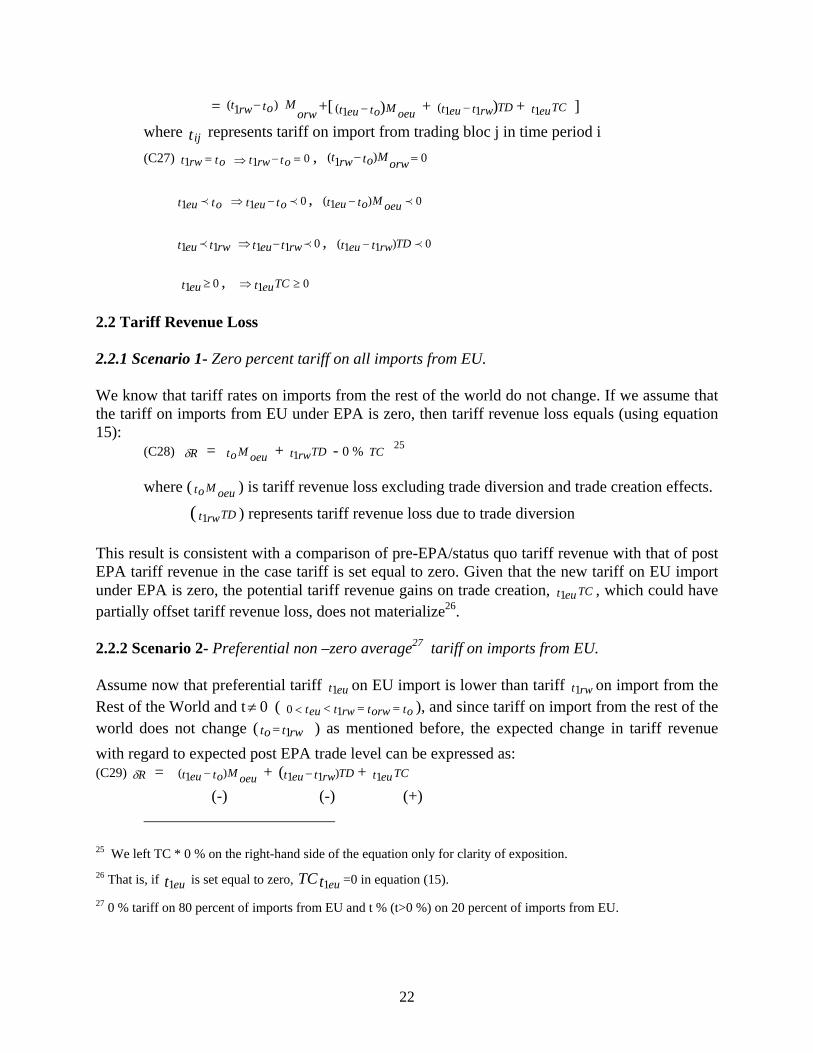
= Mtot rw orw)( 1 − +[ Mtot eu oeu)1( − + TDt rwt eu )11( − + TCt eu1 ]
where tij represents tariff on import from trading bloc j in time period i (C27) tot rw =1 01 =−⇒ tot rw , 0)( 1 =− Mtot rw orw tot eu p1 01 ptot eu −⇒ , 0)1( pMtot eu oeu− t rwt eu 11 p 011 pt rwt eu−⇒ , 0)11( pTDt rwt eu − 01 ≥t eu , 01 ≥⇒ TCt eu
2.2 Tariff Revenue Loss 2.2.1 Scenario 1- Zero percent tariff on all imports from EU. We know that tariff rates on imports from the rest of the world do not change. If we assume that the tariff on imports from EU under EPA is zero, then tariff revenue loss equals (using equation 15):
(C28) Rδ = Mto oeu + TDt rw1 - 0 % TC 25
where ( Mto oeu ) is tariff revenue loss excluding trade diversion and trade creation effects.
( TDt rw1 ) represents tariff revenue loss due to trade diversion
This result is consistent with a comparison of pre-EPA/status quo tariff revenue with that of post EPA tariff revenue in the case tariff is set equal to zero. Given that the new tariff on EU import under EPA is zero, the potential tariff revenue gains on trade creation, TCt eu1 , which could have partially offset tariff revenue loss, does not materialize26. 2.2.2 Scenario 2- Preferential non –zero average27 tariff on imports from EU. Assume now that preferential tariff t eu1 on EU import is lower than tariff t rw1 on import from the Rest of the World and t 0≠ ( totorwt rwteu ==<< 10 ), and since tariff on import from the rest of the world does not change ( t rwto 1= ) as mentioned before, the expected change in tariff revenue with regard to expected post EPA trade level can be expressed as: (C29) Rδ = Mtot eu oeu)1( − + TDt rwt eu )11( − + TCt eu1 (-) (-) (+)
25 We left TC * 0 % on the right-hand side of the equation only for clarity of exposition. 26 That is, if t eu1 is set equal to zero, tTC eu1 =0 in equation (15).
27 0 % tariff on 80 percent of imports from EU and t % (t>0 %) on 20 percent of imports from EU.
23
where:
Mtot eu oeu)1( − represents tariff revenue loss on pre EPA import from EU TDt rwt eu )11( − , tariff revenue loss due to trade diversion and TCt eu1 , tariff revenue increases as a result of trade creation.
For the empirical estimation of expected changes in tariff revenue, t stands for tariff (excluding any other charges applicable to imports) collected as percentage of c.i.f. value of imports by products. Comparing to statutory (official) rate, it highlights in particular the coverage of import exemptions and the performance of customs administration.
-------
24
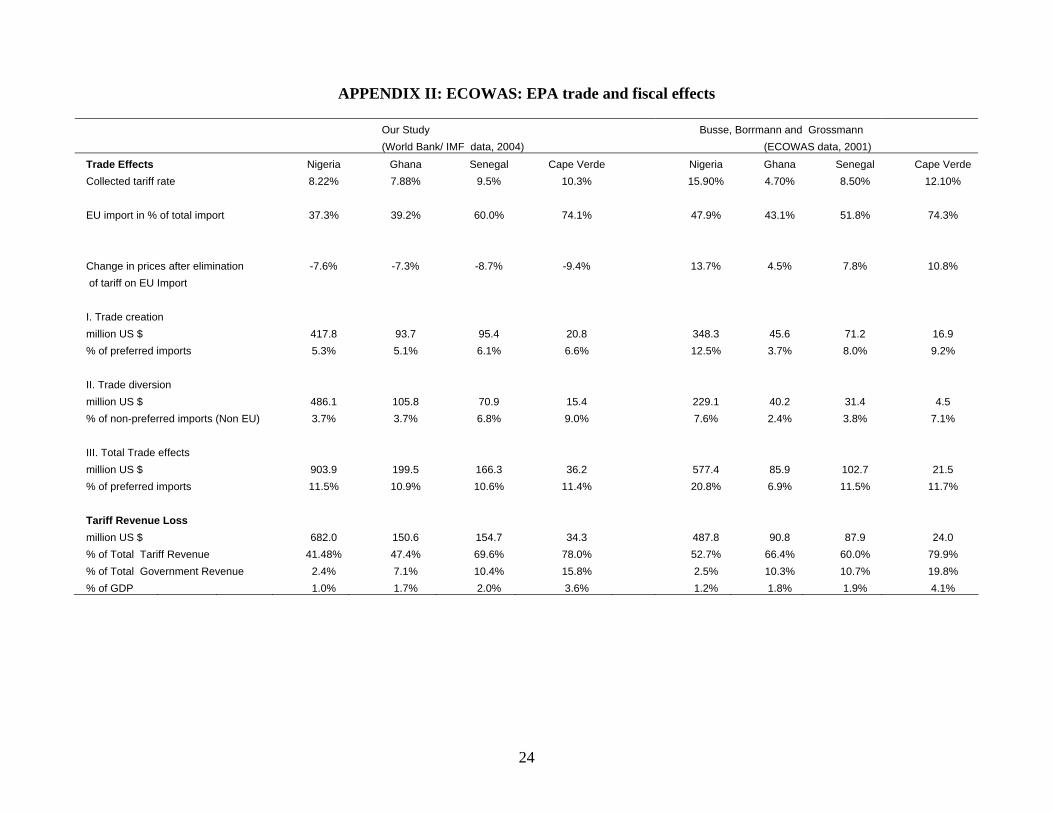
APPENDIX II: ECOWAS: EPA trade and fiscal effects
Our Study Busse, Borrmann and Grossmann (World Bank/ IMF data, 2004) (ECOWAS data, 2001)
Trade Effects Nigeria Ghana Senegal Cape Verde Nigeria Ghana Senegal Cape Verde Collected tariff rate 8.22% 7.88% 9.5% 10.3% 15.90% 4.70% 8.50% 12.10% EU import in % of total import 37.3% 39.2% 60.0% 74.1% 47.9% 43.1% 51.8% 74.3% Change in prices after elimination -7.6% -7.3% -8.7% -9.4% 13.7% 4.5% 7.8% 10.8% of tariff on EU Import I. Trade creation million US $ 417.8 93.7 95.4 20.8 348.3 45.6 71.2 16.9 % of preferred imports 5.3% 5.1% 6.1% 6.6% 12.5% 3.7% 8.0% 9.2% II. Trade diversion million US $ 486.1 105.8 70.9 15.4 229.1 40.2 31.4 4.5 % of non-preferred imports (Non EU) 3.7% 3.7% 6.8% 9.0% 7.6% 2.4% 3.8% 7.1% III. Total Trade effects million US $ 903.9 199.5 166.3 36.2 577.4 85.9 102.7 21.5 % of preferred imports 11.5% 10.9% 10.6% 11.4% 20.8% 6.9% 11.5% 11.7% Tariff Revenue Loss million US $ 682.0 150.6 154.7 34.3 487.8 90.8 87.9 24.0 % of Total Tariff Revenue 41.48% 47.4% 69.6% 78.0% 52.7% 66.4% 60.0% 79.9% % of Total Government Revenue 2.4% 7.1% 10.4% 15.8% 2.5% 10.3% 10.7% 19.8% % of GDP 1.0% 1.7% 2.0% 3.6% 1.2% 1.8% 1.9% 4.1%
25
Appendix Table 1. ECOWAS Countries' Gross Domestic Product (In units indicated)
Level (in billion dollars)
Share (in percent of total)
Average annual
Per capita (in current dollars)
1974 2004 1974 2004 percent
change 1974 2004
Total 48.0 124.7 100.0 100.0 3.2 431 490 Benin 0.4 4.0 0.9 3.2 7.6 143 494 Burkina Faso 0.5 5.1 1.1 4.1 7.8 93 399 Cape Verde 0.1 0.9 0.2 0.7 7.7 366 1,877 Cote d'Ivoire 3.1 16.0 6.4 12.9 5.7 487 897 Gambia, The 0.1 1.9 0.2 1.6 10.6 177 1,317 Ghana 4.1 8.9 8.5 7.1 2.6 409 409 Guinea 3.9 4.0 8.1 3.2 0.1 940 440 Guinea-Bissau 0.6 0.3 1.2 0.2 -2.5 905 176 Liberia 0.5 0.5 1.1 0.4 -0.1 326 152 Mali 0.4 4.8 0.8 3.9 8.6 67 368 Niger 0.7 3.0 1.4 2.4 5.2 128 225 Nigeria 31.1 64.4 64.8 51.6 2.5 542 500 Senegal 1.4 7.6 2.9 6.1 5.8 276 669 Sierra Leone 0.6 1.1 1.2 0.9 2.2 193 201 Togo 0.5 2.0 1.1 1.6 4.5 227 339
Memorandum items:
WAEMU countries 1/ 7.7 43.0 15.9 34.5 5.9 221 509 Non-WAEMU countries 2/ 40.4 81.7 84.1 65.5 2.4 526 480
Sources: International Financial Statistics, WEO; and staff estimates. 1/ Benin, Burkina Faso, Cote d'Ivoire, Guinea-Bissau, Mali, Niger, Senegal, and Togo 2/ Cape Verde, The Gambia, Ghana, Guinea, Liberia, Nigeria, and Sierra Leone
26
Appendix Table 2. ECOWAS Countries' Demographic and Social Indicators (In units indicated)
Population Illiteracy rate
Level (in millions) Share (in percent of
total) Average
annual (in percent of adult
population)
1974 2004 1974 2004 percent
change 1974 2004
Total 111.4 254.5 100.0 100.0 2.8 77 45 Benin 3.1 8.2 2.8 3.2 3.3 86 60 Burkina Faso 5.8 12.8 5.2 5.0 2.7 92 87 Cape Verde 0.3 0.5 0.2 0.2 2.0 57 24 Cote d'Ivoire 6.3 17.9 5.7 7.0 3.5 76 52 Gambia, The 0.5 1.5 0.5 0.6 3.4 n/a n/a Ghana 10.0 21.7 9.0 8.5 2.6 65 26 Guinea 4.2 9.2 3.7 3.6 2.7 n/a n/a Guinea-Bissau 0.6 1.5 0.6 0.6 3.0 n/a n/a Liberia 1.6 3.2 1.4 1.3 2.5 78 44 Mali 6.1 13.1 5.4 5.2 2.6 89 81 Niger 5.2 13.5 4.6 5.3 3.3 93 83 Nigeria 57.3 128.7 51.5 50.6 2.7 75 33 Senegal 5.1 11.4 4.6 4.5 2.7 83 61 Sierra Leone 2.9 5.3 2.6 2.1 2.1 n/a n/a Togo 2.4 6.0 2.1 2.4 3.1 74 40
Memorandum items:
WAEMU countries 1/ 34.6 84.4 31.1 33.2 3.0 85 68 Non-WAEMU countries 2/ 76.8 170.1 68.9 66.8 2.7 74 32
Sources: International Financial Statistics, World Economic Outlook, World Bank Indicators; and staff estimates. 1/ Benin, Burkina Faso, Cote d'Ivoire, Guinea-Bissau, Mali, Niger, Senegal, and Togo 2/ Cape Verde, The Gambia, Ghana, Guinea, Liberia, Nigeria, and Sierra Leone 3/ 1996. 4/ 1992.
27
Appendix Table 3. ECOWAS Countries' Merchandise Exports (In units indicated)
Level (in million dollars) Share (in percent of total) Average annual Direction of Exports in 1974 (in percent) 1/
1974 2004 1974 2004 percent change ECOWAS Other Africa ROW
Total 12,630 46,991 100.0 100.0 4.5 3.1 0.9 96.0 Benin 34 349 0.3 0.7 8.1 19.9 1.0 79.0 Burkina Faso 36 371 0.3 0.8 8.0 47.2 0.2 52.7 Cape Verde 2 21 0.0 0.0 8.3 6.7 20.0 73.3 Cote d'Ivoire 1,213 6,545 9.6 13.9 5.8 9.4 3.9 86.7 Gambia 39 37 0.3 0.1 -0.2 1.7 0.0 98.3 Ghana 729 2,268 5.8 4.8 3.9 0.7 0.5 98.7 Guinea 112 560 0.9 1.2 5.5 0.1 7.8 92.1 Guinea-Bissau 3 115 0.0 0.2 13.1 1.4 1.9 96.7 Liberia 400 959 3.2 2.0 3.0 0.9 0.3 98.9 Mali 64 327 0.5 0.7 5.6 32.1 3.9 64.0 Niger 53 222 0.4 0.5 4.9 33.4 0.3 66.3 Nigeria 9,219 33,209 73.0 70.7 4.4 1.8 0.2 98.1 Senegal 391 1,269 3.1 2.7 4.0 10.3 7.2 82.5 Sierra Leone 146 185 1.2 0.4 0.8 2.0 0.0 98.0 Togo 188 554 1.5 1.2 3.7 2.3 0.3 97.4
Memorandum items:
WAEMU countries 2/ 1,982 9,752 15.7 20.8 5.5 11.1 4.0 84.8 Non-WAEMU countries 3/ 10,648 37,239 84.3 79.2 4.3 1.6 0.3 98.1
World exports 746,464 9,113,
972 … … 8.7 1.7 3.3 95.0 Sources: IMF Direction of Trade Statistics, World Economic Outlook database; and staff estimates. 1/ For Cape Verde and Guinea 1976 and 1981 respectively. 2/ Benin, Burkina Faso, Cote d'Ivoire, Guinea-Bissau, Mali, Niger, Senegal, and Togo 3/ Cape Verde, The Gambia, Ghana, Guinea, Liberia, Nigeria, and Sierra Leone
28
Appendix Table 4. ECOWAS countries' Bound and Applied tariff rates in 2004
(In percent) WTO bound tariffs Applied tariffs Minimum Maximum Average Minimum Maximum Average
Total 1/ 20 88 54 0 43 13 Benin 0 100 30 0 20 12 Burkina Faso 0 100 46 0 20 12 Cape Verde 2/ ... ... ... 0 123 10 Cote d'Ivoire 0 25 11 0 20 12 Gambia 20 110 106 0 18 13 Ghana 30 99 95 0 110 13 Guinea 0 40 21 0 7 6 Guinea-Bissau 40 50 49 0 20 12 Liberia 2/ ... ... ... ... ... ... Mali 0 75 30 0 20 12 Niger 0 200 41 0 20 12 Nigeria 40 150 117 3 150 29 Senegal 15 30 30 0 20 12 Sierra Leone 30 80 47 0 30 14 Togo 80 80 80 0 20 12
Memorandum items: WAEMU countries 1/ 3/ 17 83 39 0 20 12 Non-WAEMU countries 1/ 4/ 24 96 77 1 63 15 Nigeria (after 2005 tariff reform) 0 50 12 Guinea (after 2005 tariff reform) 0 20 12 Non-WAEMU countries (after 2005 tariff reforms) 1/ 4/ 0 46 13 Sources: IMF Trade Policy Division's databases; and staff estimates. 1/Unweighted average. 2/ Not a member of WTO. 3/ Benin, Burkina Faso, Cote d'Ivoire, Guinea-Bissau, Mali, Niger, Senegal, and Togo 4/ Cape Verde, The Gambia, Ghana, Guinea, Liberia, Nigeria, and Sierra Leone NB: The average tariff estimate does not reflect the bans on imports and is therefore an underestimate, especially for Nigeria.
29
AFRICA REGION WORKING PAPER SERIES Series # Title Date Author
ARWPS 1 Progress in Public Expenditure Management in Africa: Evidence from World Bank Surveys
January 1999 C. Kostopoulos
ARWPS 2 Toward Inclusive and Sustainable Development in the Democratic Republic of the Congo
March 1999 Markus Kostner
ARWPS 3 Business Taxation in a Low-Revenue Economy: A Study on Uganda in Comparison with Neighboring Countries
June 1999 Ritva Reinikka Duanjie Chen
ARWPS 4 Pensions and Social Security in Sub-Saharan Africa: Issues and Options
October 1999 Luca Barbone Luis-A. Sanchez B.
ARWPS 5 Forest Taxes, Government Revenues and the Sustainable Exploitation of Tropical Forests
January 2000 Luca Barbone Juan Zalduendo
ARWPS 6 The Cost of Doing Business: Firms’ Experience with Corruption in Uganda
June 2000 Jacob Svensson
ARWPS 7 On the Recent Trade Performance of Sub-Saharan African Countries: Cause for Hope or More of the Same
August 2000 Francis Ng and Alexander J. Yeats
ARWPS 8 Foreign Direct Investment in Africa: Old Tales and New Evidence
November 2000 Miria Pigato
ARWPS 9 The Macro Implications of HIV/AIDS in South Africa: A Preliminary Assessment
November 2000 Channing Arndt Jeffrey D. Lewis
ARWPS 10 Revisiting Growth and Convergence: Is Africa Catching Up?
December 2000 C. G. Tsangarides
ARWPS 11 Spending on Safety Nets for the Poor: How Much, for How Many? The Case of Malawi
January 2001 William J. Smith
ARWPS 12 Tourism in Africa February 2001 Iain T. Christie D. E. Crompton
ARWPS 13 Conflict Diamonds
February 2001 Louis Goreux
ARWPS 14 Reform and Opportunity: The Changing Role and Patterns of Trade in South Africa and SADC
March 2001 Jeffrey D. Lewis
ARWPS 15 The Foreign Direct Investment Environment in Africa
March 2001 Miria Pigato
ARWPS 16 Choice of Exchange Rate Regimes for April 2001 Fahrettin Yagci

30
AFRICA REGION WORKING PAPER SERIES Series # Title Date Author
Developing Countries
ARWPS 18 Rural Infrastructure in Africa: Policy Directions
June 2001 Robert Fishbein
ARWPS 19 Changes in Poverty in Madagascar: 1993-1999
July 2001 S. Paternostro J. Razafindravonona David Stifel
ARWPS 20 Information and Communication Technology, Poverty, and Development in sub-Saharan Africa and South Asia
August 2001 Miria Pigato
ARWPS 21 Handling Hierarchy in Decentralized Settings: Governance Underpinnings of School Performance in Tikur Inchini, West Shewa Zone, Oromia Region
September 2001 Navin Girishankar A. Alemayehu Yusuf Ahmad
ARWPS 22 Child Malnutrition in Ethiopia: Can Maternal Knowledge Augment The Role of Income?
October 2001 Luc Christiaensen Harold Alderman
ARWPS 23 Child Soldiers: Preventing, Demobilizing and Reintegrating
November 2001 Beth Verhey
ARWPS 24 The Budget and Medium-Term Expenditure Framework in Uganda
December 2001 David L. Bevan
ARWPS 25 Design and Implementation of Financial Management Systems: An African Perspective
January 2002 Guenter Heidenhof H. Grandvoinnet Daryoush Kianpour B. Rezaian
ARWPS 26 What Can Africa Expect From Its Traditional Exports?
February 2002 Francis Ng Alexander Yeats
ARWPS 27 Free Trade Agreements and the SADC Economies
February 2002 Jeffrey D. Lewis Sherman Robinson Karen Thierfelder
ARWPS 28 Medium Term Expenditure Frameworks: From Concept to Practice. Preliminary Lessons from Africa
February 2002 P. Le Houerou Robert Taliercio
ARWPS 29 The Changing Distribution of Public Education Expenditure in Malawi
February 2002 Samer Al-Samarrai Hassan Zaman
ARWPS 30 Post-Conflict Recovery in Africa: An Agenda for the Africa Region
April 2002 Serge Michailof Markus Kostner Xavier Devictor
ARWPS 31 Efficiency of Public Expenditure Distribution and Beyond: A report on Ghana’s 2000 Public Expenditure Tracking
May 2002 Xiao Ye S. Canagaraja
31
AFRICA REGION WORKING PAPER SERIES Series # Title Date Author
Survey in the Sectors of Primary Health and Education
ARWPS 33 Addressing Gender Issues in Demobilization and Reintegration Programs
August 2002 N. de Watteville
ARWPS 34 Putting Welfare on the Map in Madagascar August 2002 Johan A. Mistiaen Berk Soler T. Razafimanantena J. Razafindravonona
ARWPS 35 A Review of the Rural Firewood Market Strategy in West Africa
August 2002 Gerald Foley Paul Kerkhof Djibrilla Madougou
ARWPS 36 Patterns of Governance in Africa September 2002 Brian D. Levy
ARWPS 37 Obstacles and Opportunities for Senegal’s International Competitiveness: Case Studies of the Peanut Oil, Fishing and Textile Industries
September 2002 Stephen Golub Ahmadou Aly Mbaye
ARWPS 38 A Macroeconomic Framework for Poverty Reduction Strategy Papers : With an Application to Zambia
October 2002 S. Devarajan Delfin S. Go
ARWPS 39 The Impact of Cash Budgets on Poverty Reduction in Zambia: A Case Study of the Conflict between Well Intentioned Macroeconomic Policy and Service Delivery to the Poor
November 2002 Hinh T. Dinh Abebe Adugna Bernard Myers
ARWPS 40 Decentralization in Africa: A Stocktaking Survey
November 2002 Stephen N. Ndegwa
ARWPS 41 An Industry Level Analysis of Manufacturing Productivity in Senegal
December 2002 Professor A. Mbaye
ARWPS 42 Tanzania’s Cotton Sector: Constraints and Challenges in a Global Environment
December 2002 John Baffes
ARWPS 43 Analyzing Financial and Private Sector Linkages in Africa
January 2003 Abayomi Alawode
ARWPS 44 Modernizing Africa’s Agro-Food System: Analytical Framework and Implications for Operations
February 2003 Steven Jaffee Ron Kopicki Patrick Labaste Iain Christie
ARWPS 45 Public Expenditure Performance in Rwanda March 2003 Hippolyte Fofack C. Obidegwu Robert Ngong
32
AFRICA REGION WORKING PAPER SERIES Series # Title Date Author
ARWPS 46 Senegal Tourism Sector Study March 2003 Elizabeth Crompton Iain T. Christie
ARWPS 47 Reforming the Cotton Sector in SSA March 2003 Louis Goreux John Macrae
ARWPS 48 HIV/AIDS, Human Capital, and Economic Growth Prospects for Mozambique
April 2003 Channing Arndt
ARWPS 49 Rural and Micro Finance Regulation in Ghana: Implications for Development and Performance of the Industry
June 2003 William F. Steel David O. Andah
ARWPS 50 Microfinance Regulation in Benin: Implications of the PARMEC LAW for Development and Performance of the Industry
June 2003 K. Ouattara
ARWPS 51 Microfinance Regulation in Tanzania: Implications for Development and Performance of the Industry
June 2003 Bikki Randhawa Joselito Gallardo
ARWPS 52 Regional Integration in Central Africa: Key Issues
June 2003 Ali Zafar Keiko Kubota
ARWPS 53 Evaluating Banking Supervision in Africa June 2003 Abayomi Alawode
ARWPS 54 Microfinance Institutions’ Response in Conflict Environments: Eritrea- Savings and Micro Credit Program; West Bank and Gaza – Palestine for Credit and Development; Haiti – Micro Credit National, S.A.
June 2003
Marilyn S. Manalo
AWPS 55 Malawi’s Tobacco Sector: Standing on One Strong leg is Better than on None
June 2003 Steven Jaffee
AWPS 56 Tanzania’s Coffee Sector: Constraints and Challenges in a Global Environment
June 2003 John Baffes
AWPS 57 The New Southern AfricanCustoms Union Agreement
June 2003 Robert Kirk Matthew Stern
AWPS 58a How Far Did Africa’s First Generation Trade Reforms Go? An Intermediate Methodology for Comparative Analysis of Trade Policies
June 2003 Lawrence Hinkle A. Herrou-Aragon Keiko Kubota
AWPS 58b How Far Did Africa’s First Generation Trade Reforms Go? An Intermediate Methodology for Comparative Analysis of
June 2003 Lawrence Hinkle A. Herrou-Aragon Keiko Kubota

33
AFRICA REGION WORKING PAPER SERIES Series # Title Date Author
Trade Policies AWPS 59 Rwanda: The Search for Post-Conflict
Socio-Economic Change, 1995-2001
October 2003 C. Obidegwu
AWPS 60 Linking Farmers to Markets: Exporting Malian Mangoes to Europe
October 2003 Morgane Danielou Patrick Labaste J-M. Voisard
AWPS 61 Evolution of Poverty and Welfare in Ghana in the 1990s: Achievements and Challenges
October 2003 S. Canagarajah Claus C. Pörtner
AWPS 62 Reforming The Cotton Sector in Sub-Saharan Africa: SECOND EDITION
November 2003 Louis Goreux
AWPS 63 (E) Republic of Madagascar: Tourism Sector Study
November 2003 Iain T. Christie D. E. Crompton
AWPS 63 (F) République de Madagascar: Etude du Secteur Tourisme
November 2003 Iain T. Christie D. E. Crompton
AWPS 64 Migrant Labor Remittances in Africa: Reducing Obstacles to Development Contributions
Novembre 2003 Cerstin Sander Samuel M. Maimbo
AWPS 65 Government Revenues and Expenditures in Guinea-Bissau: Casualty and Cointegration
January 2004 Francisco G. Carneiro Joao R. Faria Boubacar S. Barry
AWPS 66 How will we know Development Results when we see them? Building a Results-Based Monitoring and Evaluation System to Give us the Answer
June 2004 Jody Zall Kusek Ray C. Rist Elizabeth M. White
AWPS 67 An Analysis of the Trade Regime in Senegal (2001) and UEMOA’s Common External Trade Policies
June 2004 Alberto Herrou-Arago Keiko Kubota
AWPS 68 Bottom-Up Administrative Reform: Designing Indicators for a Local Governance Scorecard in Nigeria
June 2004 Talib Esmail Nick Manning Jana Orac Galia Schechter
AWPS 69 Tanzania’s Tea Sector: Constraints and Challenges
June 2004 John Baffes
AWPS 70 Tanzania’s Cashew Sector: Constraints and Challenges in a Global Environment
June 2004 Donald Mitchell
AWPS 71 An Analysis of Chile’s Trade Regime in 1998 and 2001: A Good Practice Trade Policy Benchmark
July 2004 Francesca Castellani A. Herrou-Arago Lawrence E. Hinkle
AWPS 72 Regional Trade Integration inEast Africa: Trade and Revenue Impacts of the Planned East African Community Customs Union
August 2004 Lucio Castro Christiane Kraus Manuel de la Rocha
34
AFRICA REGION WORKING PAPER SERIES Series # Title Date Author
AWPS 73 Post-Conflict Peace Building in Africa: The
Challenges of Socio-Economic Recovery and Development
August 2004 Chukwuma Obidegwu
AWPS 74 An Analysis of the Trade Regime in Bolivia in2001: A Trade Policy Benchmark for low Income Countries
August 2004 Francesca Castellani Alberto Herrou-Aragon Lawrence E. Hinkle
AWPS 75 Remittances to Comoros- Volumes, Trends, Impact and Implications
October 2004 Vincent da Cruz Wolfgang Fendler Adam Schwartzman
AWPS 76 Salient Features of Trade Performance in Eastern and Southern Africa
October 2004 Fahrettin Yagci Enrique Aldaz-Carroll
AWPS 77 Implementing Performance-Based Aid in Africa
November 2004 Alan Gelb Brian Ngo Xiao Ye
AWPS 78 Poverty Reduction Strategy Papers: Do they matter for children and Young people made vulnerable by HIV/AIDS?
December 2004 Rene Bonnel Miriam Temin Faith Tempest
AWPS 79 Experience in Scaling up Support to Local Response in Multi-Country Aids Programs (map) in Africa
December 2004 Jean Delion Pia Peeters Ann Klofkorn Bloome
AWPS 80 What makes FDI work? A Panel Analysis of the Growth Effect of FDI in Africa
February 2005 Kevin N. Lumbila
AWPS 81 Earnings Differences between Men and Women in Rwanda
February 2005 Kene Ezemenari Rui Wu
AWPS 82 The Medium-Term Expenditure Framework The Challenge of Budget Integration in SSA countries
April 2005 Chukwuma Obidegwu
AWPS 83 Rules of Origin and SADC: The Case for change in the Mid Term Review of the Trade Protocol
June 2005 Paul Brenton Frank Flatters Paul Kalenga
AWPS 84 Sexual Minorities, Violence and AIDS in Africa
July 2005 Chukwuemeka Anyamele Ronald Lwabaayi Tuu-Van Nguyen, and Hans Binswanger
AWPS 85 Poverty Reducing Potential of Smallholder Agriculture in Zambia: Opportunities and Constraints
July 2005 Paul B. Siegel Jeffrey Alwang
35
AFRICA REGION WORKING PAPER SERIES Series # Title Date Author
AWPS 86 Infrastructure, Productivity and Urban Dynamics in Côte d’Ivoire An empirical analysis and policy implications
July 2005 Zeljko Bogetic Issa Sanogo
AWPS 87 Poverty in Mozambique: Unraveling Changes and Determinants
August 2005 Louise Fox Elena Bardasi, Katleen Van den Broeck
AWPS 88 Operational Challenges: Community Home Based Care (CHBC) forPLWHA in Multi-Country HIV/AIDS Programs (MAP) forSub-Saharan Africa
August 2005 Nadeem Mohammad Juliet Gikonyo
AWPS 89 Framework for Forest Resource Management in Sub-Saharan Africa
August 2005 Giuseppe Topa
AWPS 90 Kenya: Exports Prospects and Problems September 2005 Francis Ng Alexander Yeats
AWPS 91 Uganda: How Good a Trade Policy Benchmark for Sub-Saharan-Africa
September 2005 Lawrence E. Hinkle Albero Herrou Aragon Ranga Rajan Krishnamani Elke Kreuzwieser
AWPS 92 Community Driven Development in South Africa, 1990-2004
October 2005
David Everatt Lulu Gwagwa
AWPS 93 The Rise of Ghana’’s Pineapple Industry from Successful take off to Sustainable Expansion
November 2005 Morgane Danielou Christophe Ravry
AWPS 94 South Africa: Sources and Constraints of Long-Term Growth, 1970-2000
December 2005 Johannes Fedderke
AWPS 95 South Africa’’s Export Performance: Determinants of Export supply
December 2005 Lawrence Edwards Phil Alves
AWPS 96 Industry Concentration in South African Manufacturing: Trends and Consequences, 1972-96
December 2005 Gábor Szalontai Johannes Fedderke
AWPS 97 The Urban Transition in Sub-Saharan Africa: Implications for Economic Growth and Poverty Reduction
December 2005 Christine Kessides
AWPS 98 Measuring Intergovernmental Fiscal Performance in South Africa Issues in Municipal Grant Monitoring
May 2006 Navin Girishankar David DeGroot T.V. Pillay
36
AFRICA REGION WORKING PAPER SERIES Series # Title Date Author
AWPS 99 Nutrition and Its determinants in Southern Ethiopia Findings from the Child Growth Promotion Baseline Survey
July 2006 Jesper Kuhl Luc Christiaensen
AWPS 100 The Impact of Morbidity and Mortality on Municipal Human Resources and Service Delivery
September 2006 Zara Sarzin
AWPS 101 Rice Markets in Madagascar in Disarray: Policy Options for Increased Efficiency and Price Stabilization
September 2006 Bart Minten Paul Dorosh Marie-Hélène Dabat, Olivier Jenn-Treyer, John Magnay and Ziva Razafintsalama
AWPS 102 Riz et Pauvrete a Madagascar Septembre 2006 Bart Minten
AWPS 103 ECOWAS – Fiscal Revenue Implications of the Prospective Economic Partnersip Agreement with the EU
April 2007 Simplice G. Zouhon-Bi Lynge Nielsen