Embed Size (px)
Citation preview
2013
Roos Bernelot Moens
Erasmus Universiteit Rotterdam
REVENUE DIVERSIFICATION FOR MUSEUMS
ERASMUS SCHOOL OF HISTORY, CULTURE AND COMMUNICATION
Revenue Diversification for Museums
exploring the revenue strategies of the Rijksmuseum and the Van Gogh
Museum in the quest for financial stability
Keywords: museums, museum finance; revenue diversification; revenue volatility; revenue strategy.
~
Erasmus University Rotterdam
Erasmus School of History, Communication and Culture
Master thesis Cultural Economics & Cultural Entrepreneurship
~
Student: Roos Bernelot Moens
Student number: 371812
E-mail address: [email protected] /
~
Supervising lecturer: Dr. Anna Mignosa
Second reader: Prof. Dr. Arjo Klamer
~
Amsterdam, July 19, 2013
I
Table of Contents
Acknowledgements………………………………………………………………………………………….. II
Abstract……………………………………………………………………………………………………….. III
1. Introduction…………………………………………………………………………………… 1
2. Theoretical Framework - Museum Finances……………………………..……………….….. 3
Introduction…………………………………………………………………………………………...… 3
2.1. The Museum……………………………………………………………….……………. 3
2.1.1. Definition and function of museums………………………………………………. 3
2.1.2. The museum as a nonprofit organization………………………………………….. 5
2.1.3. The curious economics of museums……………………………………………..… 6
2.2. Museum Finances…………………………………………………………………..…… 10
2.2.1. A little history of financing culture in the Netherlands….………………………….10
2.2.2. Museum income………………………………....………………………………..... 13
2.3. The Risks of the Financial Arrangements………………………………………..……… 18
2.3.1. Cross-subsidization…………………………………………………………..…….. 18
2.3.2. Resource Dependence Theory……………………………………………………… 18
2.4. Revenue Diversification……………………………….……………………………….... 21
2.4.1. Modern Portfolio Theory……………………………………………………….…. 21
2.4.2. Revenue diversification for nonprofit organizations………………………….…… 22
3. Problem Statement, Method and Data...…………………………………………………..….. 26
Introduction……………………………………………………………………………………….…….. 26
3.1. Problem statement and research questions……………………………………………… 26
3.2. Method…………………………………………………………………………...……… 29
3.3. Data……………………………………………………………………………………… 37
3.4. Limitations of research……………………………………………………………..…… 40
4. Results and Discussion…………………………………………………………………….…. 42
Introduction………………………………………………………………………………………...…… 42
4.1. Results Analysis Part 1………………………………………………………………….. 42
4.2. Results Analysis Part II…………………………………………………………………. 54
5. Conclusion……………………………………………………………….……….................... 64
Bibliography……………………………………………………………………………..…… 70
Appendices……………………………………………………………………………….…… 77
II
Acknowledgements
‘Love many things, for therein lies the true strength, and whosoever loves much performs much, and
can accomplish much, and what is done in love is done well.’
[Vincent van Gogh]
The process of writing this master thesis turned out surprisingly rewarding. It was a good opportunity
to reflect on what I learned in the past year, not only about the economics of culture, but even more so
about myself. I learned that studying is actually a joy and a source of energy once you love the subject
studied. And ‘whosoever loves much performs much, and can accomplish much, and what is done in
love is done well’. To say I loved writing my master thesis might be an overstatement, but I definitely
did not mind doing it. I did love the subject and I feel that -on a personal level- I performed much and
accomplished much. Whether it is done well is up to those judging the work… Either way, I have
enjoyed this past year and enjoyed writing the thesis. It is thus with mixed feelings that I am finishing
up my thesis. I feel satisfaction, relief, and happy that it is almost done. However, I cannot help but
also feel slightly disappointed that this year is coming to an end. I will always look back on this period
with fond memories of the experience I gained at the Erasmus University: the friends I made in the
great class of ’12-’13, the intense discussions we had in our seminars, the inspiring teachers, the fun
fieldtrips, and maybe even the train rides to Rotterdam and back.
But with each word I wrote in this thesis the end of the year came closer in sight and I would
not have been able to accomplish this without the help and support of many in the process. First and
foremost, I would like to thank my supervisor, Anna Mignosa, for her guidance in the process and the
inspiring conversations we had on the thesis topic: grazie mille for helping me and for your
constructive criticism. Also a big thanks to my very clever brother, Daan, for his econometrical
support. Couldn’t have done it without you, you little smart-ass. I also could not have done this
without the loving support of my parents. Thanks to my dad for academic inspiration and a critical
eye, and to my mom for sharing the love for the arts with me. Not to forget, I would like to thank my
good, old lap-top, for not breaking down on me and sticking it out with me to the end (knock wood…).
Last but certainly not least, a special thanks goes out to my late grandfather, Harts Nijstad, for his
love, friendship and inspiration, and for leaving the crumbs leading me in the right direction.
~
III
Abstract
The latest cuts in the government budget for the arts and culture have forced Dutch museums to
reconsider their finances and revenue strategies. Museums in the Netherlands are considered to be too
reliant on public support and the government wishes to stimulate more independence and
entrepreneurship in the sector. Museums, on the other hand, appear reluctant to adopt such an
approach and feel that commercialization will lead the mission-drift and distraction from their core
cultural and social values. In academic literature, however, it has been suggested that revenue
diversification, i.e. an equal balance between multiple income sources in the revenue portfolio of
nonprofit organizations, will lead to increased financial stability. In this thesis the revenue
diversification strategy, which stems from the financial Modern Portfolio Theory, is tested as a
potential revenue strategy for museums in the Netherlands. The question is whether a more diversified,
well-balanced revenue portfolio for museums will increase their financial stability in terms of reduced
revenue volatility. Moreover, the implications of a more market-oriented revenue strategy are
investigated. The research focuses on the annual reports from the years 2002-2011 of two museums in
Amsterdam, the Rijksmuseum and the Van Gogh Museum, which both receive subsidies from the state
via the Ministry of Education, Culture and Science (MinOCW). Given the limited amount of data no
significant conclusions could be drawn with respect to the impact of revenue diversification on
revenue volatility. By comparing the financial positions of the two museums, however, evidence was
found pointing at the positive effect of a more commercial, market-oriented revenue strategy on
museum finances. In general, this thesis was aimed at exploring new opportunities in revenue
strategies for museums and some first steps have been made in this respect. However, further research
is required, using larger data sets, to gain more information about the topic.
1
1. Introduction
‘First there was the fine-tooth comb. Then came the efficiency reduction. Still later the cheese slicer.
And now there is the blunt ax. The government has initiated a frontal attack on art and culture.’
The above sentence is a central statement on the website of ‘NEDERLAND SCHREEUWT OM
CULTUUR’, a national demonstration against the increasing cuts in the government budget for arts
and culture, which are (partly) the result of the economic downturn of the recent years. The Dutch
were called upon to ‘cry out for culture’ and on November 20th of 2010 about 75.000 people went out
onto the streets to protest against the cuts. Clearly, the budget cuts were not well-received in the
cultural sector. The economic developments and the political pressure forced many institutions to
reevaluate their finances, including the museum sector. For decades museums in the Netherlands have
been highly reliant on public support, generating the major part of their total revenues via subsidies of
the state, provincial or municipal authorities.
On state level the Ministry of Education, Culture and Science (MinOCW) is responsible for
the funding of the national, cultural institutions, including the so-called rijksmusea (national
museums). On average, these museums receive about 70% of their income from the state. The
remaining revenues are derived from commercial activities and private contributions. What is
suggested by the government is that less reliance on public support and a better balance between the
different revenue sources will eventually lead to a more autonomous and sustainable sector. By
reducing their involvement in the arts and culture the government wishes to generate more
independence in the sector as well as to stimulate entrepreneurship. With the introduction of the new
cultural policy museum too are forced to rethink their revenue strategies.
The income issue in the nonprofit sector has also been addressed in academic literature on
various occasions. Since many nonprofit organizations rely on multiple revenue sources this makes
their revenue portfolio rather complex. Several studies have provided evidence for the fact that
diversification of revenue sources and a balanced revenue portfolio will lead to a stronger financial
position, as opposed to organizations with more concentrated revenue sources.
In this thesis the theory of revenue diversification is suggested as a potential revenue strategy
for Dutch museums. By broadening their range of revenue sources and aiming for an equal division
between each source of revenue this might lead to a stronger financial condition and a more secure and
sustainable future. In the case of the national museums a shift needs to take place away from
MinOCW funding and towards other sources of income. In other words, following the suggestion of
the government, the museums are stimulated to take on a more entrepreneurial approach and a more
market-oriented revenue strategy. Although this development is feared by many museums, the aim of
this thesis is to provide evidence in favor of such an approach. By investigating the implications of a
2
revenue diversification strategy or a more commercial revenue strategy, the aim is to provide some
first stepping stones on the way to a new funding structure.
The main research question addressed in this thesis is whether ‘revenue diversification is a
valid revenue management strategy for museums in the Netherlands that receive a subsidy from the
MinOCW’ (Q1). In order to answer this question an analysis is performed to assess the ‘impact of
revenue diversification on revenue volatility for the Rijksmuseum and the Van Gogh Museum’ (Q1.1).
It is hypothesized that higher degrees of revenue diversification will decrease revenue volatility in the
following year (H1). A second analysis is performed to explore the boundaries of a more commercial,
market-oriented revenue strategy. Towards this end the financial positions of the Rijksmuseum and the
Van Gogh Museum, which follow opposing revenue strategies, are compared. The question addressed
here is if ‘the Van Gogh Museum has a stronger financial position than the Rijksmuseum in terms of
asset size, current ratio, operating margins and equity balances’ (Q2).
The thesis is structured as follows. In the following chapter (2) a theoretical framework is created. An
overview is provided on the theories, literature and context of museum finances. It is explained why
museums are financed the way they are, how they are exactly financed, what problems are
encountered in museum finances and how these problems may be overcome. A possible solution is
tested in this thesis. In chapter 3 the problem is stated and the method and data used are explained. A
quantitative study is performed analyzing the revenue data from the annual reports of the two
museums. The analysis consists of two parts. In the first part, an econometrical regression is
performed to study the impact of revenue diversification on revenue volatility. In the second part, the
financial positions of the Rijksmuseum and the Van Gogh Museum are compared. The results of the
analysis are presented and discussed in chapter 4. Finally, in chapter 5 the conclusions of the study
will be drawn.
3
2. Theoretical Framework – Museum Finances
Introduction
In this section I will present a framework of theories, concepts and definitions explaining the why,
how and what concerning museum finances. Economic developments and changes in public policy
force museums to rethink their financial situation. The aim of my thesis is to explore the current state
of museum finances and identify new opportunities in future financial management. In order to fully
understand what constitutes financial management in a sector like this, thorough exploration of the
topic is required. How do museums finance their operations and activities? How does a museum
obtain its resources? Why are museums financed the way they are? What is the reason for the reliance
on multiple revenue sources? What implications or effects do these revenue sources have on the
museum? What is problematic about these effects; and how can these problems be overcome? These
are some of the questions that remain to be answered.
2.1. The Museum
The way museums are financed is dependent on their organizational peculiarities and the environment
they operate in. Museums rely on a variety of income streams and stakeholders when it comes to their
finances. How museums are financed has much to do with the role of the museum in society, their
organizational form and the curious economics of museums. Therefore, some of these general
concepts will be explained in the following sections.
2.1.1. The definition and function of a museum
Definitions of the museum vary widely, and finding the exact definition is not as easy as may be
figured. Museums come in all sorts and kinds. There are art museums, history museums, fashion
museums, nature museums, and so on. Despite the differences in the missions of various types of
museums, the underlying denominator is the word museum, meaning that all museums share a similar
set of rules and carry out similar functions (Frey and Meier, 2006).
The Oxford English Dictionary (2013) provides an overview of the basic definitions of a
museum and its etymology. The roots of the word stem from the ancient Greek and classical times
who referred to the museum as a place holy to the Muses [Def. 1.a.], which were the goddesses of
inspiration for the arts, science and literature. Aside from their function as a shrine of the Muses,
museums in the ancient Hellenic world were buildings or institutions dedicated to education and
research, especially within the study of the arts or literature [Def 1.b.]. Next to the historical definition,
the Oxford English Dictionary provides a second definition of the museum which is more in
accordance with the contemporary view of a museum. Nowadays, a museum is known as ‘a building
or institution in which objects of historical, artistic, or cultural interest are preserved and exhibited’
4
(Oxford English Dictionary [Def. 2a], 2013). The educational aspect, as was historically a main
function of the museum, does not become very clear in this definition. It may be obvious, however,
that the preservation and exhibition of objects by museums is aimed not only at the documentation of
knowledge and information, but also on making it available to the public.
The contemporary definition lies at the base of the description of a museum given by the
International Council of Museums (ICOM), which is used as a reference on an international level. The
ICOM is an organization focused on setting the standards for museums internationally. They define a
museum as ‘a nonprofit, permanent institution in the service of society and its development, open to
the public, which acquires, conserves, researches, communicates and exhibits the tangible and
intangible heritage of humanity and its environment for the purposes of education, study and
enjoyment’ (ICOM.museum, 2013). It is recognized that the definition of the museum is not static, but
that it should in fact be evolving and stay updated with developments in current society. The ICOM
makes sure that their definition of the museum maintains consistent with ‘the realities of the global
museum community’ (ICOM.museum, 2013). As such, the definition of a museum by the ICOM is
world-wide adopted by institutions for museums. In the Netherlands too the ICOM-definition is
applied by the central museum bodies. Both the Nederlandse Museumvereniging as well as the
Museumregister Nederland refer to the ICOM-definition in their interpretation of a museum.
The ICOM-definition of museums already hints at the function and role of a museum in that
the activities of a museum are concerned with the acquisition, conservation, investigation,
communication and exhibition of heritage in the service of the society. Societies recognize their
responsibility for safeguarding the heritage of their community for future generations. The traditional
function of museums is to take up this role as guardians of heritage by collecting objects of cultural,
social and historical value and protecting them (Johnson and Thomas, 1998; Luksetich and Partridge,
1997). Primarily, museums collect objects to ‘extend, consolidate or complete existing collections’
(Frey and Steiner, 2012; Noble, 1970). These objects are of a particular value to a community and
require protection against deterioration and oblivion. Another important task of museums is research
(Anderson, 2005). Creating historical and academic context and acquiring knowledge and information
is considered a key activity to ensure the value and legitimacy of heritage objects and the collection.
These tasks are performed by museums not only with the aim of preservation and protection of
heritage, but also because of the educational function of museums. By presenting and communication
their collection to the public the museum provides objects of study and leisure to current and future
generations ensuring that their heritage is maintained (Frey and Steiner, 2012; Noble, 1970).
Besides their traditional function, museums also play an important economic role in current
society. They function as a tourist attraction and (consequently) as stimulator of economic
development in the region (Frey and Meier, 2006). As McPherson (2006) suggests, ‘museums are no
longer simply exhibition spaces that represent the knowledge and truth of the histories that they
represent; they have become sites where people participate, interpret and buy, rather than just visit and
5
become educated’. This second function is an additional validation of the importance of museums to
the community at large as well as to the public authorities. The economic externalities of the presence
of a museum in a community may have positive effects on the economy and the welfare of a region.
Both the traditional as well as the economic function that museums carry out are an incentive
for the government and community to give support in various ways, including financial support. To
ensure the existence of museums and the economic and social externalities they provide external
funders often provide financial resources to museums.
2.1.2. The museum as a nonprofit organization
Museums are (predominantly) nonprofit organizations that are –as the name already suggests- not
aimed at making profits. Nonprofit organizations are focused on pursuing a certain non-pecuniary
mission, and may also be referred to as mission-driven organizations. Netzner (2006) describes a non-
profit as an organization with often the same formal structure and governance as regular for-profit
organizations. In contrast, however, non-profit organizations are characterized by the fact that the
managers cannot be the owners of the firm, nor have an economic interest in the organization. The
managers are legally not allowed to appropriate any profits made by the organization, ensuring their
priority to give single-minded attention to the pursuit of the organization’s core cultural mission. As
such, nonprofits are subject to the non-distribution constraint, inhibiting them to distribute ‘residual
earnings to individuals who exercise control over the firm, such as officers, directors, or members’
(Hansmann, 1980; 1987). The restrictions enforced upon management, however, do not prohibit the
nonprofit organizations from making any profits at all. The nonprofit organizational form simply
signifies that any surplus of revenue should be reinvested with the aim of furthering the organization’s
mission (Netzner, 2006).
Following the traditional definition, museums typically have a social or cultural mission, and
are driven by intrinsic values such as celebrating the past and giving a sense of identity, meaning and
education to a community (Klamer, 2011; Urry, 1996). They are aimed at providing a service to their
customers, not to become richer (in monetary terms) themselves, but with the aim of (intrinsically)
enriching the lives of their visitors. As such, the primary aim of museums as nonprofit organizations
is not to make profits or increase revenue. Still the need for sufficient resources to cover expenses and
finance operations should not be underestimated (Chang and Tuckman, 2010; Boris and Steuerle,
2006). Nonprofit organizations often provide services they cannot charge market prices for and are
thus typically not capable of completely covering their expenses with revenue earned through
operations. Therefore, nonprofit organizations frequently depend on external income sources to
financially support their activities. In some cases, they even rely solely on external funding.
Museums too often rely for a great deal on financial support from external sources, even
though they might have the capacity to generate considerable income through operations. Their service
to society in a nonprofit way is an incentive for the provision of external funds by the government and
6
the community. The external funds for museums may include gifts or donations from individuals,
foundation and corporate grants, government subsidies, endowment earnings, or funds from other
sources (Froelich, 1999; Kearns, 2007).
2.1.3. The curious economics of museums
Another rationale for the way museums are financed nowadays requires an economic perspective. The
reason for the reliance of museums on other external resources besides self-generated revenue is due to
market failure. In the market for museums, supply and demand do not match efficiently. In order to
fully understand what constitutes the market failure in the museum sector, more information is
required on the curious economics of museums.
Supply and demand
The theory of supply and demand stems from classical microeconomic theory and has been applied to
museums by cultural economists on various occasions. By taking an economic perspective on
museums it is assumed that the supply and demand for a museum’s services is generated by economic
agents who aim to maximize their utility in the eye of scarce resources and within the boundaries set
by the institutions and the (economic and political) environment (Frey and Meier, 2006). Prieto-
Rodríguez and Fernández-Blanco (2006) also identify the museum as ‘an organization that follows a
general path specified by economic behavior’ in the pursuit of ‘maximization of an objective function
under a set of economic and institutional restrictions’. In sum, museums are run and visited by
individuals (or when talking economics: economic agents) who in the face of scarce resources have to
make decisions affecting the role and function of the museum.
Following the economic point of view, visitors are no longer just visitors, but are now
considered ‘consumers’ who represent the market demand for the good or service that is supplied by
the museums (McPherson 2006; Prieto-Rodríguez and Fernández-Blanco, 2006). Demand for museum
services can be divided into two categories: the direct private demand by the museum’s visitors who
make use of the museum’s services and the indirect social demand by individuals or organizations that
derive benefits from a museum’s services through external or economic effects (Frey and Meier,
2006). Together, the two types of demand represent the total demand for a museum.
The private demand for museums is the type of demand that can be translated into actual
visitor numbers. It is the demand expressed by those individuals that actually make use of the
museum’s services and attach direct value to it. They visit the museum, go to exhibitions, buy at the
museum store, and make use of the museum’s food and catering services. These individuals are often
willing to pay for the services provided by museums. There are many factors determining the private
demand. First and foremost, the admission price and income are of major influence. But also the
education level and opportunity cost of time of visitors and the price of alternative activities play a
7
significant role. Other factors determining demand are concerned with the supply side of the museum
and are related to the quality of the collection or the exhibition program (Frey and Meier, 2006).
Social demand is concerned with the indirect benefits that are derived from the museum’s
services, also referred to as non-user benefits. In other words, (social) value is created, even for
individuals that do not make direct use of the museum’s services. The creation of these values happens
in various ways. Firstly, people value having the possibility of being able to go to the museum,
without actually going (option value), and the awareness that a museum exists even though no plans
are made to visit (existence value). As such, value is derived from the mere presence of the museum in
their community. People also gain satisfaction from knowing that future generations will also be able
to make use of the museum’s services (bequest value) or from the knowledge that the museum has
status outside the community as well (prestige value). In other words, value is derived from the fact
that others can visit the museum or will be able to do so in the future. People in a community that
attach value to museums feel that other people should value it too. They derive identity and status
from the existence of the museum and from the fact that they can share it with others. Finally, people
attach educational value to museum and appreciate the sense of culture that is embedded in people’s
minds by the museum.
All these values underlying social demand for museums validate the existence of museums,
regardless of any private, direct demand for a museum’s services. As mentioned before, the
combination of social and private demand constitutes the total demand for a museum. All people that
visit museums and therefore represent private demand are also representatives of social demand. The
problem lies in the fact that social demand may not be extended into private demand. Even though
these individuals theoretically would be willing to pay for the museum’s services, they do not make
direct use of its services and therefore museums cannot directly generate income from pure social
demand. Indirectly, however, social demand for museums is financially corrected by government
support, donations and individual giving, ensuring that the museum has sufficient financial means to
supply the services demanded.
The supply side of museums is concerned with the generation of a diversified mix of output
that meets demand in the most efficient way possible. Museums too, and increasingly so, are faced
with competition for visitors in the market. Therefore they have to adjust their output mix to market
demand. The ‘goods’ produced by a museum include conservation, documentation, research,
exhibitions, education, entertainment and/or commercial, ancillary activities (Johnson and Thomas,
1998; Prieto-Rodríguez and Fernández-Blanco, 2006). What constitutes the goods supplied depends
on what the exact objective of the museum is and economic factors such as demand and, most
importantly, resources.
Sufficient resources are essential to cover the high costs incurred on the supply side of
museums related to their diverse activities or multiple-output mix. The cost structure of museums is in
fact rather unique. Museums typically carry high fixed costs that proportionally will fall quickly when
8
the number of visitors increases (Frey and Meier, 2006). The marginal cost of an extra visitor is
generally close to zero, which means that no significant extra costs will be incurred when the amount
of visitors rises. From an economical perspective, these cost characteristics of museums are an
incentive for museum managers to strive for maximization of visitor numbers. From the traditional
perspective, however, the social desire to educate and entertain an as wide as possible public is also a
key driver. In sum, museum managers derive utility from higher visitor numbers because it enables
them to share their mission with a wider audience as well as the economic benefits that come with
higher attendance rates.
The utility function of a museum depends not only on the number of visitors to the museum,
but also on the quality of its exhibitions (Frey and Meier, 2006). Maximizing both the number of
visitors as well as the quality of their exhibitions provides museum managers with a feeling of
satisfaction. The two utility functions are independent in that they are aimed at two different
objectives. Of course the two objectives are connected. Visitors value high quality exhibitions and
collections. Thus, in order to maximize visitor numbers, the quality of the collection and exhibitions
should be maximized too.
At the same time, following the rules of supply and demand, in order to attract a wider
audience prices should be kept at a low level. However, setting low prices also means that less revenue
will be generated. This has consequences for the amount of resources on the supply side and hence on
the quality a museum is able to provide. In museums the price of entrance tickets often does not reflect
the quality of the exhibition or collection. In a survey conducted by the American Association of
Museums (AAM), for example, it was found that the average earned income per visitor was $5,91.
However, the average cost per visitor was approximately $23,35: the costs per visitor were about four
times the amount of visitor income earned (Kotler et al, 2008). This discrepancy is the result of the
low prices relative to the high and costly quality that is offered by museums. Therefore, for every
dollar earned per visitor, museums have to raise four dollars from alternative sources to cover their
costs (Kotler et al, 2008). From an economic perspective, this means that the quality provided in
museums is too high for the level of the ticket prices. Either the quality of the exhibitions should be
decreased, or the price level should be raised. Both these options are counterintuitive and impossible
for museum managers which make their management strategies unique.
The discrepancy between the high costs that accompany the quality provided by museums and
the relative low level of revenue generated by private demand is also known as market failure. Market
failure is typical to the nonprofit sector and to museums too. Markets fail when they are unable ‘to
provide goods in a satisfactory way’ and ‘when they do not lead to efficient outcomes or when
outcomes are undesirable’ (Klamer and Zuidhof, 1999). In other words, supply and demand in the
museum market do not meet in an efficient and satisfactory way. There is a gap between the high costs
on the supply side and the income from direct private demand for museums. This gap between costs
9
and revenue in the museum market needs to be filled by generating revenue from alternative sources,
such as public or private support.
Support from the public sector is also validated because of the public or collective character of
the goods supplied by museums. Museums are of social and cultural significance for the community at
large and should therefore be accessible to everyone, regardless of income level. Therefore, often the
government steps in financially to keep price levels low and allow access to those whom socially
demand a museum but do not have the financial means to convert this social demand into private
demand. In other words, ‘to provide equality of access to cultural goods for everyone, public
authorities need to take an active part in heritage management’ (Ost, 2012). This is also known as the
equity rationale for public intervention in the museum sector. In this respect equity refers to economic
equality to all members of a community. As such, government support for museums is a way to
enhance equity or equality in society and make museums accessible to anyone (Ginsburgh, 2004;
Lingle, 1992).
In sum, reasons why museums often are funded by multiple revenue sources are because of the
specific function they carry out, their organizational form and because of market failure. The
traditional as well as the economic function of museums is an incentive for the government and
community to step in as funders. The nonprofit organizational form of museums limits their ability to
focus on the generation of revenues and their capacity to capitalize on their charitable mission. Market
failure in the museum sector is the economic reason for the way museums are financed. Because
museums are unable to rely financially on (private) market demand, they often rely for a great deal on
income from alternative sources.
In this section arguments have been provided why museums often rely on multiple revenue
sources. As such the question why museums are financed the way they are has been addressed. The
way museums are financed nowadays, particularly in the Netherlands, will be discussed in the
following section.
10
2.2. Museum Finances
“The most significant challenge for museums is finding the resources to pay for the varied
and costly activities of running museums. Museums throughout the world face, to varying
degrees, reductions in government support, competition for private funding, and competition
for visitorship and earned income. […] The need to raise money has altered the way museums
operate. Museums have responded to this challenge by working to raise earned income by
building attendance through special exhibits, services, events, and retail operations;
generating private giving, foundation, and corporate support; and employing business
practices including management-by-objectives, strategic planning, marketing, cost cutting,
and outsourcing” (Kotler et al., 2008).
The above quote from Kotler et al. (2008) basically sums up the current state of how museums are
financed throughout the world. In general, the income of museums can be divided into two overall
categories: earned income and contributed income. Contributed income can be subdivided into the
categories of public contributions and private contributions. Basically this means that museums are
dependent on three general sources of income. Firstly, they are dependent on their own efforts to
generate income through ticket sales and other commercial activities. On the other hand, they depend
on the willingness to contribute by private and public sources. An endowment fund can generate
additional revenue from investments, but is less typical to museums in general.
Since my thesis focuses on museums in the Netherlands, and Amsterdam in particular, I will
focus on the Dutch museum market. The global situation as outlined above is also applicable to
museums in the Netherlands. Most museums in the Netherlands receive a major part of their income
from the state, regional or local government. The remaining income is generated from private
contributions and earned income from operational activities. These income categories will be
discussed in the current section.
As can be interpreted from the quote by Kotler et al. (2008) the composition of museum
finances is evolving and continuously adapting to the state of its economic and political environment.
Before going into the current state of museum finances a brief overview is given on the history of the
way culture has been financed in the Netherlands over the past century.
2.2.1. A little history of financing culture in the Netherlands
Nowadays many Dutch museums rely for a great deal on public support by either state or local
governments (Towse, 2010). Public support has not always been the case, however. In fact, initially
cultural policy in the Netherlands did not include an active participative role of the governments. In
the 19th century the state assumed a passive role with respect to arts and culture, distancing itself from
11
making any value judgments about it in general. Development in the cultural sector is therefore largely
due to the activities of private citizens and numerous foundations (Council of Europe/ERICarts, 2011).
This is also true for many of the most important museums in Amsterdam, which were largely founded
on private initiative around the end of the 19th and start of the 20
th century. In fact, the public
authorities at that time often financially relied on loans granted by wealthy citizens. The industrial
revolution of the late 1800s stimulated a period of economic growth and the rise of the middle class.
This middle class was eager to show their newly gained wealth and sophistication by displaying their
interest in art and culture, which had always been associated with the higher classes, elite and social
status. In a relative short period of time several new cultural institutions were founded in the city of
Amsterdam, such as the City Theater in 1884 (Stadsschouwburg), the Rijksmuseum in 1885, the
Concertgebouw in 1888, and the Stedelijk Museum in 1895. The foundation of these institutions has
mostly been financed by private money (Steenbergen, 2008).
At the same time, while private support of the arts and culture increased as a result of the
growing economy, an exodus of Dutch top art took place. Many international buyers showed an
interest in the Dutch seventeenth-century paintings which were increasingly sold across national
borders. Several Amsterdam citizens felt the need to counter this trend and decided to join forces in
order to be able to retain Dutch art and donate it to the Dutch state. It was the beginning of a collective
private patronage of the arts we now still know as the Vereniging Rembrandt. Financial support was
given to the State and museums in the form of loans enabling them to acquire artworks which were
considered cultural heritage to the Netherlands (Vereniging Rembrandt, 2013).
As has become clear, private support was a main funding source for many cultural institutions
and museums at the start of the 20th century. However, in the course of the 20
th century the financing
of arts institutions has increasingly become a government task. Over the years the government
‘assumed the role of moderator of cultural activities’ and has become the ‘largest patron for public art
and culture’ (Council of Europe/ERICarts, 2011). Several factors contributed to this development. The
economic downturn in the 1920s and the recession following the Second World War resulted in a
drastic decline in the private support for the arts. Therefore the government felt the need to step in to
take over much of the patronage for the arts and culture. Especially after 1945, in the wake of World
War II, when the Dutch started to rebuild their country, supporting the arts and culture became a
public concern (Martinius, 1990). A Department for Art and Culture was established in 1945. At that
time, the state felt that the arts and culture were of significant value to society. The great influence it
could have on civilization, cultural elevation and education of the people would help in the
rehabilitation of the post-war Netherlands. By supporting the arts and culture sector and making it
accessible to as many people as possible the government attempted to stimulate the public’s interest in
art.
Even though the post-war support for the arts was intended to be of temporary nature, the role
of the government kept increasing in the subsequent decades (Martinius, 1990). The cultural sector, in
12
turn, started to get used the public support and focused more and more on getting these public
subsidies. Because the post-war years were marked by economic growth, the government, which
possessed sufficient financial resources, found the growing expenses for the arts acceptable. Especially
due to welfare policy and the social objectives on the political agenda, consensus prevailed about the
importance of investing in the arts and culture sector. Slowly the temporary, post-war solution
concerning the arts and cultural activities became the norm and increasingly, the arts and culture were
assumed facilities of public interest and therefore expected to be paid out of public funds.
Up until the eighties subsidies for culture were rationalized by both the givers and the
receivers. However, the economic stagnation in the early eighties forced the government to remediate
cultural policy and ever since public funding of the arts has been subjected to strict regulation. The
driving force behind these developments was the focus of the government on reducing subsidy
dependence of cultural institutions and its commitment to a more market-based allocation of public
funds (Van Dulken, 2002).
Throughout the nineties the focus of cultural policy shifted towards economization of the
cultural sector. An important development in the museum sector in the nineties was the
‘transformation of state museums into self-governing foundations’ (Council of Europe/ERICarts,
2011). Until then these institutions had been part of the central government administration. Instead of
direct funding, the government now introduced financial incentives, encouraging cultural
organizations to become more independent and focused on the market. Even though museums
continued to be subsidized by the Ministry of Culture, a more market-oriented approach gained
popularity, in practice as well as in academic interest in the subject (Anderson, 2005; McPherson,
2006).
In the past decade, the government has gradually been cutting back on its expenses on culture,
creating more distance between the cultural sector and the state and increasingly promoting more
independence and entrepreneurship in the cultural sector (Cultuur in Beeld, 2012). The year 2004,
marked a definitive change in public support for culture. Due to economic downturn, in 2004 the
budget for culture was cut by 10%. The financial crisis in 2008 has resulted in even more urgency to
decrease the role of the government as main financier. Moreover, as from 2007 the state government
introduced a new subsidy scheme giving effect to the policy premise that funding will only be
allocated to institutions that are included in the ‘basic cultural infrastructure’ (Council of
Europe/ERICarts, 2011). This basic infrastructure includes only Dutch institutions offering a product
of top quality which have a national or international dimension.
In the 2012 publication of Cultuur in Beeld, a document on the yearly plans regarding cultural
policy, the government announced that in 2013 it was again significantly cutting back on its
expenditures. The state wishes to further reduce its involvement in the cultural sector and introduced
that the budget for culture would be cut by 200 million euro. The budget for culture would shrink by
20%. In 2011 and 2012 the government had already made the first cuts of 30 and 50 million,
13
respectively. Not only on state level, but also on provincial and municipal level cuts have been made
on the cultural budget and are also planned for the subsidy period 2013-2016 (Cultuur in Beeld, 2012).
2.2.2. Museum income
Over the years the income structure of museums has become more hybrid. Revenue is generated
through a combination of public and private sources, as well as through the self-generation of earned
income. With the decline in public support, museums will have to focus more and more on the other
income sources to finance their activities. Especially in the Netherlands the weight of the income
distribution has to shift from government support, towards earned income and private contributions.
Government Support
As mentioned before, the majority of the museums in the Netherlands rely largely on financial support
from the government (Towse, 2010). In fact, Dutch museums relatively receive the most pecuniary
public support in all of Europe (EGMUS, 2013). Government support may come directly from state,
regional and local authorities or indirectly via public foundations or tax exemptions.
The Ministry of Education, Culture and Science (MinOCW) is responsible for the cultural
policy in the Netherlands and is organized in a three-tier system comprising the central government
(MinOCW), provincial (regional) governments and municipal governments. The MinOCW subsidizes
several cultural institutions with a national character. Two thirds of the state budget for the arts and
culture are redistributed by the provincial and municipal governments. Most museums in the
Netherlands rely on financial support by their municipalities (Council of Europe/ERICarts, 2011).
The MinOCW provides four-year grants to a selection of institutions within a predetermined
framework called the ‘basic cultural infrastructure’. The institutions that are part of this national
infrastructure fall under direct ministerial responsibility because of the specific function they perform
in the national context. Institutions in the infrastructure that perform a core function in a certain region
or city fall under the responsibility of the regional or municipal authorities, respectively. As such,
under ministerial regulation, funds are allocated to cultural institutions that are included in
infrastructure for culture due to their national, regional or municipal importance (Cultuursubsidie.nl,
2013).
In order to qualify for the grants the eligible institutions within the infrastructure have to
submit an application one year prior to the start of the new policy period, specifically defining the
activities they have planned and their goals for the upcoming four-year subsidy period. Only for
certain activities government support is provided and these activities are articulated in the ministerial
decree. Every four years the ministry redefines the infrastructure for culture, reconsiders the selected
and subsidized organizations, and presents a new plan or framework about the foreseen policy and
spending on culture in the upcoming subsidy period (Council of Europe/ERICarts, 2011).
14
Also included in the basic cultural infrastructure are various public cultural funds, such as the
Mondriaan Foundation which is specifically aimed at supporting museums and heritage preservation
(Cultuur in Beeld, 2012). The central government is responsible for the allocation of money to these
funds and setting the conditions under which these funds have to operate. These funds have been
established by the government with the aim of maintaining, developing and promoting cultural
activities in the Dutch community that have not been selected in the basic infrastructure. Hence, these
entities do not qualify for a direct subsidy from the government but may apply for indirect public
support from one of the public funds (Council of Europe/ERICarts, 2011; Cultuursubsidies.nl, 2013).
A final form of government support for the arts and culture comes in the form of tax
exemption regulations. Both the cultural institutions (on the receiving end) as well as the donors may
benefit from these tax advantages. Tax exemptions are applied to sponsoring activities and donations
in that donated or inherited money is subject to lower or zero tax rates. Also lower VAT rates are
applied to cultural institutions in the Netherlands, including (public) museums (Council of
Europe/ERICarts, 2011).
Despite the privatization of many of the Dutch national museums (rijksmusea) in the nineties,
they remained very dependent on government support. Taken together, these museums still raise about
70% of their total budget from the government (Council of Europe/ERICarts, 2011). It is not
surprising that the decline in government support is therefore considered to be of significant influence
on the museums.
Earned Income
The privatization of museums in the Netherlands did trigger some new developments in the museum
sector in the last decade of the twentieth century. One of these trends is the increased importance of
revenue generation from entrepreneurial and commercial activities by museums. A new market-
oriented ideology started to prevail in the museum field. Ever since an increase in focus on the
generation of earned income has taken place. This development has also initiated an influx of more
general administrative museum staff instead of specialist curators and the comparison of museum
directors with CEOs is becoming ever more striking (Rottenberg, 2002; Anderson, 2005). Even in the
composition of the supervisory boards of museums a shift in balance is noticed from specialists and
scholars towards businessmen and bankers, who possess knowledge about money, networks and
capacity to raise funds and finding new resources (Anderson, 2005). This renewed market-orientation
has forced many museums to take on a more business-like, economic approach (McPherson, 2006).
Even though museums are predominantly non-profit organizations, they are starting to mirror for-
profit behavior.
As mentioned earlier, this new market-oriented ideology increased the focus of generating
earned income, which can be understood as any revenue earned by an organization through the
provision of services and the sale of goods that require payment or something of equivalent value in
15
return. In other words, income is generated by means of exchange and these revenue-generating
business activities require cultural entrepreneurship and a sense of the market. Museums may generate
earned income through entrance fees, a museum store, food and catering services, commercial
sponsorships, license agreements or other commercial activities, such as the exploitation of facilities.
The primary source of earned income for museums is generated through entrance fees.
Museums often charge visitors for their visit to the museum and the consumption of the museum’s
services. As explained earlier, in the US museums still need to raise four dollars, for every dollar of
entrance fee charged. To a great extent this is also true for Dutch museums. The fees charged and the
thus generated income often is not sufficient to cover the total costs of the museum. However,
museums are ill-advised to raise their income by charging higher fees, because this could lead to a
drastic decline in visitor numbers. Often a way to increase income is by finding ways to increase
visitor numbers. Many subsidized cultural institutions have set ambitious goals when it comes to
increasing their public reach with the hope to increase their revenues. Museums have invested heavily
in recent years to remain attractive to the public and sponsors and to continue to ensure the high
quality of their collections and presentations (Cultuur in Beeld, 2012). The organization of special
exhibitions has proven a very effective way of enhancing revenue for museums (Kotler et al., 2008).
Special exhibitions often prompt significant increases in visitor numbers, increasing revenue from
entrance fees.
Increased visitor numbers may also lead to the generation of additional earned income from
ancillary activities such as running a museum shop or a restaurant. Higher attendance rates lead to
higher sales numbers in the store and more consumption in the restaurant. These commercial activities
have proven significant sources of income to more market-oriented museums when visitor numbers
are increasing. Besides the positive effects of an increase in revenue, undertaking retail activities and
catering services are also often regarded as a way of enhancing the visitor experience (Kotler et al.,
2008). In an increasing competitive environment, museums have to distinguish themselves from other
leisure activities in the market, by focusing on the desires of their ‘customers’. In other words,
museums have to become more customer-oriented.
For museums in the Netherlands the generation of earned income is mainly accomplished by
the two strategies described above. However, other commercial activities are undertaken as well. The
exploitation of the museum’s facilities is also a commercial revenue-generating opportunity for
museums. Museum’s can offer their often remarkable location and spaces to host events which may
represent a significant source of income for museums. Besides the additional income, the exploitation
of the museum’s facilities may also function as a way to gain more exposure to a wider audience.
Commercial sponsorships also appear in the museum field. Sponsorships in a structural form are more
common in the larger museums that can offer the opportunity of reaching a wider audience. Special
exhibitions are also attractive opportunities for sponsors because of the high potential media attention
16
(Frey and Meier, 2006). Finally, license agreements to manufacturing companies concerning objects
held by museums may be a way to generate additional earned income.
The commercial strategies described above are the main strategies used by the museums in the
Netherlands. Increasingly, museums focus on generating income from these ancillary activities, as a
result of the decline in government support. Nowadays, earned income is gaining ground relative to
income from the government (Stichting Museana, Museumcijfers 2011).
Private Contributions
Private contributions to museums are transactions based on donations or gifts which require more
personal involvement of the donor (Klamer and Zuidhof, 1999). Money is not donated on the basis of
quid pro quo but represents gifts based on reciprocity or informal exchange. Income is generated
without the expectation of receiving anything tangible or of equivalent (objective) value in return. The
donors gain utility simply from the act of giving (Andreoni, 1990). Private contributions come from
different donors: individuals, corporate donors and private foundations.
Many factors may be of influence on the decision of individuals to donate to museums. Aside
from the tax benefits, individual giving is often the result of social factors, such as social pressure,
status, guilt or sympathy (Andreoni, 1990). Individuals may donate to museums because they believe
in a cause or in the museum’s mission. They feel that it is important to grant support. By giving money
they send a message out into the community: I give, therefore I care. Andreoni (1990, 1995) refers to
the concepts of altruism and ‘warm-glow’ with respect to charitable giving. The feeling of satisfaction
people get from financially supporting a cause is a sufficient reward to decide to donate. This kind of
revenue is important to museums on many levels. Not only do these kinds of contributions provide the
institution with financial resources, but also with recognition by the public, community buy-in and
organizational legitimacy (Galaskiewicz and Bielefeld, 1998; Fischer et al., 2011).
Money donated to museums may come either in a restricted or unrestricted form. The gift
given to the institution is unrestricted when there are no limits or obligations as for their use.
Unrestricted contributions are philanthropic of nature. Institutions receiving these kinds of donations
may allocate the money towards any purpose they see fit. The person donating the money often
receives a subjective and intangible reward in terms of that feeling of satisfaction or ‘warm glow’
(Andreoni 1990, 1995). In addition, by supporting the museum financially people can derive social
status or identity. Contributions may also come in a restricted form, however. Restricted contributions
still are the result of philanthropy but have a conditional character and are limited in its use by the
donor. The organization receiving the gift must use the given amount according to the conditions that
have been prescribed by the giver.
Corporate contributions or donations should not be confused with corporate sponsorships.
Corporate sponsorships require a certain reward for the money granted to the institution. Corporate
donations may also be of philanthropic nature, aside from the tax benefits that come with charitable
17
donations (Council of Europe/ERICarts, 2011). Corporate donations are often not completely
altruistic, however. On many occasions charitable activities and donations by organizations are part of
their own marketing strategy. A key motivation of corporate giving to the arts is concerned with the
promotion and enhancement of their own image (Leclair and Gordon, 2000).
Besides the public cultural funds, there are also numerous private funds in the Netherlands that
support the arts and culture sector. The financial resources of these private funds come from different
sources, such as donations, legacies and lottery revenues (SICA.nl, 2013). The function of these funds
is redistributive. Private funds are often focused on collecting resources to support and promote a
particular cause. Museums need to formally apply to receive funds from these private foundations. In
order to qualify, the applicant has to meet the conditions set in advance by the foundation. Therefore,
grants offered by private foundations often have a restrictive character. When the funds are granted to
the applicant, it has to allocate the funds towards the predetermined purpose.
How museums are financed in general has been described in this section. Three overall income
categories have been identified that provide Dutch museums with the monetary means to carry out
their activities and operations. ‘Financial benefits’ are found in various areas of the community.
However, along with the benefits, these financial arrangements may also have their downsides, which
will be discussed in the following chapter.
18
2.3 .The Risks of the Financial Arrangements
In the previous sections the why and how of museum finances have been discussed. As was explained,
in general, museums are dependent on three core revenue categories: government funding, earned
income and private contributions (Froelich, 1999). Ideally, the revenue-generating activities should
have a supporting function and not interfere with an organization’s core mission and primary
objective. However, in reality each financial arrangement has its negative side-effects and comes with
a various risks. In this section, the problems with museum finances are addressed.
2.3.1 Cross-subsidization
As mentioned earlier, museums are considered multi-output firms. They carry out a mix of activities in
the pursuit of their mission. The mission-related activities such as conservation, research and
exhibition are often loss-making activities which museums are not able to capitalize on. They are,
however, capable of capitalizing on other activities unrelated to the core mission. Ancillary or
commercial activities are often undertaken with the sole aim of making profits to fund the mission-
related, loss-making activities. This phenomenon is known as cross-subsidization (James, 2003).
According to James (2003), cross-subsidization is a ‘key fact of life for nonprofits, enabling
them to grow, to become more diversified, less dependent on government grants and private
donations, therefore less at risk and more sustainable’. The decline in government support for culture
in the Netherlands has been an incentive for museums to focus more on the cross-subsidization of their
core activities with commercial revenue. Often the arts and culture sector expressed their concerns
about the possible side effects of increased commercial activity. They fear that their social and cultural
objectives will become subordinate to revenue and profitability goals (Weisbrod, 1998). The risks of
commercialization are that nonprofit, charitable organizations start to resemble more and more for-
profit organizations and for-profit values may start to crowd-out intrinsic, nonprofit values. Cross-
subsidization may thus be conflicting with the organization’s core mission and social and cultural
values. However, as long as the commercial activities do not interfere with the mission of the
organization, this strategy will have a positive effect on the finances and long-term stability of the
organization and the sector at large (James, 2003).
2.3.2 Resource Dependence Theory
The extent to which the dependence on external resources affects an organization’s behavior is studied
in the Resource Dependence Theory as formalized by Pfeffer and Salancik (1978). In The External
Control of Organizations Pfeffer and Salancik (1978) regard organizations as being ‘embedded in
networks of interdependencies and social relationships’. Nonprofit organizations often obtain
(financial) resources from their environment, which makes them dependent on external sources. The
Resource Dependency Theory focuses on the political and social interdependencies between
19
nonprofits and the entities that provide resources to them (Thompson, 1967; Chang and Tuckman,
1994). Because of the dependence on their environment, external sources are able to exert a
considerable amount of power and control over an organization. As such, nonprofit organizations are
constrained by their environments and the way these organizations deliver their service is influenced
by their external resource providers (Pfeffer and Salancik, 1978).
The extent of environmental dependence (Froelich, 1999) is related to the proportion of the
contributed revenue by each external funder with respect to the total revenue of the organization. The
higher the proportion of contribution revenue to total revenue, the higher the dependence on this
particular contributor. Concerning this phenomenon Froelich (1999) states the following:
“The degree of dependence experienced by an organization is determined by the importance
and concentration of resources provided. Organizations that rely on a few resources for vital
inputs become highly dependent on and beholden to those providers for survival.”
Organizations that do not have many external funders are very dependent on those few funders that do
support their organization and will go far to maintain these funds in order to survive. This puts their
intrinsic motivation to the test (Frey, 1999) endangering the commitment to their actual cultural and
social mission and values. Especially in times of economic crisis or decline, certain sources of income
may be lost or may decrease drastically. If an organization is too dependent on these particular funding
sources this can seriously affect the stability of finances and endanger the survival of an organization.
Therefore, following the Resource Dependence Theory, adequate management of these resource
dependencies is a critical organizational function for nonprofits (Froelich, 1999).
Private contributions appear to be rather risk-free resources. The reciprocal, ‘no-strings-
attached’ character of the gift appears to be the ideal support for nonprofit organizations. As mention
earlier, the gift does not only benefit the organization in a financial way, but also represents
community support for the organization, belief in its mission and thus indicates the organization’s
legitimacy (Gronbjerg, 1993; Froelich, 1999). However, private contributions are also accompanied by
potential constraints and may have a restrictive nature. The first constraint of private contributions is
revenue volatility, which refers to the unstable and unpredictable character of private donations
(Gronbjerg, 1993; Froelich, 1999). Little control can be exercised over these types of funds and
fluctuations in private income are quite common and not easily anticipated. Another implication of
private contributions is known as goal displacement. Sometimes an organization will alter its goals
and activities to conform to the wishes of the contributor or restrictions of the contribution. As a
consequence the organization might lose sight of its core values and the pursuit of the actual mission
may be hindered. Moreover, costs concerned with fundraising efforts might not match the benefits
derived. When too much effort is allocated towards fundraising activities, the core activities might not
receive enough attention.
20
Dependence on government support does not come without risks either. On average, over 60 percent
of the income of Dutch museums is derived from government grants (Stichting Museana,
Museumcijfers 2011; Council of Europe/ERICarts, 2011). As such, without significant income from
other sources, the museum’s very existence depends on public support (Froelich, 1999). On the
positive side, government funding has been shown to be one of the most stable revenue sources of
nonprofit organizations (Gronbjerg, 1993). The volatility of public revenue is not of great concern.
However, government funding has also been related to risks as goal displacement, although to a lesser
extent than with private contributions (Froelich, 1999). With the continuous reevaluation of cultural
policy the MinOCW may change their funding criteria. In order to receive grants, cultural
organizations in the national infrastructure will adjust their own policy and programming to the
requirements of the state, Moreover, public support may cause shifts in attention to particular internal
processes instead of outcome objectives. This can eventually conflict with the organization’s mission
and goals. Also, the rules and regulations that the publicly funded organization is subjected to may
lead to bureaucratization and an increase in administrative tasks. As Froelich (1999) states,
government funding may lead to ‘highly formalized and standardized procedures, consuming efforts to
achieve compliance, and substantially reduced administrative autonomy’.
As has become clear, not only commercial activities, but every revenue strategy has its constraints.
Cross-subsidization of loss-making activities by undertaking profitable commercial activities may lead
to distortion of the organization’s mission (James, 2003). The Resource Dependence Theory explains
the restrictive character of the external funds. Private contributions are associated with revenue
volatility and goal displacement and public contributions with goal displacement, changes in
organizational processes and structure and reduced administrative autonomy. Basically, what is feared
is mission drift (Froelich, 1999). The organization’s legitimacy is at stake, when focus is steered away
from its social and cultural objectives. A case has to be made for the autonomy of museums. Less
dependence on external resources will provide the organization with more power to make their own
decisions and in getting their priorities straight. However, too much focus on cross-subsidization
might lead to convergence of non-profit values to for-profit values. Basically, for an organization to
remain its viability and integrity it has to be in control of its revenue sources rather than be controlled
by them. A good balance between the income sources will increase organizational autonomy and
financial stability, while at the same time safeguarding the core cultural and social values. A solution
for the problems with museum finances may be found in the theory of revenue diversification.
21
2.4 .Revenue Diversification
The current state of museum finances in the Netherlands and the Resource Dependence Theory have
led to the suggestion that a revenue diversification strategy might be beneficial for museums. The
concept of revenue diversification is derived from a theory from the field of finance known as the
Modern Portfolio Theory (Markowitz, 1952). In academic literature the portfolio theory and the
concept of revenue diversification have often been suggested as a revenue management strategy for
nonprofit organizations. In this chapter the concept and context of revenue diversification and the
academic findings will be discussed.
2.4.1 Modern Portfolio Theory
The study of finance focuses on the decision making processes that precede the allocation of money or
other financial assets by individuals and businesses. The main issue in finance is concerned with
finding the optimal balance between risk and return of certain investments. Every investment comes
with a relative amount of uncertainty or risk which financial experts like to call volatility. The more
certainty exists about the expected returns of an investment, the less risky the investment is. What it
all comes down to is making efficient financial decisions and finding the optimal balance between
perceived risk and expected return of an investment. This optimal balance can be achieved through the
spreading of risk by investing in different assets at the same time and forming a portfolio of assets.
This line of reasoning has led to the formation of the Modern Portfolio Theory (Markowitz, 1952).
The Modern Portfolio Theory is concerned with ‘the process by which an investor selects a
particular investment portfolio’ (Carroll and Stater, 2009). The Modern Portfolio Theory was first
introduced by Harry Markowitz (1952; 1991) who investigated the formation of an optimal market
portfolio. A portfolio is a carefully selected combination of different financial assets and its value is
determined by the sum of its parts (Berk and DeMarzo, 2007). According to the portfolio theory
investors are assumed to maximize the expected future returns on their investment and to minimize the
variance or risk of these returns. In this sense, an investor is a rent seeker who prefers to invest in
assets that are likely to yield him higher returns in the future. On the other hand, investors are risk
averse in that they have a preference for safe and certain income, rather than risky or volatile income.
The concepts of rent-seeking versus risk-averseness can be extended to the comparison of non-
profit and for-profit organizations. The for-profit organization is aimed at making a profit and can be
considered a ‘rent seeker’. Firms organized in this way are often more willing to take on some risk
with the aim of potentially increasing the profit margins. The non-profit organization, on the other
hand, is defined as a mission-driven organization whose main priority is not creating financial value,
but generating non-pecuniary social or cultural value. Their aim is to have sufficient financial means
to serve their mission and to be financially sustainable. Therefore, non-profit organizations are more
likely to adopt risk-averse revenue strategies that enhance financial security and stability.
22
The Modern Portfolio Theory is built upon the investment strategy that attempts to combine the best of
both worlds when it comes to rent-seeking and risk-aversion. This strategy is called ‘diversification’.
By adopting a diversification strategy, an investor carefully selects and balances various assets to be
included in a portfolio. The funds invested in the portfolio should be diversified among assets that
yield maximum expected returns. Through the law of large numbers, the actual returns of the portfolio
will remain close to the level of expected returns. Moreover, by diversifying among different assets,
risk is spread and reduced. The chances are slim that all assets turn out to yield negative returns. This
way a portfolio is created with reduced overall volatility for the same level of expected returns
(Markowitz, 1952; Williams, 1997). In sum, diversification leads to reduced risk and more stable
returns on your investments.
The underlying rules and ideas of the Modern Portfolio Theory and the diversification strategy can
also be applied to the revenue management of organizations with revenue portfolios that include
various sources of income, such as museums. Finding the optimal distribution of revenue streams is
one of the complex tasks of the financial managers of these organizations. A rational museum manager
should create a revenue portfolio of various revenue sources, which is considered efficient with respect
to the risks and returns of the different financial arrangements. In the following section I will discuss
the literature and findings on revenue diversification as a financial management strategy for nonprofit
organizations.
2.4.2 Revenue diversification for nonprofit organizations
In the past decades a considerable amount of research has concentrated on revenue structures and
revenue strategies in the nonprofit sector. A specific field of interest in these studies is aimed at
finding the optimal revenue mix or distribution of different income sources for nonprofit organizations.
As Chang and Tuckman (2010) state: “The study of revenue-related questions such as whether
diversified or concentrated revenues are best for optimal financial performance has provided a rich
source of new information and insights on wide-ranging topics related to nonprofit finance”. It has
often been suggested that the establishment of multiple and equally balanced revenue sources may
positively affect a nonprofit organization’s sustainability (Evans and Archer, 1968; Fuller and Farrel,
1987) and reliance on a single revenue source has often been discouraged (Chabotar, 1989).
Revenue diversification is a financial management strategy that can be adopted by risk-averse
organizations and is frequently suggested to organizations functioning in the nonprofit sector. Their
dependence on multiple sources makes nonprofits vulnerable to pressures by the resource providers.
Especially when organizations have concentrated revenues they are likely to be more dependent on
their primary revenue source (Carroll and Stater, 2009). Diversification of revenue has been shown to
reduce the control of the donors, giving the organization more freedom to realize its own objectives
and follow its own agenda (Chang and Tuckman, 1994). Therefore, a revenue diversification strategy
can be adopted to decrease the risks of resource dependence and increase organizational autonomy
23
(Froelich, 1999; Pfeffer and Salancik, 1978; Thompson, 1967), as well as organizational legitimacy
and community buy-in (Galaskiewicz and Bielefeld, 1998).
Many academics also focused on the potential of reducing financial vulnerability of nonprofit
organizations by adopting a revenue diversifying strategy (Carroll and Stater, 2009; Chang and
Tuckman, 1994; Froelich, 1999; Frumkin and Keating, 2002; Greenlee, 2002; Greenlee and Trussel,
2000; Gronbjerg, 1993; Keating et al., 2005). Reliance on few resources has been shown to put
nonprofits in an extremely delicate position (Froelich, 1999). Risks of insolvency and decline in
revenues have been determined as consequences of revenue concentration (Keating et al., 2005).
Nonprofits with diversified revenues have been identified as more likely to have a strong financial
position, than those with few revenue sources. Chang and Tuckman (1994) found direct significant
correlations between diversified revenues of nonprofit organizations and their financial health in terms
of asset size, operating margin, and growth of equity. Even though they recognized that their findings
were subject to a number of anomalies, the final outcome of their studies suggested that nonprofits
with diversified revenues generally had a stronger financial position relative to those with more
concentrated revenues. Moreover, Hager (2001) found that, especially among arts organizations,
higher levels of revenue concentration were connected to organizational demise. As such greater
diversification of revenue has been linked to organizational survival, whereas concentrated revenue is
associated with organizational failure (Hager, 2001).
Especially in times of economic downturn and uncertainty, nonprofit managers are focused on
controlling financial risk and reducing financial vulnerability of their organization (Chang and
Tuckman, 1990). Kotler et al (2008) discus the impact of economic cycles on museums by explaining
how the U.S. economic recession in the late 1980s affected the museum sector. Government funding
was cut back, corporate support was difficult to find because corporations were hit by the economic
downturn as well and simultaneously competition for corporate support increased. All income sources
are clearly affected by economic downturn. However, other sources like visitor revenues have been
found to remain virtually unaffected by economic impacts (Lindqvist, 2012). In this sense, the
different income sources of museums are countercyclical and may react in opposite ways to
fluctuations in the economic cycle. Therefore, equally distributing your income among different
sources may serve as insurance in times of economic distress.
Moreover, since changes in the economy or the environment are more likely to affect a single
revenue source than all sources at the same time nonprofits managers would benefit from diversifying
their revenue sources. Tuckman and Chang (1991) showed that ‘a nonprofit is more vulnerable to
revenue downturns if its revenue sources are limited than if they are diverse’. By following a strategy
with concentrated revenue streams greater swings in aggregate funds may be expected (Frumkin and
Keating, 2011). Diversification of revenues will increase a nonprofit’s resilience in times of economic
hardship. If an organization experiences a decline in any particular revenue source, the loss can be
balanced by focusing on increasing revenue from another source (Tuckman and Chang, 1991; Hager
24
2001). For example, when government funding is announced to be reduced, organizations can shift
their attention to another revenue source in their portfolio, such as commercial activities. It takes more
effort to establish a completely new revenue source than to shift between the different existing sources
in your portfolio. As such, other revenue sources may act as a buffer when losses are experienced in a
single revenue stream.
By creating a buffer, nonprofits are taking control over their income and enhancing the
stability and predictability of their revenue streams (Froelich, 1999). The stability and predictability of
income have been shown to be positively related to diversified revenues on various accounts (Carroll
and Stater, 2009; Tuckman and Chang, 1991, 1994; Froelich, 1999; Frumkin and Keating, 2002;
Greenlee, 2002; Greenlee and Trussel, 2000; Jegers, 1997). When revenues are stable over time
nonprofit financial managers know what income to expect in the future. In sum, through
diversification the volatility of revenue sources in a portfolio is minimized leading to higher levels of
predictability and stability of funding (Carroll and Stater, 2009; Chang and Tuckman, 1996; Froelich,
1999; Frumkin and Keating, 2002; Jegers, 1997). Revenue diversification has therefore often been
proposed as a risk-reducing strategy to increase chances of maintaining financial viability (Chang and
Tuckman, 1994; Greenlee, 2002; Greenlee and Trussel 2000; Gronbjerg, 1993; Tuckman and Chang,
1991).
Much of the academic evidence explains the positive effects of revenue diversification.
Obviously, opposing arguments have been found too. Increased revenue diversification may lead to
new problems and an increase in funding criteria posed by the various external funders (Froelich,
1999). Dependence on multiple funders means that an organization has to keep all funders satisfied
which makes their relationship management increasingly complex and its management more time-
consuming. The criteria of different funders may also be contradictory which may lead to tensions in
the organization and potential internal conflicts. As a result goal conflicts may arise, as well as mission
vagueness, or an unclear charitable purpose which may lead to erosion of legitimacy of the
organization.
Moreover, maintaining few revenue sources is less complicated. Revenue concentration has
often been associated with greater organizational efficiency and improved organizational performance
(Frumkin and Keating, 2002, 2011; Gronbjerg, 1992). Controlling resources and evaluating their
effects on the organization is easier with concentrated revenues. When revenues are more diversified
the evaluation of these effects is more complicated (Fischer et al., 2011, Froelich, 1999; Frumkin and
Keating, 2002, 2011; Gronbjerg, 1993). Despite the increased complexity associated with a
diversification strategy, Carroll and Stater (2009) showed that it still outweighed the instability related
to a single income source.
Crowding-out is one of the possible side-effects of revenue diversification. Maintaining
several resources may potentially lead to trade-offs between income streams. An increase in income
from commercial activities or private contributions may potentially crowd-out government funding.
25
Alternatively, generating money from different sources may be an incentive for individuals to
underestimate the necessity of donating money (Carroll and Stater, 2009; Fischer et al., 2011).
However, the evaluation of these trade-offs is difficult.
To sum up, much can be said in favor of a revenue diversifying strategy, but its disadvantages have to
be accounted for too. Whether it is an appropriate strategy for an organization depends on many
factors, internal as well as environmental. From an economical or financial perspective, diversification
seems to be the rational choice. Revenue will be increased, stability and predictability enhanced, and
revenue volatility is minimized. Moreover, diversification may lead to more organizational autonomy
and may give the organization more control over its mission-related activities. However, the exact
effects of diversification on the organization’s mission remain unclear. In reality, the situation is
incredibly complex and every organization should be critical and careful in balancing the costs and
benefits of increasing their revenue base.
Since museums in the Netherlands generally do not have a well-balanced income portfolio, I wonder
whether a revenue diversifying strategy is applicable in this case. Especially the revenues of state-
funded museums appear to be too concentrated on government funding and diversification of their
income portfolio is proposed. A shift needs to take place from concentration to diversification; from
public support to private support and the self-generation of income. Following the arguments for
revenue diversification, museums could benefit greatly from this development in terms of financial
stability. Whether revenue diversification can be associated with a stronger financial position in the
museum sector in the Netherlands requires further investigation. If so, then the government is right to
step back as main financier, and museums should not worry about their financial position but focus on
developing a new revenue model, with a more diversified revenue base, which will lead to more
financial sustainability.
26
3. Problem Statement, Method and Data
Introduction
The aim of this research is to explore whether revenue diversification is a valid financial management
strategy for museums in the Netherlands. I want to investigate whether there is room for improvement
with regard to the distribution between the different income sources in the revenue portfolio of two
museums in Amsterdam that receive a structural subsidy from the state (MinOCW): the Rijksmuseum
Amsterdam and the Van Gogh Museum. The analysis applied is twofold. First, I will run a regression
analysis to assess the impact of revenue diversification on revenue volatility for the museums.
Furthermore, I will evaluate the state of finances of these two art museums and compare their relative
revenue strategies and their financial positions. By performing this research I hope to identify
opportunities for the development of a sustainable revenue management model for (art) museums in
the Netherlands. One that is more adapted to the current and potential future state of government
support and to dynamic economic circumstances.
3.1. Problem statement and research questions
Many museums in the Netherlands rely heavily on government support and show high concentration
of revenue towards public subsidies. The central funding body for culture in the Netherlands, the
Ministry of Education, Culture and Science (MinOCW) changed its funding model in 2007 and
limited its support by creating a basic national infrastructure for culture including only a few national
cultural institutions that are eligible to apply for state support. Furthermore, over the past decades, the
state has gradually taken steps back to reduce its role as main financier of the arts and culture in the
Netherlands. The museum sector, which includes many institutions that greatly rely on support by the
authorities, is also required to reconsider their finances and change in the funding structure is
necessary for sustainability in the future. This is also stimulated by the Dutch government. With
respect to this the MinOCW states the following on its website:
“In the upcoming years, due to budget cuts that need to be made by the government, less
money will be available for the support of the arts and culture. Therefore the government
stimulates entrepreneurship in arts and culture, which will result in a sector that will be less
dependent on subsidies.”
The government encourages cultural institutions to generate more self-generated ‘own’ earned income,
such as income from ticket sales, from private foundations, or other sources, including sponsorships,
private donations and product sales.
27
In the 2012 the government announced that the annual budget for culture would be cut by 200 million
euro, equivalent to a 20% decrease in the available funds. Prior to that, in 2011 and 2012, the
government had already introduced cuts of 30 and 50 million euros, respectively (Cultuur in Beeld,
2012). These developments have encountered much resistance from the cultural sector, who argued
that the reduction in government support for the arts and culture will lead to a shift in emphasis from
cultural and social values towards financial and economical values, which will consequently lead to a
decrease in quality of the goods and services supplied in the cultural sector. They feel that the cuts in
government support will lead to commercialization of the cultural services.
Nonetheless, history shows that the dependence on government or public support has not
always been the way things were. Around the beginning of the 20th century, many of the big cultural
institutions in Amsterdam were founded as a result of private initiatives and financial support from
private sources. Surely, public support for the arts and culture was not a common activity up until the
second half of the 20th century. However, after the Second World War, public support for the arts and
culture grew in importance. Even more so, statistics point out that Dutch museums are among those
that receive the highest public subsidies in Europe (EGMUS, 2013). As such, the question is whether
museums in the Netherlands might have been too spoiled in the past; whether the past state and
structure of funding has become too embedded in the minds of cultural professionals who are now
unwilling to accept change. Museums in the Netherlands need to acknowledge the fact that their
‘sources of support are changing over time and the need to know what makes sense in designing new
fiscal strategies for the future’ (Young, 2007). I wonder whether a change in the funding structure and
a more diversified revenue portfolio and more market-orientation may in fact have a positive influence
on museums. Public support was not always a commonality, so why should it be now? What are the
opportunities for less reliance on the state and more on self-generated income or other sources of
revenue?
With this research I hope to provide evidential support which points out that a more equal
division between government support, earned income and private support will lead to more financial
stability and a stronger financial position for museums in the Netherlands. Moreover, I want to see
whether this research can provide any evidence showing that museums should not fear a more
commercial approach. The central question I will address in this study is:
‘Is revenue diversification a valid revenue management strategy for museums in Amsterdam that are
subsidized by the state (MinOCW)?’ (Q1)
In order to answer this question I will seek to answer a sub-question:
‘What is the impact of revenue diversification on the volatility of revenue in the Rijksmuseum and the
Van Gogh Museum?’ (Q1.1)
28
To be able to answer these questions I will compare the financial revenue data in the annual reports of
the Rijksmuseum and the Van Gogh Museum during the period of 2002-2011.
According to the revenue data in the annual reports, the Van Gogh Museum relies more on
commercial, earned income while the Rijksmuseum predominantly relies on government support.
Following the Resource Dependence Theory, less reliance on external funders and more reliance on
earned income gives an organization more control over its revenue sources and more financial
stability. This statement is tested by comparing the financial position of the two museums. If the Van
Gogh Museum outperforms the Rijksmuseum financially, then this might be an argument for
organizations to adopt a more commercial and market-oriented approach as is proposed by the
MinOCW. It would suggest to those organizations which rely greatly on government support that in
financial terms it would not necessarily be a negative change to become more commercial. This leads
me to a second research question:
‘Does the Van Gogh Museum have a stronger financial position than the Rijksmuseum in terms of
asset size, current ratio, operating margins, and equity balances?’ (Q2)
By assessing whether the Van Gogh Museum has a better financial position than the Rijksmuseum I
will investigate the opportunities of a more market-oriented, commercial revenue strategy. In the
following section I will explain the method used to address the research questions.
29
3.2. Method
In this study I will perform a comparative quantitative analysis of museum revenues of the
Rijksmuseum and the Van Gogh Museum in Amsterdam using secondary financial data from the
annual reports of the museums of the years 2002 up until 2011. Both museums are art museums that
receive a structural subsidy of the MinOCW and are located in the city of Amsterdam. Therefore,
following Carroll and Stater’s (2009) control variables, the environment of the museums in terms of
state tax laws, regional economy and culture of civic engagement is remained constant and they
operate in the same (urban) market. In terms of visitor numbers, quality of the collection, funding
environment and international appeal the museums are highly comparable.
In the first part of my analysis I will answer the sub-question (Q1.1) to be able to answer Q1. I
will investigate whether diversification of revenue is related to the volatility of revenue of the museum
by performing a regression analysis using the ordinary least squares method. The steps I will take in
part I are as follows:
i. Determine econometric model used for the analysis of the impact of revenue diversification on
revenue volatility;
ii. Determine values of the dependent variable, revenue volatility (RVt,i);
iii. Determine the value of the independent variable: diversification index (DI);
iv. Determine the value of the extraneous variables: debt margin (DM), total margin (TM), and
retained earnings (RE);
v. Run the regression analysis to see if there is a significant relationship.
In the second part of my analysis I will answer Q2 by comparing the financial position of the
Rijksmuseum and the Van Gogh Museum using four criteria: asset size, operating margin, and equity
balance. The measures are as proposed by Chang and Tuckman (1994). Current ratio is used as an
additional criterion. The following steps will be followed in part II of my analysis:
i. Determine annual asset size of both museums;
ii. Calculate the current ratios for both museums;
iii. Calculate the annual operating margin for both museums;
iv. Calculate the annual equity balances for both museums;
v. Compare financial data for both museums.
In the conclusion, I will combine the both outcomes of analysis I and II to answer the research
questions and see if there is any evidence for the positive influence of revenue diversification and a
market-oriented strategy on museum finances.
30
3.2.1. Analysis Part I
i. Econometric model
To the measure the impact of revenue diversification on revenue volatility I will perform a regression
analysis using the ordinary least squares regression method. The econometric model used is based on
the approach used by Carroll and Stater (2009), and is specified as follows:
RVt = α + β1DIt-1 + β2DMt-1,I + β3TMt-1,I + β4REt-1,I + εt
In this model revenue volatility at time t is the dependent variable and is denoted as RVt. Revenue
volatility is measured using the following independent variables: revenue diversification (DI), as the
main independent variable, and debt margin (DM), total margin (TM), and retained earnings (RE) as
extraneous variables. Lagged values of the independent variables are used to account for the impact of
time. A one-year lag is applied, under the assumption that there is a delay in the impact of the
independent variables on revenue volatility (RV). The hypothesis tested is as follows:
H1 Higher degrees of revenue diversification in t-1 will decrease revenue volatility in t.
It is hypothesized that lower values of the diversification index in year t-1 (equivalent to higher
degrees of diversification), will lead to lower rates of revenue volatility in year t (RVt). Or conversely,
higher revenue volatility in year t (RVt) is the result of higher values of the diversification index in the
previous year (equivalent to less diversification or more concentration of revenues). The sign of DIt-1
is therefore expected to be positive.
The other independent variables, besides DI, have been included to make the econometric
model stronger. Their impact on revenue volatility is not the main interest in this study; however, they
do help explain the reasons for revenue volatility in museum finances. Even more so, the outcomes of
their impact might be of interest. Debt margin (DM) and total margin (TM) are variables concerned
with the financial flexibility of the museums (Carroll and Stater, 2009). Museums that show greater
financial flexibility are considered to have reduced financial vulnerability and therefore less revenue
volatility. The variable of retained earnings (RE) is concerned with the growth potential of the
museums. Therefore museums with greater growth potential are expected to show lower rates of
revenue volatility (Carroll and Stater, 2009).
ii. Dependent variable: revenue volatility (RV)
The dependent variable in the regression model is revenue volatility (RV). I will calculate the annual
revenue volatility in terms of the museum’s ability the estimate expected revenue for the following
year. Following Carroll and Stater (2009), revenue volatility is defined as ‘the extent to which actual
31
revenue differs from expected revenue’. Museums with stable (or less volatile) revenues are better
capable of making estimations regarding future revenues. Greater control over the stability and
predictability of income has been linked to higher degrees of revenue diversification (Froelich, 1999).
By diversifying the revenue portfolio organizations can brace themselves against the potential
variations in the income sources (Frumkin and Keating, 2011). As such, the revenue volatility of
museums will decrease and their financial condition will improve when a revenue diversifying
strategy is applied (Carroll and Stater, 2009). This line of reasoning is in accordance with the portfolio
theory, where more diversification lowers volatility of returns (Markowitz, 1952).
In the income statements in the annual reports of the museums, aside from the actual
outcomes, the budgeted amounts, or the expected revenue, for the upcoming year is given for each
category. I will use these numbers to calculate the revenue volatility of both museums (i) in year t
(RVt,i) following Carroll and Stater’s (2009) approach, measuring revenue volatility as the deviation of
actual revenue from the budgeted amounts of expected revenue in absolute terms. The volatility is
determined in relative terms to take into account any variations in size of the organization. As such
RVt is calculated as the absolute deviation of actual income from its expected value, divided by the
expected total income:
RVt,i = abs[actual total income – expected total income] / expected total income
= abs[TIt,i – E(TIt,i)] / E(TIt,i)
iii. Independent variable: Diversification Index (DI)
In order to determine the diversification index for the museums, first of all a clear distinction has to be
made between the different income categories. As was explained in the theoretical framework,
museums generally rely on three different types of revenue sources: earned income, public
contributions and private contributions.
In this research, the dependence on the subsidy granted by the MinOCW is under
investigation. It is suggested that diversification of revenue has to take place, moving away from the
income from the MinOCW support and in the direction of earned income or other contributed income.
The revenue portfolios of museums should become more equally distributed. In the annual reports of
the Rijksmuseum and the Van Gogh Museum the income statements are divided into three categories
similar to the categories mentioned before: earned income, MinOCW subsidies, and other subsidies
and contributions. The latter category is defined as ‘other’ contributions instead of ‘private’
contributions because in some years this category might include some minor public contributions from
other public sources than the MinOCW. However, these public contributions are of incidental nature,
and are more the exception than the rule. What is investigated in this study is the degree to which the
museums rely on the MinOCW as a primary financier and what the impact of diversification is
towards the other categories. Therefore, the MinOCW income category is singled out as the major
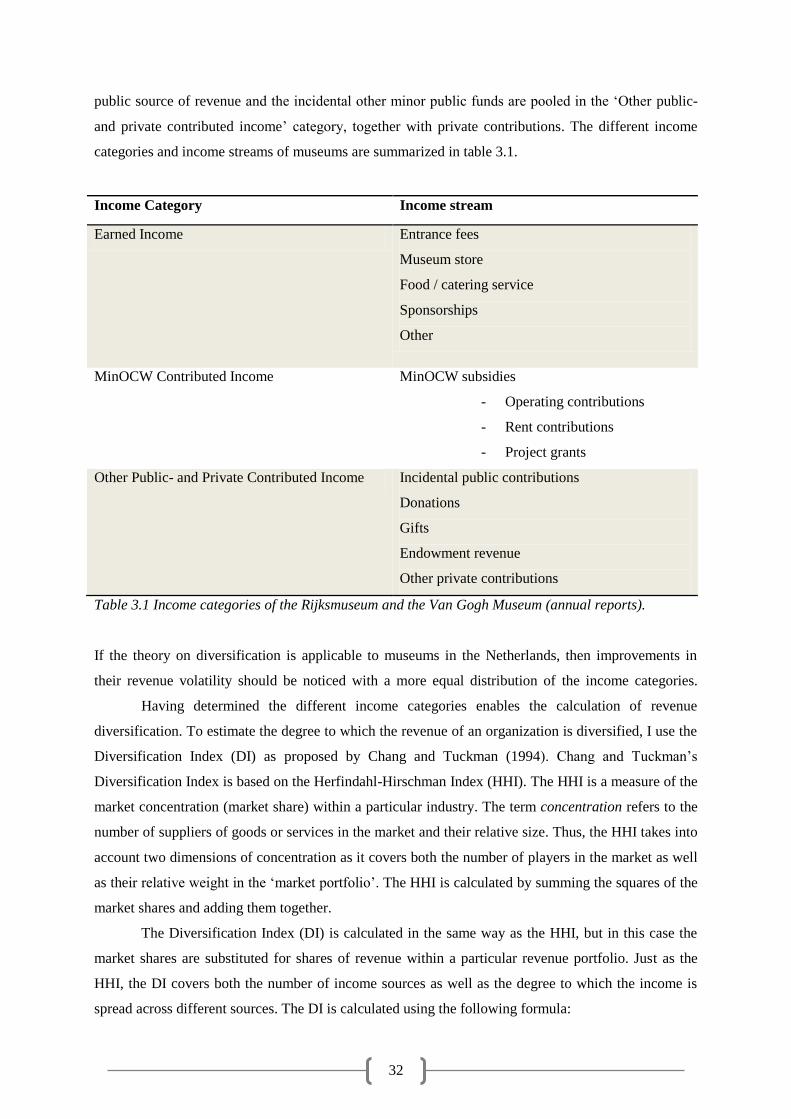
32
public source of revenue and the incidental other minor public funds are pooled in the ‘Other public-
and private contributed income’ category, together with private contributions. The different income
categories and income streams of museums are summarized in table 3.1.
Income Category Income stream
Earned Income Entrance fees
Museum store
Food / catering service
Sponsorships
Other
MinOCW Contributed Income
MinOCW subsidies
- Operating contributions
- Rent contributions
- Project grants
Other Public- and Private Contributed Income Incidental public contributions
Donations
Gifts
Endowment revenue
Other private contributions
Table 3.1 Income categories of the Rijksmuseum and the Van Gogh Museum (annual reports).
If the theory on diversification is applicable to museums in the Netherlands, then improvements in
their revenue volatility should be noticed with a more equal distribution of the income categories.
Having determined the different income categories enables the calculation of revenue
diversification. To estimate the degree to which the revenue of an organization is diversified, I use the
Diversification Index (DI) as proposed by Chang and Tuckman (1994). Chang and Tuckman’s
Diversification Index is based on the Herfindahl-Hirschman Index (HHI). The HHI is a measure of the
market concentration (market share) within a particular industry. The term concentration refers to the
number of suppliers of goods or services in the market and their relative size. Thus, the HHI takes into
account two dimensions of concentration as it covers both the number of players in the market as well
as their relative weight in the ‘market portfolio’. The HHI is calculated by summing the squares of the
market shares and adding them together.
The Diversification Index (DI) is calculated in the same way as the HHI, but in this case the
market shares are substituted for shares of revenue within a particular revenue portfolio. Just as the
HHI, the DI covers both the number of income sources as well as the degree to which the income is
spread across different sources. The DI is calculated using the following formula:
33
DI = (r1/R)2 + (r2/R)
2 + … + (rn/R)
2
N
= Σ (ri/R)2, [i = 1, 2, …, n],
i=1
where N represents the number of income sources, ri represents the revenue from the ith source, and R
is the total amount of revenue from all sources. The diversification index varies from 1/N, which
stands for completely diversified revenues (equal revenue from every category), to 1 which represents
completely concentrated revenue (all revenue from one source).
To measure the revenue diversification between the three different income categories of the
Rijksmuseum and the Van Gogh Museum the above formula is applied. The income categories of
‘earned income’, ‘MinOCW contributed income’, and ‘other public- and private contributed income’
are respectively denoted as ‘EI’, ‘MI’ and ‘OI’. Total income is denoted as ‘TI’. The formula used is
thus formulated as follows:
DI = (EI/TI)2 + (MI/TI)
2 + (OI/TI)
2
In this case, since N=3 (three income categories) the diversification index varies from 0,33 to 1, where
0,33 represents completely diversified revenue and 1 stands for completely concentrated revenue. In
other words, lower values of the DI represent more diversification of the revenue of the museum.
DI has a few noteworthy properties. DI will fall, when the number of income sources (N)
increases. More income sources thus leads to more revenue diversification (and less dependence on
each individual revenue source), irrespective of the equality of the distribution. DI will also fall,
however, when the number of income sources stays the same, but the distribution between different
income sources becomes more equal. Moreover, DI is not related to the size of an organization. It is a
relative measure of the composition of the revenue portfolio. As such the DI, just as the HHI, takes
into account the two dimensions of concentration in terms of the number of sources of income and the
extent to which the income is spread over the different categories.
iv. Extraneous variables
Three extraneous variables have been included in the econometric regression to improve fit of the
model. Extraneous variables are independent variables included in the model to control for the
potential effects of other variables on the dependent variable. However, the effects of the extraneous
variables in the model on the dependent variable are not the main focus of regression. They are simply
included to as an instrument to clarify the effect of the main independent variable on the dependent
variable. The extraneous variables included in the regression performed in this study are based on the
variables proposed by Carroll and Stater (2009): debt margin, total margin, and retained earnings.
34
Debt margin (DM)
The debt margin is a measure to assess an organization’s ability to meet its debt obligations. It is
calculated by dividing the end-of-year liabilities by the organizations end-of-year assets. When an
organization has a high amount of debt relative to its assets, it is considered to be less financially
flexible and more likely to experience revenue volatility. Therefore, greater values of the debt margin
are assumed to increase revenue volatility (Carroll and Stater, 2009).
Total margin (TM)
The total margin (TM) of an organization is a measure for the value of an organization in terms of net
assets relative to total revenue for the organization (Carroll and Stater, 2009). A higher proportion of
net assets to total revenue indicates that an organization is profitable and that much of the
organization’s revenue surplus is invested in the organization, hence increasing the organization’s
value. Higher values of the TM are therefore assumed to indicate greater financial flexibility and less
revenue volatility.
Retained earnings (RE)
An organization’s ability to retain its earnings is an indicator of potential growth. Organizations that
have greater potential for growth are assumed to have higher chances on success and organizational
longevity (Carroll and Stater, 2009). The retained earnings of an organization are the surpluses of
revenue over expenses. When an organization is able to generate greater surpluses, it has higher
chances on growth. Therefore, higher values of retained earnings are linked to greater growth potential
and organizational success, lowering the risk of revenue volatility.
v. Regression analysis
After having determined and calculated all the variables a regression analysis is performed to
investigate the impact of the independent variables (DI, DM, TM and RE) on the dependent variable
(RV). The regression analysis is performed using the ordinary least squares (OLS) regression method.
The program used to perform the regression analysis is EViews.
3.2.2. Analysis Part II
As mentioned before, in part II of my analysis I will address the second research question (Q2)
concerning the respective revenue strategies of the two museums. I will compare the financial position
of the Rijksmuseum and the Van Gogh Museum using several measures of financial health for
organizations based on the criteria used by Chang and Tuckman (1994): asset size, operating margin,
and equity balance. An additional measure is used concerning the assets the museums maintain
relative to their short-term debt liabilities: the current ratio. The criteria are determined for both
museums and compared to assess their relative financial positions. Overall, it is hypothesized that the
35
Van Gogh Museum, which is more dependent on commercial revenue and has a more market-oriented
revenue strategy, will outperform the Rijksmuseum, which has more donative revenue strategy.
Asset size
The first criterion used is concerned with the assets of an organization. Assets are tangible and
intangible items on an organization’s balance sheet that represent the economic value of the
organization (Oxford English Dictionary, [Def. 3], 2013). Museum assets are considered to include
buildings, inventory, current or liquid assets and other items of economic value. An ongoing issue in
the museum field is whether a museum’s collection should be included among their assets. Often these
collections represent enormous amounts of potential economic value. However, in reality museums
are often not allowed or capable of capitalizing on these objects. Even though no law exists in the
Netherlands that legally prohibits museums from deaccessioning, there is a generally accepted
guideline that restricts museums in the disposal of collection objects. The ICOM Code of Ethics for
Museums prescribes the minimum standard for museums and all museums that are members of the
ICOM have to apply to the code (ICOM.museum, 2013). Among the rules in the code is the principle
that ‘museum collections are held in public trust and may not be treated as a realizable asset’
(ICOM.com, 2013; Lewis, 2003). The code is also adopted by the Nederlandse Museumvereniging
and the museums connected to it. Therefore, most museums in the Netherlands are limited in their
deaccessioning possibilities and are not capable of considering their collection among their (balance
sheet) assets.
To measure the financial strength of a museum, only those assets are considered that are of
realizable economic value to the museum. The aim of Chang and Tuckman (1994) was to see which
organization owned more assets (and thus represented more economic value) and whether asset size
and diversification of revenues were positively related (i.e. more diversification leads to greater asset
base). Since this is not a relevant test to compare the financial strength of two organizations that differ
in size, an adapted test on the assets is applied. First, the growth of the organization’s total assets over
the past ten years is used as a measure of financial success. Asset growth or greater asset base is
assumed to be linked to more financial strength (Chang and Tuckman, 1994). The organization with
the most growth in assets is expected to be financially stronger.
Current ratio
In relation to the assets of the museums the yearly current ratio for both museums is calculated. The
current ratio is a financial measure which represents the capacity of an organization to cover short-
term debt with its current assets and is calculated by dividing current assets by short-term debt.
Current assets are typically cash or cash equivalents that can be quickly converted into cash, and are
often used to pay off short-term debt (within a year’s time). If the current ratio is equal to 1 then short-
term debt can be fully paid off with the organization’s current assets. However, a healthy balance of
36
the assets versus liabilities is reached by maintaining a somewhat higher current ratio of 1,5 to 2. On
the other hand, too high a current ratio is not regarded as a positive sign because this means that the
liquid assets are not allocated towards the pursuit of the mission. In strictly financial terms, however,
the higher the current ratio, the more financial flexibility the organization has. In this research, the
museum with the highest current ratio is better capable of meeting its debt obligations and is
considered to be financially stronger than the other museum.
Operating margin
The third measure of the financial position of the museums is the operating margin. The operating
margin is the relative surplus of revenue over expenditures and is calculated as total revenue minus
total expenditures divided by total revenue (Chang and Tuckman, 1994). As Chang and Tuckman
suggest, the accumulation of surpluses is essential for the continuity of nonprofit organizations (1994).
Greater surpluses of revenue over expenditures, relative to total revenue, are associated with a stronger
financial position. In other words, greater operating margins stand for a healthier organization. The
museum with the highest operating margin is considered to have a better financial position.
Equity balance
The final measure of financial health is the equity balance or the change in equity relative to the total
amount of equity in the prior year. An organization’s equity is equal to its total assets minus its
liabilities, also referred to as net assets. Higher levels of equity or net assets are usually related to
higher levels of available resources for financing future growth (Mayer et al., 2012). Financially
stronger organizations will have higher growth rates of equity as opposed to financially challenged
organizations. Equity is calculated by detracting total amount of liabilities from the total amount of
assets. To calculate the change rate of equity the amount of equity in year t-1 is detracted from the
amount in year t and the resulting number is divided by the amount of equity of year t-1. The resulting
number shows the percentage change in equity relative to the previous year. The organization with the
highest growth of equity or the most stable equity over time is considered financially stronger.
Comparison
The above described measures are calculated for both the Rijksmuseum and the Van Gogh Museum.
Subsequently the financial positions of the two museums will be compared on the basis of these
measures. Since the income portfolio of the Van Gogh Museum is more concentrated towards earned
income and the Rijksmuseum more towards the MinOCW subsidy, they are assumed to pursue
opposing revenue strategies. By comparing the financial positions of the two museums, it is
investigated whether there is any evidence pointing out that one strategy might be favored over
another.
37
3.3. Data
The revenue and financial data of the museums, as well as the data on the visitor numbers, is collected
from the annual reports of the Rijksmuseum in the years 2002-2011 and the Van Gogh Museum in the
years 2003-2011. All annual reports in the sample period (2002-2011) are published on the websites of
the museums and freely available. The 2002 annual report of the Van Gogh Museum was not
published online. However, I was able to collect the 2002 necessary data from the 2003 annual report.
In the following sections the Rijksmuseum and the Van Gogh Museum and their context will be
briefly discussed in order to create a background to the financial data.
Rijksmuseum
The Rijksmuseum was originally founded in 1800 as the National Art Gallery. At that time it was
situated in The Hague. The collection consisted mainly of paintings and historical objects. The current
building of the museum in Amsterdam was taken into use in 1885 (Rijksmuseum.nl, 2013).
As a national institution, the Rijksmuseum offers a representative overview of Dutch art and
history from the Middle Ages and onwards, as well as important aspects of European and Asian art
(Rijksmuseum.nl, 2013). Over the past decade the museum has attracted a little under one million
visitors per year on average (table 3.2). This is a remarkable amount, since the museum underwent an
extensive renovation from 2003 to 2013 and was only partially open during the project. Still
throughout the renovations the Rijksmuseum maintained operations. Visitor numbers declined
considerably during the renovation project as opposed to the years prior to the renovation (see figure
3.1). However, during renovation the visitor numbers remain relatively stable. The renovation project
was financed by the MinOCW and the museum itself (Rijksmuseum.nl, 2013). Therefore the revenue
data from the MinOCW might not be very representative of the normal situation. The fact that the
Rijksmuseum did not operate under normal circumstances in the past decade might cause anomalies in
the results of my research. This is a problem I will address in the ‘limitations’-section in this chapter.
The major part of the income of the Rijksmuseum falls in the category of public contributions.
In the past ten years the museum relied for 60-70% of its income on the MinOCW. Only 25-30% of its
revenues was self-generated. About 10-15% of the revenues comes from private sources. A note has to
be made, however, with respect to private income. In 2006 the museum decided that all charitable cash
flows accruing to the museum were to be placed in a fund (Rijksmuseum Fonds) prior to its allocation
to the museum. The fund is a separate legal entity with the aim of supporting the Rijksmuseum in the
broadest sense of the word. From the proceeds of the fund's assets, contributions are allocated to the
museum for research projects, restorations, education and the purchase of paintings, prints, books,
photographs, or other objects that enrich the collection. In this paper I decided to limit my study to all
revenue stated in the annual reports, including only the allocations of the fund to the museum.
38
Van Gogh Museum
The Van Gogh Museum opened in 1973. The museum collects and maintains western paintings,
sculptures, drawings and graphic works from the period 1840 to 1920. The core of the collection is
shaped by the legacy of Dutch modern painter Vincent van Gogh. The Van Gogh Museum houses the
largest collection of his work in the world. Surrounding and supporting this core collection, the
museum presents a broad overview of 19th-century art (Vangoghmuseum.nl, 2013).
Throughout the sample period the Van Gogh Museum has attracted circa one and a half
million visitors annually. With respect to visitor numbers the Van Gogh Museum outperforms any
other museum in the Netherlands. What is interesting about the visitor numbers in table 3.2 and figure
3.1 is that the decline in visitor numbers at the Rijksmuseum during the renovation project coincides
with an increase in attendance for the Van Gogh Museum. It appears that the Van Gogh Museum
might have captured some of the loss in visitors by the Rijksmuseum.
The high visitor numbers make that the majority of the revenue of the Van Gogh Museum is
generated on its own efforts via ticket sales and commercial activities. About 60-70% of its revenues
falls in the category of earned income. The subsidy of the MinOCW only accounts for 30% of total
revenue. Equivalent to the Rijksmuseum, the Van Gogh Museum also receives the minor part (about
10%) of its revenue from private sources. It does not operate a separate fund. However, the Van Gogh
Museum does own a subsidiary company called Van Gogh Museum Enterprises B.V., which is
responsible for raising funds to support to the programming of the Van Gogh Museum. It develops,
manufactures and sells products related to the collection and exhibition, manages and operates the
image library of the museum, takes care of the pre-sale of admission tickets to travel agencies and
hotels, and operates an external museum shop. The funds flowing from this subsidiary company are
thus mainly raised in a commercial way and highlight their market-oriented approach.
Time span
The time span used to explore the impact of revenue diversification ranges from 2002 to 2011. The
choice for this particular sample period is due to the availability of the data. As mentioned earlier, the
available annual reports of the Van Gogh Museum only go back to 2003. The 2002 data were derived
from the 2003 annual report. The Rijksmuseum has published more annual reports online and more
revenue data is available. However, to align with the data of the Van Gogh Museum, I chose 2002 as a
starting point. This way the sample period is constant for both museums and hence the political and
economic circumstances remain constant too.
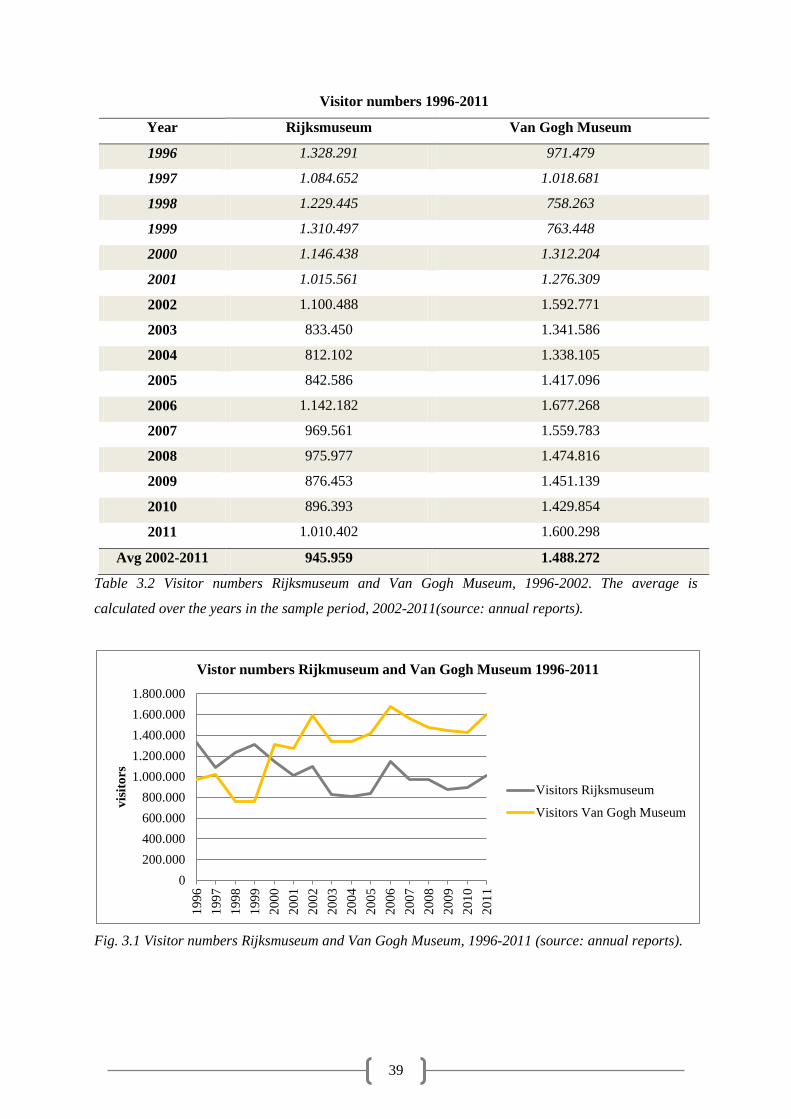
39
Visitor numbers 1996-2011
Year Rijksmuseum Van Gogh Museum
1996 1.328.291 971.479
1997 1.084.652 1.018.681
1998 1.229.445 758.263
1999 1.310.497 763.448
2000 1.146.438 1.312.204
2001 1.015.561 1.276.309
2002 1.100.488 1.592.771
2003 833.450 1.341.586
2004 812.102 1.338.105
2005 842.586 1.417.096
2006 1.142.182 1.677.268
2007 969.561 1.559.783
2008 975.977 1.474.816
2009 876.453 1.451.139
2010 896.393 1.429.854
2011 1.010.402 1.600.298
Avg 2002-2011 945.959 1.488.272
Table 3.2 Visitor numbers Rijksmuseum and Van Gogh Museum, 1996-2002. The average is
calculated over the years in the sample period, 2002-2011(source: annual reports).
Fig. 3.1 Visitor numbers Rijksmuseum and Van Gogh Museum, 1996-2011 (source: annual reports).
0
200.000
400.000
600.000
800.000
1.000.000
1.200.000
1.400.000
1.600.000
1.800.000
199
6
199
7
199
8
199
9
200
0
200
1
200
2
200
3
200
4
200
5
200
6
200
7
200
8
200
9
201
0
201
1
vis
ito
rs
Vistor numbers Rijkmuseum and Van Gogh Museum 1996-2011
Visitors Rijksmuseum
Visitors Van Gogh Museum
40
3.4. Limitations of research
Throughout the design of the method and the selection process of the data several limitations were
encountered. The primary limitations are concerned with the sample. The focus on only two museums
might cause problems with the external validity and possibility of generalization of the results.
Furthermore, even though the Rijksmuseum and the Van Gogh Museum seem comparable, many
factors are at stake which challenges the comparability. In particular the ten-year renovation of the
Rijksmuseum makes their financial situation abnormal, and perhaps too distinctive of that of the Van
Gogh Museum. Aside from the limitations concerned with the generalization of the results, the lack of
data will probably be a constraint in this study. As only the data from the past ten years of two
museums were usable, the sample size is likely to be too small. The regression analysis might
therefore lack significance.
Another limit of the research can be found in the annual reports of the museums. Even though
the annual reports provide extensive information and are subject to external audits and control, their
validity may be questioned. In the data collection process I encountered some complicating factors
with respect to the financial reporting and some differences between the two museums were noticed.
Where the Van Gogh Museum only specifies overall revenue categories, the Rijksmuseum
distinguishes more between sub-categories and gives greater insight into the details of their income
sources.
Moreover, the way of reporting of the museums is not always consistent throughout the
sample period. The Van Gogh Museum is relatively consistent and clear in their way of reporting. The
Rijksmuseum, on the other hand, is not very consistent in their way of reporting. The structure used
for their income statements varies considerably from year to year. Different posts in the income
statement are moved across the three overall income categories. For example, in the first years of the
sample period an income post called ‘contributions for art acquisitions’ is reported in the ‘earned
income’-category. In the latter years, the same post is accounted for in the ‘other public- and private
contributions’-category. Moreover, the ‘contributions for art acquisitions’-category is often a relatively
significant revenue source. However, since this category includes contributions, and because in the
majority of the years it is in fact pooled under contributed income by the Rijksmuseum, I chose to
classify the ‘contributions for art acquisitions’ in the latter category in the years 2002-2004, or in this
case, in the ‘Other Contributions’-category.
Furthermore, the reported income amounts are subject to change. For example, in the 2003
annual report of the Rijksmuseum the annual revenue numbers are reported in the income statement.
The revenue numbers for 2003 are also mentioned in the 2004 annual report, as a means for
comparison form year to year. However, the revenue numbers of the year 2003 in the 2003 annual
report do not correspond with the 2003 revenue numbers in the 2004 annual report. For an
unexplained reason the museum decided to make (minor) adjustments in the revenue numbers of 2003
41
a year later in the 2004 annual report. This phenomenon happened a few times in the sample period in
both museums. However, because the differences in revenue numbers were not significantly large, the
inconsistency in financial reporting was not considered a major constraint. The inconsistency in
reporting is a challenge in defining which numbers are the correct ones. I decided to use the revenue
numbers as they are reported in the year itself, with the exception of the 2002 revenue numbers for the
Van Gogh Museum, which were derived from the 2003 annual report.
Aside from the above limitations with the annual reports of the museums, another problem
arose with the Rijksmuseum, which not only has an annual report for the museum, but also has a
separate annual report for the Rijksmuseum Fonds (Rijksmuseum Fund). As explained earlier, this
fund is an independent foundation which supports the Rijksmuseum in the broadest sense of the word.
In the museum’s regular annual report these contributions are accounted for as revenue from an
external funder. Even though the Rijksmuseum Fund is considered an independent organization, the
funds they manage can only be allocated to the Rijksmuseum. Therefore, the Rijksmuseum Fund
merely functions as an intermediary for the charitable donations made to the museum. In this study,
however, I decided not to take the Rijksmuseum Fund into account because these are not readily
available revenues. What is investigated in this paper are the revenues that are used for operational
activities which are accounted for in the income statements of the museum. However, the existence of
the Rijksmuseum Fund, and the lack of such a fund for the Van Gogh Museum does make financial
matters different in reality and posed a limit to the comparison of their financial position.
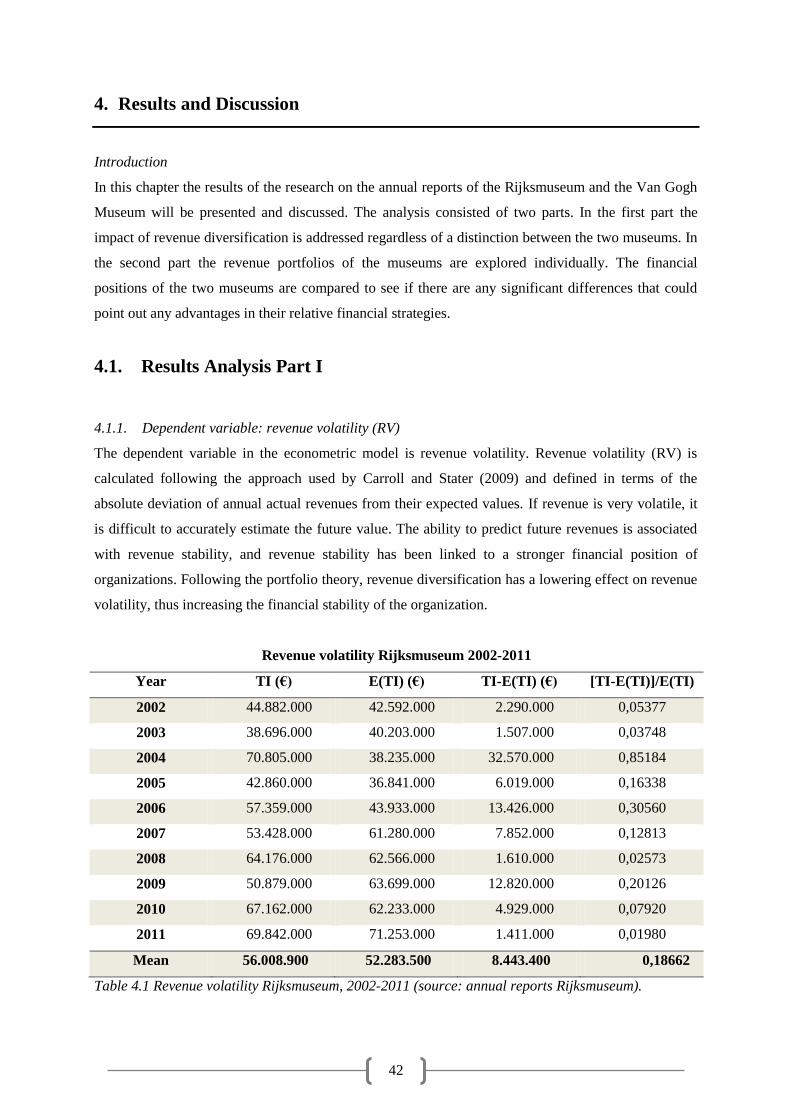
42
4. Results and Discussion
Introduction
In this chapter the results of the research on the annual reports of the Rijksmuseum and the Van Gogh
Museum will be presented and discussed. The analysis consisted of two parts. In the first part the
impact of revenue diversification is addressed regardless of a distinction between the two museums. In
the second part the revenue portfolios of the museums are explored individually. The financial
positions of the two museums are compared to see if there are any significant differences that could
point out any advantages in their relative financial strategies.
4.1. Results Analysis Part I
4.1.1. Dependent variable: revenue volatility (RV)
The dependent variable in the econometric model is revenue volatility. Revenue volatility (RV) is
calculated following the approach used by Carroll and Stater (2009) and defined in terms of the
absolute deviation of annual actual revenues from their expected values. If revenue is very volatile, it
is difficult to accurately estimate the future value. The ability to predict future revenues is associated
with revenue stability, and revenue stability has been linked to a stronger financial position of
organizations. Following the portfolio theory, revenue diversification has a lowering effect on revenue
volatility, thus increasing the financial stability of the organization.
Revenue volatility Rijksmuseum 2002-2011
Year TI (€) E(TI) (€) TI-E(TI) (€) [TI-E(TI)]/E(TI)
2002 44.882.000 42.592.000 2.290.000 0,05377
2003 38.696.000 40.203.000 1.507.000 0,03748
2004 70.805.000 38.235.000 32.570.000 0,85184
2005 42.860.000 36.841.000 6.019.000 0,16338
2006 57.359.000 43.933.000 13.426.000 0,30560
2007 53.428.000 61.280.000 7.852.000 0,12813
2008 64.176.000 62.566.000 1.610.000 0,02573
2009 50.879.000 63.699.000 12.820.000 0,20126
2010 67.162.000 62.233.000 4.929.000 0,07920
2011 69.842.000 71.253.000 1.411.000 0,01980
Mean 56.008.900 52.283.500 8.443.400 0,18662
Table 4.1 Revenue volatility Rijksmuseum, 2002-2011 (source: annual reports Rijksmuseum).
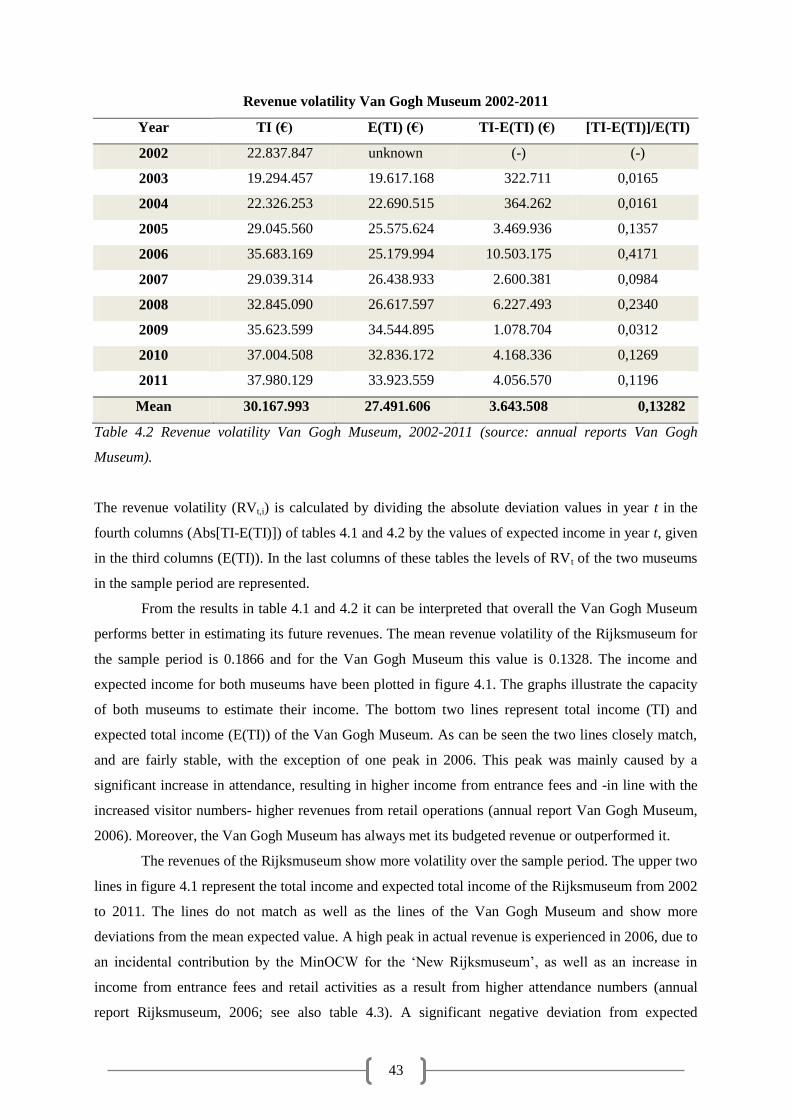
43
Revenue volatility Van Gogh Museum 2002-2011
Year TI (€) E(TI) (€) TI-E(TI) (€) [TI-E(TI)]/E(TI)
2002 22.837.847 unknown (-) (-)
2003 19.294.457 19.617.168 322.711 0,0165
2004 22.326.253 22.690.515 364.262 0,0161
2005 29.045.560 25.575.624 3.469.936 0,1357
2006 35.683.169 25.179.994 10.503.175 0,4171
2007 29.039.314 26.438.933 2.600.381 0,0984
2008 32.845.090 26.617.597 6.227.493 0,2340
2009 35.623.599 34.544.895 1.078.704 0,0312
2010 37.004.508 32.836.172 4.168.336 0,1269
2011 37.980.129 33.923.559 4.056.570 0,1196
Mean 30.167.993 27.491.606 3.643.508 0,13282
Table 4.2 Revenue volatility Van Gogh Museum, 2002-2011 (source: annual reports Van Gogh
Museum).
The revenue volatility (RVt,i) is calculated by dividing the absolute deviation values in year t in the
fourth columns (Abs[TI-E(TI)]) of tables 4.1 and 4.2 by the values of expected income in year t, given
in the third columns (E(TI)). In the last columns of these tables the levels of RVt of the two museums
in the sample period are represented.
From the results in table 4.1 and 4.2 it can be interpreted that overall the Van Gogh Museum
performs better in estimating its future revenues. The mean revenue volatility of the Rijksmuseum for
the sample period is 0.1866 and for the Van Gogh Museum this value is 0.1328. The income and
expected income for both museums have been plotted in figure 4.1. The graphs illustrate the capacity
of both museums to estimate their income. The bottom two lines represent total income (TI) and
expected total income (E(TI)) of the Van Gogh Museum. As can be seen the two lines closely match,
and are fairly stable, with the exception of one peak in 2006. This peak was mainly caused by a
significant increase in attendance, resulting in higher income from entrance fees and -in line with the
increased visitor numbers- higher revenues from retail operations (annual report Van Gogh Museum,
2006). Moreover, the Van Gogh Museum has always met its budgeted revenue or outperformed it.
The revenues of the Rijksmuseum show more volatility over the sample period. The upper two
lines in figure 4.1 represent the total income and expected total income of the Rijksmuseum from 2002
to 2011. The lines do not match as well as the lines of the Van Gogh Museum and show more
deviations from the mean expected value. A high peak in actual revenue is experienced in 2006, due to
an incidental contribution by the MinOCW for the ‘New Rijksmuseum’, as well as an increase in
income from entrance fees and retail activities as a result from higher attendance numbers (annual
report Rijksmuseum, 2006; see also table 4.3). A significant negative deviation from expected
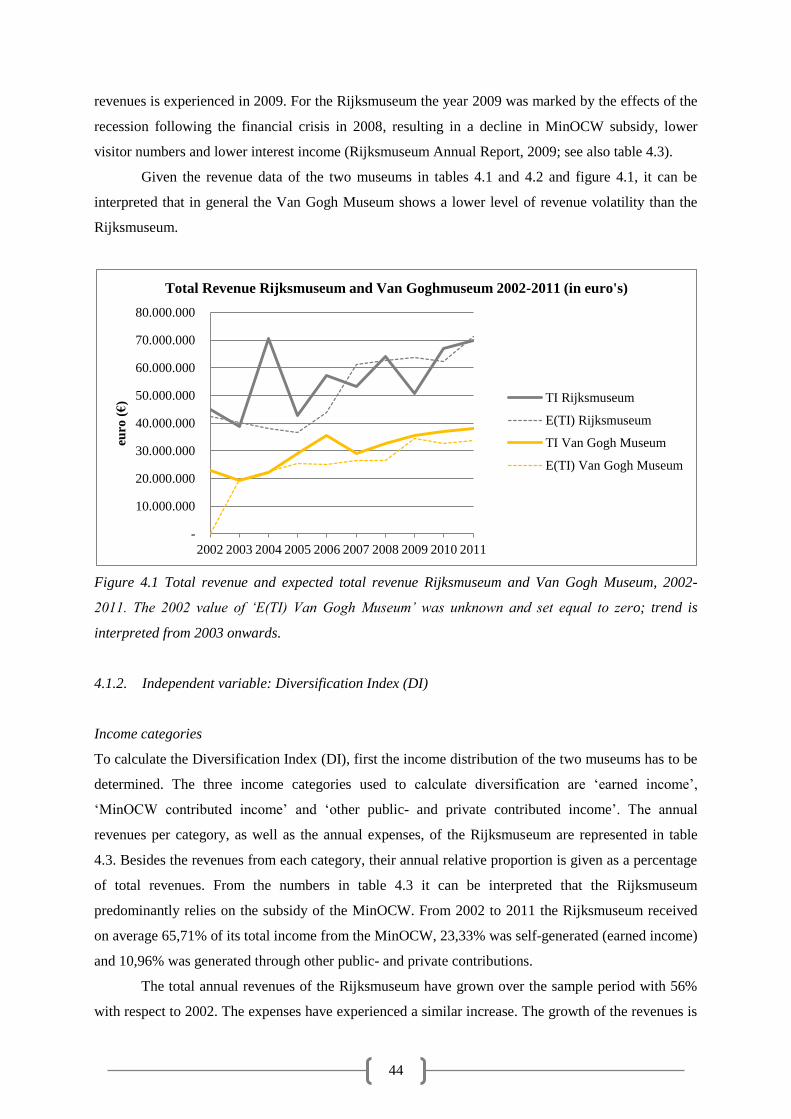
44
revenues is experienced in 2009. For the Rijksmuseum the year 2009 was marked by the effects of the
recession following the financial crisis in 2008, resulting in a decline in MinOCW subsidy, lower
visitor numbers and lower interest income (Rijksmuseum Annual Report, 2009; see also table 4.3).
Given the revenue data of the two museums in tables 4.1 and 4.2 and figure 4.1, it can be
interpreted that in general the Van Gogh Museum shows a lower level of revenue volatility than the
Rijksmuseum.
Figure 4.1 Total revenue and expected total revenue Rijksmuseum and Van Gogh Museum, 2002-
2011. The 2002 value of ‘E(TI) Van Gogh Museum’ was unknown and set equal to zero; trend is
interpreted from 2003 onwards.
4.1.2. Independent variable: Diversification Index (DI)
Income categories
To calculate the Diversification Index (DI), first the income distribution of the two museums has to be
determined. The three income categories used to calculate diversification are ‘earned income’,
‘MinOCW contributed income’ and ‘other public- and private contributed income’. The annual
revenues per category, as well as the annual expenses, of the Rijksmuseum are represented in table
4.3. Besides the revenues from each category, their annual relative proportion is given as a percentage
of total revenues. From the numbers in table 4.3 it can be interpreted that the Rijksmuseum
predominantly relies on the subsidy of the MinOCW. From 2002 to 2011 the Rijksmuseum received
on average 65,71% of its total income from the MinOCW, 23,33% was self-generated (earned income)
and 10,96% was generated through other public- and private contributions.
The total annual revenues of the Rijksmuseum have grown over the sample period with 56%
with respect to 2002. The expenses have experienced a similar increase. The growth of the revenues is
-
10.000.000
20.000.000
30.000.000
40.000.000
50.000.000
60.000.000
70.000.000
80.000.000
2002 2003 2004 2005 2006 2007 2008 2009 2010 2011
euro
(€
)
Total Revenue Rijksmuseum and Van Goghmuseum 2002-2011 (in euro's)
TI Rijksmuseum
E(TI) Rijksmuseum
TI Van Gogh Museum
E(TI) Van Gogh Museum
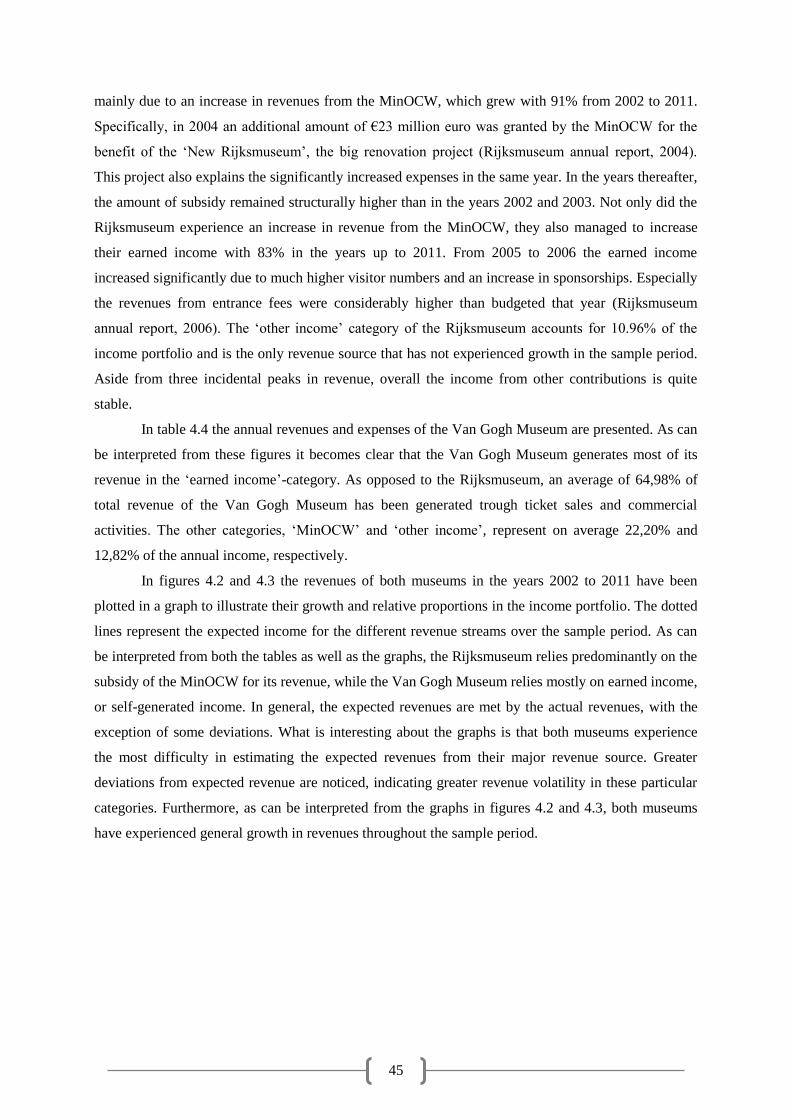
45
mainly due to an increase in revenues from the MinOCW, which grew with 91% from 2002 to 2011.
Specifically, in 2004 an additional amount of €23 million euro was granted by the MinOCW for the
benefit of the ‘New Rijksmuseum’, the big renovation project (Rijksmuseum annual report, 2004).
This project also explains the significantly increased expenses in the same year. In the years thereafter,
the amount of subsidy remained structurally higher than in the years 2002 and 2003. Not only did the
Rijksmuseum experience an increase in revenue from the MinOCW, they also managed to increase
their earned income with 83% in the years up to 2011. From 2005 to 2006 the earned income
increased significantly due to much higher visitor numbers and an increase in sponsorships. Especially
the revenues from entrance fees were considerably higher than budgeted that year (Rijksmuseum
annual report, 2006). The ‘other income’ category of the Rijksmuseum accounts for 10.96% of the
income portfolio and is the only revenue source that has not experienced growth in the sample period.
Aside from three incidental peaks in revenue, overall the income from other contributions is quite
stable.
In table 4.4 the annual revenues and expenses of the Van Gogh Museum are presented. As can
be interpreted from these figures it becomes clear that the Van Gogh Museum generates most of its
revenue in the ‘earned income’-category. As opposed to the Rijksmuseum, an average of 64,98% of
total revenue of the Van Gogh Museum has been generated trough ticket sales and commercial
activities. The other categories, ‘MinOCW’ and ‘other income’, represent on average 22,20% and
12,82% of the annual income, respectively.
In figures 4.2 and 4.3 the revenues of both museums in the years 2002 to 2011 have been
plotted in a graph to illustrate their growth and relative proportions in the income portfolio. The dotted
lines represent the expected income for the different revenue streams over the sample period. As can
be interpreted from both the tables as well as the graphs, the Rijksmuseum relies predominantly on the
subsidy of the MinOCW for its revenue, while the Van Gogh Museum relies mostly on earned income,
or self-generated income. In general, the expected revenues are met by the actual revenues, with the
exception of some deviations. What is interesting about the graphs is that both museums experience
the most difficulty in estimating the expected revenues from their major revenue source. Greater
deviations from expected revenue are noticed, indicating greater revenue volatility in these particular
categories. Furthermore, as can be interpreted from the graphs in figures 4.2 and 4.3, both museums
have experienced general growth in revenues throughout the sample period.
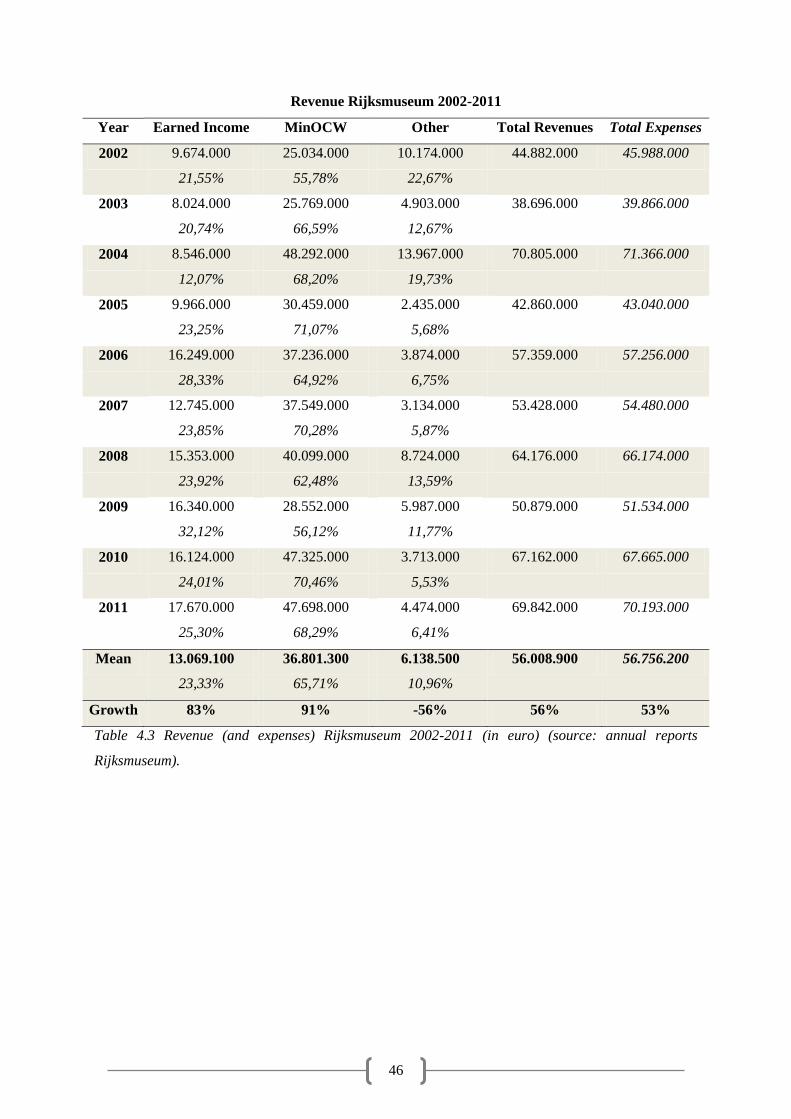
46
Revenue Rijksmuseum 2002-2011
Year Earned Income MinOCW Other Total Revenues Total Expenses
2002 9.674.000 25.034.000 10.174.000 44.882.000 45.988.000
21,55% 55,78% 22,67%
2003 8.024.000 25.769.000 4.903.000 38.696.000 39.866.000
20,74% 66,59% 12,67%
2004 8.546.000 48.292.000 13.967.000 70.805.000 71.366.000
12,07% 68,20% 19,73%
2005 9.966.000 30.459.000 2.435.000 42.860.000 43.040.000
23,25% 71,07% 5,68%
2006 16.249.000 37.236.000 3.874.000 57.359.000 57.256.000
28,33% 64,92% 6,75%
2007 12.745.000 37.549.000 3.134.000 53.428.000 54.480.000
23,85% 70,28% 5,87%
2008 15.353.000 40.099.000 8.724.000 64.176.000 66.174.000
23,92% 62,48% 13,59%
2009 16.340.000 28.552.000 5.987.000 50.879.000 51.534.000
32,12% 56,12% 11,77%
2010 16.124.000 47.325.000 3.713.000 67.162.000 67.665.000
24,01% 70,46% 5,53%
2011 17.670.000 47.698.000 4.474.000 69.842.000 70.193.000
25,30% 68,29% 6,41%
Mean 13.069.100 36.801.300 6.138.500 56.008.900 56.756.200
23,33% 65,71% 10,96%
Growth 83% 91% -56% 56% 53%
Table 4.3 Revenue (and expenses) Rijksmuseum 2002-2011 (in euro) (source: annual reports
Rijksmuseum).
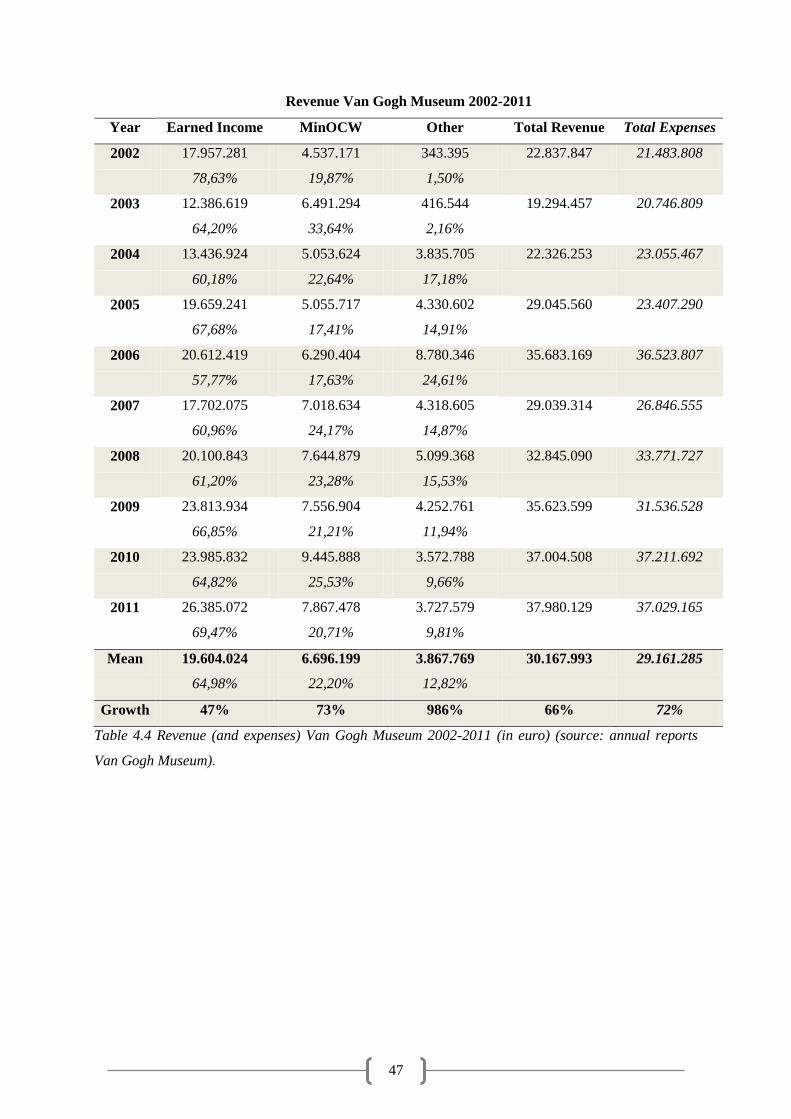
47
Revenue Van Gogh Museum 2002-2011
Year Earned Income MinOCW Other Total Revenue Total Expenses
2002 17.957.281 4.537.171 343.395 22.837.847 21.483.808
78,63% 19,87% 1,50%
2003 12.386.619 6.491.294 416.544 19.294.457 20.746.809
64,20% 33,64% 2,16%
2004 13.436.924 5.053.624 3.835.705 22.326.253 23.055.467
60,18% 22,64% 17,18%
2005 19.659.241 5.055.717 4.330.602 29.045.560 23.407.290
67,68% 17,41% 14,91%
2006 20.612.419 6.290.404 8.780.346 35.683.169 36.523.807
57,77% 17,63% 24,61%
2007 17.702.075 7.018.634 4.318.605 29.039.314 26.846.555
60,96% 24,17% 14,87%
2008 20.100.843 7.644.879 5.099.368 32.845.090 33.771.727
61,20% 23,28% 15,53%
2009 23.813.934 7.556.904 4.252.761 35.623.599 31.536.528
66,85% 21,21% 11,94%
2010 23.985.832 9.445.888 3.572.788 37.004.508 37.211.692
64,82% 25,53% 9,66%
2011 26.385.072 7.867.478 3.727.579 37.980.129 37.029.165
69,47% 20,71% 9,81%
Mean 19.604.024 6.696.199 3.867.769 30.167.993 29.161.285
64,98% 22,20% 12,82%
Growth 47% 73% 986% 66% 72%
Table 4.4 Revenue (and expenses) Van Gogh Museum 2002-2011 (in euro) (source: annual reports
Van Gogh Museum).
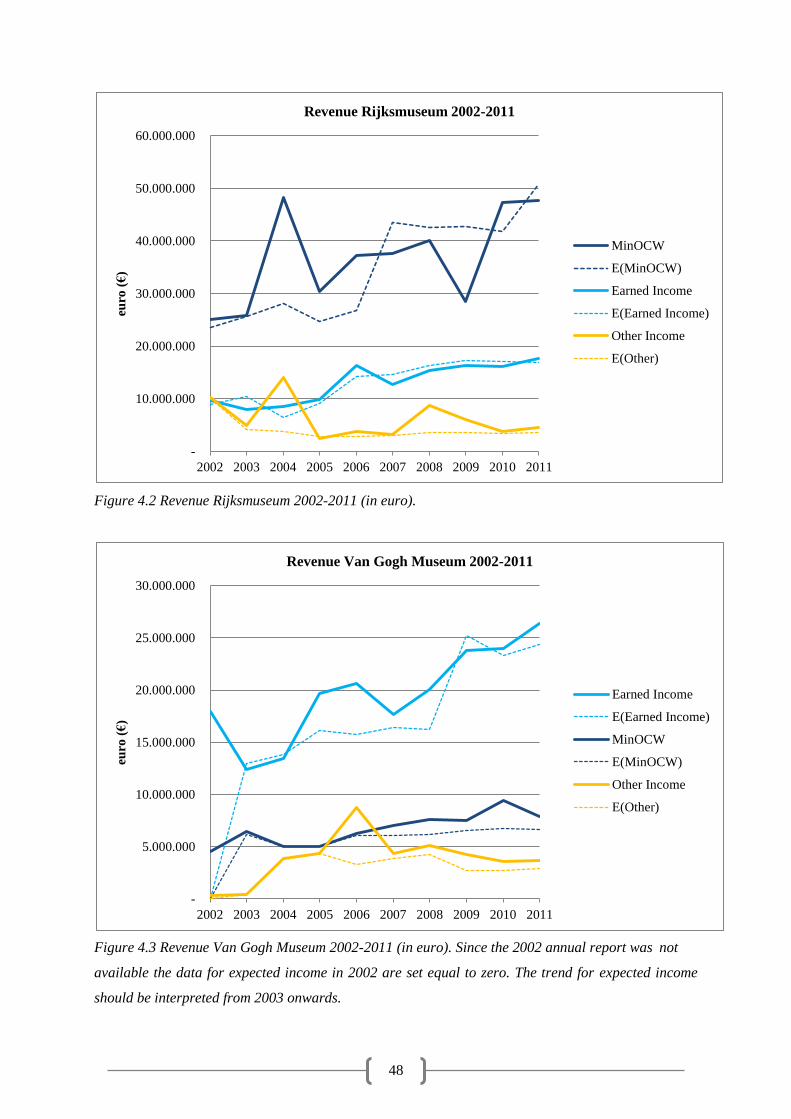
48
Figure 4.2 Revenue Rijksmuseum 2002-2011 (in euro).
Figure 4.3 Revenue Van Gogh Museum 2002-2011 (in euro). Since the 2002 annual report was not
available the data for expected income in 2002 are set equal to zero. The trend for expected income
should be interpreted from 2003 onwards.
-
10.000.000
20.000.000
30.000.000
40.000.000
50.000.000
60.000.000
2002 2003 2004 2005 2006 2007 2008 2009 2010 2011
euro
(€
) Revenue Rijksmuseum 2002-2011
MinOCW
E(MinOCW)
Earned Income
E(Earned Income)
Other Income
E(Other)
-
5.000.000
10.000.000
15.000.000
20.000.000
25.000.000
30.000.000
2002 2003 2004 2005 2006 2007 2008 2009 2010 2011
euro
(€
)
Revenue Van Gogh Museum 2002-2011
Earned Income
E(Earned Income)
MinOCW
E(MinOCW)
Other Income
E(Other)
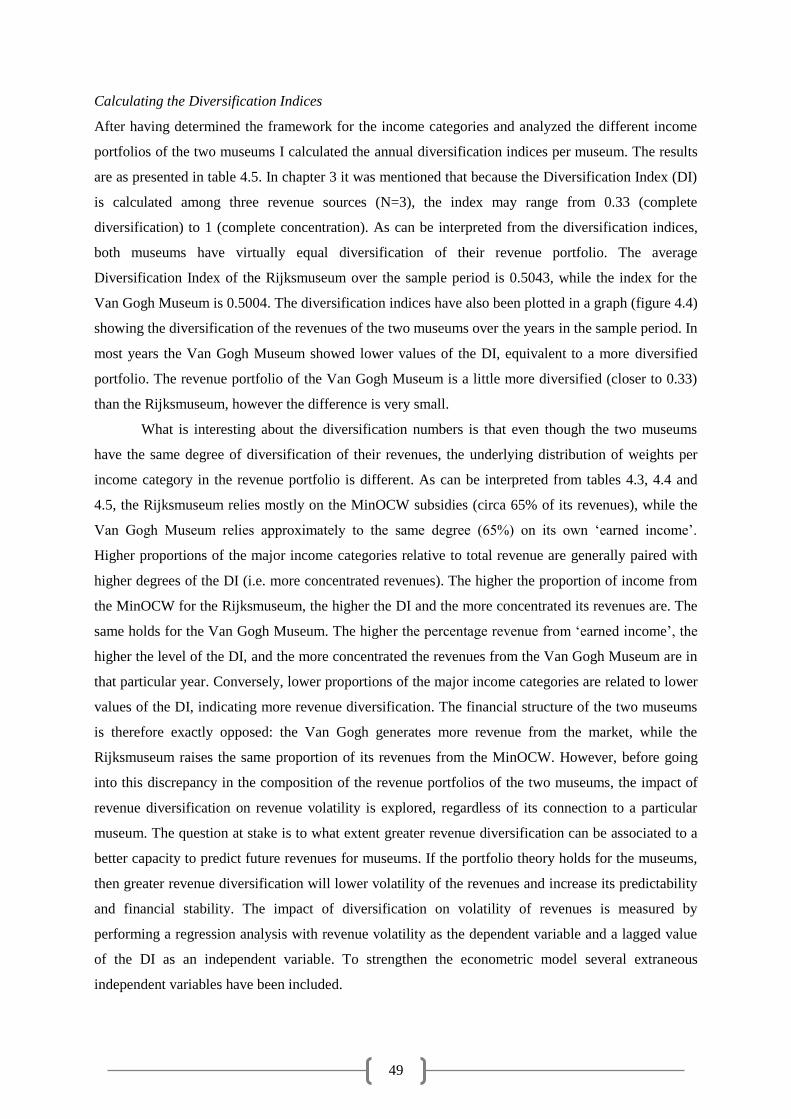
49
Calculating the Diversification Indices
After having determined the framework for the income categories and analyzed the different income
portfolios of the two museums I calculated the annual diversification indices per museum. The results
are as presented in table 4.5. In chapter 3 it was mentioned that because the Diversification Index (DI)
is calculated among three revenue sources (N=3), the index may range from 0.33 (complete
diversification) to 1 (complete concentration). As can be interpreted from the diversification indices,
both museums have virtually equal diversification of their revenue portfolio. The average
Diversification Index of the Rijksmuseum over the sample period is 0.5043, while the index for the
Van Gogh Museum is 0.5004. The diversification indices have also been plotted in a graph (figure 4.4)
showing the diversification of the revenues of the two museums over the years in the sample period. In
most years the Van Gogh Museum showed lower values of the DI, equivalent to a more diversified
portfolio. The revenue portfolio of the Van Gogh Museum is a little more diversified (closer to 0.33)
than the Rijksmuseum, however the difference is very small.
What is interesting about the diversification numbers is that even though the two museums
have the same degree of diversification of their revenues, the underlying distribution of weights per
income category in the revenue portfolio is different. As can be interpreted from tables 4.3, 4.4 and
4.5, the Rijksmuseum relies mostly on the MinOCW subsidies (circa 65% of its revenues), while the
Van Gogh Museum relies approximately to the same degree (65%) on its own ‘earned income’.
Higher proportions of the major income categories relative to total revenue are generally paired with
higher degrees of the DI (i.e. more concentrated revenues). The higher the proportion of income from
the MinOCW for the Rijksmuseum, the higher the DI and the more concentrated its revenues are. The
same holds for the Van Gogh Museum. The higher the percentage revenue from ‘earned income’, the
higher the level of the DI, and the more concentrated the revenues from the Van Gogh Museum are in
that particular year. Conversely, lower proportions of the major income categories are related to lower
values of the DI, indicating more revenue diversification. The financial structure of the two museums
is therefore exactly opposed: the Van Gogh generates more revenue from the market, while the
Rijksmuseum raises the same proportion of its revenues from the MinOCW. However, before going
into this discrepancy in the composition of the revenue portfolios of the two museums, the impact of
revenue diversification on revenue volatility is explored, regardless of its connection to a particular
museum. The question at stake is to what extent greater revenue diversification can be associated to a
better capacity to predict future revenues for museums. If the portfolio theory holds for the museums,
then greater revenue diversification will lower volatility of the revenues and increase its predictability
and financial stability. The impact of diversification on volatility of revenues is measured by
performing a regression analysis with revenue volatility as the dependent variable and a lagged value
of the DI as an independent variable. To strengthen the econometric model several extraneous
independent variables have been included.
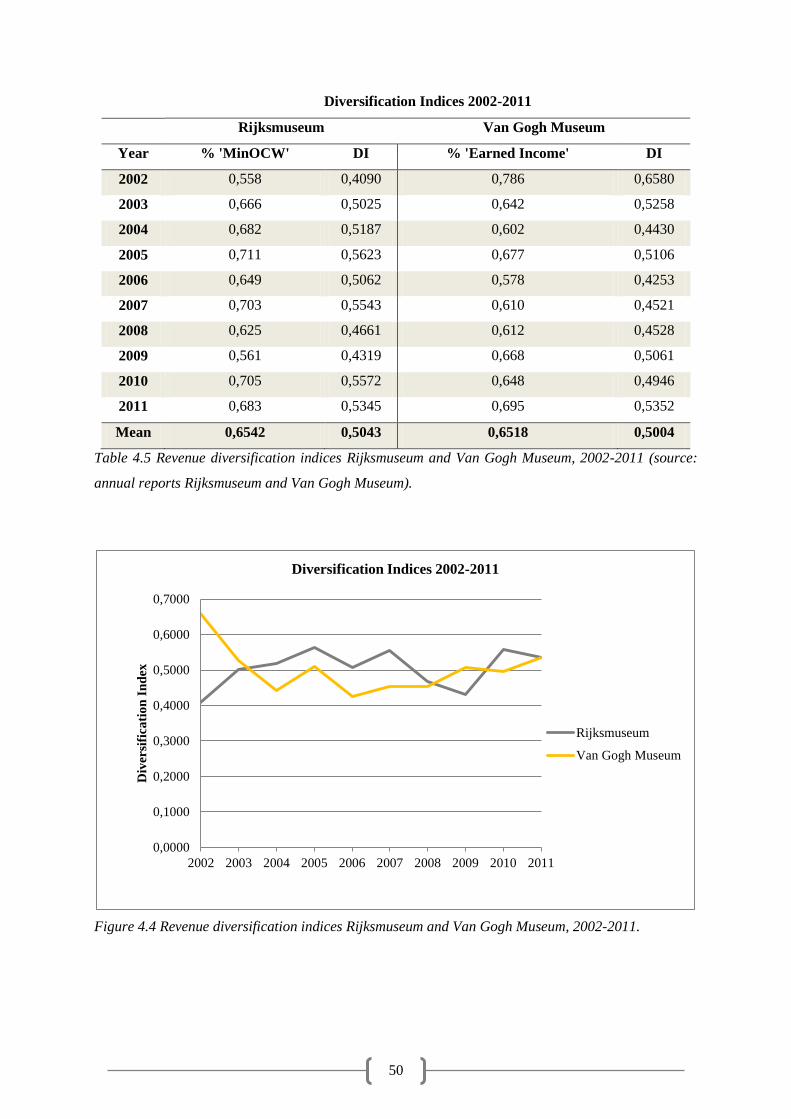
50
Diversification Indices 2002-2011
Rijksmuseum Van Gogh Museum
Year % 'MinOCW' DI % 'Earned Income' DI
2002 0,558 0,4090 0,786 0,6580
2003 0,666 0,5025 0,642 0,5258
2004 0,682 0,5187 0,602 0,4430
2005 0,711 0,5623 0,677 0,5106
2006 0,649 0,5062 0,578 0,4253
2007 0,703 0,5543 0,610 0,4521
2008 0,625 0,4661 0,612 0,4528
2009 0,561 0,4319 0,668 0,5061
2010 0,705 0,5572 0,648 0,4946
2011 0,683 0,5345 0,695 0,5352
Mean 0,6542 0,5043 0,6518 0,5004
Table 4.5 Revenue diversification indices Rijksmuseum and Van Gogh Museum, 2002-2011 (source:
annual reports Rijksmuseum and Van Gogh Museum).
Figure 4.4 Revenue diversification indices Rijksmuseum and Van Gogh Museum, 2002-2011.
0,0000
0,1000
0,2000
0,3000
0,4000
0,5000
0,6000
0,7000
2002 2003 2004 2005 2006 2007 2008 2009 2010 2011
Div
ersi
fica
tio
n I
nd
ex
Diversification Indices 2002-2011
Rijksmuseum
Van Gogh Museum
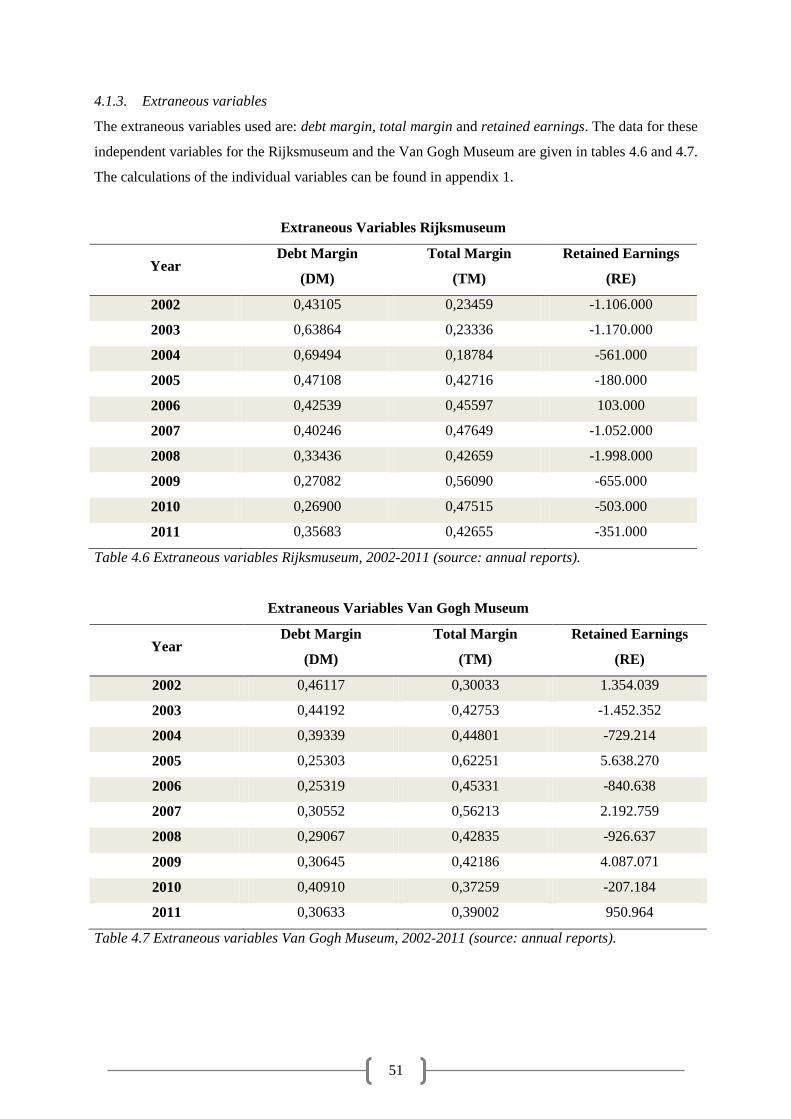
51
4.1.3. Extraneous variables
The extraneous variables used are: debt margin, total margin and retained earnings. The data for these
independent variables for the Rijksmuseum and the Van Gogh Museum are given in tables 4.6 and 4.7.
The calculations of the individual variables can be found in appendix 1.
Extraneous Variables Rijksmuseum
Year Debt Margin
(DM)
Total Margin
(TM)
Retained Earnings
(RE)
2002 0,43105 0,23459 -1.106.000
2003 0,63864 0,23336 -1.170.000
2004 0,69494 0,18784 -561.000
2005 0,47108 0,42716 -180.000
2006 0,42539 0,45597 103.000
2007 0,40246 0,47649 -1.052.000
2008 0,33436 0,42659 -1.998.000
2009 0,27082 0,56090 -655.000
2010 0,26900 0,47515 -503.000
2011 0,35683 0,42655 -351.000
Table 4.6 Extraneous variables Rijksmuseum, 2002-2011 (source: annual reports).
Extraneous Variables Van Gogh Museum
Year Debt Margin
(DM)
Total Margin
(TM)
Retained Earnings
(RE)
2002 0,46117 0,30033 1.354.039
2003 0,44192 0,42753 -1.452.352
2004 0,39339 0,44801 -729.214
2005 0,25303 0,62251 5.638.270
2006 0,25319 0,45331 -840.638
2007 0,30552 0,56213 2.192.759
2008 0,29067 0,42835 -926.637
2009 0,30645 0,42186 4.087.071
2010 0,40910 0,37259 -207.184
2011 0,30633 0,39002 950.964
Table 4.7 Extraneous variables Van Gogh Museum, 2002-2011 (source: annual reports).
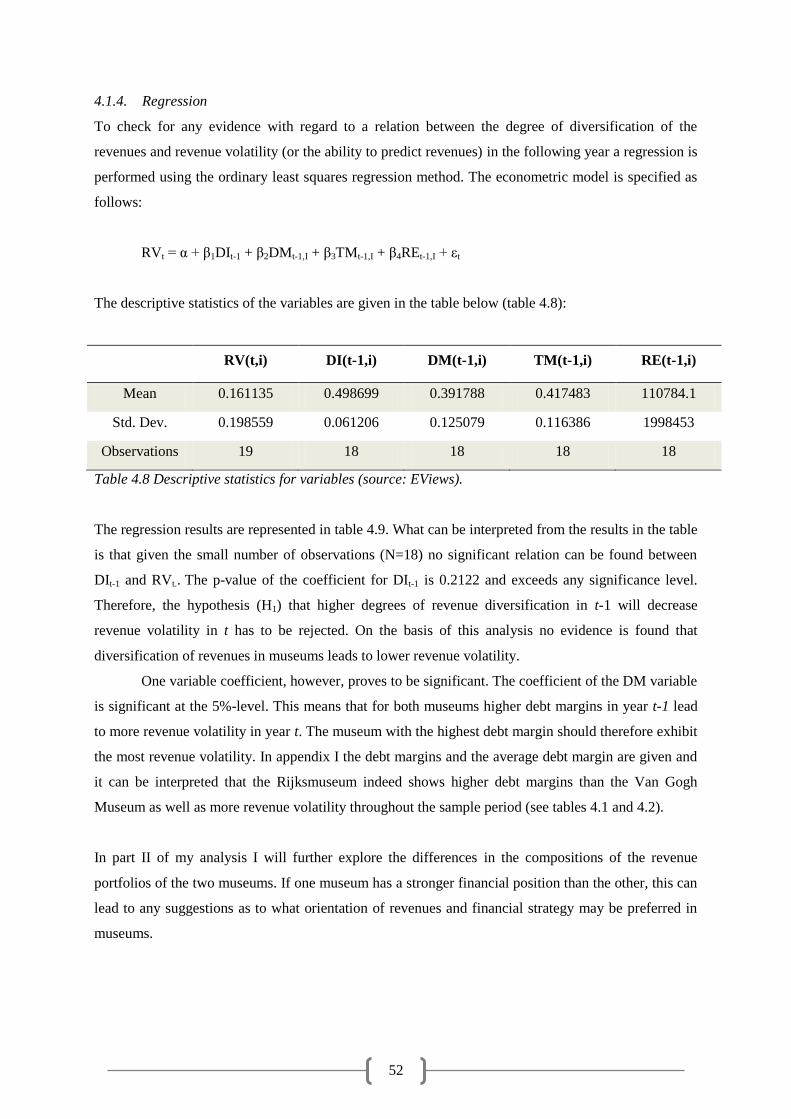
52
4.1.4. Regression
To check for any evidence with regard to a relation between the degree of diversification of the
revenues and revenue volatility (or the ability to predict revenues) in the following year a regression is
performed using the ordinary least squares regression method. The econometric model is specified as
follows:
RVt = α + β1DIt-1 + β2DMt-1,I + β3TMt-1,I + β4REt-1,I + εt
The descriptive statistics of the variables are given in the table below (table 4.8):
RV(t,i) DI(t-1,i) DM(t-1,i) TM(t-1,i) RE(t-1,i)
Mean 0.161135 0.498699 0.391788 0.417483 110784.1
Std. Dev. 0.198559 0.061206 0.125079 0.116386 1998453
Observations 19 18 18 18 18
Table 4.8 Descriptive statistics for variables (source: EViews).
The regression results are represented in table 4.9. What can be interpreted from the results in the table
is that given the small number of observations (N=18) no significant relation can be found between
DIt-1 and RVt.. The p-value of the coefficient for DIt-1 is 0.2122 and exceeds any significance level.
Therefore, the hypothesis (H1) that higher degrees of revenue diversification in t-1 will decrease
revenue volatility in t has to be rejected. On the basis of this analysis no evidence is found that
diversification of revenues in museums leads to lower revenue volatility.
One variable coefficient, however, proves to be significant. The coefficient of the DM variable
is significant at the 5%-level. This means that for both museums higher debt margins in year t-1 lead
to more revenue volatility in year t. The museum with the highest debt margin should therefore exhibit
the most revenue volatility. In appendix I the debt margins and the average debt margin are given and
it can be interpreted that the Rijksmuseum indeed shows higher debt margins than the Van Gogh
Museum as well as more revenue volatility throughout the sample period (see tables 4.1 and 4.2).
In part II of my analysis I will further explore the differences in the compositions of the revenue
portfolios of the two museums. If one museum has a stronger financial position than the other, this can
lead to any suggestions as to what orientation of revenues and financial strategy may be preferred in
museums.
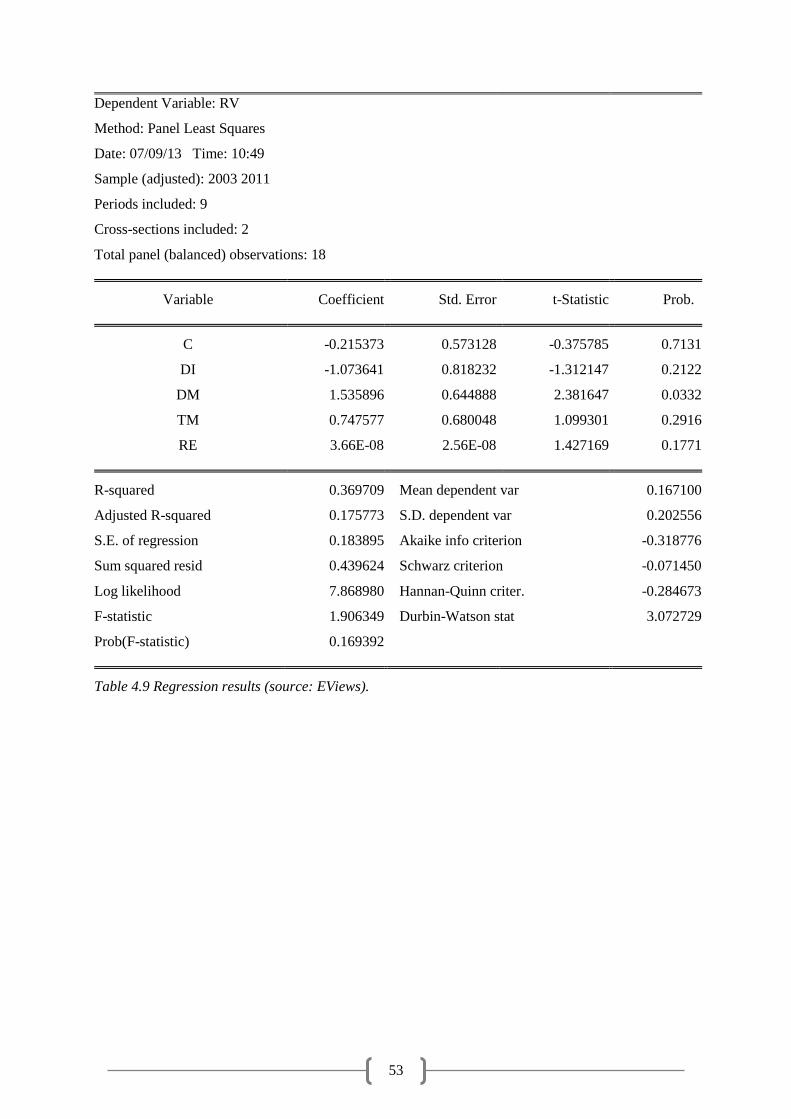
53
Dependent Variable: RV
Method: Panel Least Squares
Date: 07/09/13 Time: 10:49
Sample (adjusted): 2003 2011
Periods included: 9
Cross-sections included: 2
Total panel (balanced) observations: 18
Variable Coefficient Std. Error t-Statistic Prob.
C -0.215373 0.573128 -0.375785 0.7131
DI -1.073641 0.818232 -1.312147 0.2122
DM 1.535896 0.644888 2.381647 0.0332
TM 0.747577 0.680048 1.099301 0.2916
RE 3.66E-08 2.56E-08 1.427169 0.1771
R-squared 0.369709 Mean dependent var 0.167100
Adjusted R-squared 0.175773 S.D. dependent var 0.202556
S.E. of regression 0.183895 Akaike info criterion -0.318776
Sum squared resid 0.439624 Schwarz criterion -0.071450
Log likelihood 7.868980 Hannan-Quinn criter. -0.284673
F-statistic 1.906349 Durbin-Watson stat 3.072729
Prob(F-statistic) 0.169392
Table 4.9 Regression results (source: EViews).
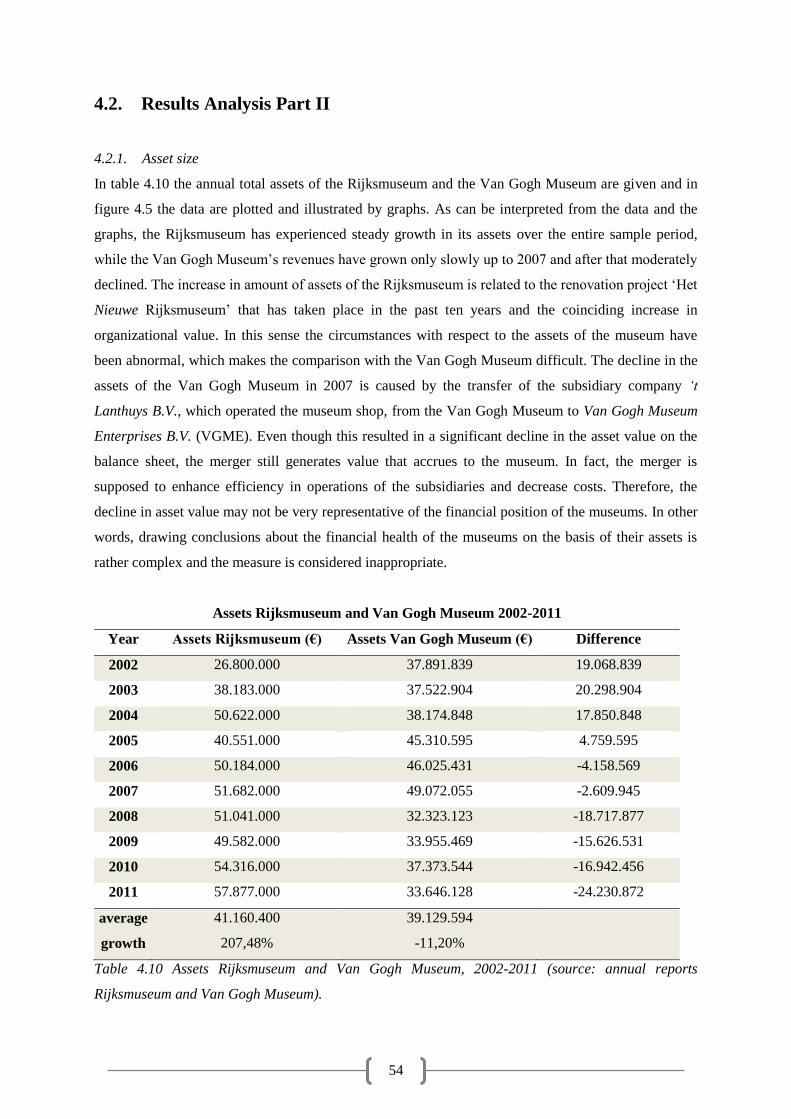
54
4.2. Results Analysis Part II
4.2.1. Asset size
In table 4.10 the annual total assets of the Rijksmuseum and the Van Gogh Museum are given and in
figure 4.5 the data are plotted and illustrated by graphs. As can be interpreted from the data and the
graphs, the Rijksmuseum has experienced steady growth in its assets over the entire sample period,
while the Van Gogh Museum’s revenues have grown only slowly up to 2007 and after that moderately
declined. The increase in amount of assets of the Rijksmuseum is related to the renovation project ‘Het
Nieuwe Rijksmuseum’ that has taken place in the past ten years and the coinciding increase in
organizational value. In this sense the circumstances with respect to the assets of the museum have
been abnormal, which makes the comparison with the Van Gogh Museum difficult. The decline in the
assets of the Van Gogh Museum in 2007 is caused by the transfer of the subsidiary company ‘t
Lanthuys B.V., which operated the museum shop, from the Van Gogh Museum to Van Gogh Museum
Enterprises B.V. (VGME). Even though this resulted in a significant decline in the asset value on the
balance sheet, the merger still generates value that accrues to the museum. In fact, the merger is
supposed to enhance efficiency in operations of the subsidiaries and decrease costs. Therefore, the
decline in asset value may not be very representative of the financial position of the museums. In other
words, drawing conclusions about the financial health of the museums on the basis of their assets is
rather complex and the measure is considered inappropriate.
Assets Rijksmuseum and Van Gogh Museum 2002-2011
Year Assets Rijksmuseum (€) Assets Van Gogh Museum (€) Difference
2002 26.800.000 37.891.839 19.068.839
2003 38.183.000 37.522.904 20.298.904
2004 50.622.000 38.174.848 17.850.848
2005 40.551.000 45.310.595 4.759.595
2006 50.184.000 46.025.431 -4.158.569
2007 51.682.000 49.072.055 -2.609.945
2008 51.041.000 32.323.123 -18.717.877
2009 49.582.000 33.955.469 -15.626.531
2010 54.316.000 37.373.544 -16.942.456
2011 57.877.000 33.646.128 -24.230.872
average 41.160.400 39.129.594
growth 207,48% -11,20%
Table 4.10 Assets Rijksmuseum and Van Gogh Museum, 2002-2011 (source: annual reports
Rijksmuseum and Van Gogh Museum).
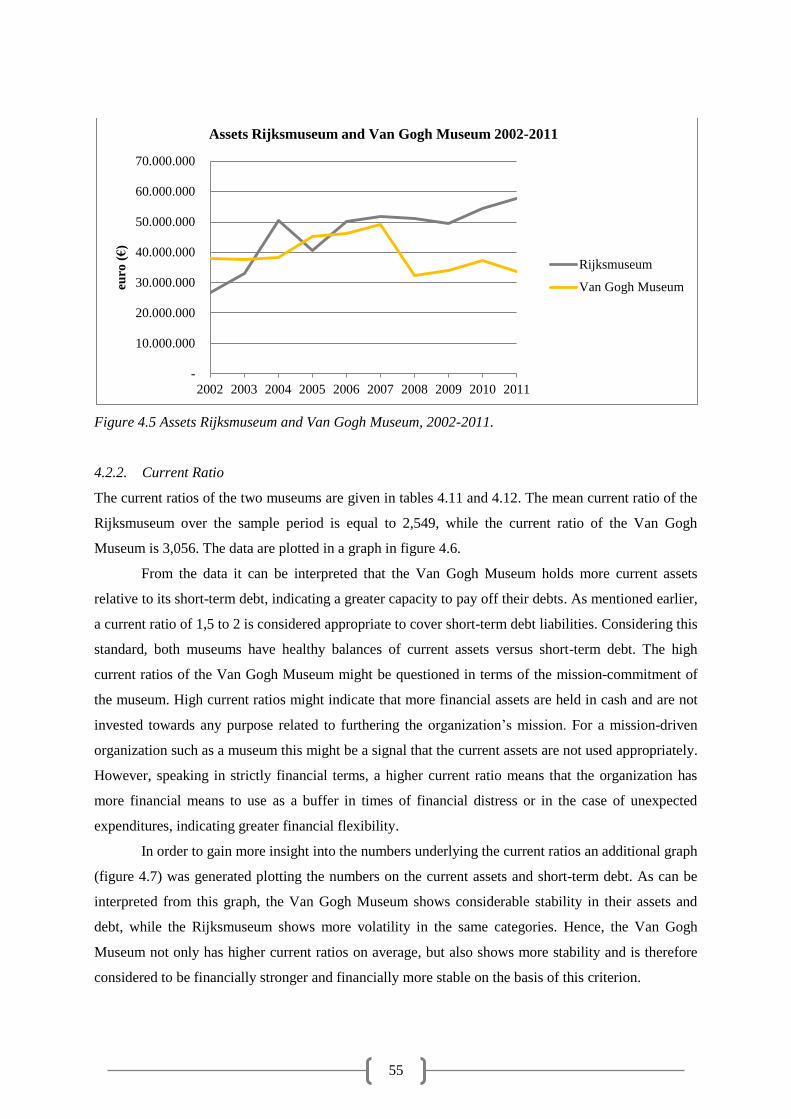
55
Figure 4.5 Assets Rijksmuseum and Van Gogh Museum, 2002-2011.
4.2.2. Current Ratio
The current ratios of the two museums are given in tables 4.11 and 4.12. The mean current ratio of the
Rijksmuseum over the sample period is equal to 2,549, while the current ratio of the Van Gogh
Museum is 3,056. The data are plotted in a graph in figure 4.6.
From the data it can be interpreted that the Van Gogh Museum holds more current assets
relative to its short-term debt, indicating a greater capacity to pay off their debts. As mentioned earlier,
a current ratio of 1,5 to 2 is considered appropriate to cover short-term debt liabilities. Considering this
standard, both museums have healthy balances of current assets versus short-term debt. The high
current ratios of the Van Gogh Museum might be questioned in terms of the mission-commitment of
the museum. High current ratios might indicate that more financial assets are held in cash and are not
invested towards any purpose related to furthering the organization’s mission. For a mission-driven
organization such as a museum this might be a signal that the current assets are not used appropriately.
However, speaking in strictly financial terms, a higher current ratio means that the organization has
more financial means to use as a buffer in times of financial distress or in the case of unexpected
expenditures, indicating greater financial flexibility.
In order to gain more insight into the numbers underlying the current ratios an additional graph
(figure 4.7) was generated plotting the numbers on the current assets and short-term debt. As can be
interpreted from this graph, the Van Gogh Museum shows considerable stability in their assets and
debt, while the Rijksmuseum shows more volatility in the same categories. Hence, the Van Gogh
Museum not only has higher current ratios on average, but also shows more stability and is therefore
considered to be financially stronger and financially more stable on the basis of this criterion.
-
10.000.000
20.000.000
30.000.000
40.000.000
50.000.000
60.000.000
70.000.000
2002 2003 2004 2005 2006 2007 2008 2009 2010 2011
euro
(€
)
Assets Rijksmuseum and Van Gogh Museum 2002-2011
Rijksmuseum
Van Gogh Museum
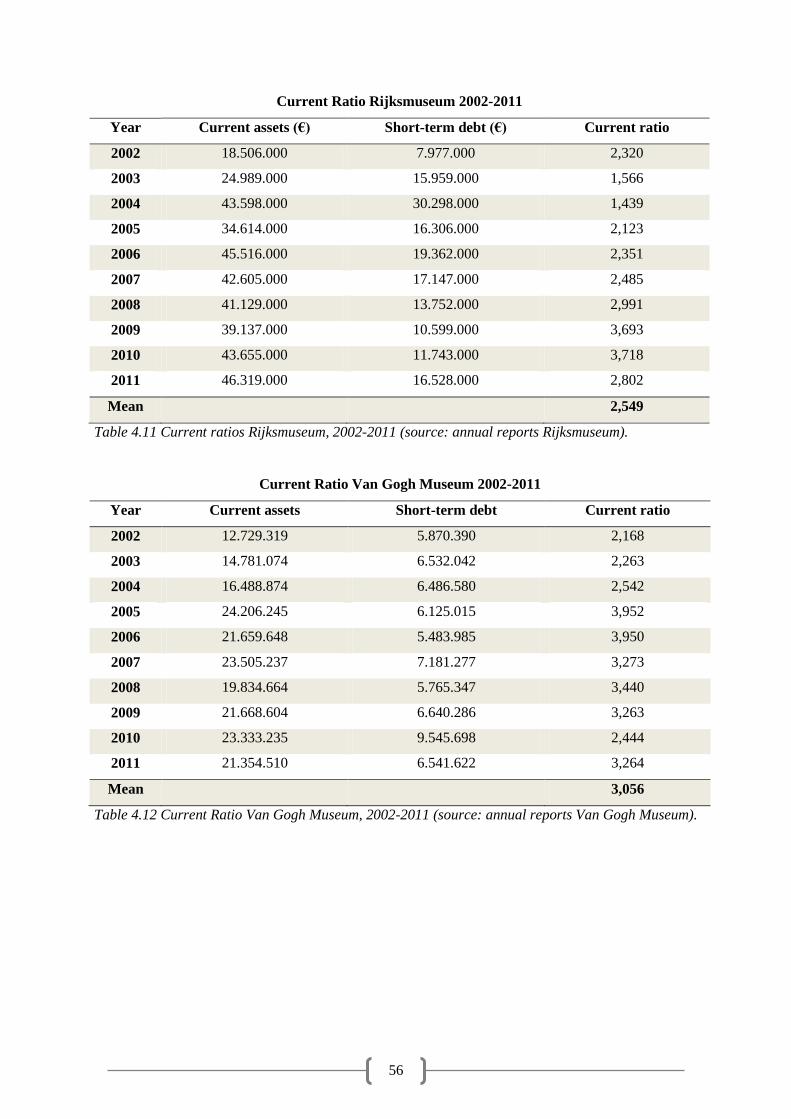
56
Current Ratio Rijksmuseum 2002-2011
Year Current assets (€) Short-term debt (€) Current ratio
2002 18.506.000 7.977.000 2,320
2003 24.989.000 15.959.000 1,566
2004 43.598.000 30.298.000 1,439
2005 34.614.000 16.306.000 2,123
2006 45.516.000 19.362.000 2,351
2007 42.605.000 17.147.000 2,485
2008 41.129.000 13.752.000 2,991
2009 39.137.000 10.599.000 3,693
2010 43.655.000 11.743.000 3,718
2011 46.319.000 16.528.000 2,802
Mean
2,549
Table 4.11 Current ratios Rijksmuseum, 2002-2011 (source: annual reports Rijksmuseum).
Current Ratio Van Gogh Museum 2002-2011
Year Current assets Short-term debt Current ratio
2002 12.729.319 5.870.390 2,168
2003 14.781.074 6.532.042 2,263
2004 16.488.874 6.486.580 2,542
2005 24.206.245 6.125.015 3,952
2006 21.659.648 5.483.985 3,950
2007 23.505.237 7.181.277 3,273
2008 19.834.664 5.765.347 3,440
2009 21.668.604 6.640.286 3,263
2010 23.333.235 9.545.698 2,444
2011 21.354.510 6.541.622 3,264
Mean
3,056
Table 4.12 Current Ratio Van Gogh Museum, 2002-2011 (source: annual reports Van Gogh Museum).
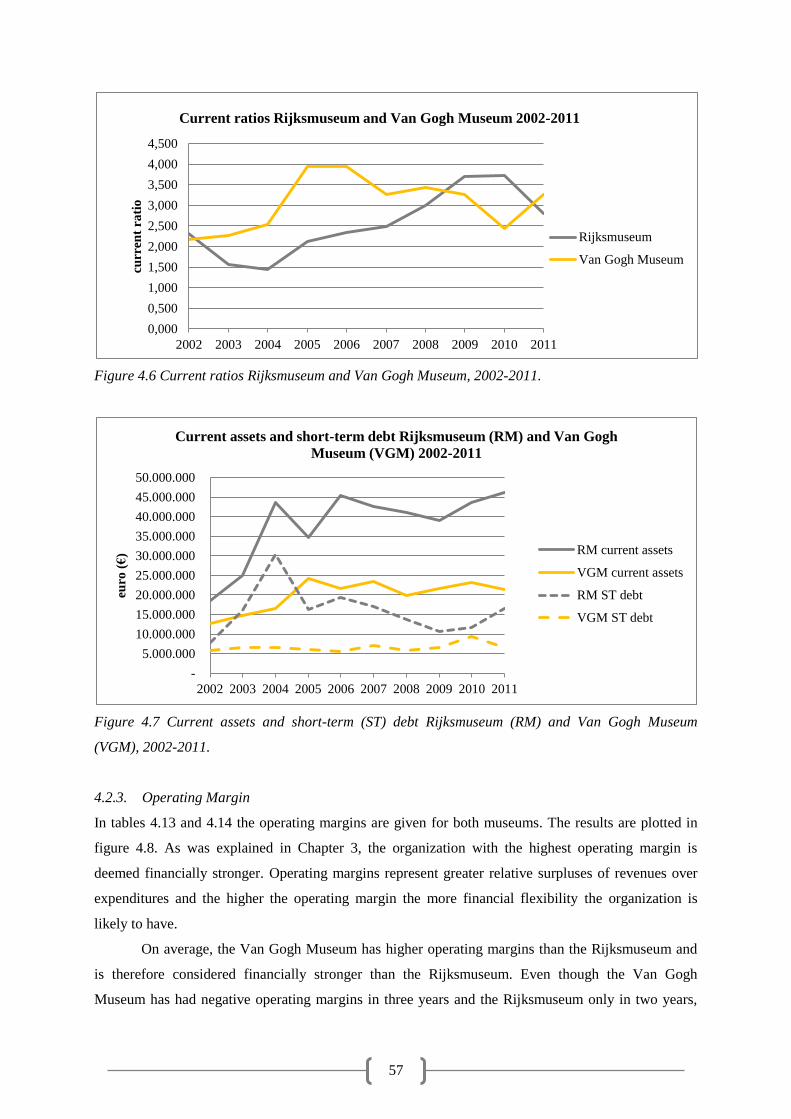
57
Figure 4.6 Current ratios Rijksmuseum and Van Gogh Museum, 2002-2011.
Figure 4.7 Current assets and short-term (ST) debt Rijksmuseum (RM) and Van Gogh Museum
(VGM), 2002-2011.
4.2.3. Operating Margin
In tables 4.13 and 4.14 the operating margins are given for both museums. The results are plotted in
figure 4.8. As was explained in Chapter 3, the organization with the highest operating margin is
deemed financially stronger. Operating margins represent greater relative surpluses of revenues over
expenditures and the higher the operating margin the more financial flexibility the organization is
likely to have.
On average, the Van Gogh Museum has higher operating margins than the Rijksmuseum and
is therefore considered financially stronger than the Rijksmuseum. Even though the Van Gogh
Museum has had negative operating margins in three years and the Rijksmuseum only in two years,
0,000
0,500
1,000
1,500
2,000
2,500
3,000
3,500
4,000
4,500
2002 2003 2004 2005 2006 2007 2008 2009 2010 2011
curr
ent
rati
o
Current ratios Rijksmuseum and Van Gogh Museum 2002-2011
Rijksmuseum
Van Gogh Museum
-
5.000.000
10.000.000
15.000.000
20.000.000
25.000.000
30.000.000
35.000.000
40.000.000
45.000.000
50.000.000
2002 2003 2004 2005 2006 2007 2008 2009 2010 2011
euro
(€
)
Current assets and short-term debt Rijksmuseum (RM) and Van Gogh
Museum (VGM) 2002-2011
RM current assets
VGM current assets
RM ST debt
VGM ST debt
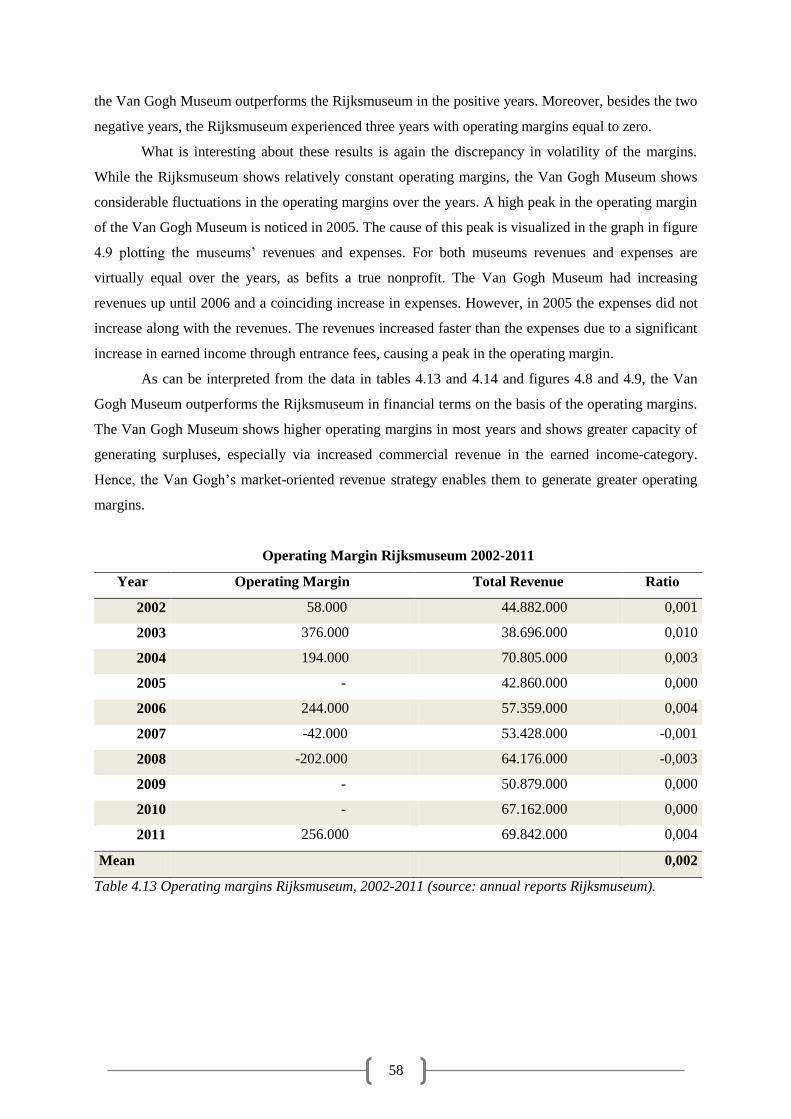
58
the Van Gogh Museum outperforms the Rijksmuseum in the positive years. Moreover, besides the two
negative years, the Rijksmuseum experienced three years with operating margins equal to zero.
What is interesting about these results is again the discrepancy in volatility of the margins.
While the Rijksmuseum shows relatively constant operating margins, the Van Gogh Museum shows
considerable fluctuations in the operating margins over the years. A high peak in the operating margin
of the Van Gogh Museum is noticed in 2005. The cause of this peak is visualized in the graph in figure
4.9 plotting the museums’ revenues and expenses. For both museums revenues and expenses are
virtually equal over the years, as befits a true nonprofit. The Van Gogh Museum had increasing
revenues up until 2006 and a coinciding increase in expenses. However, in 2005 the expenses did not
increase along with the revenues. The revenues increased faster than the expenses due to a significant
increase in earned income through entrance fees, causing a peak in the operating margin.
As can be interpreted from the data in tables 4.13 and 4.14 and figures 4.8 and 4.9, the Van
Gogh Museum outperforms the Rijksmuseum in financial terms on the basis of the operating margins.
The Van Gogh Museum shows higher operating margins in most years and shows greater capacity of
generating surpluses, especially via increased commercial revenue in the earned income-category.
Hence, the Van Gogh’s market-oriented revenue strategy enables them to generate greater operating
margins.
Operating Margin Rijksmuseum 2002-2011
Year Operating Margin Total Revenue Ratio
2002 58.000 44.882.000 0,001
2003 376.000 38.696.000 0,010
2004 194.000 70.805.000 0,003
2005 - 42.860.000 0,000
2006 244.000 57.359.000 0,004
2007 -42.000 53.428.000 -0,001
2008 -202.000 64.176.000 -0,003
2009 - 50.879.000 0,000
2010 - 67.162.000 0,000
2011 256.000 69.842.000 0,004
Mean 0,002
Table 4.13 Operating margins Rijksmuseum, 2002-2011 (source: annual reports Rijksmuseum).
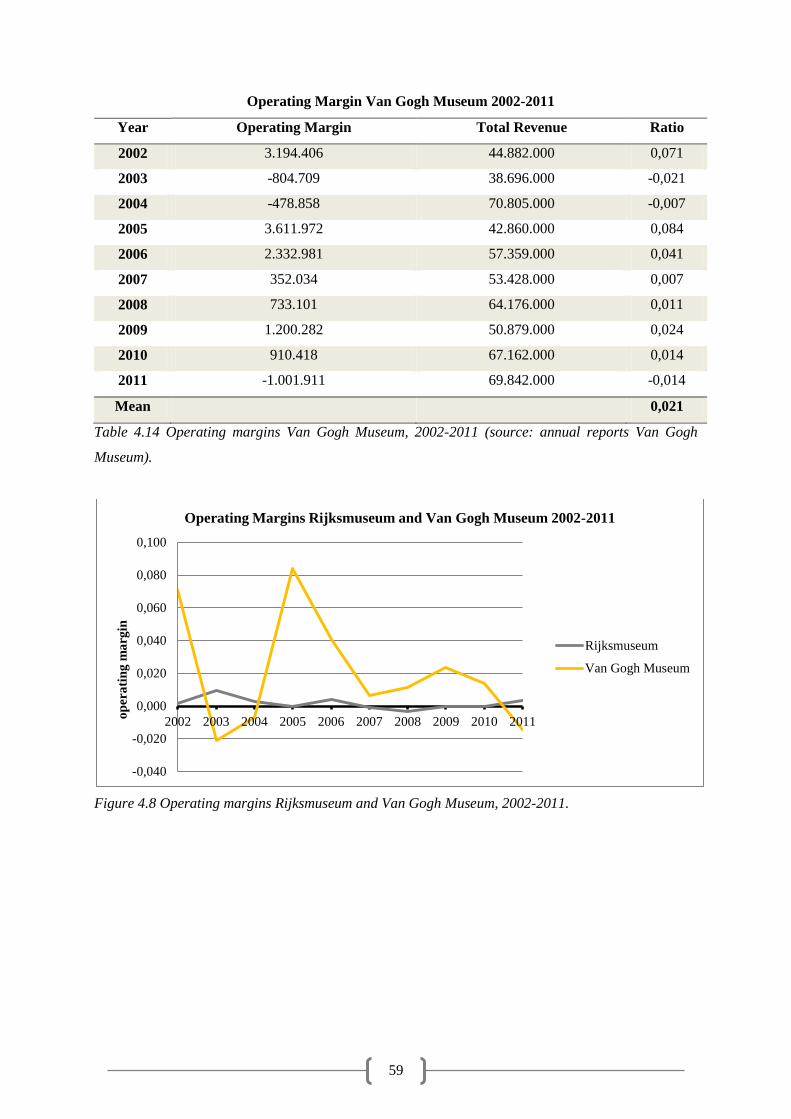
59
Operating Margin Van Gogh Museum 2002-2011
Year Operating Margin Total Revenue Ratio
2002 3.194.406 44.882.000 0,071
2003 -804.709 38.696.000 -0,021
2004 -478.858 70.805.000 -0,007
2005 3.611.972 42.860.000 0,084
2006 2.332.981 57.359.000 0,041
2007 352.034 53.428.000 0,007
2008 733.101 64.176.000 0,011
2009 1.200.282 50.879.000 0,024
2010 910.418 67.162.000 0,014
2011 -1.001.911 69.842.000 -0,014
Mean
0,021
Table 4.14 Operating margins Van Gogh Museum, 2002-2011 (source: annual reports Van Gogh
Museum).
Figure 4.8 Operating margins Rijksmuseum and Van Gogh Museum, 2002-2011.
-0,040
-0,020
0,000
0,020
0,040
0,060
0,080
0,100
2002 2003 2004 2005 2006 2007 2008 2009 2010 2011
op
era
tin
g m
arg
in
Operating Margins Rijksmuseum and Van Gogh Museum 2002-2011
Rijksmuseum
Van Gogh Museum
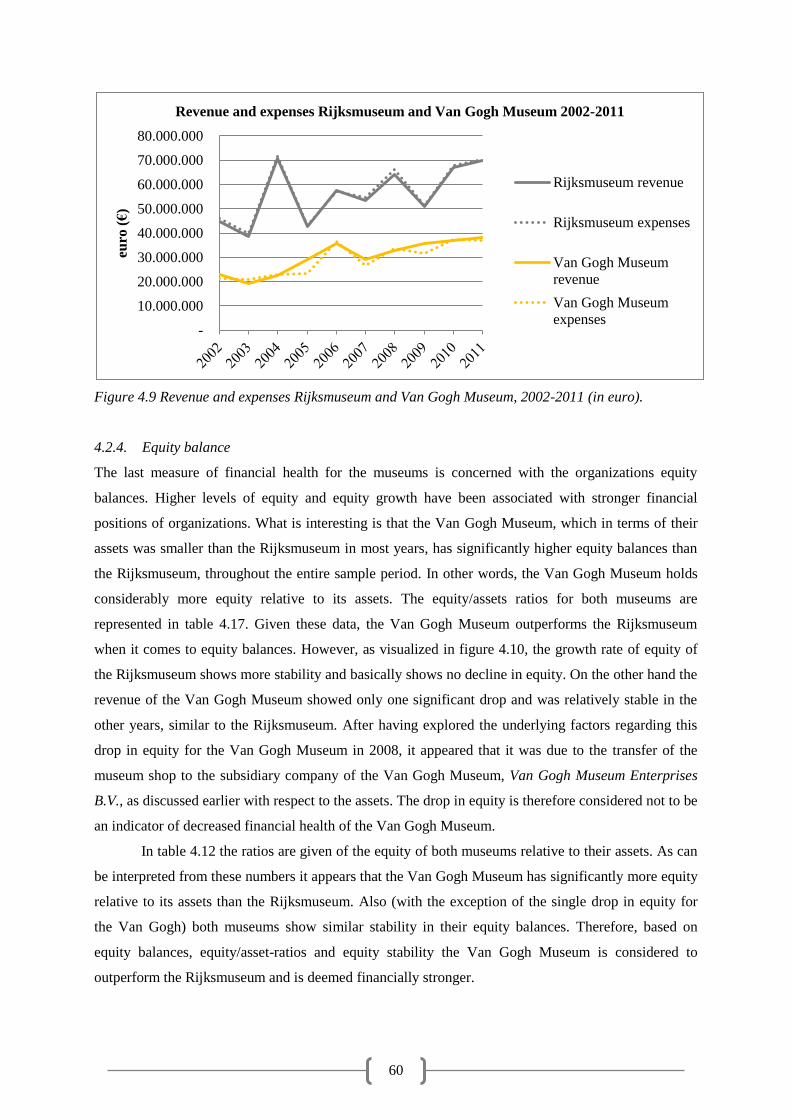
60
Figure 4.9 Revenue and expenses Rijksmuseum and Van Gogh Museum, 2002-2011 (in euro).
4.2.4. Equity balance
The last measure of financial health for the museums is concerned with the organizations equity
balances. Higher levels of equity and equity growth have been associated with stronger financial
positions of organizations. What is interesting is that the Van Gogh Museum, which in terms of their
assets was smaller than the Rijksmuseum in most years, has significantly higher equity balances than
the Rijksmuseum, throughout the entire sample period. In other words, the Van Gogh Museum holds
considerably more equity relative to its assets. The equity/assets ratios for both museums are
represented in table 4.17. Given these data, the Van Gogh Museum outperforms the Rijksmuseum
when it comes to equity balances. However, as visualized in figure 4.10, the growth rate of equity of
the Rijksmuseum shows more stability and basically shows no decline in equity. On the other hand the
revenue of the Van Gogh Museum showed only one significant drop and was relatively stable in the
other years, similar to the Rijksmuseum. After having explored the underlying factors regarding this
drop in equity for the Van Gogh Museum in 2008, it appeared that it was due to the transfer of the
museum shop to the subsidiary company of the Van Gogh Museum, Van Gogh Museum Enterprises
B.V., as discussed earlier with respect to the assets. The drop in equity is therefore considered not to be
an indicator of decreased financial health of the Van Gogh Museum.
In table 4.12 the ratios are given of the equity of both museums relative to their assets. As can
be interpreted from these numbers it appears that the Van Gogh Museum has significantly more equity
relative to its assets than the Rijksmuseum. Also (with the exception of the single drop in equity for
the Van Gogh) both museums show similar stability in their equity balances. Therefore, based on
equity balances, equity/asset-ratios and equity stability the Van Gogh Museum is considered to
outperform the Rijksmuseum and is deemed financially stronger.
-
10.000.000
20.000.000
30.000.000
40.000.000
50.000.000
60.000.000
70.000.000
80.000.000eu
ro (
€)
Revenue and expenses Rijksmuseum and Van Gogh Museum 2002-2011
Rijksmuseum revenue
Rijksmuseum expenses
Van Gogh Museum
revenue
Van Gogh Museum
expenses
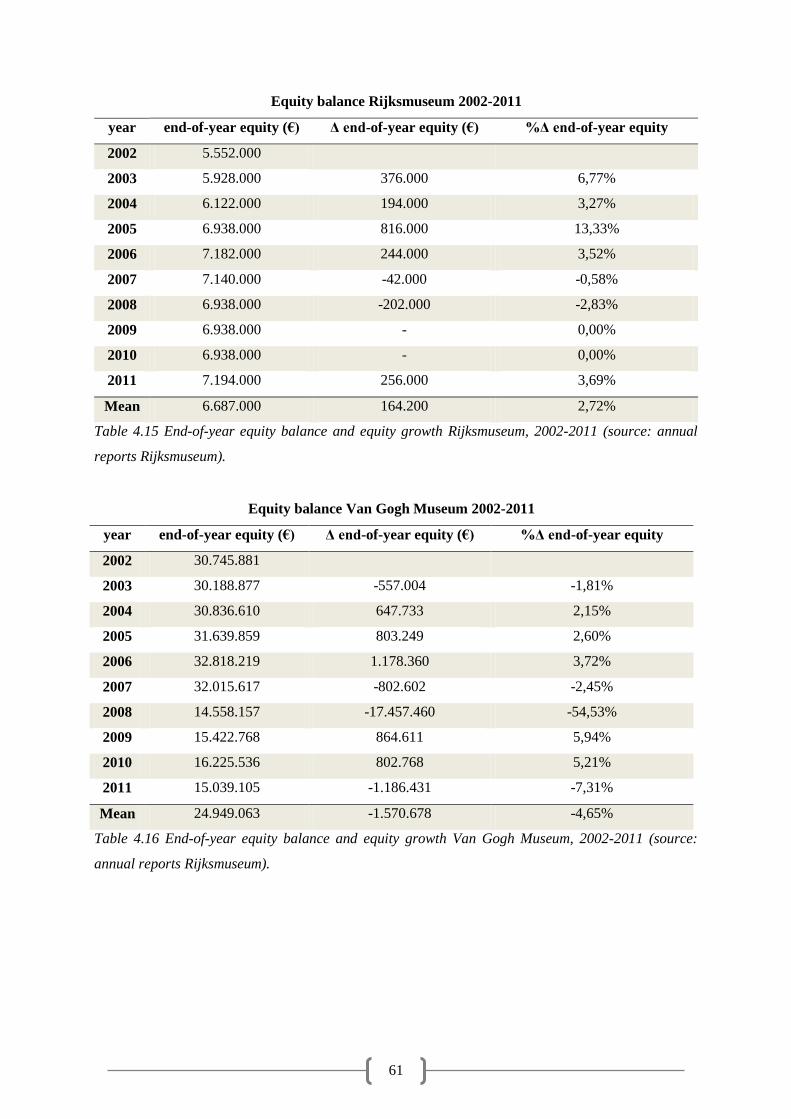
61
Equity balance Rijksmuseum 2002-2011
year end-of-year equity (€) Δ end-of-year equity (€) %Δ end-of-year equity
2002 5.552.000
2003 5.928.000 376.000 6,77%
2004 6.122.000 194.000 3,27%
2005 6.938.000 816.000 13,33%
2006 7.182.000 244.000 3,52%
2007 7.140.000 -42.000 -0,58%
2008 6.938.000 -202.000 -2,83%
2009 6.938.000 - 0,00%
2010 6.938.000 - 0,00%
2011 7.194.000 256.000 3,69%
Mean 6.687.000 164.200 2,72%
Table 4.15 End-of-year equity balance and equity growth Rijksmuseum, 2002-2011 (source: annual
reports Rijksmuseum).
Equity balance Van Gogh Museum 2002-2011
year end-of-year equity (€) Δ end-of-year equity (€) %Δ end-of-year equity
2002 30.745.881
2003 30.188.877 -557.004 -1,81%
2004 30.836.610 647.733 2,15%
2005 31.639.859 803.249 2,60%
2006 32.818.219 1.178.360 3,72%
2007 32.015.617 -802.602 -2,45%
2008 14.558.157 -17.457.460 -54,53%
2009 15.422.768 864.611 5,94%
2010 16.225.536 802.768 5,21%
2011 15.039.105 -1.186.431 -7,31%
Mean 24.949.063 -1.570.678 -4,65%
Table 4.16 End-of-year equity balance and equity growth Van Gogh Museum, 2002-2011 (source:
annual reports Rijksmuseum).
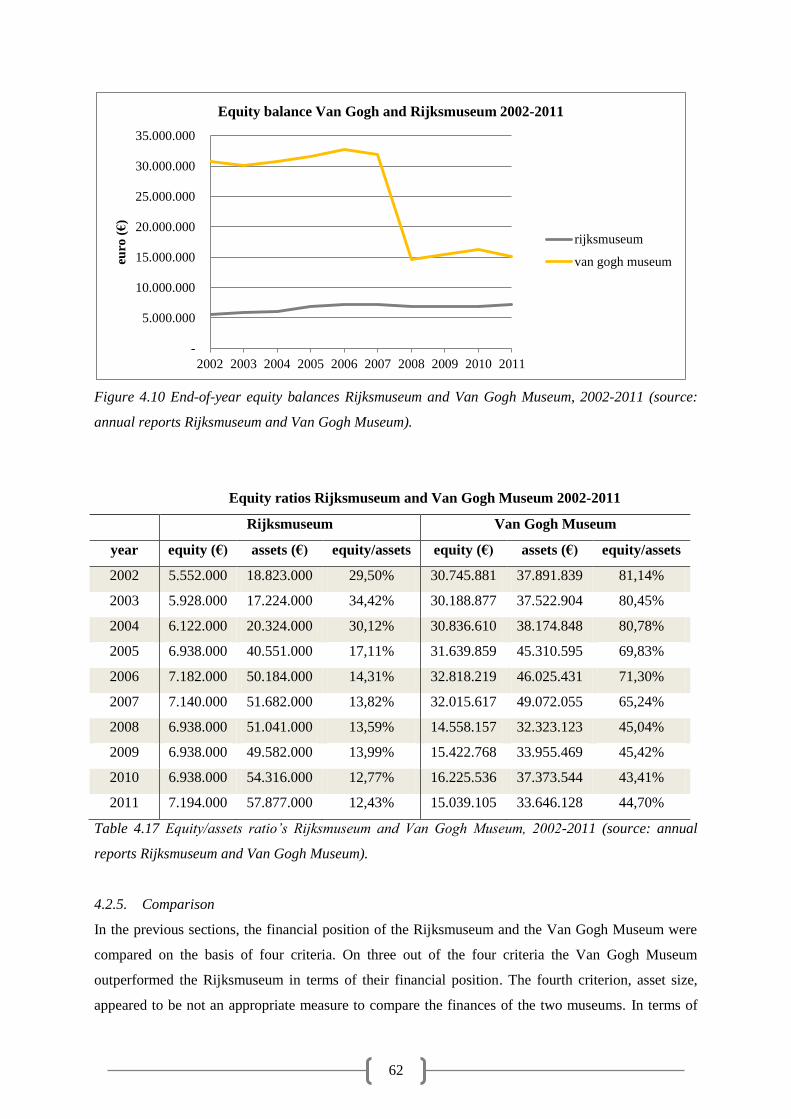
62
Figure 4.10 End-of-year equity balances Rijksmuseum and Van Gogh Museum, 2002-2011 (source:
annual reports Rijksmuseum and Van Gogh Museum).
Equity ratios Rijksmuseum and Van Gogh Museum 2002-2011
Rijksmuseum Van Gogh Museum
year equity (€) assets (€) equity/assets equity (€) assets (€) equity/assets
2002 5.552.000 18.823.000 29,50% 30.745.881 37.891.839 81,14%
2003 5.928.000 17.224.000 34,42% 30.188.877 37.522.904 80,45%
2004 6.122.000 20.324.000 30,12% 30.836.610 38.174.848 80,78%
2005 6.938.000 40.551.000 17,11% 31.639.859 45.310.595 69,83%
2006 7.182.000 50.184.000 14,31% 32.818.219 46.025.431 71,30%
2007 7.140.000 51.682.000 13,82% 32.015.617 49.072.055 65,24%
2008 6.938.000 51.041.000 13,59% 14.558.157 32.323.123 45,04%
2009 6.938.000 49.582.000 13,99% 15.422.768 33.955.469 45,42%
2010 6.938.000 54.316.000 12,77% 16.225.536 37.373.544 43,41%
2011 7.194.000 57.877.000 12,43% 15.039.105 33.646.128 44,70%
Table 4.17 Equity/assets ratio’s Rijksmuseum and Van Gogh Museum, 2002-2011 (source: annual
reports Rijksmuseum and Van Gogh Museum).
4.2.5. Comparison
In the previous sections, the financial position of the Rijksmuseum and the Van Gogh Museum were
compared on the basis of four criteria. On three out of the four criteria the Van Gogh Museum
outperformed the Rijksmuseum in terms of their financial position. The fourth criterion, asset size,
appeared to be not an appropriate measure to compare the finances of the two museums. In terms of
-
5.000.000
10.000.000
15.000.000
20.000.000
25.000.000
30.000.000
35.000.000
2002 2003 2004 2005 2006 2007 2008 2009 2010 2011
euro
(€
) Equity balance Van Gogh and Rijksmuseum 2002-2011
rijksmuseum
van gogh museum
63
the current ratios, operating margins and the equity balances the Van Gogh Museum has proven to be
financially stronger. The museum showed more stability in their current assets and short-term debt
liabilities over the years and higher current ratios, higher operating margins, and higher equity
balances, equity stability and equity/asset-ratios. Often their advantage could be related to their
market-oriented approach and their ability to generate revenue in the market. As such, the analysis
provides arguments in favor of a more market-oriented strategy, which is in line with the advice of the
MinOCW.
However, what has to be noted is that the situation of the Rijksmuseum with respect to the
ongoing renovation project in the past ten years has influenced their financial position. In order to
make sound conclusions one has to be aware of their financial position prior to the renovation project
and assess whether the criteria used were significantly different before the project and during the
project. Therefore the conclusion that can be drawn here is that in the past ten years the Van Gogh
Museum did outperform the Rijksmuseum on financial grounds. The question remains, whether this
would also have been the case when the Rijksmuseum operated under normal and comparable
conditions.
64
5. Conclusion
The aim of this thesis was to explore whether revenue diversification is a valid revenue management
strategy for museums in the Netherlands and whether a more market-oriented, commercial strategy in
the generation of revenues should be adopted by museums that appear too reliant on government
support. By focusing on two museums that receive a structural subsidy of the MinOCW (Ministry of
Education, Culture and Science), the Rijksmuseum and the Van Gogh Museum, the implications of
these revenue strategies were studied. In this concluding chapter the results of the study will be
summarized and the answers to the central research questions will be provided. Furthermore, the
relevance of the research, its limitations and suggestions for further research will be discussed.
The changes in cultural policy have been a heavily discussed topic in the recent years in the
Netherlands. Over the past decades, the government has played an important role in the regulation and
support of the arts and culture and recently they stated their intention to significantly decrease their
involvement. They wish to stimulate a more market-oriented approach and entrepreneurship in the
cultural field, including the museum sector. Therefore, the relevance of this study is of practical
nature, directly responding to current affairs in the museum sector in the Netherlands.
Museums rely on multiple revenue sources and are often to a great extent dependent on
external funding to finance their activities. The reason why they require financial support from
different sources is related to their specific function and role in the community, their nonprofit
organizational form and the unique character of the economics of museums.
The traditional function of museums is to safeguard social, cultural and historical heritage of a
nation, region or city. Besides the traditional function, museums often also serve an economic
function. They may act as tourist attractions and stimulators of economic development in the region.
These two functions explain why museums are of importance to the society at large and why they are
often financially supported by the government and community in their activities. Another reason why
museums require support from multiple revenue sources is because they are mostly organized in a
nonprofit way and are therefore limited in their ability to generate sufficient revenue in a for-profit
way. Nonprofit organizations are mission-driven organizations which are ideally mostly preoccupied
with mission-related activities and not with revenue-generating activities. From an economic point of
view, external financial support, and specifically public funding, is required because of the ‘public
good’-character of the museum and the occurrence of market failure. Moreover, in the market for
museums supply and demand do not meet in an efficient way. The private demand for museums is not
sufficient for museums to generate revenues in the market to cover their relatively high fixed costs.
In general, Dutch museums rely for the major part of their revenues on the government. To a
smaller degree they generate (earned) income in a commercial way via entrance fees and ancillary
65
activities, and through private contributions from corporations or individuals. These different financial
arrangements are all accompanied by risks to the organization. Cross-subsidization of mission-related
loss-making activities by profitable commercial activities in the earned income-category may lead to
convergence of non-profit to for-profit values. This might put the organization’s mission and their
social and cultural values to the test in that commercial value might become too important to the
organization. On the other hand, following the Resource Dependence Theory, dependence on
government support or other external sources makes museums vulnerable to the power and control
these entities may have over them. The funding criteria that come with external support restrict the
museum in their ability of following their own agenda and require them to adjust to the conditions set
by their external funders.
As all income strategies are accompanied by risks to the organization it is often advised to
avoid overdependence on one single revenue category. Therefore, the different income sources need to
be carefully balanced. In the Netherlands the balance between the income sources of museums is not
considered to be optimal. In this thesis revenue diversification has been suggested as a possible
strategy to overcome the problems with the different financial arrangements. Revenue diversification
is a risk-reducing strategy that stems from the Modern Portfolio Theory from the study of finance. By
creating a well-balanced revenue portfolio, including equal shares of income from multiple sources,
the ‘risks’ of the financial arrangements related to cross-subsidization and resource dependence, may
be minimized and the total revenue stream of the museum will be stabilized. In academic literature,
revenue diversification has often been shown to positively affect the financial stability and
organizational autonomy of nonprofits. The question posed in this study is whether the theory of
revenue diversification is also applicable to museums in the Netherlands. If the theory of revenue
diversification also holds for museums, a more equal balance between state support, earned income
and other public and private contributions will positively affect the financial stability of museums.
This led me to my first research question:
Q1: Is revenue diversification a valid revenue management strategy for museums in the Netherlands
that receive a subsidy from the MinOCW?
To assess whether revenue diversification could potentially benefit the financial position of a museum
the financial data in the annual reports of the Rijksmuseum and the Van Gogh Museum were used.
The choice for these two museums and the sample period, which ranged from 2002 to 2011, was based
on the availability of the annual reports in these particular years and the presence of annual budgets in
the annual reports. Inclusion of more museums subsidized by the MinOCW in the sample would have
been preferred, but their annual reports were either not available or did not include the required data.
The sample of the two museums and the ten-year sample period resulted in the limited number of 20
observations. This posed a considerable constraint on my research in obtaining significant results.
66
Despite this limitation, it was investigated whether the available data provided any information about
the effects of revenue diversification on the financial stability of the museum in terms of revenue
volatility. Towards this end a sub-question to Q1 was posed:
Q1.1: What is the impact of revenue diversification on revenue volatility for the Rijksmuseum and the
Van Gogh Museum?
A regression analysis was performed to test for significant correlation between revenue diversification
in t-1 and revenue volatility in t. The theory of revenue diversification explained that lower levels of
the diversification index (DI), which are the equivalent for higher degrees of diversification of
revenues, are related to lower levels of revenue volatility and thus higher levels of revenue
predictability. Revenue predictability was measured by the ability of museums to predict future
income in their budgets for the upcoming year. In other words, revenue volatility (RVt) was measured
in terms of the absolute difference between actual and budgeted total annual income. It was
hypothesized (H1) that higher degrees of revenue diversification, and thus lower values of the
diversification index (DIt-1), would have a lowering effect on revenue volatility in the following year
(RVt). The results from the regression analysis showed no significant relationship between the two
variables (RVt and DIt-1) given the data used. With respect to Q1.1, the hypothesis (H1) was rejected.
No significant evidence was found suggesting that higher degrees of revenue diversification have a
lowering effect on revenue volatility. Therefore the answer to my primary research question (Q1) on
whether revenue diversification could be considered a valid revenue management strategy for the
MinOCW-subsidized museums in Amsterdam cannot be properly answered. On the basis of the
available data and the regression no sound conclusions can be drawn on the effect of revenue
diversification. A larger and more comprehensive database is required to gain greater insight into the
effects of revenue diversification.
Even though statistically no evidence was found, some interesting observations could be made
with respect to the revenue distribution of the two museums. It was noted that while both museums
showed the same degree of diversification (ca. 0,50) the proportions of the revenue sources were
different. For the Rijksmuseum the major revenue source (65%) was the MinOCW, suggesting a
greater dependence on public support. At the same time, the Van Gogh Museum generates the
majority of the revenues (also 65%) in the earned income-category following a more commercial,
market-oriented strategy than the Rijksmuseum. Hence, their respective revenue portfolios are exactly
opposed. This was an incentive to further explore the differences between the revenue strategies of the
two museums and to investigate whether there was evidence that one strategy might be preferred over
another. This led me to the formulation of a second research question:
67
Q2: Does the Van Gogh Museum have a stronger financial position than the Rijksmuseum in terms of
asset size, current ratio, operating margins, and equity balances?
In the second part of the analysis the second question was addressed by comparing the financial
situation of the two museums. If one museum was to perform better financially than the other, this
finding could suggest that one revenue strategy might be favored over another.
Four measures were used to compare the financial positions of the two museums: asset size,
current ratio, operating margin, and equity balances. On three out of the four measures the Van Gogh
Museum outperformed the Rijksmuseum financially. The Van Gogh Museum had higher current
ratios, greater operating margins, and higher and more stable equity balances. Even more so, they held
significantly more equity relative to their assets compared to the Rijksmuseum. The fourth measure,
asset size, was concluded to be unfit as a measure of financial health of the museums in this sample
due to complicating circumstances underlying the fluctuations in the asset base. The Rijksmuseum
undertook an extensive renovation project in the sample period leading to an increase in asset size
unrelated to their financial strength. The decline in asset value for the Van Gogh Museum was related
to an internal change in the organizational structure after a merger of two subsidiary companies of the
museum. The asset size declined, however the merger is supposed to provide the museum with more
(cost) efficiency and hence better financial health. Even though the asset size of the Rijksmuseum was
greater than the asset size of the Van Gogh Museum in most years, no sound conclusion could be
drawn with respect to the relative financial position of the two museums. More in-depth research on
the underlying determinants of asset size is required to understand their effects on financial strength.
In sum, the answer to Q2 is that the Van Gogh Museum has a stronger financial position than
the Rijksmuseum on the basis of all relevant criteria: current ratio, operating margins, and equity
balances. The overall interpretation of the results has led to the conclusion that the Van Gogh Museum
is considered financially stronger than the Rijksmuseum given the data in the annual reports in this
sample period. Moreover, much of the financial data suggested that the comparative advantage of the
Van Gogh Museum was directly related to their ability to generate revenue from the market through
entrance fees and retail activities. Based on this conclusion, there is evidence suggesting that a more
market-oriented, commercial revenue strategy might be beneficial for the financial strength of
museums.
On the basis of the findings in this thesis no significant conclusion could be drawn with respect to
whether a revenue diversification strategy could be beneficial for museums in the Netherlands. The
inability to obtain significant results might have been caused by the limited availability of data. In the
first place the Rijksmuseum and the Van Gogh Museum were chosen because they were both
supported by the MinOCW and due to their comparability in terms of visitor numbers, quality of the
collection and international status. However, they also turned out to be the only two museums
68
subsidized by the MinOCW that provided the necessary data to perform the study and the most annual
reports to address the greatest time span possible. The small sample size limits the ability to generalize
the results, since the two museums are not very representative of the Dutch museum sector as a whole.
To gain more insight in the actual effects a larger sample of museums should be used.
Another limitation related to the sample period is concerned with the extensive renovation
project of the Rijksmuseum that coincided more or less exactly with the sample period used. The
renovation project was financed by the MinOCW and the Rijksmuseum itself. Therefore the revenue
data of the Rijksmuseum may not have been very representative of the normal situation. This made the
ability to compare their financial position with the Van Gogh Museum questionable. However,
throughout the renovation project the Rijksmuseum remained (partially) open and was able to attract a
considerable amount of visitors. The question is whether under normal circumstances the level of
revenue diversification of the Rijksmuseum would be significantly different: it is questioned whether
the museum is capable of generating more revenue in the market under normal circumstances and
whether the subsidy of the MinOCW would be smaller.
Other limitations were encountered in the inconsistency in financial reporting and in the lack
of transparency with respect to the underlying causes of fluctuations in revenue data. While the Van
Gogh Museum was very clear and consistent in their way of reporting, the Rijksmuseum showed less
consistency. However, the Rijksmuseum did specify and describe mutations in the financial data,
whereas the Van Gogh Museum was less thorough. Even more so, although the annual reports are a
comprehensive source of financial data, they do not provide a complete visual on the financial
positions of the museums. Presence of independent funds or subsidiary companies directly supporting
the museums and their effect on the financial position of the museums need to be further investigated.
An insight that was gained throughout this study is that it is very difficult to get a clear visual
on the financial position of the museums from their annual reports. Financial and revenue structures
are very complex and their implications on financial stability and strength are often hard to trace. The
motivation for this study was to explore new revenue strategies for museums. However, aside from
new revenue strategies, the financial reporting of museums might require reevaluation.
The study performed in this thesis is a mere stepping stone to further research. Even though no
significant results have been found regarding the potential benefits of revenue diversification, no
evidence was found proving the opposite. The effects of revenue diversification for museums in the
Netherlands require further investigation using a larger sample of museums and preferably a longer
sample period. The investigation of a better-balanced revenue portfolio for museums in the
Netherlands remains relevant and could be a source of interesting information for the sector at large.
With respect to the second analysis in this thesis, some evidence was found suggesting that a
more market-oriented strategy might be of benefit to museums. This finding also requires further
investigation to see whether the results can be generalized to other museums. It would be interesting to
69
compare a larger sample of museums following a market-oriented, commercial approach, with a larger
sample of museums that follow a revenue strategy that is more focused on subsidy income and
donative income.
70
Bibliography
Academic references
Anderson, R.G.W. (2005). To thrive or to survive? The state and status of research in museums.
Museum Management and Curatorship, 20(4), 297-311.
Andreoni, J. (1990). Impure altruism and donations to public goods: a theory of warm-glow
giving. The economic journal, 100(401), 464-477.
Andreoni, J. (1995). Cooperation in public-goods experiments: kindness or confusion? The American
Economic Review, 891-904.
Berk, J.B., and DeMarzo, P.M. (2007). Corporate finance. Pearson Education.
Boris, E.T., & Steuerle, C.E. (2006). Scope and Dimensions of the Nonprofit Sector. The nonprofit
sector: A research handbook, 66-88.
Carroll, D.A., & Stater, K.J. (2009). Revenue diversification in nonprofit organizations: does it lead to
financial stability? Journal of Public Administration Research and Theory, 19(4), 947-966.
Chabotar, K.J. (1989). Financial ratio analysis comes to nonprofits. The Journal of Higher
Education, 188-208.
Chang, C. F., & Tuckman, H. P. (1990). Why do nonprofit managers accumulate surpluses, and how
much do they accumulate? Nonprofit Management and Leadership, 1(2), 117-135.
Chang, C.F., & Tuckman, H.P. (1994) Revenue diversification among nonprofits. VOLUNTAS:
International Journal of Voluntary and Nonprofit Organizations, 5(3), 273–290.
Chang, C.F., & Howard Tuckman (2010). Income diversification. Handbook of Research on Nonprofit
Economics and Management, 5-17.
Dulken, H. van (2002). Sanering van de subsidiëring: overheidsbemoeienis met monumentenzorg,
film en toneel vanaf de jaren zestig. Amsterdam: Boekmanstudies.
71
Evans, J. L., & Archer, S. H. (1968). Diversification and the reduction of dispersion: an empirical
analysis. The Journal of Finance, 23(5), 761-767.
Fischer, R.L., Wilsker, A. & Young D.R. (2011). Exploring the revenue mix of nonprofit
organizations: Does it relate to publicness? Nonprofit and Voluntary Sector Quarterly, 40(4),
662-681.
Frey, B.S. (1999). State support and creativity in the arts: some new considerations. Journal of
Cultural Economics, 23(1-2), 71-85.
Frey, B.S., & Meier, S. (2006). The economics of museums. Handbook of the Economics of Art and
Culture, 1, 1017-1047.
Frey, B. S., & Steiner, L. (2012). Pay as you go: a new proposal for museum pricing. Museum
Management and Curatorship, 27(3), 223-235.
Froelich, K.A. (1999). Diversification of revenue strategies: Evolving resource dependence in
nonprofit organizations. Nonprofit and Voluntary Sector Quarterly, 28(3), 246– 268.
Frumkin, P., & Keating E.K. (2002). The risks and rewards of nonprofit revenue concentration.
Hauser Center for Nonprofit Organizations, Harvard University Working Paper.
Frumkin, P., and Keating, E.K. (2011). Diversification reconsidered: The risks and rewards of revenue
concentration. Journal of Social Entrepreneurship, 2(2): 151-164.
Fuller, R. J., & Farrell, J. L. (1987). Modern investments and security analysis. New York:
McGraw-Hill.
Galaskiewicz, J., & Bielefeld, W. (1998). Nonprofit organizations in an age of uncertainty: A study
of growth and decline. Aldine de Gruyter.
Ginsburgh, V.A. (2004). Economics of art and culture. Amsterdam: Elsevier.
Greenlee, J. (2002). Revisiting the prediction of financial vulnerability. Nonprofit Management and
Leadership, 13(1), 17–31.
72
Greenlee, J., & Trussel J. (2000). Estimating the financial vulnerability of charitable organizations.
Nonprofit Management and Leadership, 11 (2), 199–210.
Gronbjerg, K.A. (1992). Nonprofit human service organizations: Funding strategies and
patterns of adaptation. Human Services as Complex Organizations, 73-97.
Gronbjerg, K.A. (1993). Understanding nonprofit funding: Managing revenues in social
service and community development organizations. San Francisco: Jossey-Bass.
Hager, M. (2001). Financial vulnerability among arts organizations: A test of the Tuckman-Chang
measures. Nonprofit and Voluntary Sector Quarterly, 30(2), 376–92.
Hansmann, H.B. (1980). The role of the nonprofit enterprise. The Yale law journal, 89(5), 835- 901.
Hansmann, H.B. (1987). Economic theories of nonprofit organization. The nonprofit sector: A
research handbook, 1, 27–42.
James, E. (2003). Commercialism and the mission of nonprofits. Society, 40(4), 29-35.
Jegers, M. (1997). Portfolio theory and nonprofit financial stability: A comment and extension.
Nonprofit and Voluntary Sector Quarterly, 26(1), 65–72.
Johnson, P., & Thomas, B. (1998). The Economics of Museums: A research perspective. Journal of
Cultural Economics, 22(2-3), 75-85.
Kearns, Kevin (2007). Income portfolios. Financing nonprofits: putting theory into practice, 291-
314.
Keating, E., Fischer, M., Gordon, T., & Greenlee, J. (2005). Assessing financial vulnerability in the
nonprofit sector. Hauser Center for Nonprofit Organizations, Harvard University Working
Paper.
Klamer, A. (2011). Cultural entrepreneurship. The Review of Austrian Economics, 24(2), 141-156.
Klamer, A. and P.W. Zuidhof (1999). The values of cultural heritage: merging economic and cultural
appraisals. Economics and Heritage Conservation. Los Angeles: Getty Conservation Institute.
73
Kotler, N.G., Kotler, P., & Kotler, W.I. (2008). Museum marketing and strategy: designing
missions, building audiences, generating revenue and resources. Jossey-Bass.
Leclair, M.S., & Gordon. K. (2000). Corporate support for artistic and cultural activities: What
determines the distribution of corporate giving? Journal of Cultural Economics, 24(3), 225-
241.
Lindqvist, K. (2012). Museum finances: challenges beyond economic crises. Museum Management
and Curatorship, 27(1), 1-15.
Lingle, C. (1992). Public choice and public funding of the arts. In Cultural Economics (pp. 21-30).
Springer Berlin Heidelberg.
Luksetich, W. A., & Partridge, M. D. (1997). Demand functions for museum services. Applied
Economics, 29(12), 1553-1559.
Markowitz, Harry M. (1952). Portfolio selection. Journal of Finance, 7(1), 77– 91.
Markowitz, Harry M. (1991). Foundations of Portfolio Theory. Journal of Finance, 46(2), 469-477.
Martinius, W. O. (1990). Schoonheid, welzijn, kwaliteit: kunstbeleid en verantwoording na 1945. G.
Schwartz/SDU.
Mayer, W.J., Wang, H.C., Egginton, J.F., & Flint, H.S. (2012). The impact of revenue diversification
on expected revenue and volatility for nonprofit organizations. Nonprofit and Voluntary Sector
Quarterly, 20(10), 1-19.’
McPherson, G. (2006). Public memories and private tastes: the shifting definitions of museums and
their visitors in the UK. Museum Management and Curatorship, 21(1), 44-57.
Noble, J. V. (1970). Museum manifesto. Museum News, 48(8), 16-20.
Netzner, D. (2006). Nonprofit organizations. A Handbook of Cultural Economics, 331-341.
Ost, C. (2012). Mapping heritage economics for spatial analysis in historic city cores. In The
Economics of Uniqueness (pp. 245-32). Washington, D.C.: The World Bank.
74
Pfeffer, J., & Salancik, G.R. (1978). The external control of organizations. New York.
Prieto-Rodríguez, J., & Fernández-Blanco, V. (2006). Optimal pricing and grant policies for museums.
Journal of Cultural Economics, 30(3), 169-181.
Rottenberg, B. (2002). Museums, information and the public sphere. Museum International, 54(4),
21–28.
Steenbergen, R. (2008). De nieuwe mecenas: Cultuur en de terugkeer van het particuliere geld. Renee
Steenbergen.
Thompson, J.D. (1967). Organizations in action. New York: McGraw-Hill.
Towse, R. (2010). A textbook of cultural economics. Cambridge University Press.
Tuckman, H.P., & Chang, C.F. (1991). A methodology for measuring the financial vulnerability
charitable nonprofit organizations. Nonprofit and Voluntary Sector Quarterly, 20(4), 445–460.
Urry, J. (1996). How societies remember the past. Theorizing museums, 45-65.
Weisbrod, B.A. (1998). Guest editor’s introduction: The nonprofit mission and its financing. Journal
of Policy Analysis and Management, 17(2), 165-174.
Williams, J.O. (1997). Maximizing the probability of achieving investment goals. The Journal of
Portfolio Management, 24(1), 77–81.
Young, D.R. (2007). Why study nonprofit finance? Financing nonprofits: Putting theory into practice,
3-20.
75
Other references – websites, dictionaries, etc.
Asset [Def. 3]. (n.d.). Oxford English Dictionary Online. In Oxford English Dictionary. Retrieved
June 3, 2013, from:
http://www.oed.com/view/Entry/11866?redirectedFrom=asset#eid
Council of Europe/ERICarts (2011). Compendium of Cultural Policies and Trends in Europe, 12th
edition 2011. Retrieved June 20, 2013, from:
http://www.culturalpolicies.net/down/netherlands_052008.pdf
Cultuursubsidie.nl (2013). Ministerie van Onderwijs, Cultuur en Wetenschap, Subsidieverstrekkers.
Retrieved June 3, 2013, from:
http://www.cultuursubsidie.nl/subsidieverstrekkers/ministerie-ocw
EGMUS/European Group on Museum Statistics (2013).
http://www.egmus.eu/nc/en/statistics/complete_data/
International Council of Museums (ICOM). Museum Definition. Icom.museum. Retrieved June 3,
2013, from:
http://icom.museum/the-vision/museum-definition/.
International Council of Museums (ICOM). Code of Ethics. Icom.museum. Retrieved July 9, 2013,
from:
http://icom.museum/the-vision/code-of-ethics
Lewis, Geoffrey (2003). Deaccessioning and the ICOM Code of Ethics for Museums. ICOM News,
no. 1, p. 3.
Ministerie van Onderwijs Cultuur en Wetenschap (2012). Cultuur in Beeld 2012. Rijksoverheid, June
2012. Retrieved June 3, from:
http://www.rijksoverheid.nl/documenten-en-publicaties/rapporten/2012/10/22/cultuur-in-
beeld-2012.html
Museum [Def. 1a, 1b, 2a]. (n.d.). Oxford English Dictionary Online. In Oxford English Dictionary.
Retrieved June 3, 2013, from:
http://www.oed.com/search?searchType=dictionary&q=museum&_searchBtn=Search.
76
Rijksmuseum.nl (2013). Rijksmuseum Amsterdam:
http://www.rijksmuseum.nl
SICA. Overige Fondsen en Regelingen. Sica.nl. Retrieved, June 21, 2013, from
http://www.sica.nl/content/nl-overige-fondsen-en-regelingen
Stichting Museana (2011). Museumcijfers 2011. Retrieved june 3, 2013, from:
http://issuu.com/nederlandse_museumvereniging/docs/museumcijfers2011?e=6970311/26069
95
Vangoghmuseum.nl (2013). Van Gogh Museum Amsterdam:
http://www.vangoghmuseum.nl
Vereniging Rembrandt. Geschiedenis. Verenigingrembrandt.nl. Retrieved June 3, 2013, from
http://www.verenigingrembrandt.nl/74/de-vereniging/geschiedenis/.
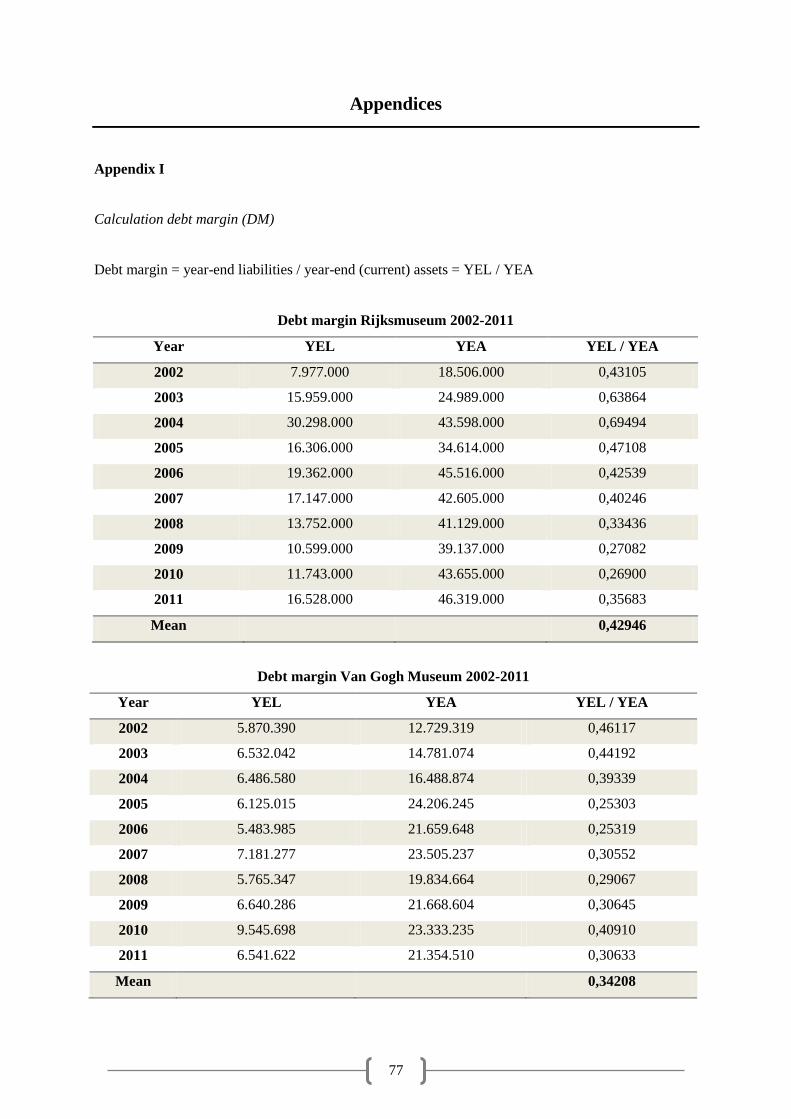
77
Appendices
Appendix I
Calculation debt margin (DM)
Debt margin = year-end liabilities / year-end (current) assets = YEL / YEA
Debt margin Rijksmuseum 2002-2011
Year YEL YEA YEL / YEA
2002 7.977.000 18.506.000 0,43105
2003 15.959.000 24.989.000 0,63864
2004 30.298.000 43.598.000 0,69494
2005 16.306.000 34.614.000 0,47108
2006 19.362.000 45.516.000 0,42539
2007 17.147.000 42.605.000 0,40246
2008 13.752.000 41.129.000 0,33436
2009 10.599.000 39.137.000 0,27082
2010 11.743.000 43.655.000 0,26900
2011 16.528.000 46.319.000 0,35683
Mean
0,42946
Debt margin Van Gogh Museum 2002-2011
Year YEL YEA YEL / YEA
2002 5.870.390 12.729.319 0,46117
2003 6.532.042 14.781.074 0,44192
2004 6.486.580 16.488.874 0,39339
2005 6.125.015 24.206.245 0,25303
2006 5.483.985 21.659.648 0,25319
2007 7.181.277 23.505.237 0,30552
2008 5.765.347 19.834.664 0,29067
2009 6.640.286 21.668.604 0,30645
2010 9.545.698 23.333.235 0,40910
2011 6.541.622 21.354.510 0,30633
Mean
0,34208
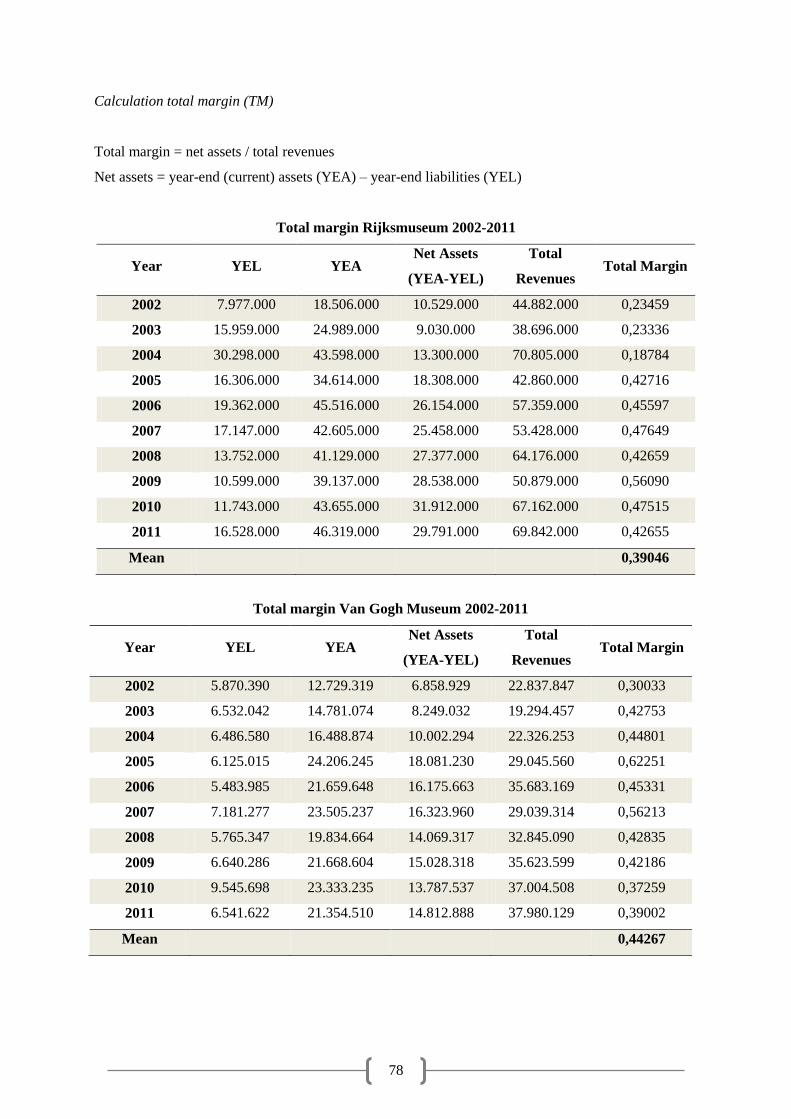
78
Calculation total margin (TM)
Total margin = net assets / total revenues
Net assets = year-end (current) assets (YEA) – year-end liabilities (YEL)
Total margin Rijksmuseum 2002-2011
Year YEL YEA Net Assets
(YEA-YEL)
Total
Revenues Total Margin
2002 7.977.000 18.506.000 10.529.000 44.882.000 0,23459
2003 15.959.000 24.989.000 9.030.000 38.696.000 0,23336
2004 30.298.000 43.598.000 13.300.000 70.805.000 0,18784
2005 16.306.000 34.614.000 18.308.000 42.860.000 0,42716
2006 19.362.000 45.516.000 26.154.000 57.359.000 0,45597
2007 17.147.000 42.605.000 25.458.000 53.428.000 0,47649
2008 13.752.000 41.129.000 27.377.000 64.176.000 0,42659
2009 10.599.000 39.137.000 28.538.000 50.879.000 0,56090
2010 11.743.000 43.655.000 31.912.000 67.162.000 0,47515
2011 16.528.000 46.319.000 29.791.000 69.842.000 0,42655
Mean
0,39046
Total margin Van Gogh Museum 2002-2011
Year YEL YEA Net Assets
(YEA-YEL)
Total
Revenues Total Margin
2002 5.870.390 12.729.319 6.858.929 22.837.847 0,30033
2003 6.532.042 14.781.074 8.249.032 19.294.457 0,42753
2004 6.486.580 16.488.874 10.002.294 22.326.253 0,44801
2005 6.125.015 24.206.245 18.081.230 29.045.560 0,62251
2006 5.483.985 21.659.648 16.175.663 35.683.169 0,45331
2007 7.181.277 23.505.237 16.323.960 29.039.314 0,56213
2008 5.765.347 19.834.664 14.069.317 32.845.090 0,42835
2009 6.640.286 21.668.604 15.028.318 35.623.599 0,42186
2010 9.545.698 23.333.235 13.787.537 37.004.508 0,37259
2011 6.541.622 21.354.510 14.812.888 37.980.129 0,39002
Mean
0,44267
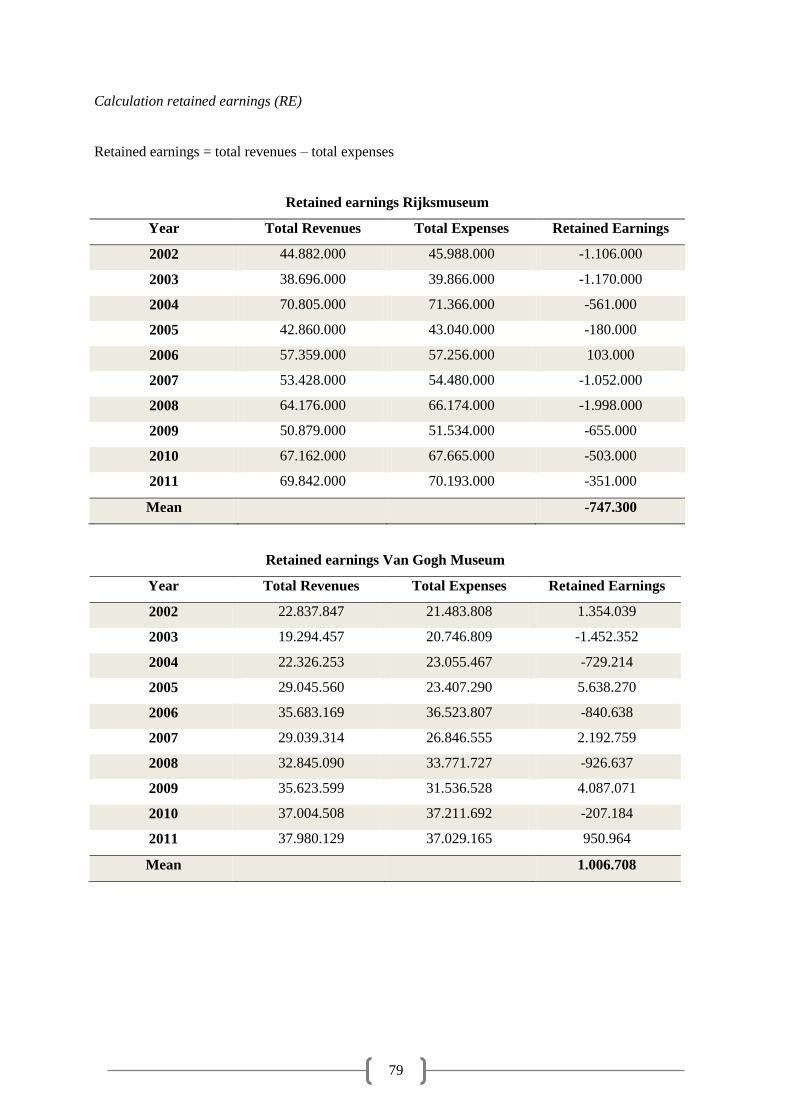
79
Calculation retained earnings (RE)
Retained earnings = total revenues – total expenses
Retained earnings Rijksmuseum
Year Total Revenues Total Expenses Retained Earnings
2002 44.882.000 45.988.000 -1.106.000
2003 38.696.000 39.866.000 -1.170.000
2004 70.805.000 71.366.000 -561.000
2005 42.860.000 43.040.000 -180.000
2006 57.359.000 57.256.000 103.000
2007 53.428.000 54.480.000 -1.052.000
2008 64.176.000 66.174.000 -1.998.000
2009 50.879.000 51.534.000 -655.000
2010 67.162.000 67.665.000 -503.000
2011 69.842.000 70.193.000 -351.000
Mean
-747.300
Retained earnings Van Gogh Museum
Year Total Revenues Total Expenses Retained Earnings
2002 22.837.847 21.483.808 1.354.039
2003 19.294.457 20.746.809 -1.452.352
2004 22.326.253 23.055.467 -729.214
2005 29.045.560 23.407.290 5.638.270
2006 35.683.169 36.523.807 -840.638
2007 29.039.314 26.846.555 2.192.759
2008 32.845.090 33.771.727 -926.637
2009 35.623.599 31.536.528 4.087.071
2010 37.004.508 37.211.692 -207.184
2011 37.980.129 37.029.165 950.964
Mean
1.006.708