Embed Size (px)
Citation preview
iXIMPRASSOCIATES INC.E N GINE EBS
Evaluation of Cook Recirculation Sump Levelfor Reduced Pump Flow Rates
Revision 0
~s
Prepared by:Michell He'
Reviewed by: el~/)qRobert . C ard
eV«Robert N. Coward
QUALlTYASSURANCE DOCUMENT
This document has been prepared, reviewed, and approved in accordance withthe Quality Assurance requirements of 10CFR50 Appendix B, as specified inthe MPR Quality Assurance Manual.
qqg0060i 5000307 qq500ipDR; QDQC p
gii'
1.0 PURPOSE
The purpose of this evaluation is to determine minimum water level in the Cookcontainment recirculation sump as a function of total pump flow. The minimum water levelwillensure satisfactory hydraulic sump performance over the expected range of flows. Thisrange includes flows lower than those tested in the original development of the sumpdesign.
2.0 METHODOLOGY
The minimum water level as a function of flow is developed using the results of AldenResearch Laboratory's 1978 testing, supplemental information provided by Alden in 1998,and classic weir wall flowcorrelations. Correlations for flow over weir walls and preventionofvortexing are used with the data from the 1978 tests to develop the minimum water levelsfor satisfactory performance.
3.0 BACKGROUND
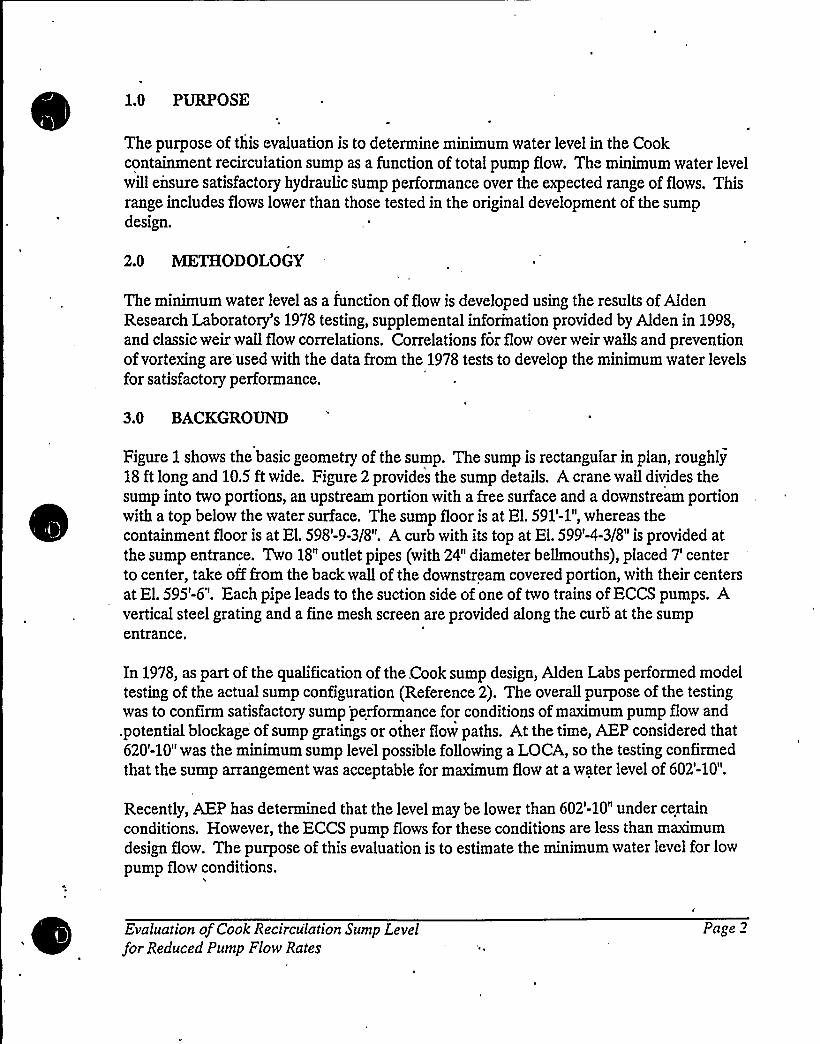
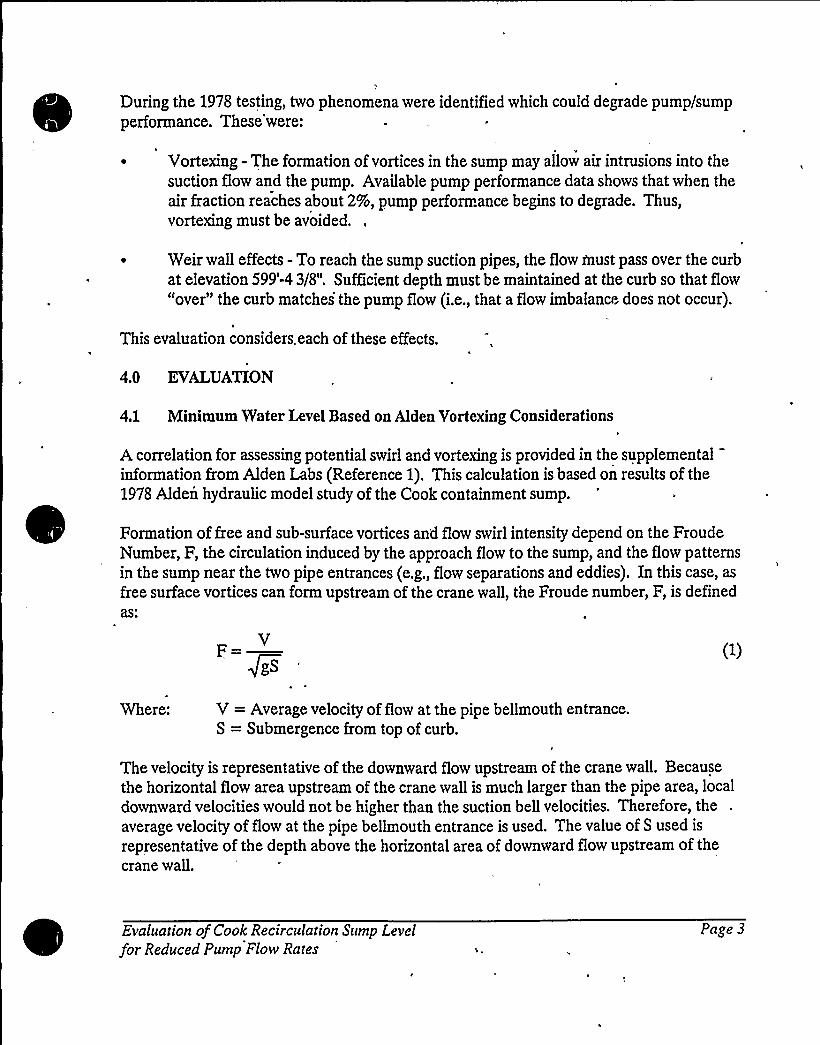
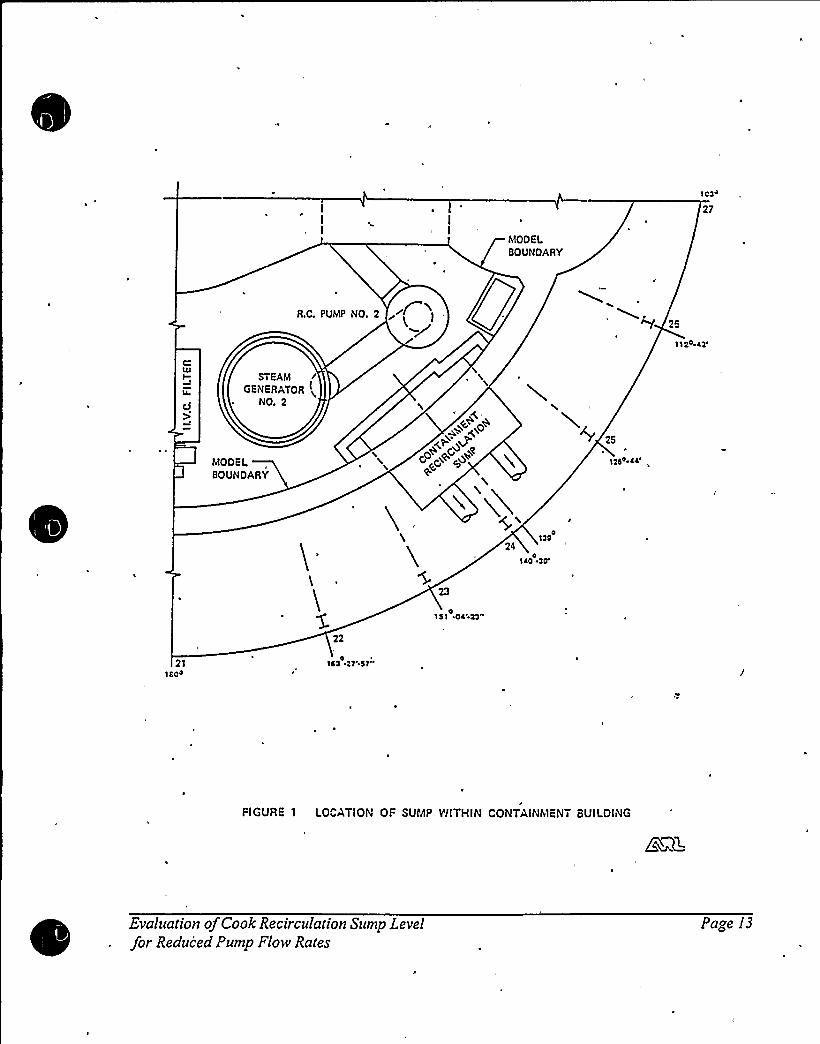
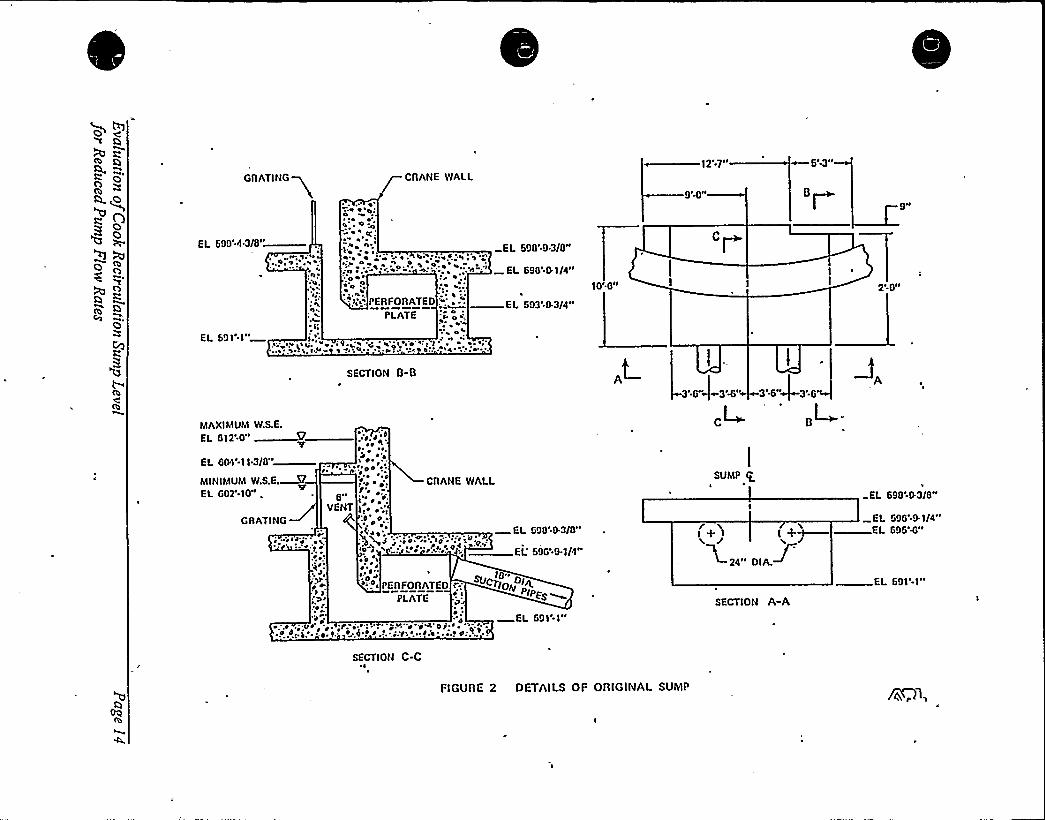
Figure 1 shows the basic geometry of the sump. The sump is rectangular in plan, roughly18 ft long and 10.5 ftwide. Figure 2 provides the sump details. A crane wall divides thesump into two portions, an upstream portion with a free surface and a downstream portionwith a top below the water surface. The sump floor is at El. 591'-1", whereas thecontainment floor is at El. 598'-9-3/8". A curb with its top at El. 599'-4-3/8" is provided atthe sump entrance. Two 18" outlet pipes (with 24" diameter bellmouths), placed 7'enterto center, take offfrom the back wall of the downstream covered portion, with their centersat El. 595'-6". Each pipe leads to the suction side of one of two trains of ECCS pumps. Avertical steel grating and a fine mesh screen are provided along the curb at the sumpentrance.
In 1978, as part of the qualification of the,Cook sump design, Alden Labs performed modeltesting of the actual sump configuration (Reference 2). The overall purpose of the testingwas to confirm satisfactory sump performance for conditions of maximum pump flow and.potential blockage of sump gratings or other flow paths. At the time, AEP considered that620'-10" was the minimum sump level possible following a LOCA, so the testing confirmedthat the sump arrangement was acceptable for maximum flow at a water level of 602'-10".
Recently, AEP has determined that the level may be lower than 602'-10" under certainconditions. However, the ECCS pump flows for these conditions are less than maximumdesign flow. The purpose of this evaluation is to estimate the minimum water level for low
pump flow conditions.
Evaluation of Cook Recircu'lation Sump Levelfor Reduced Pump Flow Rates
Page 2
During the 1978 testing, two phenomena were identified which could degrade pump/sumpperformance. These'were:
~ Vortexing - The formation of vortices in the sump may allow air intrusions into thesuction Qow and the pump. Available pump performance data shows that when theair fraction reaches about 2%, pump performance begins to degrade. Thus,vortexing must be avoided.
~ Weir wall effects - To reach the sump suction pipes, the flow must pass over the curbat elevation 599'-4 3/8". Sufflcient depth must be maintained at the curb so that flow"over" the curb matches'he pump flow (i.e,, that a Qow imbalance does not occur).
This evaluation considers. each of these effects.
4.0 EVALUATION
4.1 MinimumWater Level Based on Alden Vortexing Considerationsr
Acorrelation for assessing potential swirl and vortexing is provided in the supplementalinformation from Alden Labs (Reference 1). This calculation is based on results of the1978 Alden hydraulic model study of the Cook containment sump.
Formation of free and sub-surface vortices and flow swirl intensity depend on the FroudeNumber, F, the circulation induced by the approach flow to the sump, and the flow patternsin the sump near the two pipe entrances (e.g., flow separations and eddies). In this case, as
free surface vortices can form upstream of the crane wall, the Froude number, F, is definedas'.
VF,=—~gs
Where: V = Average velocity of Qow at the pipe bellmouth entrance.S = Submergence from top of curb.
The velocity is representative of the downward flow upstream of the crane wall. Becausethe horizontal flow area upstream of the crane wall is much larger than the pipe area, localdownward velocities would not be higher than the suction bell velocities. Therefore, theaverage velocity of Qow at the pipe bellmouth entrance is used. The value of S used is
representative of the depth above the horizontal area of downward flow upstream of thecrane wall.
Evaluation ofCook Recirculation Sump Levelfor Reduced Pump Flow Rates
Page 3
The Froude Number is the parameter which controls vortexing and swirls. The minimumwater level providing satisfactory hydraulic performance for a lower flow than that tested inthe 1978 Alden model can be determined by keeping the respective Froude Numbersessentially the same between the two cases. By equating the Froude Number for the newconditions under consideration with the earlier 1978 model Froude Number, F,
V
g min
(2)
't
The minimum water level above the curb top for the new conditions may be calculated byH
p2S. =—
2
gm(3)
The model Froude Number is based on the,1978 Alden report test case considering a flowof 9,500 gpm. This flow gave. satisfactory performance with up to 50%'grating/screenblockage for a water elevation of 602'-10". These values are used in equation (2) tocalculate F .
The flow of 9,500 gpm is first converted to cfs as follows:
Q = 9,500gpm +'
21.17cfs0.002228
'f 1gpm
(4)
The pipe bell has an inside diameter of 2 ft. The corresponding pipe bell area and velocityat the pipe bell entrance are therefore:
V= —= 6.74ft/sQA
The submergence from the top of the curb is
(5)
(6)
S = 602.83ft-599.36ft = 3.47ft
The results from equations (6) and (7), along with a gravitational acceleration of 32.2ft/sec, are used in equation (2) to solve for a model Froude Number of 0.64.
(7)
Evaluation ofCook Recirculation Sump Levelfor Reduced Pump Flow Rates
Page 4
The model Froude Number can now be'used in equation (3) to determine minimumrequired water elevation for the new conditions. Flow. rates between 1,000 gpm and 15,000
gpm are considered. Velocity at the bellmouth entrance is calculated as in equations (4),(5), and (6). Gravitational acceleration is as before. Results of the application of equation
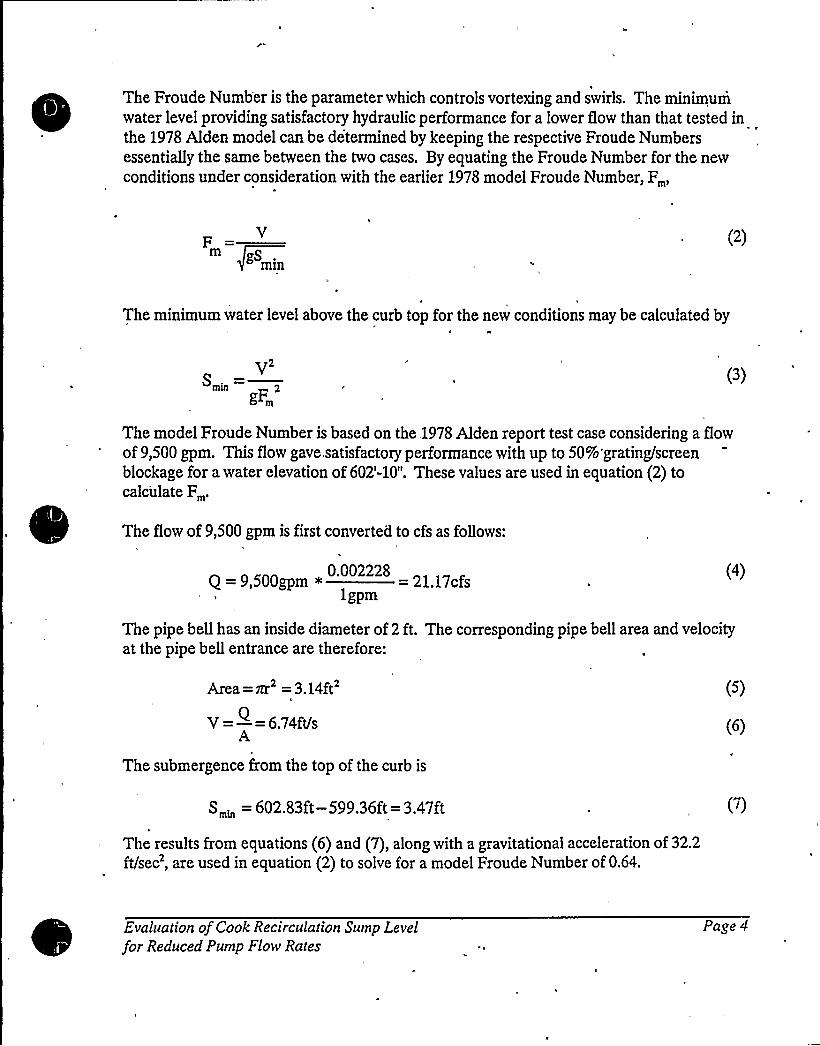
(3) are shown in Table 1. Figure 3 graphically depicts the minimum water elevation based
on vortexing considerations.
It is important to note that this method of calculating minimum required water elevationresults in a minimum elevation of at least 607'or a flow rate of 15,000 gpm, The 1978
testing concluded that 602'-10" was acceptable for this flow rate. These results show thatthe correlation used to assess vortexing is conservative.
4.2 MinimumWater Level Based on Alden Critical Flow Considerations
The second method considered in the Alden supplemental report (Reference 1) is based ona "critical depth", Y,. This critical depth is a function of the total approach flow, Q„ to thesump and the available width, B, over which the flow takes place:
Y,=—q'g (8)
Where: Y, = Critical flow depth (ft)q = Q,/B is the discharge per unit width (ft'/sec/ft)
g = gravitational acceleration (32.2 ft/sec )I
The upstream water level relative to the top of the curb needed to maintain the supply offlow to the sump is 1,5 Y,. For conservatism, Alden increased the factor to 2.0 Y,.Therefore, the minimum required water elevation is the elevation of:the top of the curb
plus 2Y,:
Where:
MWE= 599.36+ 2Y,
MWE = Minimumwater elevation (ft)
(9)
The possibility of 50% of the gratings/screen at the sump entrance being blocked byinsulation debris (fibrous and/or metallic) is considered in the critical depth calculation.
Only half the length of the available curb (9 ft) is considered when calculating the criticaldepth. Impervious blockage of the entire bottom portion of the grating/screen is
considered unrealistic and is not included in the Alden evaluation.
Evaluation of Cook Recirculation Sump Levelfor Reduced Pump Flow Rates
Page 5
0
Jl
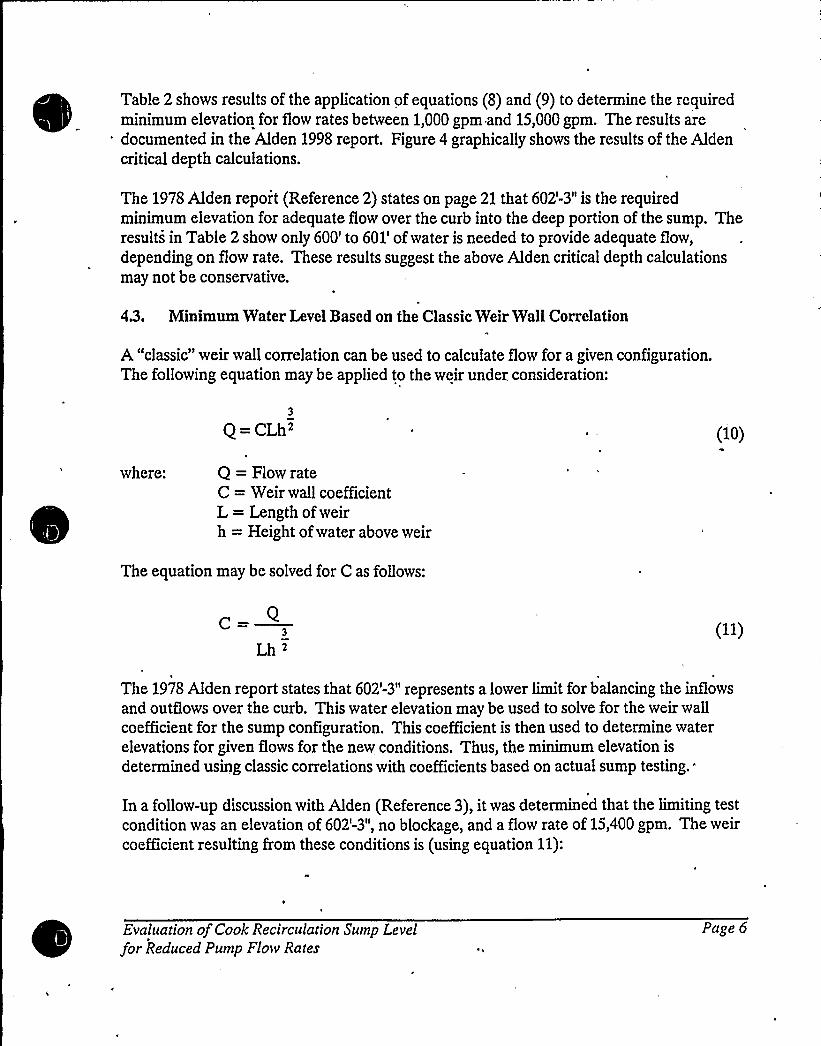
Table 2 shows results of the application of equations (8) and (9) to determine the requiredminimum elevation for flow rates between 1,000 gpm and 15,000 gpm. The results aredocumented in the Alden 1998 report. Figure 4 graphically shows the results of the Aldencritical depth calculations.
The 1978 Alden report (Reference 2) states on page 21 that 602'-3" is the requiredminimum elevation for adequate flow over the curb into the deep portion of the sump. Theresults in Table 2 show only 600'o 601'f water is needed to provide adequate flow,depending on flow rate. These results suggest the above Alden critical depth calculationsmay not be conservative.
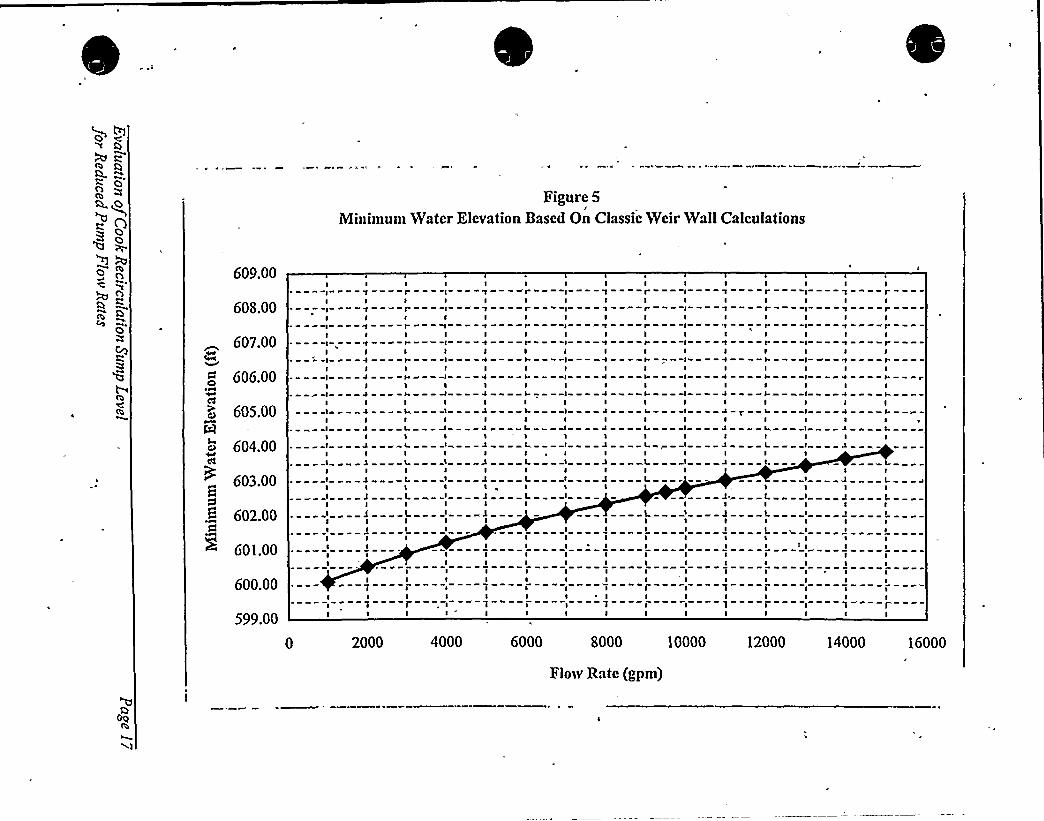
43. MinimumWater Level Based on the Classic Weir Wall Correlation
A "classic" weir wall correlation can be used to calculate flow for a given configuration.The following equation may be applied to the weir under consideration:
Q =CLh'10)where: Q = Flow rate
C = Weir wall coefficientL = Length of weirh = Height ofwater above weir
The equation may be solved for C as follows:
C=-Q3
Lh ~
The 1978 Alden report states that 602'-3" represents a lower limitfor balancing the inflowsand outflows over the curb. This water elevation may be used to solve for the weir wallcoefficient for the sump configuration. This coefficient is then used to determine waterelevations for given flows for the new conditions. Thus, the minimum elevation is
determined using classic correlations with coefficients based on actual sump testing. *
In a follow-up discussion with Alden (Reference 3), it was determined that the limiting testcondition was an elevation of 602'-3", no blockage, and a flow rate of 15,400 gpm. The weircoefflcient resulting from these conditions is (using equation 11):
Evaluation ofCook Recirculation Sump Levelfor Reduced Pump Flow Rates
Page 6
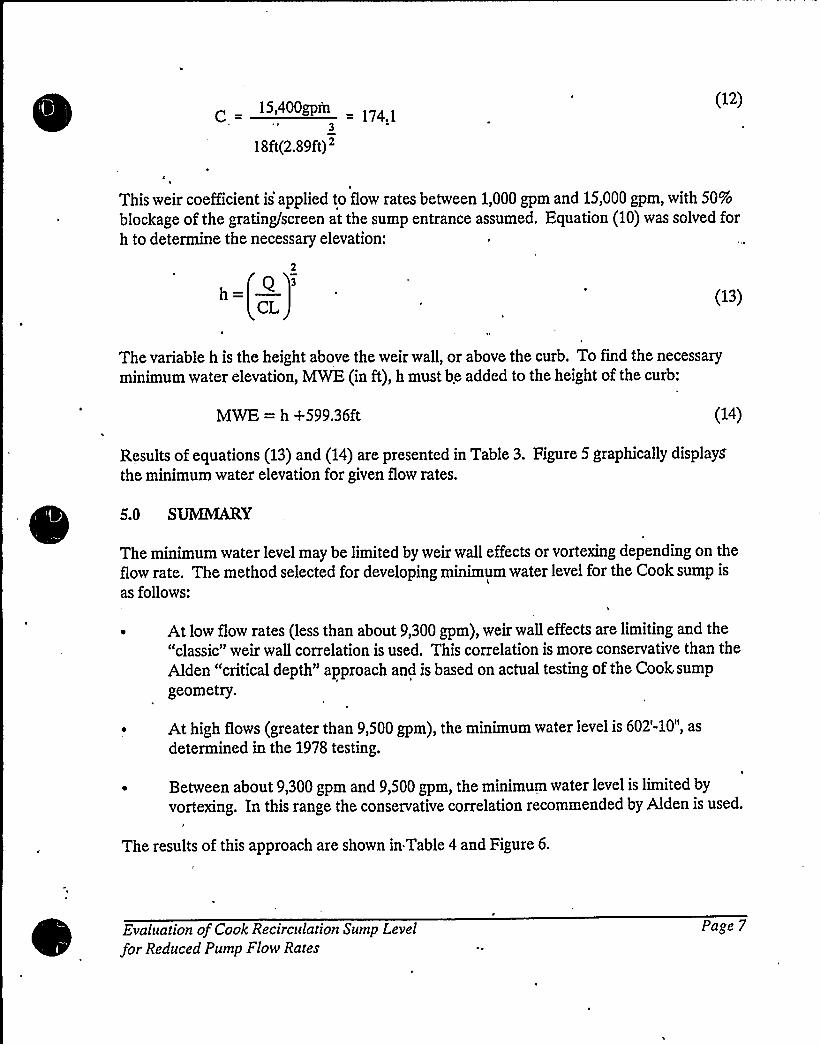
15,400 gpm 1743
18ft(2.89ft) ~
(12)
This weir coefficient is applied to flow rates between 1,000 gpm and 15,000 gpm, with 50%
blockage of the grating/screen at the sump entrance assumed. Equation (10) was solved forh to determine the necessary elevation:
2
Q 3h=—CL (13)
The variable h is the height above the weir wall, or above the curb. To find the necessary
minimum water elevation, MWE (in ft), h must be added to the height of the curb:
MWE = ll +599.36ft (14)
Results of equations (13) and (14) are presented in Table 3. Figure 5 graphicallydisplays'he
minimum water elevation for given flow rates.
5.0 SUMMARY
The minimum water level may be limited by weir wall effects or vortexing depending on the
flow rate. The method selected for developing minimum water level for the Cook sump is
as follows:
At low flow rates (less than about 9,300 gpm), weir wall effects are limiting and the"classic" weir wall correlation is used. This correlation is more conservative than theAlden "critical depth" approach and is based on actual testing of the Cook sump
geometry.
At high flows (greater than 9,500 gpm), the minimum water level is 602'-10", as
determined in the 1978 testing,
~ Between about 9,300 gpm and 9,500 gpm, the minimum water level is limited byvortexing. In this range the conservative correlation recommended by Alden is used.
The results of this approach are shown in.Table 4 and Figure 6.
Evaluation ofCook Recirculation Sump Level
for Reduced Pump Flow Rates
Page 7
During recirculation phase, the maximum flow rate from the sump corresponds to twoRHR trains operating and two containment spray pumps operating. The design pump flowrates for each of these systems are 3,000 gpm and 3,200 gpm, respectively, for a total flowrate of 12,400 gpm. The minimum required sump water elevation for a flow of 12,400 gpmis 602'-10".
The minimum sump flow rate during recirculation mode corresponds to one RHR trainfunctioning with a design pump flow rate of 3,000 gpm, and containment sprays notfunctioning due to low containment pressure. The minimum sump water elevation for a
flow rate of 3,000 gpm according to Figure 6 is approximately 600'-11". Thus, depending onthe sump average flow rate, the correlations developed in this evaluation could reduce therequired elevation by almost two feet.
6.0 REFERENCES
1. Letter to Mr. John Ripak of Indiana Michigan Power Company from MahadevanPadmanabhan of Alden Research Laboratory, Inc., "Evaluation of RequiredMinimum Submergence at D.C. Cook Containment Sump with One TrainOperating", January 8, 1998.
2. Padmanabhan, M., "Hydraulic Model Investigation of Vortexing and Swirl Within a
Reactor Containment Recirculation Sump", Alden Research Laboratory, Inc.,September, 1978.
3. Telephone conversation between R. Keating (MPR), J. Ripak (AEP), and M.Padmanabhan (ARL), January 22, 1999.
Evaluation of Cook Recirculation Sump Levelfor Reduced Pump'Flow Rates
Page 8
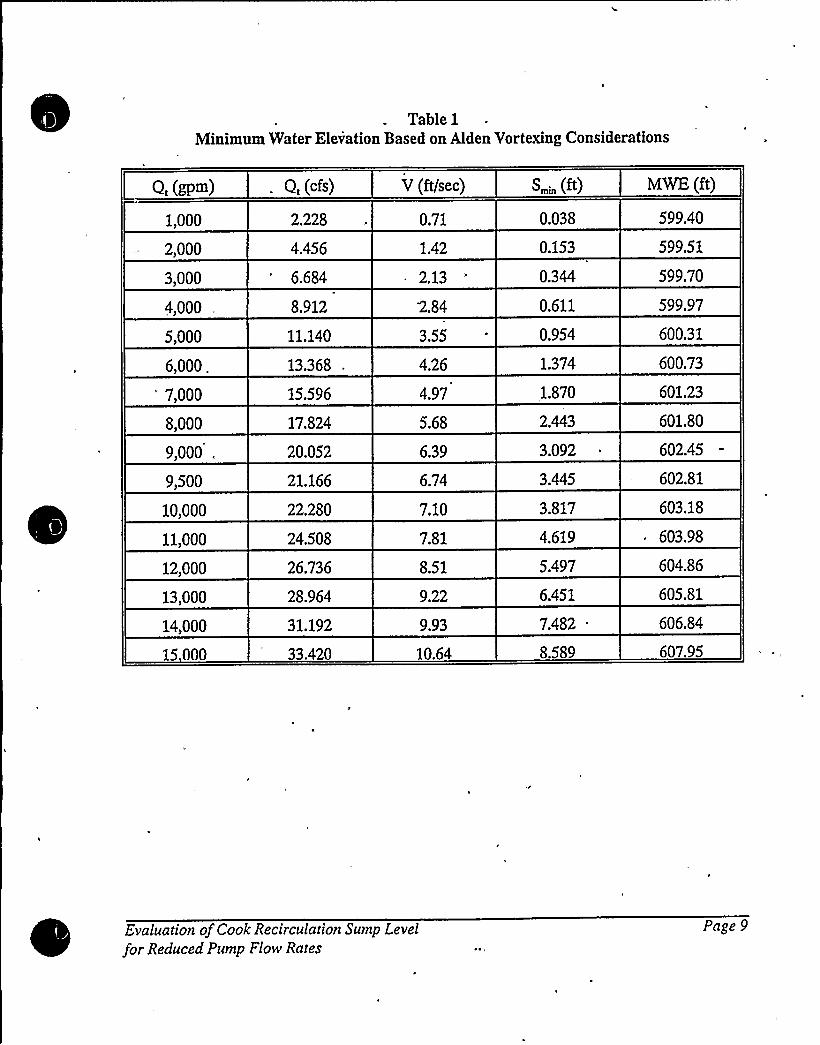
Table 1
MinimumWater Elevation Based on Alden Vortexing Considerations
Q, (gpm)
1,000
2,000
3,000
4,000
5,000
6,000."
7,000
8,000
9,000,
9,500
10,000
11,000
12,000
13,000
14,000
15 000
. Q,(cfs)
2.228
4.456
6.684
8,912
11.140
13.368
15.596
17.824
20.052
21.166
22.280
24.508
26.736
28.964
31.192
33.420
V (ft/sec)
0.71
1.42
2.13
2.84
3.55
4.26
4.97
5.68
6.39
6.74
7.10
7.81
8.51
9.22
9.93
10.64
s ,.„(ft)
0.038
0.153
0.344
0.611
0.954
1.374
1.870
2.443
3.092
3.445
3.817
4.619
5.497
6.451
7.482
8.589
MWE (ft)
599.40
599.51
599.70
599.97
600.31
600.73
601.23
601.80
602.45
602.81
603.18
603.98
604.86
605.81
606.84
607.95
Evaluation of Cook Recirculation Sump Level
for Reduced Pump Flow Rates
Page 9
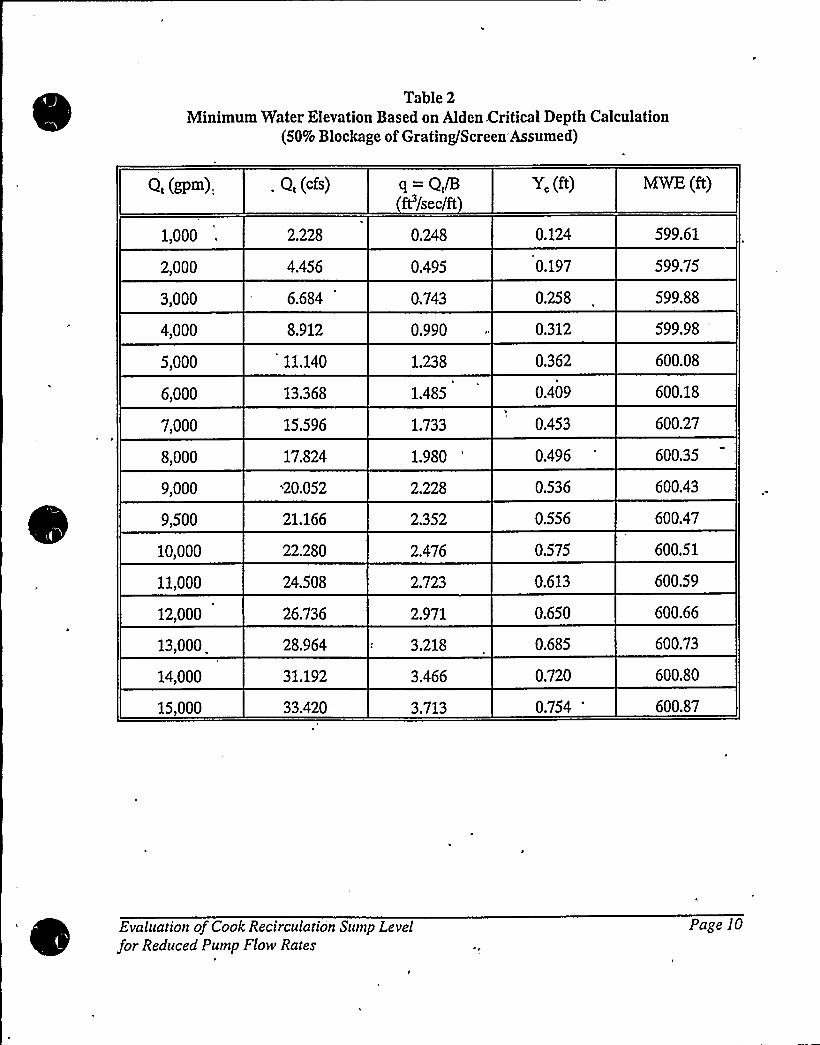
Table 2MinimumWater Elevation Based on Alden Critical Depth Calculation
(50Vo Blockage of Grating/Screen'Assumed)
1,000
2,000
3,000
4,000
5,000
6,000
7,000
8,000
9,000
9,500
10,000
11,000
12,000
13,000,
14,000
15,000
. Q,(cfs)
2.228
4.456
6.684
8,912
11.140
13.368
15.596
17.824
'20.052
21.166
22.280
24.508
26.736
28.964
31.192
33.420
q = Q,/Bft'/sec/ft
0.248
0.495
0.743
0.990
1.238
1.485
1.733
1.980
2.228
2.352
2.476
2.723
2.971
3.218
3.466
3.713
0.124
0.197
0.258
0.312
0.362
0.409
0.453
0.496
0.536
0.556
0.575
0.613
0.650
0.685
0.720
0.754
'WE
(ft)
599.61
599.75
599.88
599.98
'00.08
600.18
600.27
600.35
600.43
600.47
600,51
600.59
600.66
600.73
600.80
600.87
Evaluation ofCook Recirculation Sump Levelfor Reduced Pump Flow Rates
Page 10
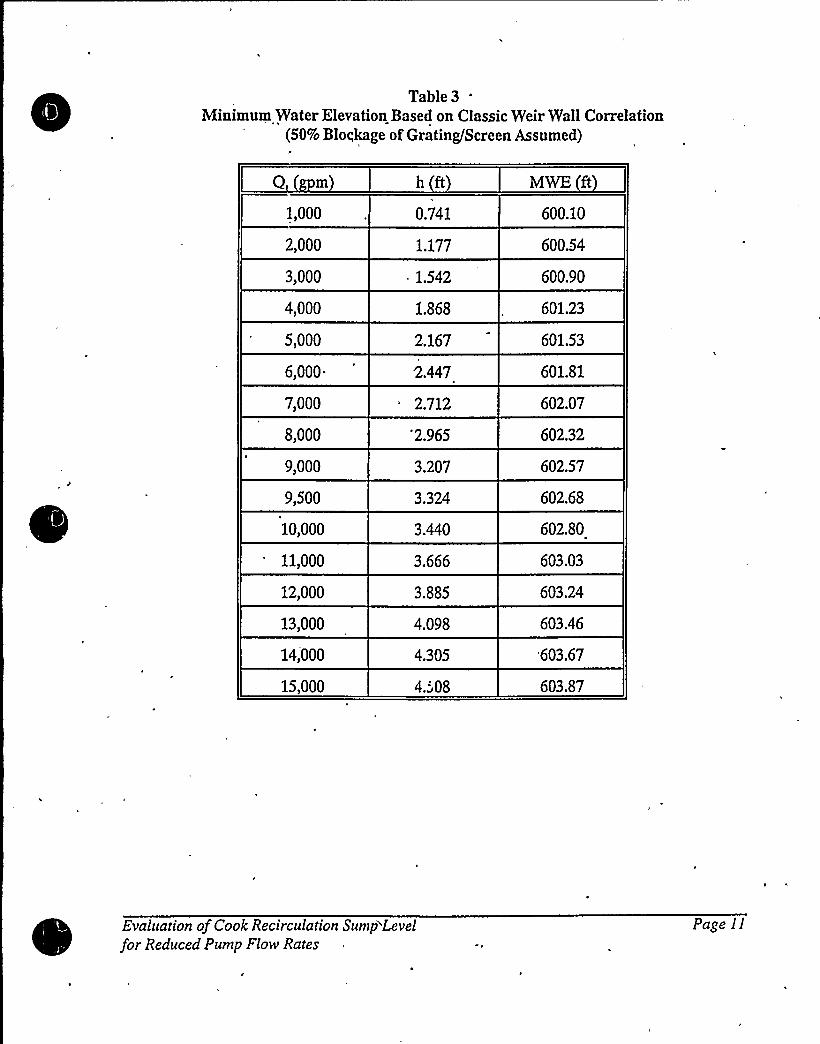
Table3'inimumWater Elevation Based on Classic Weir Wall Correlation
(50% Blockage of Grating/Screen Assumed)
Q m
1,000
2,000
3,000
4,000
5,000
6,000-
7,000
8,000
9,000
9,500
10,000
11,000
12,000
13,000
14,000
15,000
0.741
1.177
1.542
1.868
2.167
2.447
2.712
'2.965
3.207
3.324
3.440
3.666
3.885
4.098
4.305
4.~08
600.10
600.54
600.90
601.23
601.53
601.81
602.07
602.32
602.57
602.68
602.80
603.03
603.24
603.46
603.67
603.87
Evaluation of Cook Recirculation Sump'Levelfor Reduced Pump Flow Rates
Page II
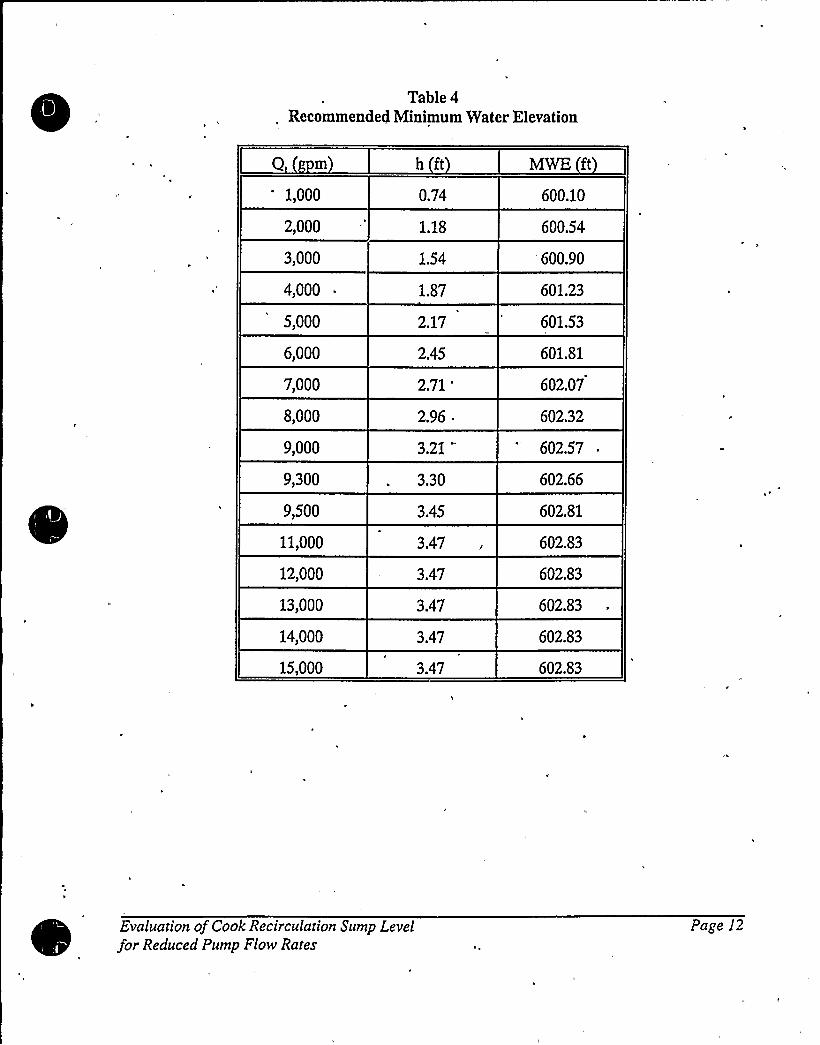
Table 4Recommended Minimum Water Elevation
Q m
1,000
2,000
3,000
4,000
5,000
6,000
7,000
8,000
9,000
9,300
9,500
11,000
12,000
13,000
14,000
15,000
0.74
1.18
1.54
1.87
2,17
2.45
2.71
'.96
~
3.21"
3.30
3.45
3.47
3.47
3.47
3.47
3.47
600.10
600.54
'00.90
601.23
601.53
601.81
602.07
602.32
602.57
602.66
602.81
602.83
602.83
602.83
602.83
602.83
Evaluation ofCook Recirculation Sump Levelfor Reduced Pump Flow Rates
Page 12
I
II
MODELBOUNDARY
1C2~
27
R.Q. PUhlP NO. 2
1120
02'TEAM
GENERATORNO. 2
MODELSOUNDARY
L
124
64'4
0129
160 20'
1600
22
162 27'57"0
151 .00'20
FIGURE 1 LO ATION OF SUMP lj'/ITHIN CONTAINMENT BUILOIiVG
Evaluation ofCook Recirculation Sump Levelfor Reduced Pump Flow Rates
Page (3
EE3
+ ~o
o
o
o
GRATING
EL886'63//8'L
591'I"
CAANE V/ALL
"..:; .. PEIIFOAATEOPLATE
~ 6 'O':2 I
~ ~
\ '
r~ ~
EL 593'-93/4"
~3 ~
o ~
o ~
EL 596'9 3/0"
EL 596'01/4"o or
10 0"
12'.7"
9'-0"
~ 56 3/r
2'66
0 6 6
MAXIMUMV/.S.E.
EL 8/2'8"~EL EM'll 3/8"
MINIMUMW.S.E.
EL G02'-10" .
GAATING
SECTION 8-0
. o.o '.~ ~
~'o
~ ~
r ~ ~l'r ~~6
12r ~ ~ 8
:o o ~
$x '".~ . ~ ..r(O
CIIANE WALLGrr
VENT
~ o \, ~"
'.; 6 PEAFOAATEO
EL 696'9-3/6"
EL" 596'9.1/4"
I .
3'-G" 3'6"
,l3'6"$3'6'Q
SUMP IL
/I + I I +~r/ />24" OW.>
EL 698'-0-3/8"
EL 69G'9.1/4"EL G95'-6"
EL 691'-1-
.o O.g ~ .. ~
PLATE
EL 691'1"t -OC.4'6 O.'.Er.VEr." 6:O .. r.t O..;. ~ .
SECTION C- C
SECTION A-A
FIGURE 2 DETAILS OF ORIGINAL SUMP~g„ l,
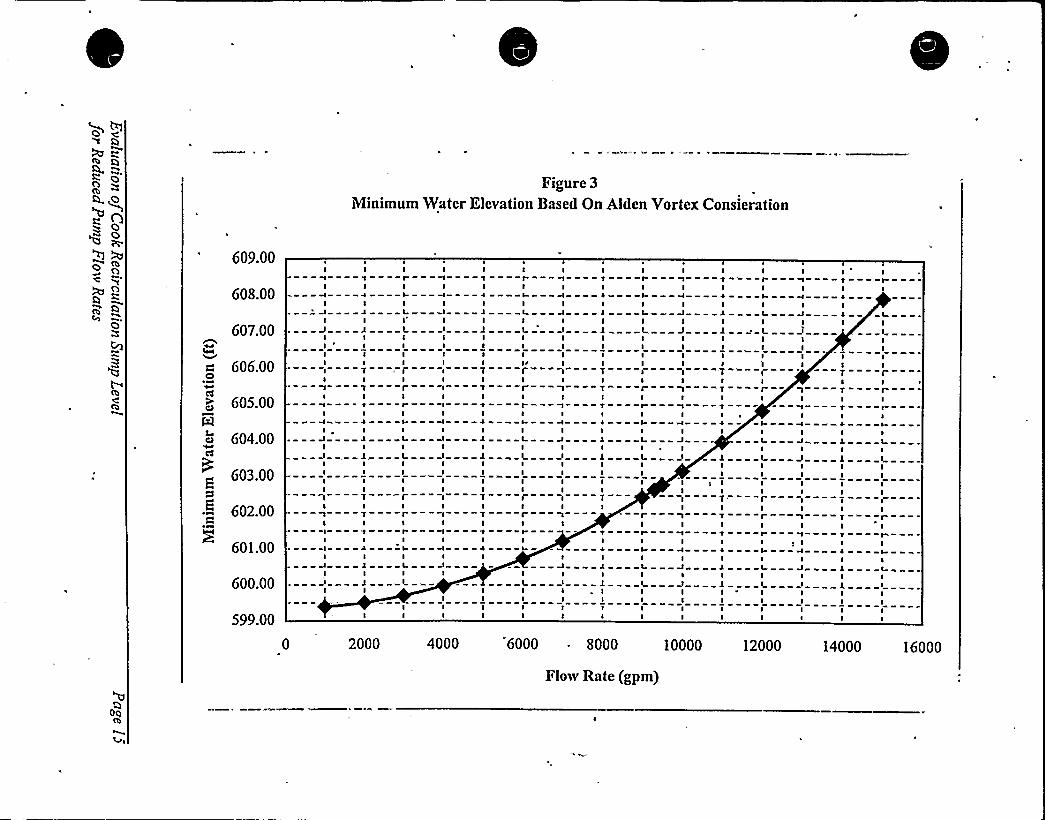
Figure 3
Minimum Water Elevation Based On Alden Vortex Consieration
609.00
608.00
607.00
606.00~ S4
605.00Fl
604.00
603.00
~- 602.00~ W
601.00
600.00
I IJ
I ~
Ir--IIILI'
IIIIrI---rI
IIIIIIIIII
I IJ I
I III IL I
IL
I I I I IJ L--------J- LI
I II I I
I II Ir
I IrILI I I
L
I
IJ
I
IJIJ
IITIT
I4IJIJIIIITI
IL
I I I4 I
I IJ ~ tI II II II I
T
I ItI4 II I
L
I
I4I
JI
IITItIt'
II
IIII
IL
I I I IL-- J J II I I I II I I I II I I II I I IT r
I I I I I I I
I I I IJ
I II II
I II I
J JI II I
J II, II I
II I I I I I I IJ L J J I J —J I
599.00
0 2000 4000 "6000 ~ 8000 10000 12000 14000 16000
Flow Rate (gpm)
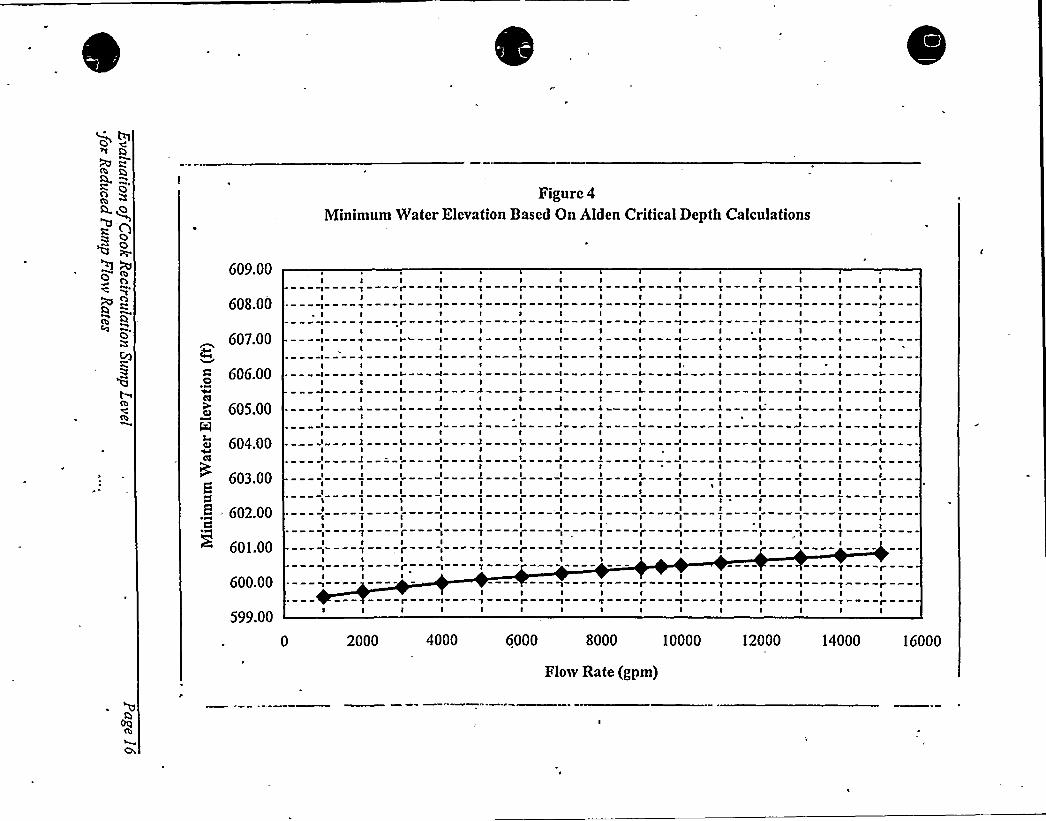
Figure 4
Minimum Water E<levation Based On Alden Critical Depth Calculations
609.00
608.00
ITI
'T
I I I Ir T T I
607.00
606.00
605.00
604.00
603.008
.5 - 602.00O~
6oi.oo
600.00
599.00
0
IIIII
IIIIIIII
I ItI It I
4I I
L
I II I
'7II I I
2000
I I II
I II
I I It I
I . I I I I+ I + I
I I I+ 4
I
I
I
I
ILIIILII
I I
I I III I II lI I IL J-- lI I II
ILL
I I I I I I II J J I II I I I I I II I I I I I
IIII
IIII
IIII
I ' II I II I II I I
I I II I I
I II I
IIrI
I II
'I
TI Ir
I II 'T rI IT
T rIP
I II T r I T
I I I I I I IT P I r T
IP
IPI T
I I I I I I I I I I I I
4000 6000 8000 10000 12000 14000 16000
Flow Rate (gpm)
~ ~
to
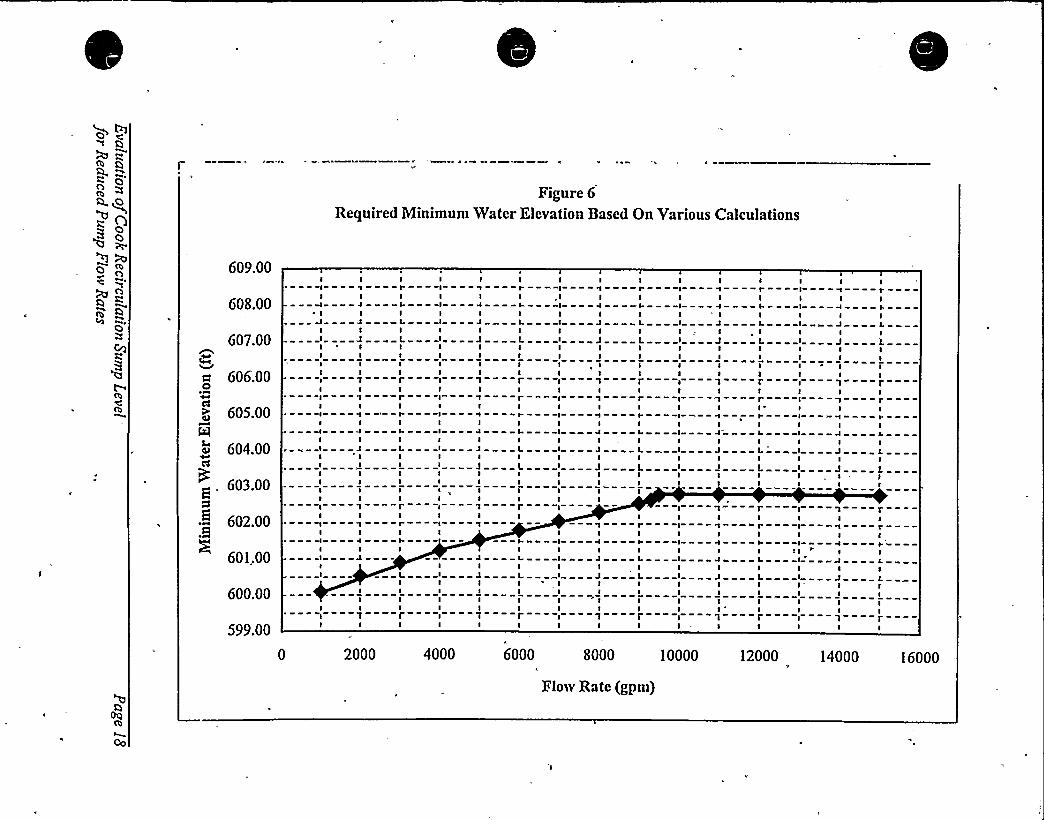
Figure 6
Required Minimum Water Elevation Based On Various Calculations
609.00
608.00
607.00
a 606.00
605.00
0) 604.00
. 603.00
~- 602.00
601,00
600.00
599.00
IIIII
II
IL
I II J
I I I IJ L I J
IIIIIIIII
II
1I
I
IlIL
I I ILI
I II JI II JIIIIIIII
IL II I
lI
JIIIIII
I I I I II I I I I
I II I
I I I I I I II I I r I I
IL
I II
I ILI II I
IJII
ILIL
I II J
IL
I II I
I I I t II II' I I t
I I I I II
I I IL I JI I II I J
I ILI I
L
I I I IL J
I IJ
I I JILI = II I
ILIL
IIIIIIII
I0 I I I
LIL
I II Ir
I I I I I I II I I ' I I Ir I 1 I I
I - I I I I I
I, I I I I I I II I I I I I I I II 1 1 rI
I I
0 2000 4000 6000 8000 10000 12000 14000 16000
Flow Rate (gpm)
I II»
I g f C
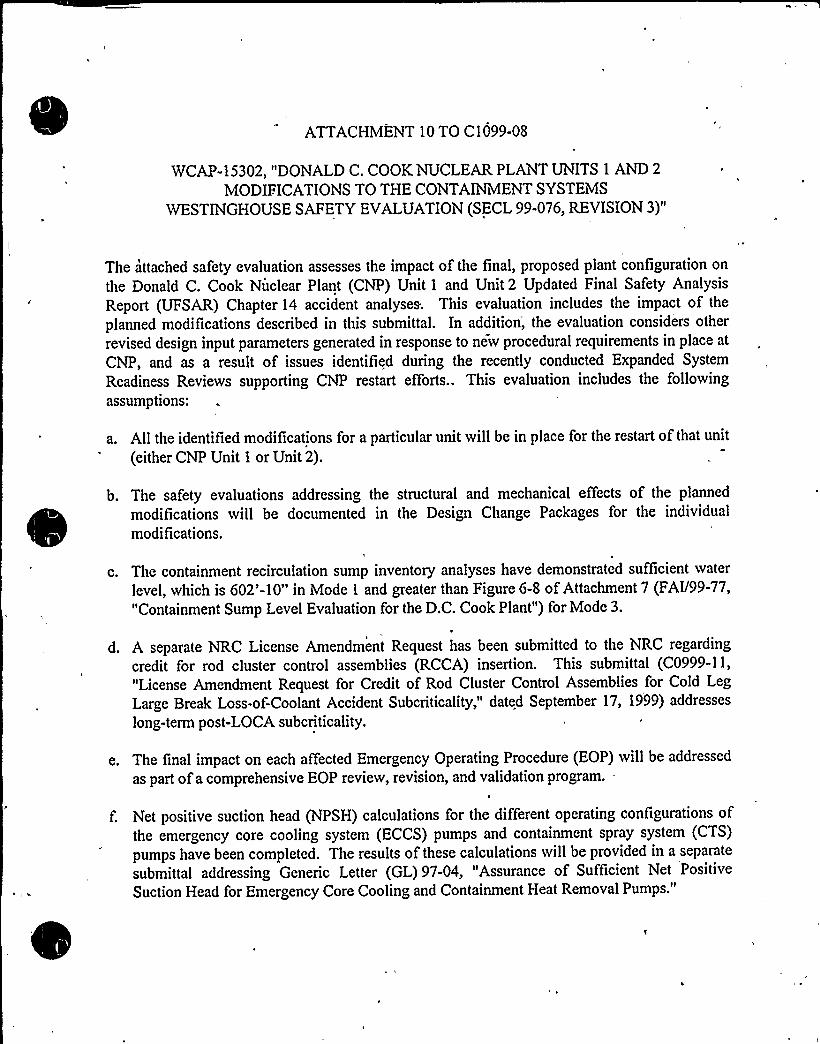
ATTACHMENT10 TO C1099-08
WCAP-15302, "DONALDC. COOK NUCLEARPLANT UNITS 1 AND 2
MODIFICATIONSTO THE CONTAINMENTSYSTEMSWESTINGHOUSE SAFETY EVALUATION(SECL 99-076, REVISION 3)"
The attached safety evaluation assesses the impact of the final, proposed plant configuration on
the Donald C. Cook Nuclear Plant (CNP) Unit 1 and Unit 2 Updated Final Safety Analysis
Report (UFSAR) Chapter 14 accident analyses; This evaluation includes the impact of the
planned modifications described in this submittal. In addition', the evaluation considers other
revised design input parameters generated in response to new procedural requirements in place at
CNP, and as a result of issues identified during the recently conducted Expanded System
Readiness Reviews supporting CNP restart efforts.. This evaluation includes the followingassumptions:
a. Allthe identified modifications for a particular unit willbe in place for the restart of that unit
(either CNP Unit 1 or Unit 2).
b. The safety evaluations addressing the structural and mechanical effects of the planned
modifications will be documented in the Design Change Packages for the individual
modifications.
c. The containment recirculation sump inventory analyses have demonstrated sufficient water
level, which is 602'-10" in Mode 1 and greater than Figure 6-8 ofAttachment 7 (FAI/99-77,"Containment Sump Level Evaluation for the D.C. Cook Plant" ) for Mode 3.
d. A separate NRC License Amendment Request has been submitted to the NRC regarding
credit for rod cluster control assemblies (RCCA) insertion. This submittal (C0999-11,
"License Amendment Request for Credit of Rod Cluster Control Assemblies for Cold Leg
Large Break Loss-of-Coolant Accident Subcriticality," dated September 17, 1999) addresses
long-term post-LOCA subcriticality.
e. The final impact on each affected Emergency Operating Procedure (EOP) willbe addressed
as part ofa comprehensive EOP review, revision, and validation program.-II
f. Net positive suction head (NPSH) calculations for the different operating configurations ofthe emergency core cooling system (ECCS) pumps and containment spray system (CTS)
pumps have been completed. The results of these calculations willbe provided in a separate
submittal addressing Generic Letter (GL) 97-04, "Assurance of Sufficient Net Positive
Suction Head for Emergency Core Cooling and Containment Heat Removal Pumps."
0


![Compact ink recirculation system CC1 - Toshiba Tec Top Page...Compact ink recirculation system Example: Mounting of ink recirculation system [CC1] with ink recirculation head Up to](https://img.pdfslide.us/doc/110x75/5f0f72527e708231d4443441/compact-ink-recirculation-system-cc1-toshiba-tec-top-page-compact-ink-recirculation.jpg)