Embed Size (px)
Citation preview

CANADIAN VENTURE CAPITAL REVIEW
First Nine Months 2016
REUTERS

Table of Contents
Canada’s VC Market in Q3 2016 3
$ Invested and # Companies Financed 5
Top VC Deals 7
Top VC Investors 8
North American Rankings 10
Investor Type & Nationality 12
Canada by Province, Stage, Sector 14
International VC Context 17
VC Funds Raised 19
Public and M&A Exits 20
Explanatory Notes & Contacts 21

Canada’s Venture Capital Market in Q3 2016
3 Contributors to our venture capital & private equity analyses are entitled
to packages of additional data. Please contact us to participate.
Canadian VC Market Trends
Venture capital investment activity in Canadian companies continued at a rapid pace in the first three quarters of the year
with a total of $2.5 billion invested in 446 deals from January to September. In dollar terms, this represented the best first
nine months of any calendar year since 2001, while the number of deals done was the most since 2005.
Growth was driven by large cap VC deals, with 11 companies raising rounds $50 million or greater in the first nine
months. This puts 2016 within reach of breaking the all-time record of 13 such transactions in the year 2000. With more
large Canadian VC deals, the average round size in Canada climbed to $5.6 million, pulling Canada out of its traditional
last-place ranking among the top 10 VC-attracting nations. However Canada still ranked poorly compared to most other
nations in terms of average round size, lagging far behind the USA at $17.7 million, the United Kingdom at $16.9 million,
and Israel at $15.3 million.
Investment by Canadian funds in non-Canadian companies also had a strong showing in the first nine months, with just
over $362 million invested in 67 deals. Highlights of Q3 dealmaking abroad included Intact Financial’s investment in
MetroMile, a San Francisco-based pay-per-mile car insurance company; and Georgian Partner’s investment in Tealium, a
San Diego-based provider of unified marketing solutions.
Trends in the US VC market
Venture capitalists invested US$10.6 billion in 891 deals in the third quarter of 2016. Total venture dollars deployed to
startup companies for the quarter decreased 32 percent and total deal count was down 11 percent, compared to the
second quarter when US$15.6 billion was invested in 999 deals. This represented the eleventh consecutive quarter of
more than US$10 billion in venture capital invested in a single quarter, and only the second time quarterly deal counts
have dropped below one thousand since Q1 2013.

Contributors to our venture capital & private equity analyses are entitled
to packages of additional data. Please contact us to participate. 4
Canada’s Venture Capital Market in Q3 2016 Canadian VC Trends by Region
Growth in venture capital dealmaking in the first nine months of 2016 was widespread across the country. Ontario,
Quebec, and British Columbia all rose in their North American rankings by state and province, to 6th, 8th, and 18th place
respectively. In rankings by city, Montreal placed first among Canadian urban centres, coming in 11th place among North
American VC-attracting cities. However, Toronto, Vancouver, and Kitchener-Waterloo all advanced one or more positions
from the ranks they held the prior year.
Canadian VC Trends by Sector
As with last year, investment in the information technology sector took the largest share of VC dollars with 62% of
investment totals from January to September, or $1.6 billion. Investment in the sector has now reached $2.0 billion over
the past twelve months, up 24% over the previous twelve-month period.
Cleantech companies received $149 million in the first three quarters, a 6% share of all investment. Life Sciences
companies took a 21% share, or $531 million, while Consumer-related companies took $148 million, or 6% of funds
disbursed from January to September.
Canada VC Fundraising Trends
Following on the heels of a weak second quarter, Canadian venture capital fundraising returned strong in Q3 with $725
million raised, predominantly led by the $485 million close of Georgian Partners III. A total of $1.7 billion has been raised
for venture capital investment purposes so far this year.

$1,528 $1,594
$1,938
$2,367
$2,748
$2,525
$0
$500
$1,000
$1,500
$2,000
$2,500
$3,000
2011 2012 2013 2014 2015 2016
Q1 Q2 Q3 Q4
Canadian Companies Secure $774 Million in Q3 Best First 3Q for Canadian VC in 15 Years
De
al V
alu
es (
CA
D M
illio
ns)
5 Contributors to our venture capital & private equity analyses are entitled
to packages of additional data. Please contact us to participate.

445 451 471
559 587
446
0
100
200
300
400
500
600
700
2011 2012 2013 2014 2015 2016
Q1 Q2 Q3 Q4
VC Deal Volume Up 2% From 2015 Most Rounds From January to September Since 2005
Nu
mb
er
of D
ea
ls
6 Contributors to our venture capital & private equity analyses are entitled
to packages of additional data. Please contact us to participate.

Top Canadian Venture Capital Deals First Nine Months 2016
Rank Company Name Location
Deal
Value
($ Mil)
Industry Investor Participants
(Disclosed)
1 Thalmic Labs Kitchener, ON $158.4 Wearable
Technology Intel Capital, Amazon Alexa Fund, Fidelity
Investments Canada
2 Dalcor
Pharmaceuticals Montreal, QC $126.7 Drug Development
CDP Capital, CTI Life Sciences, Fonds de
Solidarité FTQ, Sanderling Ventures
3 Real Matters Markham, ON $100.0 Property Information
Services Undisclosed investors
4 Zymeworks Vancouver, BC $87.8 Biotherapeutics
BDC Capital, Lumira Capital, Eli Lilly and
Company, Celgene, CTI Life Sciences Fund,
Fonds de Solidarité FTQ, Perceptive Advisors,
Teralys Capital, Northleaf Venture Catalyst Fund,
Brace Pharma Capital, Merlin Nexus
5 Triotech Amusement Montreal, QC $80.0 Entertainment
Devices Fonds de Solidarité FTQ, Caisse de dépôt et
placement du Québec
6 Blockstream Montreal, QC $75.8 Cryptocurrencies
Horizons Ventures, AXA Strategic Ventures, Digital
Garage, AME Cloud Ventures, Blockchain Capital,
Future\Perfect Ventures, Khosla Ventures, Mosaic
Ventures, Seven Seas Venture Partners
6 Flipp Corp Toronto, ON $63.7 Mobile Consumer
Marketplace Insight Venture Partners, General Atlantic
7 Farmers Edge
Precision Consulting Winnipeg, MB $58.0 Agritech
Mitsui & Co., Kleiner Perkins Caufield & Byers,
Osmington
7 Contributors to our venture capital & private equity analyses are entitled
to packages of additional data. Please contact us to participate.

Firm Name # Deals (First 3Q)
Estimated
Investments ($ Millions)
Real Ventures 50 $22.2
Anges Quebec 28 $10.1
Cycle Capital 21 $9.8
iNovia Capital 17 $52.6
Teralys Capital 11 $37.0
Relay Ventures 10 $24.0
Avrio Capital 7 $9.0
Yaletown Partners 7 $7.2
Most Active Investors in Canadian Companies Private Independent Funds
Firm Name # Deals (First 3Q)
Estimated
Investments ($ Millions)
Kleiner Perkins Caufield & Byers
3 $21.8
Battery Ventures 3 $16.9
Acton Capital Partners
3 $7.0
Accomplice 3 $6.5
Accel Partners & Co 3 $3.5
Domain Associates 3 $2.6
Techstars Central 3 $2.1
Canadian Partnerships Non-Canadian Partnerships

Firm Name # Deals (First 3Q)
Estimated
Investments ($ Millions)
Business Development Bank of Canada
82 $112.9
MaRS Discovery District 21 $21.8
Export Development Canada
17 $26.3
FedDev Ontario 6 $3.8
Sustainable Development Technology Canada
6 $12.0
Innovacorp 5 $4.2
Investissement Québec 4 $12.2
Firm Name # Deals
(First 3Q)
Estimated
Investments
($ Millions)
Fonds de Solidarité FTQ 57 $179.3
New Brunswick Innovation Foundation
24 $4.2
Desjardins 23 $8.3
FondAction 10 $14.1
OMERS Ventures 9 $27.2
La Caisse de dépôt et Placement du Québec
6 $124.9
Westcap Management 6 $7.3
Government Funds
Most Active Investors in Canadian Companies Government & Other Fund Types
Pension, Retail & Institutional Funds

State / Province
First
3Q
2016
Rank
2015
Rank
H1 2016 VC
Invested
(CAD $
Millions)
First 3Q 2016
North
American
Market Share
Change in
Rank From
2015
California 1 1 $29,158 51.7% -
New York 2 2 $5,718 10.1% -
Massachusetts 3 3 $5,547 9.8% -
Florida 4 16 $1,451 2.6% +12▲
Texas 5 5 $1,335 2.4% -
Ontario 6 8 $1,113 2.0% +2▲
Illinois 7 6 $931 1.7% -1 ▼
Quebec 8 14 $840 1.5% +6▲
Washington 9 4 $816 1.4% -5 ▼
Pennsylvania 10 15 $788 1.4% +5▲
Virginia 11 18 $617 1.1% +7▲
Utah 12 12 $594 1.1% -
North Carolina 13 13 $455 0.8% -
New Jersey 14 7 $419 0.7% -7 ▼
Minnesota 15 19 $390 0.7% +4▲
British Columbia 18 21 $331 0.6% +3▲
Québec, B.C., and Ontario All Up in 2016 North American VC Rankings
10 Contributors to our venture capital & private equity analyses are entitled
to packages of additional data. Please contact us to participate.

Montreal, Toronto Reach 11th & 13th Place North American VC Rankings
11 Contributors to our venture capital & private equity analyses are entitled
to packages of additional data. Please contact us to participate.
Metro Region
First
3Q
2016
Rank
2015
Rank
First 3Q 2016
VC Invested
(CAD $
Millions)
First 3Q 2016
North
American
Market Share
Change in
Rank From
2015
San Francisco 1 1 $15,981 28.3% -
San Jose 2 2 $7,829 13.9% -
New York City 3 3 $6,126 10.9% -
Boston 4 4 $5,280 9.4% -
Los Angeles 5 5 $3,267 5.8% -
Washington D.C. 6 6 $1,154 2.0% -
San Diego 7 8 $1,066 1.9% +1▲
Chicago 8 9 $915 1.6% +1▲
Orange County 9 10 $888 1.6% +1▲
Seattle 10 7 $795 1.4% -3 ▼
Montreal 11 16 $736 1.3% +5▲
Philadelphia 12 15 $651 1.2% +3▲
Toronto 13 14 $645 1.1% +1▲
Austin 14 13 $552 1.0% -1 ▼
Houston 15 24 $523 0.9% +9▲
Vancouver 20 19 $315 0.6% +1▲
Kitchener-Waterloo 21 26 $295 0.5% +5▲

0%
10%
20%
30%
40%
50%
60%
70%
80%
90%
100%
2011 2012 2013 2014 2015 First 9 Months2016
Canadian Investors U.S. Investors Other Foreign Investors
5% of VC Investment from Funds Overseas United States Investors Account for 36%
$1,528 $1,594 $1,938 $2,367 $2,525
De
al V
alu
es (
CA
D M
illio
ns)
12 Contributors to our venture capital & private equity analyses are entitled
to packages of additional data. Please contact us to participate.
$2,748

0%
10%
20%
30%
40%
50%
60%
70%
80%
90%
100%
2011 2012 2013 2014 2015 First 9 Months2016
Private Independent Government RetailCorporate Angels & Individuals InstitutionalOther
Institutional & Retail Funds Step Up Activity with 8% and 6% of YTD Investment Overall
13 Contributors to our venture capital & private equity analyses are entitled
to packages of additional data. Please contact us to participate.
De
al V
alu
es (
CA
D M
illio
ns)
$1,528 $1,594 $1,938 $2,367 $2,525 $2,748

0%
10%
20%
30%
40%
50%
60%
70%
80%
90%
100%
2011 2012 2013 2014 2015 First 9 Months2016
Ontario Québec British Columbia Rest of Canada
$442 Million Invested in Ontario Companies in Q3 Best Quarter for Ontario Since Q4 2002
14 Contributors to our venture capital & private equity analyses are entitled
to packages of additional data. Please contact us to participate.
De
al V
alu
es (
CA
D M
illio
ns)
$1,528 $1,594 $1,938 $2,367 $2,525 $2,748

0%
10%
20%
30%
40%
50%
60%
70%
80%
90%
100%
2011 2012 2013 2014 2015 First 9 Months2016
Seed Early Stage Later Stage Expansion Other Advanced Stage
Seed & Early Stage VC Falls to 21% of Activity VCs Focusing on Later Stages
15 Contributors to our venture capital & private equity analyses are entitled
to packages of additional data. Please contact us to participate.
De
al V
alu
es (
CA
D M
illio
ns)
$1,528 $1,594 $1,938 $2,367 $2,525 $2,748

0%
10%
20%
30%
40%
50%
60%
70%
80%
90%
100%
2011 2012 2013 2014 2015 First 9 Months2016
Information Technology Life Sciences Cleantech
Consumer-Related Energy & Industrial Other Sectors
IT Accounts for 62% of First 3Q Investment Life Sciences Takes 21%
16 Contributors to our venture capital & private equity analyses are entitled
to packages of additional data. Please contact us to participate.
De
al V
alu
es (
CA
D M
illio
ns)
$1,528 $1,594 $1,938 $2,367 $2,525 $2,748

Canada’s Round Sizes No Longer Raking Last Among Top Ten VC-Attracting Nations
$0
$10
$20
$30
$40
$50
$60
Ave
rag
e A
mo
un
t In
ve
ste
d p
er
Ro
un
d
(First N
ine
Mo
nth
s 2
01
6, C
AD
$ M
illio
ns)
17 Contributors to our venture capital & private equity analyses are entitled
to packages of additional data. Please contact us to participate.

0
5
10
15
20
25
30
35
$0
$20
$40
$60
$80
$100
$120
$140
$160
$180
$200
Q1'14 Q2'14 Q3'14 Q4'14 Q1'15 Q2'15 Q3'15 Q4'15 Q1'16 Q2'16 Q3'16
Total Deal Values # of Deals
Am
ou
nt In
ve
ste
d (
CA
D $
Mill
ion
s)
# o
f R
ou
nd
s
Canadia
n Investo
rs, N
on
-Canadia
n C
om
panie
s
Intact in Metromile & Georgian’s Tealium Lead Canadian VC Dealmaking Abroad in Q3
18 Contributors to our venture capital & private equity analyses are entitled
to packages of additional data. Please contact us to participate.

$0
$100
$200
$300
$400
$500
$600
$700
$800
$900
$1,000
Q1'14 Q2'14 Q3'14 Q4'14 Q1'15 Q2'15 Q3'15 Q4'15 Q1'16 Q2'16 Q3'16
Private Independent Retail Other
19 Contributors to our venture capital & private equity analyses are entitled
to packages of additional data. Please contact us to participate.
Ve
ntu
re C
ap
ita
l F
un
dra
isin
g (
CA
D M
illio
ns)
Led by Georgian Partners III, Canadian VC Funds Raise $725 Million in Q3
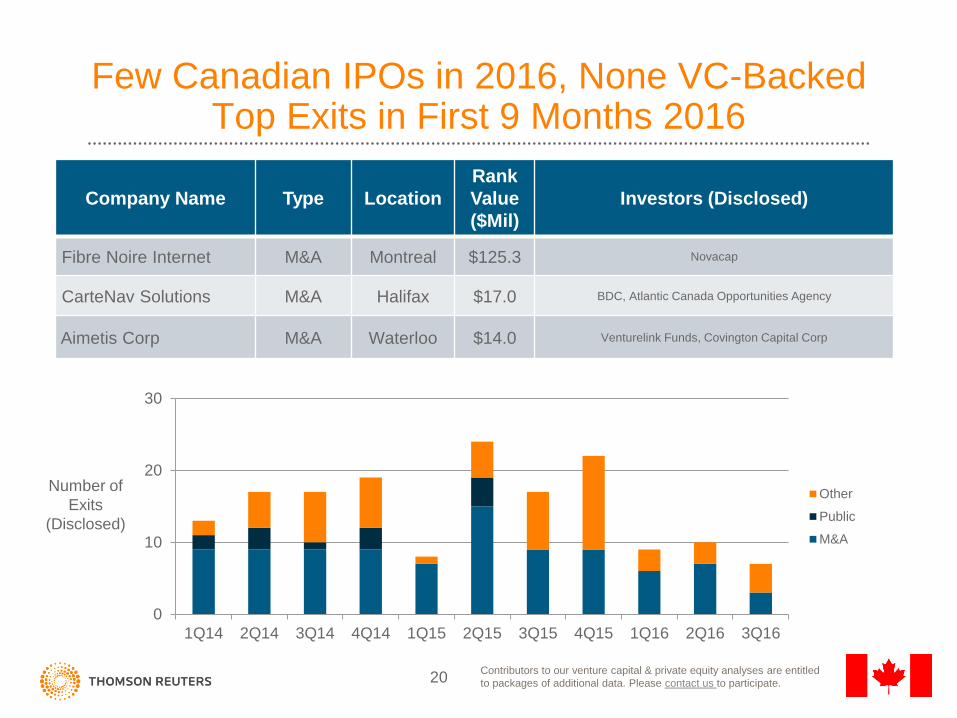
Few Canadian IPOs in 2016, None VC-Backed Top Exits in First 9 Months 2016
0
10
20
30
1Q14 2Q14 3Q14 4Q14 1Q15 2Q15 3Q15 4Q15 1Q16 2Q16 3Q16
Other
Public
M&A
Number of
Exits
(Disclosed)
Company Name Type Location
Rank
Value
($Mil)
Investors (Disclosed)
Fibre Noire Internet M&A Montreal $125.3 Novacap
CarteNav Solutions M&A Halifax $17.0 BDC, Atlantic Canada Opportunities Agency
Aimetis Corp M&A Waterloo $14.0 Venturelink Funds, Covington Capital Corp
20 Contributors to our venture capital & private equity analyses are entitled
to packages of additional data. Please contact us to participate.

Explanatory Notes
1. Data collected and analyzed by Thomson Reuters for this statistical report were drawn from a variety of sources. These include Thomson
Reuters M&A databases, regulatory filings, and public and proprietary sources among the members of Réseau du capital d’investissement
du Québec and other Canadian and non-resident fund managers responding to Thomson Reuters’ quarterly surveys.
2. Rankings of top VC investors include only investment activity made in Canadian portfolio companies. Estimated investment activity is
based on the actual syndicate breakdown, where available, and is split equally among disclosed investors where actual breakdowns are
not available. Private independent, government, and other funds are independently ranked in their respective categories. Rankings capture
the six-month period from January 1st, 2016 to September 30th, 2016.
3. All current and previous years data is as of Thursday, October 27th, 2016. Data is continuously updated and is therefore subject to change.
4. All figures are in Canadian dollars unless otherwise noted.
5. For further information on Thomson Reuters venture capital and private equity offerings, please visit us at:
http://thomsonreuters.com/en/products-services/financial/venture-capital-and-private-equity/private-equity-venture-capital.html
6. For further reports on private equity, venture capital, and other asset classes, please visit us at:
http://dmi.thomsonreuters.com
7. If you would like to participate in the submission process, receive quarterly press releases, or have questions about our venture capital
criteria, please contact us at:
Gavin Penny
E-mail: [email protected]
Tel: 416-687-7577
21


![CAKE Investors August 2017 - accelerize.comaccelerize.com/wp-content/uploads/2017/08/CAKE-Investors_August...using Tealium. [Tealium] Validate emails collected through CAKE using Briteverify](https://img.pdfslide.us/doc/110x75/5aa212087f8b9a436d8c7ce1/cake-investors-august-2017-tealium-tealium-validate-emails-collected-through.jpg)