Embed Size (px)
Citation preview

i
The Hamilton Project • Brookings
Jay Shambaugh, Lauren Bauer, and Audrey Breitwieser
FRAMING PAPER | FEBRUARY 2018
Returning to EducationThe Hamilton Project on Human Capital and Wages

ii
The Hamilton Project • Brookings
The Hamilton Project seeks to advance America’s promise
of opportunity, prosperity, and growth.
We believe that today’s increasingly competitive global economy
demands public policy ideas commensurate with the challenges
of the 21st Century. The Project’s economic strategy reflects a
judgment that long-term prosperity is best achieved by fostering
economic growth and broad participation in that growth, by
enhancing individual economic security, and by embracing a role
for effective government in making needed public investments.
Our strategy calls for combining public investment, a secure social
safety net, and fiscal discipline. In that framework, the Project
puts forward innovative proposals from leading economic thinkers
— based on credible evidence and experience, not ideology or
doctrine — to introduce new and effective policy options into the
national debate.
The Project is named after Alexander Hamilton, the nation’s
first Treasury Secretary, who laid the foundation for the modern
American economy. Hamilton stood for sound fiscal policy,
believed that broad-based opportunity for advancement would
drive American economic growth, and recognized that “prudent
aids and encouragements on the part of government” are
necessary to enhance and guide market forces. The guiding
principles of the Project remain consistent with these views.
MISSION STATEMENT
Returning to EducationThe Hamilton Project on Human Capital and Wages
Jay ShambaughThe Hamilton Project, the Brookings Institution, and The George Washington University
Lauren BauerThe Brookings Institution
Audrey BreitwieserThe Hamilton Project
FEBRUARY 2018
A CHAPTER IN THE RECENTLY RELEASED HAMILTON PROJECT BOOK
Revitalizing Wage Growth Policies to Get American Workers a Raise
One simple question—are wages rising?—is as central to the health of our democracy as it is to the health of our economy. For the last few decades, the U.S. economy has experienced real wage stagnation. Without rising wages, the dreams of American families to live in good homes, to support their families, to retire comfortably, and to see their children do better—what we call the American Dream—simply cannot be realized. By raising productivity growth and strengthening worker bargaining power, we can create a faster-growing and more-dynamic economy that will benefit all workers over the long term.
SH
AM
BA
UG
H / N
UN
N
Edited by
JAY SHAMBAUGH and RYAN NUNN
Policies to Get American
Workers a Raise
REVITALIZING WAGE
GROWTH
REV
ITALIZIN
G W
AG
E GR
OW
TH
O N E S I M P L E Q U E S T I O N — A R E WA G E S R I S I N G ? —is as central to the health of our democracy as it is to the health of our
economy. For the last few decades, the U.S. economy has experienced
real wage stagnation. Without rising wages, the dreams of American
families to live in good homes, to support their families, to retire
comfortably, and to see their children do better—what we call the
American Dream—simply cannot be realized. By raising productivity
growth and strengthening worker bargaining power, we can create
a faster-growing and more-dynamic economy that will benefit all
workers over the long term.
CONTRIBUT ORSLauren Bauer, The Brookings Institution
Jared Bernstein, Center on Budget and Policy Priorities
Audrey Breitwieser, The Hamilton Project
Fatih Guvenen, University of Minnesota
Ben Harris, Kellogg School of Management
Alan Krueger, Princeton University
Patrick Liu, The Hamilton Project
Matt Marx, Boston University
Ryan Nunn, The Hamilton Project and the Brookings Institution
Becca Portman, The Hamilton Project
Eric Posner, The University of Chicago Law School
Jay Shambaugh, The Hamilton Project, the Brookings
Institution, and The George Washington University
Heidi Shierholz, Economic Policy Institute
Abigail Wozniak, University of Notre Dame
6 × 9 SPINE: 0.4688 FLAPS: 0
RevitalizingWageGrowth_CV_WIP03.indd 1 1/26/18 9:36 PM

2
The Hamilton Project • Brookings
Human Capital and the American EconomyWAGE PREMIUMS
One of the most straightforward ways to raise wages is through education. Americans with higher levels of education not only have higher wages but, for the most part, also have higher wage growth. In 1979 a worker with a bachelor’s degree earned roughly a third more than a worker with a high school education. Subsequently, the wage premium for higher-skilled workers rose considerably (Katz and Autor 1999). In the past 30 years, the gap in earnings between high-school-educated and college-educated workers has more than doubled (Autor 2014).
In 2016 those with some college but no postsecondary degree earned about $5,000 more than those with only a high school diploma (who on average earned $37,000 per year), while those with an associate’s degree earned $9,000 more (figure 1). However, neither premium has grown since 1996.
Earnings premiums are progressively larger for those with more advanced postsecondary education, and these premiums have been rising. In the past 20 years the premium for a bachelor’s degree holder has increased by about 40 percent to $25,000, the premium for a master’s degree has increased about 20 percent to almost $40,000, and the premium for a doctorate has increased by about 15 percent to $64,000. The largest premium is for professional degree holders, though that has fallen in the past 20 years by about 6 percent from $69,000 to $65,000.
Some of the shifts in the college premium, and in particular the slowing growth in the premium for some levels of education, could be attributable to a changing composition of who holds what degrees: the average preparedness of both the high school and the postsecondary groups may have fallen as more students attended college. In addition, postsecondary completion rates have stagnated or declined over time, while the value of different types of postsecondary degrees and certificates also reflect varying labor market returns to different fields (Holzer and Baum 2017). Regardless, the college premium remains high, and one way to spur overall wage growth is to raise the average education level of the workforce.
IntroductionInvesting in people—human capital—lifts the productivity of workers and enhances their economic mobility. Although progress slowed in the 1980s and 1990s, levels of education have risen for each generation in the United States. Between 1950 and 2007 additional human capital provided 20 percent of increased labor productivity (Fernald and Jones 2014). At the individual level, this higher productivity leads to higher wages. As the introduction to this volume notes, productivity growth does not always translate into higher wages overall, and many other issues such as worker bargaining power are crucial to wage growth. But for wages to increase over the long term, productivity must rise. To continue to improve living standards, federal, state, and local governments should invest in and adopt policies that improve education.
This chapter looks comprehensively at how human capital develops over people’s lifetimes through early childhood education, K–12 education, postsecondary education, and workforce development. The first section reviews trends in wage premiums and human capital investment as well as the returns to educational attainment to provide context for an examination of Hamilton Project policy proposals on education in the second section.
Since its founding in 2006, The Hamilton Project has commissioned more than 50 policy proposals on education and human capital development. Each of these proposals calls on a deep body of evidence and provides specific directions for policy improvement. We review policy options for human capital development proposed in The Hamilton Project’s commissioned works, with a focus on improving access to and the affordability of quality education in the United States. Readers interested in learning more about individual Hamilton Project education policy proposals can find them on The Hamilton Project’s website (www.HamiltonProject.org).
AbstractHuman capital investment is central to raising wages. This chapter describes trends in human capital investment and educational attainment. It reviews the evidence of the wage returns to educational attainment and to early childhood education, K–12 education, postsecondary education, and workforce development policies and programs. Finally, this chapter synthesizes a decade of Hamilton Project policy proposals on education and human capital around a framework of access, affordability, and quality.

3
The Hamilton Project • Brookings
Educational attainment is central not just to wage growth, but also to other critical labor market outcomes. While median wages generally rise with additional education, unemployment rates decrease, as shown in figure 2. In 2016 the unemployment rate was more than 5 percent for those with a high school degree but less than 3 percent for those with a bachelor’s degree, and even lower among those with any kind of graduate degree.
The difference in unemployment rates is exacerbated during times of economic hardship. During the Great Recession, people with less than a bachelor’s degree experienced a much more severe spike in unemployment rates than people with at least a bachelor’s degree. From January 2008 to October 2009 individuals with less than a high school diploma, a high school diploma only, or some college or an associate’s degree saw a 7.5, 6.3, and 5.0 percentage point surge in
FIGURE 1.
Annual Postsecondary Earnings Premiums, 1996 and 2016
Source: U.S. Census Bureau 1997, 2017a; authors’ calculations.
Note: The “earnings premium” is median earnings minus $37,000, which is the approximate median earnings of a high school graduate. “Earnings” are medians and are expressed in 2016 dollars, deflated using the Consumer Price Index for All Urban Consumers Research Series (CPI-U-RS). “High school degree” includes GED attainment. The population includes people ages 25 to 64 years old that work full-time and year-round.
Earn
ings
pre
miu
m o
ver h
igh
scho
ol d
egre
e(2
016
dolla
rs)
Somecollege
Associate’sdegree
Bachelor’sdegree
Master’sdegree
Professionaldegree
Doctorate
20,000
0
40,000
60,000
80,000
1996 2016
Source: Bureau of Labor Statistics (BLS) 2017.
Note: Data are for persons age 25 and over in 2016. Earnings are for full-time wage and salary workers.
FIGURE 2.
Unemployment Rates and Median Weekly Earnings by Educational Attainment
Unemployment rate
Median earnings
Median w
eekly earnings (2016 dollars)U
nem
ploy
men
t rat
e (p
erce
nt)
Somecollege
High schooldegree
Less thanhigh school
Associate’sdegree
Bachelor’sdegree
Master’sdegree
Professionaldegree
Doctorate0
2
4
6
8
0
450
900
1350
1800

4
The Hamilton Project • Brookings
scenario, the educational attainment itself does not affect wages. Beyond talent, people who acquire more education may have a host of other advantages that allowed them to pursue higher education degrees; those advantages might also help lift their wages even in the absence of a degree. Mindful of these possibilities, a large body of research attempts to credibly demonstrate the causal effect of education on wages.1 In this section, we review evidence from well-designed studies of the effects of workforce development, and postsecondary, K–12, and early childhood education on wages.
In addition to formal education, workforce development or training programs have been carefully studied. Decades of program evaluations have yielded mixed results; for example, a meta-analysis of 15 programs in operation from 1964 to 1998 found that training results in a $2,000 annual earnings premium for women, and that in general programs have not become more effective over time (Greenberg, Michalopolous, and Robins 2003). Some workforce development programs are more effective than others, with the best leading to improved labor market outcomes, including higher employment rates and wages. In a Hamilton Project strategy paper, Greenstone and Looney (2011) review much of the evidence summarized in figure 3 that shows the effect of a variety of workforce development programs on annual earnings. While some of the programs studied were not effective and saw earnings effects fade over time, workforce development programs serving disadvantaged youth and those that focused on specific sectors, like Quality Employment Training Through Skills Training (QUEST) (Elliot and Roder 2017) and WorkAdvance (Hendra et al. 2016), were most successful in raising wages.
Those with postsecondary degrees have the most success in the labor market; however, it is important to ascertain whether that success
their unemployment rates, respectively, but those with a bachelor’s degree or higher experienced only a 2.4 percentage point increase (Federal Reserve Bank of St. Louis 2014). When looking at changes in employment-to-population ratios, only those with a bachelor’s degree or more had returned to prerecession levels by early 2017 (Schanzenbach, Nunn, Bauer, and Breitwieser 2017). While those with less education were far more vulnerable to the economic shock, in some cases the recession might have pushed workers toward investing in education because jobs were unavailable. During the Great Recession postsecondary enrollment rates rose among the unemployed in their 20s (Turner 2017), with higher enrollment rates among job losers, as well (Barr and Turner 2015).
While the labor market return to education is generally high, that return varies by race and gender. The bachelor’s degree premium for women (66 percent) is lower than for men (73 percent), and women with bachelor’s degrees earn less than their male counterparts ($1,013 versus $1,378 in weekly earnings). The largest college premium was for Asians (95 percent), followed by whites (62 percent), African Americans (56 percent), and Hispanics (52 percent). Across educational levels, racial gaps in earnings persist, with whites earning more than similarly educated African Americans or Hispanics. For example, the median usual weekly earnings of a white male advanced degree holder were $1,760 compared to $1,295 for an African American male advanced degree holder (BLS 2018, table 9).
THE EFFECT OF EDUCATION ON EARNINGS
The association between earnings and educational attainment does not by itself show that more education causes higher wages for individuals. It may be that more-talented individuals both acquire more education and earn higher wages; in an extreme version of this
FIGURE 3.
Effects of Workforce Development Programs on Annual Earnings
Source: Bloom et al. 1997 (JTPA Youth and Adult); Cave et al. 1993 (JOBSTART); Elliott and Roder 2017 (QUEST); Hendra et al. 2016 (WorkAdvance); Kemper, Long and Thornston 1981 (Supported Work Demonstration Youth); Kemple and Willner 2008 (Career Academies); Maguire et al. 2010 (Sectoral Training Programs); Millenky et al. 2011 (National Guard Youth Challenge); Roder and Elliott 2011 (Year Up); Schochet, Burghardt, and McConnell 2008 (Job Corps). See Greenstone and Looney (2011) for more details.
Note: JTPA = Job Training Partnership Act of 1982. Values are expressed in 2016 dollars, deflated using the CPI-U-RS. The bars indicate the earnings gain from participating in each program. Solid bars indicate results that are statistically significant at the 10 percent level and are intent-to-treat for experimental studies.
Supported WorkDemonstration
Youth
Year Up
1 yearpost-program
2 yearspost-program
3 yearspost-program
5–9 yearspost-program
SectoralTraining
ProgramsJTPA Youth
JTPA Adult National GuardYouth Challenge
JOBSTARTWorkAdvance Job Corps CareerAcademies
QUEST
–1,000
0
1,000
2,000
3,000
4,000
5,000
6,000
E�ec
t on
earn
ings
(201
6 do
llars
)

5
The Hamilton Project • Brookings
is caused by the degree itself or by the characteristics of the degree-earning students. Figure 4 shows the effect on earnings as a result of different types of postsecondary education: certificates and degrees from two-year, four-year, and four-year flagship institutions (a state’s most selective public university). Due to differences in the outcome variables, effects are shown as percent effect sizes. Jepsen, Troske, and Coomes (2014) use administrative data from Kentucky to
identify the returns to certificates and associate’s degrees. They find a 5 percent (for men) and 7 percent (for women) accretion in quarterly earnings in the fourth year after enrolling in a certificate program. For associate’s degrees, they find a 24 percent return for men and 56 percent for women. Jacobson, LaLonde, and Sullivan (2005) find similarly positive but smaller impacts for workers displaced in Washington State after their employer closed or moved out of state.
FIGURE 4.
Effects of Postsecondary Education on Earnings
Source: Hoekstra 2009 (Flagship university); Jacobson, LaLonde, and Sullivan 2005 (Community college); Jepsen, Troske, and Coomes 2014 (Certificate and Associate’s degree); Zimmerman 2014 (Four-year university).
Note: Zimmerman (2014) reported effects for men and women in dollars but not percent changes; the overall results are driven by men because there is no effect on women. Solid bars indicate results that are statistically significant at the 10 percent level.
E�ec
t on
earn
ings
(per
cent
)
Certi�cate(KY)
Community college(WA)
Associate’s degree(KY)
Four-yearuniversity
(FL)
Flagshipuniversity
Men Women Displacedmen
Displacedwomen
Men Women All White men0
10
20
30
40
50
60
FIGURE 5.
Effects of K–12 Education on Annual Earnings
Source: Chetty et al. 2011 (Classroom quality); Chetty, Friedman, and Rockoff 2014 (Teacher quality); Jackson, Johnson, and Persico 2016 (Per-pupil spending); Oreopoulos 2009 (One year of additional schooling); Weinberger 2014 (Extracurricular participation and math achievement).
Note: Solid bars indicate results that are statistically significant at the 10 percent level.
E�ec
t on
earn
ings
(per
cent
)
Extracurricularparticipation
One year ofadditionalschooling
Standard deviationincrease in classroom
quality
10 percentannual increase
in per-pupilspending
Mathachievement
Standard deviationincrease in
teacher quality
0
3
6
9
12
15

6
The Hamilton Project • Brookings
education find other kinds of benefits, including improvements in health and reductions in criminal behavior (Elango et al. 2016).
Cannon et al. (2017) offer a meta-analysis of the adult earnings effects of the most prominent early childhood programs, accounting for both wages and employment rates (figure 6). They looked at programs that target home visiting, early childhood education, and those programs that maintain both a school and a home component. They find that, decades after enrollment, participants see effects on earnings. The largest gains are for the programs considered most intensive—the Perry Preschool Project (1962–67) and the Carolina Abecedarian Project (1972–85)—but for every program studied the long-term effect on earnings was positive. While there are long-term returns to early childhood education and care, there are short-term income benefits for parents as well. The literature on the employment effects of subsidized early childhood education and care suggest that a 10 percent price reduction will raise employment among single mothers by 3 to 4 percent and among married mothers by 5 to 6 percent (Ziliak, Hokayem, and Hardy 2008).
EDUCATIONAL ATTAINMENT
Increasing educational attainment has been a bedrock of U.S. productivity growth for decades, with growth in human capital providing 0.4 percentage points of the average 2.0 percent annualized growth rate in output per year. Figure 7 shows educational attainment of adults in the United States over the past 77 years. Driven by younger cohorts becoming ever more educated, the share of adults with at least a high school diploma rose almost fourfold and the share with at least a bachelor’s degree burgeoned more than sevenfold. More recently, rising labor quality has continued to support growth, providing 0.5 percentage points of 1.8 percent
Using admission cutoffs for different universities, Zimmerman (2014) and Hoekstra (2009) identify the effects of attending a four-year university and a state’s flagship university, respectively. Zimmerman finds a 22 percent return in quarterly earnings eight to fourteen years after attending a four-year university, and Hoekstra finds 20 percent growth in annual earnings after attending a flagship university among white men between the ages of 28 and 32.
Studies have also shown the importance of K–12 education. Figure 5 shows the effects of various aspects of K–12 education on annual earnings. The largest earnings premium is associated with participation in extracurricular activities, which in 1999 had a 13 percent impact on annual earnings later in life. This premium grew from 5 to 13 percent from 1979 to 1999 (Weinberger 2014). Messacar and Oreopolous (2012) use changes in compulsory schooling laws to identify the effect of additional schooling on a variety of outcomes including wages, finding that an additional year of schooling is associated with a 10.7 percent rise in annual earnings. Looking at different measures of quality, a standard deviation increase in teacher quality raises annual earnings at age 27 by 1.3 percent (Chetty, Friedman, and Rockoff 2014) while a standard deviation increase in classroom quality raises annual earnings at age 27 by 9.6 percent (Chetty et al. 2011). Jackson, Johnson, and Persico (2016) look at the effects of school finance reform on the long-run outcomes of affected students and find that accumulating 10 percent annual boosts to per pupil spending leads to 7.3 percent higher annual earnings.
The importance of early childhood interventions has been convincingly demonstrated by a growing body of research. More states are now spending funds on pre-K programs alongside longer-standing federal programs such as Head Start. This chapter focuses on earnings effects, but studies of the long-term impacts of preschool
FIGURE 6.
Effects of Preschool Programs on Lifetime Earnings
Source: Cannon et al. 2017.
Note: Solid bars indicate results that are statistically significant at the 10 percent level.
EarlyHead Start
Parent-ChildHome
Program
Nurse-FamilyPartnership
ChicagoChild Parent
Center
Head StartCarolinaAbecedarian
Project
Perry Preschool
E�ec
t on
earn
ings
(201
6 do
llars
)
0
20,000
40,000
60,000
80,000
100,000
Combination Early care and education Home visiting

7
The Hamilton Project • Brookings
growth from 2002 to 2013, but for a less encouraging reason. The shift in employment away from lower-skilled workers supported growth in the average level of human capital more than the increase in educational attainment (Bosler et al. 2016).
Over the long run, successive cohorts of Americans have become more likely to attain degrees. In 1940 only one-fourth of adults over the age of 25 had at least a high school diploma. But the youngest cohort at that time was more highly educated: 35 percent of those
between the ages of 25 and 34 had at least a high school diploma. Growing levels of education were also evident for bachelor’s degrees: 4.6 percent of adults in 1940 above age 25 had at least a bachelor’s degree, compared with 6 percent of those between 25 and 34.
In the 1980s growth in educational attainment began to slow. For people ages 25 to 34, the percentage of the population with at least a high school diploma or at least a bachelor’s degree increased in the 1970s by 1.6 and 4.5 percentage points a year, respectively. During
FIGURE 7.
Educational Attainment in the United States, 1940–2017
Source: U.S. Census Bureau 2017b; authors’ calculations.
25–34 years old
25 years and over
25–34 years old
25 years and over
High school degree or more
Bachelor’s degree or more
Shar
e of
pop
ulat
ion
(per
cent
)
0
20
40
60
80
100
1940 1950 1960 1970 1980 1990 2000 2010 2017
Source: U.S. Census Bureau 2017c; authors’ calculations.
Note: Values reflect highest level of education attained in 2017. Population includes civilian noninstitutionalized population ages 25 and older. In 2014 about 5 percent of the population had some graduate school but no graduate degree; changes to the questionnaire in 2015 preclude this calculation for 2017.
FIGURE 8.
Educational Attainment in the United States
Shar
e of
pop
ulat
ion
(per
cent
)
GED
High school diploma
Vocational degree
Associate’s degree
Master’s degree
Professionaldegree ordoctorate
Bachelor’s degree
High school degree or less Postsecondary degree or less Graduate degree or less0
20
40
60
80
100
26
21
46
9
10
3
3
Some college,no degree
16
Less thanhigh school degree

8
The Hamilton Project • Brookings
the 1980s, the equivalent annual growth rates were only 0.2 percentage points each. Since 1990 yearly growth in the share of this population with at least a high school diploma has been on average 0.2 percentage points, compared with somewhat faster 1.6 percentage point growth for those with at least a bachelor’s degree. The flattening of the growth in high school attainment along with the slowdown in those gaining a bachelor’s degree mean that incoming cohorts no longer have as much of an advantage in education over those retiring. If this persists, it will likely contribute to slowing wage growth in aggregate.
Figure 8 shows a more detailed account of the current educational attainment of the U.S. population. The figure’s three bars show, from left to right, the share of the U.S. population with a high school diploma or less (39 percent), a bachelor’s degree or less (87 percent), and a graduate degree or less (100 percent). In 2017 90 percent of adults over the age of 25 had at least a high school diploma and more than 60 percent had at least some postsecondary education. About one in ten adults had less than a high school education and 29 percent of adults had only a high school diploma or equivalent.
Figure 9 shows how the United States compares to other developed countries in educational attainment. According to the latest Organisation for Economic Co-operation and Development (OECD) data, the United States reported 35 percent with a bachelor’s degree and 11 percent with a training program or associate’s degree completed. This compares to 29 percent and 8 percent, respectively, for the OECD member countries, on average. The United States also has relatively few adults who have completed less than a secondary degree. Though the U.S. ranking is comparatively good, its relative standing has declined over the past few decades. An early adopter of both mandatory public high school education and expanded college accessibility, for many years the United States had a considerable lead on other countries in educational attainment. More recently,
the OECD average has approached the U.S. average; in several categories, for example, the gap between the U.S. and OECD average shares of 25 to 34 population with postsecondary education has been cut in half since 1995 (OECD 2018).
HUMAN CAPITAL INVESTMENTS
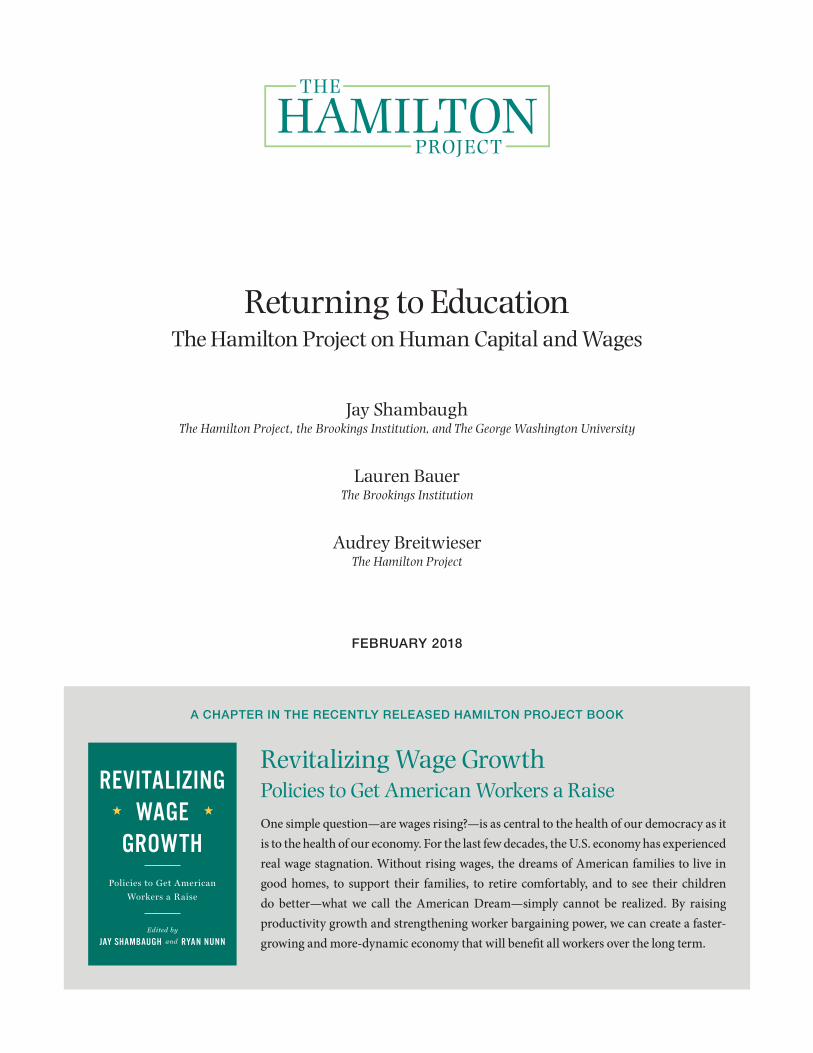
Another measure of educational investment is the share of a country’s output it dedicates to spending on human capital. The United States spent 4.7 percent of GDP on combined public human capital investment as a share of GDP in 2013, the last year for which data were available in each of the categories (figure 10). From public resources, the United States spends roughly 0.3 percent of GDP on early childhood, 3.3 percent on primary and secondary, 1 percent on postsecondary, and 0.04 percent on training programs. The OECD also collects data on the private resources spent on primary and secondary (0.3 percent of GDP) and postsecondary education (1.7 percent of GDP) in the United States. When public and private spending are combined, the United States ranks in the top 10 of human capital spending among OECD countries, a ranking that would be substantially lower if we were to consider only public spending.
U.S. spending on education is distributed among federal, state, and local governments, as well as the private sector. The federal government provides the vast majority of public funds for workforce development and postsecondary education, while state and local governments are primarily responsible for financing K–12 education. In early childhood education, the picture is changing as states ramp up their own preschool programs; however, federal tax incentives and programs still play a major role in providing resources to pay for early childhood education.
In the United States the private sector plays a large role in training, though these efforts are targeted toward workers who are higher
FIGURE 9.
Educational Attainment in Selected OECD Countries
Shar
e of
pop
ulat
ion
(per
cent
)
Canad
aIsr
ael
Korea
United Kingdom
United Sta
tes
Australi
aFin
land
Norway
Luxe
mbourg
Irelan
dSw
itzerla
ndSw
edenIce
land
Estonia
Denmar
kBelgium
New Zealand
Netherla
ndsSpain
France
EU Ave
rage
Latv
iaAustr
iaSlove
niaGre
ecePolan
dGerm
any
Portugal
Hungary
Czech
RepublicChile
Sllvak
RepublicTu
rkey
Italy
Mexic
o
25
75
High schooldegree
Less thanhigh school
degree
Training orassociate’s
degree
Bachelor’sdegree
0
50
100
Source: OECD n.d.
Note: Data are sorted from the highest to lowest percentage of the population with at least a bachelor’s degree, training completed, or an associate’s degree. Japan is not included due to missing data. Switzerland training/associate’s degree data are included in other categories. Portugal’s training/associate’s degree data are not applicable. Data are for 2016 with the exception of Chile and Ireland, which are for 2015. “High school degree” in this figure refers to the OECD category “Upper secondary and post-secondary non-tertiary education.” “Less than high school degree” refers to the OECD category “Below upper secondary education.”
9
The Hamilton Project • Brookings
Source: OECD 2013, 2017; authors’ calculations.
Note: Data are sorted from highest to lowest human capital investment as a share of Gross Domestic Product (GDP). Some OECD countries not included due to unpublished data for certain categories. Early childhood spending data for Poland are from 2012, and are unavailable for Canada. Other education data for Chile are from 2014. Data for Switzerland are unavailable. All other data are for 2013.
FIGURE 10.
Human Capital Investment as a Share of GDP, Selected OECD Countries
Denmar
kNorw
ay
New Zealand
Finlan
dSw
edenFra
ncePortu
galBelgium
United Sta
tes
Israe
lAustr
alia
Netherla
ndsChile
Irelan
dAustr
iaM
exico
Estonia
Slovenia
Poland
German
ySpainJa
pan Italy
Czech
RepublicHungar
y
Slovak R
epublic
Shar
e of
GD
P (p
erce
nt)
Training (public)
Postsecondary(private)
Postsecondary(public)
Primary andsecondary (public)
Primary andsecondary (private)
Early childhood(public)
0
2
4
6
8
1
3
5
7
9
FIGURE 11.
Federal and State Expenditures on Workforce Development Programs, Selected Years
Source: National Association of State Workforce Agencies 2017; National Skills Coalition 2008–15; authors’ calculations.
State WIA/WIOA Supplemental SpendingFederal WIA/WIOA Spending
State Wagner-Peyser Employment Services SpendingOther Federal ETA Program Spending
2008
2012
2015
Federal spending
Spending (billions of 2015 dollars)
State spending
0 1 2 3 4 5 6 7
10
The Hamilton Project • Brookings
skilled. U.S. public spending on workforce development is both relatively small and declining. Focusing on programs for which comparable data exist over time, the data show that federal and state spending on workforce development programs decreased between 2008 and 2015. Most of this change comes from cuts in state and federal spending in the Workforce Innovation and Opportunity Act (WIOA), which President Barack Obama signed into law in 2014 as a reauthorization of the expired Workforce Investment Act (WIA). These programs support youth, adult, and dislocated worker employment activities. In contrast, other state spending (such as for employment services under the Wagner-Peyser Act) increased by 4.3 percent, and other federal Employment and Training Administration (ETA) program spending decreased by 4.2 percent (see figure 11). Given program consolidation under WIOA, as well as small training programs associated with other programs, the magnitude of the effective decline in public workforce development spending over time is unclear.
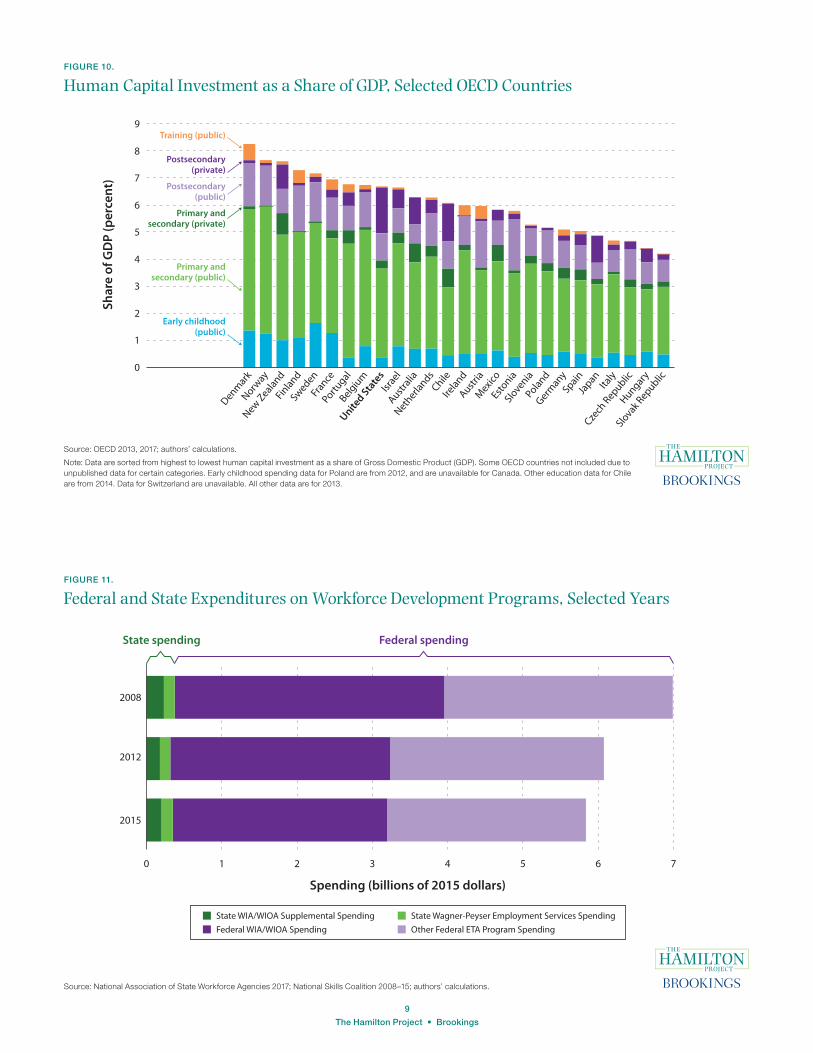
The federal government invests in postsecondary education primarily through grants, loans, and tax incentives to students and their families, investments that grew during the Great Recession; direct federal support to institutions is negligible. By contrast, states primarily support postsecondary education through direct funding. This state funding declined in the wake of the Great Recession, and while recent growth means the spending is nearly back to its 2008 level, it is lower on a per capita or per student basis (see figure 12). States have more recently started to support students directly through grant programs (Baum et al. 2012; Deming and Dynarski 2009), but these programs did not fully replace the decline in state aid to public institutions from 2010 to 2013 (Dynarski and Scott-Clayton 2013).Tandberg and Griffith (2013)
report that political factors, pressure on state budgets from other sectors, and state-level governance structures all help explain changes over time in institutional aid.
State and local funding currently represent more than 90 percent of money spent on public K–12 education. During the Great Recession the federal share of K–12 spending grew to 13 percent (Schanzenbach, Boddy, Mumford, and Nantz 2016) and helped to prevent even deeper state education cuts, but was not enough to make up for lost state spending. Nearly a decade later, per pupil spending had not recovered in a majority of states. Between 2008 and 2015 combined state and local funding for K–12 education fell in 29 states (Leachman, Masterson, and Figueroa 2017; see figure 13). Those states that have seen growth in per pupil spending are, for the most part, losing school-age population. Spending cuts during the Great Recession affected critical outcomes for students: a 10 percent recessionary school spending cut was associated with a 7.8 percent of a standard deviation test score reduction and 2.6 percentage point lower graduation rates if students were exposed to the cuts throughout high school (Jackson, Wigger, and Xiong 2018).
Preschool spending trends have been somewhat different. Forty-two states currently offer publicly funded preschool for eligible four-year-olds (see figure 14). States vary widely in their rates of annual per pupil spending, from just under $2,000 per student in South Carolina to more than 12,000 per student in New Jersey in 2015. Average spending among states that provide preschool for eligible four-year-olds has been stagnant, growing from about $4,800 in 2008 to about $4,900 in 2015. Since 2008 29 states have expanded the number of seats available in state preschool programs, but only 16 states have increased per pupil spending.
FIGURE 12.
State and Federal Higher Education Expenditures, 2004–15
Source: College Board 2016; Federal Reserve Bank of St. Louis n.d.; State Higher Education Executive Officers Association 2003, 2009, 2015; Schanzenbach, Bauer, and Breitwieser 2017.
Note: The shaded area indicates the Great Recession. “Federal grants and loans” refers to the sum of federal grants (including Pell Grants, Federal Supplemental Educational Opportunity Grants, and benefits for veterans and active military service members), federal work-study, federal loans, and education tax benefits. “State grants” includes both need- and non-need-based aid. “State institutional aid” includes aid for independent institutions, noncredit and continuing education, and general public operations.
State institutional aid
State grants
Federal grants and loans
0
50
100
150
200
2004 2005 2006 2007 2008 2009 2010 2011 2012 2013 2014 2015
Spen
ding
(bill
ions
of 2
015
dolla
rs)

11
The Hamilton Project • Brookings
FIGURE 13.
Change in State and Local K–12 Expenditures, 2008 vs. 2015
Source: Leachman, Masterson, and Figueroa 2017.
Note: Funding levels are weighted by K–12 enrollment in each year. Dollar amounts are inflation adjusted.
21.1 to 28.014.1 to 21.07.1 to 14.00.0 to 7.0
–7.0 to –0.1–14.0 to –7.1–21.0 to –14.1–28.0 to –21.1
Percent Change in K–12 Funding, 2008 vs. 2015
21.1 to 28.014.1 to 21.07.1 to 14.00.0 to 7.0
–7.0 to –0.1–14.0 to –7.1–21.0 to –14.1–28.0 to –21.1
Percent Change in K–12 Funding, 2008 vs. 2015
FIGURE 14.
Annual State Preschool Expenditures per Pupil
Source: National Institute for Early Education Research 2017.
Note: Data are for 2015. Funding levels are weighted by state preschool enrollment in each year. Dollar values are calculated in 2015 dollars, deflated using the CPI-U-RS. Vermont total includes local and federal spending. Value for Washington, DC is $16,400.
Pre-K Funding per Enrolled Student (2015 dollars)0 1 to 2,000 2,001 to 4,000 4,001 to 6,000 6,001 to 8,000 8,001 and up
Pre-K Funding per Enrolled Student (2015 dollars)0 1 to 2,000 2,001 to 4,000 4,001 to 6,000 6,001 to 8,000 8,001 and up
12
The Hamilton Project • Brookings
The Hamilton Project Human Capital Policy ProposalsHuman capital investment is both highly consequential and unevenly distributed in the United States. Since its inception, The Hamilton Project has commissioned numerous human capital policy proposals to improve education and support wage growth. The Hamilton Project itself does not offer proposals, but solicits policy proposals developed from the research and expertise of contributing authors.
This section reviews and synthesizes these policy proposals on human capital, beginning with workforce development and then moving in turn to postsecondary, K–12, and early childhood education. The sections organize policy ideas around building access to education while increasing affordability and quality. For more policy specifics and the evidence guiding the recommendations, please visit The Hamilton Project’s website (www.HamiltonProject.org).
WORKFORCE DEVELOPMENT
Access and Affordability
Building on the evidence that training programs can lift wages and other employment outcomes, a number of Hamilton Project proposals suggest boosting funding or improving the quality of training programs. Hamilton Project proposals focus on the opportunity to return to postsecondary education for those who are out of the workforce or who have been displaced from previous employment. Louis Jacobson, Robert LaLonde, and Daniel Sullivan (2011) propose a new Displaced Worker Training Program that would address targeting and Pell Grant eligibility based on recent and more-permanent labor market misfortunes. Sarah Turner (2017) proposes an Enrollment for Employment and Earnings policy that would improve the relationship between the unemployment insurance (UI) system and federal financial aid for postsecondary education. When applying for UI, beneficiaries would be informed of their eligibility for postsecondary financial aid; if interested, they would be given additional information about schools and programs of study. The proposed benefit level would allow for full-time enrollment in school and trigger a UI benefit extension.
However, postsecondary education is not the only training option, nor is it always the best option. If a worker loses her job in March, waiting to enroll at a community college the next semester is not likely to be the best course of action. Sheena McConnell, Irma Perez-Johnson, and Jillian Berk (2014) recommend allocating additional funding to the WIA Adult program; more funding in that program has been found to increase earnings among participants. While some WIA participants are working toward a postsecondary degree, there are many unemployed or low-skilled workers looking for shorter-term credit-bearing courses. These courses may eventually lead to a degree, but each course is discrete, builds skills, and can be taken on a rolling basis. McConnell, Perez-Johnson, and Berk also recommend augmenting the value of the training vouchers to allow recipients to pay for some of the ancillary costs of attendance that support success, such as high-quality child care and reliable transportation.
Apprenticeship programs are another important training option that should be strengthened. Apprentices work for an employer and earn a salary while undertaking on-the-job training, developing
workplace noncognitive skills, and completing occupation-related academic work. Workers experience immediate and large wage increases after completing their apprenticeships. Robert Lerman (2014) sees roles for states and the federal government in expanding apprenticeship opportunities in the United States, including facilitating relationships between employers and training providers, and providing financial incentives to develop programs.
Identifying and supporting the most effective training programs is crucial to workers’ success. Harry Holzer (2011) proposes a new federal competitive grant program to fund evidence-based training programs for implementation at the state level. With a flexible set of allowable activities by eligible applicants, resources from this grant could be leveraged to expand existing effective workforce development programs or to raise new dollars.
Quality
Those returning to training programs after losing employment are often in a precarious position because of their unemployed status and their need to learn new skills in order to reenter the labor force. Engaging a guidance counselor on where to enroll, in what type of program, and in what field improves the outcomes for those in workforce development programs. In addition, preenrollment counseling makes it more likely that those looking to enroll in workforce development programs or additional education will make good choices. Holzer (2014) therefore recommends career counseling for enrolled students, possibly facilitated by the collocation of American Job Centers with college campuses.
Several other Hamilton Project proposals aim to enhance the value of training programs, building on the evidence cited in figure 3 that sector-specific training programs generate the largest wage benefits to participants. Holzer (2011) recommends that a competitive grant program support sector-specific training programs, while Jacobson, LaLonde, and Sullivan (2011) propose financial incentives to community colleges to offer more high-return courses. In a different Hamilton Project proposal, Holzer (2014) recommends that states reward schools that place students in high-demand occupations and offer technical assistance for smoothing those relationships.
POSTSECONDARY EDUCATION
Access and Affordability
The Hamilton Project has commissioned many policy proposals to increase the share of Americans pursuing and completing college. Several Hamilton Project proposals address ways to lower the cost of college and thereby increase enrollment. However, many studies—perhaps surprisingly—do not show an effect of student aid on enrollment (Schanzenbach, Bauer, and Breitwieser 2017). One reason that the price discount afforded by student aid programs might not translate into enrollment growth is that students and their parents lack necessary information. Consequently, other Hamilton Project proposals describe corrective policies to make it clear to applicants that financial aid is available and college is potentially affordable.
Caroline Hoxby and Sarah Turner (2013) propose growing the Expanding College Opportunities Program by working with third-party college admissions institutions to provide customized college application information and fee waivers for high-achieving low-income students. Hoxby and Turner find that in addition to increasing
13
The Hamilton Project • Brookings
the number of applications, rates of matriculation at higher-quality colleges, and graduation rates, students save money due to more-generous financial aid packages at more-selective universities. In fact, the College Board has started to use the parameters outlined in this Hamilton Project proposal to provide more-personalized information to students who take their college entrance exams.
As part of the effort to increase student aid accessibility, Susan Dynarski and Judith Scott-Clayton (2007) propose streamlining federal aid into a single simplified schedule that could fit on a postcard; the FAFSA (Free Application for Federal Student Aid) process would be replaced with a checkbox on an income tax form. For the Pell Grant program specifically, Sandy Baum and Judith Scott-Clayton (2013) propose using only IRS data to make a single eligibility determination. In addition, Baum and Scott-Clayton propose giving a bonus to students who complete their degree within a designated time frame.
While grant aid covers a high share of the cost of going to most public two- and four-year colleges, student loans are still an important part of funding college for many students and have become a larger portion of consumer debt. Recent changes to the student loan system have helped develop and increase take-up of a number of income-based repayment programs, but student loan defaults are still prevalent, especially for students who do not complete their programs. Susan Dynarski and Daniel Kreisman (2013) recommend consolidating the many distinct student loan programs into a single income-based repayment system. This would better align loan repayment with the wage benefits of higher education that tend to accrue over time. Dynarski and Kreisman also propose reforms to the private loan system: private student loans would not survive bankruptcy, loans could not be marketed as student loans if they require a credit check, and private loans would be loans of last resort.
Quality
The Hamilton Project has several proposals to improve the quality of postsecondary education for students who struggle to complete a degree. Recommendations include providing more information about college quality to applicants, reforming the academic remediation process that ensnares many lower-skilled college entrants, providing additional support to low-income students, and giving schools a stake in the success of their students through financial incentives.
Some Hamilton Project proposals that focus on providing high-quality college-option information to students have now been implemented. Bridget Terry Long (2010) and Phillip Levine (2013) offer proposals to provide better information to students, including information about the costs of college and students’ labor force outcomes. The U.S. Department of Education’s College Scorecard, developed in part by former Hamilton Project policy director Adam Looney, provides this service.
Once enrolled in college, many students are surprised to find that they have been sorted into non-credit-bearing remedial courses. In a different Hamilton Project paper, Bridget Terry Long (2014) recommends ways to mitigate issues associated with remedial courses while enhancing program quality for students who require additional skills prior to taking on college-level work. To improve the process for placement into remedial coursework, Long recommends against using a single entrance exam. She also notes three paths for
improving the quality of remediation: mainstreaming, coordinating remedial and college-level coursework, and utilizing technology-enhanced learning.
Hamilton Project proposals have also leveraged the centrality of the federal aid system to improve the quality of the college experience for low-income students. Baum and Scott-Clayton (2013) propose augmenting the Pell Grant program with support service reforms such as providing academic coaching and career counseling to eligible students.
Two Hamilton Project proposals aim to improve postsecondary quality through better alignment of students’ and institutions’ incentives. Tiffany Chou, Adam Looney, and Tara Watson (2017) propose that institutions for which the five-year cohort repayment rate is less than 20 percent would be required to reimburse the government for a share of the shortfall. By making institutions share in the financial risk that students take on for tuition, institutions have an incentive to improve the labor force outcomes of their graduates. The revenue generated through this program would be used to provide grant support to institutions that serve low-income students particularly well. Such a program might also help steer students toward higher-quality programs. Likewise, Holzer (2014) would make public subsidies to public postsecondary institutions partially dependent on the labor market outcomes of students five years out.
Complementary to these approaches, David Deming (2017) argues in a Hamilton Project policy proposal that free college proposals should be paired with federal matching grants to postsecondary institutions. Specifically, he calls for a 1:1 federal match on the first $5,000 of net per student spending in all public two- and four-year postsecondary institutions that commit to making college tuition-free for income-eligible students. Schools could spend their matching grant money on programs that are key to improving quality and rates of completion: instruction and academic support.
K–12 EDUCATION
Access and Affordability
Compared to postsecondary and early childhood education and care, policy challenges in K–12 schooling are not typically framed in the language of access and affordability. State constitutions guarantee every child a free primary and secondary education in public schools, although state school finance systems are regularly challenged in the courts for failing to provide equitable or adequate education for all students. Hamilton Project proposals on K-12 education have focused on a variety of mechanisms to address the quality and equity of education.
Given that the literature demonstrates wage benefits from additional education, The Hamilton Project has commissioned policy proposals that would enhance the time students spend in school through access to summer programs and reduced absences. The more time students spend in school, the less likely they are to drop out of high school; in addition, more school time leads to higher enrollment in postsecondary programs.
Alan Krueger and Molly Fifer (2006) tackle summer learning loss, which occurs when students exhibit lower performance at the start of the school year than at the end of the prior school year. Summer learning loss is in large part an equity issue because those who have

14
The Hamilton Project • Brookings
the resources to pay for summer programs can avoid academic declines. Moreover, schools where remediation is necessary will spend less time teaching new information. Krueger and Fifer propose addressing this problem by providing resources to low-income students for six-week educational summer programs.
Missing days of school during the school year is also a problem. Patterns of school absence start in kindergarten, and continued absences predict lower achievement, course failures, and high school dropout. As a measure of school quality, Diane Whitmore Schanzenbach, Lauren Bauer, and Megan Mumford (2016) recommend that states hold schools accountable for reducing rates of chronic absenteeism. To reengage students in school, Derek Messacar and Phillip Oreopolous (2012), Jens Ludwig and Anuj Shah (2014), and Louis Jacobson (2017) propose developing and scaling up programs aimed at skill-building among at-risk youth.
Finally, preventing high school dropout and promoting postsecondary attendance are key to raising human capital. Messacar and Oreopolous (2012) propose to better enforce compulsory schooling laws as part of a carrot-and-stick approach to raising high school graduation rates. Going a step farther, Jacobson (2017) proposes that states hold schools accountable for students’ longer-term outcomes, such as completing postsecondary coursework or obtaining career-oriented certificates or two- or four-year degrees. To avoid remediation at the outset of postsecondary coursework, Long (2014) recommends better alignment between K–12 exit and postsecondary entrance requirements.
Quality
Hamilton Project policy proposals offer complementary ideas on improving K–12 teacher quality. One strand of work focuses on inducing good candidates to enter the teaching profession. Robert Gordon, Thomas Kane, and Douglas Staiger (2006) and Thomas Dee and Dan Goldhaber (2017) recommend opening up pathways to alternative certification for those who want to teach, and creating licensure reciprocity across states. Dee and Goldhaber additionally focus on the recruitment practices and student teacher placement strategies employed by school districts. They argue that both recruitment and early-career training should focus on subjects and schools where there are frequent teacher shortages; in addition, recruitment and placement should provide teaching candidates with information about what types of positions (e.g., special education or STEM) are in highest demand. For those teachers who are not performing well, Gordon, Kane, and Staiger propose assessing teacher value-added and denying tenure to the lowest-performing teachers.
Both these proposals use compensation-based incentives to retain high-quality teachers. Gordon, Kane, and Staiger (2006) support increasing the salaries paid to the highest-performing teachers as a general retention strategy. To address teacher shortages in difficult-to-staff subjects, Dee and Goldhaber (2017) propose targeting financial incentives to candidates for these positions. Brian Jacob and Jonah Rockoff (2011) propose that in their classroom assignments, principals should be thoughtful about developing each teacher’s expertise in a particular grade level, as a teacher of English language learners, or as a subject-matter specialist.
Though states are responsible for most of the redistribution of funds to needier districts, about 10 percent of school district budgets comes
from federal funds. A number of proposals look at opportunities afforded by Title I, federal money that goes to school districts to provide compensatory programs to assist academically challenged students. Nora Gordon (2016) makes recommendations about how to simplify and improve the targeting of the Title I grant formulas. She suggests that the U.S. Department of Education focus both on issuing clear nonregulatory guidance that matches current law and on removing old guidance as it becomes outdated, with corresponding outreach to state agencies so districts understand the considerable discretion they have over Title I funds. Jens Ludwig and Isabel Sawhill (2007) would require schools to spend their Title I dollars on effective evidence-based programs and faithful implementation of them. One such program, discussed in the Roseanna Ander, Jonathan Guryan, and Jens Ludwig (2016) proposal, would use Title I funds to scale daily in-school tutorials (one tutor to two students) to all students who are at least two grade levels behind in math.
Evidence also suggests that school organization can be improved so as to enhance student outcomes. Jacob and Rockoff (2011) propose phasing out middle schools in favor of the K–8 structure, and starting secondary schools later in the day. In a different Hamilton Project paper, Roland Fryer (2012) takes lessons learned from charter schools and suggests they be applied cross-sector. These recommendations mirror other Hamilton Project policy proposals that call for intensive tutoring, extended time, and teacher quality. Fryer also highlights the school-level role of data to drive personalization and feedback as well as school culture.
EARLY CHILDHOOD EDUCATION
Access and Affordability
Hamilton Project proposals have described a variety of policy levers that could expand access to and affordability of early childhood education and care. A policy proposal by Elizabeth Cascio and Diane Whitmore Schanzenbach (2014) provides a framework for state policymakers looking to expand early childhood education. They propose strategies for states that encompass both starting and scaling up programs. Because making progress on access requires new enrollees, they consider ways to prevent substitution or crowd-out of higher-income students who otherwise would have attended preschool.
The Cascio and Schanzenbach strategy presumes that states are the primary actors in early childhood education and care expansion, but the federal Head Start program could also enroll additional children. Ludwig and Sawhill (2007) propose what they called “Head Start on steroids” (16). To increase the number of children Head Start could serve, Ludwig and Sawhill would allow Head Start centers and elementary schools to apply for funds, jointly administered by the U.S. Departments of Education and Health and Human Services, to serve all eligible children in their area. By making the grants competitive and using a lottery to assign winners, they could embed a rapid and rigorous evaluation component into the program.
Other proposals recommend changing the tax code to make child-care provisions more generous and better targeted. Policy proposals by James Ziliak (2014) and Elizabeth Cascio (2017) recommend eliminating the Child and Dependent Care Tax Credit and replacing it with a new refundable child-care tax credit. Both proposals would target the new credit toward low-income families, limiting eligibility to households with an adjusted gross income at or below $70,000.

15
The Hamilton Project • Brookings
Cascio additionally recommends making the credit more generous for families with younger children, while Ziliak recommends doubling the size of the credit if the child is enrolled in a licensed program.
The vast majority of parents who are enrolled in school themselves are enrolled in two-year degree-granting institutions. Long (2017) makes proposals for expanding access to and the affordability of child care on postsecondary campuses. Noting that child-care costs are not factored into the FAFSA and that few campuses offer on-site or subsidized child care, Long proposes expanding and improving the Child Care Access Means Parents in School (CCAMPIS) Program. Accredited postsecondary institutions would apply for a grant to offer child care to students, and would give priority to schools that serve students with greater need. Schools could fund their own centers or subsidize enrollment in a higher-quality child-care center.
Quality
The theory undergirding Ziliak and Cascio’s proposals is that by supporting low-income families with additional resources to pay for child care, parents are more likely to switch from informal care to more-expensive but higher-quality care. Ziliak provides further monetary incentives for increased quality, doubling the value of the credit if a family enrolls a child in a licensed program. However, there are other ways to improve the overall quality of early childhood education and care beyond helping families pay for the more-expensive programs.
In order to increase the quality of existing early childhood education and care programs, Cascio and Schanzenbach (2014) and Cascio (2017) recommend that states adopt program standards for quality, such as early learning standards (including process quality); parameters for teacher education, specialization, professional development, class size and teacher-to-pupil ratios; and wraparound health and nutrition services. Adding assessments and accountability metrics, like Quality Rating and Improvement Systems and Classroom Assessment Scoring System, would keep attention focused on both providers and classrooms.
ConclusionBeyond the benefits to individuals’ lives that education can bring, a well-educated population confers many benefits to the economy in the form of higher productivity, higher wages, and lower unemployment rates. The evidence reviewed in this paper shows that the wage returns to a wide variety of human capital inputs
are substantial and that human capital investments are vital to sustaining a vibrant economy.
At each stage of human capital formation and across the life course, core concepts emerge:
Having at least a four-year college education generates the largest wage returns to education. A number of policies can affect college attendance and completion, such as lowering the perceived cost of college, reducing barriers to applying to high-quality colleges for low-income students, providing information and counseling to improve decision making, and providing financial incentives to schools to improve completion and workforce outcomes for students.
It is necessary to make improvements in K–12 quality and outcomes to ensure students are adequately prepared to succeed in college and careers. This can be achieved through a focus on key issues in K–12, including ensuring students spend more time in school and remain engaged during the summer, reducing chronic absenteeism, and preventing high school dropout. Policies to improve school quality, including improving teacher quality, supporting intensive tutoring, and making school start times developmentally appropriate, can also contribute to student success.
A growing body of evidence suggests that early childhood education has substantial benefits to participants, including on their lifetime earnings in adulthood. Hamilton Project proposals leverage the wide variety of policy tools available in order to ensure access to and the affordability of high-quality early childhood education and child care.
Not all educational investments take years to bear fruit, nor do they require formal schooling—workforce development can work. Providing access to high-quality workforce development—such as short-term training programs to earn credits and build stackable credentials, apprenticeship programs that offer paid work and training on the job and in the classroom, and community colleges that provide occupational training in high-demand sectors—would increase wages through skill-building and re-skilling.
The United States should invest early and consistently in education. Simply expending more resources is not the entire story: a number of proposals suggest ways to improve the efficacy of spending, thereby deepening access to educational opportunities while maintaining quality. Taken as a whole, these Hamilton Project policy proposals would help to expand and improve U.S. education and human capital investment, an integral part of lifting wages over time.

16
The Hamilton Project • Brookings
1. There is also the possibility, that education does increase wages, but not because of an increase in human capital, rather because people pursue education to signal to employers that they are high quality employees. Evidence suggests this does not substantially explain the wage returns to education (Lange and Topel 2006)
Ander, Roseanna, Jonathan Guryan, and Jens Ludwig. 2016, March. “Improving Academic Outcomes for Disadvantaged Students: Scaling Up Individualized Tutorials.” Policy Proposal 2016-02, The Hamilton Project, Brookings Institution, Washington, DC.
Ashenfelter, Orley, and David Card, eds. 1999. Handbook of Labor Economics vol. 3. Amsterdam, Netherlands: Elsevier.
Autor, David. 2014. “Skills, Education, and the Rise of Earnings Inequality among the ‘Other 99 Percent.’” Science 344 (6186): 843–51.
Barr, Andrew, and Sarah Turner. 2015. “Out of Work and Into School: Labor Market Policies and College Enrollment During the Great Recession.” Journal of Public Economics 124 (April): 63–73.
Baum, Sandy, David W. Breneman, Matthew M. Chingos, Ronald G. Ehrenberg, Pamela Fowler, John Hayek, Donald E. Heller, et al. 2012, May. “Beyond Need and Merit: Strengthening State Grant Programs.” Brown Center on Education Policy, Brookings Institution, Washington, DC.
Baum, Sandy, and Judith Scott-Clayton. 2013, October. “Redesigning the Pell Grant Program for the Twenty-First Century.” Policy Proposal 2013-04, The Hamilton Project, Brookings Institution, Washington, DC.
Bloom, Howard S., Larry L. Orr, Stephen H. Bell, George Cave, Fred Doolittle, Winston Lin, and Johannes M. Bos. 1997. “The Benefits and Costs of JTPA Title II-A Programs: Key Findings from the National Job Training Partnership Act Study.” Journal of Human Resources 32 (3): 549–76.
Bosler, Canyon, Mary C. Daly, John G. Fernald, and Bart Hobijn. 2016. “The Outlook for U.S. Labor-Quality Growth.” Working Paper 2016-14, Federal Reserve Bank of San Francisco, San Francisco, CA.
Bureau of Labor Statistics (BLS). 2017. “Unemployment Rates and Earnings by Educational Attainment, 2016.” Bureau of Labor Statistics, U.S. Department of Labor, Washington, DC.
———. 2018, January. “Usual Weekly Earnings of Wage and Salary Workers: Fourth Quarter 2017.” USDL-18-0079, News Release, Bureau of Labor Statistics, U.S. Department of Labor, Washington, DC.
Endnote
References
Cannon, Jill S., M. Rebecca Kilburn, Lynn A. Karoly, Teryn Mattox, Ashley N. Muchow, and Maya Buenaventura. 2017. “Investing Early: Taking Stock of Outcomes and Economic Returns from Early Childhood Programs.” RAND Corporation, Santa Monica, CA.
Cascio, Elizabeth U. 2017, October. “Public Investments in Child Care.” Policy Proposal 2017-14, The Hamilton Project, Brookings Institution, Washington, DC.
Cascio, Elizabeth U., and Diane Whitmore Schanzenbach. 2014, June. “Expanding Preschool Access for Disadvantaged Children.” In Kearney and Harris, Policies to Address Poverty in America, chap. 1.
Cave, George, Hans Bos, Fred Doolittle, and Cyril Toussaint. 1993. “JOBSTART: Final Report on a Program for School Dropouts.” Manpower Demonstration Research Corporation (MDRC), New York, NY.
Chetty, Raj, John N. Friedman, Nathaniel Hilger, Emmanuel Saez, Diane Whitmore Schanzenbach, and Danny Yagan. 2011. “How Does Your Kindergarten Classroom Affect Your Earnings? Evidence from Project Star.” Quarterly Journal of Economics 126 (4): 1593–660.
Chetty, Raj, John N. Friedman, and Jonah E. Rockoff. 2014. “Measuring the Impacts of Teachers I: Evaluating Bias in Teacher Value-Added Estimates.” American Economic Review 104 (9): 2593–632.
Chou, Tiffany, Adam Looney, and Tara Watson. 2017, April. “A Risk-Sharing Proposal for Student Loans.” Policy Proposal 2017-04, The Hamilton Project, Brookings Institution, Washington, DC.
College Board. 2016. Trends in Student Aid. New York, NY: The College Board.
Dee, Thomas S., and Dan Goldhaber. 2017, April. “Understanding and Addressing Teacher Shortages in the United States.” Policy Proposal 2017-05, The Hamilton Project, Brookings Institution, Washington, DC.
Deming, David J. 2017, April. “Increasing College Completion with a Federal Higher Education Matching Grant.” Policy Proposal 2017-03, The Hamilton Project, Brookings Institution, Washington, DC.

17
The Hamilton Project • Brookings
Deming, David J., and Susan M. Dynarski. 2009, September. “Into College, Out of Poverty? Policies to Increase the Postsecondary Attainment of the Poor.” Working Paper 15387, National Bureau of Economic Research, Cambridge, MA.
Dynarski, Susan M., and Daniel Kreisman. 2013, October. “Loans for Educational Opportunity: Making Borrowing Work for Today’s Students.” Policy Proposal 2013-05, The Hamilton Project, Brookings Institution, Washington, DC.
Dynarski, Susan M., and Judith E. Scott-Clayton. 2007, February. “College Grants on a Postcard: A Proposal for Simple and Predictable Federal Student Aid.” Policy Proposal 2007-01, The Hamilton Project, Brookings Institution, Washington, DC.
———. 2013, January. “Financial Aid Policy: Lessons from Research.” Working Paper 18710, National Bureau of Economic Research, Cambridge, MA.
Elango, Sneha, Jorge Luis Garcia, James J. Heckman, and Andres P. Hojman. 2016. “Early Childhood Education.” In Economics of Means-Tested Transfer Programs in the United States, vol. 2, edited by Robert Moffitt. Chicago: University of Chicago Press.
Elliott, Mark, and Anne Roder. 2017, April. “Escalating Gains: Project QUEST’s Sectoral Strategy Pays Off.” Economic Mobility Corporation.
Federal Reserve Bank of St. Louis. 2014, March. “Unemployment Rates by Educational Attainment.” FRED Economic Data, Federal Reserve Bank of St. Louis, St. Louis, MO.
———. n.d. FRED Economic Data. Federal Reserve Bank of St. Louis, St. Louis, MO.
Fernald, John G., and Charles I. Jones. 2014, January. “The Future of U.S. Economic Growth.” Working Paper 2014-02, Federal Reserve Bank of San Francisco, CA.
Fryer, Roland. 2012, September. “Learning from the Successes and Failures of Charter Schools.” Policy Proposal 2012-06, The Hamilton Project, Brookings Institution, Washington, DC.
Gordon, Nora. 2016, March. “Increasing Targeting, Flexibility, and Transparency in Title I of the ESEA.” Policy Proposal 2016-01, The Hamilton Project, Brookings Institution, Washington, DC.
Gordon, Robert, Thomas J. Kane, Douglas O. Staiger. 2006, April. “Identifying Effective Teachers Using Performance on the Job.” Policy Proposal 2006-01, The Hamilton Project, Brookings Institution, Washington, DC.
Greenberg, David H., Charles Michalopolous, and Philip K. Robins. 2003. “A Meta-Analysis of Government-Sponsored Training Programs.” ILR Review 57 (1): 31–53.
Greenstone, Michael, and Adam Looney. 2011, November. “Building America’s Job Skills with Effective Workforce Programs: A Training Strategy to Raise Wages and Increase Work Opportunities.” Strategy Paper, The Hamilton Project, Brookings Institution, Washington, DC.
Hendra, Richard, David H. Greenberg, Gayle Hamilton, Ari Oppenheim, Alexandra Pennington, Kelsey Schaberg, and Betsy L. Tessler. 2016, August. “Encouraging Evidence on a Sector-Focused Advancement Strategy.” MDRC, New York, NY.
Hoekstra, Mark. 2009. “The Effect of Attending the Flagship State University on Earnings: A Discontinuity-Based Approach.” Review of Economics and Statistics 91 (4): 717–24.
Holzer, Harry J. 2011. “Raising Job Quality and Skills for American Workers: Creating More-Effective Education and Workforce Development Systems in the States.” Policy Proposal 2011-10, The Hamilton Project, Brookings Institution, Washington, DC.
———. 2014, June. “Improving Employment Outcomes for Disadvantaged Students.” In Kearney and Harris, Policies to Address Poverty in America, chap. 8.
Holzer, Harry J., and Sandy Baum. 2017. Making College Work: Pathways to Success for Disadvantaged Students. Washington, DC: Brookings Institution Press.
Hoxby, Caroline M., and Sarah Turner. 2013, June. “Informing Students about Their College Options: A Proposal for Broadening the Expanding College Opportunities Project.” Policy Proposal 2013-03, The Hamilton Project, Brookings Institution, Washington, DC.
Jackson, C. Kirabo, Rucker C. Johnson, and Claudia Persico. 2016. “The Effects of School Spending on Educational and Economic Outcomes: Evidence from School Finance Reforms.” Quarterly Journal of Economics 131 (1): 157–218.
Jackson, C. Kirabo, Cora Wigger, and Heyu Xiong. 2018. “Do School Spending Cuts Matter? Evidence from the Great Recession.” Working Paper 18-02, Institute for Policy Research, Northwestern University, Evanston, IL.
Jacob, Brian A., and Jonah E. Rockoff. 2011, September. “Organizing Schools to Improve Student Achievement: Start Times, Grade Configurations, and Teacher Assignments.” Policy Proposal 2011-08, The Hamilton Project, Brookings Institution, Washington, DC.
Jacobson, Louis S. 2017, April. “Improving College and Career Outcomes of Low-Performing High School Students.” Policy Proposal 2017-07, The Hamilton Project, Brookings Institution, Washington, DC.
Jacobson, Louis, Robert J. LaLonde, and Daniel G. Sullivan. 2005. “Estimating the Returns to Community College Schooling for Displaced Workers.” Journal of Econometrics 125 (1–2): 271–304.
———. 2011, November. “Policies to Reduce High-Tenured Displaced Workers’ Earnings Losses through Retraining.” Policy Proposal 2011-11, The Hamilton Project, Brookings Institution, Washington, DC.
Jepsen, Christopher, Kenneth Troske, and Paul Coomes. 2014. “The Labor-Market Returns to Community College Degrees, Diplomas, and Certificates.” Journal of Labor Economics 32 (1): 95–121.
Katz, Lawrence F., and David H. Autor. 1999. “Changes in the Wage Structure and Earnings Inequality.” In Ashenfelter and Card Handbook of Labor Economics vol. 3, 1464–555.
Kearney, Melissa S., and Benjamin H. Harris, eds. 2014. Policies to Address Poverty in America. Washington, DC: The Hamilton Project, Brookings Institution.
Kemper, Peter, David Long, and Craig Thornton. 1981. “The Supported Work Evaluation: Final Benefit-Cost Analysis.” Manpower Demonstration Research Corporation (MDRC), New York, NY.

18
The Hamilton Project • Brookings
Kemple, James J., and Cynthia J. Willner. 2008. “Career Academics: Long-Term Impacts on Labor Market Outcomes, Educational Attainment, and Transitions to Adulthood.” MDRC, New York.
Krueger, Alan B., and Molly E. Fifer. 2006, April. “Summer Opportunity Scholarships (SOS): A Proposal to Narrow the Skills Gap.” Policy Proposal 2006-03, The Hamilton Project, Brookings Institution, Washington, DC.
Lange, Fabian, and Robert Topel. 2006. “The Social Value of Education and Human Capital.” In Handbook of the Economics of Education, vol. 1, edited by Erik Hanushek and F. Welch, 459–509. Amsterdam, Netherlands: Elsevier.
Leachman, Michael, Kathleen Masterson, and Eric Figueroa. 2017, November 29. “A Punishing Decade for School Funding.” Center on Budget and Policy Priorities, Washington, DC.
Lerman, Robert I. 2014. “Expanding Apprenticeship Opportunities in the United States.” In Kearney and Harris, Policies to Address Poverty in America, chap. 7.
Levine, Phillip. 2013, October. “Simplifying Estimates of College Costs.” Policy Proposal 2013-06, The Hamilton Project, Brookings Institution, Washington, DC.
Long, Bridget Terry. 2010, December. “Grading Higher Education: Giving Consumers the Information They Need.” Paper jointly released by The Center for American Progress and The Hamilton Project, Brookings Institution, Washington, DC.
———. 2014. “Addressing the Academic Barriers to Higher Education.” In Kearney and Harris, Policies to Address Poverty in America, chap. 6.
———. 2017, October. “Helping Women to Succeed in Higher Education: Supporting Student-Parents with Child Care.” Policy Proposal 2017-15, The Hamilton Project, Brookings Institution, Washington, DC.
Ludwig, Jens, and Isabel V. Sawhill. 2007, February. “Success by Ten: Intervening Early, Often, and Effectively in the Education of Young Children.” Policy Proposal 2007-02, The Hamilton Project, Brookings Institution, Washington, DC.
Ludwig, Jens, and Anuj Shah. 2014, May. “Think Before You Act: A New Approach to Preventing Youth Violence and Dropout.” Policy Proposal 2014-02, The Hamilton Project, Brookings Institution, Washington, DC.
Maguire, Sheila, Joshua Freely, Carol Clymer, Maureen Conway, and Deena Schwartz. 2010. “Tuning In to Local Labor Markets: Findings from the Sectoral Employment Impact Study, Executive Summary.” Public/Private Ventures Publications, Philadelphia, PA.
McConnell, Sheena, Irma Perez-Johnson, and Jillian Berk. 2014. “Providing Disadvantaged Workers with Skills to Succeed in the Labor Market.” In Kearney and Harris, Policies to Address Poverty in America, chap. 9.
Messacar, Derek, and Philip Oreopoulos. 2012, September. “Staying in School: A Proposal to Raise High-School Graduation Rates.” Policy Proposal 2012-07, The Hamilton Project, Brookings Institution, Washington, DC.
Millenky, Megan, Dan Bloom, Sara Muller-Ravett, and Joseph Broadus. 2011. “Staying on Course: Three-Year Results of the National Guard Youth ChalleNGe Evaluation.” Manpower Demonstration Research Corporation (MDRC), New York, NY.
National Association of State Workforce Agencies. 2017, August. “NASWA 2016 State Supplemental Funding Survey.” National Association of State Workforce Agencies, Washington, DC.
National Institute for Early Education Research. 2017. The State of Preschool 2016: State Preschool Yearbook. New Brunswick, NJ: Rutgers Graduate School of Education.
National Skills Coalition. 2008–15. “Interactive Federal Funding Tool.” National Skills Coalition, Washington, DC.
Oreopoulos, Philip. 2009. “Would More Compulsory Schooling Help Disadvantaged Youth? Evidence from Recent Changes to School-Leaving Laws.” In The Problems of Disadvantaged Youth: An Economic Perspective, edited by Jonathan Gruber, 85–112. Chicago, IL: University of Chicago Press.
Organisation for Economic Co-operation and Development (OECD). 2013. “OECD Family Database.” Organisation for Economic Co-operation and Development, Paris, France.
———. 2017. “Public Spending on Labour Markets (indicator).” OECD Data, Organisation for Economic Co-operation and Development, Paris, France. doi: 10.1787/911b8753-en. Accessed December 21, 2017.
———. 2018. “Population with Tertiary Education (indicator).” OECD Data, Organisation for Economic Co-operation and Development, Paris, France. doi: 10.1787/0b8f90e9-en. Accessed January 5, 2018.
———. n.d. “OECD.Stat.” OECD Statistics, Organisation for Economic Co-operation and Development, Paris, France. Accessed July 20, 2017.
Roder, Anne, and Mark Elliott. 2011. “A Promising Start: Year Up’s Initial Impacts on Low-Income Young Adults’ Careers.” Economic Mobility Corporation, New York, NY.
Schanzenbach, Diane Whitmore, Lauren Bauer, and Audrey Breitwieser. 2017, April. “Eight Economic Facts on Higher Education.” Economic Facts, The Hamilton Project, Brookings Institution, Washington, DC.
Schanzenbach, Diane Whitmore, Lauren Bauer, and Megan Mumford. 2016, October. “Lessons for Broadening School Accountability under the Every Student Succeeds Act.” Strategy Paper, The Hamilton Project, Brookings Institution, Washington, DC.
Schanzenbach, Diane Whitmore, David Boddy, Megan Mumford, and Greg Nantz. 2016, March. “Fourteen Economic Facts on Education and Economic Opportunity.” Economic Facts, The Hamilton Project, Brookings Institution, Washington, DC.
Schanzenbach, Diane Whitmore, Ryan Nunn, Lauren Bauer, and Audrey Breitwieser. 2017, August. “The Closing of the Jobs Gap: A Decade of Recession and Recovery.” Economic Analysis, The Hamilton Project, Brookings Institution, Washington, DC.

19
The Hamilton Project • Brookings
Schochet, Peter Z., John Burghardt, and Sheena McConnell. 2008. “Does Job Corps Work? Impact Findings from the National Job Corps Study.” American Economic Review 98 (5): 1864–86.
State Higher Education Officers Association (SHEEO). 2003. State Higher Education Finance Report: FY 2003. Boulder, CO: State Higher Education Officers Association.
———. 2009. State Higher Education Finance Report: FY 2009. Boulder, CO: State Higher Education Officers Association.
———. 2015. State Higher Education Finance Report: FY 2015. Boulder, CO: State Higher Education Officers Association.
Tandberg, David A., and Casey Griffith. 2013. “State Support of Higher Education: Data, Measures, Findings, and Directions for Future Research.” Higher Education: Handbook of Theory and Research 28 (1): 613–85.
Turner, Sarah. 2017, April. “Labor Force to Lecture Hall: Pell Grants and Postsecondary Policies in Response to Job Loss.” Policy Proposal 2017-06, The Hamilton Project, Brookings Institution, Washington, DC.
U.S. Census Bureau. 1997. “PINC-03. Educational Attainment-People 25 Years Old and Over, by Total Money Earnings, Work Experience, Age, Race, Hispanic Origin, and Sex, 1996.” Current Population Survey Tables for Personal Income, U.S. Census Bureau, Suitland, MD.
———. 2017a. “PINC-03. Educational Attainment-People 25 Years Old and Over, by Total Money Earnings, Work Experience, Age, Race, Hispanic Origin, and Sex, 2016.” Current Population Survey Tables for Personal Income, U.S. Census Bureau, Suitland, MD.
———. 2017b. “Table A-1. Years of School Completed by People 25 Years and Over, by Age and Sex: Selected Years 1940 to 2017.” Current Population Survey Historical Time Series Tables, U.S. Census Bureau, Suitland, MD.
———. 2017c. “Table A-4. Detailed Years of School Completed by People 25 Years and Over: 2000 to 2017.” Current Population Survey Historical Time Series Tables, U.S. Census Bureau, Suitland, MD.
Weinberger, Catherine J. 2014. “The Increasing Complementarity between Cognitive and Social Skills.” Review of Economics and Statistics 96 (5): 849–61.
Ziliak, James P. 2014. “Proposal 10: Supporting Low-Income Workers through Refundable Child-Care Credits.” In Kearney and Harris, Policies to Address Poverty in America, chap. 10.
Ziliak, James P., Charles Hokayem, and Bradley Hardy. “Child Care Subsidies and the Economic Well-Being of Recipient Families: A Survey and Implications for Kentucky.” University of Kentucky Center for Poverty Research, Lexington, KY.
Zimmerman, Seth D. 2014. “The Returns to College Admission for Academically Marginal Students.” Journal of Labor Economics 32 (4): 711–54.

20
The Hamilton Project • Brookings
Authors
Jay ShambaughDirector, The Hamilton Project; Senior Fellow, Economic Studies, The Brookings Institution; Professor of Economics and International Affairs, Elliott School of International Affairs, The George Washington University
Jay Shambaugh is the director of The Hamilton Project and a senior fellow in Economic Studies at the Brookings Institution. He is also a Professor of Economics and International Affairs at the Elliott School of International Affairs at The George Washington University. He has spent two stints in public service. Most recently, he served as a Member of the White House Council of Economic Advisers (August 2015–January 2017) where he was involved in policy related to international economics, macroeconomics, competition policy, energy and environment policy, housing, finance, technology, as well as other issues. He also served as first Senior Economist for International Economics and then Chief Economist at the White House Council of Economic Advisers (2009–11).
Prior to joining the faculty at George Washington, Jay taught at Georgetown and Dartmouth. He is also a Research Associate at the NBER and has been a visiting scholar at the IMF. Jay received his PhD in economics from the University of California at Berkeley, MA from the Fletcher School at Tufts, and BA from Yale University.
Jay’s area of research is macroeconomics and international economics. His work includes analysis of the interaction of exchange rate regimes with monetary policy, capital flows, and trade flows as well as studies of international reserves holdings, country balance sheet exchange rate exposure, the cross-country impact of fiscal policy, and the current crisis in the euro area. In addition to his book, Exchange Rate Regimes in the Modern Era (MIT Press, 2009), Jay has published in The American Economic Review, The Quarterly Journal of Economics, and other leading journals.
Lauren BauerPost-Doctoral Fellow, Economic Studies, The Brookings Institution
Lauren Bauer is a post-doctoral fellow in Economic Studies at the Brookings Institution. Her research focuses on social and safety net policies as well as civic engagement and political behavior. She holds a BA in History and an MA and PhD in Human Development and Social Policy with a certificate in Education Sciences all from Northwestern University. Prior to taking up doctoral work, Lauren served in research positions with political campaigns and as a Special Assistant in the Office of the Secretary at the US Department of Education.
Audrey BreitwieserSenior Research Assistant, The Hamilton Project
Audrey Breitwieser is a senior research assistant at The Hamilton Project. She graduated magna cum laude from Claremont McKenna College in 2016 with a degree in economics. During her time as a research assistant she has coauthored papers on topics including women’s labor force participation, higher education, and The Great Recession.
Acknowledgments
We would like to thank David Dreyer, Joy Fox, Nora Gordon, Ben Harris, Mark Hoekstra, Harry Holzer, Kriston McIntosh, Ryan Nunn, and Mark Steitz for excellent comments and suggestions. We would also like to thank Nick Fedorochko for his contributions to all aspects of this paper, and Patrick Liu, Becca Portman, and Rachel Williams for research assistance.

21
The Hamilton Project • Brookings
ADVISORY COUNCIL
GEORGE A. AKERLOFUniversity ProfessorGeorgetown University
ROGER C. ALTMANFounder & Senior ChairmanEvercore
KAREN ANDERSONSenior Director of Policy and CommunicationsBecker Friedman Institute forResearch in EconomicsThe University of Chicago
ALAN S. BLINDERGordon S. Rentschler Memorial Professor of Economics & Public AffairsPrinceton UniversityNonresident Senior FellowThe Brookings Institution
ROBERT CUMBYProfessor of EconomicsGeorgetown University
STEVEN A. DENNINGChairmanGeneral Atlantic
JOHN M. DEUTCHInstitute ProfessorMassachusetts Institute of Technology
CHRISTOPHER EDLEY, JR.Co-President and Co-FounderThe Opportunity Institute
BLAIR W. EFFRONPartnerCenterview Partners LLC
DOUGLAS W. ELMENDORFDean & Don K. Price Professorof Public PolicyHarvard Kennedy School
JUDY FEDERProfessor & Former DeanMcCourt School of Public PolicyGeorgetown University
ROLAND FRYERHenry Lee Professor of EconomicsHarvard University
JASON FURMANProfessor of the Practice of Economic PolicyHarvard Kennedy SchoolSenior CounselorThe Hamilton Project
MARK T. GALLOGLYCofounder & Managing PrincipalCenterbridge Partners
TED GAYERVice President & DirectorEconomic StudiesThe Brookings Institution
TIMOTHY F. GEITHNERPresidentWarburg Pincus
RICHARD GEPHARDTPresident & Chief Executive OfficerGephardt Group Government Affairs
ROBERT GREENSTEINFounder & PresidentCenter on Budget and Policy Priorities
MICHAEL GREENSTONEMilton Friedman Professor of EconomicsDirector of the Becker Friedman Institute for Research in EconomicsDirector of the Energy Policy InstituteUniversity of Chicago
GLENN H. HUTCHINSCo-founderNorth IslandCo-founderSilver Lake
JAMES A. JOHNSONChairmanJohnson Capital Partners
LAWRENCE F. KATZElisabeth Allison Professor of EconomicsHarvard University
MELISSA S. KEARNEYProfessor of EconomicsUniversity of MarylandNonresident Senior FellowThe Brookings Institution
LILI LYNTONFounding PartnerBoulud Restaurant Group
HOWARD S. MARKSCo-ChairmanOaktree Capital Management, L.P.
MARK MCKINNONFormer Advisor to George W. BushCo-Founder, No Labels
ERIC MINDICHChief Executive Officer & FounderEton Park Capital Management
ALEX NAVABFormer Head of Americas Private EquityKKRFounderNavab Holdings
SUZANNE NORA JOHNSONFormer Vice ChairmanGoldman Sachs Group, Inc.
PETER ORSZAGVice Chairman of Investment BankingManaging Director and Global Co-head of HealthLazardNonresident Senior FellowThe Brookings Institution
RICHARD PERRYManaging Partner & Chief Executive OfficerPerry Capital
PENNY PRITZKERChairmanPSP Partners
MEEGHAN PRUNTYManaging DirectorBlue Meridian PartnersEdna McConnell Clark Foundation
ROBERT D. REISCHAUERDistinguished Institute Fellow & President EmeritusUrban Institute
ALICE M. RIVLINSenior Fellow, Economic StudiesCenter for Health PolicyThe Brookings Institution
DAVID M. RUBENSTEINCo-Founder & Co-Chief Executive OfficerThe Carlyle Group
ROBERT E. RUBINFormer U.S. Treasury SecretaryCo-Chair EmeritusCouncil on Foreign Relations
LESLIE B. SAMUELSSenior CounselCleary Gottlieb Steen & Hamilton LLP
SHERYL SANDBERGChief Operating OfficerFacebook
DIANE WHITMORE SCHANZENBACHMargaret Walker Alexander ProfessorDirectorThe Institute for Policy ResearchNorthwestern UniversityNonresident Senior FellowThe Brookings Institution
RALPH L. SCHLOSSTEINPresident & Chief Executive OfficerEvercore
ERIC SCHMIDTTechnical AdvisorAlphabet Inc.
ERIC SCHWARTZChairman and CEO76 West Holdings
THOMAS F. STEYERBusiness Leader and Philanthropist
LAWRENCE H. SUMMERSCharles W. Eliot University ProfessorHarvard University
LAURA D’ANDREA TYSONProfessor of Business Administration and Economics DirectorInstitute for Business & Social ImpactBerkeley-Haas School of Business
JAY SHAMBAUGHDirector

22
The Hamilton Project • BrookingsW W W . H A M I L T O N P R O J E C T . O R G
1775 Massachusetts Ave., NW Washington, DC 20036
(202) 797-6484
Printed on recycled paper.
AbstractHuman capital investment is central to raising wages. This chapter describes trends in human capital investment and educational attainment. It reviews the evidence of the wage returns to educational attainment and to early childhood education, K–12 education, postsecondary education, and workforce development policies and programs. Finally, this chapter synthesizes a decade of Hamilton Project policy proposals on education and human capital around a framework of access, affordability, and quality.
Source: Bureau of Labor Statistics (BLS) 2017.
Note: Data are for persons age 25 and over in 2016. Earnings are for full-time wage and salary workers.
FIGURE 2.
Unemployment Rates and Median Weekly Earnings by Educational Attainment
Unemployment rate
Median earnings
Median w
eekly earnings (2016 dollars)U
nem
ploy
men
t rat
e (p
erce
nt)
Somecollege
High schooldegree
Less thanhigh school
Associate’sdegree
Bachelor’sdegree
Master’sdegree
Professionaldegree
Doctorate0
2
4
6
8
0
450
900
1350
1800