Embed Size (px)
Citation preview
45th International Conference on Environmental Systems ICES-2015-307 12–16 July 2015, Bellevue, Washington
Return to Mercury: An Overview of the MESSENGER
Spacecraft Thermal Environmental Predictions and Analysis
Process
G. Allan Holtzman,1 Shawn M. Begley,
2 and Carl J. Ercol
3
The Johns Hopkins University Applied Physics Laboratory, Laurel, MD, 20723
At 01:00 UTC on 18 Mar 2011, the MErcury Surface, Space ENvironment, GEochemistry,
and Ranging (MESSENGER) spacecraft became the first to achieve orbit around the planet
Mercury. Designed and built by The Johns Hopkins University Applied Physics Laboratory
in conjunction with the Carnegie Institution of Washington, MESSENGER was launched on
3 Aug 2004, and after studying the planet Mercury from orbit for more than four years,
impacted the planet at 19:25 UTC on 30 Apr 2015. This paper provides an overview of the
thermal support activities for the spacecraft and the process used to make temperature
predictions for critical spacecraft components. The planned operational profile for the
spacecraft position and attitude was run through the thermal analysis process to generate
environmental and internal heating profiles for spacecraft components. The environmental
heating calculations were performed with a custom algorithm that was run on a graphics
processing unit for increased performance and that takes into account the thermal
environment of Mercury, including spatial variation of the surface properties. Temperature
predictions were generated from physical models of each spacecraft component, and the
operational plan was modified if temperature limits were exceeded. Each Mercury year, flight
temperatures were compared with the predictions, and adjustments to the process were made
as necessary. Special thermal challenges, such as comet observations, instrument calibrations,
or potential safe-hold demotions, were analyzed on an individual basis and sometimes
involved several iterations of planning. The fidelity of the enhanced thermal analysis process
optimized science return while mitigating thermal risks to the spacecraft and its instruments.
Nomenclature
AU = Astronomical Unit
CUDA = parallel computing platform and programming model created by the Nvidia Corporation
ESC = Earth solar constant
FPAA = Front phased-array antenna
GPU = Graphics processing unit
IR = Infrared
MOI = Mercury orbit insertion
MTA = Mercury true anomaly
OCM = Orbit-correction maneuver
OTA = Orbit true anomaly
SAX = Solar Assembly for X-rays
SciBox = An end-to-end automated science planning and commanding system
STK = Satellite ToolKit
XRS = X-Ray Spectrometer
1 G. Allan Holtzman, Spacecraft Analysis and Operations Thermal Lead, The Johns Hopkins University Applied
Physics Laboratory, 11100 Johns Hopkins Road, Laurel, MD 20723-6099. 2 Shawn M. Begley, Instrument Analysis and Operations Thermal Lead, The Johns Hopkins University Applied
Physics Laboratory, 11100 Johns Hopkins Road, Laurel, MD 20723-6099. 3 Carl J. Ercol, Spacecraft Design Thermal Lead, The Johns Hopkins University Applied Physics Laboratory, 11100
Johns Hopkins Road, Laurel, MD 20723-6099.
International Conference on Environmental Systems
2
I. Introduction
HE MErcury Surface, Space ENvironment, GEochemistry and Ranging (MESSENGER) mission studied Mercury
from orbit for more than four Earth years. This paper provides an overview of the thermal support activities of the
MESSENGER spacecraft during the final orbital phase of the mission; the cruise phase, Mercury orbit insertion (MOI),
early orbital operations, and the transition to an 8-hour orbit have been covered previously.1–5
Spacecraft-related
thermal activities included calculations of the thermal heating environment, daily monitoring of the temperatures of
spacecraft components and instruments, comparison of flight temperatures with model predictions and historical trends,
and interactions with the operations team to manage temperatures of critical spacecraft components.
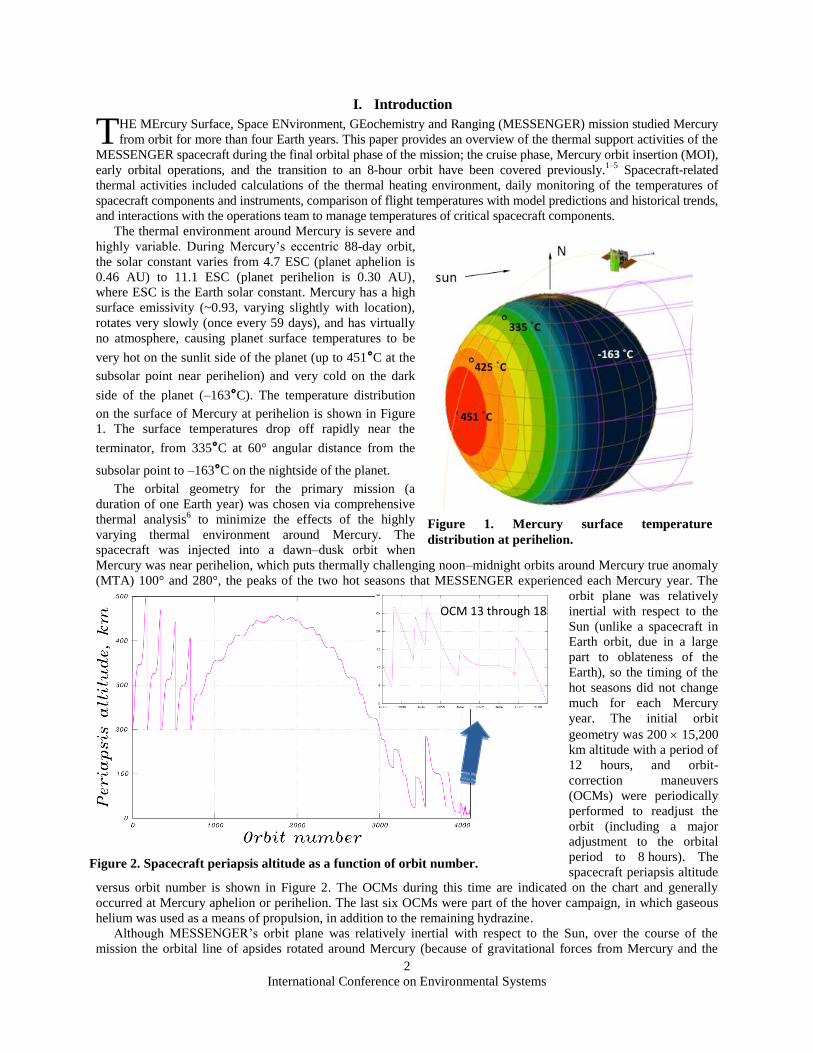
The thermal environment around Mercury is severe and
highly variable. During Mercury’s eccentric 88-day orbit,
the solar constant varies from 4.7 ESC (planet aphelion is
0.46 AU) to 11.1 ESC (planet perihelion is 0.30 AU),
where ESC is the Earth solar constant. Mercury has a high
surface emissivity (~0.93, varying slightly with location),
rotates very slowly (once every 59 days), and has virtually
no atmosphere, causing planet surface temperatures to be
very hot on the sunlit side of the planet (up to 451°C at the
subsolar point near perihelion) and very cold on the dark
side of the planet (–163°C). The temperature distribution
on the surface of Mercury at perihelion is shown in Figure
1. The surface temperatures drop off rapidly near the
terminator, from 335°C at 60° angular distance from the
subsolar point to –163°C on the nightside of the planet.
The orbital geometry for the primary mission (a
duration of one Earth year) was chosen via comprehensive
thermal analysis6 to minimize the effects of the highly
varying thermal environment around Mercury. The
spacecraft was injected into a dawn–dusk orbit when
Mercury was near perihelion, which puts thermally challenging noon–midnight orbits around Mercury true anomaly
(MTA) 100° and 280°, the peaks of the two hot seasons that MESSENGER experienced each Mercury year. The
orbit plane was relatively
inertial with respect to the
Sun (unlike a spacecraft in
Earth orbit, due in a large
part to oblateness of the
Earth), so the timing of the
hot seasons did not change
much for each Mercury
year. The initial orbit
geometry was 200 15,200
km altitude with a period of
12 hours, and orbit-
correction maneuvers
(OCMs) were periodically
performed to readjust the
orbit (including a major
adjustment to the orbital
period to 8 hours). The
spacecraft periapsis altitude
versus orbit number is shown in Figure 2. The OCMs during this time are indicated on the chart and generally
occurred at Mercury aphelion or perihelion. The last six OCMs were part of the hover campaign, in which gaseous
helium was used as a means of propulsion, in addition to the remaining hydrazine.
Although MESSENGER’s orbit plane was relatively inertial with respect to the Sun, over the course of the
mission the orbital line of apsides rotated around Mercury (because of gravitational forces from Mercury and the
T
Figure 1. Mercury surface temperature
distribution at perihelion.
Figure 2. Spacecraft periapsis altitude as a function of orbit number.
OCM 13 through 18
International Conference on Environmental Systems
3
Sun), changing the location of the orbit periapsis relative to the subsolar point (Figure 3). The latitude of periapsis
progressed northward from 60°N at MOI to 84°N in 2013 and thereafter southward to 55.7°N at the end of the
mission. This drift caused the first hot season (sometimes referred to as low-MTA or outbound season) in each
Mercury year to gradually become hotter, because periapsis moved northward and eventually switched to the
dayside of the planet during this season, and the second hot season (high-MTA or inbound season) to become less
hot. The planetary infrared (IR) heating of the +Y face of the spacecraft (a side mostly insensitive to specific
spacecraft maneuvers because the spacecraft is limited to rotations about its Y-axis, with minor exceptions) for
Mercury years 3, 10, and 17 is shown in Figure 4. The heating increased with time in the first season, and decreased
in the second, as indicated by the arrows on the figure. The orbit average heating values increased slightly with
successive Mercury years because of the decrease in orbit period and general lowering of the periapsis altitude.
Figure 3. Progression of the latitude of periapsis and inertial orientation of the MESSENGER orbit plane.
Figure 4. Planetary IR heating of the +Y face of the spacecraft for Mercury years 3, 10, and 17. The heating
shown for each orbit includes the peak (in red) and the orbit average (green) values.
International Conference on Environmental Systems
4
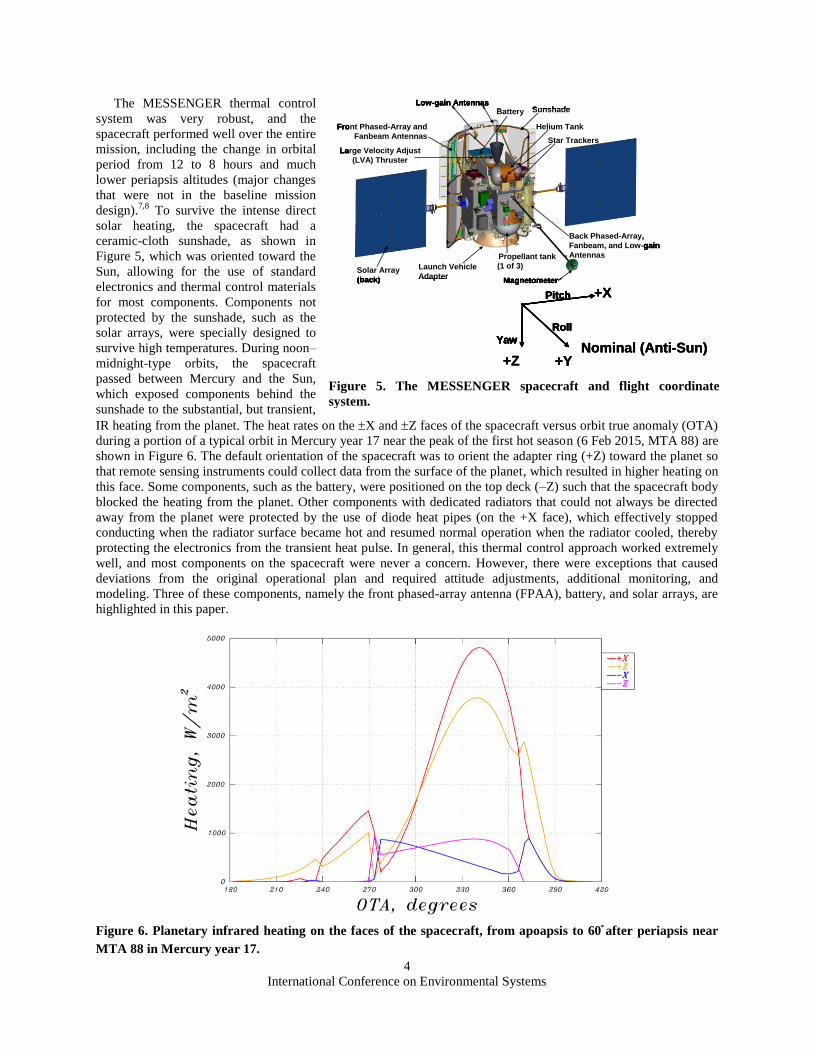
The MESSENGER thermal control
system was very robust, and the
spacecraft performed well over the entire
mission, including the change in orbital
period from 12 to 8 hours and much
lower periapsis altitudes (major changes
that were not in the baseline mission
design).7,8
To survive the intense direct
solar heating, the spacecraft had a
ceramic-cloth sunshade, as shown in
Figure 5, which was oriented toward the
Sun, allowing for the use of standard
electronics and thermal control materials
for most components. Components not
protected by the sunshade, such as the
solar arrays, were specially designed to
survive high temperatures. During noon–
midnight-type orbits, the spacecraft
passed between Mercury and the Sun,
which exposed components behind the
sunshade to the substantial, but transient,
IR heating from the planet. The heat rates on the X and Z faces of the spacecraft versus orbit true anomaly (OTA)
during a portion of a typical orbit in Mercury year 17 near the peak of the first hot season (6 Feb 2015, MTA 88) are
shown in Figure 6. The default orientation of the spacecraft was to orient the adapter ring (+Z) toward the planet so
that remote sensing instruments could collect data from the surface of the planet, which resulted in higher heating on
this face. Some components, such as the battery, were positioned on the top deck (–Z) such that the spacecraft body
blocked the heating from the planet. Other components with dedicated radiators that could not always be directed
away from the planet were protected by the use of diode heat pipes (on the +X face), which effectively stopped
conducting when the radiator surface became hot and resumed normal operation when the radiator cooled, thereby
protecting the electronics from the transient heat pulse. In general, this thermal control approach worked extremely
well, and most components on the spacecraft were never a concern. However, there were exceptions that caused
deviations from the original operational plan and required attitude adjustments, additional monitoring, and
modeling. Three of these components, namely the front phased-array antenna (FPAA), battery, and solar arrays, are
highlighted in this paper.
Figure 6. Planetary infrared heating on the faces of the spacecraft, from apoapsis to 60˚after periapsis near
MTA 88 in Mercury year 17.
Magnetometer
Propellant tank
(1 of 3)Launch Vehicle
AdapterSolar Array
(back)
Front Phased-Array and
Fanbeam Antennas
Low-gain AntennasBattery Sunshade
Large Velocity Adjust
(LVA) Thruster
Helium Tank
Star Trackers
Back Phased-Array,
Fanbeam, and Low-gain
Antennas
Magnetometer
Propellant tank
(1 of 3)Launch Vehicle
AdapterSolar Array
(back)
Front Phased-Array and
Fanbeam Antennas
Low-gain AntennasBattery Sunshade
Large Velocity Adjust
(LVA) Thruster
Helium Tank
Star Trackers
Back Phased-Array,
Fanbeam, and Low-gain
Antennas
+Y
+XPitch
Roll
Yaw
+Z
Pitch
Nominal (Anti-Sun)
Roll
Yaw
Magnetometer
Propellant tank
(1 of 3)Launch Vehicle
AdapterSolar Array
(back)
Front Phased-Array and
Fanbeam Antennas
Low-gain AntennasBattery Sunshade
Large Velocity Adjust
(LVA) Thruster
Helium Tank
Star Trackers
Back Phased-Array,
Fanbeam, and Low-gain
Antennas
Magnetometer
Propellant tank
(1 of 3)Launch Vehicle
AdapterSolar Array
(back)
Front Phased-Array and
Fanbeam Antennas
Low-gain AntennasBattery Sunshade
Large Velocity Adjust
(LVA) Thruster
Helium Tank
Star Trackers
Back Phased-Array,
Fanbeam, and Low-gain
Antennas
+Y
+XPitch
Roll
Yaw
+Z
Pitch
Nominal (Anti-Sun)
Roll
Yaw
+Y
+XPitch
Roll
Yaw
+Z
Pitch
Nominal (Anti-Sun)
Roll
Yaw
Figure 5. The MESSENGER spacecraft and flight coordinate
system.
International Conference on Environmental Systems
5
II. Telemetry Processing
MESSENGER thermal telemetry was processed, mainly with MATLAB and shell scripts, on Linux servers
several times a day by using cron (a time-based job scheduler). This approach is powerful yet flexible, allowing for
such features as extraction of thermal telemetry from any time period over the entire mission within seconds,
automated detection and notification of any anomalous thermal telemetry, and autonomous creation of daily
temperature and heating plots that showed the current data against the backdrop of previous Mercury seasons. It is
important to note that experience gained from the daily monitoring process led to an increased understanding of the
spacecraft and a positive impact on its operations and science return.
Starting at MOI, temperatures from housekeeping telemetry were logged in spreadsheets, organized by orbit and
Mercury year. Raw temperatures per orbit were automatically generated by the telemetry processing scripts, which
were then placed onto a spreadsheet that was published to a network shared area for accessibility by members of the
MESSENGER operations team. The spreadsheet itself contains temperatures summarized per orbit for each Mercury
year as well as some tools to plot data versus time, MTA, or OTA.
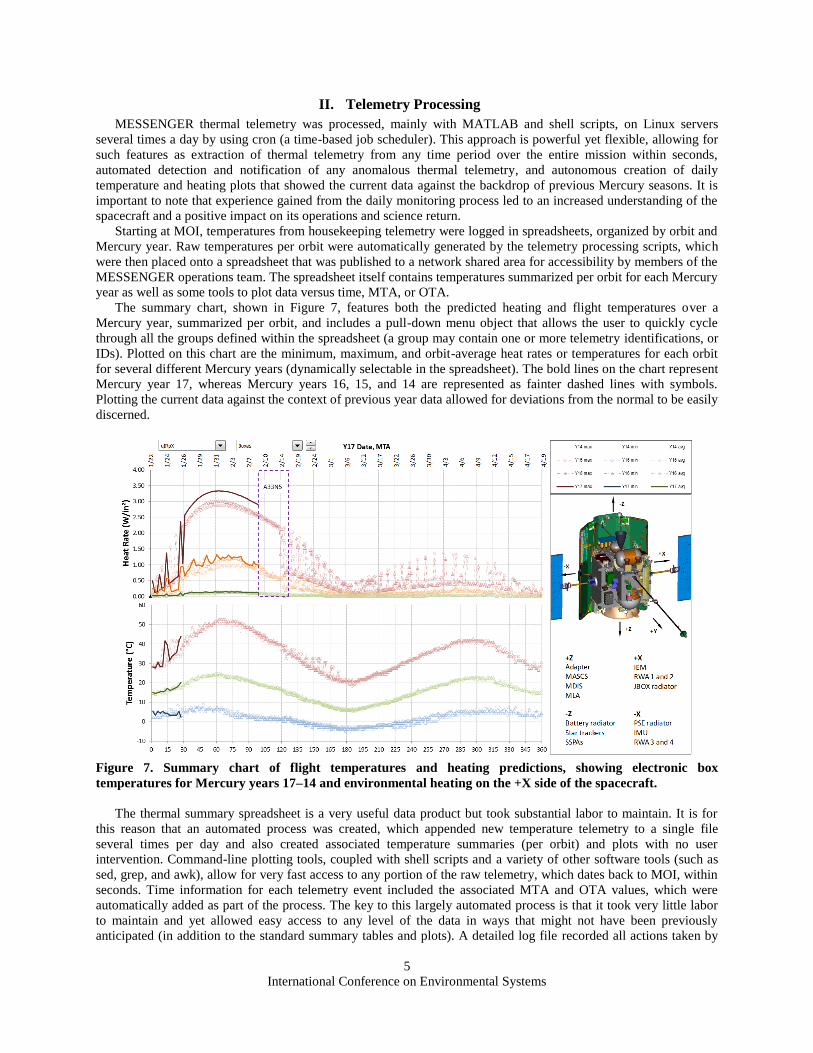
The summary chart, shown in Figure 7, features both the predicted heating and flight temperatures over a
Mercury year, summarized per orbit, and includes a pull-down menu object that allows the user to quickly cycle
through all the groups defined within the spreadsheet (a group may contain one or more telemetry identifications, or
IDs). Plotted on this chart are the minimum, maximum, and orbit-average heat rates or temperatures for each orbit
for several different Mercury years (dynamically selectable in the spreadsheet). The bold lines on the chart represent
Mercury year 17, whereas Mercury years 16, 15, and 14 are represented as fainter dashed lines with symbols.
Plotting the current data against the context of previous year data allowed for deviations from the normal to be easily
discerned.
Figure 7. Summary chart of flight temperatures and heating predictions, showing electronic box
temperatures for Mercury years 17–14 and environmental heating on the +X side of the spacecraft.
The thermal summary spreadsheet is a very useful data product but took substantial labor to maintain. It is for
this reason that an automated process was created, which appended new temperature telemetry to a single file
several times per day and also created associated temperature summaries (per orbit) and plots with no user
intervention. Command-line plotting tools, coupled with shell scripts and a variety of other software tools (such as
sed, grep, and awk), allow for very fast access to any portion of the raw telemetry, which dates back to MOI, within
seconds. Time information for each telemetry event included the associated MTA and OTA values, which were
automatically added as part of the process. The key to this largely automated process is that it took very little labor
to maintain and yet allowed easy access to any level of the data in ways that might not have been previously
anticipated (in addition to the standard summary tables and plots). A detailed log file recorded all actions taken by
International Conference on Environmental Systems
6
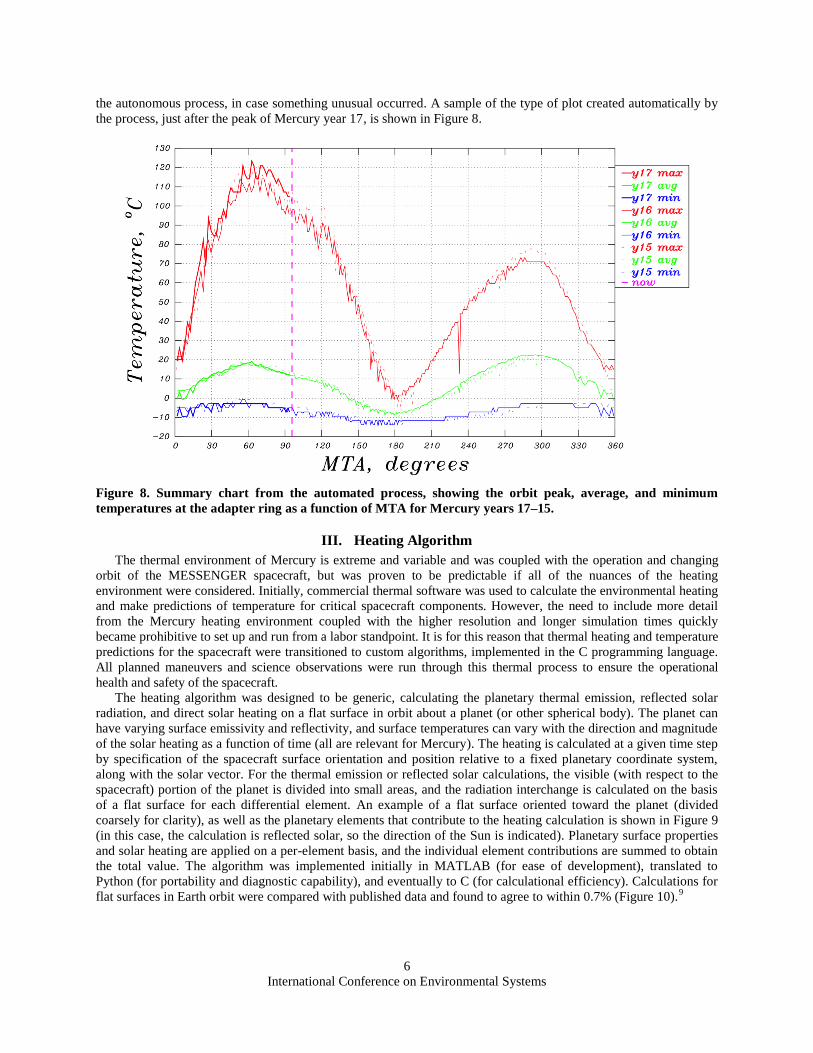
the autonomous process, in case something unusual occurred. A sample of the type of plot created automatically by
the process, just after the peak of Mercury year 17, is shown in Figure 8.
Figure 8. Summary chart from the automated process, showing the orbit peak, average, and minimum
temperatures at the adapter ring as a function of MTA for Mercury years 17–15.
III. Heating Algorithm
The thermal environment of Mercury is extreme and variable and was coupled with the operation and changing
orbit of the MESSENGER spacecraft, but was proven to be predictable if all of the nuances of the heating
environment were considered. Initially, commercial thermal software was used to calculate the environmental heating
and make predictions of temperature for critical spacecraft components. However, the need to include more detail
from the Mercury heating environment coupled with the higher resolution and longer simulation times quickly
became prohibitive to set up and run from a labor standpoint. It is for this reason that thermal heating and temperature
predictions for the spacecraft were transitioned to custom algorithms, implemented in the C programming language.
All planned maneuvers and science observations were run through this thermal process to ensure the operational
health and safety of the spacecraft.
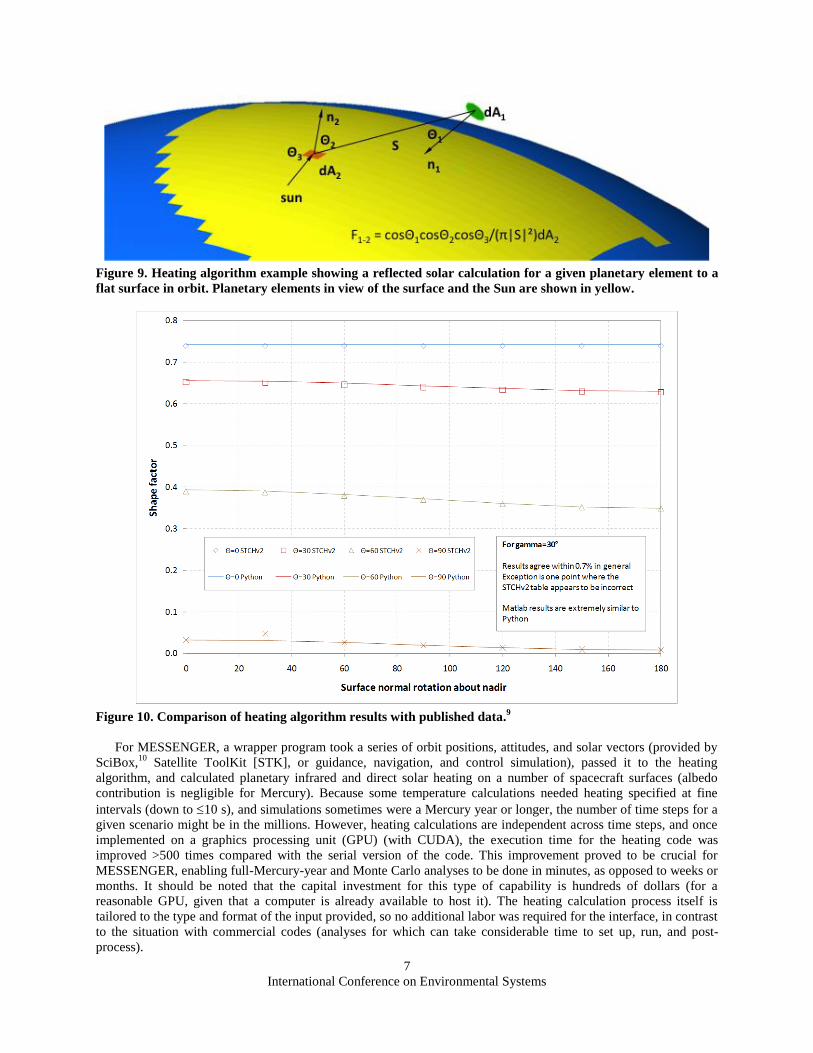
The heating algorithm was designed to be generic, calculating the planetary thermal emission, reflected solar
radiation, and direct solar heating on a flat surface in orbit about a planet (or other spherical body). The planet can
have varying surface emissivity and reflectivity, and surface temperatures can vary with the direction and magnitude
of the solar heating as a function of time (all are relevant for Mercury). The heating is calculated at a given time step
by specification of the spacecraft surface orientation and position relative to a fixed planetary coordinate system,
along with the solar vector. For the thermal emission or reflected solar calculations, the visible (with respect to the
spacecraft) portion of the planet is divided into small areas, and the radiation interchange is calculated on the basis
of a flat surface for each differential element. An example of a flat surface oriented toward the planet (divided
coarsely for clarity), as well as the planetary elements that contribute to the heating calculation is shown in Figure 9
(in this case, the calculation is reflected solar, so the direction of the Sun is indicated). Planetary surface properties
and solar heating are applied on a per-element basis, and the individual element contributions are summed to obtain
the total value. The algorithm was implemented initially in MATLAB (for ease of development), translated to
Python (for portability and diagnostic capability), and eventually to C (for calculational efficiency). Calculations for
flat surfaces in Earth orbit were compared with published data and found to agree to within 0.7% (Figure 10).9
International Conference on Environmental Systems
7
Figure 9. Heating algorithm example showing a reflected solar calculation for a given planetary element to a
flat surface in orbit. Planetary elements in view of the surface and the Sun are shown in yellow.
Figure 10. Comparison of heating algorithm results with published data.9
For MESSENGER, a wrapper program took a series of orbit positions, attitudes, and solar vectors (provided by
SciBox,10
Satellite ToolKit [STK], or guidance, navigation, and control simulation), passed it to the heating
algorithm, and calculated planetary infrared and direct solar heating on a number of spacecraft surfaces (albedo
contribution is negligible for Mercury). Because some temperature calculations needed heating specified at fine
intervals (down to 10 s), and simulations sometimes were a Mercury year or longer, the number of time steps for a
given scenario might be in the millions. However, heating calculations are independent across time steps, and once
implemented on a graphics processing unit (GPU) (with CUDA), the execution time for the heating code was
improved >500 times compared with the serial version of the code. This improvement proved to be crucial for
MESSENGER, enabling full-Mercury-year and Monte Carlo analyses to be done in minutes, as opposed to weeks or
months. It should be noted that the capital investment for this type of capability is hundreds of dollars (for a
reasonable GPU, given that a computer is already available to host it). The heating calculation process itself is
tailored to the type and format of the input provided, so no additional labor was required for the interface, in contrast
to the situation with commercial codes (analyses for which can take considerable time to set up, run, and post-
process).
International Conference on Environmental Systems
8
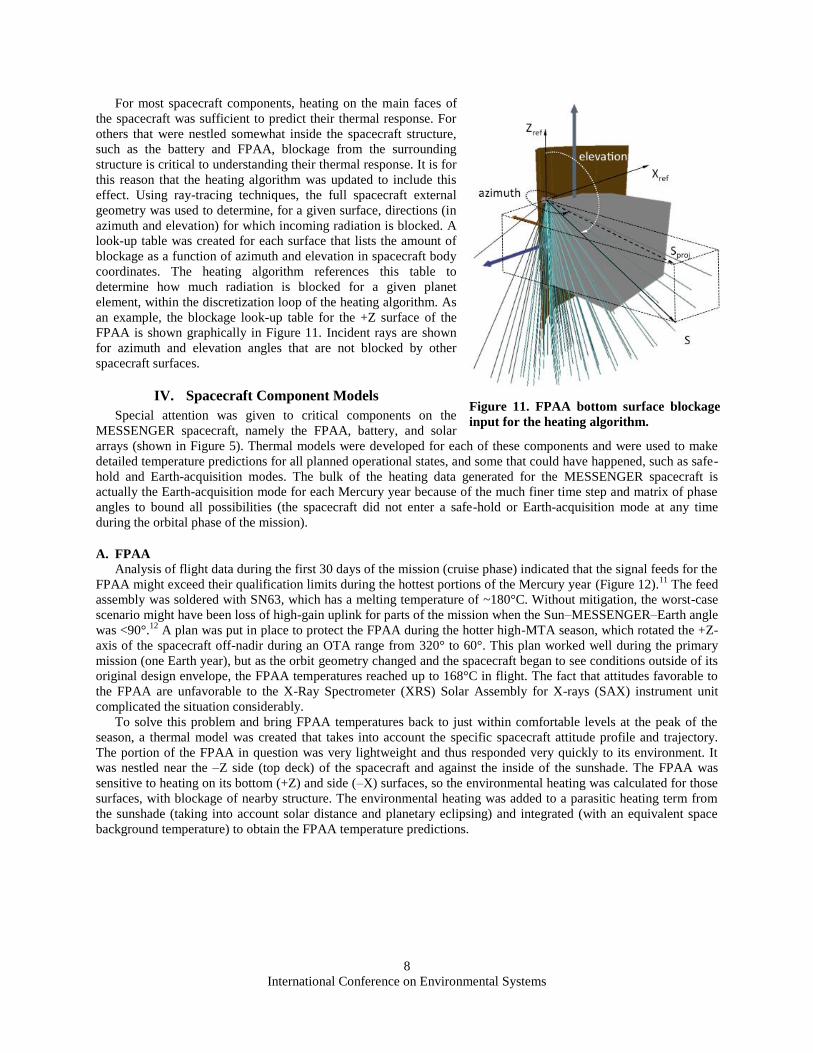
For most spacecraft components, heating on the main faces of
the spacecraft was sufficient to predict their thermal response. For
others that were nestled somewhat inside the spacecraft structure,
such as the battery and FPAA, blockage from the surrounding
structure is critical to understanding their thermal response. It is for
this reason that the heating algorithm was updated to include this
effect. Using ray-tracing techniques, the full spacecraft external
geometry was used to determine, for a given surface, directions (in
azimuth and elevation) for which incoming radiation is blocked. A
look-up table was created for each surface that lists the amount of
blockage as a function of azimuth and elevation in spacecraft body
coordinates. The heating algorithm references this table to
determine how much radiation is blocked for a given planet
element, within the discretization loop of the heating algorithm. As
an example, the blockage look-up table for the +Z surface of the
FPAA is shown graphically in Figure 11. Incident rays are shown
for azimuth and elevation angles that are not blocked by other
spacecraft surfaces.
IV. Spacecraft Component Models
Special attention was given to critical components on the
MESSENGER spacecraft, namely the FPAA, battery, and solar
arrays (shown in Figure 5). Thermal models were developed for each of these components and were used to make
detailed temperature predictions for all planned operational states, and some that could have happened, such as safe-
hold and Earth-acquisition modes. The bulk of the heating data generated for the MESSENGER spacecraft is
actually the Earth-acquisition mode for each Mercury year because of the much finer time step and matrix of phase
angles to bound all possibilities (the spacecraft did not enter a safe-hold or Earth-acquisition mode at any time
during the orbital phase of the mission).
A. FPAA
Analysis of flight data during the first 30 days of the mission (cruise phase) indicated that the signal feeds for the
FPAA might exceed their qualification limits during the hottest portions of the Mercury year (Figure 12).11
The feed
assembly was soldered with SN63, which has a melting temperature of ~180°C. Without mitigation, the worst-case
scenario might have been loss of high-gain uplink for parts of the mission when the Sun–MESSENGER–Earth angle
was <90°.12
A plan was put in place to protect the FPAA during the hotter high-MTA season, which rotated the +Z-
axis of the spacecraft off-nadir during an OTA range from 320° to 60°. This plan worked well during the primary
mission (one Earth year), but as the orbit geometry changed and the spacecraft began to see conditions outside of its
original design envelope, the FPAA temperatures reached up to 168°C in flight. The fact that attitudes favorable to
the FPAA are unfavorable to the X-Ray Spectrometer (XRS) Solar Assembly for X-rays (SAX) instrument unit
complicated the situation considerably.
To solve this problem and bring FPAA temperatures back to just within comfortable levels at the peak of the
season, a thermal model was created that takes into account the specific spacecraft attitude profile and trajectory.
The portion of the FPAA in question was very lightweight and thus responded very quickly to its environment. It
was nestled near the –Z side (top deck) of the spacecraft and against the inside of the sunshade. The FPAA was
sensitive to heating on its bottom (+Z) and side (–X) surfaces, so the environmental heating was calculated for those
surfaces, with blockage of nearby structure. The environmental heating was added to a parasitic heating term from
the sunshade (taking into account solar distance and planetary eclipsing) and integrated (with an equivalent space
background temperature) to obtain the FPAA temperature predictions.
Figure 11. FPAA bottom surface blockage
input for the heating algorithm.
International Conference on Environmental Systems
9
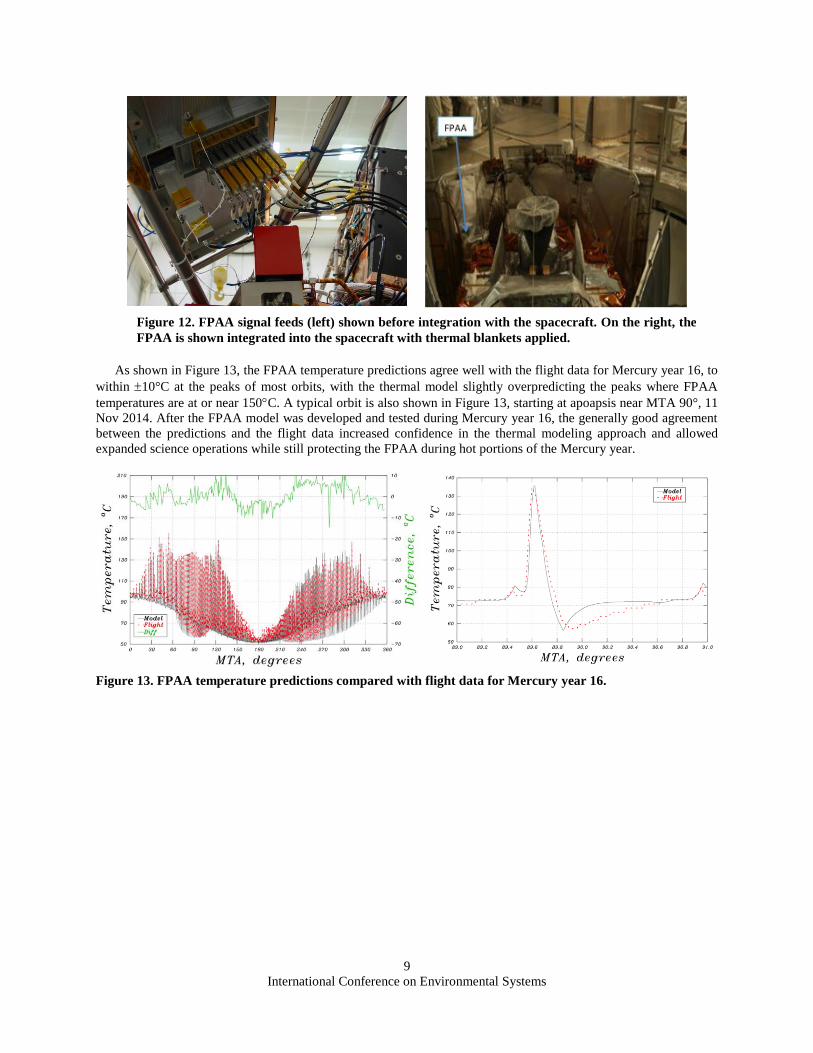
As shown in Figure 13, the FPAA temperature predictions agree well with the flight data for Mercury year 16, to
within 10°C at the peaks of most orbits, with the thermal model slightly overpredicting the peaks where FPAA
temperatures are at or near 150C. A typical orbit is also shown in Figure 13, starting at apoapsis near MTA 90°, 11
Nov 2014. After the FPAA model was developed and tested during Mercury year 16, the generally good agreement
between the predictions and the flight data increased confidence in the thermal modeling approach and allowed
expanded science operations while still protecting the FPAA during hot portions of the Mercury year.
Figure 13. FPAA temperature predictions compared with flight data for Mercury year 16.
Figure 12. FPAA signal feeds (left) shown before integration with the spacecraft. On the right, the
FPAA is shown integrated into the spacecraft with thermal blankets applied.
International Conference on Environmental Systems
10
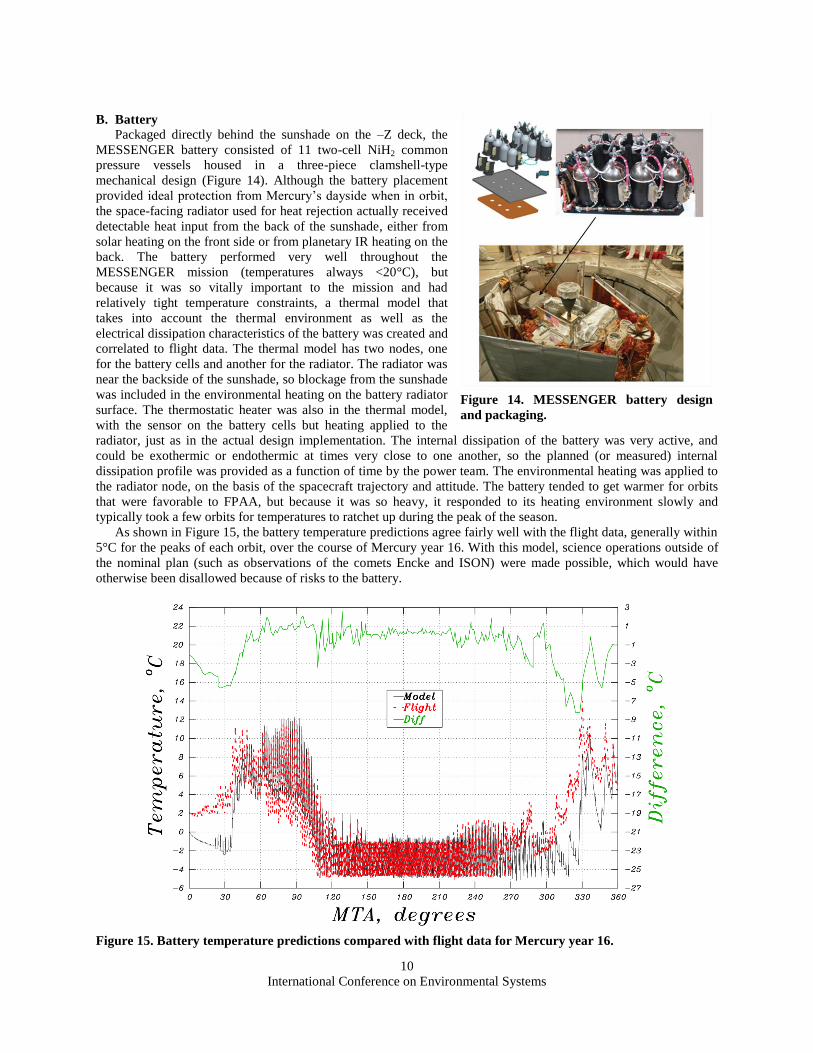
B. Battery
Packaged directly behind the sunshade on the –Z deck, the
MESSENGER battery consisted of 11 two-cell NiH2 common
pressure vessels housed in a three-piece clamshell-type
mechanical design (Figure 14). Although the battery placement
provided ideal protection from Mercury’s dayside when in orbit,
the space-facing radiator used for heat rejection actually received
detectable heat input from the back of the sunshade, either from
solar heating on the front side or from planetary IR heating on the
back. The battery performed very well throughout the
MESSENGER mission (temperatures always <20°C), but
because it was so vitally important to the mission and had
relatively tight temperature constraints, a thermal model that
takes into account the thermal environment as well as the
electrical dissipation characteristics of the battery was created and
correlated to flight data. The thermal model has two nodes, one
for the battery cells and another for the radiator. The radiator was
near the backside of the sunshade, so blockage from the sunshade
was included in the environmental heating on the battery radiator
surface. The thermostatic heater was also in the thermal model,
with the sensor on the battery cells but heating applied to the
radiator, just as in the actual design implementation. The internal dissipation of the battery was very active, and
could be exothermic or endothermic at times very close to one another, so the planned (or measured) internal
dissipation profile was provided as a function of time by the power team. The environmental heating was applied to
the radiator node, on the basis of the spacecraft trajectory and attitude. The battery tended to get warmer for orbits
that were favorable to FPAA, but because it was so heavy, it responded to its heating environment slowly and
typically took a few orbits for temperatures to ratchet up during the peak of the season.
As shown in Figure 15, the battery temperature predictions agree fairly well with the flight data, generally within
5°C for the peaks of each orbit, over the course of Mercury year 16. With this model, science operations outside of
the nominal plan (such as observations of the comets Encke and ISON) were made possible, which would have
otherwise been disallowed because of risks to the battery.
Figure 15. Battery temperature predictions compared with flight data for Mercury year 16.
Figure 14. MESSENGER battery design
and packaging.
International Conference on Environmental Systems
11
C. Solar Arrays
The solar arrays each had a 2:1 ratio of optical solar
reflectors to triple-junction gallium-arsenide solar cells,13,14
as shown in Figure 16, and were managed throughout the
Mercury year by pointing them off the Sun by a prescribed
amount that increased with higher direct solar heating
(because of the eccentric orbit of Mercury). The solar arrays
also received planetary IR heating, potentially on both sides,
near periapsis, and during the peak of the hotter seasons the
solar arrays were commanded to point far off the Sun for a
short time to mitigate this transient heat pulse. In later
Mercury years, an additional mode was added during which
the solar arrays were pointed more off the Sun than normal
operations for ~1 hour before orbital peak heating (but not so
far as a full offset) in order to pre-cool the arrays. The solar-
array commanding was augmented with specific MTA and
OTA ranges to off-point the array, and by how much, for
every Mercury year (which changed every Mercury year).
A solar-array thermal model was created to help plan the
operation of the solar-array off-pointing. The model consists
of a flat plate, with environmental heating calculated on both
sides, rotated about the spacecraft X-axis to the prescribed Sun offset for a given time step. The model can be run in
an adaptive mode, where the software attempts to find just-in-time offset values that keep the solar-array
temperatures within the specified temperature limit. This procedure helps to define the MTA, OTA, and offset
values that should be used for a given thermal season, spacecraft trajectory, and attitude plan. All the points in time
for Mercury year 16 where some offset was required to keep the arrays within limit is shown in Figure 17, plotted as
OTA versus MTA values. The corresponding Sun offset values as a function of MTA, indicating the severity of the
Sun offsets that were required for Mercury year 16, are shown in Figure 18. Once potential limits were defined, the
model was run again but in a scripted mode during which the proposed offset profile is implemented and resulting
solar-array temperatures are calculated.
This model allowed for thermal protection of the solar arrays as they experienced the changing solar loads during
the Mercury year, as well as the highly transient heat pulses from the planet. As shown in Figure 19, the temperature
predictions for Mercury year 16 are within 20°C of the flight data. The precise timing of the solar-array off-
Figure 16. The MESSENGER +X solar array
before spacecraft integration.
Figure 17. Times versus MTA and OTA when solar
arrays are required to point off the Sun more than
seasonal amounts during Mercury year 16.
Precooling times are indicated in orange, and full-
offset times are indicated in red. Note that no full-
offsets are required during the high-MTA season.
Figure 18. Solar array Sun offset values versus
MTA for Mercury year 16. The seasonal offset
varies as a function of MTA throughout the
Mercury year, and full offsets were needed to
mitigate heating from the planet during the
first season.
International Conference on Environmental Systems
12
pointing kept the arrays at or below their prescribed temperature limits while maximizing power generation and
overall life.
Figure 19. Solar-array temperature predictions compared with flight data for Mercury year 16.
V. End-of-Mission Predictions
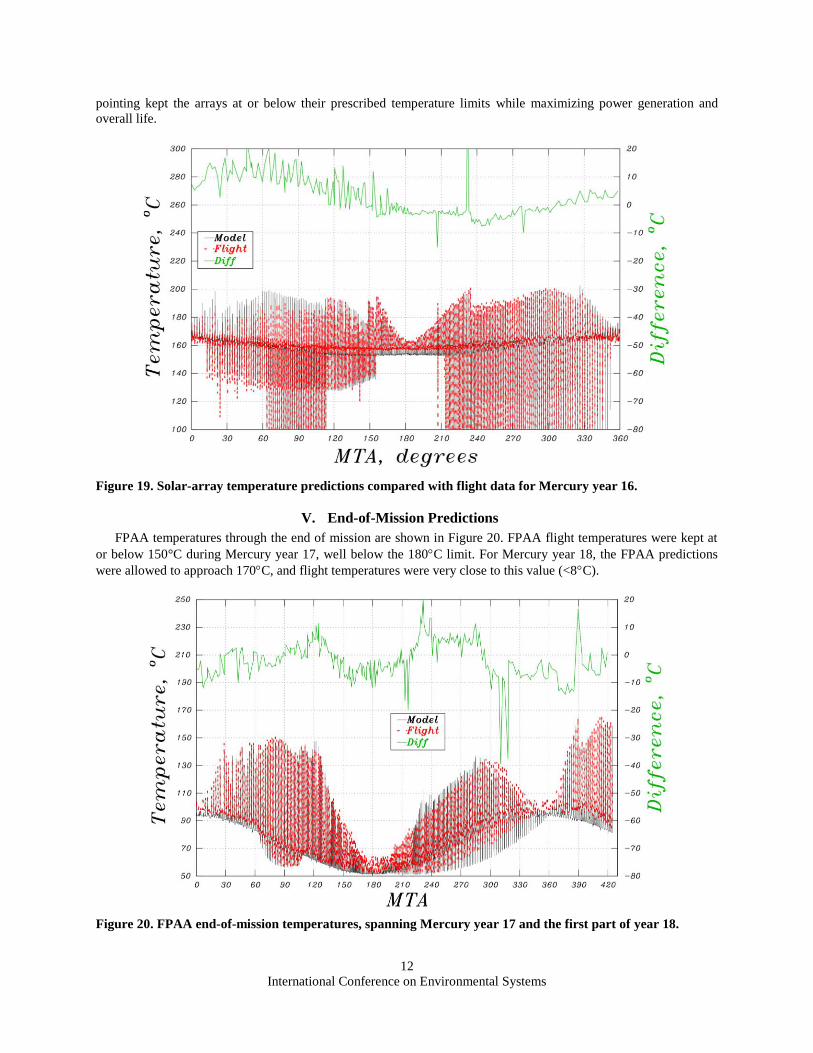
FPAA temperatures through the end of mission are shown in Figure 20. FPAA flight temperatures were kept at
or below 150°C during Mercury year 17, well below the 180C limit. For Mercury year 18, the FPAA predictions
were allowed to approach 170C, and flight temperatures were very close to this value (<8C).
Figure 20. FPAA end-of-mission temperatures, spanning Mercury year 17 and the first part of year 18.
International Conference on Environmental Systems
13
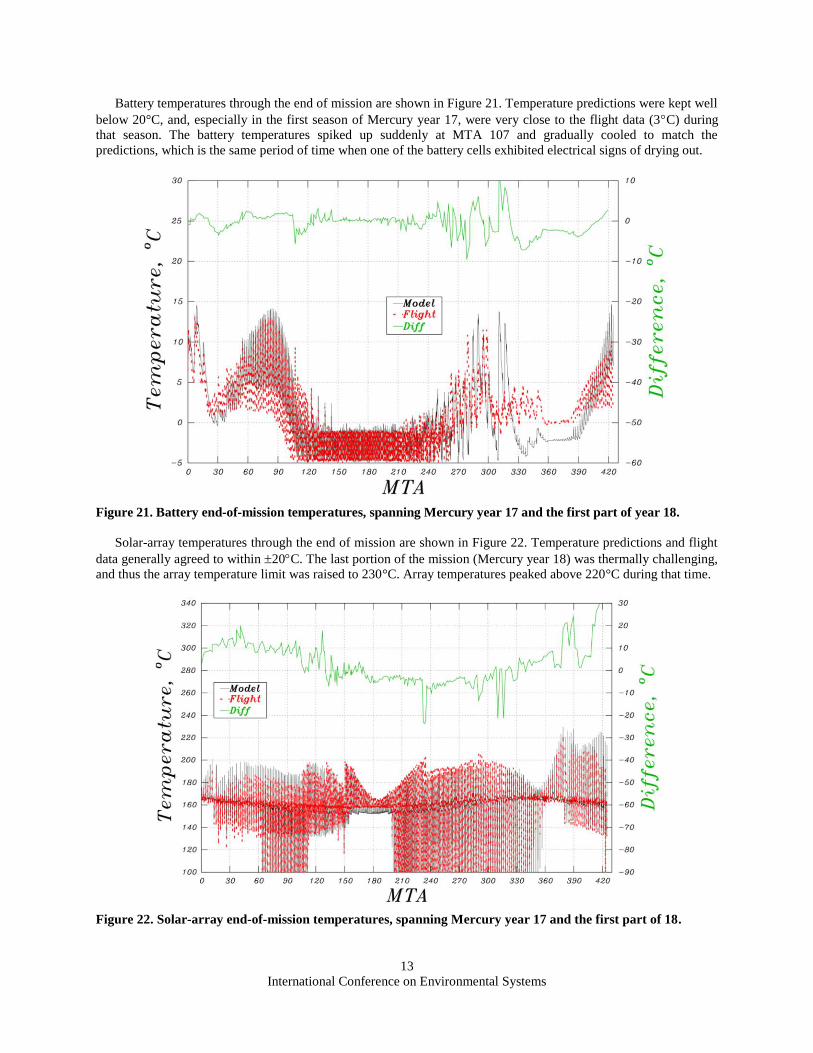
Battery temperatures through the end of mission are shown in Figure 21. Temperature predictions were kept well
below 20°C, and, especially in the first season of Mercury year 17, were very close to the flight data (3C) during
that season. The battery temperatures spiked up suddenly at MTA 107 and gradually cooled to match the
predictions, which is the same period of time when one of the battery cells exhibited electrical signs of drying out.
Figure 21. Battery end-of-mission temperatures, spanning Mercury year 17 and the first part of year 18.
Solar-array temperatures through the end of mission are shown in Figure 22. Temperature predictions and flight
data generally agreed to within 20C. The last portion of the mission (Mercury year 18) was thermally challenging,
and thus the array temperature limit was raised to 230°C. Array temperatures peaked above 220°C during that time.
Figure 22. Solar-array end-of-mission temperatures, spanning Mercury year 17 and the first part of 18.
International Conference on Environmental Systems
14
VI. Conclusion
Enhanced thermal support of the MESSENGER spacecraft has allowed the operations team to optimize planned
spacecraft maneuvers for maximized science return while mitigating thermal risks to the spacecraft and its
instruments. The thermal environment of Mercury is extreme and for the MESSENGER mission was highly coupled
with the operation of the spacecraft, but the thermal design of the spacecraft was robust and continued to yield
nominal results throughout the mission. In addition, the argument of periapsis for the MESSENGER orbit continued
to change, altering the thermal aspects of each Mercury year. This dynamic thermal situation required constant
vigilance on the part of the thermal team but also created the opportunity to tie in thermal predictions of the
spacecraft with the operational plan to enhance the scientific return from the mission.
Acknowledgments
The MESSENGER mission is supported by the NASA Discovery Program under contracts to the Carnegie
Institution of Washington and The Johns Hopkins University Applied Physics Laboratory. The authors acknowledge
Sean Solomon, the MESSENGER Principal Investigator at Lamont-Doherty Earth Observatory of Columbia
University, and Helene Winters, the MESSENGER spacecraft Project Manager at The Johns Hopkins University
Applied Physics Laboratory, for their support in the preparation and presentation of this paper.
References 1Ercol, C. J., Begley, S. M., and Holtzman, G. A., “Return to Mercury: An Overview of the MESSENGER Spacecraft
Thermal Control System Design and Up-to-Date On-Orbit Flight Performance,” Thermal and Fluids Analysis Workshop, paper
TFAWS2012-PT-03, 26 pp., Pasadena, CA, 13–17 August 2012. 2Ercol, C. J., “The MESSENGER Spacecraft Power System: Thermal Performance through Mercury Flyby 3,” 8th Annual
International Energy Conversion Engineering Conference, paper AIAA-2010-6848, 16 pp., Nashville, TN, 25–28 July 2010. 3Ercol, C. J., et al., “Power Subsystem Thermal Design and Early Mission Performance,” 4th International Energy
Conversion Engineering Conference and Exhibit, paper AIAA-4144, 14 pp., San Diego, CA, 26–29 June 2006. 4Ercol, C. J., “Return to Mercury: An Overview of the MESSENGER Spacecraft Thermal Control System Design and Up-to-
Date Flight Performance,” SAE Int. J. Aerosp., Vol. 1, No. 1, April 2009, pp. 405–419. 5Ercol, C. J., Dakermanji, G., and Laughery, S. C., “The MESSENGER Spacecraft Power System: Thermal Performance
through the First Mercury Flyby,” 6th Annual International Energy Conversion Engineering Conference, paper AIAA-2008-
5785, 12 pp., Cleveland, OH, 28–30 July 2008. 6Ercol, C. J., and Santo, A. G. “Determination of Optimum Thermal Phase Angles at Mercury Perihelion for an Orbiting
Spacecraft,” 29th International Conference on Environmental Systems, Society of Automotive Engineers, Tech. Paper Ser., paper
1999-01-21123, 10 pp., Denver, CO, 21–25 July 1999. 7Yen, C. L., “Ballistic Mercury Orbiter Mission via Venus and Mercury Gravity Assist,” J. Astronaut. Sci., Vol. 37, 1989, pp.
417–432. 8Santo, A. G., et al., “The MESSENGER Mission to Mercury: Spacecraft and Mission Design,” Planet. Space Sci., Vol. 49,
2001, pp. 1481–1500. 9Gilmore, D. G., Spacecraft Thermal Control Handbook Volume 2: Cryogenics, The Aerospace Corporation Press, El
Segundo, CA, 2002. 10Choo, T. H. et al., “SciBox, an End-to-end Automated Science Planning and Commanding System,” Acta Astronaut., Vol.
93, 2014, 490–496. 11Wallis, R. E., Bruzzi, J. R., and Malouf, P. M., “Testing of the MESSENGER Spacecraft Phased-Array Antenna,” Antenna
Measurement Techniques Association 26th Meeting and Symposium, pp. 331–336, Stone Mountain, GA, October 2004. 12Flanigan, S. H., O’Shaughnessy, D. J., and Finnegan, E. J., “Guidance and Control Challenges to the MESSENGER
Spacecraft in Achieving and Operating from Orbit at Mercury,” 35th Guidance and Control Conference, American Astronautical
Society, paper AAS 12-096, 18 pp., Breckenridge, CO, 3–8 February 2012. 13Wienhold, P. D., and Persons, D. F., “The Development of High-Temperature Composite Solar Array Substrate Panels for
the MESSENGER Spacecraft,” SAMPE J., Vol., 39, No. 6, 2003, pp. 6–17. 14Ercol, C. J., et al., “Prototype Solar Panel Development and Testing for a Mercury Orbiter Spacecraft,” 35th Intersociety
Energy Conversion Engineering Conference, American Institute of Aeronautics and Astronautics, paper AIAA-2000-2881, 11
pp., Las Vegas, NV, 24–28 July 2000. 15Ercol, C. J., “MESSENGER Heritage: High-Temperature Technologies for Spacecraft to the Inner Solar System,”
American Institute of Aeronautics and Astronautics Space 2007 Conference, paper AIAA-2007-6188, 8 pp., Long Beach, CA,
18–20 Sept. 2007. 16Vaughan, R. L., et al., “Return to Mercury: The MESSENGER Spacecraft and Mission,” Institute of Electrical and
Electronics Engineers Aerospace Conference, IEEEAC paper 1562, 15 pp., Big Sky, MT, 4–11 March 2006.