Embed Size (px)
Citation preview

“Florida Transportation Disadvantaged Services: Return on Investment Study” -- March 2008the Marketing Institute -- Florida State University College of Business pg.
Florida Transportation Disadvantaged Programs
Return On Investment Study
prepared by:
Dr. J. Joseph Cronin, [email protected] John R. Kerr Research Chair in MarketingDepartment of Marketing andCo-Directorthe Marketing InstituteThe College of BusinessFlorida State University
with the assistance of:
Jenna Hagerich, MBA StudentThe College of BusinessFlorida State University
Jeff Horton, Directorthe Marketing InstituteThe College of BusinessFlorida State University
Julie Hotaling, Research Associatethe Marketing InstituteThe College of BusinessFlorida State University
821 Academic Way, Suite 222P.O. Box 3061111
Tallahassee, FL 32306-1111(850) 644-2509

“Florida Transportation Disadvantaged Services: Return on Investment Study” -- March 2008the Marketing Institute -- Florida State University College of Business pg.
Table of ContentsExecutive Summary
Introduction
Return on Investment Methodology
Medical Trips
Employment Trips
Education Trips
Nutrition Trips
Life-Sustaining Trips
Statewide Summary
i
1
3
4
7
9
11
13
15
Florida Transportation Disadvantaged Programs
Return On Investment Study

“Florida Transportation Disadvantaged Services: Return on Investment Study” -- March 2008the Marketing Institute -- Florida State University College of Business pg.
Executive SummaryThe “transportation disadvantaged” in the state of Florida are defi ned as those individuals who because of age, disability, or income restraints, do not have access to conventional public transportation options. Even though it was reported that state and local spending on transportation disadvantaged programs totals in the hundreds of millions of dollars, no attempt has been made yet to assess what state or local governments receive for their investment in transportation disadvantaged programs. Thus, the purpose of the current study was to calculate the return generated by funds invested by the state of Florida on transportation disadvantaged programs.
There are fi ve common types of transportation disadvantaged programs. These programs provide state government with both direct and indirect benefi ts. The results of calculating these benefi ts are shown below:
Medical – The primary purpose of medical trips is to provide preventive medical care to the transportation disadvantaged citizens who have no other way of receiving these services. Given that nursing home costs in Florida average approximately $5,000 per month, average hospital stays are approximately $7,900, and adult day care costs range from $25 to $100 a day, the benefi t that results from providing transportation to preventive medical care is substantial based on the state’s ability to avoid funding assisted living costs. Conservative assumptions were used to identify the return on investment, or payback to the State of Florida. Specifi cally, if one percent of the trips funded result in the avoidance of a hospital stay, the payback to the State is 1108%, or about $11.08 for each dollar the State invests in this program. The State will also benefi t from healthier citizens and a reduction in the need to invest in such programs as Medicare/Medicaid to fi ll the need for medical care for these transportation disadvantaged clients.
Employment – The purpose of employment trips is to provide transportation to employment for transportation disadvantaged citizens. It was estimated that these citizens would work about six hours per day at minimum wage ($6.79/hour). The payback to the State, based on this highly conservative estimate, is 571%, or $5.71 for each dollar invested by the State in this program. The State will also benefi t by allowing transportation disadvantaged residents to work outside their homes. Not only does this reduce welfare costs, it also provides income that is spent within the state, thereby providing a direct stream of income to state and local governments through the state’s six percent sales tax and local taxes.
Education – This type of mobility funded by the State of Florida is to provide access to educational and job training programs for transportation disadvantaged citizens. This enables these citizens to become eligible for employment outside of the home. If the
i

“Florida Transportation Disadvantaged Services: Return on Investment Study” -- March 2008the Marketing Institute -- Florida State University College of Business pg.
education/training program requires 30 days (30 trips), the benefi ts accruing to the State were estimated on the basis that the rider would work an equal number of days (30) as the training at minimum wage ($6.79) for six hours daily. However, this most likely underestimates the program benefi ts since those receiving job training are likely to work more than the same number of days as they trained. Thus, the payback to the State using this highly conservative estimate is 585%, or $5.85 per each dollar invested by the State in this program. The State will also benefi t from an improvement in mental and physical health of those transportation disadvantaged citizens participating, as well as a reduction in unemployment benefi ts that are funded by the State.
Nutrition – The purpose of nutrition trips is to provide mobility for transportation disadvantaged citizens to shop for groceries or otherwise satisfy their nutritional needs. Nutrition-related purchases are generally not subject to state sales tax, so to generate a return on investment, it was assumed that 1 out of 100 nutrition trips results in being able to avoid a hospital stay as a direct result of having access to these nutritional trips. Thus, the payback to the State is 1252%, or $12.52 per each dollar invested by the State in this program. The State will also benefi t from increased overall health and well-being for these individuals and a reduction in the need to fund health care programs such as Medicare/Medicaid to assist these individuals.
Life-Sustaining/Other – The purpose of life-sustaining trips is to provide transportation to pay bills and to fulfi ll other shopping needs, such as purchasing clothing, medications, personal services, and other essential goods and services. It was assumed that each trip generates $20 in incremental spending on taxable items. The payback to the State is 462%, or $4.62 per each dollar invested by the State. The State also benefi ts by a reduction in the need to fund assisted living facilities, as this service enables these citizens to live independently. The State also benefi ts from state sales tax collected during these purchases.
Overall, the State of Florida invested $372,264,302 in these transportation disadvantaged programs in 2007. These funds generated benefi ts of $3,172,813,246.31, which is a payback of 835%, or $8.35 per each dollar invested in these programs. Again, these fi gures were generated using extremely conservative estimates, therefore, the return on investment could be substantially higher, especially medical trips since they potentially represent the most cost-effi cient method for diverting more expensive hospital stays. This study has shown that transportation disadvantaged programs are an excellent investment and worthy of continued study and funding.
ii

“Florida Transportation Disadvantaged Services: Return on Investment Study” -- March 2008the Marketing Institute -- Florida State University College of Business pg.
The “transportation disadvantaged” are defi ned as those individuals who because of age, disability, or income restraints do not have access to conventional public transportation options. According to the 2000 U.S. census, the potential size of this group is substantial given that 35.1 million people were reported over the age of 65, 44.5 million were over the age of 21 and disabled, and 33.9 million had incomes below the poverty line.
Many of Florida’s transportation disadvantaged citizens rely on the Commission for Transportation Disadvantaged programs for all of their mobility needs. It is important that these citizens receive cost-effi cient transportation to maintain their independence and quality of life. Although one cannot put a price tag on these benefi ts, it is possible to fi nd some direct and indirect benefi ts to the state government based on their funding to these transportation disadvantaged programs.
1
Florida’s transportation disadvantaged population is expected to grow from an
estimated 6.6 million in 2006 to 8.25 million in 2015 -- a 25% growth rate
and faster than increases in the general population.
Source: Center for Urban Transportation Research
Introduction: Defi ning the Transportation Disadvantaged

“Florida Transportation Disadvantaged Services: Return on Investment Study” -- March 2008the Marketing Institute -- Florida State University College of Business pg.
State and local agencies provide funding for many of the programs identifi ed in the 2006 Federal General Accounting Offi ce report, often with the requirement that 5 to 50 percent of the total cost be from local matching funds. It was specifi cally reported that state and local spending on transportation disadvantaged programs is substantial, probably totaling in the hundreds of millions of dollars.
Unfortunately, no attempt has been made yet to assess what state or local governments receive for their investment in transportation disadvantaged programs. Thus, the purpose of the current study was to calculate the return generated by funds invested by the state of Florida on transportation disadvantaged programs.
One step in the assessment process is identifying the benefi ts that accrue from investments in programs that support the state’s transportation disadvantaged citizens. While it is generally acknowledged that public dollars invested in such programs do not directly “generate” revenues or returns in the traditional sense, there are nevertheless substantial fi nancial benefi ts that accrue to the state from its investment. Specifi cally, these programs benefi t the state of Florida based (1) on the economic activity that is generated as a result of fi ve specifi c activities that are supported and (2) as a result of the state being able to avoid “costs” as a result of the investment. Five specifi c types of transportation services are funded and are commonly categorized based on the purpose served: 1) Medical Related Trips, 2) Employment Trips, 3) Nutrition Trips, 4) Education Related Trips, and (5) Life Sustaining Trips. In the next section, the methodology used to identify the economic benefi ts the State of Florida gains from either the economic activity generated by each type of trip, or the costs that each type of trip enables the state to avoid, is considered.
The fi ve (5) most common trips provided by transportation disadvantaged services are:
1) medical2) employment
3) nutrition4) education
5) life-sustaining
Provision of these services maintains continued and active access and
economic return to Florida.
2

“Florida Transportation Disadvantaged Services: Return on Investment Study” -- March 2008the Marketing Institute -- Florida State University College of Business pg.
To identify the ROI, or payback, generated by investment in a program it is necessary to identify the relevant benefi ts and costs. Whereas the cost to the state of transportation disadvantaged programs is well documented, the benefi ts are less obvious. In the sections below, the relevant benefi ts and costs are identifi ed and discussed. Once each is identifi ed, the calculation of the ROI and Payback from the programs is straightforward.
CostsThe fi rst step in determining the ROI and payback of transportation disadvantaged programs in the state of Florida is to identify the cost of the fi ve types of services identifi ed above. In Florida, these costs can be obtained from state records, as each transportation provider who is a grant recipient through the Commission for Transportation Disadvantaged is required to submit these fi gures annually. Thus, these costs are directly identifi able, and 2007 program costs were provided by the Commission for Transportation Disadvantaged. The cost of each service is identifi ed in the tables attached.
Benefi tsThe benefi ts associated with transportation disadvantaged programs are not provided in state records. They also are not easily identifi able. In the section below, the method used to estimate these benefi ts is identifi ed for each type of trip associated with the state of Florida’s transportation disadvantaged programs.
Once the costs (the money invested) and the benefi ts (the return on the
investment) are known, the “ROI” or Return on Investment and
Payback are easy to calculate.
Figure 1: Calculating Return on Investment
Calculating Return on Investment: The Methodology
3

“Florida Transportation Disadvantaged Services: Return on Investment Study” -- March 2008the Marketing Institute -- Florida State University College of Business pg.
Initially, the benefi ts were identifi ed for each of the fi ve types of transportation disadvantaged programs funded by the State of Florida (i.e., medical, employment, education, nutrition, and life-sustaining/other) in eight Florida counties. These counties were Brevard, Calhoun, Escambia, Flagler,Jefferson, Nassau, St. Lucie, Volusia, and Washington counties. These eight counties were selected to represent a diversity of urban and rural, as well as large and small, Florida transportation disadvantaged program regions. Local program administrators were contacted in order to identify relevant program benefi ts.
In the calculation of the program benefi ts for the state as a whole, mean, median, and weight average estimations were pursued. Because the mean benefi t produced the most conservative estimate of program benefi ts (i.e. the mean benefi t produced a smaller estimate of total program benefi ts), it was used in this report.
However, readers should be advised that the weighted average approach most likely produces a more realistic (and higher) estimate in the return on investment (ROI) for transportation disadvantaged programs. This is because the weighted average approach determines benefi ts and program ROI, based on the relevative size of these programs in each of Florida’s 67 counties. Thus, small programs are not artifi cially over represented in the ROI/payback calculations.
Although o en unknown to the general population, Florida’s TD population and the investments made by the State of Florida in transportation accessibility services generates signifi cant returns.
54

“Florida Transportation Disadvantaged Services: Return on Investment Study” -- March 2008the Marketing Institute -- Florida State University College of Business pg.
55
One of the primary purposes of transportation disadvantaged funding efforts is to support preventative medical care. Preventative medical care trips assist in keeping low income, elderly, and disabled Florida residents out of the hospital and nursing homes. Moreover, the mobility these programs provide allows such individuals to live healthier lives and to maintain their independence. Given that nursing home costs in Florida average approximately $5000 per month, average hospital stays are approximately $7,9001, and adult day care costs range from $25 to $100 per day2 , the benefi t that results from providing transportation disadvantaged Florida residents access to preventive medical care are substantial based on the state’s ability to avoid such costs.
In addition to the benefi ts associated with avoiding nursing home stays, conversations with program coordinators suggest that many of the medical trips supported by transportation disadvantaged programs support health care for pregnant women. It was suggested that when trips are cancelled, or cannot be scheduled due to a lack of funding, these women simply do not receive prenatal care. Given that the goal of prenatal care is to monitor the progress of pregnancies and to identify potential problems before they become serious for either mothers or their children, women who do not receive this care face a substantially increased probability of a problem
1 Source: HCUP Factbook, Agency for Healthcare Research and Quality, “Statistics on Hospital Based Care in the United States, 2005 http://www.hcups.hrq.gov/reports/factsandfi gures/HAR_2005.pdf2 Source: HCUP Fact Book No. 6 - “Hospitalization in the U.S.,” 2002http://www.eldercare.gov/eldercare/Public/resources/fact_sheets/adult_day.asp
Nursing home costs in Florida average approximately $5000/month. Diversion
programs such as those facilitated by TD services throughout the state
help defer those costs, resulting in substantial savings to Florida
taxpayers.
Return on Investment: Medical Trips

“Florida Transportation Disadvantaged Services: Return on Investment Study” -- March 2008the Marketing Institute -- Florida State University College of Business pg. 6
pregnancy or infant health care issues. Specifi cally, these mothers are more likely to deliver prematurely and are more likely to have serious pregnancy-related problems. Moreover, children that do not receive adequate prenatal health care are reported to be “three times more likely to be born at low birth weight . . . than those whose mother received prenatal care.”3 Thus, the preventative care made available by transportation disadvantaged programs benefi ts the state by reducing the expected medical costs of both mothers and their babies. Moreover, healthier babies are more likely to do better in school and are less likely to require additional public support throughout their lives.
Unfortunately, there is no preexisting information to aid in the determination of the economic benefi ts that accrue from making health care available to transportation disadvantaged Florida residents. In order to calculate the benefi ts derived from medical trips funded by transportation disadvantaged programs, several assumptions had to be made. The fi rst factor that had to be estimated was the number of those Florida residents that depended on transportation disadvantaged funded programs for their access to medical care who would otherwise need hospital care if it were not for this program.
For example, there are many transportation disadvantaged clients who rely on these medical trips to receive dialysis treatments at the hospital. Using an extremely conservative estimate that one out of every one hundred trips (i.e. 1%) prevents a one-day stay in a hospital, results in a total benefi t of $1,425,907,024 (number of trips x .1 x average cost of one day hospital stay in Florida), or a return on state funds of 1108% (total statewide program benefi ts divided by total statewide program costs).
3 Source: March of Dimes, “Prenatal Care: Pregnancy and Children”
1108%
$11.08

“Florida Transportation Disadvantaged Services: Return on Investment Study” -- March 2008the Marketing Institute -- Florida State University College of Business pg.
Once more, in order to produce a conservative estimate of the state’s return on their investment, it was assumed that the total program costs were funded by the State of Florida. These benefi ts represent a payback of $11.08 for every dollar invested by the State of Florida in the funding of programs supporting the medical mobility needs of the transportation disadvantaged. See Appendix A for a summary of the medical return on investment for each of Florida’s 67 counties.
Not surprisingly, there are substantial variations between counties and these differences are not reliant on a county’s designation as either urban or rural. For example, Miami-Dade’s return on medical trip investments is $16.82 per $1 invested, far exceeding the statewide estimated return. Columbia County also refl ects an above-the-state return of $13.48 per $1 invested while Hillsborough County’s return is estimated at $8.05.
Once again, it was must be stressed that a conservative estimate of 1% of trips diverting a hospital stay or other catastrophic treatment was used in the calculation of the program ROI. If further studies indicate that the diversion rate is greater, the return is much more signifi cant. In Table 1 below, the calculation is shown for Brevard County using a 10%, 5%, and 1% diversion rate.
Table 1: Medical ROI with Varying Diversion Rates for Brevard County
7
Total trips Use Hospital cost Total Benefi tProgram
Cost ROI Payback
108,514 0.10 $7,900 $85,726,060 $873,779 9811% $98.11
108,514 0.05 $7,900 $42,863,030 $873,779 4905% $49.05
108,514 0.01 $7,900 $8,572,606 $873,779 981% $9.81

“Florida Transportation Disadvantaged Services: Return on Investment Study” -- March 2008the Marketing Institute -- Florida State University College of Business pg. 8
A second purpose of transportation disadvantaged funding efforts in the State of Florida is to support employment opportunities for users. These trips assist in keeping low income, elderly, and disabled Florida residents in the workforce. Moreover, these programs provide individuals access to employment training programs that allow them to enter the workforce.
In order to determine their economic impact, we fi rst identifi ed their cost. For instance, the data in Table 2 indicates 5,601 trips were provided in Calhoun County in 2007 at a cost of $77,537.24. This was an average of 15 trips daily based on the cost per trip Calhoun county provided on their annual report to the Commission for Transportation Disadvantaged. Benefi ts were calculated conservatively using the assumption that each trip allowed an individual to work six hours daily at minimum wage ($6.79). To be even more conservative, we based our estimate of benefi ts on the assumption that only one person was transported on each trip. This results in benefi ts of $228,184.74 (5,601 trips x $40.74), or an ROI on the State’s investment of 294% (based on the program cost of $77,537.24). This represents a payback of $2.94 for every dollar invested.
Return on Investment: Employment Trips
Transportation programs that facilitate access to the labor market yield
substantial direct and indirect benefi ts to society through reduced reliance
on other assistance programs and by increasing the return on taxable
expenditures.
Table 2: Employment ROI for Calhoun County
Program Cost Trips
Benefi t per Trip
Annual Benefi t ROI Payback Tax Benefi t
ROI - Tax
Tax Payback
$77,537.24 5,601 $40.74 $228,184.74 294% $2.94 $11,637.42 15% $0.15

“Florida Transportation Disadvantaged Services: Return on Investment Study” -- March 2008the Marketing Institute -- Florida State University College of Business pg. 9
Additionally, a calculation was performed to determine the tax revenue generated by employment and subsequent expenditures. As such, a tax benefi t of $11,637.42 was identifi ed in Calhoun county. This was calculated by multiplying the money earned from the employment trips ($228,184.74) by the traditional state economic multiplier (1.7)1 and then multiplying by the state sales tax rate (6%) by the assumed portion of the benefi ts spent on taxable items (50%). This resulted in an additional ROI of 15%, or a payback of $0.15. In total, Calhoun County employment trips would generate an ROI of 309%, or a payback of $3.09 for every $1 invested.
This same methodology was used for each of Florida’s 67 counties and these fi gures are displayed in Appendix B. The ROI for the entire state has therefore been calculated at 571% (543% + 28%) or $5.71 per $1 invested.
1 Source: http://www.horsecouncil.org/stateeconomics.html
NOTE: This 571% return on employment trips includes both direct
and indirect returns, refl ecting a return to the State of Florida in sales tax
revenues resulting from purchase of taxable items as a result of employment.
571%
$ 5.71

“Florida Transportation Disadvantaged Services: Return on Investment Study” -- March 2008the Marketing Institute -- Florida State University College of Business pg. 10
Return on Investment: EducationThe objective of the third type of mobility funded by the State of Florida for its transportation disadvantaged citizens is to provide access to educational and training programs. This investment provides access to programs that enhance the employability of participants. Therefore, the indirect benefi ts gained by the State of Florida include a reduction in unemployment benefi ts, as well as savings that accrue as working outside the home improves the mental and physical health of those participating.
To maintain the consistent conservative estimate approach taken in this study, it was assumed that upon completion of the education/training, recipients are able to work six hours daily at minimum wage ($6.79). This places the daily value of each Florida resident able to access education/training programs as a result of the mobility enabled by the funding of transportation disadvantaged programs at $40.74.
To assess the annual benefi t of the investment made in this type of program, it was assumed that each day trip would be balanced by a minimum of one day of work by the individual taking the trip. Thus, if the education or training program requires 30 days (30 trips), the benefi ts accruing to the state were estimated on the basis that the rider would work an equal number of days (30) at minimum wage ($6.79) for six hours ($40.74). Realistically, this most likely underestimates the program benefi ts since those receiving job training are more likely to work more than the same number of days as they trained.
By providing access to job/vocational training, transportation disadvantaged
programs contribute to the long-term economic health of Florida.

“Florida Transportation Disadvantaged Services: Return on Investment Study” -- March 2008the Marketing Institute -- Florida State University College of Business pg. 11
Using Brevard County as an example, the county’s 88,167 trips in 2007 cost $709,940.04 while generating a benefi t to the state of $3,591,923.58. This projects to an ROI on the State’s invested funds of 506 % or a payback of $5.06 for every dollar invested in Brevard county. Based on these wages being spent in the state of Florida, and the conservative multiplier of 1.7 used for other statewide economic impact studies, an additional $183,188.10 is assumed to be generated through sales tax (assumes state tax rate of 6% with 50% of wages being spent on taxable goods and services). This yields an overall ROI for Brevard county of 536%, or a payback of $5.36. Table 3 below summarizes the data for Brevard county. Thus, the overall ROI is 585%, or a payback of $5.85. This summary refl ects $5.57 in direct economic benefi ts and $0.28 in indirect tax benefi ts. A complete summary of the statewide ROI and payback calculations is provided in Appendix C.
Table 3: Education Trip ROI for Brevard County
The wages earned by individuals gaining employment through these job
training/vocational trips result in a $5.86 payback for direct expenditures and a $.16 payback in sales generated
tax revenue.
586%
$ 5.86Trips
Cost per Trip
Program Cost
Benefi ts per Trip
Program Benefi ts ROI Payback Tax Benefi t
Tax ROI
Tax Payback
88,167 $8.05 $709,940.04 $40.74 $3,591,923.58 506% $5.06 $183,188.10 26% $0.26
5585%
$5.85

“Florida Transportation Disadvantaged Services: Return on Investment Study” -- March 2008the Marketing Institute -- Florida State University College of Business pg. 12
Return on Investment: NutritionA fourth purpose of transportation disadvantaged funding efforts in the state of Florida is to enable transportation disadvantaged citizens to satisfy their nutritional needs. These trips benefi t the state as they contribute to the overall health and well-being of the individuals needing this assistance.
These efforts further benefi t the state of Florida by reducing the need for health care assistance. A tax benefi t was not calculated for these trips as their intended purpose is to assist the transportation disadvantaged in securing nutrition-related purchases that generally are not subject to state sales taxes. However, to the extent that other taxable items (e.g. soft drinks, paper goods, etc) are purchased, an additional unintended return on the state’s investment in funding for the program would be realized.
In order to determine the economic impact of these programs, it was assumed that the benefi t of the nutritional trips was the enhancement of the general well-being of the program participants. It was also assumed that each trip transported only one program participant and one trip out of one hundred enabled a program participant to avoid a one-day hospital stay. The ROI and payback realized for this program were calculated as identifi ed in the sample calculation demonstrated in Table 4 below for Escambia County (number of trips x .01 x
Trips that facilitate nutritional benefi t aid all sectors of the transportation
disadvantaged population by reducing the cost associated with future health
care costs.
Table 4: Nutritional Trip ROI for Escambia County
County Trips Cost per tripProgram
CostTotal
Benefi t-1% ROI Payoff
Escambia 507 $10.44 $5,295.61 $40,053.00 756% $7.56

“Florida Transportation Disadvantaged Services: Return on Investment Study” -- March 2008the Marketing Institute -- Florida State University College of Business pg. 13
$7,900 divided by the program cost).
The data for Escambia County indicated that 507 nutritional-related trips were funded in Escambia County during 2007 by the State of Florida at a total cost of $5,295.61. Conservatively assuming only one passenger per trip and that one trip in one hundred (i.e. 1%) resulted in the avoidance of a hospital stay as a result of their enhanced nutrition with an average hospital cost of $7,900, suggests that the benefi t derived is the avoidance of $40,053 in state funded hospital care during that year. This yields an ROI of 756%, or a payback of $7.56 for Escambia county.
Once this methodology is projected across all 67 counties, the mobility to allow the transportation disadvantaged to satisfy their nutritional needs have an ROI of 1252% or a payback of $12.52 for each invested dollar. Calculations for the ROI and payback for nutrition trips in each of Florida’s individual counties can be found in Appendix D.
1252%
$ 12.52

“Florida Transportation Disadvantaged Services: Return on Investment Study” -- March 2008the Marketing Institute -- Florida State University College of Business pg. 14
Return on Investment: Life Sustaining/OtherA fi fth purpose of Transportation Disadvantaged funding efforts in the State of Florida is to enable these individuals to make life-sustaining and other essential trips. Such trips are made to pay bills and to secure every day shopping needs, such as purchasing clothing, medications, personal services and other essential goods and services, that enable transportation disadvantaged Florida residents to live day-to-day.
These trips benefi t the state as they contribute to the overall health and well-being of the individuals needing this assistance. These efforts further benefi t the state of Florida indirectly by reducing the need for health care assistance and assisted living, as such trips also contribute to the independence and quality of life for these citizens. Moreover, the state further benefi ts from taxes collected as a result of the money these Florida residents spend on these shopping trips.
In order to determine the economic impact of these programs, it was assumed that $20 was spent that would not have otherwise been spent or would have been directed out of state through distance purchases (i.e. online, catalog, or telephone purchases), by the individuals making each of the trips.
Conversations with program directors suggested that most trips included taking multiple passengers to malls or other service locations. Thus, the estimated incremental $20 spent on taxable items per trip is conservative. Using this information as well as the program costs, annual direct economic benefi ts (spending by those on these trips) is estimated $163,591,080 (8,179,554 x $20). Applying the conservative estimator of 1.7,
Florida residents who are dependent on transportaton disadvantaged services for conduct of personal business and
shopping is a healthy investment by the State of Florida, resulting in a 460%
return on investment.

“Florida Transportation Disadvantaged Services: Return on Investment Study” -- March 2008the Marketing Institute -- Florida State University College of Business pg. 15
it is estimated that these funds resulted in $278,104,836 being spent on taxable items by Florida residents producing sales tax revenues of $16,686,290.16. Thus, the economic activity generated suggests that State of Florida funds invested in this program produced an ROI of 462% (436% + 26%), or a payback of $4.62 for each dollar invested. Appendix E summarizes this calculation individually for all Florida counties.
Florida residents who utilize transportaton disadvantaged services
are estimated to return $4.62 per $1 invested ($4.36 direct benefi t + $.26 tax
benefi t).
462%
$ 4.62

“Florida Transportation Disadvantaged Services: Return on Investment Study” -- March 2008the Marketing Institute -- Florida State University College of Business pg.
Statewide Summary of Benefi tsThe ROI and payback for each of the fi ve types of transportation disadvantaged programs funded by the State of Florida were calculated on a county-by-county basis. A variety of assumptions is made in calculating the benefi ts generated by these funds so that the overall ROI and payback for the State’s investment in transportation disadvantaged programs could be estimated. As is indicated in the fi gure shown on page 17, in 2007 the State of Florida invested $372,264,302 in these programs (fi gures include both state and local funding). These funds generated benefi ts of $3,172,813,246.31. This equates to an overall Return on Investment of 835% for the funds invested. It is thereby suggested that the state receives $8.35 in benefi ts for every $1 invested in transportation disadvantaged programs.
While using highly conservative estimates for this report, it appears that nutrition trips represent the most effi cient of the state’s transportation disadvantaged programs with an estimated ROI of 1252%, or a payback of $12.52. Medical Trips are the next most effi cient with an estimated ROI of 1108%, or a payback of $11.08. Education trips generated an estimate ROI of 585%, or a payback of $5.85. The estimated ROI for Employment trips is 571%, or a payback of $5.71. Life Sustaining/Other trips represent an ROI of 462% percent, or a payback of $4.62.
Based on these fi gures, it seems fair to conclude that the estimated benefi ts of transportation disadvantaged programs far outweigh their costs. It must be restated that these ROI fi gures are generated using highly conservative assumptions.
835%
$ 8.35
16

“Florida Transportation Disadvantaged Services: Return on Investment Study” -- March 2008the Marketing Institute -- Florida State University College of Business pg. 17
Realistically, the actual ROI would probably be much greater, and more accurate, if they considered the number of clients who actually avoid hospitals, nursing homes, and assisted living facilites by utilizing these transportation disadvantaged programs. Therefore the ROI for medical trips could potentially represent the most cost-effective method for diverting more expensive hospital stays. One can safely conclude that the data presented confi rms that for the State of Florida, Transportation Disadvantaged Programs are an excellent investment and worthy of continued study and funding.
Invested Benefi t ROI Payback
Medical $128,644,086.92 $1,425,907,024.00 1108% $11.08
Employment $51,493,469.64 $293,918,993.63 571% $5.71
Economic $279,656,511.54
Tax $14,262,482.09
Education $75,908,687.79 $444,568,459.05 586% $5.86
Economic $422,995,679.40
Tax $21,572,779.65
Nutrition $50,812,200.65 $636,409,306.00 1252% $12.52
Life Sustaining/Other $63,845,299.62 $294,791,126.16 462% $4.62
Economic $278,104,836.00
Tax $16,686,290.16
Totals $370,703,744.62 $3,095,594,908.84 835% $8.35

“Florida Transportation Disadvantaged Services: Return on Investment Study” -- March 2008the Marketing Institute -- Florida State University College of Business pg.
AppendicesAppendix A: Medical Trip ROI by County
Appendix B: Employment ROI by County
Appendix C: Education ROI by County
Appendix D: Nutrition ROI by County
Appendix E: Life Sustaining ROI by County

Appendix AMedical Related Trips
County Trips Cost/Trip Program Cost Total Benefit-10% Payoff/$1 Total Benefit-5% Payoff/$1 Total Benefit-1% Payoff/$1Alachua 104,241 $ 15.21 1,585,321.12$ $82,350,390.00 $51.95 $41,175,195.00 $25.97 $8,235,039.00 -$ Baker 7,643 $ 30.98 236,775.45$ $6,037,970.00 $25.50 $3,018,985.00 $12.75 $603,797.00 2.55$ Bay 61,382 $ 10.70 656,918.45$ $48,491,780.00 $73.82 $24,245,890.00 $36.91 $4,849,178.00 7.38$ Bradford 11,672 $ 17.95 209,466.86$ $9,220,880.00 $44.02 $4,610,440.00 $22.01 $922,088.00 4.40$ Brevard 108,514 $ 8.05 873,778.55$ $85,726,060.00 $98.11 $42,863,030.00 $49.05 $8,572,606.00 9.81$ Broward 798,274 $ 9.46 7,548,808.42$ $630,636,460.00 $83.54 $315,318,230.00 $41.77 $63,063,646.00 8.35$ Calhoun 12,772 $ 13.84 176,808.71$ $10,089,880.00 $57.07 $5,044,940.00 $28.53 $1,008,988.00 5.71$ Charlotte 56,097 $ 9.40 527,211.47$ $44,316,630.00 $84.06 $22,158,315.00 $42.03 $4,431,663.00 8.41$ Citrus 38,672 $ 13.35 516,412.64$ $30,550,880.00 $59.16 $15,275,440.00 $29.58 $3,055,088.00 5.92$ Clay 24,881 $ 18.74 466,205.71$ $19,655,990.00 $42.16 $9,827,995.00 $21.08 $1,965,599.00 4.22$ Collier 52,880 $ 18.92 1,000,734.65$ $41,775,200.00 $41.74 $20,887,600.00 $20.87 $4,177,520.00 4.17$ Columbia 184,476 $ 5.86 1,081,752.83$ $145,736,040.00 $134.72 $72,868,020.00 $67.36 $14,573,604.00 13.47$ Desoto 16,257 $ 23.02 374,160.25$ $12,843,030.00 $34.32 $6,421,515.00 $17.16 $1,284,303.00 3.43$ Dixie 10,466 $ 38.30 400,869.71$ $8,268,140.00 $20.63 $4,134,070.00 $10.31 $826,814.00 2.06$ Duval 82,006 $ 32.39 2,655,865.76$ $64,784,740.00 $24.39 $32,392,370.00 $12.20 $6,478,474.00 2.44$ Escambia 68,377 $ 10.44 714,197.03$ $54,017,830.00 $75.63 $27,008,915.00 $37.82 $5,401,783.00 7.56$ Flagler 13,958 $ 13.39 186,844.92$ $11,026,820.00 $59.02 $5,513,410.00 $29.51 $1,102,682.00 5.90$ Franklin 8,471 $ 33.34 282,385.06$ $6,692,090.00 $23.70 $3,346,045.00 $11.85 $669,209.00 2.37$ Gadsden 25,328 $ 20.28 513,605.08$ $20,009,120.00 $38.96 $10,004,560.00 $19.48 $2,000,912.00 3.90$ Gilchrist 5,038 $ 31.27 157,544.41$ $3,980,020.00 $25.26 $1,990,010.00 $12.63 $398,002.00 2.53$ Glades 2,930 $ 39.50 115,722.35$ $2,314,700.00 $20.00 $1,157,350.00 $10.00 $231,470.00 2.00$ Gulf 8,081 $ 22.04 178,117.49$ $6,383,990.00 $35.84 $3,191,995.00 $17.92 $638,399.00 3.58$ Hamilton 32,945 $ 15.09 497,192.27$ $26,026,550.00 $52.35 $13,013,275.00 $26.17 $2,602,655.00 5.23$ Hardee 8,250 $ 25.85 213,233.11$ $6,517,500.00 $30.57 $3,258,750.00 $15.28 $651,750.00 3.06$ Hendry 8,883 $ 85.78 762,000.43$ $7,017,570.00 $9.21 $3,508,785.00 $4.60 $701,757.00 0.92$ Hernando 41,902 $ 13.25 555,119.53$ $33,102,580.00 $59.63 $16,551,290.00 $29.82 $3,310,258.00 5.96$ Highlands 45,701 $ 18.83 860,355.78$ $36,103,790.00 $41.96 $18,051,895.00 $20.98 $3,610,379.00 4.20$
Hillsborough 657,641 $ 9.81 6,451,836.53$ $519,536,390.00 $80.53 $259,768,195.00 $40.26 $51,953,639.00 8.05$ Holmes 22,680 $ 12.73 288,612.77$ $17,917,200.00 $62.08 $8,958,600.00 $31.04 $1,791,720.00 6.21$ Indian River 45,834 $ 17.01 779,560.57$ $36,208,860.00 $46.45 $18,104,430.00 $23.22 $3,620,886.00 4.64$ Jackson 26,867 $ 17.68 474,984.61$ $21,224,930.00 $44.69 $10,612,465.00 $22.34 $2,122,493.00 4.47$ Jefferson 10,252 $ 25.27 259,044.26$ $8,099,080.00 $31.27 $4,049,540.00 $15.63 $809,908.00 3.13$ Lafayette 4,492 $ 27.36 122,897.64$ $3,548,680.00 $28.88 $1,774,340.00 $14.44 $354,868.00 2.89$ Lake 81,244 $ 22.76 1,849,363.68$ $64,182,760.00 $34.71 $32,091,380.00 $17.35 $6,418,276.00 3.47$ Lee 41,525 $ 22.37 928,769.15$ $32,804,750.00 $35.32 $16,402,375.00 $17.66 $3,280,475.00 3.53$ Leon 41,169 $ 12.17 501,100.15$ $32,523,510.00 $64.90 $16,261,755.00 $32.45 $3,252,351.00 6.49$ Levy 15,224 $ 32.95 501,601.74$ $12,026,960.00 $23.98 $6,013,480.00 $11.99 $1,202,696.00 2.40$ Liberty 18,206 $ 9.42 171,573.85$ $14,382,740.00 $83.83 $7,191,370.00 $41.91 $1,438,274.00 8.38$ Madison 14,118 $ 23.40 330,324.03$ $11,153,220.00 $33.76 $5,576,610.00 $16.88 $1,115,322.00 3.38$ Manatee 83,589 $ 5.86 490,008.46$ $66,035,310.00 $134.76 $33,017,655.00 $67.38 $6,603,531.00 13.48$ Marion 140,213 $ 22.60 3,168,234.34$ $110,768,270.00 $34.96 $55,384,135.00 $17.48 $11,076,827.00 3.50$ Martin 42,814 $ 18.02 771,543.40$ $33,823,060.00 $43.84 $16,911,530.00 $21.92 $3,382,306.00 4.38$ Miami-Dade 10,167,468 $ 4.70 47,761,235.93$ $8,032,299,720.00 $168.18 $4,016,149,860.00 $84.09 $803,229,972.00 16.82$ Monroe 39,412 $ 20.90 823,600.01$ $31,135,480.00 $37.80 $15,567,740.00 $18.90 $3,113,548.00 3.78$ Nassau 30,846 $ 15.63 482,090.62$ $24,368,340.00 $50.55 $12,184,170.00 $25.27 $2,436,834.00 5.05$ Okaloosa 36,648 $ 15.41 564,813.45$ $28,951,920.00 $51.26 $14,475,960.00 $25.63 $2,895,192.00 5.13$
Okeechobee 9,703 $ 24.52 237,945.26$ $7,665,370.00 $32.21 $3,832,685.00 $16.11 $766,537.00 3.22$ Orange 517,124 $ 8.92 4,614,685.61$ $408,527,960.00 $88.53 $204,263,980.00 $44.26 $40,852,796.00 8.85$ Osceola 92,742 $ 8.92 827,605.45$ $73,266,180.00 $88.53 $36,633,090.00 $44.26 $7,326,618.00 8.85$ Palm Beach 1,703,504 $ 7.48 12,739,764.19$ $1,345,768,160.00 $105.64 $672,884,080.00 $52.82 $134,576,816.00 10.56$ Pasco 208,658 $ 6.43 1,341,124.17$ $164,839,820.00 $122.91 $82,419,910.00 $61.46 $16,483,982.00 12.29$ Pinellas 690,876 $ 6.06 4,186,708.56$ $545,792,040.00 $130.36 $272,896,020.00 $65.18 $54,579,204.00 13.04$ Polk 138,543 $ 16.17 2,240,053.48$ $109,448,970.00 $48.86 $54,724,485.00 $24.43 $10,944,897.00 4.89$ Putnam 14,446 $ 12.91 186,548.15$ $11,412,340.00 $61.18 $5,706,170.00 $30.59 $1,141,234.00 6.12$ Santa Rosa 9,508 $ 13.97 132,811.30$ $7,511,320.00 $56.56 $3,755,660.00 $28.28 $751,132.00 5.66$ Sarasota 361,198 $ 9.94 3,591,707.39$ $285,346,420.00 $79.45 $142,673,210.00 $39.72 $28,534,642.00 7.94$ Seminole 127,935 $ 8.92 1,141,656.56$ $101,068,650.00 $88.53 $50,534,325.00 $44.26 $10,106,865.00 8.85$ St Johns 50,769 $ 12.53 636,217.75$ $40,107,510.00 $63.04 $20,053,755.00 $31.52 $4,010,751.00 6.30$ St Lucie 101,236 $ 8.51 861,645.46$ $79,976,440.00 $92.82 $39,988,220.00 $46.41 $7,997,644.00 9.28$ Sumter 18,450 $ 14.11 260,411.21$ $14,575,500.00 $55.97 $7,287,750.00 $27.99 $1,457,550.00 5.60$ Suwannee 155,384 $ 6.87 1,068,111.30$ $122,753,360.00 $114.93 $61,376,680.00 $57.46 $12,275,336.00 11.49$ Taylor 5,530 $ 17.71 97,938.38$ $4,368,700.00 $44.61 $2,184,350.00 $22.30 $436,870.00 4.46$ Union 7,489 $ 13.72 102,781.02$ $5,916,310.00 $57.56 $2,958,155.00 $28.78 $591,631.00 5.76$ Volusia 392,726 $ 8.64 3,392,631.45$ $310,253,540.00 $91.45 $155,126,770.00 $45.72 $31,025,354.00 9.14$ Wakulla 16,336 $ 14.29 233,457.70$ $12,905,440.00 $55.28 $6,452,720.00 $27.64 $1,290,544.00 5.53$ Walton 47,267 $ 9.98 471,666.13$ $37,340,930.00 $79.17 $18,670,465.00 $39.58 $3,734,093.00 7.92$ Washington 19,693 $ 10.66 210,013.18$ $15,557,470.00 $74.08 $7,778,735.00 $37.04 $1,555,747.00 7.41$ Total 18,049,456 128,644,086.92$ $14,259,070,240.00 $110.84 $7,129,535,120.00 $55.42 $1,425,907,024.00 11.08$
Column A: Eight counties selected by TD to focus on, a mixture of urban and rural areas. Column B: Annual Operating Report 2007, Transportation Disadvantaged Commission. Source: http://www.dot.state.fl.us/ctd/docs/APR/2007/2007%20FINAL%20APR.pdfTotal number of medical trips provided in 2007 for that corresponding county. Column C: Cost per trip for corresponding county. : Annual Operating Report 2007, Transportation Disadvantaged Commission. Source: http://www.dot.state.fl.us/ctd/docs/APR/2007/2007%20FINAL%20APR.pdfColumn D: Program Cost. (Column B * Column C). Column E: Total benefit if 10% of passengers would end up in the hospital. Calculate # of trips times 10% times $7900 (average cost per hospital stay. HCUP Fact Book, Agency for Healthcare Research and Quality, “Statistics on Hospital-Based Care in the UnitedStates, 2005”,http://www.hcups.ahrq.gov/reports/factsandfigures/HAR_2005.pdf) Column F: Payoff per $1 at 10%, found by dividing the benefit my program cost. Column G: Same as Column E, substitute 5% Column H: Same as F, with Column G as benefit Column I: Same as Column E, substitute 1% Column J: Same as F, with Column I as benefit

Appendix BEmployment Related TripsIndirect Benefits-Using Traditional Multiplier (1.7)
County Employment TCost per Trip Program Cost Annual Benefit Payoff$1 Tax Benefit Payoff/$1Alachua 68,908 $ 15.21 1,047,968.72$ 2,807,311.92$ 2.68$ 143,172.91$ 0.14$ Baker 120 $ 30.98 3,717.53$ 4,888.80$ 1.32$ 249.33$ 0.07$ Bay 6,800 $ 10.70 72,774.52$ 277,032.00$ 3.81$ 14,128.63$ 0.19$ Bradford 0 $ 17.95 -$ -$ -$ Brevard 162,771 $ 8.05 1,310,667.82$ 6,631,290.54$ 5.06$ 338,195.82$ 0.26$ Broward 427,309 $ 9.46 4,040,810.27$ 17,408,568.66$ 4.31$ 887,837.00$ 0.22$ Calhoun 5,601 $ 13.84 77,537.24$ 228,184.74$ 2.94$ 11,637.42$ 0.15$ Charlotte 780 $ 9.40 7,330.60$ 31,777.20$ 4.33$ 1,620.64$ 0.22$ Citrus 21,044 $ 13.35 281,014.36$ 857,332.56$ 3.05$ 43,723.96$ 0.16$ Clay 16,575 $ 18.74 310,572.71$ 675,265.50$ 2.17$ 34,438.54$ 0.11$ Collier 17,872 $ 18.92 338,221.06$ 728,105.28$ 2.15$ 37,133.37$ 0.11$ Columbia 2,522 $ 5.86 14,788.81$ 102,746.28$ 6.95$ 5,240.06$ 0.35$ Desoto 1,954 $ 23.02 44,971.96$ 79,605.96$ 1.77$ 4,059.90$ 0.09$ Dixie 0 $ 38.30 -$ -$ -$ Duval 87,874 $ 32.39 2,845,908.20$ 3,579,986.76$ 1.26$ 182,579.32$ 0.06$ Escambia 48,406 $ 10.44 505,600.15$ 1,972,060.44$ 3.90$ 100,575.08$ 0.20$ Flagler 21,923 $ 13.39 293,466.20$ 893,143.02$ 3.04$ 45,550.29$ 0.16$ Franklin 0 $ 33.34 -$ -$ -$ Gadsden 40,638 $ 20.28 824,063.62$ 1,655,592.12$ 2.01$ 84,435.20$ 0.10$ Gilchrist 0 $ 31.27 -$ -$ -$ Glades 160 $ 39.50 6,319.31$ 6,518.40$ 1.03$ 332.44$ 0.05$ Gulf 0 $ 22.04 -$ -$ -$ Hamilton 418 $ 15.09 6,308.28$ 17,029.32$ 2.70$ 868.50$ 0.14$ Hardee 3,544 $ 25.85 91,599.78$ 144,382.56$ 1.58$ 7,363.51$ 0.08$ Hendry 355 $ 85.78 30,452.57$ 14,462.70$ 0.47$ 737.60$ 0.02$ Hernando 1,539 $ 13.25 20,388.74$ 62,698.86$ 3.08$ 3,197.64$ 0.16$ Highlands 46,232 $ 18.83 870,352.26$ 1,883,491.68$ 2.16$ 96,058.08$ 0.11$
Hillsborough 106,333 $ 9.81 1,043,187.90$ 4,332,006.42$ 4.15$ 220,932.33$ 0.21$ Holmes 5,000 $ 12.73 63,627.15$ 203,700.00$ 3.20$ 10,388.70$ 0.16$ Indian River 5,983 $ 17.01 101,760.94$ 243,747.42$ 2.40$ 12,431.12$ 0.12$ Jackson 1 $ 17.68 17.68$ 40.74$ 2.30$ 2.08$ 0.12$ Jefferson 3,776 $ 25.27 95,410.76$ 153,834.24$ 1.61$ 7,845.55$ 0.08$ Lafayette 0 $ 27.36 -$ -$ -$ Lake 53,146 $ 22.76 1,209,766.66$ 2,165,168.04$ 1.79$ 110,423.57$ 0.09$ Lee 6,200 $ 22.37 138,672.34$ 252,588.00$ 1.82$ 12,881.99$ 0.09$ Leon 108,284 $ 12.17 1,318,009.38$ 4,411,490.16$ 3.35$ 224,986.00$ 0.17$ Levy 279 $ 32.95 9,192.52$ 11,366.46$ 1.24$ 579.69$ 0.06$ Liberty 165 $ 9.42 1,554.96$ 6,722.10$ 4.32$ 342.83$ 0.22$ Madison 4,623 $ 23.40 108,166.03$ 188,341.02$ 1.74$ 9,605.39$ 0.09$ Manatee 65,748 $ 5.86 385,422.44$ 2,678,573.52$ 6.95$ 136,607.25$ 0.35$ Marion 1,434 $ 22.60 32,402.47$ 58,421.16$ 1.80$ 2,979.48$ 0.09$ Martin 17,604 $ 18.02 317,238.52$ 717,186.96$ 2.26$ 36,576.53$ 0.12$ Miami-Dade 3,297,946 $ 4.70 15,491,956.99$ 134,358,320.04$ 8.67$ 6,852,274.32$ 0.44$ Monroe 5,189 $ 20.90 108,435.51$ 211,399.86$ 1.95$ 10,781.39$ 0.10$ Nassau 1,247 $ 15.63 19,489.30$ 50,802.78$ 2.61$ 2,590.94$ 0.13$ Okaloosa 37,005 $ 15.41 570,315.48$ 1,507,583.70$ 2.64$ 76,886.77$ 0.13$
Okeechobee 7,810 $ 24.52 191,523.50$ 318,179.40$ 1.66$ 16,227.15$ 0.08$ Orange 254,747 $ 8.92 2,273,298.70$ 10,378,392.78$ 4.57$ 529,298.03$ 0.23$ Osceola 45,687 $ 8.92 407,698.89$ 1,861,288.38$ 4.57$ 94,925.71$ 0.23$ Palm Beach 619,456 $ 7.48 4,632,641.52$ 25,236,637.44$ 5.45$ 1,287,068.51$ 0.28$ Pasco 27,630 $ 6.43 177,588.50$ 1,125,646.20$ 6.34$ 57,407.96$ 0.32$ Pinellas 724,817 $ 6.06 4,392,391.02$ 29,529,044.58$ 6.72$ 1,505,981.27$ 0.34$ Polk 54,060 $ 16.17 874,077.30$ 2,202,404.40$ 2.52$ 112,322.62$ 0.13$ Putnam 82,413 $ 12.91 1,064,238.71$ 3,357,505.62$ 3.15$ 171,232.79$ 0.16$ Santa Rosa 12,785 $ 13.97 178,585.66$ 520,860.90$ 2.92$ 26,563.91$ 0.15$ Sarasota 129,661 $ 9.94 1,289,332.64$ 5,282,389.14$ 4.10$ 269,401.85$ 0.21$ Seminole 63,023 $ 8.92 562,399.82$ 2,567,557.02$ 4.57$ 130,945.41$ 0.23$ St Johns 0 $ 12.53 -$ -$ -$ St Lucie 37,696 $ 8.51 320,840.29$ 1,535,735.04$ 4.79$ 78,322.49$ 0.24$ Sumter 3,544 $ 14.11 50,021.53$ 144,382.56$ 2.89$ 7,363.51$ 0.15$ Suwannee 3,921 $ 6.87 26,953.00$ 159,741.54$ 5.93$ 8,146.82$ 0.30$ Taylor 16,576 $ 17.71 293,567.19$ 675,306.24$ 2.30$ 34,440.62$ 0.12$ Union 0 $ 13.72 -$ -$ -$ Volusia 57,519 $ 8.64 496,887.83$ 2,343,324.06$ 4.72$ 119,509.53$ 0.24$ Wakulla 679 $ 14.29 9,703.59$ 27,662.46$ 2.85$ 1,410.79$ 0.15$ Walton 16,502 $ 9.98 164,669.53$ 672,291.48$ 4.08$ 34,286.87$ 0.21$ Washington 2,587 $ 10.66 27,588.69$ 105,394.38$ 3.82$ 5,375.11$ 0.19$ Total 6,864,421 17.50$ 51,493,469.64$ 279,656,511.54$ 5.43$ 14,262,482.09$ 0.28$

Appendix BEmployment Related Trips (continued)Indirect Benefits-Using Contemporary Multiplier (2.0)
County Employment TCost per Trip Program Cost Annual Benefit Payoff$1 Tax Benefit Payoff/$1Alachua 68,908 $ 15.21 1,047,968.72$ 2,807,311.92$ 2.68$ 168,438.72$ 0.16$ Baker 120 $ 30.98 3,717.53$ 4,888.80$ 1.32$ 293.33$ 0.08$ Bay 6,800 $ 10.70 72,774.52$ 277,032.00$ 3.81$ 16,621.92$ 0.23$ Bradford 0 $ 17.95 -$ -$ -$ Brevard 162,771 $ 8.05 1,310,667.82$ 6,631,290.54$ 5.06$ 397,877.43$ 0.30$ Broward 427,309 $ 9.46 4,040,810.27$ 17,408,568.66$ 4.31$ 1,044,514.12$ 0.26$ Calhoun 5,601 $ 13.84 77,537.24$ 228,184.74$ 2.94$ 13,691.08$ 0.18$ Charlotte 780 $ 9.40 7,330.60$ 31,777.20$ 4.33$ 1,906.63$ 0.26$ Citrus 21,044 $ 13.35 281,014.36$ 857,332.56$ 3.05$ 51,439.95$ 0.18$ Clay 16,575 $ 18.74 310,572.71$ 675,265.50$ 2.17$ 40,515.93$ 0.13$ Collier 17,872 $ 18.92 338,221.06$ 728,105.28$ 2.15$ 43,686.32$ 0.13$ Columbia 2,522 $ 5.86 14,788.81$ 102,746.28$ 6.95$ 6,164.78$ 0.42$ Desoto 1,954 $ 23.02 44,971.96$ 79,605.96$ 1.77$ 4,776.36$ 0.11$ Dixie 0 $ 38.30 -$ -$ -$ Duval 87,874 $ 32.39 2,845,908.20$ 3,579,986.76$ 1.26$ 214,799.21$ 0.08$ Escambia 48,406 $ 10.44 505,600.15$ 1,972,060.44$ 3.90$ 118,323.63$ 0.23$ Flagler 21,923 $ 13.39 293,466.20$ 893,143.02$ 3.04$ 53,588.58$ 0.18$ Franklin 0 $ 33.34 -$ -$ -$ Gadsden 40,638 $ 20.28 824,063.62$ 1,655,592.12$ 2.01$ 99,335.53$ 0.12$ Gilchrist 0 $ 31.27 -$ -$ -$ Glades 160 $ 39.50 6,319.31$ 6,518.40$ 1.03$ 391.10$ 0.06$ Gulf 0 $ 22.04 -$ -$ -$ Hamilton 418 $ 15.09 6,308.28$ 17,029.32$ 2.70$ 1,021.76$ 0.16$ Hardee 3,544 $ 25.85 91,599.78$ 144,382.56$ 1.58$ 8,662.95$ 0.09$ Hendry 355 $ 85.78 30,452.57$ 14,462.70$ 0.47$ 867.76$ 0.03$ Hernando 1,539 $ 13.25 20,388.74$ 62,698.86$ 3.08$ 3,761.93$ 0.18$ Highlands 46,232 $ 18.83 870,352.26$ 1,883,491.68$ 2.16$ 113,009.50$ 0.13$
Hillsborough 106,333 $ 9.81 1,043,187.90$ 4,332,006.42$ 4.15$ 259,920.39$ 0.25$ Holmes 5,000 $ 12.73 63,627.15$ 203,700.00$ 3.20$ 12,222.00$ 0.19$ Indian River 5,983 $ 17.01 101,760.94$ 243,747.42$ 2.40$ 14,624.85$ 0.14$ Jackson 1 $ 17.68 17.68$ 40.74$ 2.30$ 2.44$ 0.14$ Jefferson 3,776 $ 25.27 95,410.76$ 153,834.24$ 1.61$ 9,230.05$ 0.10$ Lafayette 0 $ 27.36 -$ -$ -$ Lake 53,146 $ 22.76 1,209,766.66$ 2,165,168.04$ 1.79$ 129,910.08$ 0.11$ Lee 6,200 $ 22.37 138,672.34$ 252,588.00$ 1.82$ 15,155.28$ 0.11$ Leon 108,284 $ 12.17 1,318,009.38$ 4,411,490.16$ 3.35$ 264,689.41$ 0.20$ Levy 279 $ 32.95 9,192.52$ 11,366.46$ 1.24$ 681.99$ 0.07$ Liberty 165 $ 9.42 1,554.96$ 6,722.10$ 4.32$ 403.33$ 0.26$ Madison 4,623 $ 23.40 108,166.03$ 188,341.02$ 1.74$ 11,300.46$ 0.10$ Manatee 65,748 $ 5.86 385,422.44$ 2,678,573.52$ 6.95$ 160,714.41$ 0.42$ Marion 1,434 $ 22.60 32,402.47$ 58,421.16$ 1.80$ 3,505.27$ 0.11$ Martin 17,604 $ 18.02 317,238.52$ 717,186.96$ 2.26$ 43,031.22$ 0.14$ Miami-Dade 3,297,946 $ 4.70 15,491,956.99$ 134,358,320.04$ 8.67$ 8,061,499.20$ 0.52$ Monroe 5,189 $ 20.90 108,435.51$ 211,399.86$ 1.95$ 12,683.99$ 0.12$ Nassau 1,247 $ 15.63 19,489.30$ 50,802.78$ 2.61$ 3,048.17$ 0.16$ Okaloosa 37,005 $ 15.41 570,315.48$ 1,507,583.70$ 2.64$ 90,455.02$ 0.16$
Okeechobee 7,810 $ 24.52 191,523.50$ 318,179.40$ 1.66$ 19,090.76$ 0.10$ Orange 254,747 $ 8.92 2,273,298.70$ 10,378,392.78$ 4.57$ 622,703.57$ 0.27$ Osceola 45,687 $ 8.92 407,698.89$ 1,861,288.38$ 4.57$ 111,677.30$ 0.27$ Palm Beach 619,456 $ 7.48 4,632,641.52$ 25,236,637.44$ 5.45$ 1,514,198.25$ 0.33$ Pasco 27,630 $ 6.43 177,588.50$ 1,125,646.20$ 6.34$ 67,538.77$ 0.38$ Pinellas 724,817 $ 6.06 4,392,391.02$ 29,529,044.58$ 6.72$ 1,771,742.67$ 0.40$ Polk 54,060 $ 16.17 874,077.30$ 2,202,404.40$ 2.52$ 132,144.26$ 0.15$ Putnam 82,413 $ 12.91 1,064,238.71$ 3,357,505.62$ 3.15$ 201,450.34$ 0.19$ Santa Rosa 12,785 $ 13.97 178,585.66$ 520,860.90$ 2.92$ 31,251.65$ 0.17$ Sarasota 129,661 $ 9.94 1,289,332.64$ 5,282,389.14$ 4.10$ 316,943.35$ 0.25$ Seminole 63,023 $ 8.92 562,399.82$ 2,567,557.02$ 4.57$ 154,053.42$ 0.27$ St Johns 0 $ 12.53 -$ -$ -$ St Lucie 37,696 $ 8.51 320,840.29$ 1,535,735.04$ 4.79$ 92,144.10$ 0.29$ Sumter 3,544 $ 14.11 50,021.53$ 144,382.56$ 2.89$ 8,662.95$ 0.17$ Suwannee 3,921 $ 6.87 26,953.00$ 159,741.54$ 5.93$ 9,584.49$ 0.36$ Taylor 16,576 $ 17.71 293,567.19$ 675,306.24$ 2.30$ 40,518.37$ 0.14$ Union 0 $ 13.72 -$ -$ -$ Volusia 57,519 $ 8.64 496,887.83$ 2,343,324.06$ 4.72$ 140,599.44$ 0.28$ Wakulla 679 $ 14.29 9,703.59$ 27,662.46$ 2.85$ 1,659.75$ 0.17$ Walton 16,502 $ 9.98 164,669.53$ 672,291.48$ 4.08$ 40,337.49$ 0.24$ Washington 2,587 $ 10.66 27,588.69$ 105,394.38$ 3.82$ 6,323.66$ 0.23$
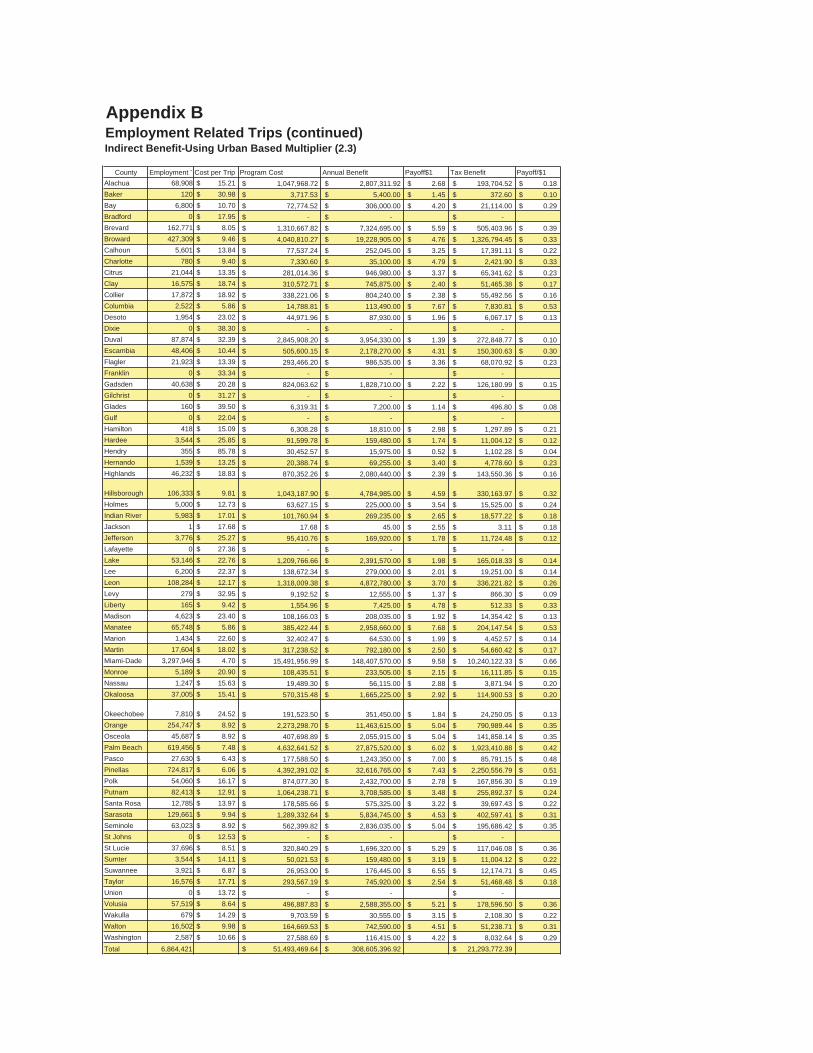
Appendix BEmployment Related Trips (continued)Indirect Benefit-Using Urban Based Multiplier (2.3)
County Employment TCost per Trip Program Cost Annual Benefit Payoff$1 Tax Benefit Payoff/$1Alachua 68,908 $ 15.21 1,047,968.72$ 2,807,311.92$ 2.68$ 193,704.52$ 0.18$ Baker 120 $ 30.98 3,717.53$ 5,400.00$ 1.45$ 372.60$ 0.10$ Bay 6,800 $ 10.70 72,774.52$ 306,000.00$ 4.20$ 21,114.00$ 0.29$ Bradford 0 $ 17.95 -$ -$ -$ Brevard 162,771 $ 8.05 1,310,667.82$ 7,324,695.00$ 5.59$ 505,403.96$ 0.39$ Broward 427,309 $ 9.46 4,040,810.27$ 19,228,905.00$ 4.76$ 1,326,794.45$ 0.33$ Calhoun 5,601 $ 13.84 77,537.24$ 252,045.00$ 3.25$ 17,391.11$ 0.22$ Charlotte 780 $ 9.40 7,330.60$ 35,100.00$ 4.79$ 2,421.90$ 0.33$ Citrus 21,044 $ 13.35 281,014.36$ 946,980.00$ 3.37$ 65,341.62$ 0.23$ Clay 16,575 $ 18.74 310,572.71$ 745,875.00$ 2.40$ 51,465.38$ 0.17$ Collier 17,872 $ 18.92 338,221.06$ 804,240.00$ 2.38$ 55,492.56$ 0.16$ Columbia 2,522 $ 5.86 14,788.81$ 113,490.00$ 7.67$ 7,830.81$ 0.53$ Desoto 1,954 $ 23.02 44,971.96$ 87,930.00$ 1.96$ 6,067.17$ 0.13$ Dixie 0 $ 38.30 -$ -$ -$ Duval 87,874 $ 32.39 2,845,908.20$ 3,954,330.00$ 1.39$ 272,848.77$ 0.10$ Escambia 48,406 $ 10.44 505,600.15$ 2,178,270.00$ 4.31$ 150,300.63$ 0.30$ Flagler 21,923 $ 13.39 293,466.20$ 986,535.00$ 3.36$ 68,070.92$ 0.23$ Franklin 0 $ 33.34 -$ -$ -$ Gadsden 40,638 $ 20.28 824,063.62$ 1,828,710.00$ 2.22$ 126,180.99$ 0.15$ Gilchrist 0 $ 31.27 -$ -$ -$ Glades 160 $ 39.50 6,319.31$ 7,200.00$ 1.14$ 496.80$ 0.08$ Gulf 0 $ 22.04 -$ -$ -$ Hamilton 418 $ 15.09 6,308.28$ 18,810.00$ 2.98$ 1,297.89$ 0.21$ Hardee 3,544 $ 25.85 91,599.78$ 159,480.00$ 1.74$ 11,004.12$ 0.12$ Hendry 355 $ 85.78 30,452.57$ 15,975.00$ 0.52$ 1,102.28$ 0.04$ Hernando 1,539 $ 13.25 20,388.74$ 69,255.00$ 3.40$ 4,778.60$ 0.23$ Highlands 46,232 $ 18.83 870,352.26$ 2,080,440.00$ 2.39$ 143,550.36$ 0.16$
Hillsborough 106,333 $ 9.81 1,043,187.90$ 4,784,985.00$ 4.59$ 330,163.97$ 0.32$ Holmes 5,000 $ 12.73 63,627.15$ 225,000.00$ 3.54$ 15,525.00$ 0.24$ Indian River 5,983 $ 17.01 101,760.94$ 269,235.00$ 2.65$ 18,577.22$ 0.18$ Jackson 1 $ 17.68 17.68$ 45.00$ 2.55$ 3.11$ 0.18$ Jefferson 3,776 $ 25.27 95,410.76$ 169,920.00$ 1.78$ 11,724.48$ 0.12$ Lafayette 0 $ 27.36 -$ -$ -$ Lake 53,146 $ 22.76 1,209,766.66$ 2,391,570.00$ 1.98$ 165,018.33$ 0.14$ Lee 6,200 $ 22.37 138,672.34$ 279,000.00$ 2.01$ 19,251.00$ 0.14$ Leon 108,284 $ 12.17 1,318,009.38$ 4,872,780.00$ 3.70$ 336,221.82$ 0.26$ Levy 279 $ 32.95 9,192.52$ 12,555.00$ 1.37$ 866.30$ 0.09$ Liberty 165 $ 9.42 1,554.96$ 7,425.00$ 4.78$ 512.33$ 0.33$ Madison 4,623 $ 23.40 108,166.03$ 208,035.00$ 1.92$ 14,354.42$ 0.13$ Manatee 65,748 $ 5.86 385,422.44$ 2,958,660.00$ 7.68$ 204,147.54$ 0.53$ Marion 1,434 $ 22.60 32,402.47$ 64,530.00$ 1.99$ 4,452.57$ 0.14$ Martin 17,604 $ 18.02 317,238.52$ 792,180.00$ 2.50$ 54,660.42$ 0.17$ Miami-Dade 3,297,946 $ 4.70 15,491,956.99$ 148,407,570.00$ 9.58$ 10,240,122.33$ 0.66$ Monroe 5,189 $ 20.90 108,435.51$ 233,505.00$ 2.15$ 16,111.85$ 0.15$ Nassau 1,247 $ 15.63 19,489.30$ 56,115.00$ 2.88$ 3,871.94$ 0.20$ Okaloosa 37,005 $ 15.41 570,315.48$ 1,665,225.00$ 2.92$ 114,900.53$ 0.20$
Okeechobee 7,810 $ 24.52 191,523.50$ 351,450.00$ 1.84$ 24,250.05$ 0.13$ Orange 254,747 $ 8.92 2,273,298.70$ 11,463,615.00$ 5.04$ 790,989.44$ 0.35$ Osceola 45,687 $ 8.92 407,698.89$ 2,055,915.00$ 5.04$ 141,858.14$ 0.35$ Palm Beach 619,456 $ 7.48 4,632,641.52$ 27,875,520.00$ 6.02$ 1,923,410.88$ 0.42$ Pasco 27,630 $ 6.43 177,588.50$ 1,243,350.00$ 7.00$ 85,791.15$ 0.48$ Pinellas 724,817 $ 6.06 4,392,391.02$ 32,616,765.00$ 7.43$ 2,250,556.79$ 0.51$ Polk 54,060 $ 16.17 874,077.30$ 2,432,700.00$ 2.78$ 167,856.30$ 0.19$ Putnam 82,413 $ 12.91 1,064,238.71$ 3,708,585.00$ 3.48$ 255,892.37$ 0.24$ Santa Rosa 12,785 $ 13.97 178,585.66$ 575,325.00$ 3.22$ 39,697.43$ 0.22$ Sarasota 129,661 $ 9.94 1,289,332.64$ 5,834,745.00$ 4.53$ 402,597.41$ 0.31$ Seminole 63,023 $ 8.92 562,399.82$ 2,836,035.00$ 5.04$ 195,686.42$ 0.35$ St Johns 0 $ 12.53 -$ -$ -$ St Lucie 37,696 $ 8.51 320,840.29$ 1,696,320.00$ 5.29$ 117,046.08$ 0.36$ Sumter 3,544 $ 14.11 50,021.53$ 159,480.00$ 3.19$ 11,004.12$ 0.22$ Suwannee 3,921 $ 6.87 26,953.00$ 176,445.00$ 6.55$ 12,174.71$ 0.45$ Taylor 16,576 $ 17.71 293,567.19$ 745,920.00$ 2.54$ 51,468.48$ 0.18$ Union 0 $ 13.72 -$ -$ -$ Volusia 57,519 $ 8.64 496,887.83$ 2,588,355.00$ 5.21$ 178,596.50$ 0.36$ Wakulla 679 $ 14.29 9,703.59$ 30,555.00$ 3.15$ 2,108.30$ 0.22$ Walton 16,502 $ 9.98 164,669.53$ 742,590.00$ 4.51$ 51,238.71$ 0.31$ Washington 2,587 $ 10.66 27,588.69$ 116,415.00$ 4.22$ 8,032.64$ 0.29$ Total 6,864,421 51,493,469.64$ 308,605,396.92$ 21,293,772.39$

Appendix BEmployment Related TripsDirect Benefits-50% taxable goods and services
County Annual Benefit % Spent in FL Multiplier FL Direct Benefit Tax Rate Tax Revenue Payoff/$1Alachua 2,807,311.92$ 50% 1.7 2,386,215.13$ 6% 143,172.91$ $0.14Baker 5,400.00$ 50% 1.7 4,590.00$ 6% 275.40$ $0.07Bay 306,000.00$ 50% 1.7 260,100.00$ 6% 15,606.00$ $0.21Bradford -$ 50% 1.7 -$ 6% -$ Brevard 7,324,695.00$ 50% 1.7 6,225,990.75$ 6% 373,559.45$ $0.29Broward 19,228,905.00$ 50% 1.7 16,344,569.25$ 6% 980,674.16$ $0.24Calhoun 252,045.00$ 50% 1.7 214,238.25$ 6% 12,854.30$ $0.17Charlotte 35,100.00$ 50% 1.7 29,835.00$ 6% 1,790.10$ $0.24Citrus 946,980.00$ 50% 1.7 804,933.00$ 6% 48,295.98$ $0.17Clay 745,875.00$ 50% 1.7 633,993.75$ 6% 38,039.63$ $0.12Collier 804,240.00$ 50% 1.7 683,604.00$ 6% 41,016.24$ $0.12Columbia 113,490.00$ 50% 1.7 96,466.50$ 6% 5,787.99$ $0.39Desoto 87,930.00$ 50% 1.7 74,740.50$ 6% 4,484.43$ $0.10Dixie -$ 50% 1.7 -$ 6% -$ Duval 3,954,330.00$ 50% 1.7 3,361,180.50$ 6% 201,670.83$ $0.07Escambia 2,178,270.00$ 50% 1.7 1,851,529.50$ 6% 111,091.77$ $0.22Flagler 986,535.00$ 50% 1.7 838,554.75$ 6% 50,313.29$ $0.17Franklin -$ 50% 1.7 -$ 6% -$ Gadsden 1,828,710.00$ 50% 1.7 1,554,403.50$ 6% 93,264.21$ $0.11Gilchrist -$ 50% 1.7 -$ 6% -$ Glades 7,200.00$ 50% 1.7 6,120.00$ 6% 367.20$ $0.06Gulf -$ 50% 1.7 -$ 6% -$ Hamilton 18,810.00$ 50% 1.7 15,988.50$ 6% 959.31$ $0.15Hardee 159,480.00$ 50% 1.7 135,558.00$ 6% 8,133.48$ $0.09Hendry 15,975.00$ 50% 1.7 13,578.75$ 6% 814.73$ $0.03Hernando 69,255.00$ 50% 1.7 58,866.75$ 6% 3,532.01$ $0.17Highlands 2,080,440.00$ 50% 1.7 1,768,374.00$ 6% 106,102.44$ $0.12
Hillsborough 4,784,985.00$ 50% 1.7 4,067,237.25$ 6% 244,034.24$ $0.23Holmes 225,000.00$ 50% 1.7 191,250.00$ 6% 11,475.00$ $0.18Indian River 269,235.00$ 50% 1.7 228,849.75$ 6% 13,730.99$ $0.13Jackson 45.00$ 50% 1.7 38.25$ 6% 2.30$ $0.13Jefferson 169,920.00$ 50% 1.7 144,432.00$ 6% 8,665.92$ $0.09Lafayette -$ 50% 1.7 -$ 6% -$ Lake 2,391,570.00$ 50% 1.7 2,032,834.50$ 6% 121,970.07$ $0.10Lee 279,000.00$ 50% 1.7 237,150.00$ 6% 14,229.00$ $0.10Leon 4,872,780.00$ 50% 1.7 4,141,863.00$ 6% 248,511.78$ $0.19Levy 12,555.00$ 50% 1.7 10,671.75$ 6% 640.31$ $0.07Liberty 7,425.00$ 50% 1.7 6,311.25$ 6% 378.68$ $0.24Madison 208,035.00$ 50% 1.7 176,829.75$ 6% 10,609.79$ $0.10Manatee 2,958,660.00$ 50% 1.7 2,514,861.00$ 6% 150,891.66$ $0.39Marion 64,530.00$ 50% 1.7 54,850.50$ 6% 3,291.03$ $0.10Martin 792,180.00$ 50% 1.7 673,353.00$ 6% 40,401.18$ $0.13Miami-Dade 148,407,570.00$ 50% 1.7 126,146,434.50$ 6% 7,568,786.07$ $0.49Monroe 233,505.00$ 50% 1.7 198,479.25$ 6% 11,908.76$ $0.11Nassau 56,115.00$ 50% 1.7 47,697.75$ 6% 2,861.87$ $0.15Okaloosa 1,665,225.00$ 50% 1.7 1,415,441.25$ 6% 84,926.48$ $0.15
Okeechobee 351,450.00$ 50% 1.7 298,732.50$ 6% 17,923.95$ $0.09Orange 11,463,615.00$ 50% 1.7 9,744,072.75$ 6% 584,644.37$ $0.26Osceola 2,055,915.00$ 50% 1.7 1,747,527.75$ 6% 104,851.67$ $0.26Palm Beach 27,875,520.00$ 50% 1.7 23,694,192.00$ 6% 1,421,651.52$ $0.31Pasco 1,243,350.00$ 50% 1.7 1,056,847.50$ 6% 63,410.85$ $0.36Pinellas 29,529,044.58$ 50% 1.7 25,099,687.89$ 6% 1,505,981.27$ $0.34Polk 2,432,700.00$ 50% 1.7 2,067,795.00$ 6% 124,067.70$ $0.14Putnam 3,708,585.00$ 50% 1.7 3,152,297.25$ 6% 189,137.84$ $0.18Santa Rosa 575,325.00$ 50% 1.7 489,026.25$ 6% 29,341.58$ $0.16Sarasota 5,834,745.00$ 50% 1.7 4,959,533.25$ 6% 297,572.00$ $0.23Seminole 2,836,035.00$ 50% 1.7 2,410,629.75$ 6% 144,637.79$ $0.26St Johns -$ 50% 1.7 -$ 6% -$ St Lucie 1,696,320.00$ 50% 1.7 1,441,872.00$ 6% 86,512.32$ $0.27Sumter 159,480.00$ 50% 1.7 135,558.00$ 6% 8,133.48$ $0.16Suwannee 176,445.00$ 50% 1.7 149,978.25$ 6% 8,998.70$ $0.33Taylor 745,920.00$ 50% 1.7 634,032.00$ 6% 38,041.92$ $0.13Union -$ 50% 1.7 -$ 6% -$ Volusia 2,588,355.00$ 50% 1.7 2,200,101.75$ 6% 132,006.11$ $0.27Wakulla 30,555.00$ 50% 1.7 25,971.75$ 6% 1,558.31$ $0.16Walton 742,590.00$ 50% 1.7 631,201.50$ 6% 37,872.09$ $0.23Washington 116,415.00$ 50% 1.7 98,952.75$ 6% 5,937.17$ $0.22

Appendix BEmployment Related Trips (continued)Direct Benefits-75% taxable goods and services
County Annual Benefit % Spent in FL Multiplier FL Direct Benefit Tax Rate Tax Revenue Payoff/$1Alachua 2,807,311.92$ 75% 1.7 3,579,322.70$ 6% 214,759.36$ $0.20Baker 5,400.00$ 75% 1.7 6,885.00$ 6% 413.10$ $0.11Bay 306,000.00$ 75% 1.7 390,150.00$ 6% 23,409.00$ $0.32Bradford -$ 75% 1.7 -$ 6% -$ Brevard 7,324,695.00$ 75% 1.7 9,338,986.13$ 6% 560,339.17$ $0.43Broward 19,228,905.00$ 75% 1.7 24,516,853.88$ 6% 1,471,011.23$ $0.36Calhoun 252,045.00$ 75% 1.7 321,357.38$ 6% 19,281.44$ $0.25Charlotte 35,100.00$ 75% 1.7 44,752.50$ 6% 2,685.15$ $0.37Citrus 946,980.00$ 75% 1.7 1,207,399.50$ 6% 72,443.97$ $0.26Clay 745,875.00$ 75% 1.7 950,990.63$ 6% 57,059.44$ $0.18Collier 804,240.00$ 75% 1.7 1,025,406.00$ 6% 61,524.36$ $0.18Columbia 113,490.00$ 75% 1.7 144,699.75$ 6% 8,681.99$ $0.59Desoto 87,930.00$ 75% 1.7 112,110.75$ 6% 6,726.65$ $0.15Dixie -$ 75% 1.7 -$ 6% -$ Duval 3,954,330.00$ 75% 1.7 5,041,770.75$ 6% 302,506.25$ $0.11Escambia 2,178,270.00$ 75% 1.7 2,777,294.25$ 6% 166,637.66$ $0.33Flagler 986,535.00$ 75% 1.7 1,257,832.13$ 6% 75,469.93$ $0.26Franklin -$ 75% 1.7 -$ 6% -$ Gadsden 1,828,710.00$ 75% 1.7 2,331,605.25$ 6% 139,896.32$ $0.17Gilchrist -$ 75% 1.7 -$ 6% -$ Glades 7,200.00$ 75% 1.7 9,180.00$ 6% 550.80$ $0.09Gulf -$ 75% 1.7 -$ 6% -$ Hamilton 18,810.00$ 75% 1.7 23,982.75$ 6% 1,438.97$ $0.23Hardee 159,480.00$ 75% 1.7 203,337.00$ 6% 12,200.22$ $0.13Hendry 15,975.00$ 75% 1.7 20,368.13$ 6% 1,222.09$ $0.04Hernando 69,255.00$ 75% 1.7 88,300.13$ 6% 5,298.01$ $0.26Highlands 2,080,440.00$ 75% 1.7 2,652,561.00$ 6% 159,153.66$ $0.18Hillsborough 4,784,985.00$ 75% 1.7 6,100,855.88$ 6% 366,051.35$ $0.35Holmes 225,000.00$ 75% 1.7 286,875.00$ 6% 17,212.50$ $0.27Indian River 269,235.00$ 75% 1.7 343,274.63$ 6% 20,596.48$ $0.20Jackson 45.00$ 75% 1.7 57.38$ 6% 3.44$ $0.19Jefferson 169,920.00$ 75% 1.7 216,648.00$ 6% 12,998.88$ $0.14Lafayette -$ 75% 1.7 -$ 6% -$ Lake 2,391,570.00$ 75% 1.7 3,049,251.75$ 6% 182,955.11$ $0.15Lee 279,000.00$ 75% 1.7 355,725.00$ 6% 21,343.50$ $0.15Leon 4,872,780.00$ 75% 1.7 6,212,794.50$ 6% 372,767.67$ $0.28Levy 12,555.00$ 75% 1.7 16,007.63$ 6% 960.46$ $0.10Liberty 7,425.00$ 75% 1.7 9,466.88$ 6% 568.01$ $0.37Madison 208,035.00$ 75% 1.7 265,244.63$ 6% 15,914.68$ $0.15Manatee 2,958,660.00$ 75% 1.7 3,772,291.50$ 6% 226,337.49$ $0.59Marion 64,530.00$ 75% 1.7 82,275.75$ 6% 4,936.55$ $0.15Martin 792,180.00$ 75% 1.7 1,010,029.50$ 6% 60,601.77$ $0.19Miami-Dade 148,407,570.00$ 75% 1.7 189,219,651.75$ 6% 11,353,179.11$ $0.73Monroe 233,505.00$ 75% 1.7 297,718.88$ 6% 17,863.13$ $0.16Nassau 56,115.00$ 75% 1.7 71,546.63$ 6% 4,292.80$ $0.22Okaloosa 1,665,225.00$ 75% 1.7 2,123,161.88$ 6% 127,389.71$ $0.22Okeechobee 351,450.00$ 75% 1.7 448,098.75$ 6% 26,885.93$ $0.14Orange 11,463,615.00$ 75% 1.7 14,616,109.13$ 6% 876,966.55$ $0.39Osceola 2,055,915.00$ 75% 1.7 2,621,291.63$ 6% 157,277.50$ $0.39Palm Beach 27,875,520.00$ 75% 1.7 35,541,288.00$ 6% 2,132,477.28$ $0.46Pasco 1,243,350.00$ 75% 1.7 1,585,271.25$ 6% 95,116.28$ $0.54Pinellas 29,529,044.58$ 75% 1.7 37,649,531.84$ 6% 2,258,971.91$ $0.51Polk 2,432,700.00$ 75% 1.7 3,101,692.50$ 6% 186,101.55$ $0.21Putnam 3,708,585.00$ 75% 1.7 4,728,445.88$ 6% 283,706.75$ $0.27Santa Rosa 575,325.00$ 75% 1.7 733,539.38$ 6% 44,012.36$ $0.25Sarasota 5,834,745.00$ 75% 1.7 7,439,299.88$ 6% 446,357.99$ $0.35Seminole 2,836,035.00$ 75% 1.7 3,615,944.63$ 6% 216,956.68$ $0.39St Johns -$ 75% 1.7 -$ 6% -$ St Lucie 1,696,320.00$ 75% 1.7 2,162,808.00$ 6% 129,768.48$ $0.40Sumter 159,480.00$ 75% 1.7 203,337.00$ 6% 12,200.22$ $0.24Suwannee 176,445.00$ 75% 1.7 224,967.38$ 6% 13,498.04$ $0.50Taylor 745,920.00$ 75% 1.7 951,048.00$ 6% 57,062.88$ $0.19Union -$ 75% 1.7 -$ 6% -$ Volusia 2,588,355.00$ 75% 1.7 3,300,152.63$ 6% 198,009.16$ $0.40Wakulla 30,555.00$ 75% 1.7 38,957.63$ 6% 2,337.46$ $0.24Walton 742,590.00$ 75% 1.7 946,802.25$ 6% 56,808.14$ $0.34Washington 116,415.00$ 75% 1.7 148,429.13$ 6% 8,905.75$ $0.32
Indirect Benefit Tables
Direct Benefit Tables
Column A: Eight counties selected by TD to focus on, a mixture of urban and rural areas. Column B: Source: Annual Operating Report 2007, Transportation Disadvantaged Commission. http://www.dot.state.fl.us/ctd/docs/APR/2007/2007%20FINAL%20APR.pdfTotal employment trips. Column C: Cost per trip. Source: Annual Operating Report 2007, Transportation Disadvantaged Commission. http://www.dot.state.fl.us/ctd/docs/APR/2007/2007%20FINAL%20APR.pdfColumn D: Total Cost of employment trips, found by multiplying number of trips by trip cost. (Column B*Column C) Column E: Benefits were calculated conservatively using the assumption that each of these individuals is thereby able to work six hours daily at minimum wage ($6.79) The number of trips taken annually, multiplied by the conservative income of $40.74 made per trip. Column F: Payoff per dollar, found by dividing total benefit by total cost (column E/ column D) Column G: Tax benefit is found by taking the total income (Column E) and multiplying it by the conservative multiplier of 1.7, a 50% taxable item rate, and the 6% tax rate. Column H: Pay off per dollar in taxes is found by dividing Column G by Column D.
Column A: County name Column B: Annual benefit as found from calculations above. Column C: Estimated amount to be spent on taxable items in the state of Florida. Column D: Conservatively estimated multiplier of 1.7 Column E: Florida’s direct benefit, found by multiplying calculations from in columns B-D Column F: Tax rate stated at 6% Column G: tax revenue, calculated by multiplying benefit times the tax rate Column H: return per dollar invested, by dividing tax revenue by the annual benefit (column G/Column B)

Appendix CNutrition Related TripsCounty Trips Cost per trip Program Cost Total Benefit-10% Payoff/$1 Total Benefit-1% Payoff/$1Alachua 1,447 $ 15.21 22,006.31$ $1,143,130.00 51.95$ $114,313.00 5.19$ Baker 4,170 $ 30.98 129,184.04$ $3,294,300.00 25.50$ $329,430.00 2.55$ Bay 21,568 $ 10.70 230,823.65$ $17,038,720.00 73.82$ $1,703,872.00 7.38$ Bradford 2,747 $ 17.95 49,297.93$ $2,170,130.00 44.02$ $217,013.00 4.40$ Brevard 101,734 $ 8.05 819,184.50$ $80,369,860.00 98.11$ $8,036,986.00 9.81$ Broward 713,210 $ 9.46 6,744,408.13$ $563,435,900.00 83.54$ $56,343,590.00 8.35$ Calhoun 6,095 $ 13.84 84,375.91$ $4,815,050.00 57.07$ $481,505.00 5.71$ Charlotte 60,826 $ 9.40 571,655.61$ $48,052,540.00 84.06$ $4,805,254.00 8.41$ Citrus 17,738 $ 13.35 236,867.17$ $14,013,020.00 59.16$ $1,401,302.00 5.92$ Clay 11,541 $ 18.74 216,248.55$ $9,117,390.00 42.16$ $911,739.00 4.22$ Collier 11,860 $ 18.92 224,446.16$ $9,369,400.00 41.74$ $936,940.00 4.17$ Columbia 9,125 $ 5.86 53,508.29$ $7,208,750.00 134.72$ $720,875.00 13.47$ Desoto 4,499 $ 23.02 103,545.98$ $3,554,210.00 34.32$ $355,421.00 3.43$ Dixie 823 $ 38.30 31,522.62$ $650,170.00 20.63$ $65,017.00 2.06$ Duval 0 $ 32.39 -$ $0.00 $0.00Escambia 507 $ 10.44 5,295.61$ $400,530.00 75.63$ $40,053.00 7.56$ Flagler 21,347 $ 13.39 285,755.73$ $16,864,130.00 59.02$ $1,686,413.00 5.90$ Franklin 0 $ 33.34 -$ $0.00 $0.00Gadsden 0 $ 20.28 -$ $0.00 $0.00Gilchrist 1,267 $ 31.27 39,620.64$ $1,000,930.00 25.26$ $100,093.00 2.53$ Glades 800 $ 39.50 31,596.55$ $632,000.00 20.00$ $63,200.00 2.00$ Gulf 4,627 $ 22.04 101,986.09$ $3,655,330.00 35.84$ $365,533.00 3.58$ Hamilton 12,718 $ 15.09 191,934.78$ $10,047,220.00 52.35$ $1,004,722.00 5.23$ Hardee 4,478 $ 25.85 115,740.35$ $3,537,620.00 30.57$ $353,762.00 3.06$ Hendry 1,954 $ 85.78 167,617.79$ $1,543,660.00 9.21$ $154,366.00 0.92$ Hernando 13,078 $ 13.25 173,257.92$ $10,331,620.00 59.63$ $1,033,162.00 5.96$ Highlands 7,017 $ 18.83 132,100.32$ $5,543,430.00 41.96$ $554,343.00 4.20$
Hillsborough 44,991 $ 9.81 441,387.59$ $35,542,890.00 80.53$ $3,554,289.00 8.05$ Holmes 568 $ 12.73 7,228.04$ $448,720.00 62.08$ $44,872.00 6.21$ Indian River 3,799 $ 17.01 64,614.71$ $3,001,210.00 46.45$ $300,121.00 4.64$ Jackson 8,909 $ 17.68 157,503.18$ $7,038,110.00 44.69$ $703,811.00 4.47$ Jefferson 8,325 $ 25.27 210,353.44$ $6,576,750.00 31.27$ $657,675.00 3.13$ Lafayette 3,097 $ 27.36 84,731.52$ $2,446,630.00 28.88$ $244,663.00 2.89$ Lake 23,280 $ 22.76 529,924.51$ $18,391,200.00 34.71$ $1,839,120.00 3.47$ Lee 3,100 $ 22.37 69,336.17$ $2,449,000.00 35.32$ $244,900.00 3.53$ Leon 9 $ 12.17 109.55$ $7,110.00 64.90$ $711.00 6.49$ Levy 921 $ 32.95 30,345.19$ $727,590.00 23.98$ $72,759.00 2.40$ Liberty 2,375 $ 9.42 22,382.07$ $1,876,250.00 83.83$ $187,625.00 8.38$ Madison 6,534 $ 23.40 152,878.40$ $5,161,860.00 33.76$ $516,186.00 3.38$ Manatee 29,188 $ 5.86 171,103.46$ $23,058,520.00 134.76$ $2,305,852.00 13.48$ Marion 19,723 $ 22.60 445,658.29$ $15,581,170.00 34.96$ $1,558,117.00 3.50$ Martin 6,641 $ 18.02 119,676.27$ $5,246,390.00 43.84$ $524,639.00 4.38$ Miami-Dade 5,570,505 $ 4.70 26,167,203.43$ $4,400,698,950.00 168.18$ $440,069,895.00 16.82$ Monroe 8,326 $ 20.90 173,989.99$ $6,577,540.00 37.80$ $657,754.00 3.78$ Nassau 10,526 $ 15.63 164,510.34$ $8,315,540.00 50.55$ $831,554.00 5.05$ Okaloosa 9,137 $ 15.41 140,818.07$ $7,218,230.00 51.26$ $721,823.00 5.13$
Okeechobee 5,424 $ 24.52 133,011.97$ $4,284,960.00 32.21$ $428,496.00 3.22$ Orange 163,602 $ 8.92 1,459,943.45$ $129,245,580.00 88.53$ $12,924,558.00 8.85$ Osceola 29,341 $ 8.92 261,831.44$ $23,179,390.00 88.53$ $2,317,939.00 8.85$ Palm Beach 619,456 $ 7.48 4,632,641.52$ $489,370,240.00 105.64$ $48,937,024.00 10.56$ Pasco 52,846 $ 6.43 339,661.30$ $41,748,340.00 122.91$ $4,174,834.00 12.29$ Pinellas 96,785 $ 6.06 586,517.10$ $76,460,150.00 130.36$ $7,646,015.00 13.04$ Polk 79,358 $ 16.17 1,283,111.84$ $62,692,820.00 48.86$ $6,269,282.00 4.89$ Putnam 1,708 $ 12.91 22,056.23$ $1,349,320.00 61.18$ $134,932.00 6.12$ Santa Rosa 3,076 $ 13.97 42,966.72$ $2,430,040.00 56.56$ $243,004.00 5.66$ Sarasota 74,092 $ 9.94 736,761.51$ $58,532,680.00 79.45$ $5,853,268.00 7.94$ Seminole 40,475 $ 8.92 361,187.71$ $31,975,250.00 88.53$ $3,197,525.00 8.85$ St Johns 25,017 $ 12.53 313,503.51$ $19,763,430.00 63.04$ $1,976,343.00 6.30$ St Lucie 12,356 $ 8.51 105,165.07$ $9,761,240.00 92.82$ $976,124.00 9.28$ Sumter 15,637 $ 14.11 220,707.32$ $12,353,230.00 55.97$ $1,235,323.00 5.60$ Suwannee 11,235 $ 6.87 77,229.51$ $8,875,650.00 114.93$ $887,565.00 11.49$ Taylor 1,380 $ 17.71 24,440.32$ $1,090,200.00 44.61$ $109,020.00 4.46$ Union 1,397 $ 13.72 19,172.80$ $1,103,630.00 57.56$ $110,363.00 5.76$ Volusia 15,596 $ 8.64 134,728.74$ $12,320,840.00 91.45$ $1,232,084.00 9.14$ Wakulla 5,319 $ 14.29 76,013.80$ $4,202,010.00 55.28$ $420,201.00 5.53$ Walton 6,418 $ 9.98 64,043.69$ $5,070,220.00 79.17$ $507,022.00 7.92$ Washington 166 $ 10.66 1,770.28$ $131,140.00 74.08$ $13,114.00 7.41$ Total 8,055,814 17.50$ 50,812,200.65$ $6,364,093,060.00 125.25$ $636,409,306.00 12.52$
Nutritional Table: Column A: County Name Column B: Number of nutritional trips taken. Source: Annual Operating Report 2007, Transportation Disadvantaged Commission. http://www.dot.state.fl.us/ctd/docs/APR/2007/2007%20FINAL%20APR.pdfColumn C: Cost per trip.Source: Annual Operating Report 2007, Transportation Disadvantaged Commission. http://www.dot.state.fl.us/ctd/docs/APR/2007/2007%20FINAL%20APR.pdfColumn D: Total cost of trips, found by multiplying Column B and Column C Column E: Total benefit if trips prevented 10% of passengers from entering the hospital. Calculated as Column B*.10*$7900. $7900is average cost per hospital stay. Source: HCUP Fact Book, Agency for Healthcare Research and Quality, “Statistics on Hospital-Based Care in the United States, 2005”,http://www.hcup-us.ahrq.gov/reports/factsandfigures/HAR_2005.pdf Column F: Payoff per dollar. Column E/Column D Column G: Same as Column E, but with a usage of 1% Column H: Payoff per dollar. Column G/Column D
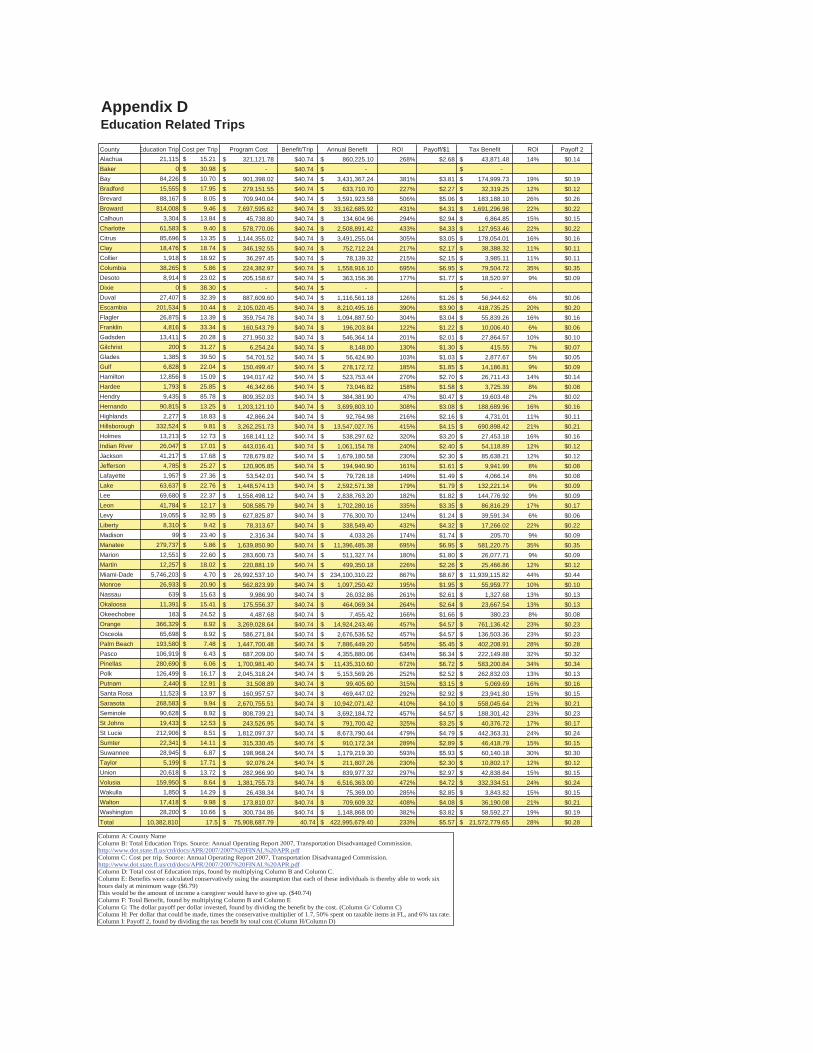
Appendix DEducation Related Trips
County Education TripsCost per Trip Program Cost Benefit/Trip Annual Benefit ROI Payoff/$1 Tax Benefit ROI Payoff 2Alachua 21,115 $ 15.21 321,121.78$ $40.74 860,225.10$ 268% $2.68 43,871.48$ 14% $0.14Baker 0 $ 30.98 -$ $40.74 -$ -$ Bay 84,226 $ 10.70 901,398.02$ $40.74 3,431,367.24$ 381% $3.81 174,999.73$ 19% $0.19Bradford 15,555 $ 17.95 279,151.55$ $40.74 633,710.70$ 227% $2.27 32,319.25$ 12% $0.12Brevard 88,167 $ 8.05 709,940.04$ $40.74 3,591,923.58$ 506% $5.06 183,188.10$ 26% $0.26Broward 814,008 $ 9.46 7,697,595.62$ $40.74 33,162,685.92$ 431% $4.31 1,691,296.98$ 22% $0.22Calhoun 3,304 $ 13.84 45,738.80$ $40.74 134,604.96$ 294% $2.94 6,864.85$ 15% $0.15Charlotte 61,583 $ 9.40 578,770.06$ $40.74 2,508,891.42$ 433% $4.33 127,953.46$ 22% $0.22Citrus 85,696 $ 13.35 1,144,355.02$ $40.74 3,491,255.04$ 305% $3.05 178,054.01$ 16% $0.16Clay 18,476 $ 18.74 346,192.55$ $40.74 752,712.24$ 217% $2.17 38,388.32$ 11% $0.11Collier 1,918 $ 18.92 36,297.45$ $40.74 78,139.32$ 215% $2.15 3,985.11$ 11% $0.11Columbia 38,265 $ 5.86 224,382.97$ $40.74 1,558,916.10$ 695% $6.95 79,504.72$ 35% $0.35Desoto 8,914 $ 23.02 205,158.67$ $40.74 363,156.36$ 177% $1.77 18,520.97$ 9% $0.09Dixie 0 $ 38.30 -$ $40.74 -$ -$ Duval 27,407 $ 32.39 887,609.60$ $40.74 1,116,561.18$ 126% $1.26 56,944.62$ 6% $0.06Escambia 201,534 $ 10.44 2,105,020.45$ $40.74 8,210,495.16$ 390% $3.90 418,735.25$ 20% $0.20Flagler 26,875 $ 13.39 359,754.78$ $40.74 1,094,887.50$ 304% $3.04 55,839.26$ 16% $0.16Franklin 4,816 $ 33.34 160,543.79$ $40.74 196,203.84$ 122% $1.22 10,006.40$ 6% $0.06Gadsden 13,411 $ 20.28 271,950.32$ $40.74 546,364.14$ 201% $2.01 27,864.57$ 10% $0.10Gilchrist 200 $ 31.27 6,254.24$ $40.74 8,148.00$ 130% $1.30 415.55$ 7% $0.07Glades 1,385 $ 39.50 54,701.52$ $40.74 56,424.90$ 103% $1.03 2,877.67$ 5% $0.05Gulf 6,828 $ 22.04 150,499.47$ $40.74 278,172.72$ 185% $1.85 14,186.81$ 9% $0.09Hamilton 12,856 $ 15.09 194,017.42$ $40.74 523,753.44$ 270% $2.70 26,711.43$ 14% $0.14Hardee 1,793 $ 25.85 46,342.66$ $40.74 73,046.82$ 158% $1.58 3,725.39$ 8% $0.08Hendry 9,435 $ 85.78 809,352.03$ $40.74 384,381.90$ 47% $0.47 19,603.48$ 2% $0.02Hernando 90,815 $ 13.25 1,203,121.10$ $40.74 3,699,803.10$ 308% $3.08 188,689.96$ 16% $0.16Highlands 2,277 $ 18.83 42,866.24$ $40.74 92,764.98$ 216% $2.16 4,731.01$ 11% $0.11Hillsborough 332,524 $ 9.81 3,262,251.73$ $40.74 13,547,027.76$ 415% $4.15 690,898.42$ 21% $0.21Holmes 13,213 $ 12.73 168,141.12$ $40.74 538,297.62$ 320% $3.20 27,453.18$ 16% $0.16Indian River 26,047 $ 17.01 443,016.41$ $40.74 1,061,154.78$ 240% $2.40 54,118.89$ 12% $0.12Jackson 41,217 $ 17.68 728,679.82$ $40.74 1,679,180.58$ 230% $2.30 85,638.21$ 12% $0.12Jefferson 4,785 $ 25.27 120,905.85$ $40.74 194,940.90$ 161% $1.61 9,941.99$ 8% $0.08Lafayette 1,957 $ 27.36 53,542.01$ $40.74 79,728.18$ 149% $1.49 4,066.14$ 8% $0.08Lake 63,637 $ 22.76 1,448,574.13$ $40.74 2,592,571.38$ 179% $1.79 132,221.14$ 9% $0.09Lee 69,680 $ 22.37 1,558,498.12$ $40.74 2,838,763.20$ 182% $1.82 144,776.92$ 9% $0.09Leon 41,784 $ 12.17 508,585.79$ $40.74 1,702,280.16$ 335% $3.35 86,816.29$ 17% $0.17Levy 19,055 $ 32.95 627,825.87$ $40.74 776,300.70$ 124% $1.24 39,591.34$ 6% $0.06Liberty 8,310 $ 9.42 78,313.67$ $40.74 338,549.40$ 432% $4.32 17,266.02$ 22% $0.22Madison 99 $ 23.40 2,316.34$ $40.74 4,033.26$ 174% $1.74 205.70$ 9% $0.09Manatee 279,737 $ 5.86 1,639,850.90$ $40.74 11,396,485.38$ 695% $6.95 581,220.75$ 35% $0.35Marion 12,551 $ 22.60 283,600.73$ $40.74 511,327.74$ 180% $1.80 26,077.71$ 9% $0.09Martin 12,257 $ 18.02 220,881.19$ $40.74 499,350.18$ 226% $2.26 25,466.86$ 12% $0.12Miami-Dade 5,746,203 $ 4.70 26,992,537.10$ $40.74 234,100,310.22$ 867% $8.67 11,939,115.82$ 44% $0.44Monroe 26,933 $ 20.90 562,823.99$ $40.74 1,097,250.42$ 195% $1.95 55,959.77$ 10% $0.10Nassau 639 $ 15.63 9,986.90$ $40.74 26,032.86$ 261% $2.61 1,327.68$ 13% $0.13Okaloosa 11,391 $ 15.41 175,556.37$ $40.74 464,069.34$ 264% $2.64 23,667.54$ 13% $0.13Okeechobee 183 $ 24.52 4,487.68$ $40.74 7,455.42$ 166% $1.66 380.23$ 8% $0.08Orange 366,329 $ 8.92 3,269,028.64$ $40.74 14,924,243.46$ 457% $4.57 761,136.42$ 23% $0.23Osceola 65,698 $ 8.92 586,271.84$ $40.74 2,676,536.52$ 457% $4.57 136,503.36$ 23% $0.23Palm Beach 193,580 $ 7.48 1,447,700.48$ $40.74 7,886,449.20$ 545% $5.45 402,208.91$ 28% $0.28Pasco 106,919 $ 6.43 687,209.00$ $40.74 4,355,880.06$ 634% $6.34 222,149.88$ 32% $0.32Pinellas 280,690 $ 6.06 1,700,981.40$ $40.74 11,435,310.60$ 672% $6.72 583,200.84$ 34% $0.34Polk 126,499 $ 16.17 2,045,318.24$ $40.74 5,153,569.26$ 252% $2.52 262,832.03$ 13% $0.13Putnam 2,440 $ 12.91 31,508.89$ $40.74 99,405.60$ 315% $3.15 5,069.69$ 16% $0.16Santa Rosa 11,523 $ 13.97 160,957.57$ $40.74 469,447.02$ 292% $2.92 23,941.80$ 15% $0.15Sarasota 268,583 $ 9.94 2,670,755.51$ $40.74 10,942,071.42$ 410% $4.10 558,045.64$ 21% $0.21Seminole 90,628 $ 8.92 808,739.21$ $40.74 3,692,184.72$ 457% $4.57 188,301.42$ 23% $0.23St Johns 19,433 $ 12.53 243,526.95$ $40.74 791,700.42$ 325% $3.25 40,376.72$ 17% $0.17St Lucie 212,906 $ 8.51 1,812,097.37$ $40.74 8,673,790.44$ 479% $4.79 442,363.31$ 24% $0.24Sumter 22,341 $ 14.11 315,330.45$ $40.74 910,172.34$ 289% $2.89 46,418.79$ 15% $0.15Suwannee 28,945 $ 6.87 198,968.24$ $40.74 1,179,219.30$ 593% $5.93 60,140.18$ 30% $0.30Taylor 5,199 $ 17.71 92,076.24$ $40.74 211,807.26$ 230% $2.30 10,802.17$ 12% $0.12Union 20,618 $ 13.72 282,966.90$ $40.74 839,977.32$ 297% $2.97 42,838.84$ 15% $0.15Volusia 159,950 $ 8.64 1,381,755.73$ $40.74 6,516,363.00$ 472% $4.72 332,334.51$ 24% $0.24Wakulla 1,850 $ 14.29 26,438.34$ $40.74 75,369.00$ 285% $2.85 3,843.82$ 15% $0.15Walton 17,418 $ 9.98 173,810.07$ $40.74 709,609.32$ 408% $4.08 36,190.08$ 21% $0.21Washington 28,200 $ 10.66 300,734.86$ $40.74 1,148,868.00$ 382% $3.82 58,592.27$ 19% $0.19Total 10,382,810 17.5 75,908,687.79$ 40.74 422,995,679.40$ 233% $5.57 21,572,779.65$ 28% $0.28
Column A: County Name Column B: Total Education Trips. Source: Annual Operating Report 2007, Transportation Disadvantaged Commission. http://www.dot.state.fl.us/ctd/docs/APR/2007/2007%20FINAL%20APR.pdfColumn C: Cost per trip. Source: Annual Operating Report 2007, Transportation Disadvantaged Commission. http://www.dot.state.fl.us/ctd/docs/APR/2007/2007%20FINAL%20APR.pdfColumn D: Total cost of Education trips, found by multiplying Column B and Column C. Column E: Benefits were calculated conservatively using the assumption that each of these individuals is thereby able to work six hours daily at minimum wage ($6.79) This would be the amount of income a caregiver would have to give up. ($40.74) Column F: Total Benefit, found by multiplying Column B and Column E Column G: The dollar payoff per dollar invested, found by dividing the benefit by the cost. (Column G/ Column C) Column H: Per dollar that could be made, times the conservative multiplier of 1.7, 50% spent on taxable items in FL, and 6% tax rate. Column I: Payoff 2, found by dividing the tax benefit by total cost (Column H/Column D)

Appendix ELife-Sustaining/Other Trips
County Life SustainingCost per trip Program Cost Benefit Annual Benefit Multiplier FL Direct Benefit Tax Tax Revenue Payoff 1 Payoff 2Alachua 15,877 $ 15.21 241,461.07$ $20 317,540.00$ 1.7 539,818.00$ 6% 32,389.08$ $2.24 $0.13Baker 1,941 $ 30.98 60,130.99$ $20 38,820.00$ 1.7 65,994.00$ 6% 3,959.64$ $1.10 $0.07Bay 405 $ 10.70 4,334.36$ $20 8,100.00$ 1.7 13,770.00$ 6% 826.20$ $3.18 $0.19Bradford 1,138 $ 17.95 20,422.66$ $20 22,760.00$ 1.7 38,692.00$ 6% 2,321.52$ $1.89 $0.11Brevard 217,028 $ 8.05 1,747,557.09$ $20 4,340,560.00$ 1.7 7,378,952.00$ 6% 442,737.12$ $4.22 $0.25Broward 832,031 $ 9.46 7,868,028.55$ $20 16,640,620.00$ 1.7 28,289,054.00$ 6% 1,697,343.24$ $3.60 $0.22Calhoun 11,190 $ 13.84 154,908.35$ $20 223,800.00$ 1.7 380,460.00$ 6% 22,827.60$ $2.46 $0.15Charlotte 7,680 $ 9.40 72,178.26$ $20 153,600.00$ 1.7 261,120.00$ 6% 15,667.20$ $3.62 $0.22Citrus 28,479 $ 13.35 380,298.81$ $20 569,580.00$ 1.7 968,286.00$ 6% 58,097.16$ $2.55 $0.15Clay 5,128 $ 18.74 96,085.48$ $20 102,560.00$ 1.7 174,352.00$ 6% 10,461.12$ $1.81 $0.11Collier 61,650 $ 18.92 1,166,703.69$ $20 1,233,000.00$ 1.7 2,096,100.00$ 6% 125,766.00$ $1.80 $0.11Columbia 2,145 $ 5.86 12,578.11$ $20 42,900.00$ 1.7 72,930.00$ 6% 4,375.80$ $5.80 $0.35Desoto 2,945 $ 23.02 67,780.15$ $20 58,900.00$ 1.7 100,130.00$ 6% 6,007.80$ $1.48 $0.09Dixie 128 $ 38.30 4,902.67$ $20 2,560.00$ 1.7 4,352.00$ 6% 261.12$ $0.89 $0.05Duval 200,813 $ 32.39 6,503,577.44$ $20 4,016,260.00$ 1.7 6,827,642.00$ 6% 409,658.52$ $1.05 $0.06Escambia 27,926 $ 10.44 291,686.77$ $20 558,520.00$ 1.7 949,484.00$ 6% 56,969.04$ $3.26 $0.20Flagler 11,414 $ 13.39 152,790.37$ $20 228,280.00$ 1.7 388,076.00$ 6% 23,284.56$ $2.54 $0.15Franklin 4,984 $ 33.34 166,144.15$ $20 99,680.00$ 1.7 169,456.00$ 6% 10,167.36$ $1.02 $0.06Gadsden 3,631 $ 20.28 73,629.98$ $20 72,620.00$ 1.7 123,454.00$ 6% 7,407.24$ $1.68 $0.10Gilchrist 257 $ 31.27 8,036.70$ $20 5,140.00$ 1.7 8,738.00$ 6% 524.28$ $1.09 $0.07Glades 53 $ 39.50 2,093.27$ $20 1,060.00$ 1.7 1,802.00$ 6% 108.12$ $0.86 $0.05Gulf 1,155 $ 22.04 25,457.95$ $20 23,100.00$ 1.7 39,270.00$ 6% 2,356.20$ $1.54 $0.09Hamilton 9,371 $ 15.09 141,423.24$ $20 187,420.00$ 1.7 318,614.00$ 6% 19,116.84$ $2.25 $0.14Hardee 3,887 $ 25.85 100,465.10$ $20 77,740.00$ 1.7 132,158.00$ 6% 7,929.48$ $1.32 $0.08Hendry 178 $ 85.78 15,269.17$ $20 3,560.00$ 1.7 6,052.00$ 6% 363.12$ $0.40 $0.02Hernando 4,361 $ 13.25 57,774.72$ $20 87,220.00$ 1.7 148,274.00$ 6% 8,896.44$ $2.57 $0.15Highlands 7,424 $ 18.83 139,762.40$ $20 148,480.00$ 1.7 252,416.00$ 6% 15,144.96$ $1.81 $0.11
Hillsborough 292,479 $ 9.81 2,869,387.24$ $20 5,849,580.00$ 1.7 9,944,286.00$ 6% 596,657.16$ $3.47 $0.21Holmes 44 $ 12.73 559.92$ $20 880.00$ 1.7 1,496.00$ 6% 89.76$ $2.67 $0.16Indian River 24,723 $ 17.01 420,497.36$ $20 494,460.00$ 1.7 840,582.00$ 6% 50,434.92$ $2.00 $0.12Jackson 5,844 $ 17.68 103,316.71$ $20 116,880.00$ 1.7 198,696.00$ 6% 11,921.76$ $1.92 $0.12Jefferson 944 $ 25.27 23,852.69$ $20 18,880.00$ 1.7 32,096.00$ 6% 1,925.76$ $1.35 $0.08Lafayette 225 $ 27.36 6,155.83$ $20 4,500.00$ 1.7 7,650.00$ 6% 459.00$ $1.24 $0.07Lake 21,007 $ 22.76 478,184.02$ $20 420,140.00$ 1.7 714,238.00$ 6% 42,854.28$ $1.49 $0.09Lee 20,737 $ 22.37 463,814.23$ $20 414,740.00$ 1.7 705,058.00$ 6% 42,303.48$ $1.52 $0.09Leon 9,309 $ 12.17 113,307.13$ $20 186,180.00$ 1.7 316,506.00$ 6% 18,990.36$ $2.79 $0.17Levy 1,894 $ 32.95 62,403.68$ $20 37,880.00$ 1.7 64,396.00$ 6% 3,863.76$ $1.03 $0.06Liberty 4,680 $ 9.42 44,104.45$ $20 93,600.00$ 1.7 159,120.00$ 6% 9,547.20$ $3.61 $0.22Madison 2,960 $ 23.40 69,256.21$ $20 59,200.00$ 1.7 100,640.00$ 6% 6,038.40$ $1.45 $0.09Manatee 38,063 $ 5.86 223,129.74$ $20 761,260.00$ 1.7 1,294,142.00$ 6% 77,648.52$ $5.80 $0.35Marion 5,379 $ 22.60 121,543.17$ $20 107,580.00$ 1.7 182,886.00$ 6% 10,973.16$ $1.50 $0.09Martin 62,565 $ 18.02 1,127,472.62$ $20 1,251,300.00$ 1.7 2,127,210.00$ 6% 127,632.60$ $1.89 $0.11Miami-Dade 4,020,904 $ 4.70 18,888,020.56$ $20 80,418,080.00$ 1.7 136,710,736.00$ 6% 8,202,644.16$ $7.24 $0.43Monroe 40,127 $ 20.90 838,541.50$ $20 802,540.00$ 1.7 1,364,318.00$ 6% 81,859.08$ $1.63 $0.10Nassau 3,725 $ 15.63 58,217.84$ $20 74,500.00$ 1.7 126,650.00$ 6% 7,599.00$ $2.18 $0.13Okaloosa 5,387 $ 15.41 83,023.63$ $20 107,740.00$ 1.7 183,158.00$ 6% 10,989.48$ $2.21 $0.13
Okeechobee 3,176 $ 24.52 77,884.59$ $20 63,520.00$ 1.7 107,984.00$ 6% 6,479.04$ $1.39 $0.08Orange 213,043 $ 8.92 1,901,142.60$ $20 4,260,860.00$ 1.7 7,243,462.00$ 6% 434,607.72$ $3.81 $0.23Osceola 38,206 $ 8.92 340,940.39$ $20 764,120.00$ 1.7 1,299,004.00$ 6% 77,940.24$ $3.81 $0.23Palm Beach 735,605 $ 7.48 5,501,269.29$ $20 14,712,100.00$ 1.7 25,010,570.00$ 6% 1,500,634.20$ $4.55 $0.27Pasco 47,796 $ 6.43 307,203.03$ $20 955,920.00$ 1.7 1,625,064.00$ 6% 97,503.84$ $5.29 $0.32Pinellas 402,909 $ 6.06 2,441,628.54$ $20 8,058,180.00$ 1.7 13,698,906.00$ 6% 821,934.36$ $5.61 $0.34Polk 46,416 $ 16.17 750,484.13$ $20 928,320.00$ 1.7 1,578,144.00$ 6% 94,688.64$ $2.10 $0.13Putnam 49,041 $ 12.91 633,290.02$ $20 980,820.00$ 1.7 1,667,394.00$ 6% 100,043.64$ $2.63 $0.16Santa Rosa 8,134 $ 13.97 113,618.75$ $20 162,680.00$ 1.7 276,556.00$ 6% 16,593.36$ $2.43 $0.15Sarasota 92,614 $ 9.94 920,941.94$ $20 1,852,280.00$ 1.7 3,148,876.00$ 6% 188,932.56$ $3.42 $0.21Seminole 52,707 $ 8.92 470,342.69$ $20 1,054,140.00$ 1.7 1,792,038.00$ 6% 107,522.28$ $3.81 $0.23St Johns 98,527 $ 12.53 1,234,702.80$ $20 1,970,540.00$ 1.7 3,349,918.00$ 6% 200,995.08$ $2.71 $0.16St Lucie 72,259 $ 8.51 615,014.81$ $20 1,445,180.00$ 1.7 2,456,806.00$ 6% 147,408.36$ $3.99 $0.24Sumter 64,053 $ 14.11 904,071.49$ $20 1,281,060.00$ 1.7 2,177,802.00$ 6% 130,668.12$ $2.41 $0.14Suwannee 5,493 $ 6.87 37,758.94$ $20 109,860.00$ 1.7 186,762.00$ 6% 11,205.72$ $4.95 $0.30Taylor 4,855 $ 17.71 85,983.87$ $20 97,100.00$ 1.7 165,070.00$ 6% 9,904.20$ $1.92 $0.12Union 329 $ 13.72 4,515.28$ $20 6,580.00$ 1.7 11,186.00$ 6% 671.16$ $2.48 $0.15Volusia 211,276 $ 8.64 1,825,144.25$ $20 4,225,520.00$ 1.7 7,183,384.00$ 6% 431,003.04$ $3.94 $0.24Wakulla 4,679 $ 14.29 66,867.57$ $20 93,580.00$ 1.7 159,086.00$ 6% 9,545.16$ $2.38 $0.14Walton 4,069 $ 9.98 40,603.58$ $20 81,380.00$ 1.7 138,346.00$ 6% 8,300.76$ $3.41 $0.20Washington 152 $ 10.66 1,620.98$ $20 3,040.00$ 1.7 5,168.00$ 6% 310.08$ $3.19 $0.19Total 8,179,554 63,845,299.62$ 163,591,080.00$ 278,104,836.00$ 16,686,290.16$ $4.36 $0.26
Column A: County Name Column B: Total Life-Sustaining Trips. Source: Annual Operating Report 2007, Transportation Disadvantaged Commission. http://www.dot.state.fl.us/ctd/docs/APR/2007/2007%20FINAL%20APR.pdfColumn C: Cost per trip. Source: Annual Operating Report 2007, Transportation Disadvantaged Commission. http://www.dot.state.fl.us/ctd/docs/APR/2007/2007%20FINAL%20APR.pdfColumn D: Number of life-sustaining trips reported multiplied by the cost per trip. Column E: Benefits were calculated conservatively using the assumption that each of these individuals spent $20 a trip on items other than food. Column F: Number of trips times the benefit per trip. Column G: Conservatively estimated multiplier of 1.7 Column H: Column F times Column G Column I: Tax rate of 6% Column J: FL Direct Benefit multiplied by the tax rate produces tax revenue. Column K: Payoff 1: Column F divided by Column D Column L: The payoff per dollar 2 is found by dividing the benefit by the cost. Column J divided by Column D.