Embed Size (px)
Citation preview
This is the author's manuscript of the article published in final edited form as: Walk, M., Greenspan, I., Crossley, H., & Handy, F. (2015). Social Return on Investment Analysis. Nonprofit Management and Leadership, 26(2), 129–144. http://doi.org/10.1002/nml.21190
Social Return on Investment Analysis: A Case Study of a Job and Skills Training Program Offered by a
Social Enterprise
Marlene Walk, Itay Greenspan, Honey Crossle, and Femida Handy
Keywords: social enterprise; social return on investment; case study research
Abstract
This article uses a social return on investment (SROI) methodology to analyze the social impact
of a social enterprise offering a job and skills training program to an unemployed, largely female
population. The social enterprise is based in Toronto (Canada) and run by a nonprofit agency dedicated
to the advancement and empowerment of women, primarily immigrants, through access to
employment. We focus our analysis on a job and skills training program that provides clients with the
skills and tools that they need to successfully seek employment in their efforts to (re-)enter the
Canadian labor market. Our goal is to determine the tangible and intangible program outcomes by
applying and testing the SROI methodology.
2
Unemployment has severe consequences for individuals and families because it may lead to
negative experiences of social exclusion (Schmid and Gazier 2002) and life in poverty (Gallie, Paugam,
and Jacobs 2003). However, gaining access to the labor market can be extremely difficult for
unemployed individuals, especially for certain marginalized subgroups such as women (International
Labor Office 2010; O'Connor 2000) and first-generation immigrants (Zietsma 2007). For women, both
individual factors, such as taking care of the family and child rearing, and structural factors, such as
welfare state regulations, hinder their success in the labor market (Stier, Lewin-Epstein, and Braun
2001). Successfully accessing the labor market is even more challenging for female immigrants,
especially women of color, leading to frustrating migration and job search experiences (Creese and
Wiebe 2012; Tastsoglou and Preston 2012). For instance, first-generation immigrants face various
discriminatory barriers to full integration into a host society. These barriers include, among others,
adapting to a new language, difficulty accessing services, and the devaluation of existing skills and
undervaluation of credentials from their countries of origin (Aydemir and Skuterud 2005; Handy and
Greenspan 2009; Reitz 2001; Walk et al. 2014).
Social enterprises—defined as organizations that aim to achieve a social goal by breaking even
(or even making a profit) through the sale of services (Quarter, Ryan, and Chan 2015)—have been
regarded as valuable organizational venues for mitigating social exclusion (Kerlin 2010), for example,
through the provision of skill and employment training programs to unemployed individuals (Spear and
Bidet 2005; Vidal 2005). Investment in skills-training services that target the development of job skills for
immigrants and other marginalized groups can facilitate a successful integration into sustainable
employment (Cohen-Goldner and Eckstein 2010). Skills-training programs have benefits beyond the
acquisition of skills. For participants, these programs boost self-esteem and self-efficacy (Creed,
Bloxsome, and Johnston 2001). For employers, they offer increased diversity in the workforce (Kirsh et
al. 2010), and such programs create an improved sense of belonging to the community for participants
3
(Corbiere and Lecomte 2009; Tastsoglou and Preston 2012). However, the continuation of these skills-
training programs might be challenged in coming years, as public funding shifts toward short-term
employment programs without a skills-training component (that is, applied, hands-on workshops or
internships; Creese and Wiebe 2012). It is here that demonstrating the social impact of a job training
program run by a social enterprise might provide arguments in favor of these programs and,
consequentially, contribute to reversing this defunding trend.
This article uses a social return on investment (SROI) approach to examine the benefits of a job
and skills training program administered by a Canadian nonprofit organization. Our goal is to better
understand the social impact of this program in the field of work integration by specifically including the
clients’ perspectives. We focus on a particular social enterprise offering a job and skills training program;
this social enterprise is a registered private career college and is run by a nonprofit agency serving an
unemployed, largely female population that is predominantly first- or second-generation immigrants in
Toronto, Canada.
We first present a general description of the case study that we analyzed: the Working Skills
Centre (WSC), its social enterprise Academy of Computer & Employment Skills (A.C.E.S.), and the job and
skills training program that is the focus of our analysis. We then discuss the SROI methodology and
engage in the analysis of the social value of the job and skills training program. Last, discussion and
implications are offered. Given the increasing importance of program evaluation to justify funding,
political support, and agency reputation, this analysis offers a useful platform for scholars and
practitioners wishing to utilize the SROI approach for the study of nonprofits and their social enterprises.
Background
Access to the Canadian Labor Market
4
Access to the labor market can provide serious barriers to individuals seeking employment.
Recent statistics show that among the general unemployed population, average length of
unemployment was approximately twenty consecutive weeks (Employment and Social Development
Canada 2012). Individuals living in Ontario—where the WSC is located—experience, on average, 21.8
weeks without work. The average unemployment rate in Canada was 6.9 percent in 2014, but is almost
doubled (12.9 percent) among immigrants who arrived fewer than five years ago (average
unemployment among all immigrants was 7.8 percent in 2014) (Statistics Canada 2015b). Generally,
unemployment rates for women are lower than those of men (5.2 percent vs. 6 percent for the 24–54
year old; 4.9 percent versus 6.4 percent for those ages 55 and older); however, women have a lower
share of overall labor market participation when compared to men (82.1 percent versus 90.80 percent
for the 24–54 year old; 31.3 percent versus 43.4 percent for those 55 and older) (Statistics Canada
2015c). Moreover, women in Canada participate less hours and earn less (mean earnings and hourly
wages are lower) than men across education levels; this trend is even more pronounced for mothers
than for non-mothers (Sigle-Rushton and Waldfogel 2007). Reasons for these differences can be
attributed to individual factors such as family situation, but structural factors such as welfare state
regulations might also influence women's success in the labor market (Stier et al. 2001).
As indicated previously, access to the labor market is even more challenging for relatively recent
immigrants, especially female immigrants (Creese and Wiebe 2012; Tastsoglou and Preston 2012). Even
though most of the immigrants arriving in Canada are highly educated (Statistics Canada 2015a), they
face various barriers when attempting to access the labor market. Adapting to a new language is one of
the most profound barriers in accessing the labor market (Aycan and Berry 1996; Aydemir and Skuterud
2005). Correspondingly, only about 9.5 percent of immigrants arriving in 2013 reported English as their
mother tongue (Citizenship and Immigration Canada 2013). Moreover, Canadian immigrants frequently
5
encounter difficulties in getting their previously earned credentials acknowledged (Aycan and Berry
1996; Bauder 2003; Reitz 2001).
It is here that A.C.E.S. might have a distinct social impact in helping members of its largely
female and partially immigration-experienced population to access the labor market.
Organizational Setting: The Case of Working Skills Centre
Established in 1978, WSC describes itself as “an innovative, community-based, non-profit,
charitable organization that empowers immigrants, primarily women” whose mission is “to prepare our
clients to fully participate in Canadian society by providing skills training, work experiences, and
settlement services that ultimately lead to employment” (Working Skills Centre n.d.).
The WSC serves as many as 3,200 clients annually through settlement services, job placement,
professional development, and skills training. The client population is largely unemployed,
predominantly female, and first- or second-generation immigrants, though the number of Canadian-
born clients has increased in recent years. In 2008, WSC's longstanding community-based training
programs were registered as a private career college under Ontario's Private Career Colleges Act (2005).
The new career college, known as the Academy of Computer & Employment Skills, or A.C.E.S., has
operated as a social enterprise since its inception. The lion's share of program revenues stems from
contracts with third parties, primarily with the City of Toronto. Other revenue sources are provincial
funds through social assistance, fee-paying clients, and corporate and individual donors, which help to
fund scholarships and bursaries for selected student-clients. This funding structure fits the definition of a
“supported social enterprise” (Mook et al., 2015).
A.C.E.S. runs a job and skills training program that awards diploma certificates for a variety of
courses such as office administration, computerized accounting, and medical reception. All courses are
6
composed of three modules: (1) a six-month academic training, (2) a six-week internship, and (3) a job
search support component. During the six-month (600 hours) training, students attend classes five days
a week (9:00 a.m. to 4:00 p.m.) on a range of topics such as Microsoft Office applications, SAP, and
office procedures. Hands-on workshops and small-size classes ensure that the students receive both
group and one-on-one instruction in an environment that mirrors a professional work setting. Program
graduates apply the learned skills and gain practical experience during the subsequent six-week
internship. This is followed by a six-month support period during which A.C.E.S. provides to graduates
job search and job maintenance assistance such as preparation of résumés and pro bono mock
interviews.
Potential students can learn about the job and skills training program by attending information
sessions that are held regularly at WSC, by referrals that social assistance caseworkers give out to their
clients, by WSC's outreach and advertisement efforts, or by former students who frequently refer
friends and acquaintances to the program. Because A.C.E.S. is a vocational program regulated by
provincial legislation, clients must meet eligibility requirements upon enrollment. As a result, it is the
agency rather than client's choice that determines final enrollment decisions. Students need to be
eighteen years or older, commit to attend the training for its entire duration, have a certain level of
English language proficiency and basic computer literacy, and hold at least a Secondary School
Graduation Diploma or an equivalent. Prior to acceptance decisions, interested clients must complete
English, math, and computer literacy assessments and go through an interview with WSC employment
counselors to assess job readiness and employability. An admissions team makes the final decision for
enrollment because demand continually exceeds supply. Spaces in the training program are thus offered
to those candidates who are most likely to be successful. Individuals can enroll to the program free of
charge if they receive social assistance (Ontario Welfare) from the provincial welfare system. In 2012—
the focus year for this SROI—about 89 percent of training participants received social assistance.
7
Agency records collected at six and twelve months after program completion suggest that
students have a 70 percent success rate in finding employment. Anecdotal evidence from informal
interviews with staff and former clients and an evaluation of pre- and post-training program satisfaction
suggest that even those students unable to find immediate employment benefit from the program by
learning workplace customs and culture such as punctuality, adhering to procedures, and regular
attendance (Walk et al. 2015). At the same time, the empirical data also suggest that clients’ pre-training
expectations are not completely aligned with their post-training outcomes (Walk et al. 2015). As such,
clients tend to underestimate the time and energy that is necessary to obtain employment but are
positively surprised by other changes in their lives such as an improved ability to handle finances.
SROI of the A.C.E.S. Job and Skills Training Program
To better understand the social value that the job and skills training program creates in the lives
of clients and to demonstrate the program's social impact to funders, potential employers, and other
stakeholders, a study using a social return on investment methodology was undertaken. The SROI
methodology is meant to capture social value that is not usually reflected in conventional financial
accounts (Maier et al. 2014; Nicholls et al. 2012); as such, the SROI considers both the tangible (that is,
employment) and intangible (for example, improved well-being, family relations) outcomes of the
evaluated program. The SROI method we used for this study draws on clients’ evaluations of the distinct
impacts and assigns financial proxies to the impacts that do not usually have a monetary value. Giving
stakeholders, in our case A.C.E.S. clients, a voice in the financial evaluation process is important because
it draws attention to the social mission of the social enterprise (Maier et al. 2014). Furthermore, the
SROI results help the social enterprise to better communicate the relationship between the inputs and
the ultimate outcomes to a whole range of stakeholders (for example, clients, funders, volunteers,
8
instructors, future employers), thus increasing transparency and accountability (Rotheroe and Richards
2007).
The SROI method is based on conventional cost-benefit analysis, a systematic process for
calculating benefits and costs of a project or program and ultimately used for decision making by
government or other funders (Cellini and Kee 2010). The SROI, however, takes cost-benefit analysis a
step further in assigning monetary values to other returns, such as social or environmental, to
demonstrate a holistic view of the value that has been created and is specifically targeted to inform the
decision making of practitioners in social enterprises and (potential) funders. The SROI assesses the
worth of the social outcomes created by a social enterprise and puts these in relationship with the
relative costs needed to achieve these outcomes (Rotheroe and Richards 2007). The SROI ratio is, thus, a
measure of monetized social value. This study followed a six-stage SROI method suggested by the SROI
Network and is outlined next (Nicholls et al. 2012; SROI Network 2013). Although still a new
methodology, SROI studies have been commonly used in the work integration field (Krlev, Münscher,
and Mülbert 2013). In the presentation that follows, we illustrate both the process and the results of the
SROI. To avoid over-claiming and to ensure transparency, we adopt conservative assumptions whenever
possible.
Stage 1: Establishing Scope and Identifying Stakeholders
In this SROI analysis we wanted to demonstrate the value that the job and skills training
program creates. Our goal was to have practical implications for WSC and to communicate these
findings and implications to funders and supporters of the agency. Indeed, WSC hopes to use this SROI
analysis to better understand the ways its social enterprise A.C.E.S. achieves positive change in the lives
of its clients, and to demonstrate the program's impact to the City of Toronto and other program
9
funders to ensure continued funding and to identify possible ways to improve the program content and
administrative setup. The main stakeholder groups of the studied initiative are clients (program
participants), WSC staff, freelance and full-time instructors, volunteers, and funders. We focus on direct
involvement of clients, because they constitute the most important and most immediately affected
stakeholder group. Our decision was also guided by constraints of money and time.
Stage 2: Mapping Outcomes
A central feature of the SROI analysis is the development of a theory of change that illustrates
the pathway of how an organization or an initiative (in our case, WSC and A.C.E.S.) enacts change,
thereby achieving its mission in a way that is both socially and economically sound.
WSC's theory of change is presented in Figure 1. Based on the theory of change, we built our
impact map, which details how the job and skills training program uses certain resources (“inputs”)
processed by enacting certain “activities” with tangible deliverables (measured as “outputs”), and
resulting in short- and long-term outcomes for stakeholders (Rotheroe and Richards 2007; see Table 1).
It is important for A.C.E.S. to assess the extent to which their job and skills training program results in
employment of their graduates as well as wider impact on the well-being of clients. As such, the
employment status of recent graduates was assessed to evaluate the program's effectiveness. In
addition to finding employment as a central tangible outcome, this SROI takes into account other
“softer” and more intangible outcomes such as increased personal assets (for example, confidence, self-
efficacy, personal growth) as well as changes in clients’ social and professional networks. For the
evaluation of these less tangible short- and long-term outcomes, we draw on qualitative data, as
described in Stage 3.
The research team discussed the inputs (direct and in-kind) of or related to the main
stakeholder groups (that is, clients, instructors, volunteers, and funders) and evaluated them carefully.
10
As detailed in Table 1, the overall inputs per client going into the job and skills training program amount
to C$5,004. For instance, we include volunteer inputs (five volunteers who on average volunteer twice a
week for five hours each, which corresponds to 1.25 full-time equivalent, FTE) into the program
consisting of their donated time, which was valued at the replacement wage rate for a receptionist of
C$13.00 per hour.
Stage 3: Evidencing Outcomes and Giving Them a Value
In this stage, the research team identified the indicators for the outcomes, the quantity and
duration of the outcomes, and the financial proxies to measure them. This SROI analysis draws on
quantitative administrative data as well as qualitative client input.
Administrative Data
Data, including demographics, employment, and education information, are routinely collected
using an intake form from potential participants attending information sessions at A.C.E.S. For the
purpose of the SROI, we used the data of the 2012 program cohort. The demographic characteristics of
this cohort (n = 110) were highly diverse. The average age was 36 years (range: 20–59); 92 percent were
female; 72 percent were single and unmarried; 43 percent reported that English was not their native
language; 89 percent received welfare benefits; 50 percent reported having a first-generation immigrant
background; 28 percent had (less than or equivalent to) a high school education, 35 percent had some
college experience or a college degree, and 37 percent held a university degree. The sample is
considered to be well educated, mirroring the overall demographics of immigrants to Canada (Statistics
Canada 2015a).
In terms of program breakdown, 42 percent attended the medical receptionist training, 25
percent enrolled in the office clerk program, 19 percent participated in the computerized accounting
training, and 14 percent enrolled in the administrative assistant training. The majority of the cohort (74
11
percent) completed the training program, while 26 percent of the participants (n = 29) dropped out
before graduation. These dropout rates are lower than those of other training programs (Disney 1992;
Perista and Nogueira 2004) and are consistent with records of previous years at WSC. Agency records
indicate that the key reasons for participants dropping out were finding employment prior to program
completion. Because the job and skills training program necessitated full-time attendance (Monday–
Friday, 9:00 a.m.–4:00 p.m.), clients offered job opportunities often opted to drop out and take on
employment rather than completing the program. In previous years, dropouts could also be explained
by personal reasons (such as pregnancy, deportation, mental or physical health issues). According to
agency records, 70 percent of the 2012 program cohort found employment; of those, 62 percent
graduated from the program and 38 percent withdrew prior to graduation. WSC's success rate of finding
employment is comparable to other work integration social enterprises, where rates varied from 58 to
85 percent (Amyot and Fairholm Mader 2014; Denny et al. 2011) as well as to similar programs
coordinated by the City of Toronto, which report a 55 percent success rate within four months of
program completion (Toronto Employment and Social Services 2014).
Qualitative Analysis
To gain deeper insights into clients’ views of the job and skills training program outcomes, we
collected qualitative data from a sample of convenience consisting of nine clients participating in the
2012 program cohort: five interviewees participated in two focus groups, and four interviewees took
part in in-depth interviews. The focus groups were conducted about twelve months after the program's
completion, and interviews were conducted six months later. For the focus groups, participants were
recruited with the aid of staff at the WSC. Out of thirty-five invited people, nine committed to
12
attendance and five attended. For the interviews, the first author recruited participants; out of eight
invited individuals, four were able to attend.
All but one of the interviewees were female; three had an immigrant background (first- and
second-generation), while six were Canadian-born. Participants’ age ranged from 29 to 56 (mean age =
41). Six participants were single, two were married, and one divorced. Six participants had children.
Eight participants had previously attended (but not necessarily completed) professional training at a
college; one held a university degree.
At A.C.E.S., five interviewees attended the office administration program, three the medical
reception program, and one the computerized accounting program. Corresponding to the quantitative
data, eight interviewees found employment after completing the program, but not necessarily in the
field for which they were trained at A.C.E.S. Of these eight, one left the program early because she had
obtained a full-time administrative position.
All participants in focus groups and interviews were asked about their experience with A.C.E.S.,
the perceived benefits of their job and skills training program participation, the extent the program had
prepared them for the job market, and their success in finding a job. Following participants’ consent,
interviews were digitally recorded and then transcribed. Analytic induction and constant comparison
strategies were used to elicit common themes in the transcripts (Glaser and Strauss 1967).
Findings
Two themes emerged from the analysis: tangible and intangible outcomes. We start with
tangible outcomes. Program attendance was clearly linked to the success on the labor market. As one
participant said, “If I had not come to Working Skills Centre, I'd never found a job. … That's for sure.”
Respondents particularly valued the skills they acquired during the training program. Because most of
13
them were computer illiterate before program attendance, exposure to tools such as Excel and
PowerPoint were regarded as helpful. Women with immigrant backgrounds also valued getting
information about their rights and responsibilities at work, as well as the opportunity to learn “about
the Canadian work environment, socializing with others and [gaining] experience on public speaking.” All
respondents found the program's employment search support beneficial and regarded the six-week
internship as a good opportunity to get work experience, especially because it put them in touch with
potential employers.
Besides the tangible outcomes, the respondents pointed to several intangible outcomes—other
areas in their lives that changed during and after program attendance. They especially valued the social
networks that they developed during the job and skills training.
The group of ladies that you meet in the classroom, you kind of take them along with you for the
rest of your life for as much as you can. … We chose the people to stay in contact for a reason
because we are helping each other. … The personal skills and their social skills all come out
because we're so close-knit and we're so accepting.
More than one individual pointed out that they were recommending each other to respective
employers when jobs became available at their workplaces. The social networks that developed
between these women were precious resources that lasted beyond program attendance. These
networks were regarded as even more important for immigrant women, who reported not having many
relatives or friends to fall back on. One woman summarized her view by explaining the importance of
networks in understanding how other women in similar positions cope:
14
Knowledge is power and immigrant ladies that do come here, [find] a power of example too. It's
encouraging, it's comforting … it's a resource that I can come to.
Another distinct area of change was improvement in confidence, self-efficacy, and personal
growth. Participating in the job and skills training program was equated to leaving one's comfort zone,
which ultimately led to personal growth and the feeling of accomplishment and increase in self-
confidence. As one interviewee observed:
I grew a lot at WSC … coming from just home to WSC and I would just open up too. It's like a
flower just blossomed because I was like wow, all these things home, school, you know, and
now I'm doing day care, school. … I loved the challenge. … My confidence did grow because I
was quite shy. [The program] really made a difference in my life. Like I'm just seeing it as, you
know, my, I'm shooting for the stars so to speak.
Those who were successful in finding employment expressed especially strong opinions about
improved confidence and self-efficacy. Furthermore, the program had spillover effects on family and
private life. Participants mentioned that they learned “how to balance a little bit more financially”; that
the program helped them to better structure their days, because they were “getting … into the habit of
having to be somewhere”; and that the families in general were supportive and “so happy” about their
successes.
The respondents expressed very emotional views about WSC. They regarded WSC as “a safe
place to come back,” mostly because staff members were perceived as accommodating, helpful, and as
a fundamental resource contributing to the positive feelings during program attendance and after its
completion.
15
That's why I love the school so much; [it] is because of the extra stuff that we got here as
students. Like, if it had just been the course itself, I may not have decided to come … here today
to talk to you, but it is the other things that come part and parcel with the education that make
this place worthwhile.
In summary, these qualitative findings indicate that the job and skills training program was
helpful for respondents in finding employment by upgrading their job skills and helping them with the
application process (tangible outcomes). In addition, participants improved their confidence and
underwent personal growth during the program (intangible outcomes). Staff members as well as fellow
students played an important role in this process.
Another important part of Stage 3 is the development of financial proxies for each outcome. We
used the qualitative findings presented previously to develop financial proxies. Outcomes were
determined to be: higher earnings resulting from program certification, finding employment, increase in
time management skills, increase in personal assets (that is, self-esteem and self-efficacy), increase in
social and professional networks, and a reduction in the costs of social assistance and subsidies from the
government. For each of these outcomes, we set a financial proxy that would reflect the intangible
change that had taken place for the participants. Financial proxies were determined based on past
studies or matched to evidence in our specific context. For example, forty-four interviewees reported
increase in confidence and self-efficacy. Previous SROI studies valued the increase in personal assets
such as these at 3 percent of gross income using “pre”-income data (Momentum 2012). Drawing on
these previously established indicators, we used clients’ social assistance payments as their “pre”-
income data and applied this to 44 percent of our sample while also accounting for differences in marital
16
status and number of children in the family. (Social assistance payments are staggered according to
marital status and number of children.)
Stage 4: Establishing Impact
In this step, we assessed whether the outcomes are the result of A.C.E.S. activities or should be
attributed to other sources. This step reduces the risk of over-claiming and is essential in the SROI
process. In particular, we focus on three precautionary measures: deadweight, attribution, and drop-off.
Deadweight is a measure of the amount of outcome had the job and skills training program not
taken place. Deadweight is calculated as a percentage of each outcome that would have occurred
regardless of A.C.E.S. input. We use a benchmark that reflects the change that would have occurred
otherwise (Nicholls et al. 2012). For instance, to account for the deadweight in relation to “finding
employment,” we use the percentage reduction in unemployment rates reported for Ontario by
Statistics Canada (2014) between March 2013 and March 2014 (−3.1 percent). This percentage was
deducted from the total quantity of the outcome. Another example is the increase in personal assets;
we assume a medium percentage change (10 to 25 percent) had the clients not participated in the
program (see Table 2).
Attribution reflects our awareness of how much of the outcome was caused by the contribution
of other organizations or people outside of A.C.E.S. (SROI Network 2013). Percentages indicate the
amount of change that is not attributable to A.C.E.S.; this attribution is subtracted from the value
accrued to each outcome. For example, we accounted for outside changes occurring in the social and
economic environment that might have affected the participants through the course of the program (20
percent), but left the remainder (80 percent) of the occurred changes as part of A.C.E.S.’s contribution
(see Table 2). These estimates were reached by consulting the staff and the executive director of the
WSC and by discussions among the members of the research team.
17
Drop-off rates are calculated for outcomes lasting longer than a year. For example, for the
outcome “finding employment,” we know from informal interviews with staff and the executive director
that 30 to 50 percent of the clients eventually go back on social assistance. We therefore estimated
drop-off rates to be the mean of that range (40 percent). Drop-off rates were estimated before applying
discount rates. Discount rates are applied to account for future costs and benefits and to adjust these to
a present value (Nicholls et al. 2012). We acknowledge that we use estimates for drop-off rates that are
higher (more conservative) than reported in similar types of programs (12–33 percent) (Action Group
2011; Nicholls et al. 2012; Off Centre 2012).
Stage 5: Calculating the SROI
We summarized and calculated the financial value of the investments (inputs) and the financial
values of the social costs and benefits (outcomes). Calculations resulted in a present value of C$10,384.
The net present value (NPV) is calculated by adding the costs and benefits paid or received in the
different time periods. Following previous studies, we applied a 3.5 percent discount rate (Lowe 2008).
Calculations of the NPV, then, resulted in C$5,381. Based on these results, we calculated the SROI ratio =
present value of outcomes / value of inputs:
SROI = C$2.08
This means for every dollar of investment in the job and skills training program, C$2.08 of social
value is created.
Sensitivity analysis was conducted to investigate the differences in outcomes when different
estimates are used. For instance, we agreed upon attribution and deadweight estimates as being “low”
(5–10 percent) or “medium” (10–25 percent) indicating potential ranges. The SROI analysis was run with
18
the midpoint of the suggested ranges (see Table 2), and sensitivity analysis was then run with the upper
and lower boundaries of these ranges. In the low-impact scenario (applying upper boundaries), the SROI
ratio was C$1.81:C$1 with a net present value of C$9,032. The high-impact scenario yielded an SROI
ratio of C$2.37:C$1 with a net present value of C$11,843 (detailed analysis available upon request).
Stage 6: Reporting, Using, and Embedding
Drawing on both quantitative and qualitative data, and using best-possible assumptions, we
quantified and analyzed the anticipated impacts of the job and skills training program using the SROI
method. Our analysis indicated that the job and skills training program requires almost C$5,004 of
investment (direct and in-kind) per client per year. This, in turn, created a social value of C$10,384 to
each client that attended during that year. Subtracting the value of investment from the social value
created showed that overall the job and skills training program has created a net present value of
almost C$5,381. The analysis estimates a social return on investment of C$2.08:C$1, meaning that in
terms of social impact, each Canadian dollar invested in human and financial capital through the job and
skills training program yields a return of just over two Canadian dollars.
The SROI is viewed by WSC as a tool that can be rolled out to all areas of activity beyond the job
and skills training program. The plan is to embed the SROI analysis within the organizational culture and
to communicate it to funders, supporters, and beneficiaries through annual reports. Finally, and most
important, we perceived that clients valued the job and skills training program for both tangible and
intangible outcomes. As such, we anticipate that the SROI results will help future clients decide whether
or not the program is an effective means to the desired end—finding employment and better
integrating into Canadian society.
Discussion and Conclusion
19
Venturing into the SROI process was stimulating and challenging alike. The iterative process of
assessing and (re)evaluating the program components and assigning quantifiable metrics to the
outcomes provided us with insights into WSC's procedures and, thus, helped the organization to reflect
on its own practices. The SROI Network handbook (Nicholls et al. 2012; SROI Network 2013) was
invaluable in understanding the underlying concepts behind the methodological process, as none of the
team members was previously familiar with the method. We were also part of a larger case study group
and leveraged knowledge from regular exchange opportunities. We recommend having one person on
the team who becomes an “expert” on the methodology, collects examples of other SROI cases, and
prepares the meetings (stage-by-stage analysis). In this regard, our process went relatively smoothly,
especially in the early stages.
The key benefit was the agency's ability to translate its work into a quantified social impact and,
based on that, to communicate the generated social impact to funders and other supporters. This is
clearly an advantage to a social enterprise competing in the marketplace for student clients and
supporters. Another (unanticipated) benefit of the study was the impact on the staff and leadership at
A.C.E.S. Whereas staff and leadership tend to believe that their program is effective, the SROI helped
them evaluate the actual social impact of the program. Employees felt empowered through the ability
to talk clearly about the benefits that their work creates. To extend this benefit to funders, the SROI will
be included on a brochure and annual reports to highlight the social impact the job and skills training
program generates.
The process was lengthy, and we had anticipated it would proceed faster than it did. The major
challenge were resources; more resources than anticipated—especially time—were required to
complete the process. Our experiences were not unique; the SROI has been identified as one of the
most resource-intensive methods for assessing social value (Stevenson et al. 2010). As a result, we had
to narrow down which of the stakeholder groups to include in the analysis. Besides the focus on clients,
20
we could have included other groups such as employees or volunteers, but ensuring direct involvement
from these groups would have required more financial resources and time.
The SROI methodology has received profound critique in the recent past (Maier et al. 2014;
Mertens, Xhauflair, and Marèe 2015). For instance, Maier and colleagues (2014) identify the difficulties
in monetization and comparison of intangible outcomes, the lack of depth when the social value of an
organization or a program is reduced to a sole number of the SROI ratio, the limits to comparability
across organizations, and the lack of standardization as the most severe limitations of the method.
Similarly, Mertens et al. (2015) argue that the SROI methodology does not stay true to the cost-benefit
analysis principles because of the addition of outcomes that pertain to more than one stakeholder
group; the present value, thus, is limited in its meaning. It is not our aim to contest this criticism, but
merely to acknowledge the limitations of the methodology.
We identify two limitations to our study. First, the qualitative component of the analysis might
be limited insofar as we spoke only to a subset of program participants. As such, the qualitative
evidence provided here may be prone to self-selection bias and may not accurately reflect the opinions
of the full cohort. Second, even though we used established financial proxies to assess the monetary
value of the outcomes and selected proxies after rigorous discussions in the research team, some of
these selections were subjective. Other research teams might decide on different proxies, depending on
the study context.
For the current case, we believe that the benefits of the SROI method such as providing
legitimacy, clarifying organizational goals, and increasing transparency (Maier et al. 2014) outweigh the
costs, especially because the WSC previously had few tools to assess the impact and effectiveness of its
job and skills training program. The SROI provides nuanced insights into clients’ realities and the
perceived impact of the training program on their lives. It is thus a valuable step toward assessing the
tangible and intangible impacts of supported social enterprises.
21
References
Action Group. 2011. Social Return on Investment (SROI) Analysis—An Evaluation of Social Added Value
for Real Jobs. Edinburgh: Action Group. http://base-uk.org/sites/base-uk.org/files/%5Buser-raw%5D/12-
03/sroi_real_jobs_evaluation_accredited.pdf.
Amyot, S., and K. Fairholm Mader. 2014. Pathways to Success for Youth in BC's Capital Region: The
Power and Potential of Social Enterprise. Victoria: BC Centre for Employment Excellence by the
Community Social Planning Council of Greater Victoria.
www.communitycouncil.ca/sites/default/files/2014_Youth_Social_Enterprise_Report_CFEEBC_CSPC.pdf.
Aycan, Z., and J. W. Berry. 1996. “Impact of Employment-Related Experiences on Immigrants’
Psychological Well-Being and Adaptation to Canada.” Canadian Journal of Behavioral Science 28 (3):
240–51.
Aydemir, A., and M. Skuterud. 2005. “Explaining the Deteriorating Entry Earnings of Canada's Immigrant
Cohorts, 1966–2000.” Canadian Journal of Economics/Revue canadienne d'économique 38 (2): 641–72.
Bauder, H. 2003. “‘Brain Abuse,’ or the Devaluation of Immigrant Labour in Canada.” Antipode 35:699–
717.
Cellini, S. R., and J. E. Kee. 2010. “Cost-Effectiveness and Cost-Benefit Analysis.” In Handbook of Practical
Program Evaluation, edited by J. S. Wholey, H. P. Hatry, and K. E. Newcomer, 493–530. San Francisco:
Jossey-Bass.
Citizenship and Immigration Canada. 2013. Facts and Figures 2013: Immigration Overview: Permanent
Residents by Top Languages Reported as Mother Tongue.
www.cic.gc.ca/english/resources/statistics/facts2013/permanent/21.asp.
22
Cohen-Goldner, S., and Z. Eckstein. 2010. “Estimating the Return to Training and Occupational
Experience: The Case of Female Immigrants.” Journal of Econometrics 156 (1): 86–105.
Corbiere, M., and T. Lecomte. 2009. “Vocational Services Offered to People with Severe Mental Illness.”
Journal of Mental Health 18 (1): 38.
Creed, P. A., T. D. Bloxsome, and K. Johnston. 2001. “Self-Esteem and Self-Efficacy Outcomes for
Unemployed Individuals Attending Occupational Skills Training Programs.” Community, Work and Family
4 (3): 285–303.
Creese, G., and B. Wiebe. 2012. “‘Survival Employment’: Gender and Deskilling among African
Immigrants in Canada.” International Migration 50 (5): 56–76.
Denny, S., R. Hazenberg, W. Irwin, and F. Seddon. 2011, April 11–13. Social Enterprise and the Individual:
An Examination of a Work-Integration Social Enterprise (WISE) and Its Impact upon Unemployed
University Graduate's Self-Efficacy and Attitudes to Enterprise. Paper presented at the Fifteenth Annual
Conference of the International Research Society for Public Management (IRSPM XV), Trinity College,
Dublin.
Disney, R. 1992. Helping the Unemployed: Active Labour Market Policies in Britain and Germany. London:
Anglo-German Foundation for the Study of Industrial Society.
Employment and Social Development Canada. 2012. Work—Unemployment Duration.
www4.hrsdc.gc.ca/[email protected]?iid=15.
Gallie, D., S. Paugam, and S. Jacobs. 2003. “Unemployment, Poverty and Social Isolation: Is There a
Vicious Circle of Social Exclusion?” European Societies 5 (1): 1–32.
Glaser, B. G., and A. L. Strauss. 1967. The Discovery of Grounded Theory: Strategies for Qualitative
Research. New York: Aldine.
23
Handy, F., and I. Greenspan. 2009. “Immigrant Volunteering: A Stepping Stone to Integration?” Nonprofit
and Voluntary Sector Quarterly 38 (6): 956–82.
International Labor Office. 2010. Women in Labour Markets: Measuring Progress and Identifying
Challenges. www.ilo.org/empelm/pubs/WCMS_123835/lang--en/index.htm.
Kerlin, J. A. 2010. “A Comparative Analysis of the Global Emergence of Social Enterprise.” VOLUNTAS:
International Journal of Voluntary and Nonprofit Organizations 21 (2): 162–79.
Kirsh, B., T. Krupa, L. Cockburn, and R. Gewurtz. 2010. “A Canadian Model of Work Integration for
Persons with Mental Illnesses.” Disability and Rehabilitation 32 (22): 1833–46.
Krlev, G., R. Münscher, and K. Mülbert. 2013. Social Return on Investment (SROI): State-of-the-Art and
Perspectives—A Meta-analysis of Practice in Social Return on Investment (SROI) Studies Published 2002–
2012. Heidelberg: Centre for Social Investment.
Lowe, J. 2008. Intergenerational Wealth Transfers and Social Discounting: Supplementary Green Book
Guidance.
www.gov.uk/government/uploads/system/uploads/attachment_data/file/193938/Green_Book_supple
mentary_guidance_intergenerational_wealth_transfers_and_social_discounting.pdf.
Maier, F., C. Schober, R. Simsa, and R. Millner. 2014. “SROI as a Method for Evaluation Research:
Understanding Merits and Limitations.” Voluntas: International Journal of Voluntary and Nonprofit
Organizations. doi: 10.1007/s11266-014-9490-x.
Mertens, S., V. Xhauflair, and M. Marée. 2015. “Questioning the Social Return on Investment (SROI).”
SOCENT Publication, Interuniversity Attraction Pole on Social Enterprise. http://iap-
socent.be/publications/questioning-social-return-investment-sroi.
24
Momentum. 2012. Social Return on Investment Case Study: Women's Venture Program. https://ccednet-
rcdec.ca/sites/ccednet-rcdec.ca/files/ccednet/pdfs/2012-Momentum_WVP_SROI.pdf.
Mook, L., S. Ryan, J. Maiorano, A. Armstrong, and J. Quarter. 2015. “Guest Editors' Introduction.”
Nonprofit Management & Leadership 26 (2). doi: 10.1002/nml.21194.
Nicholls, J., E. Lawlor, E. Neitzert, and T. Goodspeed. 2012. A Guide to Social Return on Investment, 2nd
ed. www.thesroinetwork.org/publications/doc_details/241-a-guide-to-social-return-on-investment-
2012.
O'Connor, A. 2000. “Poverty Research and Policy for the Post-Welfare Era.” Annual Review of Sociology
26:547–62.
Off Centre. 2012. Off Centre Social Return on Investment. www.offcentre.org.uk/our-research/for-every-
1-we-receive-we-generate-almost-530-in-community-b.html.
Perista, H., and S. Nogueira. 2004. Work Integration Social Enterprises in Portugal. WP no. 04/06. EMES
Working Papers Series.
Quarter, J., S. Ryan, and A. Chan. 2015. Social Purpose Enterprises: Case Studies for Social Change.
Toronto: University of Toronto Press.
Reitz, J. G. 2001. “Immigrant Skill Utilization in the Canadian Labour Market: Implications of Human
Capital Research.” Journal of International Migration and Integration 2 (3): 347–78.
Rotheroe, N., and A. Richards. 2007. “Social Return on Investment and Social Enterprise: Transparent
Accountability for Sustainable Development.” Social Enterprise Journal 3 (1): 31–48.
Schmid, G., and B. Gazier. 2002. The Dynamics of Full Employment: Social Integration through
Transitional Labour Markets. Cheltenham, UK: Edward Elgar.
25
Sigle-Rushton, W., and J. Waldfogel. 2007. “Motherhood and Women's Earnings in Anglo-American,
Continental European, and Nordic Countries.” Feminist Economics 13 (2): 55–91.
Spear, R., and E. Bidet. 2005. “Social Enterprise for Work Integration in Twelve European Countries: A
Descriptive Analysis.” Annals of Public and Cooperative Economics 76 (2): 195–231.
SROI Network. 2013. The SROI Network. www.thesroinetwork.org/.
Statistics Canada. 2014. Labour Force Characteristics. www.statcan.gc.ca/tables-tableaux/sum-
som/l01/cst01/lfss03f-eng.htm.
Statistics Canada. 2015a. Labor Force Survey Estimates (LFS), by Immigrant Status, Educational
Attainment, Sex and Age Group, Canada, 3-Month Moving Average, Unadjusted for Seasonality, Monthly
(persons unless otherwise noted). www5.statcan.gc.ca/cansim/a26?lang=eng&id=2820105.
Statistics Canada. 2015b. Table 282–0102—Labour Force Survey Estimates (LFS), by Immigrant Status,
Age Group, Canada, Regions, Provinces and Montreal, Toronto, Vancouver Census Metropolitan Areas,
Annual (persons unless otherwise noted). CANSIM (database). www5.statcan.gc.ca/cansim/pick-
choisir?lang=eng&p2=33&id=2820102.
Statistics Canada. 2015c. Table—Labour Force Characteristics by Age and Sex, Canada, Seasonally
Adjusted. www.statcan.gc.ca/pub/71-001-x/2015006/t001-eng.htm.
Stevenson, N., M. Taylor, F. Lyon, and M. Rigby. 2010. Joining the Dots: Social Impact Measurement,
Commissioning from the Third Sector and Supporting Social Enterprise Development: Mutual Advantage.
Bedford, United Kingdom: EEDA, Social Enterprise East of England, Improvement East.
Stier, H., N. Lewin-Epstein, and M. Braun. 2001. “Welfare Regimes, Family-Supportive Policies, and
Women's Employment along the Life-Course.” American Journal of Sociology 106 (6): 1731–60.
26
Tastsoglou, E., and V. Preston. 2012. “Gender, Immigration and Labour Market Integration: Where We
Are and What We Still Need to Know.” Atlantis: Critical Studies in Gender, Culture and Social Justice 30
(1): 46–59.
Toronto Employment and Social Services. 2014. Workforce Development Strategy: 2013 Progress Report.
www.toronto.ca/legdocs/mmis/2014/ed/bgrd/backgroundfile-66932.pdf.
Vidal, I. 2005. “Social Enterprise and Social Inclusion: Social Enterprises in the Sphere of Work
Integration.” International Journal of Public Administration 28 (9–10): 807–25.
Walk, M., I. Greenspan, H. Crossley, and F. Handy. 2014. “Canadian Immigrants and their Access to
Services: A Case Study of a Social Purpose Enterprise.” In Social Purpose Enterprises: Case Studies for
Social Change, edited by J. Quarter, S. Ryan, and A. Chan, 162–87. Toronto: University of Toronto Press.
Walk, M., I. Greenspan, H. Crossley, and F. Handy. 2015. “Mind the Gap: Expectations and Experiences of
Clients Utilizing Job-Training Services in a Social Enterprise.” Annals of Public and Cooperative Economics
86 (2): 221–44.
Working Skills Centre. (n.d.). About us. http://workingskillscentre.com/about-us/.
Zietsma, D. 2007. The Canadian Immigrant Labour Market in 2006: First Results from Canada's Labour
Force Survey. Catalogue no. 71–606-XIE2007001. Ottawa: Statistics Canada.
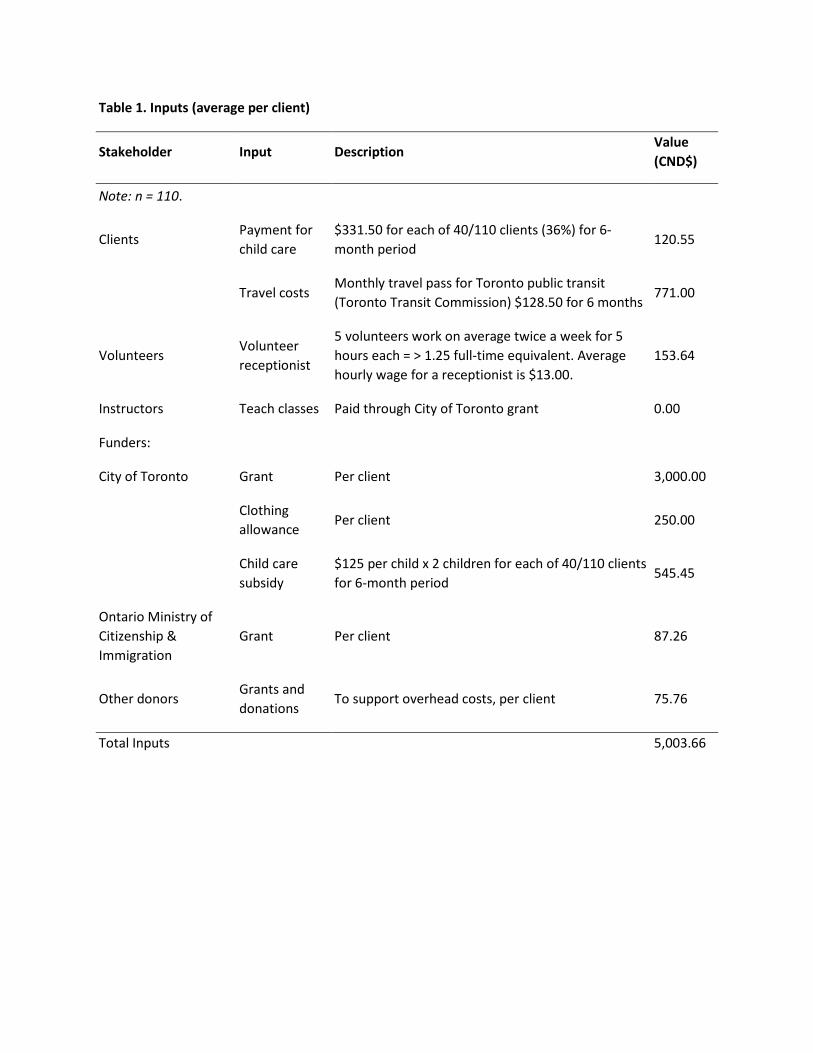
Table 1. Inputs (average per client)
Stakeholder Input Description Value (CND$)
Note: n = 110.
Clients Payment for child care
$331.50 for each of 40/110 clients (36%) for 6-month period
120.55
Travel costs Monthly travel pass for Toronto public transit (Toronto Transit Commission) $128.50 for 6 months
771.00
Volunteers Volunteer receptionist
5 volunteers work on average twice a week for 5 hours each = > 1.25 full-time equivalent. Average hourly wage for a receptionist is $13.00.
153.64
Instructors Teach classes Paid through City of Toronto grant 0.00
Funders:
City of Toronto Grant Per client 3,000.00
Clothing allowance
Per client 250.00
Child care subsidy
$125 per child x 2 children for each of 40/110 clients for 6-month period
545.45
Ontario Ministry of Citizenship & Immigration
Grant Per client 87.26
Other donors Grants and donations
To support overhead costs, per client 75.76
Total Inputs 5,003.66
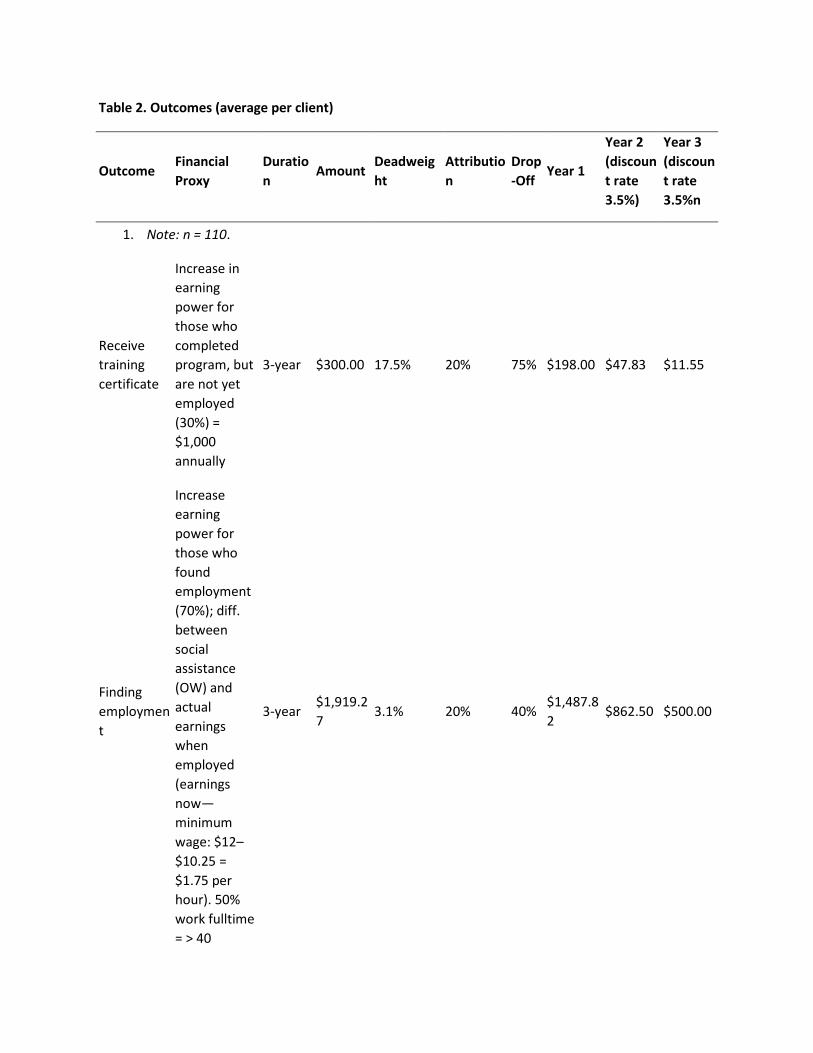
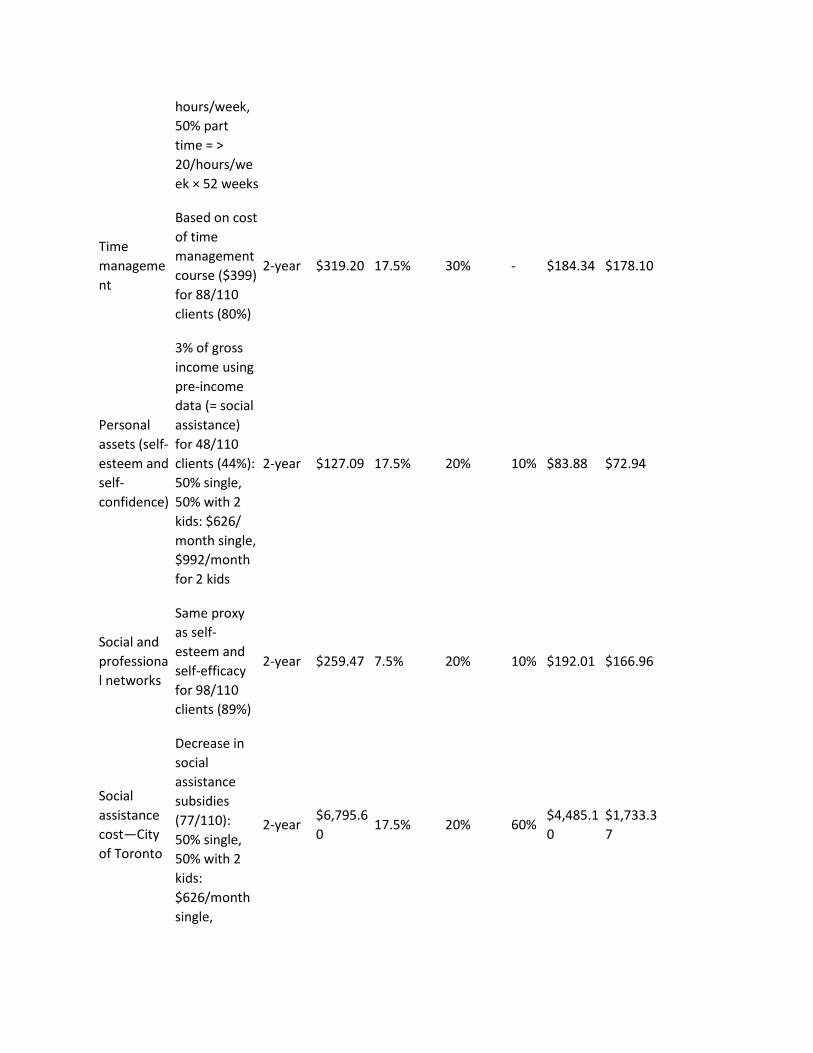
Table 2. Outcomes (average per client)
Outcome Financial Proxy
Duration
Amount Deadweight
Attribution
Drop-Off
Year 1
Year 2 (discount rate 3.5%)
Year 3 (discount rate 3.5%n
1. Note: n = 110.
Receive training certificate
Increase in earning power for those who completed program, but are not yet employed (30%) = $1,000 annually
3-year $300.00 17.5% 20% 75% $198.00 $47.83 $11.55
Finding employment
Increase earning power for those who found employment (70%); diff. between social assistance (OW) and actual earnings when employed (earnings now—minimum wage: $12–$10.25 = $1.75 per hour). 50% work fulltime = > 40
3-year $1,919.27
3.1% 20% 40% $1,487.82
$862.50 $500.00
hours/week, 50% part time = > 20/hours/week × 52 weeks
Time management
Based on cost of time management course ($399) for 88/110 clients (80%)
2-year $319.20 17.5% 30% - $184.34 $178.10
Personal assets (self-esteem and self-confidence)
3% of gross income using pre-income data (= social assistance) for 48/110 clients (44%): 50% single, 50% with 2 kids: $626/ month single, $992/month for 2 kids
2-year $127.09 17.5% 20% 10% $83.88 $72.94
Social and professional networks
Same proxy as self-esteem and self-efficacy for 98/110 clients (89%)
2-year $259.47 7.5% 20% 10% $192.01 $166.96
Social assistance cost—City of Toronto
Decrease in social assistance subsidies (77/110): 50% single, 50% with 2 kids: $626/month single,
2-year $6,795.60
17.5% 20% 60% $4,485.10
$1,733.37
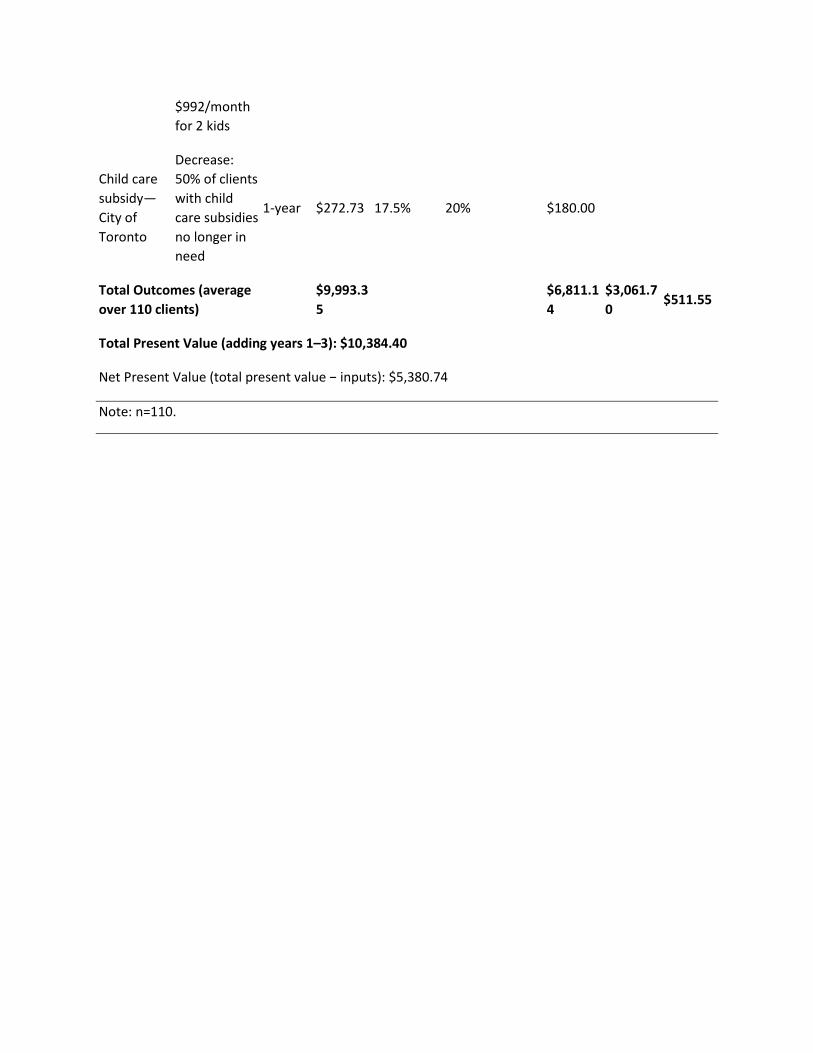
$992/month for 2 kids
Child care subsidy—City of Toronto
Decrease: 50% of clients with child care subsidies no longer in need
1-year $272.73 17.5% 20% $180.00
Total Outcomes (average over 110 clients)
$9,993.35
$6,811.14
$3,061.70
$511.55
Total Present Value (adding years 1–3): $10,384.40
Net Present Value (total present value − inputs): $5,380.74
Note: n=110.
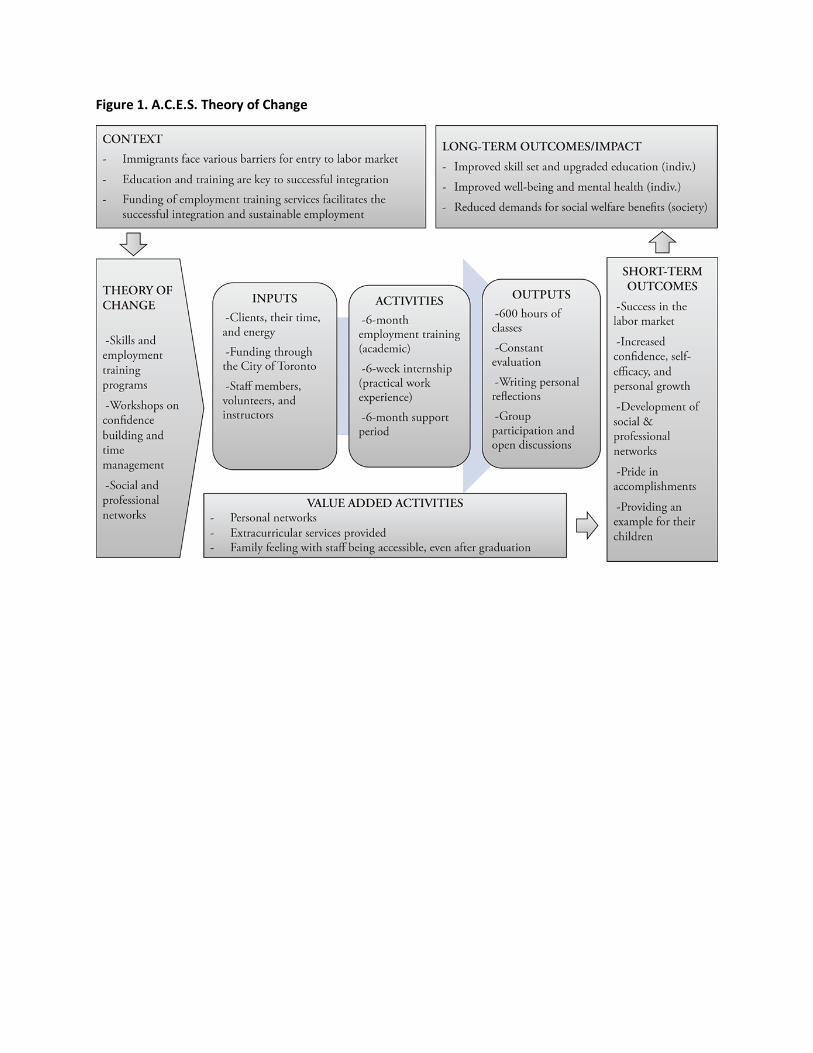
Figure 1. A.C.E.S. Theory of Change