Embed Size (px)
Citation preview


Retrospective Analysis of Electronic Vs. Manual Health Data and Disease Surveillance Records for Implications of
Outbreak Management in LMICs, using Nigeria as a Case Study
2
Contents Acknowledgements ....................................................................................................3
Acronyms...................................................................................................................4
Basic Project Information .........................................................................................6
Executive Summary...................................................................................................7
Introduction ............................................................................................................. 10
Overview of Electronic Disease Surveillance in Africa and Nigeria ....................... 12
Electronic Disease Surveillance and Response Systems in Africa ........................... 14
Qualitative Analysis................................................................................................. 18
Qualitative Interview Results .............................................................................. 18
Quantitative Survey Results ................................................................................ 23
Quantitative Analysis .............................................................................................. 29
Quantitative Data Analysis Summary ................................................................. 29
Completeness Analysis ......................................................................................... 40
Accuracy Analysis ............................................................................................... 41
Electronic Surveillance: Outbreak Policy and Mitigation Planning Imperatives ... 44
Electronic Disease Surveillance in LMICs: Policy Options .................................... 47
References ............................................................................................................... 50
Appendix 1: Lessons Learnt Report ....................................................................... 56
Appendix 2: Qualitative Interview Guide ............................................................... 59
Appendix 3: Quantitative Survey for State Officials .............................................. 61
Appendix 4: WHO IDSR Core Indicators.............................................................. 63
Retrospective Analysis of Electronic Vs. Manual Health Data and Disease Surveillance Records for Implications of
Outbreak Management in LMICs, using Nigeria as a Case Study
3
Acknowledgements
This project, Retrospective Analysis of Electronic Vs. Manual Health Data and Disease Surveillance Records for
Implications of Outbreak Management in LMICs, using Nigeria as a Case Study, submitted in response to the 2018
call for proposals by the World Bank’s Development Economics Data Group (DECDG) and the Global
Partnership for Sustainable Development Data (GPSDD), is supported by the World Bank’s Trust Fund for
Statistical Capacity Building III (TFSCB) with financing from the United Kingdom's Foreign, Commonwealth &
Development Office, the Department of Foreign Affairs and Trade of Ireland, and the Governments of Canada
and Korea.

Retrospective Analysis of Electronic Vs. Manual Health Data and Disease Surveillance Records for Implications of
Outbreak Management in LMICs, using Nigeria as a Case Study
4
Acronyms Acronym Definition
APCDR African Partnership for Chronic Disease Research
IHR International Health Regulations
AFP Acute Flaccid Paralysis
AVADAR Auto-Visual AFP Detection and Reporting
BLIS Basic Laboratory Information System
CDC U.S. Centers for Disease Control and Prevention
CHEW Community Health Extension Workers
CRF Case Report Paper Forms
DHIS 2 District Health Information Software Version 2
DRC Democratic Republic of Congo
DSNO Disease Surveillance and Notification Officers
EDC Electronic Data Capture
eHA eHealth Africa
e-IDSR Electronic Integrated Disease Surveillance & Response
EQ Open-source Electronic Questionnaire
EWARS Early Warning, Alert and Response System
EWORS Early Warning Outbreak Recognition System
EWS Early Warning System
FHIND Foundation for Healthcare Innovation and Development
FP Field Practitioners
GDP Gross Domestic Product
GFT Google Flu Trend
HRIS Human Resource Management Information System
ICT Information and Communication Technologies
IDI In Depth Interviews
IDSR Integrated Disease Surveillance and Response
InStrat InStrat Global Health Solutions
LGA Local Government Areas
LMIC Lower- and Middle-Income Countries
LMIS Logistics Management Information System
MITS Minimally Invasive Tissue Samples
MOH Ministry of Health
mSERS Mobile Strengthening Epidemic Response Systems
NCDC Nigeria Center for Disease Control
NHMIS National Health Management Information System.
NTBLF Nigeria Tuberculosis and Leprosy Foundation
PC Personal Computer
PDA Personal Digital Assistants
PHC Primary Healthcare Center
PHE Public Health Events

Retrospective Analysis of Electronic Vs. Manual Health Data and Disease Surveillance Records for Implications of
Outbreak Management in LMICs, using Nigeria as a Case Study
5
SDG Sustainable Development Goals
SE State epidemiologist
SMOH State Ministry of Health
SMS Short Messaging Service
SORMAS Surveillance, Outbreak Response Management and Analysis System
SSA Sub-Saharan Africa
VBD Vector-Borne Diseases
WHO World Health Organization

Retrospective Analysis of Electronic Vs. Manual Health Data and Disease Surveillance Records for Implications of
Outbreak Management in LMICs, using Nigeria as a Case Study
6
Basic Project Information Project Title
Retrospective Analysis of Electronic Vs. Manual Health Data and Disease Surveillance Records for Implications
of Outbreak Management in LMICs, using Nigeria as a Case Study.
Date of Report: October 2nd 2020
Lead Organization
InStrat Global Health Solutions facilitates improved healthcare delivery in low resource settings in Africa through
the appropriate use of mobile technology. InStrat has established a track record of success by deploying mobile
health technology solutions in Nigeria.
Collaborators
Foundation for Healthcare Innovation and Development (FHIND), a Nigerian not-for-profit organization formed
in 2015 to promote research, innovation, and service development through sustained improvement of health
systems and services, especially for vulnerable underserved groups. FHIND conducts health systems and services
research, to encourage best practice and influence policy change.
Epi Afric, an African health consultancy group that focuses on improving population health through expert
research and data analysis, project design and evaluation, health communication, advocacy and training.
Sustainable Development Goals (SDGs) Covered:
• SDG 3: Good Health and Wellbeing
Country: Nigeria
Data Types and Technologies:
• 2018 electronic disease surveillance and response data downloaded and analyzed on Microsoft
Excel.
• 2018 paper-based records entered into Microsoft Excel and submitted to the Health Ministries.
• Electronic Survey Monkey data outputs downloaded to Microsoft Excel.
Project Objective:
To conduct a comparative analysis of electronic data management versus paper-based regimes to determine the
superior method for more accurate, timely and complete disease surveillance and response data that can better
inform health policy and strategy.

Retrospective Analysis of Electronic Vs. Manual Health Data and Disease Surveillance Records for Implications of
Outbreak Management in LMICs, using Nigeria as a Case Study
7
Executive Summary InStrat Global Health Solutions was engaged to conduct a retrospective analysis of electronic vs. manual health
data and disease surveillance records and its implications on outbreak management in Lower- and Middle-Income
Countries (LMICs), using Nigeria as a case study. InStrat’s technical approach and methodology was informed
by the combined experience of InStrat and its partners on the use of data to inform public health policy and strategy
in Nigeria as a proxy for LMICs. The project’s analytical theory is that electronic data regimes will allow more
accurate, timely, and complete data for health policy and strategy, especially to manage disease outbreaks.
The research study covered three Local Government Areas (LGA) in two States in Nigeria where electronic data
capture systems were implemented and implemented over multiple years. The study LGAs are Epe in Lagos State
with a population of 250,300 and Badagry with a population of 327,400. Lagos State, located in the South West
of Nigeria, is home to over 11 million people and has the largest GDP of Nigeria’s 36 States, sustained by
agriculture and commerce. The other study LGA was Ifedore LGA in Ondo State with a population of 238,100.
Ondo State, located in the South West of Nigeria, is home to approximately 3.5 million people and has the sixth-
largest GDP of Nigeria’s 36 states, sustained by agriculture, oil and natural gas.
The authors adopted a mixed methods approach to the research. The methods included Desk Research to provide
the contextual underpinning of the Study; In Depth Interviews to understand policy and health professionals’
experiences with both regimes; Qualitative Survey via Survey Monkey to Primary Health Care Workers, facility
managers, LGA Disease Surveillance and Notification Officers (DSNO), State level policymakers. A Quantitative
Statistical Analysis of publicly available data was conducted to compare the difference in the proportion of
attributes derived from data generated using manual and electronic data collection methods. The team evaluated
the completeness of morbidity and mortality data reported in outpatient and in-patient departments of health
facilities including cases using both paper and electronic integrated disease surveillance response system forms.
The accuracy assessment involved a literature review of published research comparing the accuracy of
electronically captured data with paper captured data across Africa, to evaluate the relative accuracy of the two
methods.
In collaboration with partner companies, InStrat acquired and accessed publicly available, de-identified, aggregate
level health records and disease surveillance data in the LGAs. InStrat’s Data Scouts canvassed multiple local
sources including universities, libraries, research organizations, etc. to secure publicly available paper-based
disease surveillance records from target LGAs.
The retrospective analysis results demonstrate the superiority of Electronic Data Collection to paper-based
methods. Health workers and policy makers were unanimous in their preference for Electronic Data Capture
(EDC) than Paper Based Methods. Reasons include EDC introduction resulting in increased disease reporting in
the LGAs where it was piloted; increases in the number of disease surveillance reports received, interpreted, and
analyzed and its support for more comprehensive reporting and decision support frameworks. From a quantitative
standpoint, EDC significantly increased the quantity of data collected across diseases and the three LGAs. The
completeness of electronic based surveillance was remarkably better than the paper-based methods. The
Completeness Analysis showed that EDC drove a 12% increase in data completeness. The Accuracy Analysis
confirmed that electronic data capture can be more accurate than the standard, paper-based data capturing
processes.

Retrospective Analysis of Electronic Vs. Manual Health Data and Disease Surveillance Records for Implications of
Outbreak Management in LMICs, using Nigeria as a Case Study
8
Disease Outbreak Imperatives and Policy Options
The increased availability of data afforded by EDC systems will improve the capacity of LMICs to prepare for
and mange outbreaks if they occur. EDCs which include electronic surveillance can help LMICs to improve
integrated disease surveillance and response core indicators, including timely and complete reporting; timely
outbreak detection and response; building capacity of surveillance personnel and the use of data for action. If
LMICs successfully introduce and scale EDCs and electronic surveillance, critical imperatives such the use of
syndromic surveillance for early disease outbreak detection and predictive analytical models and algorithms for
outbreak prediction which in turn will inform disease outbreak prevention strategies.
Information and Communication Technologies (ICT) have become ubiquitous across all aspects human endeavor
including business, governance, education, and commerce; just to name a few. ICT has also played a critical role
in improving health care for individuals and communities by enabling new and more efficient ways of accessing,
communicating, and storing information. LMICs must adopt ICT frameworks and platforms to effectively
position themselves to fully take advantage of the potential that EDC and electronic surveillance systems present
for proactive disease surveillance and response. Technologies that present the unifying ecosystem include the
following:
• Electronic Medical Records Systems that have been adopted at hospitals and now increasingly in primary
health care facilities
• Supply Chain Management Systems
• Disease Surveillance and Response
• Health Worker Training
• Human Resource Management
• Telemedicine/Telehealth
• Health Insurance Management
• Treatment Adherence/Appointment Reminders
Adoption of the above technologies will provide multiple benefits to countries that adopt them. The most
immediate benefits relate to the core health systems strengthening imperative of outbreak mitigation. ICT
technologies that are currently deployed in the region will help accomplish the use of syndromic surveillance for
early outbreak warning; outbreak prediction using big data and artificial intelligence principles; inform vector
control activities and build health worker capacity to detect, control and manage diseases and outbreaks.
Disease outbreak mitigation planning through the development of scalable mitigation strategies could also serve
as valuable tools for healthcare personnel training and preparedness exercises. The most cost-effective strategies
for increasing outbreak preparedness, especially in resource-constrained settings of LMICs include investments
to strengthen core public health infrastructure, including water and sanitation systems; increasing situational
awareness; and rapidly extinguishing sparks that could lead to pandemics. Outbreak mitigation strategies which
ICT adoption will inform and strengthen include:
Strengthening Health Systems: To mitigate the impact of disease outbreaks, protect the health workforce and
ensure continuity of health services during and after them, stronger health systems are needed. Critical elements
include appropriate health financing systems; trained workforce that is safe and provided with personal protective
equipment; access to essential medical products and technologies; business continuity planning to ensure that
health systems are strong enough to withstand the increased needs and to mitigate the impacts of outbreaks.

Retrospective Analysis of Electronic Vs. Manual Health Data and Disease Surveillance Records for Implications of
Outbreak Management in LMICs, using Nigeria as a Case Study
9
Prevention of Vector-Borne Diseases: To prevent the transmission of Vector-Borne Diseases (VBDs), actions can
be taken to protect human beings from the vectors and/or to eliminate or reduce vectors population. These actions
include vector control, community engagement, and personal protection.
Nigeria has arguably transitioned from experimentation and early adoption phases of health ICT, to increasingly
scaled implementation of ICT projects. The private sector has played an important role in this transition through
entrepreneurial initiatives and Public, Private Partnerships which have resulted in the use of ICT across the
spectrum of healthcare delivery services. Nigeria Center for Disease Control (NCDC) used an electronic active
case management SORMAS since 2017 and has recently extended and SORMAS open to all priority health
facilities in all Nigeria’s LGAs. This as well as other private sector led initiatives including the Nigeria
Tuberculosis and Leprosy Foundation (NTBLF) use of real time electronic data capture systems for tuberculosis
surveillance present important examples of scalable electronic data regimes that allow for more accurate, timely,
and complete data for health policy and strategy, especially to manage disease outbreaks.
Conclusion
All research conducted including the Quantitative, Qualitative, Completeness and Accuracy Analyses yielded
conclusions that electronic health data management was a superior system of data collection and management for
disease surveillance and response and health policy more generally. Electronic data regimes will provide
frameworks through which Governments can improve Integrated Disease Surveillance and Response core
indicators using electronic surveillance. As such adopting ICT technologies and platforms will help governments
to adopt a more proactive footing as it relates to disease surveillance and response management. ICT will support
efforts to strengthen health systems, prevent vector borne and other infectious diseases, improve health outcomes
and save lives. These platforms and strategies will help LMICs that adopt them to better comply with the SDG 3:
Good Health and Wellbeing.

Retrospective Analysis of Electronic Vs. Manual Health Data and Disease Surveillance Records for Implications of
Outbreak Management in LMICs, using Nigeria as a Case Study
10
Introduction Research Objectives
InStrat Global Health Solutions was engaged to conduct a retrospective analysis of electronic vs. manual health
data and disease surveillance records and its implications of outbreak management in LMICs, using Nigeria as a
case study. InStrat’s technical approach and methodology was informed by the combined experience of InStrat
and its partners on the use of data to inform public health policy and strategy in Nigeria. The project’s analytical
theory is that electronic data regimes will allow more accurate, timely, and complete data for health policy and
strategy, especially to manage disease outbreaks. To test and validate this theory InStrat acquired publicly
available electronic health records and disease surveillance data from three Local Government Areas (LGA) in
two States in Nigeria (Lagos State, Ondo State) where electronic health data collection has taken place in the last
few years. Upon securing the data, InStrat worked with its analytical staff to cleanse the data and ensure that it is
presented in tables that allow for effective analyses.
Study Setting
Lagos State, located in the South West of Nigeria, is
home to over 11 million people and has the largest GDP
of the 36 states, sustained by agriculture and commerce.
• Badagry LGA. Population: 327,400
• Epe LGA. Population: 250,300
Ondo State, located in the South West of Nigeria, is home
to approximately 3.5 million people and has the sixth-
largest GDP of the 36 states, sustained by agriculture, oil
and natural gas.
• Ifedore LGA. Population: 238,100
Research Methodology
This study adopted a Mixed-Methods approach including the following:
Desk Research: InStrat reviewed ICT policies, impact evaluation reports and published articles related to
Nigeria’s disease surveillance and response to understand factors that shape adoption and scaleup of technologies,
as well as comparisons with the status quo of paper-based reporting.
In Depth Interviews (IDIs): IDIs were conducted with PHC workers, facility managers, LGA Disease
Surveillance Notification Officers (DSNO), State level policymakers. IDIs provided the interpretative context for
the quantitative analytic outputs.
Qualitative Survey: A survey of comparative experiences with electronic versus paper management regimes was
deployed via survey Monkey to PHC workers, facility managers, LGA DSNOs, State level policymakers.
Quantitative Statistical Analysis: In collaboration with partner companies, InStrat acquired and accessed
publicly available, de-identified, aggregate level health records and disease surveillance data in LGAs. InStrat’s

Retrospective Analysis of Electronic Vs. Manual Health Data and Disease Surveillance Records for Implications of
Outbreak Management in LMICs, using Nigeria as a Case Study
11
Data Scouts canvassed multiple local sources including universities, libraries, and research organizations to secure
publicly available paper-based disease surveillance records from target LGAs. Quantitative Analyses of the data
were conducted to establish the method of data collection that resulted in higher aggregate numbers and to
compare the difference in proportion of attributes derived from the data generated using each method. Line and
bar graphs were plotted in Excel 2013 while Z test for proportion was used employed. Statistical analysis was
done using Stata 14 at 5% level of significance. Statistically significant variables were those whose p-values were
below 0.05.
Completeness Analysis: This involved a retrospective research and comparative analysis of data from
paper-based Integrated Disease Surveillance and Response (IDSR) Form 003 versus electronically collected
data.
Accuracy Analysis: We conducted a literature review of comparisons of the accuracy of electronically captured
data with paper captured data across Africa to evaluate the relative accuracy of data collected from the two
methods.
Retrospective Analysis of Electronic Vs. Manual Health Data and Disease Surveillance Records for Implications of
Outbreak Management in LMICs, using Nigeria as a Case Study
12
Overview of Electronic Disease Surveillance in Africa and Nigeria
Following the adoption of the WHO Africa Region’s Integrated Disease Surveillance and Response (IDSR)
Strategy in 1998 and the International Health Regulations (IHR) in 2005, the ministries of health in the WHO
African Region committed to work collaboratively to minimize the effects of public health events (PHEs) on
human health, livelihood, travel and commercial trade by improving preparedness, surveillance systems and
response capacity (WHO, 2014). The IDSR focuses on 40 priority diseases, sub-divided into: epidemic-prone
diseases; diseases targeted for elimination; eradication of diseases of public health importance; international health
regulation events and conditions. However, the reliance of the IDSR system on the manual process of capturing
data on paper forms results in critical time lost. LMICs largely rely on informal and unstructured disease
notification process and awareness is raised only by chance findings or upon public outcry from disease outbreaks.
Disease Surveillance and Notification in Africa
The first edition of the IDSR Technical Guidelines (2002) was widely adopted and adapted throughout the African
region. Progress towards coordinated, integrated surveillance systems has been mixed, but almost every country
in the region and their partners have invested human and material resources in strengthening capacities for public
health systems in order to detect, confirm and respond to public health threats in time to prevent unnecessary
illness, disability and death. Passive surveillance systems typically rely on data submitted to the relevant public
health authority by various healthcare providers. This process is often expensive and inefficient, as substantial
delays between an event and notifications are common, resulting in an incomplete account of disease emergence.
Disease Surveillance and Notification in Nigeria
Disease surveillance and notification was introduced in Nigeria in 1988 following a major outbreak of yellow
fever in 1986/87 which claimed many lives in the country. In Nigeria, surveillance and notification of diseases
involve the immediate notification of epidemic prone diseases, diseases targeted for elimination and eradication
and monthly notification of other diseases of public health importance.
Presently in Nigeria, the collection, collation, analysis and interpretation of disease-related data in public health
institutions are often incomplete and untimely partly because of poor awareness among clinicians of their
importance in disease surveillance and notification activities for the prevention of infectious disease outbreaks.
Many outbreaks which have occurred in Nigeria have been attributed to clinicians either not reporting or reporting
late when the index cases of epidemic prone diseases present in the various health institutions across the country.
The flow of information in the IDSR system in Nigeria is from the health facility, where diseases that have
epidemic potential and those which are targeted for eradication and elimination, are reported immediately to the
focal persons in the health facility and thereafter to the LGA using designated IDSR reporting forms. The LGA
receives data from the health facilities, collate and send to the next level which is the State Ministry of Health
(SMoH). The final step in the process is the transmission of the information to the National Health Management
Information System (NHMIS).
Emergence of Electronic-Based Disease Surveillance System in Africa
Annually, over 100 infectious disease outbreaks and other public health emergencies occur in the WHO Africa
Region. Governments in African countries have recognized the urgent need to transition from paper-based disease
surveillance methods to electronic methods. Electronic disease surveillance is a secure online framework that
Retrospective Analysis of Electronic Vs. Manual Health Data and Disease Surveillance Records for Implications of
Outbreak Management in LMICs, using Nigeria as a Case Study
13
allows healthcare professionals and government agencies to communicate information about diseases and patterns
and coordinate response to outbreaks.
There is growing interest in using digital surveillance approaches to improve monitoring and control of infectious
disease outbreaks. However, LMIC applications are scarce and perhaps, as a result only few studies have shown
a direct connection between the use of digital disease surveillance and public health action. As witnessed during
the West African Ebola epidemic of 2014-16 and the current Corona Virus Pandemic, disease outbreaks can spread
rapidly, resulting in unprecedented social and economic costs and tragic loss of life. In response to these health
crises, new digital approaches to disease surveillance have emerged, aimed at speeding up the transfer of
epidemiological data and increasing countries’ preparedness for future outbreaks. Sierra Leone was the first
country in the WHO Africa region to fully transform its national disease surveillance system from paper-based to
a web-based electronic platform. As of today, electronic reporting of disease surveillance data is active in all
public health facilities. The process, which was first piloted in one district in 2016, was successfully rolled out to
all the 14 districts and every government health facility countrywide. The goal was to revitalize the national public
health surveillance system and to speed up the response to public health events through real-time information
flow. In Guinea, the Ebola outbreak of 2014-2016 demonstrated the importance of strong disease surveillance
systems and the severe consequences of weak capacity to detect and respond to cases quickly. Challenges in the
transmission and management of surveillance data were included in factors that contributed to the delay in
detecting and confirming the Ebola outbreak. To help address this challenge, the U.S. Centers for Disease Control
and Prevention (CDC), the Ministry of Health (MOH) in Guinea, the World Health Organization and other
partners collaborated to strengthen the disease surveillance system through the implementation of an electronic
reporting system using an open source software tool, the District Health Information Software Version 2 (DHIS
2). These efforts are part of the Global Health Security Agenda objective to strengthen real-time surveillance. In
South Sudan, the Ministry of Health in collaboration with the World Health Organization (WHO) has rolled out
an electronic surveillance system also called Early Warning, Alert and Response System (EWARS) to enhance
the collection, management and analysis of IDSR data. A total of 108 alerts were investigated in 2017, out of
which 18 outbreaks were confirmed and effectively responded to. Theses outbreaks include cholera, measles, and
chickenpox. In 2002, the Uganda MOH piloted a new district level monitoring system in the south-western
highlands. Incoming clinical data from health centers were collated and entered onto a district level computer and
compared with a baseline of historical illness data. An anomaly measure was used to provide the index of
deviation, followed by electronic reporting. This simple system detected two malaria outbreaks in Kabale, in 2005
and 2006, more than two weeks before case numbers began to peak. In 2004 an early warning system, 2 SE FAG,
was established in French Guiana with the goal of detecting outbreaks of febrile illness in French soldiers,
including dengue. In 2006 the system was expanded to include 25 civilian health centers that provide surveillance
on sanitary conditions.
In October 2017, Nigeria Center for Disease Control implemented SORMAS after the successful pilot of an earlier
prototype of this system in Nigeria in 2015. This adoption has since been expanded to cover priority health centers
across Nigeria and is being used to identify coronavirus cases and their contacts for prompt isolation and treatment
as required.

Retrospective Analysis of Electronic Vs. Manual Health Data and Disease Surveillance Records for Implications of
Outbreak Management in LMICs, using Nigeria as a Case Study
14
Electronic Disease Surveillance and Response Systems in Africa
Many online surveillance systems that function based on real-time data have been developed involving a wide
range of technologies and data sources to prevent the occurrence of infectious diseases. These systems which
have been implemented in several countries and are at various stages of testing and scaling adopt different
approached to disease surveillance ranging from tracking of rumors to GIS tracking. These platforms also cover
a variety of diseases including epidemic prone diseases. Several of them are linked to the NHMIS. These systems
are continually being added to and updated.
S/N Name of
Solution
Country of
Operation/Use Description
1
Electronic
Integrated
Disease
Surveillance &
Response (e-
IDSR)
Nigeria, Sierra
Leone, Liberia
eIDSR enhance disease prevention and control through the
capture and submission of data on epidemiologically
important disease. It is a purpose-built digital data collecting
and reporting tool. The tool is integrated in the national health
system through its compatibility with the health information
system DHIS2. In contrast to the traditional health facility
paper-based system which requires data to be re-entered
electronically at the district level, the e-IDSR mobile
application collects and reports data from the community level
up to the national level.
2 Kano Focus Nigeria It is an e-Learning resource center with texts, courses, and
presentations.
3
Auto-Visual AFP
Detection and
Reporting
(AVADAR)
Burkina Faso,
Cameroon, Central
African Republic,
Chad, the
Democratic
Republic of Congo
(DRC), Liberia,
Mali, Niger,
Nigeria, Sierra
Leone, and South
Sudan
Acute Flaccid Paralysis (AFP) is the main indicator of polio.
AVADAR improves the traditional AFP surveillance systems
by “widening the net” of disease reporters and using an SMS
- based mobile technology to improve the completeness,
timeliness, and availability of AFP reporting.
4
Child Health and
Mortality
Prevention
Surveillance
(CHAMPS)
Bangledash,
Ethiopia, Mali,
Kenya,
Mozambique,
South Africa,
Sierra Leone
Uses digital data collection tools and Minimally Invasive
Tissue Samples (MITS) to prevent future child deaths.
5
Geo-referenced
Infrastructure
and
Demographic
Data for
DRC, Nigeria,
Zambia
Support the polio micro-planning work, and to serve as a base
layer for GIS tracking of vaccination teams.

Retrospective Analysis of Electronic Vs. Manual Health Data and Disease Surveillance Records for Implications of
Outbreak Management in LMICs, using Nigeria as a Case Study
15
Development
(GRID3)
6
SORMAS
(Surveillance
Outbreak
Response
Management and
Analysis System)
Nigeria
SORMAS (Surveillance, Outbreak Response Management
and Analysis System) is intended to enable digital
implementation of IDSR; outbreak response management in
addition to surveillance; real time data processing; and
interactive task management (including contact tracing). It
processes disease control and outbreak management
procedures in addition to surveillance and early detection of
outbreaks through real-time digital surveillance including
peripheral health care facilities and laboratories. SORMAS
permits early detection of outbreaks through case notifications
and allows recording of rumors of potential public health
significance. SORMAS presents an interactive dashboard
displaying data and including epidemiological curves,
mapping, and network diagrams.
7
Mobile
Strengthening
Epidemic
Response
Systems
(mSERS)
Nigeria
mSERS is an SMS - based platform that automates bi-
directional data collection while enabling supervision and
oversight of the entire reporting process. Its functions include
data gathering/collection permitting immediate case
notifications, rumor notifications and weekly reporting;
information feedback including information to Health Care
Workers, report receipts, validation confirmations and report
submission reminders; and data analysis.
8 Argus eIDSR
Application
Central Africa
Republic, planning
implementation in
Nigeria
Argus has been developed with the following concepts in
mind: to facilitate IDSR for early detection, surveillance and
response; to collect weekly or monthly epidemiological data;
to support immediate alerts and notifications; to perform data
validation at each level above; to perform data aggregation;
allow reporting and exporting; assure secure SMS data
transfer with hand check; to be multilingual, Argus performs
three operations: i) Alert, to provide an immediate notification
of cases that may signal a potential outbreak; ii) Report, to
transmit Weekly and Monthly surveillance reports, and
iii) Archive, to review the status of previously submitted
reports.
9
Early Warning
Outbreak
Recognition
System
(EWORS)
Nigeria
EWORS detects disease outbreaks earlier than possible with
traditional paper-based surveillance mechanisms. EWORS
provide situational awareness during outbreaks by monitoring
outbreak distribution and spread and characterizing affected
populations. InStrat’s E-WORs features “Indicator” (pre-
diagnostic) data (e.g., syndromes) that are captured
electronically allowing for real time data analysis. It has
inbuilt statistical algorithms based on local baselines of
syndromes or disease patterns. Such algorithms will adjust for
seasonal variations in disease patterns due to weather, travel
during festive occasions, etc. The statistical algorithms will
Retrospective Analysis of Electronic Vs. Manual Health Data and Disease Surveillance Records for Implications of
Outbreak Management in LMICs, using Nigeria as a Case Study
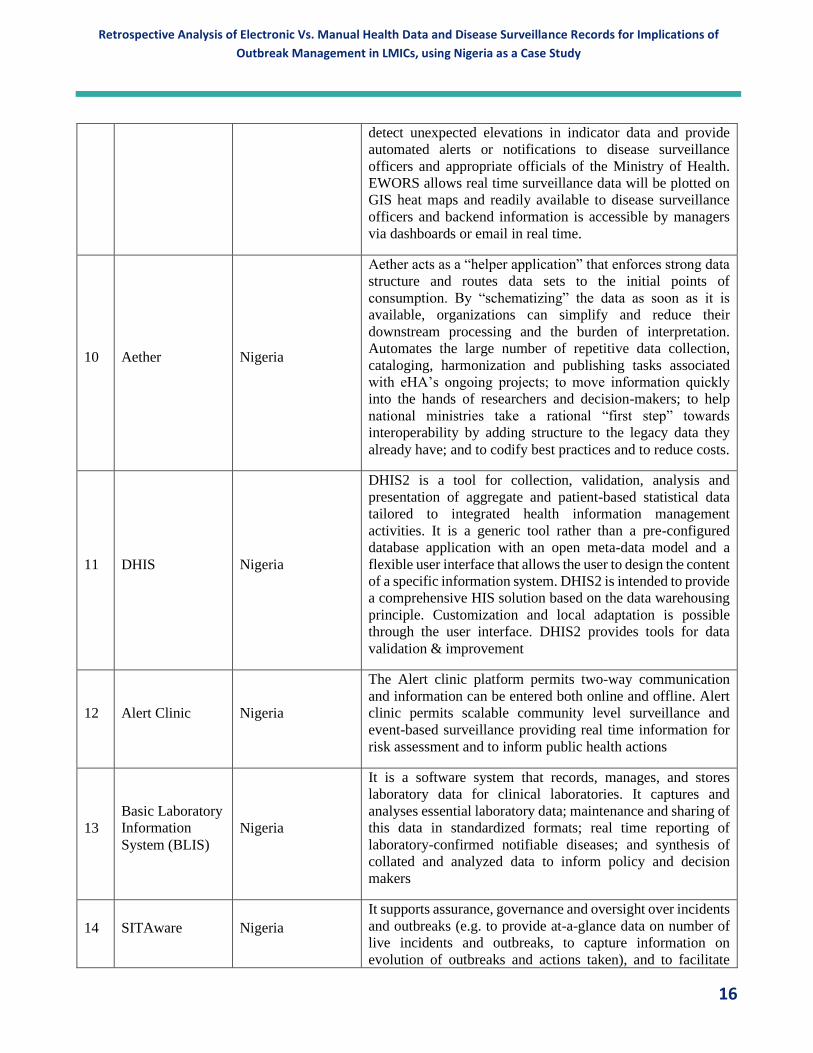
16
detect unexpected elevations in indicator data and provide
automated alerts or notifications to disease surveillance
officers and appropriate officials of the Ministry of Health.
EWORS allows real time surveillance data will be plotted on
GIS heat maps and readily available to disease surveillance
officers and backend information is accessible by managers
via dashboards or email in real time.
10 Aether Nigeria
Aether acts as a “helper application” that enforces strong data
structure and routes data sets to the initial points of
consumption. By “schematizing” the data as soon as it is
available, organizations can simplify and reduce their
downstream processing and the burden of interpretation.
Automates the large number of repetitive data collection,
cataloging, harmonization and publishing tasks associated
with eHA’s ongoing projects; to move information quickly
into the hands of researchers and decision-makers; to help
national ministries take a rational “first step” towards
interoperability by adding structure to the legacy data they
already have; and to codify best practices and to reduce costs.
11 DHIS Nigeria
DHIS2 is a tool for collection, validation, analysis and
presentation of aggregate and patient-based statistical data
tailored to integrated health information management
activities. It is a generic tool rather than a pre-configured
database application with an open meta-data model and a
flexible user interface that allows the user to design the content
of a specific information system. DHIS2 is intended to provide
a comprehensive HIS solution based on the data warehousing
principle. Customization and local adaptation is possible
through the user interface. DHIS2 provides tools for data
validation & improvement
12 Alert Clinic Nigeria
The Alert clinic platform permits two-way communication
and information can be entered both online and offline. Alert
clinic permits scalable community level surveillance and
event-based surveillance providing real time information for
risk assessment and to inform public health actions
13
Basic Laboratory
Information
System (BLIS)
Nigeria
It is a software system that records, manages, and stores
laboratory data for clinical laboratories. It captures and
analyses essential laboratory data; maintenance and sharing of
this data in standardized formats; real time reporting of
laboratory-confirmed notifiable diseases; and synthesis of
collated and analyzed data to inform policy and decision
makers
14 SITAware Nigeria
It supports assurance, governance and oversight over incidents
and outbreaks (e.g. to provide at-a-glance data on number of
live incidents and outbreaks, to capture information on
evolution of outbreaks and actions taken), and to facilitate

Retrospective Analysis of Electronic Vs. Manual Health Data and Disease Surveillance Records for Implications of
Outbreak Management in LMICs, using Nigeria as a Case Study
17
real- time data sharing between states and NCDC during major
incidents. It has a clear and simple to use user interface and
permits collection of data over a range of incidents (e.g.
disease outbreaks, chemical and radiological incidents). Basic
epidemiological data is captured along with description of
incidents, actions taken and command and control
arrangements. Incident information is fully updateable
allowing timelines of events to be recorded and the uploading
of key relevant documents.
15 Tataafo Nigeria
Tataafo is a data mining and analytic tool. It employs text
mining, analysis, and natural language processing to
determine the occurrence of outbreaks based on interaction on
the internet media (social, print, and other relevant media). It
also retrieves trending information via configured keywords
used at site searches. Key words are coined to filter
information. These key words include the 41 notifiable
diseases and other “street words” that connote diseases,
deaths, or health conditions/events.
Source: InStrat Research, NCDC Future of Surveillance Meeting, Abuja, May 2018
Retrospective Analysis of Electronic Vs. Manual Health Data and Disease Surveillance Records for Implications of
Outbreak Management in LMICs, using Nigeria as a Case Study
18
Qualitative Analysis
In-Depth Interviews
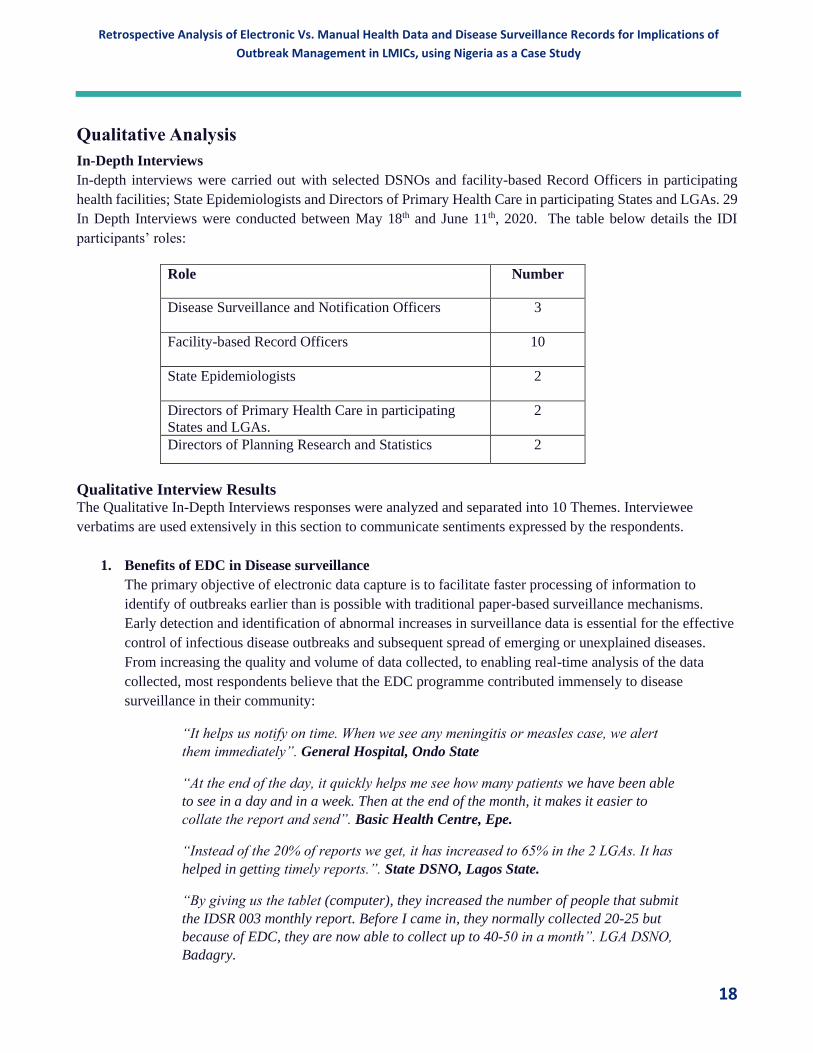
In-depth interviews were carried out with selected DSNOs and facility-based Record Officers in participating
health facilities; State Epidemiologists and Directors of Primary Health Care in participating States and LGAs. 29
In Depth Interviews were conducted between May 18th and June 11th, 2020. The table below details the IDI
participants’ roles:
Role Number
Disease Surveillance and Notification Officers
3
Facility-based Record Officers
10
State Epidemiologists
2
Directors of Primary Health Care in participating
States and LGAs.
2
Directors of Planning Research and Statistics 2
Qualitative Interview Results The Qualitative In-Depth Interviews responses were analyzed and separated into 10 Themes. Interviewee
verbatims are used extensively in this section to communicate sentiments expressed by the respondents.
1. Benefits of EDC in Disease surveillance
The primary objective of electronic data capture is to facilitate faster processing of information to
identify of outbreaks earlier than is possible with traditional paper-based surveillance mechanisms.
Early detection and identification of abnormal increases in surveillance data is essential for the effective
control of infectious disease outbreaks and subsequent spread of emerging or unexplained diseases.
From increasing the quality and volume of data collected, to enabling real-time analysis of the data
collected, most respondents believe that the EDC programme contributed immensely to disease
surveillance in their community:
“It helps us notify on time. When we see any meningitis or measles case, we alert
them immediately”. General Hospital, Ondo State
“At the end of the day, it quickly helps me see how many patients we have been able
to see in a day and in a week. Then at the end of the month, it makes it easier to
collate the report and send”. Basic Health Centre, Epe.
“Instead of the 20% of reports we get, it has increased to 65% in the 2 LGAs. It has
helped in getting timely reports.”. State DSNO, Lagos State.
“By giving us the tablet (computer), they increased the number of people that submit
the IDSR 003 monthly report. Before I came in, they normally collected 20-25 but
because of EDC, they are now able to collect up to 40-50 in a month”. LGA DSNO,
Badagry.

Retrospective Analysis of Electronic Vs. Manual Health Data and Disease Surveillance Records for Implications of
Outbreak Management in LMICs, using Nigeria as a Case Study
19
Disease surveillance activities in Badagry and Epe were compared with other LGAs in Lagos where
EDC was not being used:
“If you compare them with other LGAs, they have improved." LGA DSNO, Badagry.
In Erele, a community in Ifedore LGA, during a major disease outbreak in the community, EDC tablets
were deployed to the site and the use of the software proved very helpful:
“It was used to line list and do real time analysis of the data that was generated and
so it really helped to spot the cause and with the cause identified, we were able to do
the necessary community sensitization and all of the other things that brought that
outbreak to an end”. Director of Planning Research and Statistics, Ondo State.
EDC pick up indicators to infectious diseases and therefore identify the potential of outbreaks before
they happen. A respondent believed that EDC could be used to handle Lassa Fever outbreaks in Nigeria:
“EDC is working and should be encouraged to stay. If we scale up to other LGAs,
especially in Owo LGA, where we have Lassa fever, it is endemic in 5 LGAs, if EDC
is there, I think, it will pick most of this up”. State DSNO, Ondo State.
2. Training on EDC
Community health centers have a high rate of staff turnover and poor pay making maintenance and
continuity of skills difficult, requiring constant staff training. Health workers need constant training on
the proper methods for the collection of environmental and clinical specimens, as well as advanced
computer skills.
“… there must be continuous training of the health workers. If possible, every 3
months because there is the possibility of the trained staff leaving”. LGA DSNO,
Badagry, Lagos State.
3. Data Interpretation with EDC
According to the State Epidemiologist in Ondo State, although he was not trained on how to interpret
the data, he studies the analyzed data:
“I study what is being analyzed and I do a comparative study to what we have been
having before the introduction of EDC”. State Epidemiologist, Ondo State.
4. Existing Technologies
Other technologies existed in Ondo State:
“Before the launch of EDC, there was a collaborative effort with the University of
Maryland via NCDC. They came around and launched mSERS. This has been
working effectively.” State Epidemiologist, Ondo State.
Mobile Strengthening Epidemic Response Systems (mSERS), a project supported by the US CDC
through the University of Maryland, Baltimore, is a professional SMS messaging platform that
facilitates the exchange of weekly disease surveillance reports between all reporting levels: Local
Government Area (LGA), state and national.
Retrospective Analysis of Electronic Vs. Manual Health Data and Disease Surveillance Records for Implications of
Outbreak Management in LMICs, using Nigeria as a Case Study
20
5. Technology Shyness
Some health workers who work in health facilities in rural areas are novices to the use of technology
and may not initially display prerequisite skills to operate basic devices. Although, the health workers
are used to working with paper, supervisors feel that with continuous use, they will get used to operating
the EDC hardware:
“Most of these people are educated but not used to operating smart phones. But we
overcame that when we did the training. In fact, one of the facilities that we picked,
the woman did not know how to operate it but now she is good with it. So, I think
we’ve been able to overcome that issue of using the tablet”. State Epidemiologist,
Ondo State.
6. EDC version vs Paper copy of IDSR
For different reasons, the respondents were unanimous in their preference for using EDC rather than
paper tools to collect IDSR data:
“Before now, the process of capturing our data has been so obsolete through paper
and biro (pen) which is not the in thing... since the launching of EDC, I can boldly
say that this has helped our epidemiological activities tremendously”. State
Epidemiologist, Ondo State.
Some respondents prefer using EDC because it works faster:
“This one is better. It makes reporting easier… Talk less of the one where you’ll still
be going through the report from day 1 to day 30”. Basic Health Centre, Epe LGA,
Lagos State.
“Tablet is better. It is fast. If I have data that I want the DSNO to see, all I have to
do is synchronize it." Community Health Centre, Ondo State
“EDC is faster than paper… It sums up and gives them the results immediately.
LGA DSNO, Ondo State.
“Definitely, electronic data collection is better and faster, and errors are minimal,
and response is definitely going to be faster because you don’t take days to
analyse”. Executive Secretary, Ondo State Primary Health Management Board.
Some respondents prefer EDC because the information can’t be omitted:
“On a paper copy you can omit some things but with the electronic copy, the
information cannot be reduced”. Basic Health Centre, Epe LGA, Lagos State.
Some respondents however still use the paper copy alongside the electronic tool:
“I think that the tablet is even faster than the paper, but I still do the two. I always
give them the paper copy”. PHC Badagry, Lagos State.

Retrospective Analysis of Electronic Vs. Manual Health Data and Disease Surveillance Records for Implications of
Outbreak Management in LMICs, using Nigeria as a Case Study
21
“The paper version can still be used for archiving purposes because it is part of the
documentation for certification of any epidemic prone disease". State DSNO, Ondo
State.
7. Completeness of data
Disparities occur when data entered into EDC is compared with data entered into the IDSR paper forms.
“For instance, they may send a report around 8 am but between 8 am and the end of
the day, they may see about 5 cases which means they did not report those five cases
for that day. But at the end of the month, when they sit down with their record, they
will be able to pick everything. But they are not able to go back and resend”. LGA
DSNO, Badagry, Lagos State.
At times, they may not remember to put some number of diseases but at the end of
the month when they bring all their records together, they will be able to collect
more data." LGA DSNO, Badagry, Lagos State.
When a month ends on a Saturday or Sunday, respondents report that they are often unable to access the
previous month’s page to record data:
"Once a month ends on a weekend, maybe Saturday or Sunday, when we come on
Monday to open the tablet, we will not have access to the previous month to record
our data”. General Hospital, Ondo State.
8. Timeliness of data
For EDC data to be effective, it must be timely, however, because it is new, there are some challenges:
“We had teething problems in the first three or four months on it being a new
system.” State Epidemiologist, Lagos State.
When this respondent was asked how EDC has helped them in collecting data for the IDSR:
“It helps us notify on time. When we see any meningitis or measles case, we alert
them immediately". General Hospital, Ondo State
“There is a time limit to submit, first Wednesday of every month, that is the
deadline”. LGA DSNO, Badagry, Lagos State.
9. Sustainability
Several programs like EDC have been piloted in Ondo State, for example the mSERS program whose
subscription has ended and has become the state’s responsibility:
“…subscription they gave has been exhausted so it has now become the state’s
responsibility to take over from where that has stopped…You know the issue of
paucity of funds.” State Epidemiologist, Ondo State.

Retrospective Analysis of Electronic Vs. Manual Health Data and Disease Surveillance Records for Implications of
Outbreak Management in LMICs, using Nigeria as a Case Study
22
According to some respondents, EDC sustainability is a function of the incremental value it
demonstrates:
“There is no doubt about it, there will be a progressive improvement to the
program. Every effort has been put in place to see that it is extended to all the LGAs
since we have been able to see the impact in the LGA where it is being piloted”.
State Epidemiologist, Ondo State.
“Today we have over 583 public health facilities in Ondo State and we are talking
about deploying 363 today, even though it is still not up to the number we require.
So, in terms of a usefulness, its better but the general application is where we need
to scale up so that every data collector will have their tool”. Executive Secretary,
Ondo State Primary Health Management Board.
10. Political will
Sustainability of the EDC program is dependent on political will by all arms of government within the
project State:
“Lagos state is very committed to ensuring that we have disease control and
prevention in the state.… The state is very committed to this kind of program
especially when we can get instant data reporting which is also something that the
other policy makers can sit in their offices and view from the dashboard and
respond effectively”. State Epidemiologist, Lagos State.
“…some of these programs will be captured for sustainability, since we have been
able to see the tremendous impact in the state preparedness and response”. State
Epidemiologist, Ondo State.
When a respondent was asked if he thought the government had the political will to sustain the program,
he answered:
“For now, yes. We are hopeful that this will continue." Director of planning
Research and statistics, Lagos State

Retrospective Analysis of Electronic Vs. Manual Health Data and Disease Surveillance Records for Implications of
Outbreak Management in LMICs, using Nigeria as a Case Study
23
Quantitative Survey Results
Please refer to Appendix 2 for the Qualitative Interview Survey Questionnaire.
The Qualitative Survey was sent to participants by email at midnight, Sunday, May 24th, 2020 and left open for
10 working days. The last day for responses was midnight Friday, June 5th, 2020. Below is an analysis of the
online questionnaire responses:
• The Survey was administered to a total of 97 users with exposure to EDC and 71 (73%) responded
• 80.56% of the respondents were from Lagos State
• 19.44% of the respondents were from Ondo State
• 52.78% of the respondents were from Badagry LGA
• 30.56% of the respondents were from Epe LGA
• 16.67% of the respondents were from Ifedore LGA
• 18.06% of the respondents were Disease Surveillance Notification Officers (DSNO)
• 37.50% of the respondents were Community Health Extension Workers (CHEW)
• 44.44% of the respondents were Facility In-Charge
• No State Epidemiologists responded.
The figure below shows responses when respondents were asked to choose from a scale of 1 (Has not helped me
at all) to 7 (Has been extremely helpful), how EDC has helped them improve data interpretation and response to

Retrospective Analysis of Electronic Vs. Manual Health Data and Disease Surveillance Records for Implications of
Outbreak Management in LMICs, using Nigeria as a Case Study
24
disease outbreaks. Most of the respondents, over 80% indicated that EDC has been helpful, while 0% indicated
that EDC has not helped at all.
The figure below shows responses when respondents asked to describe how EDC has helped improve their work.
Forty-three (30.53%) of the respondents specified that EDC has helped them ‘Report data in a timely manner’;
thirty-nine (27.69%) of the respondents stated that EDC has helped them ‘Report data completely’; twenty
(14.2%) of the respondents indicated that EDC has helped them ‘Build their capacity in disease surveillance and
response’; eighteen (12.78%) of the respondents indicated that EDC has helped them ‘Respond to infectious
disease in a timely manner; Seventeen (12.07%) of the respondents showed that EDC has helped them ‘Respond
to infectious disease effectively’ and two (1.42%) of the respondents chose ‘Other’ reasons not specified.
Q7 EDC has helped you?
Q6 On a scale of 1 (Has not helped me at all) to 7 (Has been extremely helpful) please rate how
EDC has helped you to improve data interpretation and response to disease outbreaks.
Retrospective Analysis of Electronic Vs. Manual Health Data and Disease Surveillance Records for Implications of
Outbreak Management in LMICs, using Nigeria as a Case Study
25
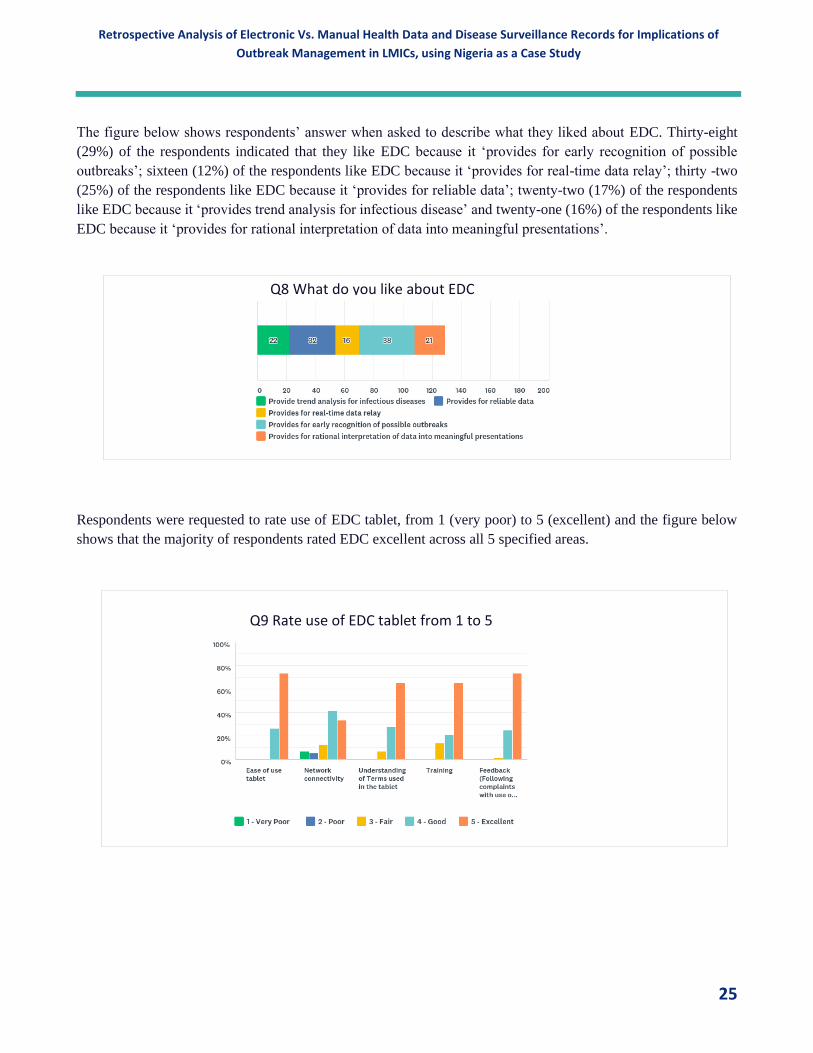
The figure below shows respondents’ answer when asked to describe what they liked about EDC. Thirty-eight
(29%) of the respondents indicated that they like EDC because it ‘provides for early recognition of possible
outbreaks’; sixteen (12%) of the respondents like EDC because it ‘provides for real-time data relay’; thirty -two
(25%) of the respondents like EDC because it ‘provides for reliable data’; twenty-two (17%) of the respondents
like EDC because it ‘provides trend analysis for infectious disease’ and twenty-one (16%) of the respondents like
EDC because it ‘provides for rational interpretation of data into meaningful presentations’.
Respondents were requested to rate use of EDC tablet, from 1 (very poor) to 5 (excellent) and the figure below
shows that the majority of respondents rated EDC excellent across all 5 specified areas.
Q8 What do you like about EDC
Q9 Rate use of EDC tablet from 1 to 5

Retrospective Analysis of Electronic Vs. Manual Health Data and Disease Surveillance Records for Implications of
Outbreak Management in LMICs, using Nigeria as a Case Study
26
In the figure below, respondents were asked if they would be willing to recommend EDC to other health
workers not currently using it and a hundred percent (100%) of the respondents said ‘yes’.
Respondents were asked to rate the level of impact EDC has had on their work. The figure below indicates that
60.87% of the respondents said that EDC has had ‘a great deal of impact’; 24.64% said that EDC has had ‘a lot
of impact’ and 14.49% said EDC has had ‘a moderate amount of impact’.
Q10 Would you recommend EDC to other health workers not currently using it?
Q14 How much of an impact do you feel EDC has had on your work?

Retrospective Analysis of Electronic Vs. Manual Health Data and Disease Surveillance Records for Implications of
Outbreak Management in LMICs, using Nigeria as a Case Study
27
When asked what challenges they face using EDC, twenty-nine (29) respondents said the ‘poor internet
connectivity at the health facility/office’. Ten (10) respondents indicated, the ‘inability to take the tablets home’.
For two (2) respondents, it was ‘inadequate feedback from supervisors’. Two other respondents said,
‘inadequate training received before EDC commenced’ and ‘tablet freezing (temporarily stops working).
Respondents were asked to rate the level of satisfaction with their work with the use of EDC. 79.17% were very
satisfied; 16.67% were moderately satisfied and 4.17% remained neutral.
Recommendations by Online Survey Respondents
1. It (EDC) should be a predictive model to notify of disease outbreaks.
2. Network (Internet) connectivity problem should be fixed.
3. Need regular training EDC
4. EDC should be expanded to other health workers
5. Other diseases should be included e.g. delivery, maternal mortality death rate.
6. By giving solar to the facility that have poor power.
Q15 What are the challenges you faced using EDC
Q16 How satisfied are you with your work with the use of EDC

Retrospective Analysis of Electronic Vs. Manual Health Data and Disease Surveillance Records for Implications of
Outbreak Management in LMICs, using Nigeria as a Case Study
28
Discussion
Respondents indicate that EDC helped increase disease reporting activity in the LGAs where it was piloted. EDC
also helped to increase the number of disease surveillance reports received. Respondents report that EDC helped
them report and analyze disease data faster. Results reveal that most of the respondents, over 80%, indicate that
EDC helped them improve data interpretation and response to disease outbreaks.
Respondents indicate that disease surveillance activities are better in Badagry and Epe, where the EDC program
was piloted than in other LGAs in Lagos. All respondents unanimously agree that they prefer the use of EDC over
the use of paper tools for data entry. Respondents indicate that EDC has helped improve disease surveillance by
ensuring timely notification and enabling real time analysis of the data received. They also reported that the use
of EDC has reduced the possibility of making mistakes or omitting information during the data entry process, data
can be analyzed easier and respondents do not need to spend their money-making photocopies. Some respondents
however still use the paper IDSR tools for archiving purposes or compliance with mandatory paper documentation.
Retrospective Analysis of Electronic Vs. Manual Health Data and Disease Surveillance Records for Implications of
Outbreak Management in LMICs, using Nigeria as a Case Study
29
Quantitative Analysis
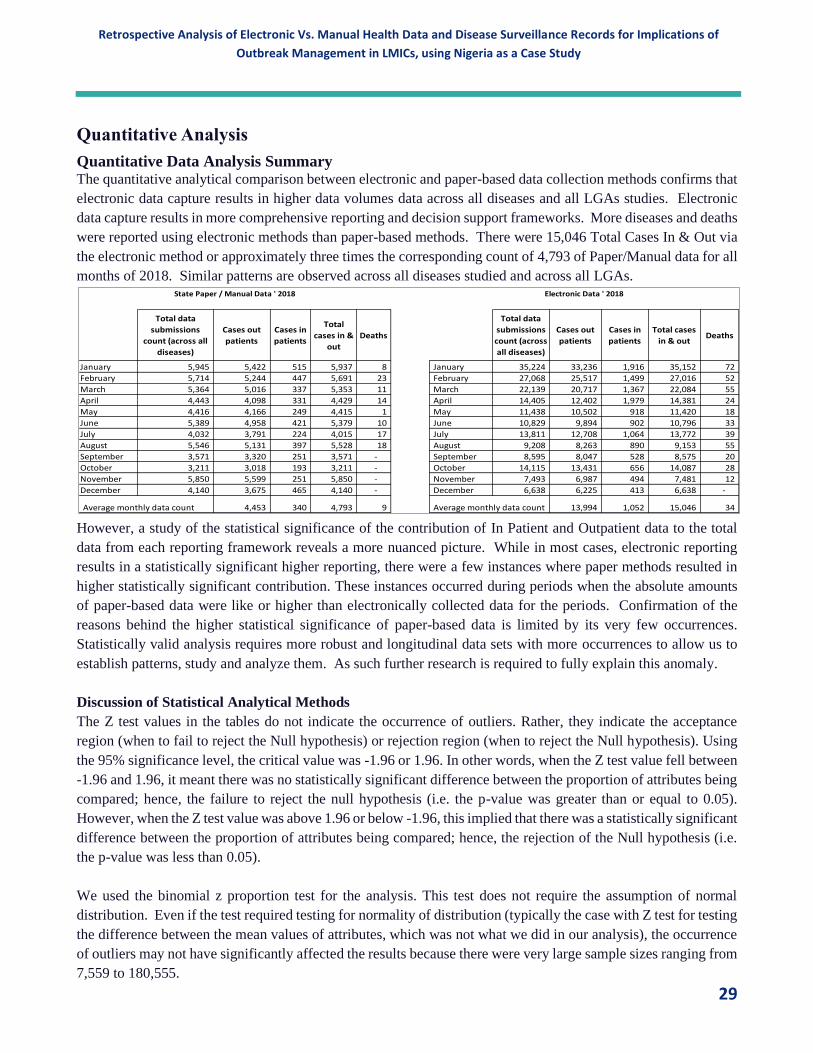
Quantitative Data Analysis Summary The quantitative analytical comparison between electronic and paper-based data collection methods confirms that
electronic data capture results in higher data volumes data across all diseases and all LGAs studies. Electronic
data capture results in more comprehensive reporting and decision support frameworks. More diseases and deaths
were reported using electronic methods than paper-based methods. There were 15,046 Total Cases In & Out via
the electronic method or approximately three times the corresponding count of 4,793 of Paper/Manual data for all
months of 2018. Similar patterns are observed across all diseases studied and across all LGAs.
However, a study of the statistical significance of the contribution of In Patient and Outpatient data to the total
data from each reporting framework reveals a more nuanced picture. While in most cases, electronic reporting
results in a statistically significant higher reporting, there were a few instances where paper methods resulted in
higher statistically significant contribution. These instances occurred during periods when the absolute amounts
of paper-based data were like or higher than electronically collected data for the periods. Confirmation of the
reasons behind the higher statistical significance of paper-based data is limited by its very few occurrences.
Statistically valid analysis requires more robust and longitudinal data sets with more occurrences to allow us to
establish patterns, study and analyze them. As such further research is required to fully explain this anomaly.
Discussion of Statistical Analytical Methods
The Z test values in the tables do not indicate the occurrence of outliers. Rather, they indicate the acceptance
region (when to fail to reject the Null hypothesis) or rejection region (when to reject the Null hypothesis). Using
the 95% significance level, the critical value was -1.96 or 1.96. In other words, when the Z test value fell between
-1.96 and 1.96, it meant there was no statistically significant difference between the proportion of attributes being
compared; hence, the failure to reject the null hypothesis (i.e. the p-value was greater than or equal to 0.05).
However, when the Z test value was above 1.96 or below -1.96, this implied that there was a statistically significant
difference between the proportion of attributes being compared; hence, the rejection of the Null hypothesis (i.e.
the p-value was less than 0.05).
We used the binomial z proportion test for the analysis. This test does not require the assumption of normal
distribution. Even if the test required testing for normality of distribution (typically the case with Z test for testing
the difference between the mean values of attributes, which was not what we did in our analysis), the occurrence
of outliers may not have significantly affected the results because there were very large sample sizes ranging from
7,559 to 180,555.
Total data
submissions
count (across all
diseases)
Cases out
patients
Cases in
patients
Total
cases in &
out
Deaths
Total data
submissions
count (across
all diseases)
Cases out
patients
Cases in
patients
Total cases
in & outDeaths
January 5,945 5,422 515 5,937 8 January 35,224 33,236 1,916 35,152 72
February 5,714 5,244 447 5,691 23 February 27,068 25,517 1,499 27,016 52
March 5,364 5,016 337 5,353 11 March 22,139 20,717 1,367 22,084 55
April 4,443 4,098 331 4,429 14 April 14,405 12,402 1,979 14,381 24
May 4,416 4,166 249 4,415 1 May 11,438 10,502 918 11,420 18
June 5,389 4,958 421 5,379 10 June 10,829 9,894 902 10,796 33
July 4,032 3,791 224 4,015 17 July 13,811 12,708 1,064 13,772 39
August 5,546 5,131 397 5,528 18 August 9,208 8,263 890 9,153 55
September 3,571 3,320 251 3,571 - September 8,595 8,047 528 8,575 20
October 3,211 3,018 193 3,211 - October 14,115 13,431 656 14,087 28
November 5,850 5,599 251 5,850 - November 7,493 6,987 494 7,481 12
December 4,140 3,675 465 4,140 - December 6,638 6,225 413 6,638 -
Average monthly data count 4,453 340 4,793 9 Average monthly data count 13,994 1,052 15,046 34
State Paper / Manual Data ' 2018 Electronic Data ' 2018

Retrospective Analysis of Electronic Vs. Manual Health Data and Disease Surveillance Records for Implications of
Outbreak Management in LMICs, using Nigeria as a Case Study
30
Analysis
Overall, higher number of diseases were reported all through the year in all the LGAs using the electronic data
collection method than the manual data collection method (Figure 1). However, there was a decline in the number
of diseases reported from January to December using both method, with a steeper decline in the electronic data
collection method which shows a sharp contrast between January (35,224 ) and December (6,638) cases reported.
Figure 1 below shows higher reported electronic data between January and March 2018. Reasons include possible
health worker excitement from being introduced to electronic data capture using newly issued tablet computers.
Some of the electronic data captured in this period also represent retrospective data from the prior December
Christmas holiday, entered in January as the system did not allow workers to enter data retrospectively. This
anomaly has since been fixed with a feature that allows retrospective data entry with corresponding dates.
Discussions with DSNOs suggest that the electronic data better represent their expectation of reported data
suggesting that data from paper-based collection methods may be underreported. This is explained by the arcane
process of collating and capturing paper based information to excel: PHCs complete paper IDSR forms monthly
and submit the paper forms to the LGA officials who collate all forms from all PHCs and enter them into excel
and forward the Excel files to the State officers. This process often results in missing forms, incomplete data and
subject to human data entry errors. Conversely, data entered directly on the electronic systems were automatically
computed at the PHC, LGA and State levels. These observations are also confirmed by the Completeness and
Accuracy Analyses.
Figure 1: Monthly number of all diseases reported using the manual and electronic data collection methods in
the three LGAs in 2018
Although there was a fluctuating pattern in the number of deaths reported in all the LGAs using both methods of
data collection, more deaths were reported using the electronic data collection method than the manual method.
Similar to the trend in the number of diseases reported in Figure 1, there was an overall decrease in the number of
reported deaths from January to December using both methods, with the electronic method showing a steeper
decrease from over 70 deaths in January to zero death in December (Figure 2). The higher electronic reporting
rates in January to March is explained by the combined impact of health worker excitement at being introduced
to electronic data capture using newly issued program devices and the entry of some of the December date in
January.
05,000
10,00015,00020,00025,00030,00035,00040,000
Nu
mb
er
of
dis
eas
es
rep
ort
ed
in a
ll LG
As
Month
Manual Electronic

Retrospective Analysis of Electronic Vs. Manual Health Data and Disease Surveillance Records for Implications of
Outbreak Management in LMICs, using Nigeria as a Case Study
31
Figure 2: Monthly number of deaths reported using the manual and electronic data collection methods in the
three LGAs in 2018
In Figure 3, more diseases were reported using the electronic data collection method compared with the manual
method. Specifically, Badagry LGA reported the highest number of diseases using both methods and this was
followed by Epe LGA. The trend in the diseases reported using the electronic method shows a gradual decline
from January to December in all the LGAs.
Number of diseases reported by LGAs
Figure 3: Monthly number of all diseases reported using the manual and electronic data collection methods by
LGAs in 2018
Using the manual method of data collection, Badagry LGA reported all the deaths while other LGAs reported no
deaths (Figure 4). Using the electronic method, Badagry LGA reported the most deaths followed by Epe LGA.
On the other hand, Ifedore LGA did not report any deaths using both methods.
01020304050607080
Nu
mb
er
of
de
ath
s re
po
rte
d in
al
l LG
As
MonthManual Electronic
0
1000
2000
3000
4000
5000
Manual data collection
Epe Badagry Ifedore
0
5000
10000
15000
20000
25000
Electronic data collection
Epe Badagry Ifedore

Retrospective Analysis of Electronic Vs. Manual Health Data and Disease Surveillance Records for Implications of
Outbreak Management in LMICs, using Nigeria as a Case Study
32
Number of deaths reported by LGAs
Figure 4: Monthly number of deaths reported using the manual and electronic data collection methods by LGAs
Table 1: Use of the manual and electronic data collection methods to report in-patient cases in the three LGAs
Month
Manual data Electronic data Z test
value
p-value of
difference
in
proportions
Total in- and
out-patient
cases
n
In-patient
cases
n (%)
Total in- and
out-patient
cases
n
In-patient
cases
n (%)
January 5937 515 (8.67) 35152 1916 (5.45) 9.738 <0.001
February 5691 447 (7.85) 27016 1499 (5.55) 6.684 <0.001
March 5353 337 (6.30) 22084 1367 (6.19) 0.287 0.774
April 4429 331 (7.47) 14381 1979
(13.76)
-11.148 <0.001
May 4415 249 (5.64) 11420 918 (8.04) -5.180 <0.001
June 5379 421 (7.83) 10796 902 (8.36) -1.155 0.248
July 4015 224 (5.58) 13772 1064 (7.73) -4.618 <0.001
August 5528 397 (7.17) 9153 890 (9.72) -5.276 <0.001
September 3571 251 (7.03) 8575 528 (6.16) 1.786 0.074
October 3211 193 (6.01) 14087 656 (4.66) 3.205 0.001
November 5850 251 (4.30) 7481 494 (6.60) -5.769 <0.001
December 4140 465 (11.23) 6638 413 (6.22) 9.249 <0.001
Total cases in the
year
57519 4081 (7.10) 180555 12626
(7.00)
0.835 0.404
0
20
40
60
80
Electronic data collection
Epe Badagry Ifedore
05
10152025
Manual data collection
Epe Badagry Ifedore

Retrospective Analysis of Electronic Vs. Manual Health Data and Disease Surveillance Records for Implications of
Outbreak Management in LMICs, using Nigeria as a Case Study
33
The manual data collection method reported a statistically significant (p<0.05) higher proportion of in-patient
cases in four months of the year (January, February, October and December), while the electronic method reported
a statistically significant (p<0.05) higher proportion of in-patient cases in five months of the year (April, May,
July August and November). Overall, there was not statistically significant (p=0.404) differences between the two
methods in reporting the total in-patient cases in 2018 (Table 1).
Table 2: Use of the manual and electronic data collection methods to report out-patient cases in the three LGAs
Month
Manual data Electronic data Z test
value
p-value of
difference
in
proportions
Total in- and
out-patient
cases
n
Out-patient
cases
n (%)
Total in- and
out-patient
cases
n
Out-patient
cases
n (%)
January 5937 5422
(91.33)
35152 33236
(94.55)
-9.738 <0.001
February 5691 5244
(92.15)
27016 25517
(94.45)
-6.683 <0.001
March 5353 5016
(93.71)
22084 20717
(93.81) -0.287 0.774
April 4429 4098
(92.53)
14381 12402
(86.24)
11.148 <0.001
May 4415 4166
(94.36)
11420 10502
(91.96) 5.180 <0.001
June 5379 4958
(92.17)
10796 9894
(91.65) 1.155 0.248
July 4015 3791
(94.42)
13772 12708
(92.27)
4.618 <0.001
August 5528 5131
(92.82)
9153 8263
(90.28) 5.277 <0.001
September 3571 3320
(92.97)
8575 8047
(93.84) -1.786 0.074
October 3211 3018
(93.99)
14087 13431
(95.34)
-3.205 0.001
November 5850 5599
(95.71)
7481 6987
(93.40) 5.769 <0.001
December 4140 3675
(64.61)
6638 6225
(93.78) -38.824 <0.001
Total cases in the
year
57519 53438
(92.90)
180555 167929
(93.00)
-0.835 0.404
Table 2 does not need to be reported because the p-values and Z test values are the same as those in Table 1. In
other words, Table 2 is a complement of Table 1 because it reports out-patient cases in all the LGAs.

Retrospective Analysis of Electronic Vs. Manual Health Data and Disease Surveillance Records for Implications of
Outbreak Management in LMICs, using Nigeria as a Case Study
34
Table 3: Use of the of the manual and electronic data collection methods to report in-patient cases in Badagry
LGA
Month
Manual data Electronic data Z test
value
p-value of
difference
in
proportions
Total in- and
out-patient
cases
n
In-patient
cases
n (%)
Total in- and
out-patient
cases
n
In-patient
cases
n (%)
January 3582 358 (9.99) 19499 1624 (8.33) 3.271 0.001
February 3518 257 (7.31) 16644 1288 (7.74) -0.878 0.380
March 2873 161 (5.60) 12298 1094 (8.90) -5.767 <0.001
April 2310 166 (7.19) 9534 1819
(19.08) -13.731 <0.001
May 2215 36 (1.63) 7101 735 (10.35) -13.013 <0.001
June 3103 307 (9.89) 6788 760 (11.20) -1.938 0.053
July 1882 158 (8.40) 11265 976 (8.66) -0.384 0.701
August 3397 220 (6.48) 6466 788 (12.19) -8.897 <0.001
September 1989 126 (6.35) 6313 513 (8.13) -2.614 0.009
October 1839 106 (5.76) 11716 649 (5.54) 0.390 0.696
November 4728 167 (3.53) 5646 485 (8.59) -10.572 <0.001
December 2542 319 (12.55) 4970 413 (8.31) 5.862 <0.001
Total cases in the
year
33978
2381 (7.01) 118240
11144
(9.43)
-13.803 <0.001
Table 3 shows that the manual method of data collection reported a statistically significant (p<0.05) higher
proportion of in-patient cases in Badagry LGA twice in the year (January and December), while the electronic
method reported a statistically significant (p<0.05) higher proportion of in-patient cases in six months of the year
(March, April, May, August, September and November). Overall, more total in-patient cases were reported using
the electronic method (9.4%) than the manual method (7.0%) in Badagry LGA and this difference was statistically
significant (p<0.001).

Retrospective Analysis of Electronic Vs. Manual Health Data and Disease Surveillance Records for Implications of
Outbreak Management in LMICs, using Nigeria as a Case Study
35
Table 4: Use of the manual and electronic data collection methods to report out-patient cases in Badagry LGA
Month
Manual data Electronic data Z test
value
p-value of
difference
in
proportions
Total in- and
out-patient
cases
n
Out-patient
cases
n (%)
Total in- and
out-patient
cases
n
Out-patient
cases
n (%)
January 3582 3224
(90.01)
19499 17875
(91.67)
-3.271 0.001
February 3518 3261
(92.70)
16644 15356
(92.26)
0.878 0.380
March 2873 2712
(94.40)
12298 11204
(91.10)
5.767 <0.001
April 2310 2144
(92.81)
9534 7715
(80.92)
13.731 <0.001
May 2215 2179
(98.38)
7101 6366
(89.65)
13.013 <0.001
June 3103 2796
(90.11)
6788 6028
(88.80)
1.938 0.053
July 1882 1724
(91.61)
11265 10289
(91.34)
0.384 0.701
August 3397 3177
(93.52)
6466 5678
(87.81)
8.897 <0.001
September 1989 1863
(93.67)
6313 5800
(91.87)
2.614 0.009
October 1839 1733
(94.24)
11716 11067
(94.46)
-0.390 0.696
November 4728 4561
(96.47)
5646 5161
(91.41) 10.572 <0.001
December 2542 2223
(87.45)
4970 4557
(91.69) -5.862 <0.001
Total cases in the
year
33978
31597
(92.10)
118240
107096
(90.58)
13.803 <0.001
Table 4 does not need to be reported because the p-values and Z test values are the same as those in Table 3
above. In other words, Table 4 is a complement of Table 3 because it reports out-patient cases in Badagry LGA.

Retrospective Analysis of Electronic Vs. Manual Health Data and Disease Surveillance Records for Implications of
Outbreak Management in LMICs, using Nigeria as a Case Study
36
Table 5: Use of the manual and electronic data collection methods to report in-patient cases in Ifedore LGA in
2018
Month
Manual data Electronic data Z test
value
p-value of
difference
in
proportions
Total in- and
out-patient
cases
n
In-patient
cases
n (%)
Total in- and
out-patient
cases
n
In-patient
cases
n (%)
January 853 0 (0.00) 6716 134 (2.00) -4.163 <0.001
February 474 0 (0.00) 3040 33 (1.09) -2.279 0.023
March 739 0 (0.00) 3163 77 (2.43) -4.284 <0.001
April 684 0 (0.00) 3548 103 (2.90) -4.511 <0.001
May 572 16 (2.80) 3151 93 (2.30) -0.201 0.840
June 751 30 (4.00) 2723 28 (1.03) 5.617 <0.001
July 688 11 (1.60) 1290 8 (0.62) 2.125 0.034
August 887 24 (2.71) 1521 4 (0.26) 5.394 <0.001
September 572 23 (4.02) 1455 14 (0.96) 4.630 <0.001
October 353 0 (0.00) 1330 6 (0.45) -1.264 0.206
November 612 21 (3.43) 1341 9 (0.67) 4.601 <0.001
December 374 0 (0.00) 867 0 (0.00) - -
Total cases in the
year
7559 125 (1.65) 30145 509 (1.69) -0.211 0.833
In Table 5, in Ifedore LGA, the manual data collection method reported a statistically significant (p<0.05) higher
proportion of in-patient cases in five months of the year (June, July, August, September and November), while
the electronic method reported a statistically significant (p<0.05) higher proportion of in-patient cases in four
months of the year (January, February, March and April). Overall, there was no statistically significant (p=0.833)
difference between the two methods in reporting the total in-patient cases in 2018 in Ifefore LGA.

Retrospective Analysis of Electronic Vs. Manual Health Data and Disease Surveillance Records for Implications of
Outbreak Management in LMICs, using Nigeria as a Case Study
37
Table 6: Use of the manual and electronic data collection methods to report out-patient cases in Ifedore LGA in
2018
Month
Manual data Electronic data Z test
value
p-value of
difference
in
proportions
Total in- and
out-patient
cases
n
Out-patient
cases
n (%)
Total in- and
out-patient
cases
n
Out-patient
cases
n (%)
January 853 853
(100.00)
6716 6582
(98.01)
4.163 <0.001
February 474 474 (10.00) 3040 3007
(98.92)
2.279 0.023
March 739 739
(100.00)
3163 3086
(97.54)
4.284 <0.001
April 684 684
(100.00)
3548 3445
(97.10)
4.511 <0.001
May 572 556 (97.20) 3151 3058
(97.05)
0.201 0.840
June 751 721 (96.01) 2723 2695
(98.97)
-5.617 <0.001
July 688 677 (98.40) 1290 1282
(99.38)
-2.125 0.034
August 887 863 (97.29) 1521 1517
(99.74)
-5.394 <0.001
September 572 549 (95.98) 1455 1441
(99.04)
-4.630 <0.001
October 353 353
(100.00)
1330 1324
(99.55)
1.264 0.206
November 612 591 (96.57) 1341 1332
(99.33) -4.601 <0.001
December 374 374
(100.00)
867 867
(100.00) - -
Total cases in the
year
7559 7434
(98.35)
30145 29636
(98.31)
0.211 0.833
Table 6 does not need to be reported because the p-values and Z test values are the same as those in Table 5
above. In other words, Table 6 is a complement of Table 5 because it reports out-patient cases in Ifefore LGA.
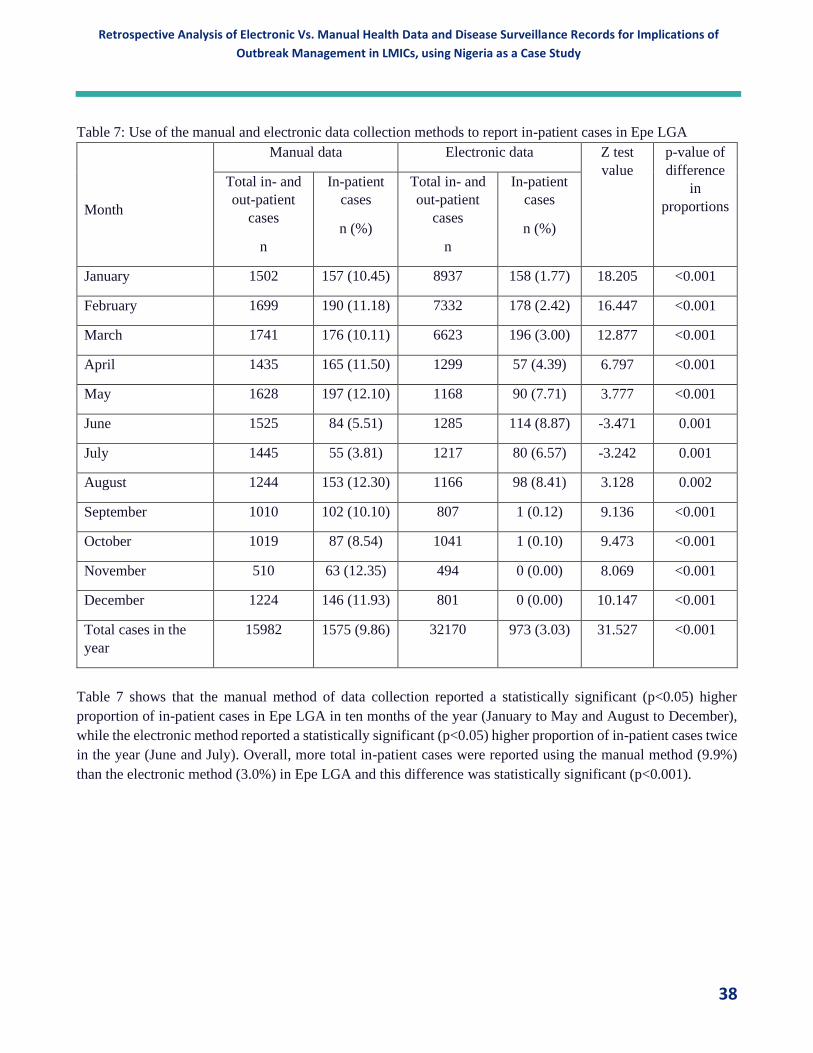
Retrospective Analysis of Electronic Vs. Manual Health Data and Disease Surveillance Records for Implications of
Outbreak Management in LMICs, using Nigeria as a Case Study
38
Table 7: Use of the manual and electronic data collection methods to report in-patient cases in Epe LGA
Month
Manual data Electronic data Z test
value
p-value of
difference
in
proportions
Total in- and
out-patient
cases
n
In-patient
cases
n (%)
Total in- and
out-patient
cases
n
In-patient
cases
n (%)
January 1502 157 (10.45) 8937 158 (1.77) 18.205 <0.001
February 1699 190 (11.18) 7332 178 (2.42) 16.447 <0.001
March 1741 176 (10.11) 6623 196 (3.00) 12.877 <0.001
April 1435 165 (11.50) 1299 57 (4.39) 6.797 <0.001
May 1628 197 (12.10) 1168 90 (7.71) 3.777 <0.001
June 1525 84 (5.51) 1285 114 (8.87) -3.471 0.001
July 1445 55 (3.81) 1217 80 (6.57) -3.242 0.001
August 1244 153 (12.30) 1166 98 (8.41) 3.128 0.002
September 1010 102 (10.10) 807 1 (0.12) 9.136 <0.001
October 1019 87 (8.54) 1041 1 (0.10) 9.473 <0.001
November 510 63 (12.35) 494 0 (0.00) 8.069 <0.001
December 1224 146 (11.93) 801 0 (0.00) 10.147 <0.001
Total cases in the
year
15982 1575 (9.86) 32170 973 (3.03) 31.527 <0.001
Table 7 shows that the manual method of data collection reported a statistically significant (p<0.05) higher
proportion of in-patient cases in Epe LGA in ten months of the year (January to May and August to December),
while the electronic method reported a statistically significant (p<0.05) higher proportion of in-patient cases twice
in the year (June and July). Overall, more total in-patient cases were reported using the manual method (9.9%)
than the electronic method (3.0%) in Epe LGA and this difference was statistically significant (p<0.001).

Retrospective Analysis of Electronic Vs. Manual Health Data and Disease Surveillance Records for Implications of
Outbreak Management in LMICs, using Nigeria as a Case Study
39
Table 8: Use of the manual and electronic data collection methods to report out-patient cases in Epe LGA
Month
Manual data Electronic data Z test
value
p-value of
difference
in
proportions
Total in- and
out-patient
cases
n
Out-patient
cases
n (%)
Total in- and
out-patient
cases
n
Out-patient
cases
n (%)
January 1502 1345
(89.55)
8937 8779
(98.23) -18.205 <0.001
February 1699 1509
(88.82)
7332 7154
(97.57) -16.447 <0.001
March 1741 1565
(89.89)
6623 6427
(97.04) -12.877 <0.001
April 1435 1270
(88.50)
1299 1242
(95.61) -6.797 <0.001
May 1628 1431
(87.90)
1168 1078
(92.30) -3.777 <0.001
June 1525 1441
(94.49)
1285 1171
(91.13) 3.471 0.001
July 1445 1390
(96.19)
1217 1137
(93.43) 3.242 0.001
August 1244 1091
(87.70)
1166 1068
(91.60) -3.128 0.002
September 1010 908 (89.90) 807 806 (99.88) -9.136 <0.001
October 1019 932 (91.46) 1041 1040
(99.90)
-9.473 <0.001
November 510 447 (87.65) 494 494
(100.00)
-8.069 <0.001
December 1224 1078
(88.07)
801 801
(100.00)
-10.147 <0.001
Total cases in the
year
15982 14407
(90.15)
32170 31197
(96.98)
31.527 <0.001
Table 8 does not need to be reported because the p-values and Z test values are the same as those in Table 7
above. In other words, Table 8 is a complement of Table 7 because it reports out-patient cases in Epe LGA.

Retrospective Analysis of Electronic Vs. Manual Health Data and Disease Surveillance Records for Implications of
Outbreak Management in LMICs, using Nigeria as a Case Study
40
Completeness Analysis
Study Setting
This study was conducted in all the functional health facilities in the study LGA between January and December
2018. Badagry had 57 functional public and private health facilities 21 Primary Health Centers (PHCs), 35 private
hospitals and 1 General hospital. Epe has 25 functional health facilities, 2 General hospitals, 4 private hospitals
and 19 PHCs. Ifedore has 28 health facilities, 1 general hospital and 27 PHCs.
State LGA No of facilities
Lagos Badagry 57
Epe 25
Ondo Ifedore 28
110
Results
Completeness of data was measured by the coverage count of the number of facilities that reported on the IDSR
003 forms across the 3 LGAs monthly. The table below shows the percentage of completeness in 2018. November
and December represent outliers in this analysis with paper-based reporting higher than e-data. Supervisors
required that paper forms be completed and submitted by facilities to comply with this part of their annual
performance evaluation. This resulted in facility workers focusing more on paper completion and submission,
later in the year, at the expense of e-data especially, as EDC was only being piloted and not accepted in place of
Paper.
Jan Feb March April May June July Aug Sep Oct Nov Dec
e-data (%) 96.3 92.6 95.4 88.9 94.5 96.3 96.3 93.6 93.6 87.1 75.2 67.0
Paper-based (%) 85.9 75.4 74.6 78.1 79.8 71.9 72.8 79.8 71.0 79.8 78.2 83.3
Table showing comparison between e-data and paper-based completeness
The above figure shows higher completeness rates for e-data across the year except for the month of November and
December.
96%93% 95%
89%95% 96% 96% 94% 94%
87%
75%
67%
86%
75% 75%78% 80%
72% 73%80%
71%
80% 79%83%
0%
20%
40%
60%
80%
100%
120%
Monthly Completeness Rate
e-Data Paper-Based

Retrospective Analysis of Electronic Vs. Manual Health Data and Disease Surveillance Records for Implications of
Outbreak Management in LMICs, using Nigeria as a Case Study
41
Average Monthly Completeness Rate
The total average completeness rate for e-data surveillance is 90% while paper-based surveillance is 78% showing
12% incremental data completeness associated with electronic surveillance.
Discussion
The completeness of electronic based surveillance is superior to the paper-based method. This study shows the
introduction of the electronic surveillance to the disease surveillance and notification system results in a 12%
higher in data completeness. A major feature of the electronic data capture that encourages data entry clerks to
report more data using electronic methods is the effectiveness is ease use and the ability to review data in real
time. Henry et al., 2012, also demonstrated that a smartphone data collection system was more likely to be
complete, have fewer inconsistencies and outperform paper systems for influenza sentinel surveillance in Kenya.
There was a higher incidence of incomplete records in the paper data than in the smartphone data adjusted to
incidence rate ratio. Similarly, our quantitative results on data completeness are consistent with findings from
Estelle et al., 2017 study which proved that interviews carried out using electronic data capture had a lower
proportion of missing data, and a level of internal validity, compared to those collected on paper.
Accuracy Analysis Electronic data capture systems are become important tools for endeavors that require high levels of data accuracy
including academic, medical device, biotech, and pharmaceutical research. Paper captured data involves data
capture with case report forms, which are sometimes subsequently entered into a database to create electronic
records. This method is time-consuming and error prone.
Thriemer, K., Ley, B., Ame, S.M. et al carried out a comparative study on paper data capture and Patient Digital
Assistant (PDA) based data collection during a fever surveillance study in Pemba Island, Zanzibar, Tanzania. Data
were collected on a 14-page case report paper form in the first period of the study. The Case Report Paper Forms
(CRF) were then replaced with handheld computers (personal digital assistants or PDAs). The PDAs were used
for screening and clinical data collection, including a rapid assessment of patient eligibility, real time errors, and
inconsistency checking. The comparison of paper-based data collection with PDA data collection showed that
direct data entry via PDA was significantly faster and 25% cheaper. Data was more accurate (7% versus 1%
erroneous data respectively) and omission did not occur with electronic data collection. According to their report,
a total of 180 patients were enrolled using paper-based data collection, and 2,209 patients were registered and
enrolled using PDAs. The use of paper CRFs was compared with direct data entry using PDAs in regard to
implementation, outcome, and costs.
90%
78%
Average
e-Data
Paper-Based

Retrospective Analysis of Electronic Vs. Manual Health Data and Disease Surveillance Records for Implications of
Outbreak Management in LMICs, using Nigeria as a Case Study
42
Omissions and accuracy for paper-based versus PDA based data collection
Replacing paper data collection forms with electronic data entry in the field: findings from a study of community-
acquired bloodstream infections in Pemba, Zanzibar
Paper PDA P
Number of variables checked
Number of records
Number (%) of omission
Number of variables checked
Number of records
Number (%) of omission
Omissions 32 180 342 (6%) 5 2209 0 (0% < 0.05
Accuracy 5 180 65 (7%) 5 2209 95 (1%) < 0.05
David G.D, Fraser P, Stephen R, et al postulated that the advantage of the Electronic Questionnaire (EQ) is its
increased data collection accuracy and this is based on the study of the African Partnership for Chronic Disease
Research (APCDR) who developed an open-source electronic questionnaire (EQ) to help facilitate large-scale
multicenter studies in sub-Saharan Africa. This validation study compares the APCDR EQ with traditional pen-
and-paper methods to assess the relative efficiency and accuracy of the EQ. The study compared the EQ against
traditional pen-and-paper methods using 200 randomized interviews conducted in an ongoing type 2 diabetes
case–control study in South Africa. The study showed that EQ had a lower number of major errors per 100
questions (EQ, 0.00 errors; paper, 0.59 errors; P < 0.001), as well as a lower overall number of errors per 100
questions (EQ, 0.17 errors; paper, 0.73 errors; P < 0.001). When using the pen-and-paper method, at least one
error occurred every three interviews on average (33.4% of interviews contained at least one error), whereas for
the EQ an error occurred once every 14 interviews on average (7.6% of interviews contained at least one error).
A study carried out by Walther B, Hossin S, Townend J, Abernethy N, et al compared four EDC methods with
the conventional approach with respect to duration of data capture and accuracy. This paper compared the
performance of four electronic data capture methods: PDA, Netbook, Tablet PC and EDC during a telephone
interview via mobile phone with the performance of conventional paper-based data collection in a Gambian
medical research field station setting. Over a study period of three weeks the error rates decreased considerably
for all EDC methods. In the last week of the study the data accuracy for the netbook (5.1%, CI95%: 3.5–7.2%)
and the tablet PC (5.2%, CI95%: 3.7– 7.4%) was not significantly different from the accuracy of the conventional
paper-based method (3.6%, CI95%: 2.2–5.5%), but error rates for the PDA (7.9%, CI95%: 6.0–10.5%) and
telephone (6.3%, CI95% 4.6–8.6%) remained significantly higher. While EDC interviews take slightly longer,
data became readily available after download, making EDC more time effective.
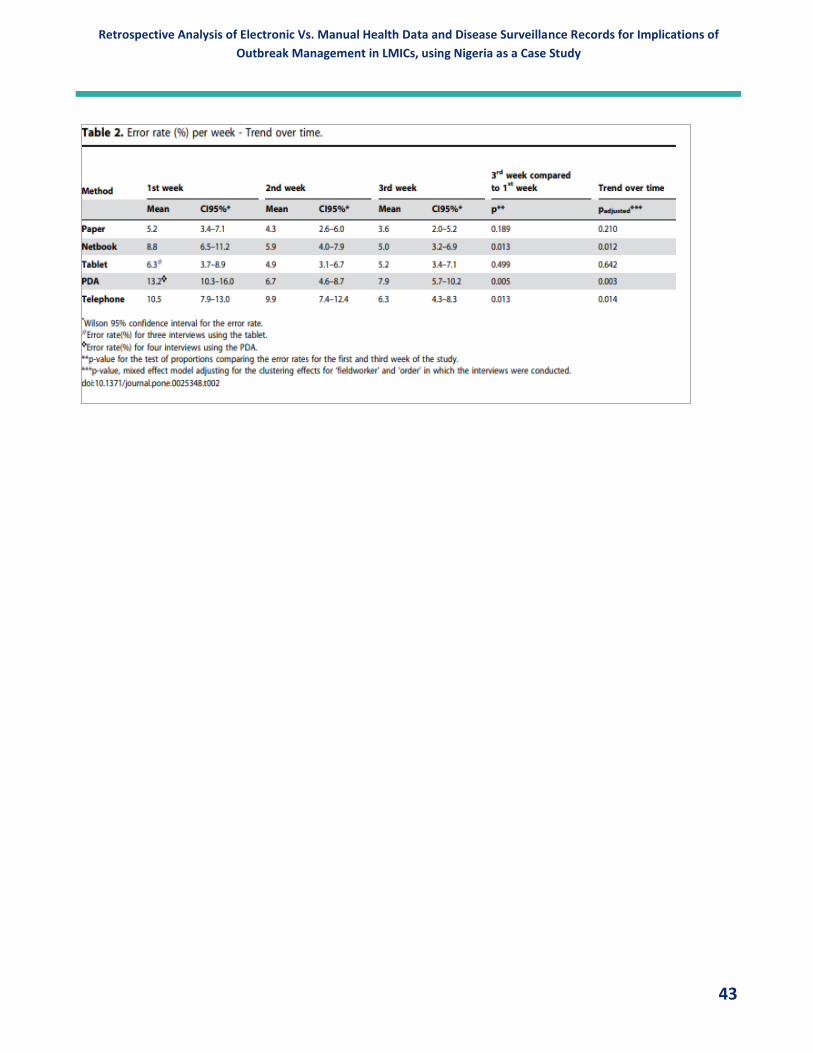
Retrospective Analysis of Electronic Vs. Manual Health Data and Disease Surveillance Records for Implications of
Outbreak Management in LMICs, using Nigeria as a Case Study
43

Retrospective Analysis of Electronic Vs. Manual Health Data and Disease Surveillance Records for Implications of
Outbreak Management in LMICs, using Nigeria as a Case Study
44
Electronic Surveillance: Outbreak Policy and Mitigation Planning
Imperatives
Our Qualitative and Quantitative analyses comparing Electronic and Paper reporting methods arrive at the same
conclusion: Electronic Data Collection and management is a superior method of data management for disease
surveillance and reporting in LMICs. In this section of the report we will present the implications of Electronic
Data Management and Surveillance on Outbreak Policy and Management in LMICs.
Priorities for Strengthening IDSR
As proxy for improved Disease Surveillance Reporting and Outbreak response we will first examine capacity for
Electronic Surveillance regimes to delivery on the priorities for strengthening IDSR. According to the WHO, the
priorities for strengthening IDSR are as follows:
• Improve IDSR Core Indicators (Please see Appendix 3 for the WHO Core IDSR Indicators)
o Timely and complete reporting (tools, guidelines, and case definitions)
o Timely outbreak detection and response
o Log of suspected outbreaks and rumors
o Regular feedback
• Build capacity of Surveillance personnel (SE, DSNOs, FPs)
o Optimize monthly review meetings
o Joint supervision and review of surveillance performance
o Prioritization of supportive supervision
o Data analysis and Use for data for action
o Outbreak investigation, reporting and response
• Improve documentation
o State and LGA levels e.g. activities, meetings, supervision, etc.
The Electronic Data sets analyzed against paper-based records in this research were electronic forms of Nigeria’s
IDSR Forms (001, 002 and 003). Therefore, the availability of timely, accurate and relatively complete electronic
data sets in the three study LGAs demonstrate the capacity of electronic surveillance to deliver on the following
priorities for strengthening IDSR directly:
• Improve IDSR core indicators
o Timely and complete reporting (tools, guidelines, and case definitions)
o Timely outbreak detection and response
o Log of suspected outbreaks and rumours
o Regular feedback
• Build capacity of Surveillance personnel
o Data analysis and Use for data for action
Electronic surveillance provides the mechanisms through which the following priorities of strengthening IDSR
can be addressed:
• Build capacity of Surveillance personnel
o Optimize monthly review meetings

Retrospective Analysis of Electronic Vs. Manual Health Data and Disease Surveillance Records for Implications of
Outbreak Management in LMICs, using Nigeria as a Case Study
45
o Joint supervision and review of surveillance performance
o Outbreak investigation, reporting and response
Syndromic Surveillance
Early detection of outbreaks is a significant factor in controlling outbreaks. According to an excerpt from the
WHO Key Facts About Major Deadly Diseases (V1, PartI, Page 18), “Recent outbreaks, however, show how
difficult this can be, even with good public health surveillance systems. Early recognition of emergence typically
starts with clinicians who can detect unusual clusters of severe cases, take samples to allow laboratory diagnostics
and alert surveillance units”.
Syndromic surveillance has been established by the literature as the most practical surveillance approach in low
resource settings. Syndromic Surveillance uses pre-diagnostic data and statistical algorithms to detect epidemics
which may include unusual diseases with non-specific presentations. Syndromic surveillance tools are ideal for
implementation in resource-limited settings given the inherently weak healthcare and laboratory systems. There
are very few laboratories in rural areas given that most labs are concentrated in the urban centers. The few
available in the rural areas, and even most in urban areas, are basic labs that are not capable of carrying out
advanced testing. During the 2015 incident of acute methanol poisoning in Ondo State tissue samples were sent
hundreds of kilometers away to the National Hospital Abuja and to the University College Hospital Ibadan for
toxicology studies. Such infrastructure levels are grossly inadequate for effective and timely outbreak response.
It is important therefore that this lag-time caused by the need for laboratory testing and diagnoses is reduced by
surveillance of pre-diagnostic syndromes of these diseases, serving as an early warning of impeding disease
outbreaks and these are communicated through the disease surveillance community to alert of possible outbreaks
in a more timely manner. Syndromic Surveillance also supports public health “situational awareness” by
facilitating the monitoring of the effectiveness of epidemic responses as well as by characterizing affected
populations.
Predictive Analytics
Predictive analytics is a broad term describing a variety of statistical and analytical techniques used to develop
models that predicts future events or behaviors. The form of these predictive models varies, depending on the
behavior or event that they are predicting. Predictive analytics encompasses a variety of statistical techniques
from data mining, predictive modelling, and machine learning, that analyze current and historical facts to
make predictions about future or otherwise unknown events.
Predictive analytics along with most predictive models and data mining techniques rely on increasingly
sophisticated statistical methods including multivariate analysis techniques such as advanced regression or time-
series model. Such techniques enable organizations to determine trends and relationships that may not be readily
apparent, but still enable it to better predict future events or behaviors.
The use of climate data for predicting outbreaks of infectious diseases dates to work by Gill and others in India.
Gill (1923) developed an EWS for malaria based on rainfall, prevalence of enlarged spleens, economic conditions
(price of food grains) and epidemic potential (the coefficient of variation of fever mortality during October for the
period 1828-1921). Iwayemi Akin et al noted that Nigeria and the rest of Sub-Saharan Africa (SSA) are yet to
effectively join the rest of the world in making extensive use of this important decision-making tool. Yet, the
conditions for their use exist with the increasingly large amount of administrative, health, economic, financial,
social, and technical data set generated by government’s offices, business enterprises and households.

Retrospective Analysis of Electronic Vs. Manual Health Data and Disease Surveillance Records for Implications of
Outbreak Management in LMICs, using Nigeria as a Case Study
46
Malaria, as one of the most serious infectious diseases causing public health problems in the Africa, affects about
two-thirds of the world population, with estimated resultant deaths close to a million annually. In view of this,
Modu, Babagana & Polovina, Nereida et al carried out a study which aimed to design and deploy an intelligent
malaria outbreak early warning system, which is a mobile application that predicts malaria outbreak based on
climatic factors using machine learning algorithms. The system will help hospitals, healthcare providers, and
health organizations take precautions in time and utilize their resources in case of emergency. This study also
makes a significant contribution by identifying hidden ecological factors of malaria (e.g., temperature, humidity,
wind, location, drought, floods, etc.).
Disease Outbreak Mitigation Planning
The development of suitable pandemic mitigation strategies is a challenging task, which must consider numerous
epidemiological, sociological, logistical, and operational factors. Since the devastation from a pandemic could
occur very rapidly (perhaps, in a few weeks), it is essential that scalable mitigation strategies supported by
comprehensive and scientifically valid models are developed beforehand and made available to the healthcare
delivery decision makers. Such strategies could also serve as valuable tools for healthcare personnel training and
preparedness exercises.
Strengths and Challenges of Newly Emerging Surveillance Systems
Internet-based systems are intuitive, adaptable, and inexpensive to maintain, and operate in real time. Advanced
computational capabilities enable automated and rapid collection of large volumes of data, referred to as “big
data”, and provide the public with “real-time” detection and improved early notification of localized outbreaks.
In addition, a system based on web queries can easily be applied to various infectious diseases, as the underlying
mechanisms could be similar.
However, internet-based surveillance systems have been met with some skepticism. Due to the unstructured
nature of the data sources, interpreting the information may require overly complex techniques to effectively
implement the system initially. A powerful cited case study is the Google Flu Trend (GFT) proposition through
which, in 2008, researchers from Google claimed that they could “nowcast” the flu based on people’s searches.
Unfortunately, GFT missed the peak of the 2013 flu season by 140 percent and was subsequently shut down by
Google. Data sharing permits more and better-quality data to be used to monitor public health and potential
outbreaks. However, use of data with precise information connected to individuals raise privacy concerns. Careful
and appropriate decisions need to be made to avoid any further privacy intrusion on personal information.
Although monitoring trends in disease outbreaks and health outcomes is possible, forecasting them is susceptible
to false positives or false negatives. Thus, data sources must be evaluated extensively, particularly to identify gaps
in coverage and false decisions. Challenges with data integration, compatibility, and evaluating surveillance
systems will likely remain well into the future. As such continued evolution backed by more research will be
necessary.

Retrospective Analysis of Electronic Vs. Manual Health Data and Disease Surveillance Records for Implications of
Outbreak Management in LMICs, using Nigeria as a Case Study
47
Electronic Disease Surveillance in LMICs: Policy Options
The increased availability of data afforded by EDC systems will improve the capacity of LMICs to prepare for
and mange outbreaks if they occur. EDCs which include electronic surveillance can help LMICs to improve
integrated disease surveillance and response core indicators, including timely and complete reporting; timely
outbreak detection and response; building capacity of surveillance personnel and the use of data for action. If
LMICs successfully introduce and scale EDCs and electronic surveillance, critical imperatives such the use of
syndromic surveillance for early disease outbreak detection and predictive analytical models and algorithms for
outbreak prediction which in turn will inform disease outbreak prevention strategies.
ICTs have become ubiquitous across all aspects human endeavor including business, governance, education, and
commerce; just to name a few. ICT has also played a critical role in improving health care for individuals and
communities by enabling new and more efficient ways of accessing, communicating, and storing information.
LMICs must adopt ICT frameworks and platforms to effectively position themselves to fully take advantage of
the potential that EDC and electronic surveillance systems present for proactive disease surveillance and response.
Technologies that present the unifying ecosystem include the following:
• Electronic Medical Records Systems that have been adopted at hospitals and now increasingly in primary
health care facilities
• Supply Chain Management Systems
• Disease Surveillance and Response
• Health Worker Training
• Human Resource Management
• Telemedicine/Telehealth
• Health Insurance Management
• Treatment Adherence/Appointment Reminders
Adoption of the above technologies will provide multiple benefits to countries that adopt them. The most
immediate benefits relate to the core health systems strengthening imperative of outbreak mitigation. ICT
technologies that are currently deployed in the region will help accomplish the use of syndromic surveillance for
early outbreak warning; outbreak prediction using big data and artificial intelligence principles; inform vector
control activities and build health worker capacity to detect, control and manage diseases and outbreaks.
Outbreak Mitigation
Disease outbreak mitigation planning through the development of scalable mitigation strategies could also serve
as valuable tools for healthcare personnel training and preparedness exercises. The most cost-effective strategies
for increasing outbreak preparedness, especially in resource-constrained settings of LMICs include investments
to strengthen core public health infrastructure, including water and sanitation systems; increasing situational
awareness; and rapidly extinguishing sparks that could lead to pandemics. Outbreak mitigation strategies which
ICT adoption will inform and strengthen include:
Strengthening Health Systems: To mitigate the impact of epidemics, protect the health workforce and ensure
continuity of health services during and after them, stronger health systems are needed. Epidemics and pandemics
put these systems under great pressure and stress. The sudden influx of large numbers of sick individuals to health
facilities stretches the systems’ capacity and resources, even more so and more noticeably where resources are

Retrospective Analysis of Electronic Vs. Manual Health Data and Disease Surveillance Records for Implications of
Outbreak Management in LMICs, using Nigeria as a Case Study
48
already scarce. Furthermore, health care settings, and especially emergency rooms, can become hubs of
transmission. Many people get infected there if prevention and control measures are not properly implemented.
A delay in the recognition of the disease will lead to delay in applying the right protection measures. In countries
where there are health staff shortages, the loss of several more health workers further weaken the health system.
It takes years to train new medical staff and rebuild the health workforce if significant numbers of the health
workforce are lost from exposure to epidemics. Long-term substantial investments should therefore be made to
strengthen health systems, so they are able to provide safe, effective, and qualitative health services before, during
and after epidemics. Critical elements include the following:
• An appropriate health financing system
• A fit-for-purpose workforce that is trained, safe and provided with personal protective equipment
• Access to essential medical products and technologies
• Business continuity plans to ensure that health systems are strong enough to withstand the increased needs
and to mitigate the impacts of outbreaks.
Prevention of Vector-Borne Diseases (VBD): To prevent the transmission of VBDs, actions can be taken to protect
human beings from the vectors and/or to eliminate or reduce vectors population. These actions include vector
control, community engagement, and personal protection. Vector Control Activities are deployed at the
community level to eliminate the vectors and larvae as much as possible, to prevent or control the transmission of
VBDs. The operationalization of vector control varies according to the type of vector and transmission intensity.
Mosquito surveillance is part of vector control and helps improve timeliness of decisions to control mosquito
populations and prevention disease. Both larval and adult vector populations should be targeted for surveillance.
Epidemiological and entomological surveillance/indicators should be collected and analyzed in close
collaboration.
Other vector control activities include:
• Environmental measures through sanitation, habitat management and livestock management.
• Mechanical measures with trapping of vectors.
• Biological tools using natural enemies and biological larvicides for mosquitoes.
• Other chemicals such as the use of mimics of natural hormones to stop the insect development.
A new generation of vector control products is also arriving with genetically modified organisms. For example,
The State of Florida announced in August 2020, a program to release of genetically modified mosquitoes as part
of its vector control program. The success of the new program still has not been evaluated yet and as such cannot
yet be recommended as an effective vector control method.
Community Engagement also an important component for controlling VBDs. Through participative actions, such
as recommendations for personal protection in the working places and schools, elimination of breeding sites,
installation of window screens, and overall surveillance of the environment to make it less favorable for
mosquitoes, are some of the major actions that can be taken by communities.
Nigeria has arguably transitioned from experimentation and early adoption phases of health ICT, to increasingly
scaled implementation of ICT projects. The private sector has played an important role in this transition through
entrepreneurial initiatives and Public, Private Partnerships which have resulted in the use of ICT across the

Retrospective Analysis of Electronic Vs. Manual Health Data and Disease Surveillance Records for Implications of
Outbreak Management in LMICs, using Nigeria as a Case Study
49
spectrum of healthcare delivery services. NCDC used an electronic active case management SORMAS since 2017
and has recently extended and SORMAS open to all priority health facilities in all Nigeria’s LGAs. This as well
as other private sector led initiatives including the Nigeria Tuberculosis and Leprosy Foundation use of real time
electronic data capture systems for tuberculosis surveillance present important examples of scalable electronic
data regimes that allow for more accurate, timely, and complete data for health policy and strategy, especially to
manage disease outbreaks.
Nigeria has arguably transitioned from experimentation and early adoption phases of health ICT, to increasingly
scaled implementation of ICT projects. The private sector has played an important role in this transition through
entrepreneurial initiatives and Public, Private Partnerships which have resulted in the use of ICT across the
spectrum of healthcare delivery services. Specific ICTs for adoption include the following:
• Electronic Medical Records Systems that have been adopted at hospitals and now increasingly in primary
health care facilities (e.g. Helium Health, InStrat)
• Supply Chain Management (e.g. LMIS, Spoxil)
• Disease Surveillance and Response (e.g. SORMAS, EWORS, MSERS)
• Health Worker Training (e.g. VTR Mobile)
• Human Resource Management (e.g. HRIS)
• Telemedicine/Telehealth (e.g. MobiHealth, MDoc)
• Health Insurance Management (e.g. Care Pay, InStrat); Treatment Adherence/Appointment Reminders
(e.g. txtalert).
Adoption of the above technologies will provide multiple benefits to countries that adopt them. The most
immediate benefits relate to the Core Health systems strengthening imperative of Outbreak Mitigation. ICT
technologies that are currently deployed in the region will help accomplish the following:
• Use of Syndromic Surveillance for early outbreak warning
• Outbreak prediction using Big Data and Artificial Intelligence principle
• Inform vector control activities
• Build health worker capacity to detect, control and manage diseases and outbreaks
Conclusion
All research conducted including the Quantitative, Qualitative, Completeness and Accuracy Analyses yielded
conclusions that electronic health data management was a superior system of data collection and management for
disease surveillance and response and health policy more generally. Electronic data regimes will provide
frameworks through which Governments can improve Integrated Disease Surveillance and Response core
indicators using electronic surveillance. As such adopting ICT technologies and platforms will help governments
to adopt a more proactive footing as it relates to disease surveillance and response management. ICT will support
efforts to strengthen health systems, prevent vector borne and other infectious diseases, improve health outcomes
and save lives. These platforms and strategies will help LMICs that adopt them to better comply with the SDG 3:
Good Health and Wellbeing.

Retrospective Analysis of Electronic Vs. Manual Health Data and Disease Surveillance Records for Implications of
Outbreak Management in LMICs, using Nigeria as a Case Study
50
References CHRETIEN, J., BURKOM, H.S., SEDYANINGSIH, E.R., LARASATI, R.P., LESCANO, A.G., MUNDACA,
C.C., BLAZES, D.L., MUNAYCO, C.V., COBERLY, J.S. and ASHAR, R.J., 2008. Syndromic surveillance:
adapting innovations to developing settings. PLoS medicine, 5(3), pp. e72.
HANAFUSA, S., MUHADIR, A., SANTOSO, H., TANAKA, K., ANWAR, M., SULISTYO, E.T. AND
HACHIYA, M., 2012. A surveillance model for human avian influenza with a comprehensive surveillance
system for local-priority communicable diseases in South Sulawesi, Indonesia. Tropical medicine and
health, 40(4), pp.141-147.
HENNING, K.J., 2004. What is syndromic surveillance? Morbidity and Mortality Weekly Report, pp. 7-11.
LEWIS, S.H. AND CHRETIEN, J.P., 2008. The potential utility of electronic disease surveillance systems in
resource-poor settings. Johns Hopkins APL Technical Digest, 27(4), pp.366-373.
MANDL, K.D., OVERHAGE, J.M., WAGNER, M.M., LOBER, W.B., SEBASTIANI, P., MOSTASHARI, F.,
PAVLIN, J.A., GESTELAND, P.H., TREADWELL, T. and KOSKI, E., 2004. Implementing syndromic
surveillance: a practical guide informed by the early experience. Journal of the American Medical Informatics
Association, 11(2), pp. 141-150.
REIS, B.Y. and MANDL, K.D., 2003. Integrating syndromic surveillance data across multiple locations: effects
on outbreak detection performance. AMIA ...Annual Symposium proceedings.AMIA Symposium, , pp. 549-
553.
SINGH, R.P., KUMAR, D., ROUTH, D., SHARMA, S.K., SEKHAR, B., DESWAL, B.S. AND SUD, A., 2017.
Reaching the Unreached: Challenges and Experiences in South Sudan.
SINGER, P.A., BERNDTSON, K., TRACY, C.S., COHEN, E.R., MASUM, H., LAVERY, J.V. AND DAAR,
A.S., 2007. A tough transition. Nature, 449(7159), p.160.
SISWOYO, H., PERMANA, M., LARASATI, R.P., FARID, J., SURYADI, A. and SEDYANINGSIH, E.R.,
2008. EDC: using a syndromic-based surveillance tool for disease outbreak detection in Indonesia, BMC
proceedings2008, BioMed Central, pp. S3.
WORLD HEALTH ORGANIZATION, 2014. Public health events of initially unknown etiology: A framework
for preparedness and response in the African Region. World Health Organization.
B.L. Gleason, A. Kamara, N. Clemens, D. Kargbo. International Journal of Infectious Disease. Establishment of
an electronic integrated disease surveillance and response system in Sierra Leone.
https://doi.org/10.1016/j.ijid.2018.11.275
Bernstein AB, et al. Public health surveillance data: legal, policy, ethical, regulatory, and practical issues.
MMWR Surveill Summ. 2012;61:30–4
Retrospective Analysis of Electronic Vs. Manual Health Data and Disease Surveillance Records for Implications of
Outbreak Management in LMICs, using Nigeria as a Case Study
51
Chan EH, et al. Using web search query data to monitor dengue epidemics: a new model for neglected tropical
disease surveillance. PLoS Negl Trop Dis. 2011;5(5):e1206.
Choi, J., Cho, Y., Shim, E. et al. Web-based infectious disease surveillance systems and public health
perspectives: a systematic review. BMC Public Health 16, 1238 (2016). https://doi.org/10.1186/s12889-016-
3893-0
Corinne Grainger. A software for disease surveillance and outbreak response - Insights from implementing
SORMAS in Nigeria and Ghana. Federal Ministry for Economic Cooperation and Development (BMZ), March
2020
Decatur, GA. Public Health Informatics Institute. (2013). Electronic Disease Surveillance System (EDSS)
Vendor Analysis, Public Health Informatics Institute
Developing digital surveillance indicators and online disease dashboards based on social media to inform
infectious disease surveillance in Africa. Africa Centres for Disease Control and Prevention, African Union
Commission, E Health Africa.
Elvis E. Isere,1,2 Akinola A. Fatiregun,1 and Ikeoluwapo O. Ajayi. An overview of disease surveillance and
notification system in Nigeria and the roles of clinicians in disease outbreak prevention and control. Niger Med J
v.56(3); May-Jun 2015 PMC4518330
European Commission; Disease Surveillance and Outbreak Response Technology in West Africa. Published on
24 April 2020
Hale TM, et al. Rural-urban differences in general and health-related internet use. American Behavioral
Scientist Thousand Oaks; 2010.
Heymann DL, Chen L, Takemi K, Fidler DP, Tappero JW, Thomas MJ, Kenyon TA, Frieden TR, Yach D,
Nishtar S, Kalache A, Olliaro PL, Horby P, Torreele E, Gostin LO, Ndomondo-Sigonda M, Carpenter D,
Rushton S, Lillywhite L, Devkota B, Koser K, Yates R, Dhillon RS, Rannan-Eliya RP Lancet. Global health
security: the wider lessons from the West African Ebola virus disease epidemic2015 May 9; 385(9980):1884-
901
https://whatis.techtarget.com/definition/National-Electronic-Disease-Surveillance-System-NEDSS
Ibrahima Socé Fall, Soatiana Rajatonirina, Ali Ahmed Yahaya, Yoti Zabulon, Peter Nsubuga, Miriam Nanyunja,
Joseph Wamala, Charles Njuguna, Charles Okot Lukoya, Wondimagegnehu Alemu, Francis Chisaka Kasolo,
Ambrose Otau Talisuna. Integrated Disease Surveillance and Response (IDSR) strategy: current status,
challenges and perspectives for the future in Africa BMJ Glob Health. 2019; 4(4): e001427. Published online
2019 Jul 3. doi: 10.1136/bmjgh-2019-001427. PMCID: PMC6615866
Mawudeku A, et al. The global public health intelligence network, Infectious Disease Surveillance. Secondth ed.
2013. p. 457–69

Retrospective Analysis of Electronic Vs. Manual Health Data and Disease Surveillance Records for Implications of
Outbreak Management in LMICs, using Nigeria as a Case Study
52
National Electronic Disease Surveillance System Working Group. National Electronic Disease Surveillance
System (NEDSS): a standards-based approach to connect public health and clinical medicine. J Public Health
Manag Pract. 2001;7(6):43-50.
Pattie DC, et al. A public health role for internet search engine query data? Mil Med. 2009;174(8):xi–xii.
Perscheid C et al. (2018). Ebola Outbreak Containment: Real-Time Task and Resource Coordination with
SORMAS. Frontiers in ICT; 5(7). Available at:
https://www.frontiersin.org/articles/10.3389/fict.2018.00007/full.
Reis BY, Kohane IS, Mandl KD. An epidemiological network model for disease outbreak detection. PLoS Med.
2007;4(6):e210.
Reynolds, E. M., MacDonald, P., & Diallo, B. I. (2019). Implementation of an electronic disease surveillance
system in Guinea, 2016 - 2018.Online Journal of Public Health Informatics, 11(1).
https://doi.org/10.5210/ojphi.v11i1.9836
Samoff E, et al. Integration of syndromic surveillance data into public health practice at state and local levels in
North Carolina. Public Health Reports; 2012: p. 310–317.
Technical Guidelines for INTEGRATED DISEASE SURVEILLANCE AND RESPONSE IN THE AFRICAN
REGION 2010 2ND EDITION
WHO Africa: Technical Guidelines for Integrated Disease Surveillance and Response in the African Region
WHO/Africa; Sierra Leone leads the way in Africa with fully functional electronic disease surveillance system.
Willard SD, Nguyen MM. Internet search trends analysis tools can provide real-time data on kidney stone
disease in the United States. Urology. 2013;81(1):37–42
Wilson K, Brownstein JS. Early detection of disease outbreaks using the internet. Can Med Assoc J.
2009;180(8):829–31
World Health Organisation Integrated epidemiological surveillance of diseases: regional strategy for
communicable diseases (resolution AFR/RC48/R2). Harare, Zimbabwe: Forty-eighth Session of the WHO
Regional Committee for Africa; 1998. [Google Scholar] [Ref list
World Health Orgznisation Health Emergencies Programme in the African Region: Annual Report Regional
Office for Africa; 2016. http://www.afro.who.int/fr/node/8317 [Google Scholar] [Ref list]
Estelle McLean, Albert Dube, Jacky Saul, Keith Branson, Mabvuto Luhanga, Oddie Mwiba, Fredrick
Kalobekamo, Steffen Geis & Amelia C Crampin (2017). Implementing electronic data capture at a well-
established health and demographic surveillance site in rural northern Malawi, Global Health Action, 10:1,
1367162, DOI: 10.1080/16549716.2017.1367162

Retrospective Analysis of Electronic Vs. Manual Health Data and Disease Surveillance Records for Implications of
Outbreak Management in LMICs, using Nigeria as a Case Study
53
Henry N Njuguna, Deborah L Caselton, Geoffrey O Arunga, Gideon O Emukule , Dennis K Kinyanjui, Rosalia
M Kalani, Carl Kinkade, Phillip M Muthoka, Mark A Katz and Joshua A Mott (2011-2012). A comparison of
smartphones to paper-based questionnaires for routine influenza sentinel surveillance, Kenya. DOI
10.1186/s12911-014-0107-5
David G.Dillonab FraserPiriec StephenRiced CristinaPomillaab Manjinder S.Sandhuab Ayesha A.Motalac
Elizabeth H.Youngab on behalf of the African Partnership for Chronic Disease Research (APCDR). Open-
source electronic data capture system offered increased accuracy and cost-effectiveness compared with paper
methods in Africa.
Giduthuri JG, Maire N, Joseph S, et al. Developing and validating a tablet version of an illness explanatory
model interview for a public health survey in Pune, India. PLoS One. 2014;9:e107374. [Crossref], [Web of
Science ®], [Google Scholar]
Matthias Havenaar (May 02, 2019). An essential guide to Electronic Data Capture in clinical research
Thriemer, K., Ley, B., Ame, S.M. et al. Replacing paper data collection forms with electronic data entry in the
field: findings from a study of community-acquired bloodstream infections in Pemba, Zanzibar. BMC Res Notes
5, 113 (2012). https://doi.org/10.1186/1756-0500-5-113
Walther B, Hossin S, Townend J, Abernethy N, Parker D, et al. (2011) Comparison of Electronic Data Capture
(EDC) with the Standard Data Capture Method for Clinical Trial Data. PLoS ONE 6(9): e25348.
doi:10.1371/journal.pone.0025348
Disease Control Priorities: Improving Health and Reducing Poverty. 3rd edition. Jamison DT, Gelband H,
Horton S, et al., editors. Washington (DC): The International Bank for Reconstruction and Development / The
World Bank; 2017 Nov 27. https://www.ncbi.nlm.nih.gov/books/NBK525302/
Managing epidemics: key facts about major deadly diseases. Geneva: World Health Organization; 2018.
Licence: CC BY-NC-SA 3.0 IGO.https://www.who.int/emergencies/diseases/managing-epidemics-
interactive.pdf
Debahuti Mishra, Asit Kumar Das, Mausami and Sashikala Mishra. Predictive Data mining : Promising Future
and Applications. Int. J of Computer and Communication Technology, Vol.2, No. 1, 2010. Pg. 20-27.
Fedson, D. S., & Hant, S. (2003). Pandemic Influenza and the Global Vaccine Supply. Clinical Infectious
Deseases, 36, 1552-1561.
George, D.B., Taylor, W., Shaman, J. et al. Technology to advance infectious disease forecasting for outbreak
management. Nat Commun 10, 3932 (2019). https://doi.org/10.1038/s41467-019-11901-7
Gill CA, (1923) The prediction of malaria epidemics. Indian Journal of Medical Research, 10: 1136-1143.
https://www2.deloitte.com/us/en/insights/topics/analytics/predictive-analytics-health-care-value-
risks.html.Predictive analytics in health care: Emerging value and risks.

Retrospective Analysis of Electronic Vs. Manual Health Data and Disease Surveillance Records for Implications of
Outbreak Management in LMICs, using Nigeria as a Case Study
54
Halloran, M. E., Longini, I. M., Nizam, A., & Yang, Y. (2002). Containing Bioterrorist Smallpox (Vol. 298;
Tech. Rep. No. 5597).
Institute of Medicine. (2004). Financing Vaccines in the 21st Century: Assuring Access and Availability (Tech.
Rep.).
Iwayemi, Akin & Iwayemi, Abiodun & Mohammed, Abdul. (2017). Big Data and Predictive Analytics: Whither
Nigeria and Sub-Saharan Africa.
Johns Hopkins Bloomberg School of Public Health. (2005). MIDAS Computer Simulation Analyzes Strategies
for Stopping Flu Pandemic Grant. http://www.jhsph.edu/publichealthnews/
press_releases/2005/cummings_midas.html
Kumar, Vaibhav & L., M.. (2018). Predictive Analytics: A Review of Trends and Techniques. International
Journal of Computer Applications. 182. 31-37. 10.5120/ijca2018917434.
Lauren Neal;University of Texas of the Permian Basin | UTPD · Department of Psychology 19.38 · PhD
Longini, I. M., Halloran, M. E., Nizam, A., & Yang, Y. (2004). Containing pandemic influenza with antiviral
agents. American Journal of Epidimiology, 159, 623-633.
Longini, I. M., & Hill, A. N. (2003). The critical vaccination fraction for heterogeneous epidemic models.
Mathematical Biosciences, 181, 85-106.
Modu, Babagana & Polovina, Nereida & Lan, Yang & Konur, Savas & Asyhari, Taufiq & Peng, Yonghong.
(2017). Towards a Predictive Analytics-Based Intelligent Malaria Outbreak Warning System. Applied Sciences.
7. 836. 10.3390/app7080836.
Mr. Chandrashekar G , Dr. N V R Naidu and Dr. G S Prakash, Predictive Analytics Tools and Techniques.
Global Journal of Finance and Management. ISSN 0975-6477 Volume 6, Number 1 (2014), pp. 59-66 ©
Research India Publications http://www.ripublication.com
Nyce, Charles (2007), Predictive Analytics White Paper (PDF), American Institute for Chartered Property
Casualty Underwriters/Insurance Institute of America, p. 1
Patel, R., Longini, I. M., & Halloran, M. E. (2005). Finding optimal vaccination strategies for pandemic
influenza using genetic algorithms. Journal of Theoretical Biology, 234, 201-212.
Schiavo R, May Leung M, Brown M. Communicating risk and promoting disease mitigation measures in
epidemics and emerging disease settings. Pathog Glob Health. 2014;108(2):76-94.
doi:10.1179/2047773214Y.0000000127
Stevenson, Erin (December 16, 2011), "Tech Beat: Can you pronounce health care predictive analytics?",
Times-Standard, archived from the original on August 4, 2014, retrieved July 2, 2012
U.S. HHS. (2007). Pandemic Flu: Planning and Response Activities. http://www.pandemicflu. gov/plan/.

Retrospective Analysis of Electronic Vs. Manual Health Data and Disease Surveillance Records for Implications of
Outbreak Management in LMICs, using Nigeria as a Case Study
55
World Health Organization 2004 . Using Climate to Predict Infectious Disease Outbreaks: A Review
WHO.(2004). World Health Organization: Influenza. http://www.who.int/mediacenter/
factsheets/2003/fs211/en/.
Youssef Travaly and Kevin Muvunyi. The future is intelligent: Harnessing the potential of artificial intelligence
in Africa

Retrospective Analysis of Electronic Vs. Manual Health Data and Disease Surveillance Records for Implications of
Outbreak Management in LMICs, using Nigeria as a Case Study
56
Appendix 1: Lessons Learnt Report Overview
InStrat Global Health Solutions is pleased to submit a Lessons Learned Report as part of the final deliverables
under the Innovations Award for the Retrospective Analysis of Electronic Vs. Manual Health Data and Disease
Surveillance Records for Implications of Outbreak Management in LMICs, using Nigeria as a Case Study. This
Lessons Learned Report address major risks and challenges that InStrat encountered during the research project
and the steps taken to mitigate them. This report also includes answers to the Output Indicator Questions as
required by the Guidelines for Final Reports and Lessons Learned. This report is included in the main project
report as an Appendix.
Risks/Mitigation
The major risk that InStrat encountered in the conduct of this project is the outbreak of the Corona Virus Pandemic
and the attendant business closures and social distancing requirements.
Fortunately, we were required to present a Contingency Plan prior to the initiation of this project. The plan
contained actions that we met the Project’s deliverables without violating local or international COVID-19
Management Guidelines or endangering the health and wellbeing of any of our staff, partners, or stakeholders. To
mitigate the risks posed by the COVID 19 Pandemic, we meticulously followed the plan and instituted human
resources measures to ensure staff compliance. The key elements of the risks and mitigation steps taken are
presented in the tablet below:
Function Platform Actions
Communications
Telephone This was the predominant mode of
communication allowing us to coordinate
amongst our team, set up research
interviews and coordinate field data
gathering activities.
Telephone conference Lines We made extensive use our ‘Free
Conference’ facility to hold voice calls
that involved multiple people in areas
where there was poor internet
connectivity. This was heavily used in
field data canvassing in Ondo State.
Email Official communication between InStrat
team as well as with external parties that
supported the various research efforts for
the project.
WhatsApp Coordination and alignment
communication requiring rapid response
and feedback.
Zoom/Skype This was extensively used for meetings
that required real time screen sharing.

Retrospective Analysis of Electronic Vs. Manual Health Data and Disease Surveillance Records for Implications of
Outbreak Management in LMICs, using Nigeria as a Case Study
57
Desk Research Internet The desk research was conducted online
using the internet to access google, State
Government websites and resources,
Local libraries, and research websites.
Analytics and
collaboration
Google Shared Platforms Project analytics and collaboration to
write the final report were conducted
using Google Shared platforms including
Google Sheets and Google Docs.
Database AWS All data acquired for this purpose was
stored on secure cloud servers with
access provided to analysts.
Our diligent use of the above platforms facilitated effective collaboration within the InStrat team internally, and
with research counterparts externally allowing us to perform all functions in a virtual environment and delivering
the project on time without compromising the quality of the research project.
Responses to Output Indicator Questions:
1. Have there been any final results or outcomes in which data or methods have allowed data to be produced:
faster; more cheaply; at a higher resolution or granularity, or where there was no data before? If yes, please
describe.
As a research project this project did not directly produce any data that can be used faster; more cheaply;
at a higher resolution or granularity, or where there was no data before. However, this research identified
policy imperatives and options for adopting Information and Communications Technologies (ICT) to
accomplish identified goal though data that is produced faster, more cheaply, more completely, and more
accurate and better linked to outcomes.
2. Has the project contributed to the production and/or use of data disaggregated by a) sex b) disability c) age,
d) geography (or other)? If yes, please summarize the of types of disaggregation and the context.
As a research project this project did not produce any data that can directly contribute to the production
and/or use of data disaggregated by a) sex b) disability c) age, d) geography (or other). However, the
research identified policy options for ICT adoption that will lead to the production of such data.
3. Has the project contributed to the use and/or production of gender statistics? If yes, please describe.
As a research project this project has not contributed directly to the use and/or production of gender
statistics. However, the ICT platforms recommended for adoption will allow the use and/or production
of gender statistics.
Retrospective Analysis of Electronic Vs. Manual Health Data and Disease Surveillance Records for Implications of
Outbreak Management in LMICs, using Nigeria as a Case Study
58
Lessons Learned
• Technical
o The requirement to produce a Corona Virus contingent plan provided InStrat a roadmap for navigating
the project during the pandemic. We recommend that all projects be required to develop risk
mitigation plans.
o Clearly defined project planning including project objectives, timelines and research frameworks and
especially, constraints on uses of the funding helped InStrat to execute the project within the
guidelines specified.
• Organizational
o The project had a clear and effective governance framework with project roles, communications
channels, and protocols between the World Bank team and InStrat team.
o InStrat’s selection of Project collaborators that had deep expertise in their selected roles and a track
record of performance allowed effective adherence to sub deliverables, the Corona Virus restrictions
notwithstanding.
• Potential for Replicability and Scalability
o This research project did not develop any specific technologies or prototypes that could be replicable
or scalable. However, the technologies identified for possible adoption to address opportunities
identified in the research are all replicable across all areas of Public health in LMICs and highly
scalable within individual countries.
Conclusions
All research conducted including the Quantitative, Qualitative, Completeness and Accuracy Analyses yielded
conclusions that electronic health data management was a superior system of data collection and management for
disease surveillance and response and health policy more generally. Electronic data regimes will provide
frameworks through which Governments can improve Integrated Disease Surveillance and Response core
indicators using electronic surveillance. As such adopting ICT technologies and platforms including Electronic
Medical Records Systems, Disease Surveillance and Response systems, electronic Health Worker Training and
Telemedicine/Telehealth platform will help governments to adopt a more proactive footing as it relates to disease
surveillance and response management. ICT will support efforts to strengthen health systems, prevent vector
borne and other infectious diseases, improve health outcomes and save lives. These platforms and strategies will
help LMICs that adopt them to better comply with the SDG 3: Good Health and Wellbeing.
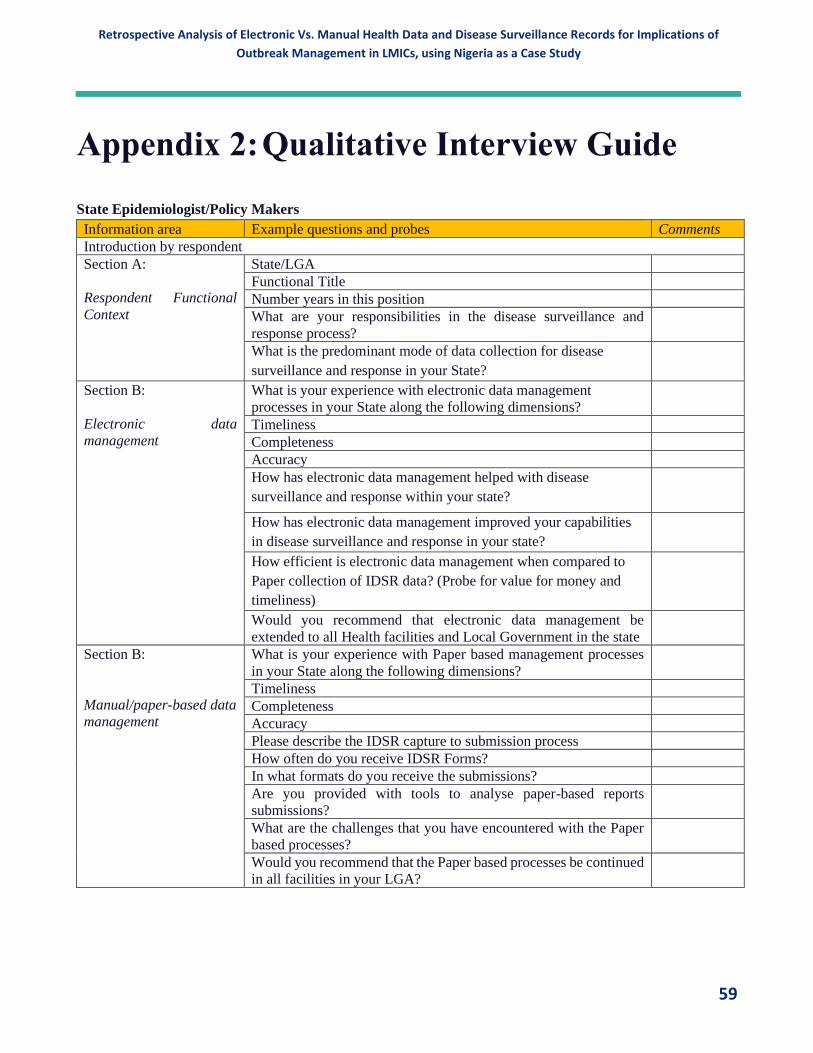
Retrospective Analysis of Electronic Vs. Manual Health Data and Disease Surveillance Records for Implications of
Outbreak Management in LMICs, using Nigeria as a Case Study
59
Appendix 2: Qualitative Interview Guide
State Epidemiologist/Policy Makers
Information area Example questions and probes Comments
Introduction by respondent
Section A:
Respondent Functional
Context
State/LGA
Functional Title
Number years in this position
What are your responsibilities in the disease surveillance and
response process?
What is the predominant mode of data collection for disease
surveillance and response in your State?
Section B:
Electronic data
management
What is your experience with electronic data management
processes in your State along the following dimensions?
Timeliness
Completeness
Accuracy
How has electronic data management helped with disease
surveillance and response within your state?
How has electronic data management improved your capabilities
in disease surveillance and response in your state?
How efficient is electronic data management when compared to
Paper collection of IDSR data? (Probe for value for money and
timeliness)
Would you recommend that electronic data management be
extended to all Health facilities and Local Government in the state
Section B:
Manual/paper-based data
management
What is your experience with Paper based management processes
in your State along the following dimensions?
Timeliness
Completeness
Accuracy
Please describe the IDSR capture to submission process
How often do you receive IDSR Forms?
In what formats do you receive the submissions?
Are you provided with tools to analyse paper-based reports
submissions?
What are the challenges that you have encountered with the Paper
based processes?
Would you recommend that the Paper based processes be continued
in all facilities in your LGA?
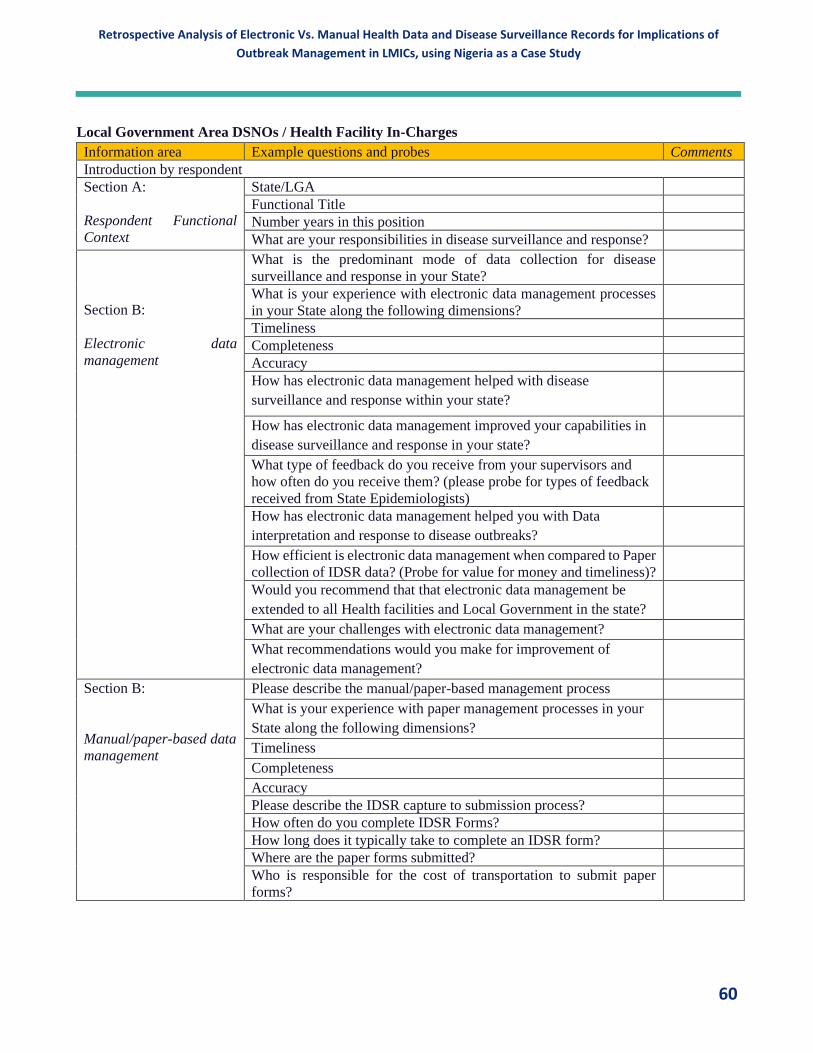
Retrospective Analysis of Electronic Vs. Manual Health Data and Disease Surveillance Records for Implications of
Outbreak Management in LMICs, using Nigeria as a Case Study
60
Local Government Area DSNOs / Health Facility In-Charges
Information area Example questions and probes Comments
Introduction by respondent
Section A:
Respondent Functional
Context
State/LGA
Functional Title
Number years in this position
What are your responsibilities in disease surveillance and response?
Section B:
Electronic data
management
What is the predominant mode of data collection for disease
surveillance and response in your State?
What is your experience with electronic data management processes
in your State along the following dimensions?
Timeliness
Completeness
Accuracy
How has electronic data management helped with disease
surveillance and response within your state?
How has electronic data management improved your capabilities in
disease surveillance and response in your state?
What type of feedback do you receive from your supervisors and
how often do you receive them? (please probe for types of feedback
received from State Epidemiologists)
How has electronic data management helped you with Data
interpretation and response to disease outbreaks?
How efficient is electronic data management when compared to Paper
collection of IDSR data? (Probe for value for money and timeliness)?
Would you recommend that that electronic data management be
extended to all Health facilities and Local Government in the state?
What are your challenges with electronic data management?
What recommendations would you make for improvement of
electronic data management?
Section B:
Manual/paper-based data
management
Please describe the manual/paper-based management process
What is your experience with paper management processes in your
State along the following dimensions?
Timeliness
Completeness
Accuracy
Please describe the IDSR capture to submission process?
How often do you complete IDSR Forms?
How long does it typically take to complete an IDSR form?
Where are the paper forms submitted?
Who is responsible for the cost of transportation to submit paper
forms?

Retrospective Analysis of Electronic Vs. Manual Health Data and Disease Surveillance Records for Implications of
Outbreak Management in LMICs, using Nigeria as a Case Study
61
Appendix 3: Quantitative Survey for State
Officials 1. Highest Qualification
2. State
• Lagos
• Ondo
3. Local Government Area
• Badagry
• Epe
• Ifedore
4. Facility
Text
5. Title
• Disease Surveillance Notification Officer
• State Epidemiologist
• Community Health Extension Worker
• Facility In-Charge
6. On a scale of 1 (Has not helped me at all) to 7 (Has Been extremely helpful), please rate how Electronic Data
Management helps you improve data interpretation and response to disease outbreaks
7. Electronic Data Management has helped you?
• Report data in a timely manner
• Respond to infectious diseases in a timely manner
• Report data completely
• Respond to infectious diseases effectively
• Build your capacity in disease surveillance and response
• Other (please specify)
8. What do you like about Electronic Data Management?
• Provide trend analysis for infectious diseases
• Provides for reliable data
• Provides for real-time data relay
• Provide for early recognition of possible outbreaks
• Provides for rational interpretation of data into meaningful presentations
• Other (please specify)
9. Rate use of Electronic Data Management tablet from 1 to 5
1 - Very Poor
2 - Poor
3 - Fair

Retrospective Analysis of Electronic Vs. Manual Health Data and Disease Surveillance Records for Implications of
Outbreak Management in LMICs, using Nigeria as a Case Study
62
4 - Good
5 - Excellent
• Ease of use tablet
• Network connectivity
• Understanding of Terms used in the tablet
• Training
• Feedback (Following complaints with use of tablet)
10. Would you recommend Electronic Data Management to other health workers not currently using it?
• Yes
• No
• Maybe
14. How much of an impact do you feel Electronic Data Management has had on your work?
• A great deal of impact
• A lot of impact
• A moderate amount of impact
15. What are the challenges you face using Electronic Data Management?
• Training received before Electronic Data Management commenced was inadequate
• Inability to take the tablets home
• Poor internet connectivity at the health facility / Office
• Inadequate feedback from supervisors
• Tablet Freezes (Temporarily stops working)
• Other (please specify)
16. How satisfied are you with your work with the use of Electronic Data Management?
• Very Satisfied
• moderately Satisfied
• Neutral
17. How do you think Electronic Data Management can be improved to be more efficient?
Text

Retrospective Analysis of Electronic Vs. Manual Health Data and Disease Surveillance Records for Implications of
Outbreak Management in LMICs, using Nigeria as a Case Study
63
Appendix 4: WHO IDSR Core Indicators
Indicator Target Calculation
Proportion of suspected
outbreaks of epidemic prone
disease notified to the
national level within 2 days of
surpassing the epidemic
threshold
Target 80%
Monthly
Number of suspected outbreaks of epidemic prone diseases notified to the national level within 2 days of surpassing the epidemic Threshold in a
given time period Total
Number of suspected outbreaks of epidemic prone diseases in
the same time period * 100
Proportion of LGAs in which
a current line graph is
available for selected priority
diseases
Target 80%
Monthly
Number of LGAs with a Current line
graph in a Given time period.
Number of LGAs * 100
Proportion of reports of
investigated outbreaks that
includes analyzed case-
based data
Target 80%
Monthly
Number of outbreak investigation
reports that Include EPI curve, mapping,
Personal Tables and case-based forms or line lists in a given time period Number of outbreaks Investigation
reports in the same time period * 100
Indicator Target Calculation
Proportion of health facilities
submitting surveillance
reports on time to the LGA
Target 80%
Monthly
Number of health Facilities Submittingreports on time to the LGAs in a Giventime period
Total number of Health facilities that should report to the LGAs *100
Proportion of LGAs
submitting weekly or monthly
surveillance reports on time
to the State level
Target 80%
Monthly
Number of LGAs that submitted IDSR
reports on time to the State level in a given
time period
Total Number of LGAs that should
Report to the State level in the same time period * 100
Proportion of cases of
diseases targeted for
elimination, eradication and
any other diseases selected
for case-based surveillance
reported with case-based or
line-listing forms.
Target 80%
Monthly
Number of diseases targeted for
elimination, eradication, and any
diseases selected for case-based
surveillance reported with case-based forms or line List in a given
Time period
Number of diseases targeted for
elimination, eradication and any other disease selected for case-based surveillance in the same time period * 100
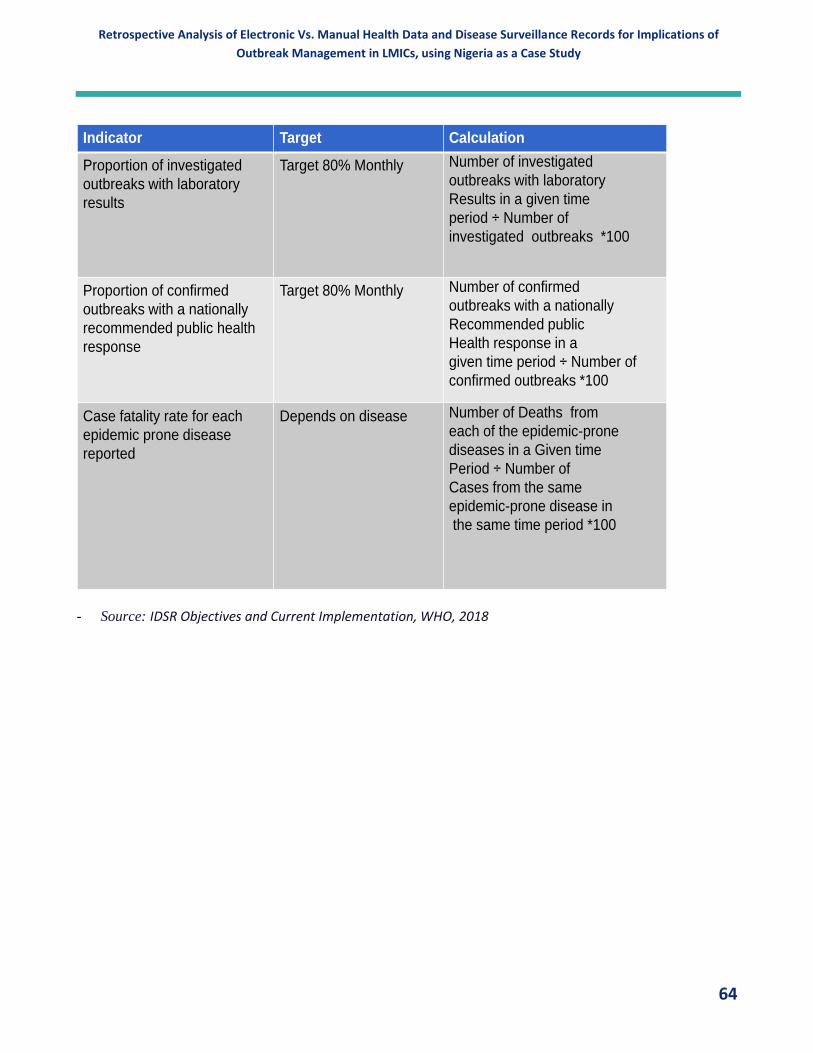
Retrospective Analysis of Electronic Vs. Manual Health Data and Disease Surveillance Records for Implications of
Outbreak Management in LMICs, using Nigeria as a Case Study
64
- Source: IDSR Objectives and Current Implementation, WHO, 2018
Indicator Target Calculation
Proportion of investigated
outbreaks with laboratory
results
Target 80% Monthly Number of investigated
outbreaks with laboratory
Results in a given time
period Number of
investigated outbreaks *100
Proportion of confirmed
outbreaks with a nationally
recommended public health
response
Target 80% Monthly Number of confirmed
outbreaks with a nationally
Recommended public
Health response in a
given time period Number of
confirmed outbreaks *100
Case fatality rate for each
epidemic prone disease
reported
Depends on disease Number of Deaths from
each of the epidemic-prone
diseases in a Given time
Period Number of
Cases from the same
epidemic-prone disease in
the same time period *100