Embed Size (px)
Citation preview
Retirement Housing in Sheffield
Supply and Demand to 2034
University of Sheffield
Retirement Housing in Sheffield: Supply and Demand to 2034
Contents
Contents 2
Acknowledgements 3
Authors 3
Summary 4
1 Introduction 9
2 The challenge of demographic change 11
3 Methodology 15
4 Presentation of the Data 18
5 Testing the Assumptions 32
6 An Alternative Model: Shop@ 36
7 Affordability of Retirement Housing in Sheffield 40
Appendix 1: Data Sources used in the Main Model 47
Appendix 2: Sheffield Housing Market Areas 48
Retirement Housing in Sheffield: Supply and Demand to 2034
3
Acknowledgements
The report’s authors would like to thank officers at Sheffield City Council for providing data and providing comment on drafts, in particular Andy van Vliet and Dan Green. The work was carried out as part of the Research Council UK/EPSRC funded DWELL project (EP/K03717X/1), which seeks to identify ways of planning and designing housing and neighbourhoods that are suitable for an ageing population. See: http://dwell.group.shef.ac.uk/ for further details.
Authors
Professor Malcolm Tait, Department of Urban Studies and Planning, University of Sheffield
Dr Adam Park, School of Architecture, University of Sheffield
Retirement Housing in Sheffield: Supply and Demand to 2034
4
Summary
Background and Approach
This report sets out the scale and location of retirement housing (housing designed and/or occupied solely by older people, but not including care and nursing homes, nor ‘standard’ age-banded properties without any form of extra support) required in Sheffield to 2034. This type of housing, which includes sheltered housing, and extra care housing, forms an important part of the housing stock of the city, playing a distinct specialist role in meeting older people’s needs. Whilst most older people live in non-specialist, or ‘general needs’ housing, retirement housing plays an important role in providing accommodation that is more suitable and/or desirable for this group than general needs housing. The report presents an analysis of demographic trends, and the current supply of retirement housing, before presenting the shortfall and surplus of this type of housing in each of the 13 Sheffield Housing Market Areas, both currently and in 2034. An analysis of the affordability of retirement housing is also presented.
The report uses two models to enable predictions to be made of the surplus and shortfall of retirement housing in Sheffield. The first model draws on work by Three Dragons Consultancy for the Greater London Authority, and predicts future need for housing across different districts and different tenures using assumptions of the rate of older people needing to move into retirement housing at a rate of 2.5% of households in 65-75 group and 15% of households in 75+ group. The second model presents analysis from the Shop@ model that uses different assumptions of the rate of older people who need to move. Testing of the models is carried out by using locally-specific data to vary the assumptions being used for demand, enabling a more sensitive appreciation of factors that are specific to Sheffield.
Findings
In 2015, there were 92,000 people over the age of 65 living in Sheffield; by 2034, this is projected to have increased to 124,000. The growth will be most rapid amongst the population over 85, which will nearly double over this period. Older households (defined for the purposes of this report as those with a ‘household representative person’ over 65) will similarly grow from 63,931 in 2015 to a projected 85,484 in 2034, with a steeper rise in single person households compared to multi-person households. The highest numbers of older person households are in the South East, North East, South West and City Centre West areas, with greater proportions of owner occupation in the South West and Peak District National Park (both over 80% of all older households), whilst there are high rates of social renting in the City Centre and Manor Abourthorne and Gleadless (both over 50%).
Retirement Housing in Sheffield: Supply and Demand to 2034
5
The current supply of retirement housing in Sheffield is 2,800 units, with the great majority (2,298) being sheltered dwellings. Extra Care1 provision is lower with 502 units in eight schemes. The geographical distribution of retirement housing is also uneven, with four housing market areas containing the majority of sheltered units: City Centre West (473 units), Chapeltown and Ecclesfield (390 units), South East (390 units), and Manor Arbourthorne and Gleadless (232 units).
Current Surplus/Shortfall
Using the Three Dragons Model and its base assumptions, in 2011 5,230 older households were seeking to move into retirement housing, the majority being households over 75 years old. The greatest concentration of these households was in the South, South East, South West and North East amongst owners, and South East and North East amongst renters. The model suggests that with current supply, there is a total shortfall of 2,430 units of retirement housing across the city based on 2011 data. The only areas without a shortfall were the City Centre, City Centre West and Chapeltown and Ecclesfield. The most serious shortfalls were in the South East (-422 units), North East (-421 units), and South West (-452 units).
2034 Surplus/Shortfall
Using the same assumptions, the model calculated surplus/shortfall in each of the 13 housing market areas. In total, 7,567 households over 65 would seek to move in 2034, with the majority being owner occupiers. Assuming the same number of units in 2034 as in 2011, would mean a total shortfall in the city of 4,767 units, or 317 dwellings each year for the 15 years being modelled. The only area with a surplus would be City Centre. The most significant shortfalls would be South East (-882), North East (-717), South West (-705) and South (-523).
Testing the Assumptions
Using questionnaire data from the Sheffield Strategic Housing Market Assessment 2013, allowed testing of the rates at which people expected or would like to move to retirement housing. Whilst only small samples were available in some housing market areas, the overall picture for Sheffield indicated a greater shortfall than produced in the Three Dragons Model.
1 Extra Care Housing is a relatively new model of housing, which offers age-restricted, self-contained dwellings that are designed to enable care to be relatively easily delivered. They differ from residential care homes is that residents are not obliged to obtain care services from one provider. There are similarities to sheltered housing, though higher levels of care are generally delivered in Extra Care Housing. Because this is a fairly new model of housing, definitions abound, but see Riseborough et al (2015) for more discussion on definitions of Extra Care Housing.
Retirement Housing in Sheffield: Supply and Demand to 2034
6
Scenario testing was also undertaken to vary the assumptions, both for an ‘optimistic’ rate of 2% of 65-75 households and 12% of 75+ households, and a ‘pessimistic’ rate of 3% of 65-75 households and 20% of 75+ households. The total citywide shortfall under the ‘optimistic’ scenario would be 3,254 by 2034, whilst for the ‘pessimistic’ scenario it would be 7,164 by this date. The ‘optimistic’ scenario could be achieved if more general needs housing was suitable for older households, meaning less demand for retirement housing. Similarly, assuming that (because of normal wear and tear) half of all current retirement housing would need to be replaced by 2034 indicated a need (based on baseline assumptions of rates of moving) of 6,167 extra units to be in place by this date.
Shop@ Model
An alternative Model – the Shop@ model was also used. This has different assumptions for the rates at which older people need to move into retirement housing, as well as using different categorisations of this housing to project supply and demand. According to the Shop@ assumptions (based on the ‘More Choice, Greater Voice’ report), the demand per 1,000 people over 75 for specialist accommodation is 170 sheltered/extra care units. The current figure for provision in Sheffield is 92 units per 1,000 population over 75. Only in the City Centre and Chapeltown and Ecclesfield is provision above the Shop@ level, with lowest levels of provision in East, South West, and Peak District.
Overall, the Shop@ model indicates a current shortfall for Sheffield of 4,511 retirement housing units, whilst by 2035 (the end date of this model) the shortfall would be 8,201 retirement housing units.
Demand for Retirement Housing and the impact of more accessible general needs housing
Whilst the figures produced using both the Three Dragons and Shop@ models indicate significant shortfalls in retirement housing up to 2034, this does not mean that such outcomes will inevitably occur. One of the main variables used in calculating the demand for retirement housing is the rate at which households over 65 move into this type of accommodation. The models use national rates, and test this against Sheffield-specific data from the Strategic Housing Market Assessment. However, these rates could either rise or fall depending on a range of factors. Rates could rise if overall health in the older population declines, or if there is an increasing awareness of and desire amongst this group to live in retirement housing. However, rates could fall if general needs housing becomes more attractive and/or suitable for older households. Standards such as ‘Lifetime Homes’, ‘Wheelchair Accessible Housing’ and their successor equivalents of Category 2 or 3 housing are designed to provide accommodation that is better able to meet the needs of ageing occupants. Building more of this housing is likely to mean, all other factors staying the same, that there would be less demand for retirement housing.
Retirement Housing in Sheffield: Supply and Demand to 2034
7
Tenure
Most retirement housing in Sheffield is social rented, making up approximately 80% of these dwellings. The large majority is contained in sheltered housing, with higher proportions of private housing contained in Extra Care Housing. The Three Dragons model indicates relatively high levels of demand for owner-occupiers to move into owner-occupied retirement housing (4026 households), and some demand for shared ownership amongst this group (710 households). This presents a particularly acute challenge in providing owner-occupied, private retirement housing, and shared equity housing, echoing previous studies2.
Affordability of Retirement Housing
The affordability of retirement housing depends on a range of factors including income levels, savings, and equity (normally held in housing), as well as access to state help/benefits. The Three Dragons Model indicates that the highest proportion of rental (largely social rented) accommodation is required in City Centre, North East, and Manor Arbourthorne and Gleadless, with highest proportion of sale properties in South West, though total numbers required varies due to the different populations of each area.
Analysis of Strategic Housing Market Assessment data indicate a wide variation in income levels of older people across the city, ranging from over 70% of 65+ households in South West having an annual income over £20,000, whereas in the East, Manor Arbourthorne and Gleadless, and Rural Upper Don Valley less than 15% of 65+ households receive income over this amount. Savings levels are more even across the city, though nearly half of all 65+ households who have savings over £20,000 live in just two areas: South West and City Centre West. Average house prices also vary widely across Sheffield, from £63,760 in North East to £213,094 in South West, indicating different levels of equity available to owners seeking to move into retirement housing.
Overall, retirement housing costs depend on tenure. The social rented sector rents are even across the city, with average rents in age banded and sheltered schemes being between £69 and £76 per week, whilst extra care schemes are more expensive at an average of £96 per week. Sale prices of retirement housing vary widely, with averages between £106,100 for age banded properties to £230,173 for extra care properties. Service charges can also be a significant factor in increasing housing costs, with average service charges in Registered Provider Extra Care schemes being £46.98 per week.
The financial help available to older people varies widely according to income, savings levels and tenure. The group who are most likely to receive state help are those on low incomes in social rented property who can access housing benefit which covers rent and service charges as well as support for other
2 Wood (2013) The Top of the Ladder, London: Demos
Retirement Housing in Sheffield: Supply and Demand to 2034
8
housing related services such as wardens and community alarms. The proportion of owners who are able to access help varies with income level, with proportionally fewer in this group who can get help with service charges and other housing related costs. This indicates a group that may struggle to afford to move into retirement housing, which may necessitate them living in accommodation that is no longer suitable for their needs.
In Sheffield, different equity levels in housing mean that in some areas older homeowners are more likely to be able to afford retirement housing for sale, particularly those in City Centre West, Rural Upper Don Valley, and South West. Lower equity levels in some areas may mean that options to move into retirement properties are fewer. Overall, those owner occupiers in low or middle income groups with low levels of equity in housing are likely to struggle most in affording retirement housing. However, actual income levels after housing costs have been taken into account may still be low for those in social rented property, despite potentially easier access to this type of housing. Nonetheless, high care costs allied with high service charges and a complex and uncertain state benefit situation may hinder the ability of a wider range of older people to move into retirement housing.
What this Report does not Cover
This report does not consider residential or dementia care housing, nor the stock of ‘standard’ age-banded properties (that is those that are reserved for older people, but do not have any specific support provided, such as a warden). It also only models supply and demand to 2034, to align the report with the Sheffield Plan and its timescale.
Summary Figures for Sheffield
2011 (Census)^ & 2015 (ONS/DCLG Projections)*
2034 (ONS/DCLG Projections)
Over 65 population* 92,000 124,000 Over 85 population* 13,000 24,000 Over 65 households* 63,931 85,484 Over 65 households by tenure^
Own/occ 37,595 Own/occ 53,176 Priv rent 2,313 Priv rent 3,529 Soc rent 17,351 Soc rent 24,983
Demand for retirement housing^
Own/occ 3,277 Own/occ 4,737 Rent 1,953 Rent 2,830
Shortfall in retirement housing^
-2,430 -4,767 Highest: South West (-452) Highest: South East (-882) Lowest: City Centre (+32) Lowest: City Centre (+14)
Shop@ Model* -4,511 -8,201
Income of 65+ households >£20k
Highest: South West (>70%) Lowest: East, Manor Arbourthorne & Gleadless, Rural UDV (<15%)
Retirement Housing in Sheffield: Supply and Demand to 2034
9
1 Introduction
Ensuring that an ageing population has access to suitable, affordable housing has become a significant national issue, with a series of reports and inquiries investigating this issue3. These indicate that enabling older people to move into homes that are more suitable to their needs has wide positive impacts, including better health and wellbeing outcomes, reducing admissions to hospitals, and ‘freeing-up’ often larger houses for families. However, despite an ageing population both in the UK and Sheffield and widespread acknowledgement of the benefits of ensuring that this population is well housed, the building of housing designed especially for older people has not kept pace with the population or likely demand. Indeed, one report has shown that in the UK, whilst around 30,000 specialist homes for older people were built annually in the 1980s, this has now fallen to about 8,000 today4. In Sheffield, the city’s older population is forecast to grow significantly over the next 15 to 20 years. This presents a range of opportunities for the city, but also challenges in terms of ensuring that homes are available that meet the needs of this changing population.
This report sets out to investigate the scale and location of retirement housing5 required for older people in Sheffield. It presents analysis of demographic changes, and relates this to current and projected supply of retirement housing in the city. Using models of the rate at which older people are likely to demand or require this type of housing, current and future surpluses and shortfalls are calculated. The report presents analysis, unavailable elsewhere, of these surpluses and shortfalls across the 13 Housing Market Areas of Sheffield6. The report also presents analysis of the potential split in tenure type over the next 20 years and the potential affordability of retirement housing across the 13 Housing Market Areas.
The report provides projections of population and potential surpluses and shortfalls of retirement housing up to 2034. This aligns with wider work on the Sheffield Plan, which is currently being prepared, and which will contain policies and site allocations for a period up to 2034. This report is designed to inform policy currently being written for the Sheffield Plan, but is also likely to be of wider relevance to a range of policy makers.
3 See www.housinglin.org.uk for a comprehensive source of available literature
4 PWC (2014) Sizing up the Situation: the advantages of downsizing, cited in APPG (2014) The affordability of retirement housing, London: HMSO
5 Retirement housing is defined as housing specially designed and/or managed for older people, but excluding residential care and nursing homes. See section X
6 Defined by the Sheffield Strategic Housing Market Assessment – see Appendix 2
Retirement Housing in Sheffield: Supply and Demand to 2034
10
The report has been produced by researchers at the University of Sheffield working on the DWELL project7, a UK Research Council funded project that seeks to understand how we can provide housing and environments that better meet the needs of an ageing population. Sheffield City Council are partners in the DWELL project, and this report reflects one strand of this joint working.
7 Designing for Wellbeing in the Environment for Later Life, see: http://dwell.group.shef.ac.uk/
Retirement Housing in Sheffield: Supply and Demand to 2034
11
2 The challenge of demographic change
2.1 Overview
The population of Sheffield is growing; therefore the number of older people in the city is predicted to increase to 2034. However, over the next twenty years, the proportion of older people in the city will also increase, with a particularly steep rise in the proportion of people aged over 85 relative to the rest of the population. This presents a range of opportunities and challenges for the city that the Sheffield Plan will need to address.
2.2 Population change: 2015-2034
The total population of Sheffield is projected to grow from 563,749 in 2013 to 625,000 in 2034.
The proportion of people over 65 will expand from 16% in 2013 to nearly 20% in 20348.
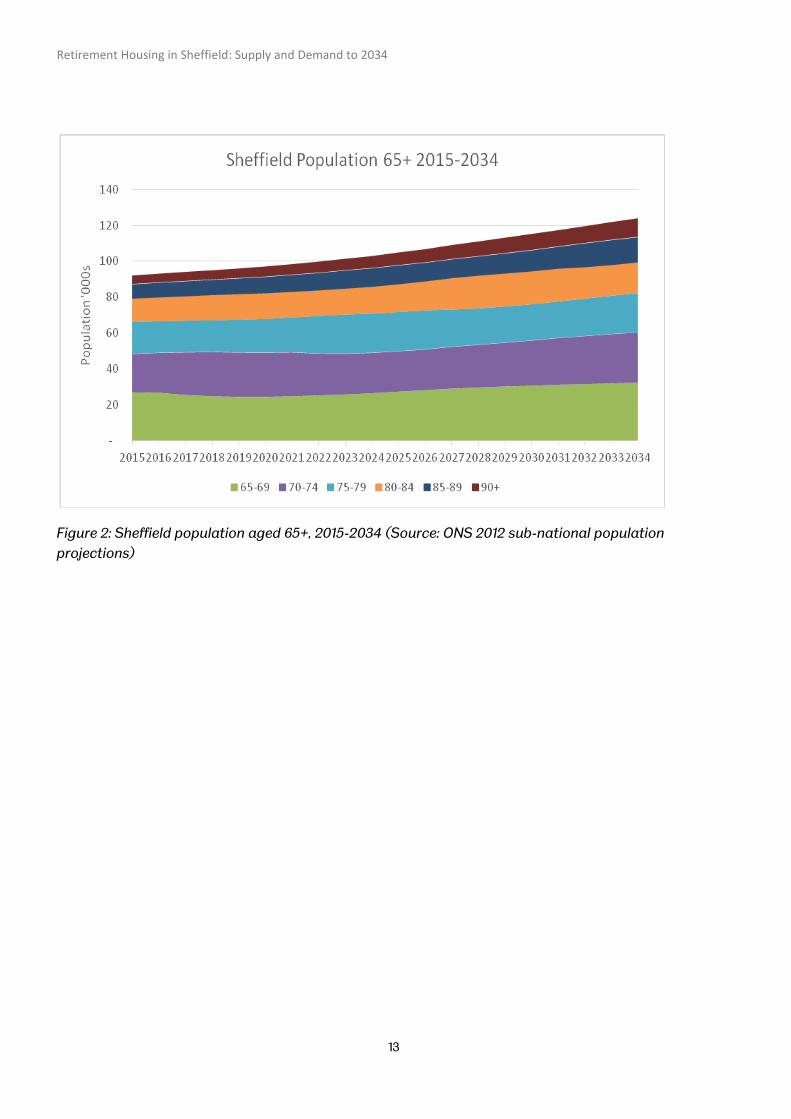
In absolute numbers there are 92,000 people over the age of 65 currently living in Sheffield, and this is projected to rise to 124,000 by the end of the plan period, an increase of 34%.
Growth will be most rapid amongst the oldest sections of the older population, which are forecast to double over the next 20 years. The number of people aged over 85 will almost double, from 13,000 currently to 24,000 in 20349.
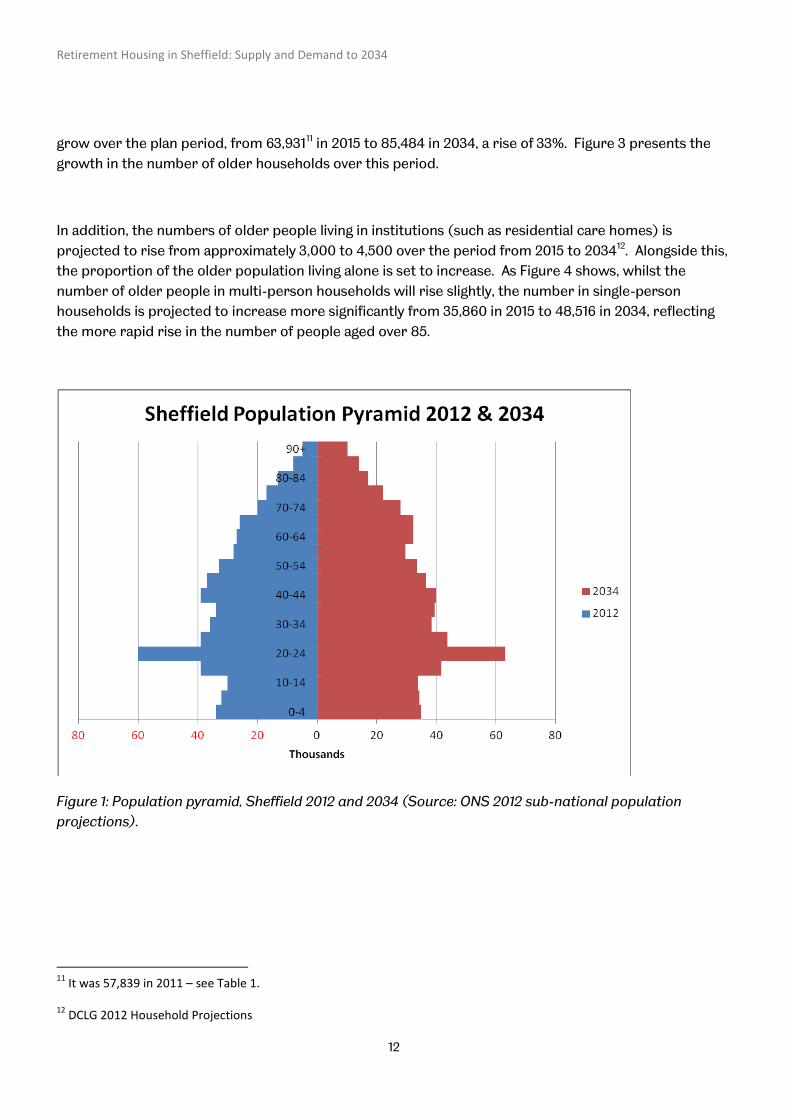
The population pyramid below (Figure 1) shows that the proportion of older people will increase within the city, with a reduction in the proportion of those under the age of 65. In particular, there is currently a high proportion of residents in their forties, who will be reaching current retirement age by 2034. Figure 2 shows the rise in population in different older age ranges over the period.
2.3 Household growth
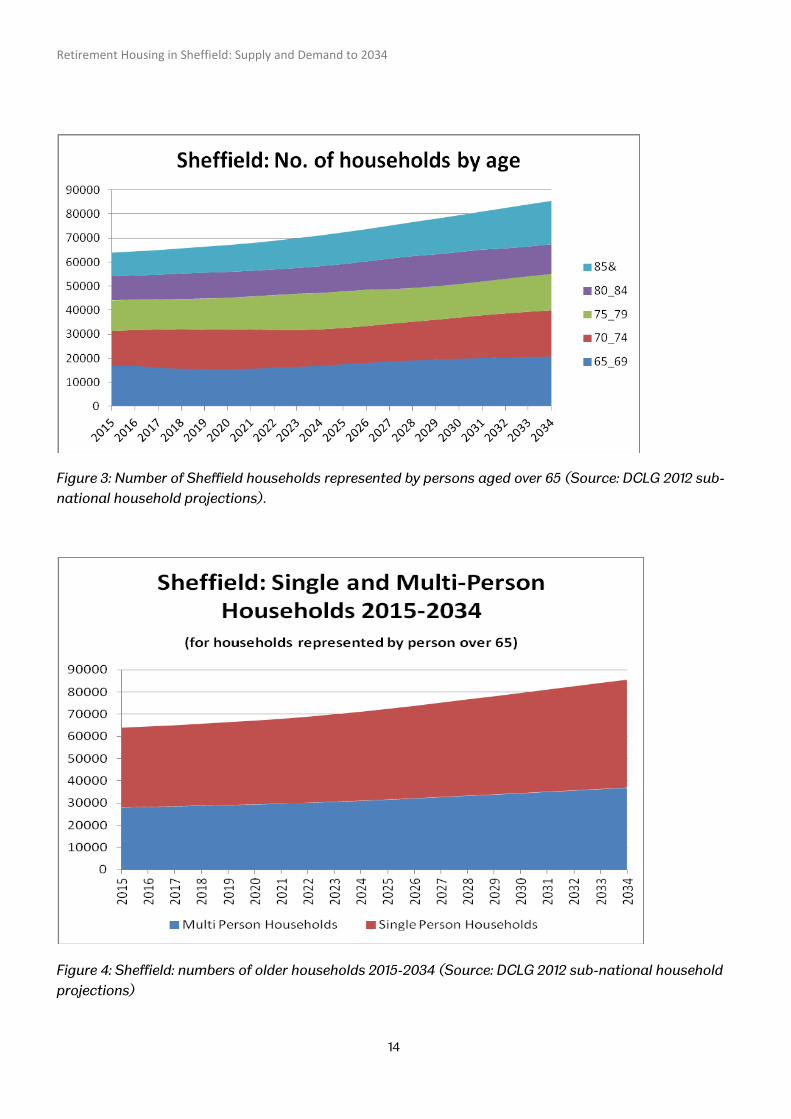
The total number of households in Sheffield is predicted to increase from 236,865 in 2015 to 271,801 in 2034. Within this, the number of households represented by a person10 aged over 65 is also projected to
8 From ONS 2012 Sub-national Population Projections
9 From ONS 2012 Sub-national Population Projections
10 The definition used by the ONS and DCLG is ‘Household Representative Person’, which is the oldest male within a household
Retirement Housing in Sheffield: Supply and Demand to 2034
12
grow over the plan period, from 63,93111 in 2015 to 85,484 in 2034, a rise of 33%. Figure 3 presents the growth in the number of older households over this period.
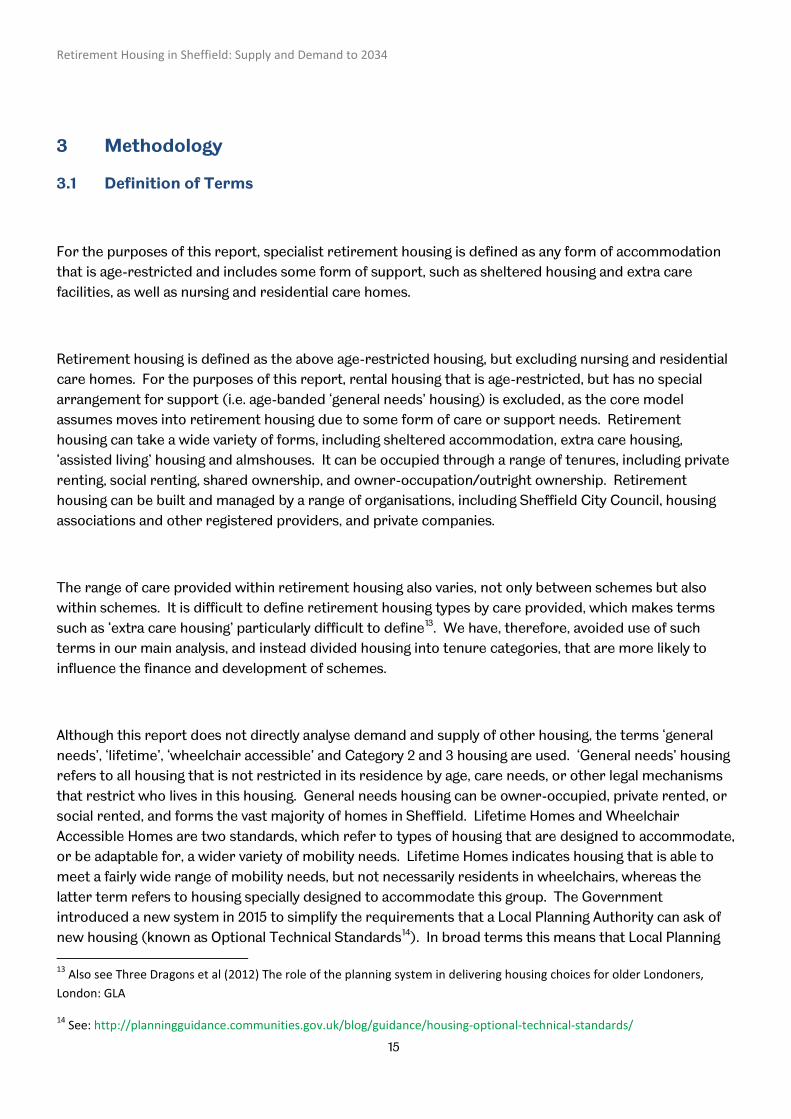
In addition, the numbers of older people living in institutions (such as residential care homes) is projected to rise from approximately 3,000 to 4,500 over the period from 2015 to 203412. Alongside this, the proportion of the older population living alone is set to increase. As Figure 4 shows, whilst the number of older people in multi-person households will rise slightly, the number in single-person households is projected to increase more significantly from 35,860 in 2015 to 48,516 in 2034, reflecting the more rapid rise in the number of people aged over 85.
Figure 1: Population pyramid, Sheffield 2012 and 2034 (Source: ONS 2012 sub-national population projections).
11 It was 57,839 in 2011 – see Table 1.
12 DCLG 2012 Household Projections
Retirement Housing in Sheffield: Supply and Demand to 2034
13
Figure 2: Sheffield population aged 65+, 2015-2034 (Source: ONS 2012 sub-national population projections)
Retirement Housing in Sheffield: Supply and Demand to 2034
14
Figure 3: Number of Sheffield households represented by persons aged over 65 (Source: DCLG 2012 sub-national household projections).
Figure 4: Sheffield: numbers of older households 2015-2034 (Source: DCLG 2012 sub-national household projections)
Retirement Housing in Sheffield: Supply and Demand to 2034
15
3 Methodology
3.1 Definition of Terms
For the purposes of this report, specialist retirement housing is defined as any form of accommodation that is age-restricted and includes some form of support, such as sheltered housing and extra care facilities, as well as nursing and residential care homes.
Retirement housing is defined as the above age-restricted housing, but excluding nursing and residential care homes. For the purposes of this report, rental housing that is age-restricted, but has no special arrangement for support (i.e. age-banded ‘general needs’ housing) is excluded, as the core model assumes moves into retirement housing due to some form of care or support needs. Retirement housing can take a wide variety of forms, including sheltered accommodation, extra care housing, ‘assisted living’ housing and almshouses. It can be occupied through a range of tenures, including private renting, social renting, shared ownership, and owner-occupation/outright ownership. Retirement housing can be built and managed by a range of organisations, including Sheffield City Council, housing associations and other registered providers, and private companies.
The range of care provided within retirement housing also varies, not only between schemes but also within schemes. It is difficult to define retirement housing types by care provided, which makes terms such as ‘extra care housing’ particularly difficult to define13. We have, therefore, avoided use of such terms in our main analysis, and instead divided housing into tenure categories, that are more likely to influence the finance and development of schemes.
Although this report does not directly analyse demand and supply of other housing, the terms ‘general needs’, ‘lifetime’, ‘wheelchair accessible’ and Category 2 and 3 housing are used. ‘General needs’ housing refers to all housing that is not restricted in its residence by age, care needs, or other legal mechanisms that restrict who lives in this housing. General needs housing can be owner-occupied, private rented, or social rented, and forms the vast majority of homes in Sheffield. Lifetime Homes and Wheelchair Accessible Homes are two standards, which refer to types of housing that are designed to accommodate, or be adaptable for, a wider variety of mobility needs. Lifetime Homes indicates housing that is able to meet a fairly wide range of mobility needs, but not necessarily residents in wheelchairs, whereas the latter term refers to housing specially designed to accommodate this group. The Government introduced a new system in 2015 to simplify the requirements that a Local Planning Authority can ask of new housing (known as Optional Technical Standards14). In broad terms this means that Local Planning 13 Also see Three Dragons et al (2012) The role of the planning system in delivering housing choices for older Londoners, London: GLA
14 See: http://planningguidance.communities.gov.uk/blog/guidance/housing-optional-technical-standards/
Retirement Housing in Sheffield: Supply and Demand to 2034
16
Authorities can no longer stipulate Lifetime Homes and Wheelchair Accessible Housing, but must instead introduce policies that allow them to stipulate ‘Category 2’ and ‘Category 3’ housing as standards. Category 2 housing is analogous to Lifetime Homes, and Category 3 is analogous to Wheelchair Accessible Housing.
3.2 The Model for Forecasting Housing Demand, Shortfall and Surplus
The methodology for forecasting retirement housing needs draws on work by the Three Dragons Consultancy (with Cambridge and Heriot Watt Universities) in their report for the Greater London Assembly ‘The Role of the Planning System in Delivering Housing Choices for Older Londoners’15. This in turn draws on work carried out for the Retirement Housing Group by Three Dragons. The model is a supply and demand model that calculates future demand for retirement housing and balances this against the existing supply of retirement housing, giving a surplus or shortfall for both the whole of Sheffield and 13 Housing Market Areas. The model draws on a variety of data sources, which are listed in Appendix 1. It was chosen as it enabled forecasts for individual Housing Market Areas, which the @Shop analysis was unable to provide (see Section 6).
3.3 Assumptions
The percentage of those seeking to move into retirement housing (not including residential and care homes) varies between age groups. The starting assumptions are that:
• 2.5% of 65-75 headed households seek to move into retirement housing • 15% of 75+ headed households seek to move into retirement housing • 100% of those in social housing or private rented housing move into affordable or social rented
retirement housing • 85% of home owners move into outright purchase retirement housing • 15% of home owners move into shared ownership retirement housing
All existing retirement housing is fit for purpose through the period 2014-2034.
These assumptions are drawn from the Three Dragons model and are derived from national data on older people’s intention to move to retirement housing.
The model assumes that the existing stock of retirement housing will be recycled either through the end of life of the occupier(s), moves to institutional accommodation (care home/residential), and moves back to general housing (likely to be a small number). DCLG household projections enable this to be modelled, as future household numbers take into account mortality rates and moves to institutional accommodation. They also enable a closer link between units required and population demand,
15 GLA (2012) The Role of the Planning System in Delivering Housing Choice for Older Londoners, London: GLA
Retirement Housing in Sheffield: Supply and Demand to 2034
17
especially as emerging forms of retirement housing, such as Extra Care, may increasingly support couples moving together and preserving the household unit.
The model enables testing of the assumptions. Two main assumptions were tested:
The proportion of 65+ households who seek to move into retirement housing was refined at a housing market sub-area level, using data from the 2013 Sheffield Strategic Housing Market Assessment. This provided data for the 65+ population’s desires and expectations to move into retirement accommodation within five years at a Housing Market Area level.
The assumption that all the existing stock of retirement housing was fit-for-purpose was tested, with a second test run that assumed 50% of the existing stock would require replacement up to 2034.
3.4 Applying forecasts to Housing Market Areas
The 2013 Sheffield Strategic Housing Market Assessment defines 13 Housing Market Areas (HMAs)16. The model forecasts demand and supply for each HMA, providing a more detailed picture of variations across the city. The model does not, however, make population or household forecasts for each individual housing market sub-area, but projects forward the share of current population for each sub-area into the future. Forecasting population at small geographic scales raises a number of problems, especially in accounting for intra-urban migration patterns.
16 See Appendix 2 for a map
Retirement Housing in Sheffield: Supply and Demand to 2034
18
4 Presentation of the Data
4.1 Older people’s tenure in Sheffield
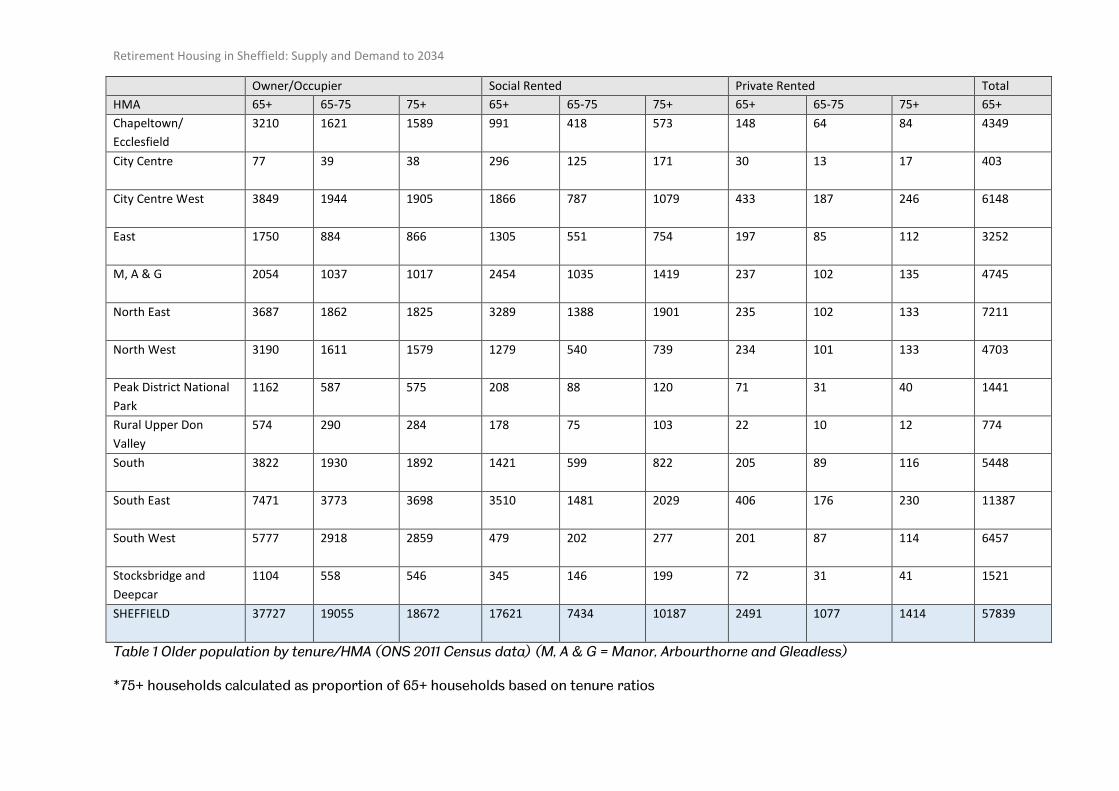
Table 1 shows the number of households in each HMA of Sheffield by tenure based on 2011 data. The first column under each tenure heading presents a definite total for the area (all households with a representative aged over 65), the subsequent two columns give an estimate of the number of households where the representative person is aged between 65 and 75, and over 75 respectively. These have been estimated on the basis of known tenure ratios for the city as a whole.
The data show that there are some 57,839 older households in the city. The highest numbers of older person households are in the South East, North East, South West and City Centre West. The lowest numbers lie in the City Centre and Rural Upper Don Valley. Of the total households, 37,727 (65.2%) are owner-occupiers. 17,621 (30.5%) are social renters, and 2,491 (4.3%) are in privately rented accommodation.
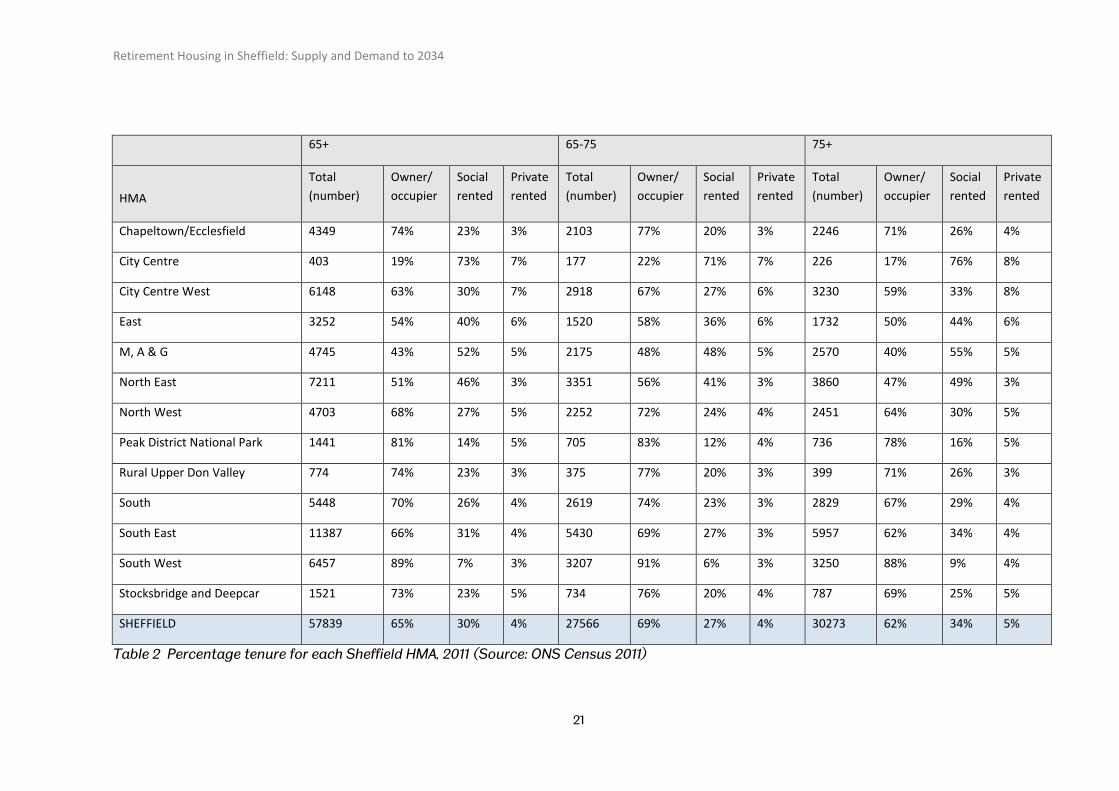
However, as one might expect, current patterns of tenure show considerable geographical variation within the city. Table 2 presents a percentage breakdown of the tenure data, showing high percentages of owner-occupier households in the South West (89%), Peak District National Park (81%), Chapeltown (74%), the Rural Upper Don Valley (74%) and Stocksbridge/Deepcar (73%). Rates of home ownership are lowest in the City Centre (an outlier at 19%), Manor Arbourthorne and Gleadless (43%) and the North East (51%), areas that show correspondingly higher rates of social renting (73%, 52%, 46% respectively). Levels of private renting are relatively low across all areas, ranging from 3% to 7%.
The data show relatively small variations in tenure between the 65-75 age group and the 75+ group. 69% of those aged 65-75 are owner occupiers and 27% rent socially, compared to 62% of owner-occupiers and 34% social renters in the group aged over 75. However, this variation is consistent across every geographical Housing Market Area in the city, a slightly higher percentage of those aged 65-75 are owner-occupiers compared to those aged over 75+. There is an inverse relationship with socially rented housing, with a higher percentage of those aged over 75 in social housing.
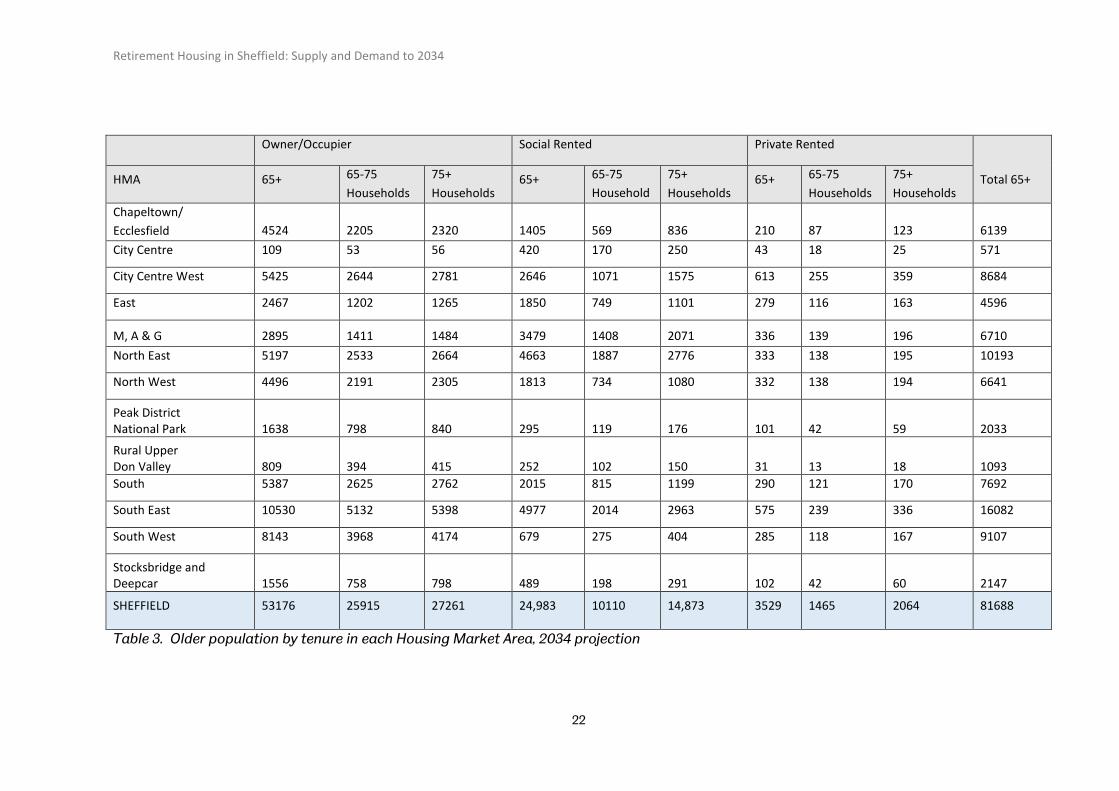
Table 3 shows forecasts for tenure by Housing Market Area in 2034 based on ONS 2011 Census data. The assumptions of the table are that the number of older people in each area will rise in line with the anticipated increase in these demographics in the general population (i.e. that there will be no change in the geographical distribution of older households across the city), and that the percentages of older people in each tenure group will remain constant17. The model predicts that there will be 81,688 17 Current trends indicate, however, a rising number and proportion of residents in private rental compared to social rent.

Retirement Housing in Sheffield: Supply and Demand to 2034
19
households with an older representative in 2034, 53,176 of which will be owner-occupied (an increase of 15,449), 24,983 socially rented (an increase of 7,362), and 3,529 privately rented (an increase of 1,038).
Retirement Housing in Sheffield: Supply and Demand to 2034
Owner/Occupier Social Rented Private Rented Total HMA
65+
65-75
75+
65+
65-75
75+
65+
65-75
75+
65+ Chapeltown/
Ecclesfield 3210 1621 1589 991 418 573 148 64 84 4349
City Centre 77 39 38 296 125 171 30 13 17 403
City Centre West 3849 1944 1905 1866 787 1079 433 187 246 6148
East 1750 884 866 1305 551 754 197 85 112 3252
M, A & G 2054 1037 1017 2454 1035 1419 237 102 135 4745
North East 3687 1862 1825 3289 1388 1901 235 102 133 7211
North West 3190 1611 1579 1279 540 739 234 101 133 4703
Peak District National Park
1162 587 575 208 88 120 71 31 40 1441
Rural Upper Don Valley
574 290 284 178 75 103 22 10 12 774
South 3822 1930 1892 1421 599 822 205 89 116 5448
South East 7471 3773 3698 3510 1481 2029 406 176 230 11387
South West 5777 2918 2859 479 202 277 201 87 114 6457
Stocksbridge and Deepcar
1104 558 546 345 146 199 72 31 41 1521
SHEFFIELD 37727 19055 18672 17621 7434 10187 2491 1077 1414 57839
Table 1 Older population by tenure/HMA (ONS 2011 Census data) (M, A & G = Manor, Arbourthorne and Gleadless)
*75+ households calculated as proportion of 65+ households based on tenure ratios
Retirement Housing in Sheffield: Supply and Demand to 2034
21
65+ 65-75 75+
HMA
Total (number)
Owner/ occupier
Social rented
Private rented
Total (number)
Owner/ occupier
Social rented
Private rented
Total (number)
Owner/ occupier
Social rented
Private rented
Chapeltown/Ecclesfield 4349 74% 23% 3% 2103 77% 20% 3% 2246 71% 26% 4%
City Centre 403 19% 73% 7% 177 22% 71% 7% 226 17% 76% 8%
City Centre West 6148 63% 30% 7% 2918 67% 27% 6% 3230 59% 33% 8%
East 3252 54% 40% 6% 1520 58% 36% 6% 1732 50% 44% 6%
M, A & G 4745 43% 52% 5% 2175 48% 48% 5% 2570 40% 55% 5%
North East 7211 51% 46% 3% 3351 56% 41% 3% 3860 47% 49% 3%
North West 4703 68% 27% 5% 2252 72% 24% 4% 2451 64% 30% 5%
Peak District National Park 1441 81% 14% 5% 705 83% 12% 4% 736 78% 16% 5%
Rural Upper Don Valley 774 74% 23% 3% 375 77% 20% 3% 399 71% 26% 3%
South 5448 70% 26% 4% 2619 74% 23% 3% 2829 67% 29% 4%
South East 11387 66% 31% 4% 5430 69% 27% 3% 5957 62% 34% 4%
South West 6457 89% 7% 3% 3207 91% 6% 3% 3250 88% 9% 4%
Stocksbridge and Deepcar 1521 73% 23% 5% 734 76% 20% 4% 787 69% 25% 5%
SHEFFIELD 57839 65% 30% 4% 27566 69% 27% 4% 30273 62% 34% 5%
Table 2 Percentage tenure for each Sheffield HMA, 2011 (Source: ONS Census 2011)
Retirement Housing in Sheffield: Supply and Demand to 2034
22
Owner/Occupier Social Rented Private Rented
Total 65+ HMA 65+ 65-75 Households
75+ Households
65+ 65-75 Household
75+ Households
65+ 65-75 Households
75+ Households
Chapeltown/ Ecclesfield 4524 2205 2320 1405 569 836 210 87 123 6139 City Centre 109 53 56 420 170 250 43 18 25 571
City Centre West 5425 2644 2781 2646 1071 1575 613 255 359 8684
East 2467 1202 1265 1850 749 1101 279 116 163 4596
M, A & G 2895 1411 1484 3479 1408 2071 336 139 196 6710 North East 5197 2533 2664 4663 1887 2776 333 138 195 10193
North West 4496 2191 2305 1813 734 1080 332 138 194 6641
Peak District National Park 1638 798 840 295 119 176 101 42 59 2033
Rural Upper Don Valley 809 394 415 252 102 150 31 13 18 1093 South 5387 2625 2762 2015 815 1199 290 121 170 7692
South East 10530 5132 5398 4977 2014 2963 575 239 336 16082
South West 8143 3968 4174 679 275 404 285 118 167 9107
Stocksbridge and Deepcar 1556 758 798 489 198 291 102 42 60 2147
SHEFFIELD 53176 25915 27261 24,983 10110 14,873 3529 1465 2064 81688
Table 3. Older population by tenure in each Housing Market Area, 2034 projection
Retirement Housing in Sheffield: Supply and Demand to 2034
23
HMA Sheltered Schemes
Extra Care Schemes
Total Sheltered Rental Units
Total Sheltered SO Units
Total Sheltered Leasehold Units
Total sheltered units
Extra Care Rental Units*
Extra Care SO Units
Extra Care Leasehold Units
Total Extra Care Units
Total Units
Chapeltown & Ecclesfield
7 0 390 0 0 390 0 0 0 0 390
City Centre 2 0 70 0 0 70 0 0 0 0 70
City Centre West
17 1 469 2 2 473 37 0 0 37 510
East 3 0 74 0 0 74 0 0 0 0 74
M, A & G 5 1 231 0 1 232 40 0 0 40 272
North East 3 2 123 0 0 123 99 12 8 119 242
North West 5 0 220 1 1 222 0 0 0 0 222
Peak District National Park
0 0 0 0 0 0 0 0 0 0 0
Rural Upper Don Valley
1 0 40 0 0 40 0 0 0 0 40
South 5 1 126 0 0 126 45 12 3 60 186
South East 8 1 390 0 0 390 176 30 11 217 607
South West 5 2 81 3 3 87 0 0 29 29 116
Stocksbridge & Deepcar
2 0 71 0 0 71 0 0 0 0 71
SHEFFIELD 63 8 2285 6 7 2298 397 54 51 502 2800
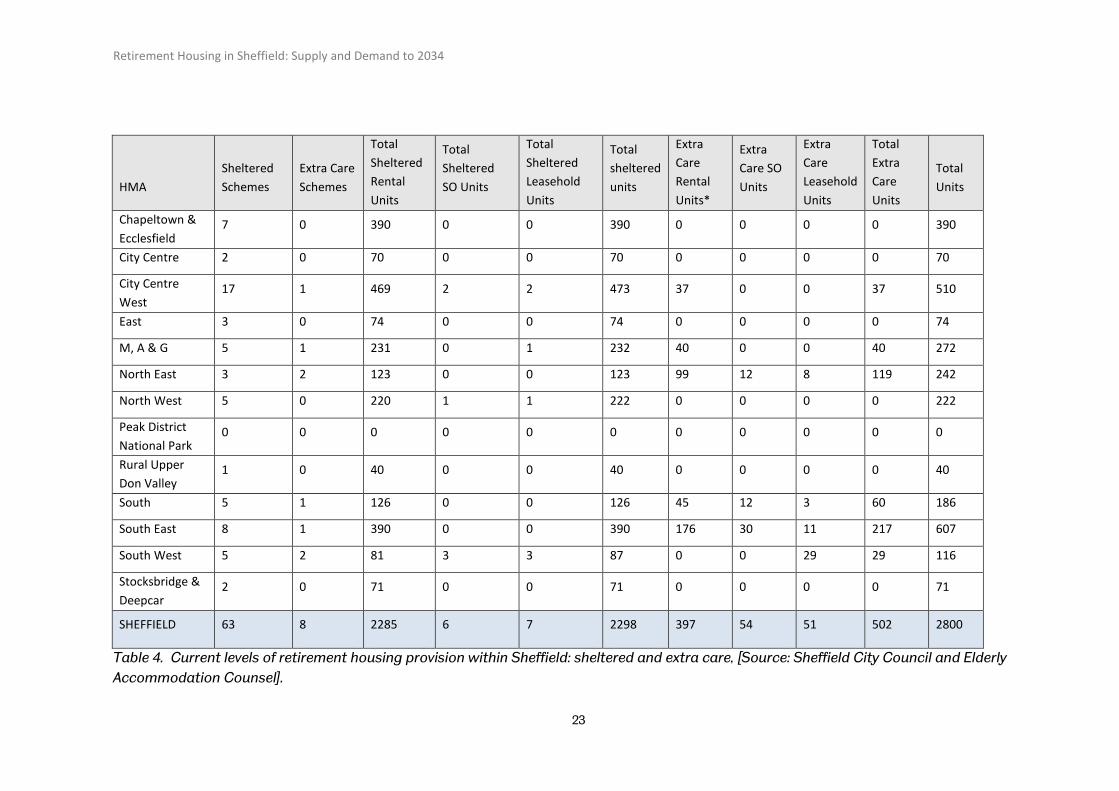
Table 4. Current levels of retirement housing provision within Sheffield: sheltered and extra care, [Source: Sheffield City Council and Elderly Accommodation Counsel].
Retirement Housing in Sheffield: Supply and Demand to 2034
24
HMA
65-75 currently in owner-occupied accommodation (number)
75+ currently in owner-occupied accommodation (number)
65+ currently in owner-occupied accommodation (total number)
65-75 currently in rented accommodation
75+ currently in rented accommodation
65+ currently in rented accommodation (total number) Total
Chapeltown & Ecclesfield
40.53 238.31 278.84 12.05 98.54 110.59 389.43
City Centre 0.97 5.72 6.69 3.45 28.22 31.67 38.36
City Centre West
48.60 285.74 334.35 24.36 198.68 223.04 557.39
East 22.10 129.92 152.01 15.89 129.94 145.83 297.85
M, A & G 25.94 152.49 178.42 28.44 232.98 261.43 439.85
North East 46.56 273.72 320.27 37.23 305.22 342.45 662.73
North West 40.28 236.82 277.10 16.02 130.84 146.86 423.96
Peak District National Park
14.67 86.27 100.94 2.96 24.08 27.04 127.98
Rural Upper Don Valley
7.25 42.61 49.86 2.12 17.31 19.42 69.28
South 48.26 283.74 332.00 17.20 140.68 157.88 489.88
South East 94.34 554.64 648.97 41.41 338.95 380.36 1029.33
South West 72.95 428.88 501.82 7.22 58.65 65.88 567.70
Stocksbridge & Deepcar
13.94 81.96 95.90 4.42 36.05 40.47 136.36
SHEFFIELD 476.38 2800.80 3277.18 212.78 1740.15 1952.93 5230.10
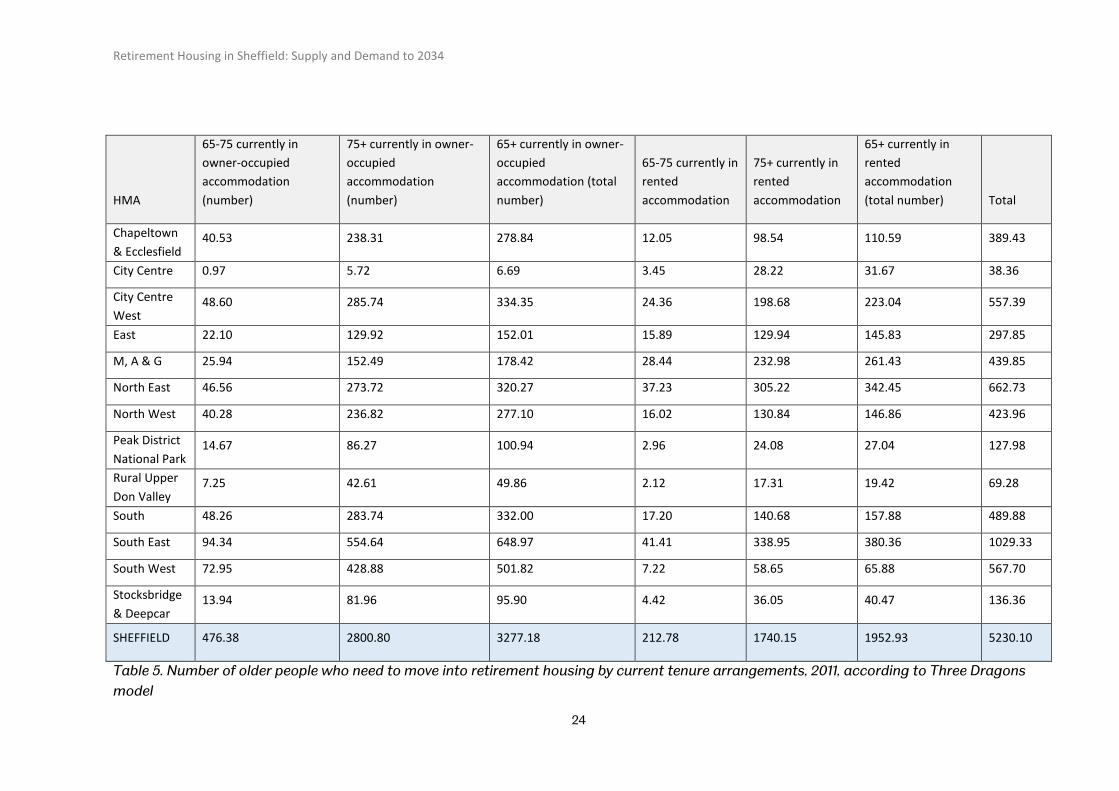
Table 5. Number of older people who need to move into retirement housing by current tenure arrangements, 2011, according to Three Dragons model
Retirement Housing in Sheffield: Supply and Demand to 2034
25
DEMAND SUPPLY SURPLUS/SHORTFALL
HMA Owner-occupiers seeking outright
Owner-occupiers seeking shared ownership RH
Social and private renters into socially rented RH
Total Extra Care Sheltered Total Total (units)
Chapeltown & Ecclesfield
237.01 41.83 110.59 389.43 0 390 390 1
City Centre 5.69 1.00 31.67 38.36 0 70 70 32
City Centre West 284.19 50.15 223.04 557.39 37 473 510 -47
East 129.21 22.80 145.83 297.85 0 74 74 -224
M, A & G 151.66 26.76 261.43 439.85 40 232 272 -168
North East 272.23 48.04 342.45 662.73 119 123 242 -421
North West 235.54 41.57 146.86 423.96 0 222 222 -202
Peak District National Park
85.80 15.14 27.04 127.98 0 0 0 -128
Rural Upper Don Valley
42.38 7.48 19.42 69.28 0 40 40 -29
South 282.20 49.80 157.88 489.88 60 126 186 -304
South East 551.63 97.35 380.36 1029.33 217 390 607 -422
South West 426.55 75.27 65.88 567.70 29 87 116 -452
Stocksbridge & Deepcar
81.51 14.38 40.47 136.36 0 71 71 -65
SHEFFIELD 2785.60 491.58 1952.93 5230.10 502 2298 2800 -2430
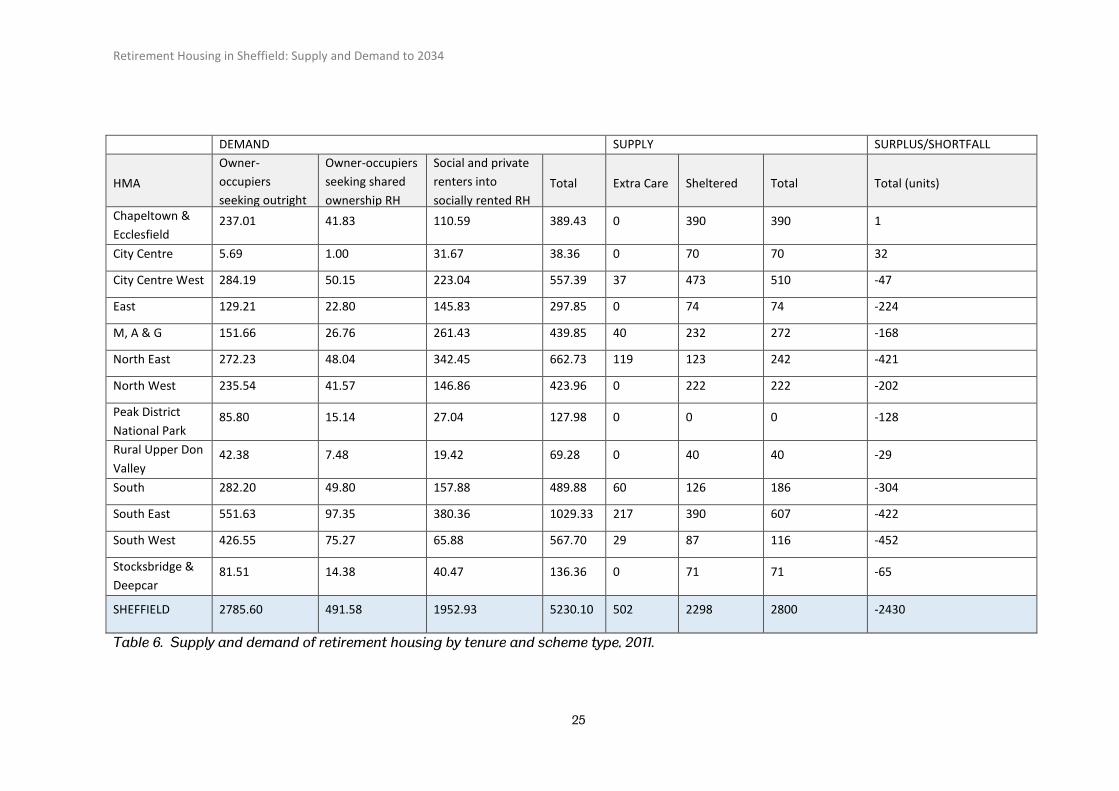
Table 6. Supply and demand of retirement housing by tenure and scheme type, 2011.
Retirement Housing in Sheffield: Supply and Demand to 2034
26
HMA 65-75 currently in owner-occupied accommodation (number)
75+ currently in owner-occupied accommodation (number)
65+ currently in owner-occupied accommodation (total number)
65-75 currently in rented accommodation
75+ currently in rented accommodation
65+ currently in rented accommodation (total number)
Total
Chapeltown & Ecclesfield
55.12 347.93 403.05 16.39 143.87 160.26 563.31
City Centre 1.32 8.35 9.67 4.69 41.21 45.89 55.56
City Centre West
66.10 417.19 483.28 33.13 290.08 323.21 806.49
East 30.05 189.68 219.73 21.61 189.71 211.33 431.06
M, A & G 35.27 222.63 257.90 38.68 340.16 378.84 636.74
North East 63.32 399.63 462.94 50.63 445.63 496.26 959.20
North West 54.78 345.76 400.54 21.79 191.02 212.81 613.35
Peak District National Park
19.95 125.95 145.90 4.03 35.16 39.19 185.09
Rural Upper Don Valley
9.86 62.21 72.07 2.88 25.27 28.15 100.22
South 65.63 414.26 479.89 23.40 205.39 228.79 708.68
South East 128.30 809.77 938.07 56.32 494.86 551.18 1489.25
South West 99.21 626.16 725.37 9.83 85.63 95.46 820.82
Stocksbridge & Deepcar
18.96 119.66 138.62 6.01 52.63 58.64 197.26
SHEFFIELD 647.87 4089.17 4737.04 289.37 2540.62 2829.99 7567.03
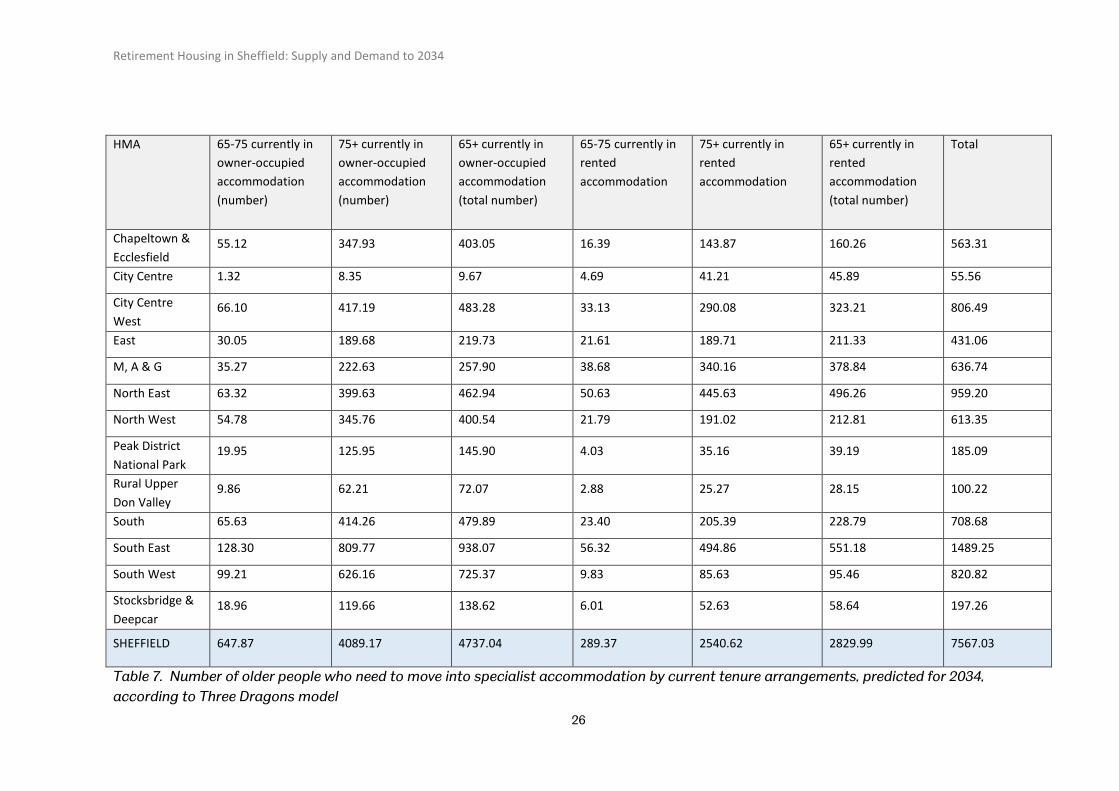
Table 7. Number of older people who need to move into specialist accommodation by current tenure arrangements, predicted for 2034, according to Three Dragons model
Retirement Housing in Sheffield: Supply and Demand to 2034
27
DEMAND 2034 SUPPLY (2011) SHORTFALL
HMA Owner-occupiers seeking outright owned
Owner-occupiers seeking shared ownership
Social and private renters into socially rented
Total Extra care Sheltered Total Total
Chapeltown & Ecclesfield
342.59 60.46 160.26 563.31 0 390 390 -173
City Centre 8.22 1.45 45.89 55.56 0 70 70 14
City Centre West 410.79 72.49 323.21 806.49 37 473 510 -296
East 186.77 32.96 211.33 431.06 0 74 74 -357
M, A & G 219.22 38.69 378.84 636.74 40 232 272 -365
North East 393.50 69.44 496.26 959.20 119 123 242 -717
North West 340.46 60.08 212.81 613.35 0 222 222 -391
Peak District National Park
124.02 21.89 39.19 185.09 0 0 0 -185
Rural Upper Don Valley
61.26 10.81 28.15 100.22 0 40 40 -60
South 407.91 71.98 228.79 708.68 60 126 186 -523
South East 797.36 140.71 551.18 1489.25 217 390 607 -882
South West 616.56 108.80 95.46 820.82 29 87 116 -705
Stocksbridge & Deepcar
117.83 20.79 58.64 197.26 0 71 71 -126
SHEFFIELD 4026.48 710.56 2829.99 7567.03 502 2298 2800 -4767
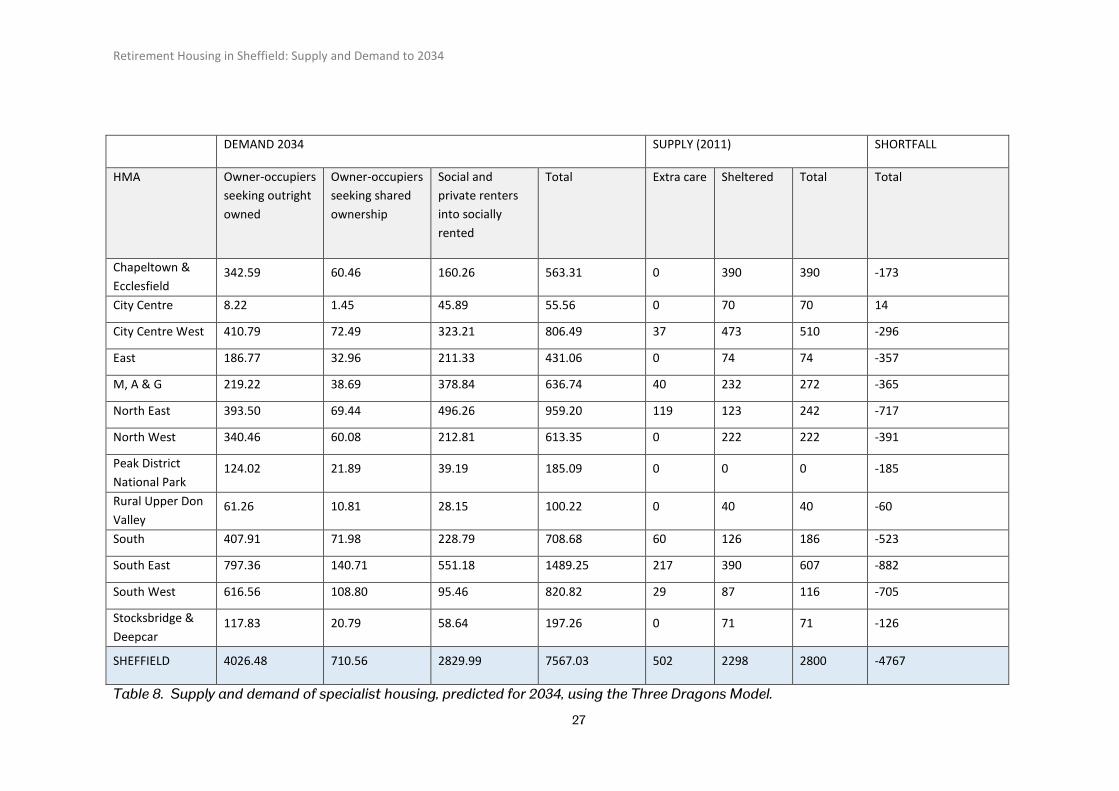
Table 8. Supply and demand of specialist housing, predicted for 2034, using the Three Dragons Model.
Retirement Housing in Sheffield: Supply and Demand to 2034
28
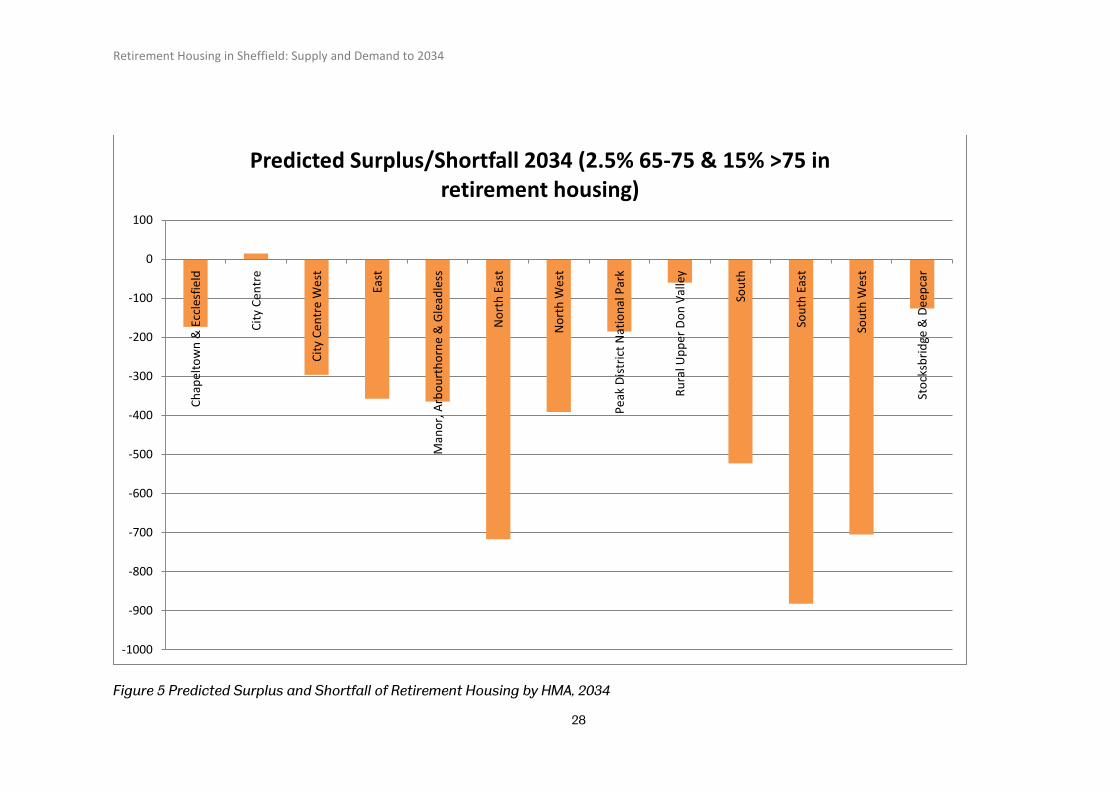
Figure 5 Predicted Surplus and Shortfall of Retirement Housing by HMA, 2034
-1000
-900
-800
-700
-600
-500
-400
-300
-200
-100
0
100
Chap
elto
wn
& E
ccle
sfie
ld
City
Cen
tre
City
Cen
tre
Wes
t
East
Man
or, A
rbou
rtho
rne
& G
lead
less
Nor
th E
ast
Nor
th W
est
Peak
Dist
rict N
atio
nal P
ark
Rura
l Upp
er D
on V
alle
y
Sout
h
Sout
h Ea
st
Sout
h W
est
Stoc
ksbr
idge
& D
eepc
ar
Predicted Surplus/Shortfall 2034 (2.5% 65-75 & 15% >75 in retirement housing)
Retirement Housing in Sheffield: Supply and Demand to 2034
4.2 Specialist housing provision: sheltered and extra care
Table 4 shows the current availability of retirement housing for older people who can no longer live completely independently. The data are broken down by the number of schemes (shaded area), and the number of units for individual accommodation within those schemes (unshaded area).
Some caveats must be borne in mind when interpreting this data: firstly, in many cases it is very difficult to differentiate between different types of scheme in terms of 'private' and 'social' tenure, because the two are often mixed within a scheme; secondly the boundary between 'sheltered' and 'extra care' housing is difficult to determine.
Broadly, the data show that there are 2,800 units of retirement housing accommodation in Sheffield. Within this total, the great majority of sheltered units are rented (some 2,285, with only 6 shared ownership and 7 leasehold units). This pattern is not as strong in extra care housing, with 397 rental units, 54 shared ownership units, and 51 leasehold units. Overall, extra care provision in the city is low, with only 502 total units in a total of eight schemes (it is difficult to categorise schemes according to ownership type).
Geographically, sheltered schemes are focused in four main areas: out of a total of 63 schemes in Sheffield, 17 are in the City Centre West (473 units); 7 are in Chapeltown and Ecclesfield (390 units); 8 are in the South East (390 units); and 5 are in the Manor, Arbourthorne and Gleadless Housing Market Area (232 units), 5 in North West (222 units), 5 in South (126 units), and South West (87 units). The small number of leasehold and shared ownership units are predominately in City Centre West and South West.
Retirement Housing in Sheffield: Supply and Demand to 2034
30
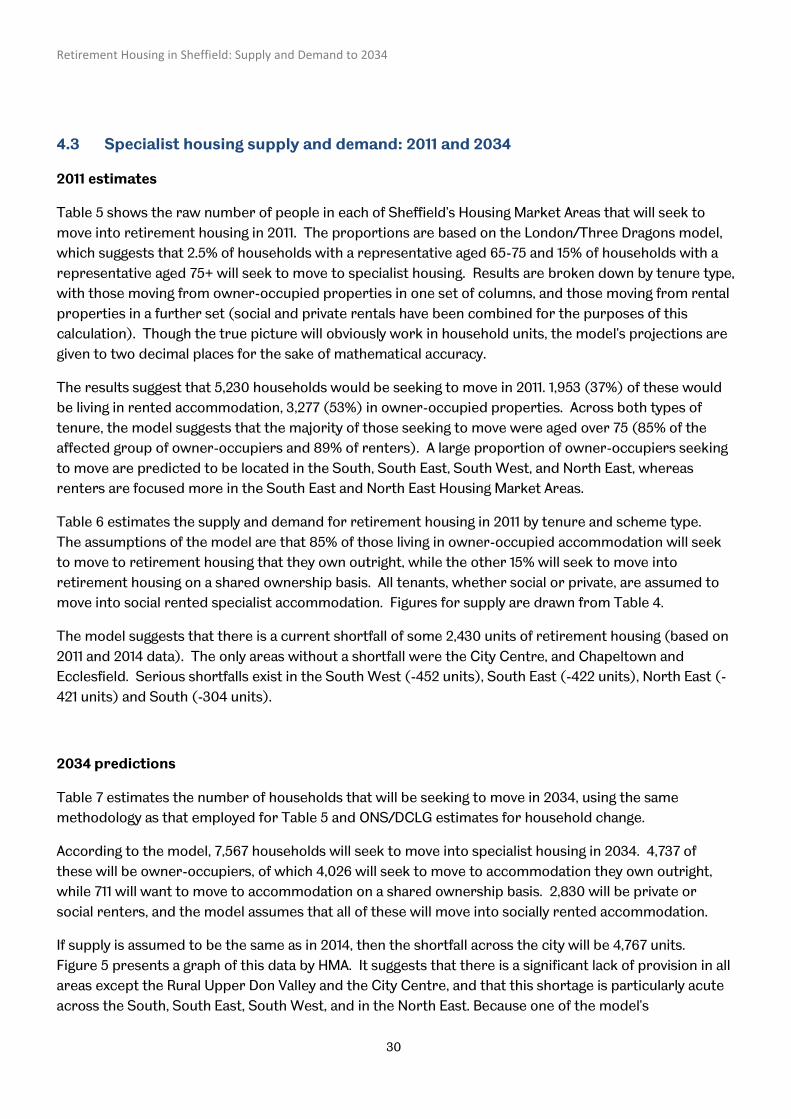
4.3 Specialist housing supply and demand: 2011 and 2034
2011 estimates
Table 5 shows the raw number of people in each of Sheffield's Housing Market Areas that will seek to move into retirement housing in 2011. The proportions are based on the London/Three Dragons model, which suggests that 2.5% of households with a representative aged 65-75 and 15% of households with a representative aged 75+ will seek to move to specialist housing. Results are broken down by tenure type, with those moving from owner-occupied properties in one set of columns, and those moving from rental properties in a further set (social and private rentals have been combined for the purposes of this calculation). Though the true picture will obviously work in household units, the model's projections are given to two decimal places for the sake of mathematical accuracy.
The results suggest that 5,230 households would be seeking to move in 2011. 1,953 (37%) of these would be living in rented accommodation, 3,277 (53%) in owner-occupied properties. Across both types of tenure, the model suggests that the majority of those seeking to move were aged over 75 (85% of the affected group of owner-occupiers and 89% of renters). A large proportion of owner-occupiers seeking to move are predicted to be located in the South, South East, South West, and North East, whereas renters are focused more in the South East and North East Housing Market Areas.
Table 6 estimates the supply and demand for retirement housing in 2011 by tenure and scheme type. The assumptions of the model are that 85% of those living in owner-occupied accommodation will seek to move to retirement housing that they own outright, while the other 15% will seek to move into retirement housing on a shared ownership basis. All tenants, whether social or private, are assumed to move into social rented specialist accommodation. Figures for supply are drawn from Table 4.
The model suggests that there is a current shortfall of some 2,430 units of retirement housing (based on 2011 and 2014 data). The only areas without a shortfall were the City Centre, and Chapeltown and Ecclesfield. Serious shortfalls exist in the South West (-452 units), South East (-422 units), North East (-421 units) and South (-304 units).
2034 predictions
Table 7 estimates the number of households that will be seeking to move in 2034, using the same methodology as that employed for Table 5 and ONS/DCLG estimates for household change.
According to the model, 7,567 households will seek to move into specialist housing in 2034. 4,737 of these will be owner-occupiers, of which 4,026 will seek to move to accommodation they own outright, while 711 will want to move to accommodation on a shared ownership basis. 2,830 will be private or social renters, and the model assumes that all of these will move into socially rented accommodation.
If supply is assumed to be the same as in 2014, then the shortfall across the city will be 4,767 units. Figure 5 presents a graph of this data by HMA. It suggests that there is a significant lack of provision in all areas except the Rural Upper Don Valley and the City Centre, and that this shortage is particularly acute across the South, South East, South West, and in the North East. Because one of the model's

Retirement Housing in Sheffield: Supply and Demand to 2034
31
assumptions is that older people will remain in the same area, the same patterns of distribution are observable between owner-occupiers and renters seeking to move as were seen in the 2011 data.
Retirement Housing in Sheffield: Supply and Demand to 2034
32
5 Testing the Assumptions
5.1 Testing against Questionnaire Data from SHMA 2013
In the Three Dragons model, one of the key drivers of older people’s demand for retirement housing is the assumption that 2.5% of 65-75 year old households and 15% of 75+ households will be seeking to move. These assumptions are drawn from national level data, and reflected in the Three Dragons model. Using questionnaire data from the 2013 Sheffield Strategic Housing Market Assessment allows testing of this assumption. In particular, the SHMA provides data on the percentage of respondents over 65 who, within the next five years ‘would like to move to’ and ‘would expect to move to’:
• Unsupported accommodation • Independent accommodation with support • Residential/nursing home • Extra Care Housing • Sheltered Housing • Other purpose built supported housing
In testing the assumptions, the final three categories were combined to give an overall percentage of respondents in each HMA who would like to and would expect to move in the next five years to retirement housing. These varied widely across HMAs from 0% to 100% of respondents wishing or expecting to move to this type of housing. Part of this variation is likely to be due to the small number of respondents in some HMAs, and therefore this data set needs to be treated with caution. The percentage figure was inserted into the model to produce surplus/shortfall figures for each HMA, keeping other factors constant. It was not possible to divide the data into 65-75 and 75+ categories, so a global figure for 65+ population was used for 2011 and projected for 2034.
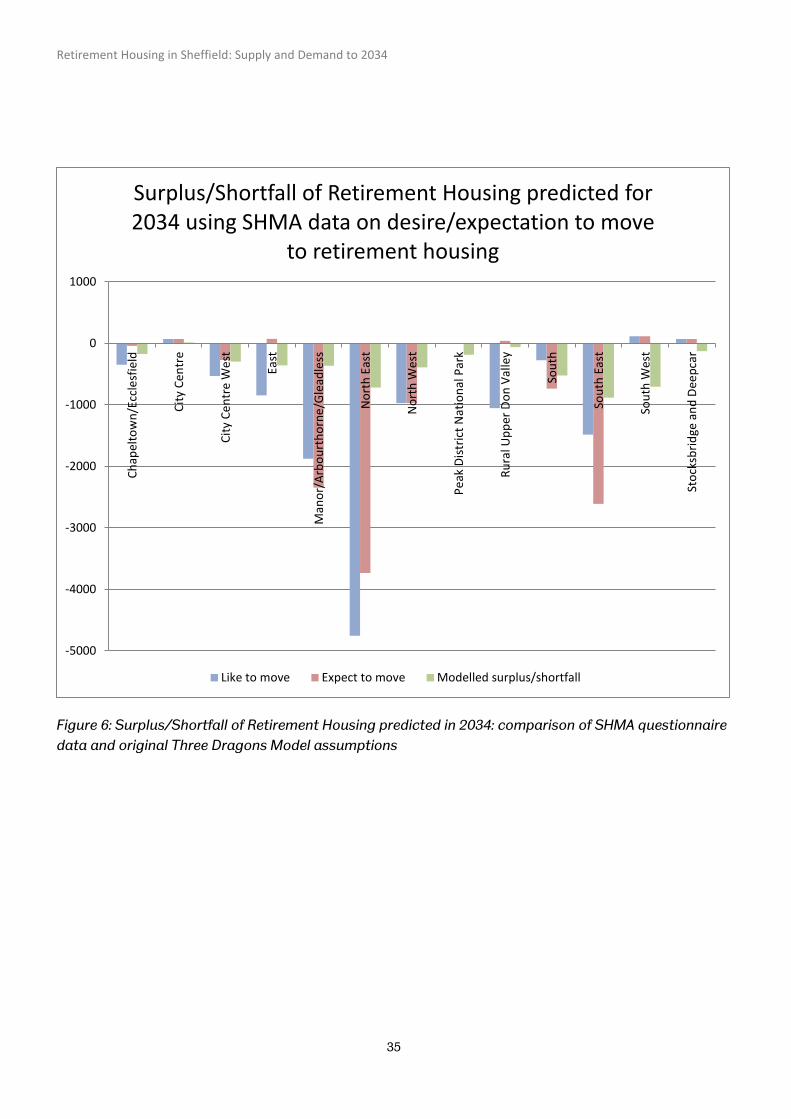
The data show that overall, using the SHMA data, that the Three Dragons Model significantly under-predicts the scale of shortfall, with a citywide shortfall of -11,880 from those indicating that they would ‘like to move’ and a shortfall of -10,338 for those indicating that they ‘expect to move’. The shortfall of retirement housing across the city in 2034 predicted by the Three Dragons Model (using baseline assumptions) is -4,767. The shortfall is greater when using data on whether respondents would like to move (-11,880) compared to whether they expect to move (-10,338), potentially indicating an awareness of a lack of retirement housing options in the city. Significantly, the data drawn from the SHMA questionnaire broadly show a greater desire to move to retirement accommodation, with a number of HMA areas indicating that 30-40% of 65+ surveyed wish or expect to move, compared to the Three Dragons assumption of 2.5% (65-75) and 15% (75+). The greatest variances between the Three Dragons Model and SHMA questionnaire data are in the North East, Manor, Arbourthorne and Gleadless, and South East. Other areas show greater consonance with the Three Dragons Model, though the majority of predictions drawn from SHMA data indicate a greater shortfall. Some differences exist between the questionnaire data on desire to move and expectation to move, though there is no clear pattern between the two data sets. It should, however, be restated that this analysis is drawn from small sample sizes within each HMA, and is therefore likely to require further work to test the actual preferences for moving amongst the 65+ population in Sheffield.
Scenario testing rates of older people seeking to move to retirement housing
Retirement Housing in Sheffield: Supply and Demand to 2034
33
A variety of factors may either increase or decrease the proportion of older people seeking to move to retirement housing. A key factor that may increase the rates and numbers of older people seeking to move include rising rates of limiting illness or mobility, such as obesity and dementia. Longer life expectancies, meaning that people will be living longer with health or mobility problems, indicate that older people require specialist housing for longer18. Additionally, changing cultural and societal expectations about housing mobility may mean fewer people are willing to remain in their ‘family’ home into older life. Evidence from the USA indicates that up to 17% of over 60s live in dedicated retirement communities, compared to 1% in the UK19. Conversely, other factors may mean a reduced number of older people seeking to move into specialist accommodation. In particular, the upgrading of existing housing stock and provision of better standards of general needs housing (for example as ‘Lifetime Homes’ and/or ‘Category 2 Accessible Housing’) would mean that a greater proportion of older people live in accommodation suitable for their changing health and mobility needs.
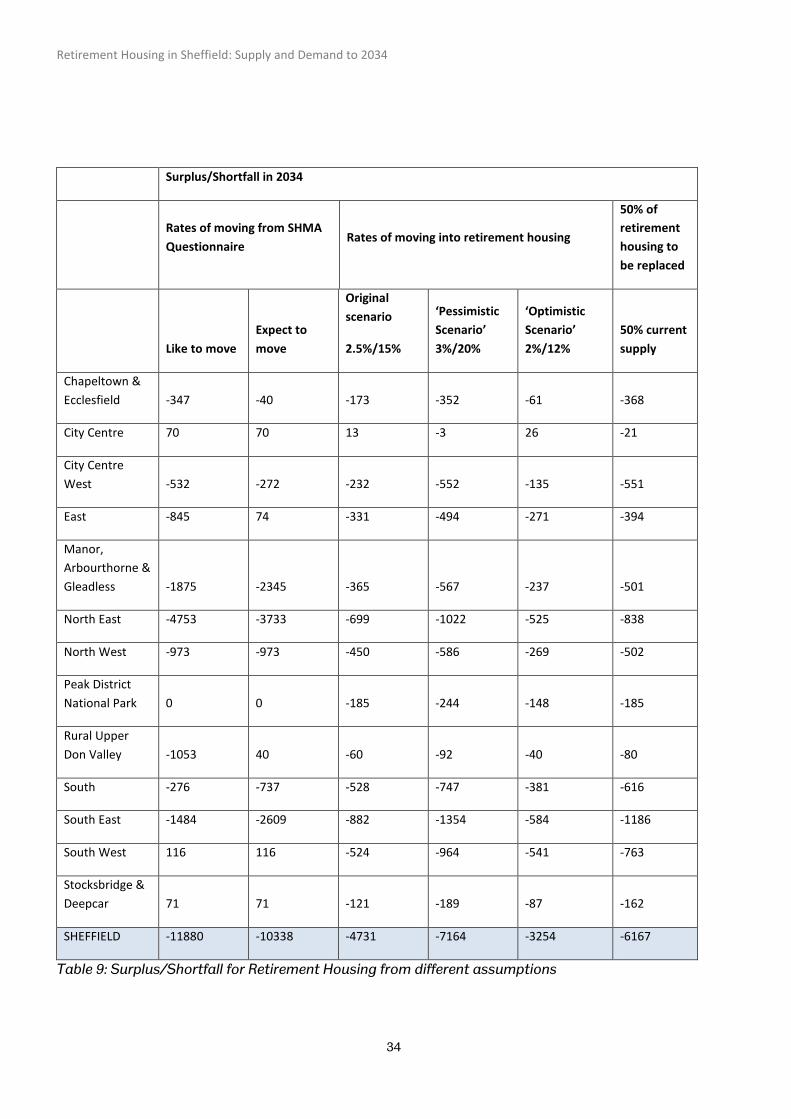
We tested two assumptions: firstly that 2% of 65-75 and 12% of 75+ households would need to move into retirement housing (the ‘optimistic’ scenario), and secondly that 3% of 65-75 and 20% of 75+ households would need to move into retirement housing (the ‘pessimistic’ scenario). The data is presented in Table X, and show that under the ‘optimistic’ scenario that by 2034 a total of 3,218 extra units would be required across Sheffield, with three HMAs having a surplus of accommodation. Under the ‘pessimistic’ scenario, there would be a need for 7,128 extra units in the city, with all areas being in deficit. The highest need for extra units would be in the South East, which would require 1,354 extra units by 2034.
5.2 Testing Replacement Rates for Retirement Housing
The original test assumed that all current retirement housing in Sheffield was fit for purpose. It is, however, likely that some housing will not be fit for purpose, and should either be renovated or replaced with other properties. The Three Dragons/London analysis tests for a 50% replacement rate over the course of the plan period (i.e. half of all retirement housing will need replacing 2014-2034). This test was performed on the Sheffield data, and the results presented in the table below. This indicates a need for 6167 extra units to be made available by 2034, with the highest need being in the South East and North East of the City.
18 Jagger, C (2015) Trends in Life Expectancy and Healthy Life Expectancy, Foresight Report, London: Government Office for Science
19 Sutherland, J. (2011) Viewpoint on Downsizing into Specialist Accommodation for Older People, London: Housing LIN
Retirement Housing in Sheffield: Supply and Demand to 2034
34
Surplus/Shortfall in 2034
Rates of moving from SHMA Questionnaire
Rates of moving into retirement housing
50% of retirement housing to be replaced
Like to move Expect to move
Original scenario
2.5%/15%
‘Pessimistic Scenario’ 3%/20%
‘Optimistic Scenario’ 2%/12%
50% current supply
Chapeltown & Ecclesfield -347 -40 -173 -352 -61 -368
City Centre 70 70 13 -3 26 -21
City Centre West -532 -272 -232 -552 -135 -551
East -845 74 -331 -494 -271 -394
Manor, Arbourthorne & Gleadless -1875 -2345 -365 -567 -237 -501
North East -4753 -3733 -699 -1022 -525 -838
North West -973 -973 -450 -586 -269 -502
Peak District National Park 0 0 -185 -244 -148 -185
Rural Upper Don Valley -1053 40 -60 -92 -40 -80
South -276 -737 -528 -747 -381 -616
South East -1484 -2609 -882 -1354 -584 -1186
South West 116 116 -524 -964 -541 -763
Stocksbridge & Deepcar 71 71 -121 -189 -87 -162
SHEFFIELD -11880 -10338 -4731 -7164 -3254 -6167
Table 9: Surplus/Shortfall for Retirement Housing from different assumptions
Retirement Housing in Sheffield: Supply and Demand to 2034
35
Figure 6: Surplus/Shortfall of Retirement Housing predicted in 2034: comparison of SHMA questionnaire data and original Three Dragons Model assumptions
-5000
-4000
-3000
-2000
-1000
0
1000
Chap
elto
wn/
Eccl
esfie
ld
City
Cen
tre
City
Cen
tre
Wes
t
East
Man
or/A
rbou
rtho
rne/
Gle
adle
ss
Nor
th E
ast
Nor
th W
est
Peak
Dist
rict N
atio
nal P
ark
Rura
l Upp
er D
on V
alle
y
Sout
h
Sout
h Ea
st
Sout
h W
est
Stoc
ksbr
idge
and
Dee
pcar
Surplus/Shortfall of Retirement Housing predicted for 2034 using SHMA data on desire/expectation to move
to retirement housing
Like to move Expect to move Modelled surplus/shortfall
Retirement Housing in Sheffield: Supply and Demand to 2034
36
6 An Alternative Model: Shop@
An alternative model used to forecast older people’s housing needs and supply is the Shop@ Model, supported by the Housing LIN. This uses similar assumptions to the Three Dragons model, but relies on different categories to split supply and demand. The model also uses some different data sets from those used for the main Sheffield study presented here, including POPPI (Projecting Older People Population Information), Elderly Accommodation Counsel data on supply of housing, and ONS Census data (rather than DCLG Household Projections). The tool also splits supply into five categories, based on level of care provided:
1. Sheltered Housing 2. Enhanced Sheltered Housing 3. Extra Care – 24/7 Support 4. Residential Care 5. Nursing Care
The Shop@ model factors demand for specialist housing using prevalence rates drawn from the national study ‘More Choice, Greater Voice’, as well as current splits between rent and sale units. These are presented below
Housing Demand (units per 1,000 people 75+)
Current Market Split in Sheffield Rent % Sale %
Sheltered Housing 125 88 12 Enhanced Sheltered Housing
20 100 0
Extra Care – 24/7 Support
25 84 16
Residential Care 65 Nursing Care 45 Table 10: Baseline Assumptions of the Shop@ Model
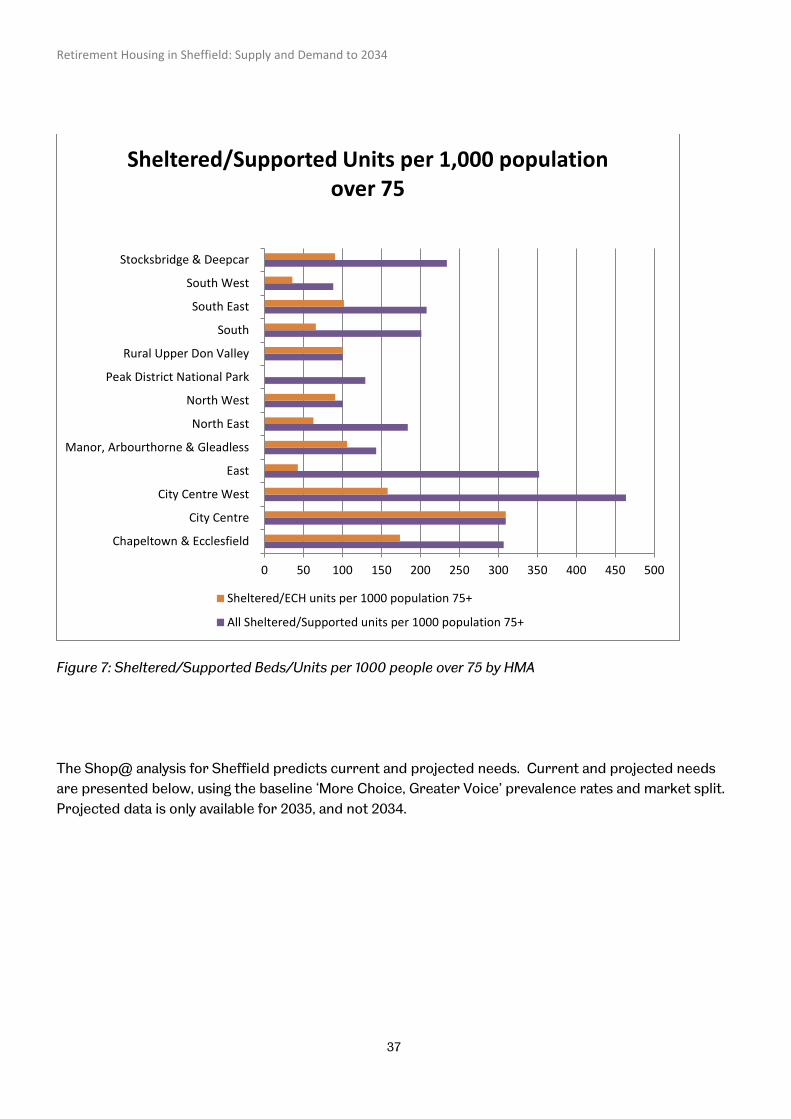
The Shop@ demand rates can be modelled against actual provision, within Sheffield. The Shop@ model predicts that demand per 1,000 people over 75 is 280 beds/units. Across Sheffield, the actual current provision is 218 beds/units for all forms of accommodation. The Shop@ model predicts 170 units of sheltered/enhanced sheltered and extra care per 1,000 population. Across, Sheffield, the actual current provision is 92 units of these forms of accommodation per 1,000 75+ population. Actual numbers of sheltered and supported beds/units per 1,000 population within each HMA are presented below in Figure 7, indicating that only in two areas is current demand for sheltered and extra care housing using Shop@ demand rates being satisfied: City Centre and Chapeltown and Ecclesfield.
Retirement Housing in Sheffield: Supply and Demand to 2034
37
Figure 7: Sheltered/Supported Beds/Units per 1000 people over 75 by HMA
The Shop@ analysis for Sheffield predicts current and projected needs. Current and projected needs are presented below, using the baseline ‘More Choice, Greater Voice’ prevalence rates and market split. Projected data is only available for 2035, and not 2034.
0 50 100 150 200 250 300 350 400 450 500
Chapeltown & Ecclesfield
City Centre
City Centre West
East
Manor, Arbourthorne & Gleadless
North East
North West
Peak District National Park
Rural Upper Don Valley
South
South East
South West
Stocksbridge & Deepcar
Sheltered/Supported Units per 1,000 population over 75
Sheltered/ECH units per 1000 population 75+
All Sheltered/Supported units per 1000 population 75+
Retirement Housing in Sheffield: Supply and Demand to 2034
38
2015 Supply
2014 Demand (baseline)
2035 Demand (projected)
2014 Surplus/Shortfall
2035 Surplus/Shortfall
Sheltered Housing
2,178 5,388 8,100 -3,209 -5,922
Sheltered Housing: Rent
1,921 4,741 7,128 -2,820 -5,207
Sheltered Housing: Lease
257 647 972 -389 -715
Enhanced Sheltered
71 862 1,296 -791 -1,225
Enhanced Sheltered: Rent
71 862 1,296 -791 -1,225
Enhanced Sheltered: Lease
0 0 0 0 0
Extra Care 566 1,078 1,620 -511 -1,054 Extra Care: Rent
473 905 1,361 -432 -888
Extra Care: Lease
93 172 259 -79 -166
Registered Care
4,124 4,741 7,128 -617 -3,004
Residential Care
1,606 2,802 4,212 -1,195 -2,606
Nursing Care
2,518 1,940 2,916 579 -398
Total Retirement Housing 2,815 7,328 11,016 -4,511 -8,201 Grand Total 6,939 12,069 18,144 -5,128 -11,205
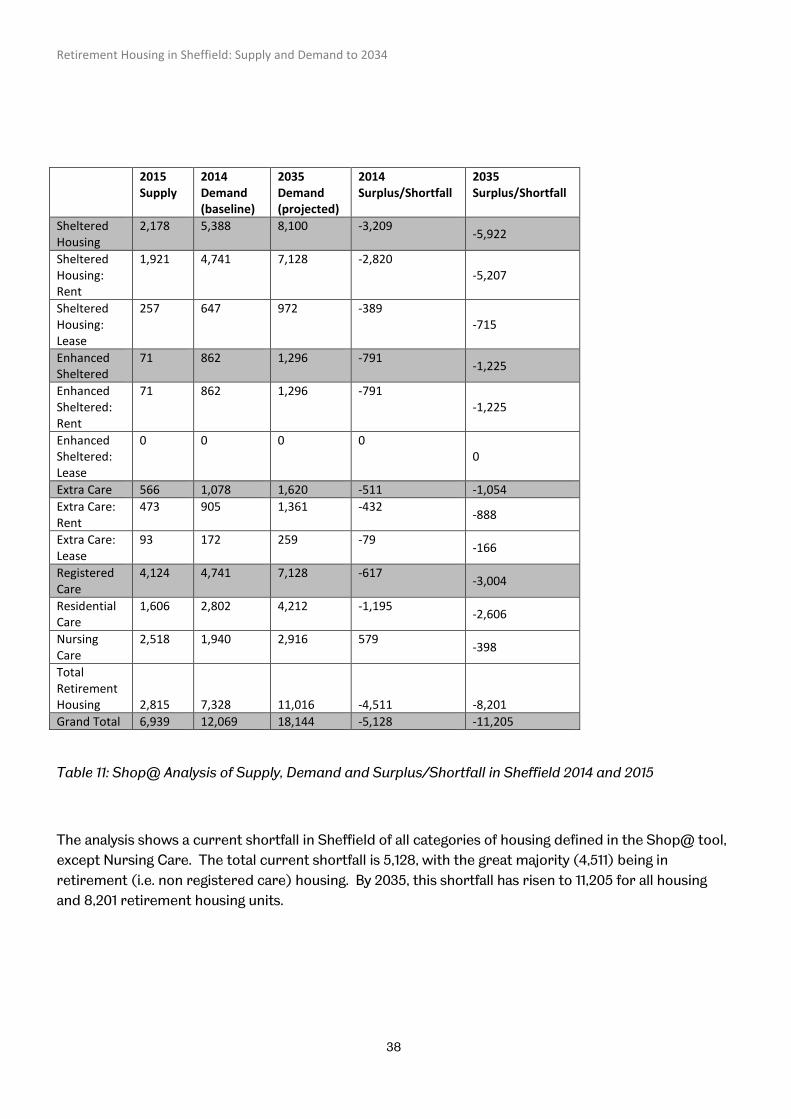
Table 11: Shop@ Analysis of Supply, Demand and Surplus/Shortfall in Sheffield 2014 and 2015
The analysis shows a current shortfall in Sheffield of all categories of housing defined in the Shop@ tool, except Nursing Care. The total current shortfall is 5,128, with the great majority (4,511) being in retirement (i.e. non registered care) housing. By 2035, this shortfall has risen to 11,205 for all housing and 8,201 retirement housing units.

Retirement Housing in Sheffield: Supply and Demand to 2034
39
The Shop@ analysis indicates a higher level of demand for retirement housing than the forecasts using the Three Dragons/London model, and consequently higher shortfalls by 2034/520. The shortfall using the Three Dragons model is 4,767, whereas Shop@ predicts a deficit of 8,201, a difference of 3,470. The Shop@ scenario is closer to the ‘pessimistic’ scenario which yields a shortfall of 7,164.
20 It should be noted that the Shop@ data is only available for 2035, whereas the Three Dragons model projects to 2034, which is the end date of the Sheffield Plan.
Retirement Housing in Sheffield: Supply and Demand to 2034
40
7 Affordability of Retirement Housing in Sheffield
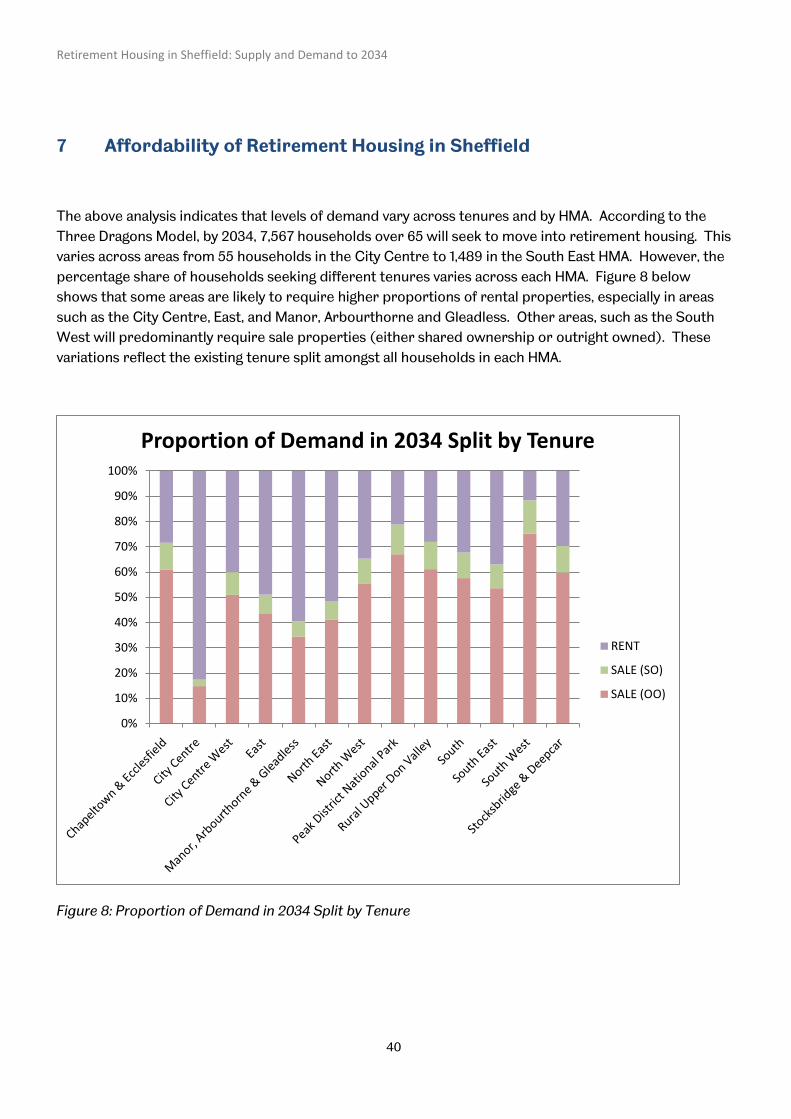
The above analysis indicates that levels of demand vary across tenures and by HMA. According to the Three Dragons Model, by 2034, 7,567 households over 65 will seek to move into retirement housing. This varies across areas from 55 households in the City Centre to 1,489 in the South East HMA. However, the percentage share of households seeking different tenures varies across each HMA. Figure 8 below shows that some areas are likely to require higher proportions of rental properties, especially in areas such as the City Centre, East, and Manor, Arbourthorne and Gleadless. Other areas, such as the South West will predominantly require sale properties (either shared ownership or outright owned). These variations reflect the existing tenure split amongst all households in each HMA.
Figure 8: Proportion of Demand in 2034 Split by Tenure
0%
10%
20%
30%
40%
50%
60%
70%
80%
90%
100%
Proportion of Demand in 2034 Split by Tenure
RENT
SALE (SO)
SALE (OO)
Retirement Housing in Sheffield: Supply and Demand to 2034
41
7.1 Wealth
Findings from the Strategic Housing Market Assessment21 indicate that the wealth of older households varies across the city, particularly in savings and equity levels. Across the whole city, older households have lower than average incomes with 32% having annual incomes greater than £20,000 compared to 52% of all households. However, older households have broadly higher levels of equity: across all older home owners, 90% have more than £75,000 in equity. However, savings levels vary more widely with 30% of older households having less than £5,000 in savings, but 20% having more than £75,000 saved.
Across HMAs, income levels varies significantly amongst older households. Over 70% of 65+ households in the South West HMA have an annual income over £20,000 (an average weekly income of £385), with high proportions also found in the Peak District National Park and City Centre West HMAs. However, in the East, Manor Arbourthorne and Gleadless ,and Rural Upper Don Valley less than 15% of older households have annual incomes above £20,000. With regard to savings, the picture is less varied. The highest proportion of older households with total savings over £20,000 again remains in the South West, Peak District National Park, and City Centre West, though over 30% of households in East, Manor Arbourthorne and Gleadless, and Rural Upper Don Valley have savings above £20,000. The lowest proportion with savings above this amount is in the North East HMA at 29%. Overall, across the city there are 14,923 older households with more than £20,000 in savings, though these are distributed unevenly. Over 6,000 of these households live in just two of the 13 HMAs: South West and City Centre West.
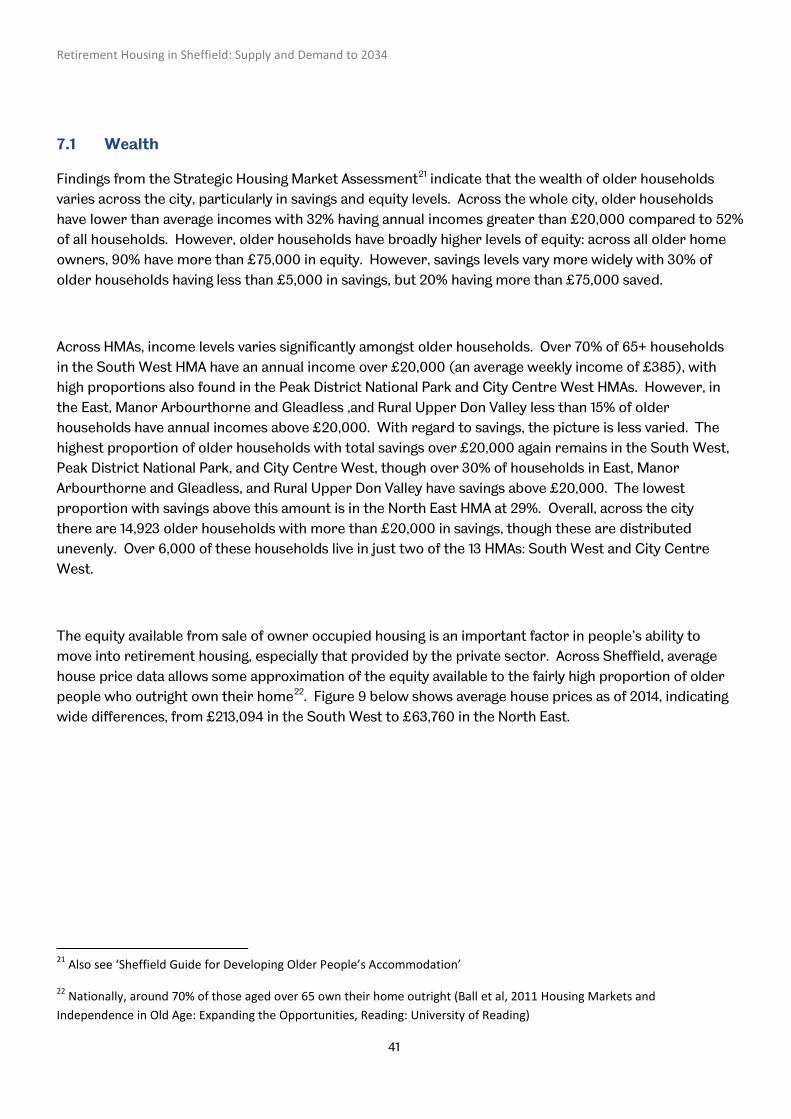
The equity available from sale of owner occupied housing is an important factor in people’s ability to move into retirement housing, especially that provided by the private sector. Across Sheffield, average house price data allows some approximation of the equity available to the fairly high proportion of older people who outright own their home22. Figure 9 below shows average house prices as of 2014, indicating wide differences, from £213,094 in the South West to £63,760 in the North East.
21 Also see ‘Sheffield Guide for Developing Older People’s Accommodation’
22 Nationally, around 70% of those aged over 65 own their home outright (Ball et al, 2011 Housing Markets and Independence in Old Age: Expanding the Opportunities, Reading: University of Reading)
Retirement Housing in Sheffield: Supply and Demand to 2034
42
Figure 9: Average Housing Price in Sheffield HMAs, 2014
7.2 Housing Costs
Data from Sheffield City Council, Registered Providers, and Land Registry/Rightmove allows basic analysis of the sale prices and rental costs of retirement housing in 201523.
Average costs indicate Social Rented values as the lowest costs of retirement housing in the City, with an average weekly rental of £73.05 for Age-Banded housing (i.e. general needs housing that is age banded)24, and £66.35 for Sheltered Housing (though there is no data available for Registered Providers). Extra Care rental provision is more expensive, with an average weekly basic rental of £96.09, though this excludes service and ineligible charges averaging £62.14 per week, bringing average gross housing costs to £158.23 in these schemes. There is, however, some variation in gross rents for a 2 bed unit from £97.14 (The Meadows) to £213.98 (Brunswick Gardens).
23 In some categories, especially sale prices of retirement housing, small volumes of recent sales mean that data sources are limited
24 Age-banded, ‘general needs’ housing is included for comparison only
0
50000
100000
150000
200000
250000
Average House Price 2014
Retirement Housing in Sheffield: Supply and Demand to 2034
43
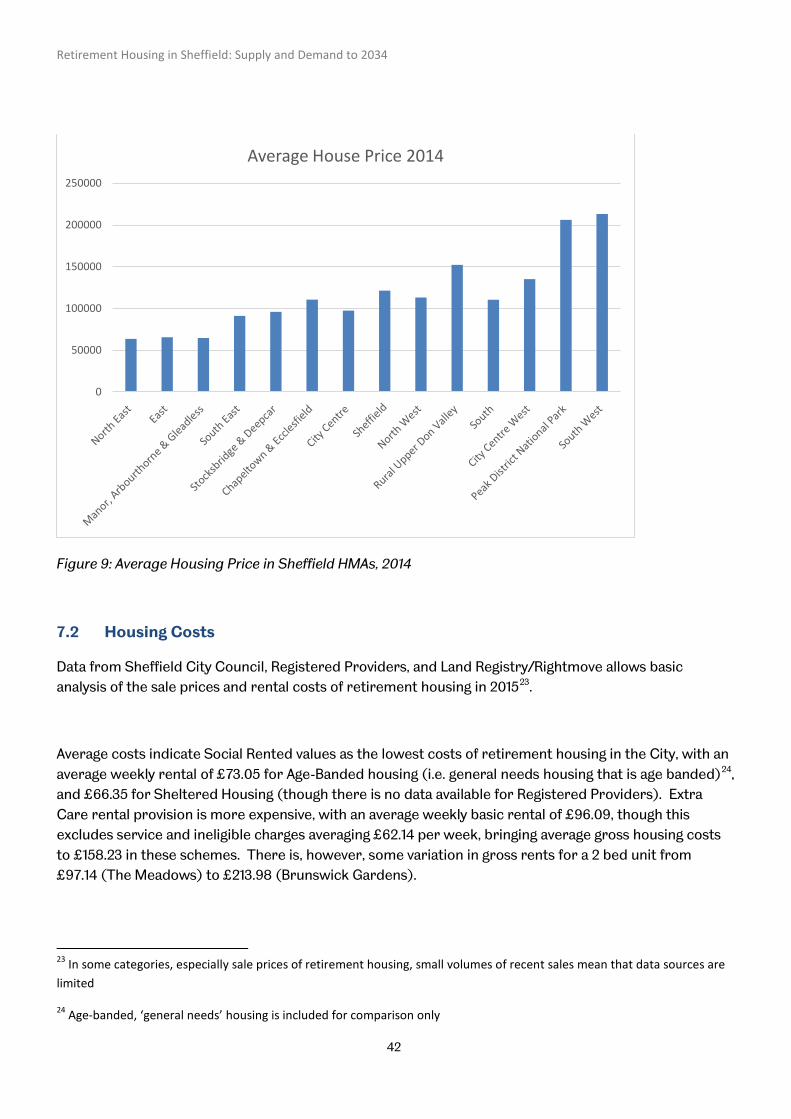
With respect to market properties, average sale price of ‘age-banded’ properties is £90,982 (this relates to properties that are restricted to residents over a certain age, usually 55 or 60, but provide no extra communal facilities). The average sale price of sheltered housing in the city is £126,545, whilst for Extra Care the average sale price is £230,173. Shared ownership properties are slightly cheaper, though differences in average costs are not very large.
Average 0 bed 1 bed 2 bed 3 bed
Sale/
Rent
Age-banded / Age-Exclusive
SCC (2015/16) £73.05 £56.88 £64.62 £73.55 £82.38 Rent
RP (Social Rent) (2014/15) £79.15 Unavailable £70.62 £80.19 £88.76 Rent
RP (Affordable Rent) (2014/15) £94.86 Unavailable £78.51 £91.47 £104.77 Rent
Market (2014-16) £90,982 n/a £93,790 £86,992 n/a Sale
Sheltered
SCC (2015/16) £66.35 £56.83 £65.70 £77.58 £81.13 Rent
RP Unavailable Unavailable Unavailable Unavailable Unavailable Rent
Market (excl. shared ownership) (2014-16) £126,545 n/a £106,142 £139,000 n/a Sale
Market (incl. shared ownership) (2014-16) £123,143 n/a £99,336 £139,000 n/a Sale
Extra Care
RP Schemes (Basic Rent) (2015/16) £96.09 n/a £90.49 £101.69 n/a Rent
RP Service charge £46.98
RP Ineligible charge £15.16
Market (excl. shared ownership) (2014-16) £230,173 n/a £210,464 £291,975 n/a Sale
Market (incl. shared ownership) (2014-16) £218,642 n/a £188,023 £291,308 n/a Sale
Table 12: Average Retirement Housing Costs in Sheffield (source Sheffield City Council, Registered Provider data, Land Registry, Rightmove)
The sale market for retirement housing is concentrated across a limited number of schemes, and most recent sales are in the South West HMA. Out of 39 sales of retirement housing in the main schemes in Sheffield in the first 3 quarters of 2015, 28 were in the South West HMA. The average sale price during
Retirement Housing in Sheffield: Supply and Demand to 2034
44
this period in the South West HMA is £186,324, compared to an average sale price in all other areas of £122,140.
There were only four sales of shared ownership properties in the first three quarters of 2015 across Sheffield, within the main schemes. These varied in price from £52,000 to £139,750.
7.3 Help with Housing Costs
Assistance for older people in meeting housing costs is complex, and varies widely according to circumstances, particularly income and savings levels and tenure. The Guarantee Credit element of Pension Credit tops up weekly incomes if they fall below £151.20 for an individual or £230.85 for a couple, and also opens up support for part or all of housing costs. Weekly incomes are calculated based on actual income and savings (equivalent to earning £1 per week for every £500 saved over £14,250). For those in social rented housing, housing benefit is available and will support all or part of weekly rent, depending on income. For those in owner occupied housing, support is available dependent on whether weekly income falls below the Guarantee Credit threshold. The same benefits apply for service charges, with full or partial support for social tenants but greater variability for owner occupiers of retirement housing through Guarantee Credit25. Benefits for housing related support, such as wardens and community alarm services are normally fully provided for social housing tenants, but mostly not available to owner occupiers. Broadly, support for rent, service charges, and housing related services is far greater for social housing tenants than for private housing tenants.
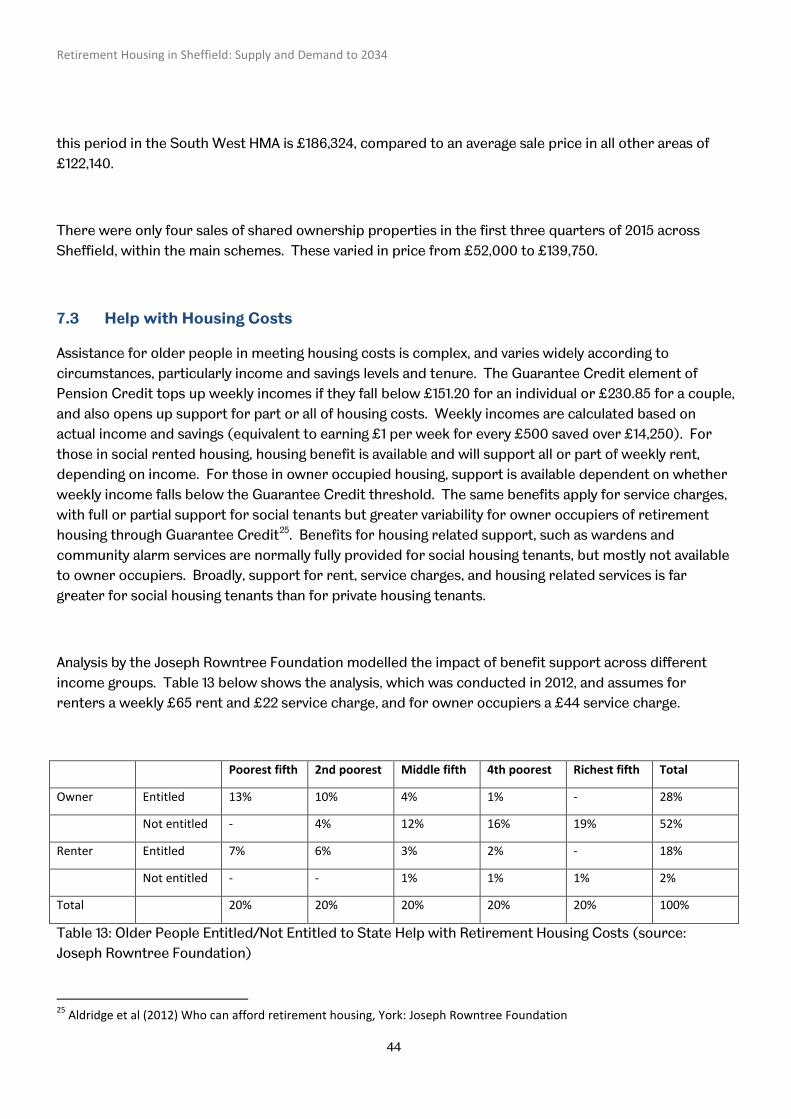
Analysis by the Joseph Rowntree Foundation modelled the impact of benefit support across different income groups. Table 13 below shows the analysis, which was conducted in 2012, and assumes for renters a weekly £65 rent and £22 service charge, and for owner occupiers a £44 service charge.
Poorest fifth 2nd poorest Middle fifth 4th poorest Richest fifth Total
Owner Entitled 13% 10% 4% 1% - 28%
Not entitled - 4% 12% 16% 19% 52%
Renter Entitled 7% 6% 3% 2% - 18%
Not entitled - - 1% 1% 1% 2%
Total 20% 20% 20% 20% 20% 100%
Table 13: Older People Entitled/Not Entitled to State Help with Retirement Housing Costs (source: Joseph Rowntree Foundation)
25 Aldridge et al (2012) Who can afford retirement housing, York: Joseph Rowntree Foundation
Retirement Housing in Sheffield: Supply and Demand to 2034
45
The analysis reveals a fairly complex picture, with 28% of all older people entitled to support being in owner occupied housing, and 18% of all older people entitled to this support being in rented housing (the proportion of those in rented accommodation entitled to support is much higher, but figures here present percentages of all older people). Amongst the poorest fifth, all older people are entitled to support, but none in the richest fifth of the older population. Ineligibility rises fairly quickly as incomes rise amongst owners – of the second poorest quintile who are owners, 28% are not entitled to help, rising to 75% of owners in the middle quintile and 94% of owners in the fourth poorest quintile. Amongst renters, however, a very small proportion is not entitled to state support – for example 66% of the 4th poorest quintile who are owners receive help (a far smaller group, given the generally lower incomes of renters). The Joseph Rowntree Foundation research also reveals a range of ‘trapdoors’ that can affect older people’s ability to move to retirement housing, including high care costs for those with savings over the £23,250 threshold, as well as ineligibilities of those in owner occupied housing for service charge or housing related services support. Their analysis suggests that those owner occupiers in middle and lower income levels are likely to have to make the largest financial sacrifices (including using savings), whilst those on the lowest income levels regardless of tenure are still likely to have the lowest weekly incomes, even when housing costs are largely supported.
7.4 Affordability of Retirement Housing in Sheffield
The analysis above indicates that older people’s ability to afford retirement housing varies widely across income and savings levels and tenure. For those in social rented housing, the availability of housing benefit enables a move into retirement housing with the least financial cost or sacrifice. Due to the nature of state help, tenants across any area of the city are eligible for help to move into retirement housing, though proportionally this group is concentrated in certain housing market areas, notably the East, North East, and North.
For owner occupiers, different equity levels in housing mean that residents in certain areas are most likely to be able to afford private retirement housing. The average price of an age banded property in Sheffield is £109,636, with the average prices of all housing being higher in seven of the 13 housing market areas mostly those to the south and west of Sheffield, indicating greater affordability in these locations. The average price of sheltered housing in Sheffield is £126,545, with the average sale price of all housing being higher in only four of the 13 housing market areas (City Centre West, Rural Upper Don Valley, Peak District National Park, and South West). The average price of extra care housing from 2014-16 was £230,645, meaning that no housing market area’s average housing price exceeded this value. However, these figures have to be taken with some caution, as the average prices for retirement housing are based on low numbers of market transactions. Furthermore, older people are more likely to live in detached and semi detached properties, meaning that equity levels in housing are likely to be higher amongst this group. If 2014 sale values of semi-detached properties are used, then four areas fall below the average cost of an age banded property, these being North East, East, Manor Arbourthorne and Gleadless, and South East.
Retirement Housing in Sheffield: Supply and Demand to 2034
46
Overall, those owner occupiers in lower and middle income groups within lower value housing market areas are most likely to struggle to afford retirement housing. This group is less likely to receive state help/benefits to assist with housing costs than those in low and middle income groups in social housing. Those least likely to struggle to afford retirement housing are those social housing tenants able to secure housing benefit, and those with the highest housing equity, incomes, and savings, most likely to be concentrated in high value housing market areas such as South West. However, high service charges allied with a complex and uncertain state benefit situation may hinder the movement of a wide range of older people into retirement housing26, meaning that wider considerations than basic housing cost need to be factored into analysis of affordability.
26 See Aldridge, 2012
Retirement Housing in Sheffield: Supply and Demand to 2034
47
Appendix 1: Data Sources used in the Main Model
A range of data sets were drawn upon as inputs to the main model. These were:
ONS Census 2011 Households at housing market sub-area level
DCLG 2012 Household Projections at Local Authority Level
Supply of Retirement Housing drawn from SCC data and the Elderly Accommodation Council at housing market sub-area level, 2016 figures.
2013 Sheffield SHMA data from household survey, deriving data for respondents’ desire and expectation to move to retirement housing within five years, at housing market sub-area level. It should be noted that this is a small sample in some sub-areas, and therefore results should be interpreted in this context
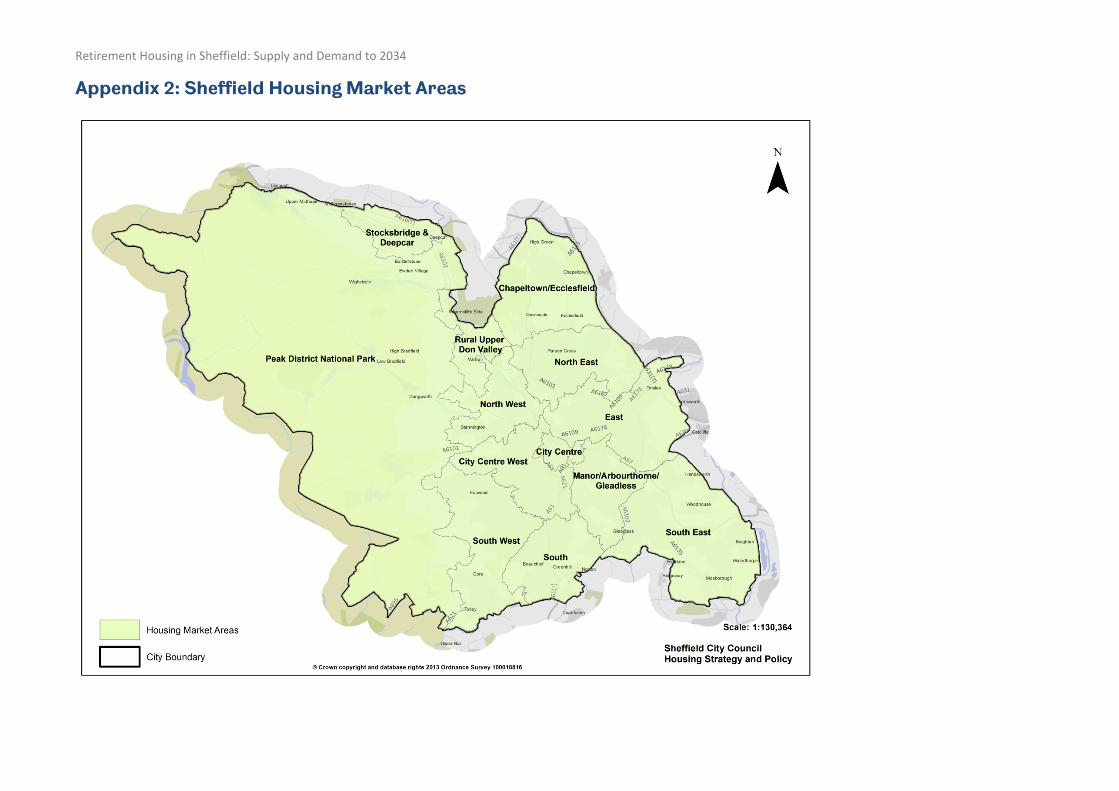
Retirement Housing in Sheffield: Supply and Demand to 2034
Appendix 2: Sheffield Housing Market Areas

Retirement Housing in Sheffield: Supply and Demand to 2034
© DWELL/University of Sheffield, May 2016