Embed Size (px)
Citation preview

Retail Food Waste Action Guide
2018

©2018 ReFED

CONTENTS
Acknowledgments 1
The Opportunity 3
Solution Summary 9
Prevention Solutions 11
Recovery Solutions 17
Recycling Solutions 21
Setting the Strategy and Approach 26
The Path Ahead 29
Contributors & Reviewers 31
Appendix 32
References 37
Resources 39
1
ABOUT ReFED
ReFED is a collaboration of over 50 private, nonprofit, and public-sector leaders committed to reducing food waste in the United States. The organization engages stakeholders throughout the food system to implement solutions, envisioning a future where combatting food waste is a core driver of business profits, job creation, hunger relief, and environmental protection.
PROJECT TEAM
The development of the Retail Food Waste Action Guide was led by ReFED, including Chris Cochran, Eva Goulbourne, Chris Hunt, and Angel Veza in partnership with Deloitte Consulting LLP.
Deloitte Consulting LLP works with grocery and food businesses across the supply chain to address merchandising decisions, transform supply chains, and develop economically sound diversion strategies. Team members included Blythe Chorn and Kyle Tanger.
Graphic design by Ocupop, including Abby Lindstrom, Michael Nieling, and Jason Reimer.
INDUSTRY PARTNERS
This guide was developed in partnership with the Food Waste Reduction Alliance and its members to accelerate waste reduction activities across the food industry. The Food Waste Reduction Alliance contributed valuable insights, data, and industry perspectives to inform the analysis and solutions presented in the guide.
Special thanks to the following companies for providing examples and thoughtful input: Ahold Delhaize, The Kroger Company, Sprouts Farmers Market, Inc., and Walmart Stores, Inc.
The Retail Food Waste Action Guide was made possible with generous support from the following foundations and donors:
AJANA FOUNDATION
THE CROWN FAMILY

ReFED | Retail Food Waste Action Guide 2
ABOUT THE ROADMAPIn 2016, ReFED published A Roadmap to Reduce U.S. Food Waste by 20 Percent (refed.com/roadmap), the most comprehensive analysis of U.S. food waste and solutions conducted to date. ReFED now works with food businesses, foundations, investors, innovators, and policymakers to implement food waste solutions at scale, putting us on the path to achieving the USDA/EPA goal of halving food waste by 2030.
• The Roadmap shows a path to a 20% reduction of food waste through 27 cost-effective, scalable solutions. These solutions would reduce food waste by 13 million tons annually, generating $100 billion of cumulative economic value over the next decade.¹
ABOUT THE RETAIL FOOD WASTE ACTION GUIDE
This Guide is designed to help retail businesses understand the size of the food waste prize and provide industry-specific guidance on implementing food waste reduction solutions and recommendations. It is designed for sustainability directors and business function leaders in the U.S. retail industry responsible for creating and implementing food waste reduction strategies. The Guide aims to:
• Provide an overview of the national food waste challenge and the retail industry’s opportunity to address it while improving business outcomes.
• Present an array of proven prevention, recovery, and recycling solutions to help the industry prioritize and accelerate waste reduction activities.

3
THE OPPORTUNITY Today, the United States spends over $218 billion – 1.3% of GDP – growing, processing, transporting, and disposing of food for human consumption that is never eaten. That equals 52.4 million tons of food sent to landfill, and an additional 10.1 million tons left unharvested on farms, totaling roughly 63 million tons of annual food waste.2
Food waste reduction goals have been established by institutions across the globe, including a goal set by the U.S. government in 2015 to reduce food waste by 50% by 2030.3 ReFED’s Roadmap to Reduce U.S. Food Waste shows an achievable path to a 20% reduction of food waste within a decade.4
Addressable food waste can be found throughout the supply chain, which ReFED divides into four segments: farms, food manufacturers, consumer-facing businesses (including distributors, retail grocers, restaurants, foodservice providers, and institutions), and homes (including all consumers).
In the retail sector, supply chain complexity, interconnected drivers, and entrenched food waste cycles have led many retailers to consider food waste a cost of doing business. Food waste drivers in the retail sector include:
• Reluctance to change stocking practices or product sizes that are closely tied to brand identity and customer satisfaction.
• Silos within businesses leading to decisions that inadvertently create waste, e.g., holding on to safety stock to ensure in-stock availability even though the majority of that stock may go to waste.
• Limited understanding of how food waste reduction solutions can enhance product freshness and drive revenue.
• High customer standards for freshness that lead to the disposal of safe, edible food perceived to be past its prime or approaching its “expiration” date.
• Customer demand for variety and consistency in food products, which can strain retailers’ inventory management and food purchasing.
Retailers are beginning to recognize the financial and reputational value of food waste: for example, 3 of the top 10 U.S. retailers have set a public zero food waste-to-landfill goal.5 Retailers are also joining food waste reduction coalitions and organizations such as the International Consumer Goods Forum,6 Champions 12.3,7 and United States Food Loss and Waste 2030 Champions,8 all of which feature reduction goals and work to increase accountability and better coordinate retailer efforts.

ReFED | Retail Food Waste Action Guide 4
FINANCIAL VALUE
The U.S. retail food sector generates 8 million tons of waste a year in distribution centers and stores, or $18 billion a year in lost value.9 On average, the value of wasted food in retail is equal to roughly double the profits from food sales.10
The case for prevention—not paying to discard product that has been purchased for sale—is clear. The financial cost of food waste is expected to continue to grow: agriculture and food prices are expected to increase over the next five years with continued growth in demand, fuel price fluctuations, and weather volatility. Further, the costs associated with purchased food are rising—in particular the cost of labor to handle and sort food.11 Growth in assortment, meanwhile, adds significant costs but does not add proportionally to revenues.12 Despite the growth of online grocery, fresh food continues to drive traffic to brick-and-mortar stores, where prevention solutions can prolong freshness and reduce waste.
The financial rationale for donations is also building as retailers implement benefits from the Bill Emerson Food Recovery Act and other supporting policy. While donations should never create business profit, they are becoming more cost-effective than sending surplus food to landfill. For example, under the previous federal standard food donation deduction, a business could only claim the cost basis of donated inventory. The 2015 passage of the PATH Act, however, enhanced the donation deduction and made it permanent.13 The result: an offset for the cost of donated food as well as some of the costs of handling, storing, or transporting food for donation—and a stronger business case for food recovery.
Recycling can also create economic value for retailers. Partnering with recycling vendors to haul and process food waste requires minimal initial investment. And while the upfront financing costs of investing in retailer-owned and operated infrastructure are higher, rising energy prices and growing markets for outputs improve the cost-benefit business case. Shifts in policy and infrastructure are also making recycling a more attractive financial choice than landfilling food waste. Examples include landfill bans imposed by local and state governments and “pay-as-you-throw” pricing, both of which make recycling comparatively more economical. Innovations in recycling technologies such as small-scale anaerobic digestion may also improve the business case for retailers to recycle food waste.
REPUTATIONAL VALUE
The growing reputational value of food waste reduction—while harder to quantify than costs of purchased food or tipping fees for example—can also have a bottom line impact. Food waste is a tangible, highly visible problem gaining public attention. It affects retailers’ reputation with customers, employees, and investors, and can impact retailers’ brands.
Consumer Education Campaigns such as the Natural Resources Defense Council and Ad Council’s savethefood.com build awareness of the economic, social, and environmental consequences of food waste.14 Increased coverage in the popular media—such as segments on Last Week Tonight with John Oliver, CBS Evening News, and NBC’s Today Show covering date labeling; FYI’s Scraps, a no-waste cooking show; and the 2017 Anthony Bourdain documentary Wasted!—are also increasing consumer awareness.15 Retailers can enhance brand perception and customer loyalty by effectively communicating food waste efforts to an increasingly engaged consumer base.
ON AVERAGE, RETAILERS WASTE ROUGHLY DOUBLE THEIR FOOD PROFITS.

5
SOLUTIONS LANDSCAPEFOOD RECOVERY HIERARCHY
ReFED has adapted the Environmental Protection Agency (EPA) Food Recovery Hierarchy framework to categorize the solutions to reduce food waste, prioritizing prevention first, then recovery, and finally recycling, to maximize economic, social and environmental benefits. 16
PREVENTION
• Mostly nascent, prevention solutions offer the highest returns to retailers and are growing the fastest, with new solutions emerging that build on new technologies and digital capabilities.
• Prevention requires significant internal collaboration across business functions as efforts to reduce waste in one department can create more waste further along the value chain.
• Industry partnerships such as ReFED and the Food Waste Reduction Alliance have made advances to mobilize food companies to spread the costs of prevention solutions such as Standardized Date Labeling that create more benefits for consumers.
RECOVERY
• Most retailers have some form of donation program in place already but could increase store coverage and donation capture rates.
• The Protecting Americans from Tax Hikes (PATH) Act has enabled enhanced deductions that allow businesses to claim both the cost basis and half of potential profits if inventory can be sold at fair market value, increasing the value of donation for retailers.17
• Recovery is becoming more feasible with the emergence of prevention solutions such as Enhanced Demand Forecasting, which enables retailers to better forecast food available for donation.
RECYCLING
• The recycling rate of unsold food within retail is an estimated 10%,18 leaving significant untapped potential.
• The economics of recycling are highly sensitive to local prices of labor, property, disposal fees, compost values, and energy prices—retailers can adopt a regional approach to identifying and testing recycling opportunities to maximize value.
• Retailers can pilot new technologies and processes (e.g., depackaging, compostable packaging, and reverse logistics) to improve the economics of recycling.

ReFED | Retail Food Waste Action Guide 6
RETAIL SUPPLY CHAIN
The following graphic shows the flow of food through the retail supply chain, highlighting the opportunities to implement solutions to avoid and reduce waste.
CORPORATE• Procurement• Distribution• Transportation & Logistics• Store Operations• Merchandising• Information Technology (IT)• Food Safety & Quality Assurance• Marketing• Legal• Finance/Tax• Public Affairs/Policy• Sustainability/Foundation
EXTERNAL STAKEHOLDERS• Haulers• Farms• Local/State/Federal Governments• Food Recovery Organizations• Foundations• Entrepreneurs & Researchers• Nonprofits• Local and State Health Departments• Suppliers• IT Vendors• Transportation Vendors
STAKEHOLDERS WITHIN SUPPLY CHAIN

7
SOLUTIONS ANALYSISOf the 27 solutions identified in the Roadmap, 18 are applicable to retail. In addition, we have identified nine new, retail-specific solutions, which we present in this Guide. For more detail on each of the solutions, see Appendix C.
The Retail Solution Matrix is designed to help retailers prioritize solutions based on two dimensions:
• PROFIT POTENTIAL: the net annual profit potential of a given solution, not including initial investment.
• FEASIBILITY: a combination of the level of effort (e.g., the behavior, systems, process changes, and partnerships required) and the initial financial capital needed to implement a solution. The lower the level of effort and financial capital requirements, the higher the feasibility.
Solutions are sorted into three priority groups, with the first priority solution in the top right box, indicating high profit potential and feasibility. The third priority solutions are on the bottom left of the graph, indicating low profit potential and feasibility but potential importance to retailers for nonfinancial reasons.
• The solutions with greatest profit potential for retailers are all Prevention solutions: Improved Inventory Management, Cold Chain Management, Dynamic Routing, Enhanced Demand Forecasting, and Dynamic Pricing & Markdowns.
• The most feasible solutions (meaning easiest to implement and requiring lowest capital investment, are Consumer Education Campaigns, Standardized Donation Regulation, Donation Matching Software, and Reduced Handling.
This analysis differs from the Marginal Food Waste Abatement Cost Curve originally presented in the ReFED Roadmap, which ranks solutions by landfill Diversion Potential and Economic Value across the food value chain. The full dataset for the Cost Curve and an interactive data visualization can be found at refed.com.19

ReFED | Retail Food Waste Action Guide 8
This solutions matrix was developed using a combination of quantitative and qualitative data. It is designed to help retailers prioritize solutions based on business value, and does not reflect broader societal economic value. The matrix represents current landscape of the industry, and will evolve over time in response to shifts in: innovation, policy, and consumer preferences, and as better data becomes available. More details on each solution ranking can be found in Appendix B.

9
SOLUTION SUMMARYThe following graphic is a summary of retail solutions and their dimensions: profit potential, feasibility, industry prevalence, diversion potential and societal economic value.
PROFIT POTENTIAL: expected net annual profit, not including the upfront investment costs.
FEASIBILITY: A combination of implementation effort and initial capital requirement.
INDUSTRY PREVALENCE: estimated percentage of retail providers that have implemented a solution.
DIVERSION POTENTIAL*: portion of all food waste (by weight) that could be diverted from landfill through the implementation of a solution.
SOCIETAL ECONOMIC VALUE*: the annual aggregate financial benefit of a solution to society minus all investment and costs.
More details on each solution ranking can be found in Appendix B.
*Rankings are based on findings from The Roadmap. Any potential benefits would be considered society-wide, not just within the scope of the retail sector.

ReFED | Retail Food Waste Action Guide 10
More details on each solution ranking can be found in Appendix B.

11
PREVENTION SOLUTIONS
THE CURRENT LANDSCAPEPrevention remains largely nascent across the food value chain. Despite recent attention to food waste, many retailers still accept it as an unavoidable cost. All of the 15 retailers ReFED interviewed had launched food recovery programs, yet only about half were aggressively pursuing prevention. This is largely due to the complexity of making changes in the supply chain and in stores that require collaboration across a retailer, as well as the need to balance other desired business outcomes such as in-stock rates, quality, etc. Another factor is that some prevention solutions (e.g., Standardized Date Labeling and Packaging Adjustments) benefit the consumer more than the retailer, providing the retailer with low incentives for adoption.
Retailers are pushing ahead on prevention solutions adoption, however, and gaining experience in the process. Here are a few examples:
Many retailers are experimenting with Produce Specifications (Imperfect Produce). While it can be challenging to move this product through the supply chain due to lack of consistent availability, this solution can appeal to cost- and waste-conscious customers, and can serve as a consumer education tool. Working with Food Safety & Quality Assurance teams can ensure that imperfect produce is not rejected upon receipt due to a lack of understanding of changes in specifications.
Standardized Date Labeling has advanced thanks to the joint efforts of ReFED and the Food Marketing Institute (FMI) and Grocery Manufacturing Association (GMA), trade associations representing the largest retail grocery and consumer packaged goods manufacturers. FMI and GMA have developed a voluntary national standard for date label language to be broadly implemented throughout the U.S. by summer 2018.22 ReFED leads a multi-stakeholder date labeling working group to accelerate adoption of this new language and coordinate consumer education efforts. Contributing to this momentum, the Consumer Goods Forum announced that its members would adopt this same language, securing alignment globally.23
KEY INSIGHTS
Prevention is applicable across the retail value chain—from farms and manufacturing to customers’ homes.
The Roadmap shows that prevention solutions create three times the societal net economic value of recovery and recycling solutions combined.20 The Retailer Solution Matrix above also shows that prevention has the most potential to create profits for retailers: all of the five solutions identified as high profit potential are prevention solutions. Many prevention solutions require relatively low investment by retailers, enabling them to avoid wasting large volumes of food valued at higher retail prices.
• Mostly nascent, prevention solutions offer the highest returns to retailers and are growing the fastest, with new solutions emerging that build on existing technologies and digital capabilities.
• Solutions require significant internal collaboration across business functions as efforts to reduce waste in one department can create more waste further along the value chain.
• Industry partnerships such as ReFED and the Food Waste Reduction Alliance have made advances to mobilize food companies to spread the costs of prevention solutions such as Standardized Date Labeling that create benefits for consumers.
Kroger is helping reduce food waste by promoting the option of buying “ugly food,” off-spec, or Imperfect Produce that is still wholesome and safe to eat. Efforts to prominently display and sell slightly blemished, undersized, or misshapen produce at a reduced price also serve to educate consumers on food waste reduction.21
In 2015, Walmart and Sam’s Club began a campaign to work directly with suppliers to convert to a “Best If Used By” date label terminology on the packaging of all privately branded products to provide clear and consistent information to customers. Today, over 92% of these products are in compliance with the standard date labeling language.24
EDUCATING CONSUMERS WITH IN-STORE PROMOTION OF IMPERFECT PRODUCE
WORKING WITH SUPPLIERS TO CHANGE DATE LABELING

ReFED | Retail Food Waste Action Guide 12
13
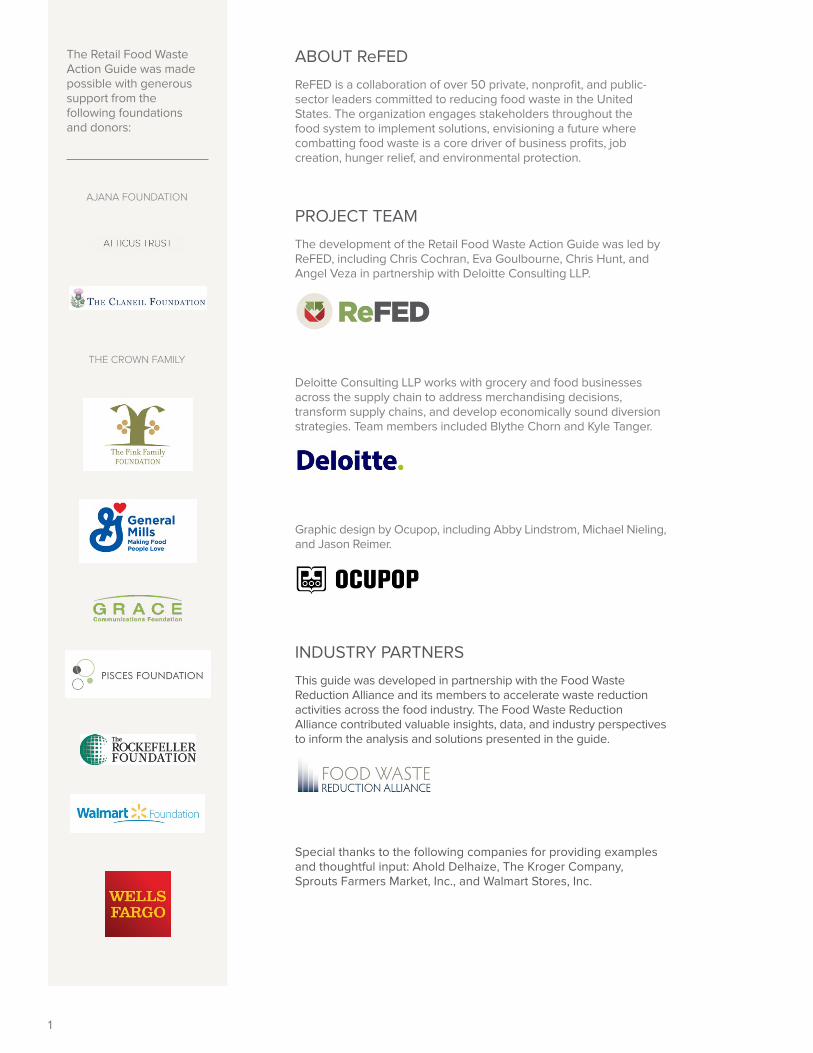
THE OUTLOOKThe feasibility levels of prevention solutions vary. Many solutions are capital-light, if implemented over time, calling for behavior changes, packaging alterations, and in-store marketing efforts. Also, while significant internal collaboration may be necessary, few (if any) external partnerships are needed. Exceptions to this rule are the significant infrastructure and technology investments needed for Cold Chain Management, Improved Inventory Management, Dynamic Routing, and Enhanced Demand Forecasting.
Most prevention solutions also have high value; at retail, food is worth roughly $2.50 per pound, or $5,000 per ton, which is magnitudes higher than the value of food scraps for disposal, providing a large economic driver for prevention efforts.25
Some solutions from the Roadmap have proven to be much more promising than expected. New digital technologies are opening up expanded opportunities in Cold Chain Management (which reduces product loss during shipment to distribution centers via direct shipments and cold-chain-certified carriers) and Improved Inventory Management (improved systems that track an average product’s remaining shelf-life and help reduce days on hand). As more retailers adopt these technologies and pilot these solutions, more data will become available about the full potential of these and other new solutions.

ReFED | Retail Food Waste Action Guide 14
BEST PRACTICES1. COLLABORATE ACROSS ORGANIZATIONAL SILOS
Prevention solutions require collaboration between different departments within a business even though departments may not be aware of the full cost implications of waste across the organization. Retailers have found that distinct departments within a business function as a system when it comes to waste—changes to decrease waste at one point can increase waste at another point in the system. For example, improved Cold Chain Management results in more products arriving at the distribution center still sellable. If the resulting decrease in product loss is not reflected in ordering changes, however, there is a risk of distribution centers becoming overwhelmed with food that is now surplus. Retailers must measure and identify root causes of waste along the entire value chain, and functions must work to share resources and budgets—and to leverage the return on investment of waste reduction initiatives across the business.
2. ALIGN COSTS AND BENEFITSIt is difficult for businesses to implement new technologies or processes if another part of the supply chain receives the benefit. It may be hard to build a business case to invest in Packaging Adjustments, for example, when consumers receive most of the cost savings. If the reputational enhancement aspect of such a strategy is understood though, retailers may decide the solution is worth the investment.
Engaging in industry collaborations on solutions such as Consumer Education Campaigns and Standardized Date Labeling that benefit consumers more than businesses can spread the already low costs further across the industry so no one retailer has to shoulder the burden. This also amplifies the impact on consumers through consistent messaging. There are many opportunities for retailers to join industry collaborations on shared food waste solutions such as ReFED, the Food Waste Reduction Alliance, and the Consumer Goods Forum.
3. ENGAGE WITH CUSTOMERSConsumer expectations for variety and cosmetic perfection have kept businesses from streamlining product selection by offering cosmetically imperfect food, reducing portion sizes, or allowing stock outs. Consumer perceptions of the freshness and quality of food can be negatively affected by changes to products such as Packaging Adjustments. One example is retailers that have received consumer pushback after experimenting with vacuum-sealed meats (for easy freezing and individual defrosting) due to differences in product appearance and lack of consumer understanding of the benefits.
There is a shift happening, however, as consumers become more aware of food waste and its consequences. Retailers can build brand image by explaining to consumers through in-store signage how stock outs help keep prices low and ensure that only the highest-quality products are sold, or how packaging changes allow products to be frozen and thawed individually, reducing waste and saving money.

15
1. REDUCED HANDLING
2. MEAL KITS
3. ENHANCED DEMAND FORECASTING
Reduced Handling has emerged as a low-cost prevention solution for produce among retailers. Less touching and movement of product during distribution reduces damage to fruits and vegetables and ensures that more product gets to stores in sellable condition. Retailers are also applying this approach to in-store merchandising: for example, more retailers are displaying produce in the box versus creating a pyramid display, and some stores post “don’t touch/handle with care” messaging for shoppers.
BENEFITS INCLUDE
• Lower prices for customers as a result of reduced waste, while still ensuring product availability.
Meal Kits that provide pre-proportioned fresh ingredients for home meal preparation reduce over-buying by consumers and food waste in homes. While many meal kit services have been built as standalone companies that deliver kits directly to consumers’ homes, retailers are starting to explore how to offer these services in stores as well as through direct-to-customer delivery (see below).
BENEFITS INCLUDE
• Increased revenue by providing a service of added convenience for customers.
Enhanced Demand Forecasting uses big data and advanced analytics to improve the sophistication of demand forecasting and buying. Enhanced forecasting takes into account store sales variability, seasonality of products and sales, and existing inventory on hand, coupled with external demand sensing. Examples include using social media data to track events, weather forecasts, and paycheck and food stamp timing to drive changes in demand.
BENEFITS INCLUDE
• Reduced overbuying and therefore reduced throws at distribution centers and stores flooded with product.
• Lower prices for customers as a result of reduced waste, while still ensuring product availability.
New SolutionsWith price competition and tightening margins across the industry, retailers are searching for new opportunities to cut food waste-related costs. While investment and interest in the prevention approaches described below is growing, implementation of these new solutions is still at the pilot and low-maturity levels.
Implementation Effort
Initial Capital Requirement
High Medium
Implementation Effort
Initial Capital Requirement
High High
Implementation Effort
Initial Capital Requirement
Low Low

ReFED | Retail Food Waste Action Guide 16
4. DYNAMIC ROUTING
5. DYNAMIC PRICING & MARKDOWNS
6. DIRECT-TO-CUSTOMER DELIVERY
Dynamic Routing involves using sensors to collect data on product freshness so that food with a shorter-than-expected shelf life can be re-routed on the spot to closer distribution centers and stores.
BENEFITS INCLUDE
• Maximized shelf-life resulting in reduced throws at distribution centers and stores and lower costs.
• Improved product freshness, resulting in enhanced brand perception and increased sales.
Dynamic Pricing & Markdowns uses sensors to gather real-time data about the quantity and quality of inventory on hand and of incoming orders, enabling product price adjustments in stores.
BENEFITS INCLUDE
• Increased sales of reduced-price product, resulting in increased revenue.
• Reduced throws, which may lead to lower supply costs if customer demand is satisfied through the increased availability of reduced-price foods.
Direct-to-Customer Delivery increases product velocity by transporting food directly from distribution centers or stores to customers. This solution can also be used to move specialty product designed for food waste reduction, such as direct-to-customer delivery of boxes of imperfect produce.
BENEFITS INCLUDE
• Increased sales through fresher produce and added convenience for customers.
• Decreased product throws resulting in reduced costs.
Implementation Effort
Initial Capital Requirement
High High
Implementation Effort
Initial Capital Requirement
High High
Implementation Effort
Initial Capital Requirement
High High

17
RECOVERY SOLUTIONS
THE CURRENT LANDSCAPERecovery is more advanced than prevention among retailers, but there is still considerable opportunity for growth. According to the latest Food Waste Reduction Alliance survey, 18% of unsaleable food by weight is donated.28 Retailers can improve the participation rate of stores and distribution centers, and even more so the performance of these facilities in recovery of unsaleable food, i.e., the donations capture rate.
Generally, retailers’ approaches to recovery are quite local and based on local regulations, incentives, and relationships. National-level solutions such as Standardized Donation Regulation would drive over half the overall recovery opportunity outlined in the Roadmap.29 Yet given the highly local nature of most recovery efforts, these solutions have been slow to gain traction.
Progress is being made, however, thanks to the passage of the Protecting Americans from Tax Hikes (PATH) Act in 2015, which expanded Donation Tax Incentives and made various new business entities eligible for food inventory enhanced deductions, which were previously accessible only to large C corporations on a permanent basis, and temporarily to non-C corporations. The enhanced deduction allows businesses to claim both the cost basis and half of potential profits of what the inventory could be or was sold at fair market value. With the expansion of the deduction in 2015, all businesses, regardless of size or incorporation status, can now take the enhanced tax deduction when donating food to a 501(c)(3) nonprofit.30 The enhancements to the deduction offset some of the costs of labor needed to separate and store food for donation—along with time spent communicating with food donation recipient organizations—and for storage facilities at stores and donation centers. They help shift the economics to make donation more cost effective than paying hauling and tipping fees to send unsalable food to landfill.
Donation Matching Software is also gaining traction with the growth of platforms. More retailers are experimenting with these tools, and pilots are expanding due to increased availability of the platforms. There is opportunity for ongoing expansion in this area as retailers’ real-time data about food availability and networks grow.
KEY INSIGHTS
Although food recovery initiatives already exist at the majority of retailers, there is still significant opportunity to increase donations through higher store and distribution center coverage and donations capture rates. ReFED analysis indicates the potential for grocery retailers to double food donations from current levels.26 27 Retailers play a critical role in increasing recovery:
• Retailers are critical to the policy changes needed for the solutions Standardized Donation Regulation and Donation Tax Incentives because of the importance of the retailer business voice to policymakers.
• Retailers play a lynchpin role in education, infrastructure, and logistics solutions as a primary source of unsold food that can be recovered to feed the hungry.

ReFED | Retail Food Waste Action Guide 18
THE OUTLOOKThe majority of recovery solutions still have low to medium penetration. They differ from prevention solutions in that prevention strategies can be implemented as one-off solutions, while recovery requires an ecosystem approach supported by three pillars:
• Education for food businesses on donor liability protections through the Bill Emerson Good Samaritan Food Donation Act and safe food handling practices.
• Support for and advancement of policy that financially incentivizes donations from businesses while providing standardized and science-based food safety regulations.
• Efficient logistics and infrastructure to transport, process, and distribute excess food.31
Recovery solutions are complex, and often involve a geographic disconnect: unsold food is not always available where food insecurity is concentrated. This can impede national solution implementation across a business.
Recovery solutions require relatively minimal investment from retailers, mainly involving process changes and partnership management. Exceptions to this rule include significant infrastructure investment that may be needed for Donation Transportation and Donation Storage & Handling.
These solutions are also low value: costs, but also benefits, are spread across a large number of stakeholders, and a retailer will always generate more profit by selling than by donating food.

19
BEST PRACTICES1. LOOK FOR WAYS TO OVERCOME LIABILITY CONCERNS
The federal Bill Emerson Good Samaritan Food Donation Act protects donors and recipients from civil or criminal liability short of gross negligence and intentional misconduct. However, this legislation remains unproven and untested in court, leaving retailers’ legal departments without a precedent to follow. Brand protection is another important concern. As one retailer explained, “It doesn’t matter if I can’t be sued; it’d almost be worse to have the company’s name on the front page of the Wall Street Journal in conjunction with someone dying from eating our food.”32
Partnering with established food recovery organizations with stringent donation safety protocols and processes reduces the risks associated with donating and provides brand protection in the case of an adverse event.
2. TAILOR DONATIONS APPROACHES LOCALLYHealth regulations vary by city and state, arising from “home rule” authority in some localities and differing interpretations of the FDA Food Code, which only loosely defines basic requirements for food safety.33 Lack of uniformity in these laws inhibits retailers from developing uniform food donation approaches across their organizations.
Leading retailers are working around this barrier by creating regulations databases in all the localities in which they have stores and distribution centers, and by supporting local staff in adapting practices to meet local regulations. (For more information, see the ReFED Policy Finder - refed.com/policy.)
3. MANAGE THE COMPLEXITYThe existing food recovery system is vast, including hundreds of regional and statewide food banks serving over 60,000 food recovery and hunger agencies.34 In this complex web of overlapping local networks, scale and transaction costs matter immensely.
For example, large batches of food (e.g., several dozen tons of potatoes) need significant transport, storage, and nonprofit labor and processing resources to be utilized before spoiling. Conversely, if one store wants to donate a single bag of 50 peaches, it can be hard to justify the labor and infrastructure costs needed to transport it to a donor recipient.
New prevention solutions such as Enhanced Demand Forecasting and Dynamic Routing allow retailers to reduce some of this complexity by better forecasting food that will be available for donation. This gives food recovery organizations more time to prepare the storage, handling, and transportation necessary to recover food.
Leading retailers have also found ways to embrace this complexity by allowing more frequent pick-ups from more food recovery organizations to ensure that unsold food is recovered despite variability in availability.
When food goes unpurchased by consumers, Walmart works to maximize its use and get good food that is still edible to people and places that need it most. Through Walmart’s food donation program in partnership with Feeding America, food banks and agencies pick up food that cannot be sold from Walmart stores and clubs in the United States. Since 2005, Walmart has donated 3.3 billion+ pounds of food to people in need. A recent analysis of Walmart’s donation program showed that getting the pickup process right locally is important for an effective program. Specifically, Walmart found that having pick up three or more times a week enables more fresh food donations. While the donation program launched with food banks as the primary partner, over the years the program has expanded to include food banks’ local community partners (such as pantries) in the stores’ pick-up process, which ultimately improved program efficiency.35
EXPANDING FOOD DONATION PARTNERSHIPS LOCALLY

ReFED | Retail Food Waste Action Guide 20
1. REVERSE LOGISTICS FOR RECOVERY
Reverse Logistics for Recovery uses store-to-distribution-center routes to move product available for recovery to centralized pickup locations.
BENEFITS INCLUDE
• Low cost to retailers—trucks have to return to the distribution centers regardless.
• Excess storage capacity is more likely to be found at distribution centers than at stores.
• May extend overall shelf life of food by enabling faster pick-up, although the time until pick-up by a food recovery organization could also be extended.
4. FORGE PARTNERSHIPS WITH TAX DEPARTMENTSPartnerships are critical to get beyond the “right thing to do” approach to donations and open up more investment of capital and labor. Tax departments can help with data collection on donations and ensure that financial benefits of donation are realized—more valuable now in the wake of the PATH Act. Senior-level finance leaders can help get tax departments engaged when relationships within a company are new.
5. BUILD IN-STORE EMPLOYEE ENGAGEMENTRecovery opportunities appeal to employees as individuals and members of their communities. In-store employees can help formulate innovative approaches to identify and recover food for donation.
The need for employee engagement and training is particularly high in Donation Liability Education, which remains at low penetration. Liability concerns are seen as a real barrier to front-line employees engaging in recovery. One way of encouraging employee engagement is through store competitions and by passing a portion of the tax benefits back to stores.
Sprouts gives quarterly awards to stores that have the highest donations (and have hit their shrink-reduction targets).36
INCENTIVIZING EMPLOYEES TO SUPPORT DONATIONS
New Solution
Implementation Effort
Initial Capital Requirement
Medium Low

21
RECYCLING SOLUTIONS
THE CURRENT LANDSCAPERecycling solutions in retail are at relatively low maturity levels, with current recycling rates only at an estimated 10%.38 Recycling rates of food scraps—which are high in water content and costly to transport without corresponding revenue—have lagged behind rates achieved for other materials.39 Once at scale though, recycling haulers are expected to become the predominant waste provider, reducing general trash collection services to once or twice per month.40
The majority of recycling solutions still have low penetration in retail, with the exception of Animal Feed and WWRF with AD:
1. Animal Feed has a higher penetration, but more so with manufacturers, where material being sent to feed is consistent and nutritional value can be understood. Manufacturer food waste tends to be more single product (e.g., a shipment of potato skins), making nutritional content assessment easier. Retailer food waste, in contrast, is a mix of many types of food, making nutritional assessment more difficult and the waste less suitable as animal feed. Retailer food waste also requires store labor for depackaging, which can negatively impact the economics and volume of material diverted for feed.
2. WRRF with AD is also more mature, but requires delivery of waste by truck or through existing sink disposal pipes to a municipal WRRF, where it is treated with anaerobic digestion. Both the labor of sink disposal and the labor and fuel associated with delivery can be expensive for retailers.
KEY INSIGHTS
While lowest on the EPA hierarchy, recycling solutions offer the greatest potential to reduce the volume of food waste nationally. Adoption of the Roadmap’s four retail-applicable recycling solutions—Centralized AD, Centralized Composting, WRRF with AD, and Animal Feed—would divert over 8.6 million tons of food waste from landfill annually. This is almost three times the diversion potential of all retail-applicable prevention and recovery solutions combined.37
In trying to strike a balance between prevention and recovery of unsalable food on the one hand, and offering consumers availability and assortment of products on the other, food waste is difficult to eliminate completely. This is especially true of fresh food that is no longer safe for consumption.
Today, this wasted food ends up in landfills, where it costs retailers millions of dollars per year in hauling and tipping fees. Retailers that shift their mindset from seeing food waste as a cost of business to seeing it as an untapped resource that can be recovered through recycling can create competitive cost advantages.

ReFED | Retail Food Waste Action Guide 22
THE OUTLOOKRecycling feasibility is low, as most recycling solutions require upfront labor to separate and prepare food for recycling, existing local infrastructure, and partnerships to provide hauling, all of which can make the costs of recycling higher than sending food waste to landfill. Recycling solutions, similar to recovery solutions, require a complete ecosystem—haulers, infrastructure, depackaging technology suppliers, etc.—and depend on three pillars to drive successful implementation:
• The risk of penalty or incentives to motivate retailers to separate food scraps from other waste streams.
• Higher profits for haulers for collecting food scraps and taking them to organics recycling facilities versus landfills.
• Infrastructure in place to process the organics.41
Recycling solutions are low value for retailers: when food is thrown away as scraps, its value has dropped by 10 to 50 times to under $100 per ton.42 The five retail-appropriate solutions all have low profit potential and overall economic value. In addition, when investing in their own infrastructure, retailers often need to use cash flows to service infrastructure project finance, but realize relatively slim profit margins from avoided disposal fees and the sale of energy and compost.43
Recycling is also highly regional in nature. The economics of recycling are highly sensitive to the local prices of labor, property, disposal fees, compost values, and energy prices. The Northeast, Northwest, and Midwest offer the most economic value from recycling due to high landfill disposal fees and high compost and energy market prices. For Centralized Composting, the Northeast, Midwest, and Northwest show the most economic promise due to the favorable combination of higher disposal fees and high market prices for compost. The Northeast and Northwest are the most promising regions for Centralized Anaerobic Digestion facilities due to the economics of local electricity, transport, and heating sectors.44

23
BEST PRACTICES1. EMBRACE REGIONALISM
Though it is easier for retailers to establish national-level recycling policies and processes, the economics often vary too much between regions for that to be viable. When investigating local and state variables, consider:
• Infrastructure availability: Only about 500 composting facilities across the country accept food scraps, out of a highly fragmented market of roughly 5,000 facilities. Most of these facilities are just a few acres in size and lack the efficiencies of larger, industrial facilities that are able to purchase mechanized equipment such as turners and depackaging technology. Siting and permitting for new facilities continue to be highly restricted in different areas of the country.45
• Landfill disposal rates: Tipping fees have remained exceptionally low in the U.S. Since tipping fees are usually the largest revenue stream for recycling processing facilities, this has hurt the business case to expand organics recycling infrastructure.46
• Transportation and logistics costs (e.g., hauling): In efficient programs, the incremental vehicle, labor, and fuel costs from recycling generally add a 5% to 10% net increase in collection costs versus landfill-only programs. But when commercial food businesses are spread out, lack of route density and inefficient scheduling of pickups can lead to higher labor and fuel cost per volume collected.47
Retailers need to examine the economics of recycling versus landfilling on a regional basis to take into account differences in input costs and output values. Leading retailers are building databases that hold data on infrastructure availability, landfill tipping and hauling fees, recycling fees, etc. to enable distribution center and store-level analyses.
Retailers should also look for opportunities to improve the regional economics of recycling where they may not currently be favorable. For example, leading retailers are partnering with one another and with waste management companies, investors, and industry collaborations such as ReFED to identify innovations and financing that can create a favorable case for new infrastructure, shared transportation options, etc. There has also been an increase in organics recycling policies at municipal and state levels in 2017 that help support infrastructure development. (For more information, see the ReFED Policy Finder - refed.com/policy.)
2. FOCUS ON RECYCLING OUTPUTSThe value of recycling outputs—namely digestate and energy from AD and compost—varies widely. In some regions, the value of outputs can shift the economics favorably. The cost of energy in the Northeast and Northwest, for example, makes Centralized AD more attractive.48 Centralized AD has also begun to expand as some retailers vertically integrate supply chains for specific products, creating a feedstock and a use for the digestate output. The profit potential of Centralized Composting may rise as new value-added products to mitigate storm water runoff and enhance agricultural production mature.
These solutions present new market and business model opportunities for retailers. The question becomes: Does appropriate valuation of recycling outputs tip the equation in favor of food waste recycling?
3. INVEST IN INNOVATIONSInnovation is critical to advancing the viability and adoption of recycling solutions, although it can be difficult for retailers to pilot emerging technologies.
• For Centralized AD, some retailers are looking at smaller-scale depackaging technologies to enable systems at their facilities.
• For Centralized Composting, advances in compostable packaging are needed to create options that are on par with conventional price and performance, particularly in maintaining fresh food quality.49
Investing in new packaging and depackaging technologies can help overcome material supply assurance (quantity) and contamination (quality) barriers to recycling. Retailers can create a dedicated innovation fund to support pilots of technologies that will, over time, reduce labor costs associated with recycling.
Visit refed.com/policy to learn more about food waste policy.
ReFED RESOURCE
The Kroger Recovery System—an anaerobic digester (AD)—opened at the Ralphs/Food 4 Less Distribution Center in Compton, CA, in 2013. Today, this AD can process nearly 55,000 tons of unsold organics a year, helping Kroger reduce the amount of food waste it sends to landfill. The system also generated more than 1.8 million kilowatt hours of renewable power in 2016, helping meet the energy needs of the 49-acre Ralphs campus. The digestion system also produces a concentration of minerals and nutrients that are turned into an organic fertilizer product.51 Based on the success in Compton, Kroger recently powered up a second AD, an anaerobic wastewater treatment system, at its KB Specialty Foods manufacturing facility in Greensburg, IN. The system will turn food production byproducts into energy and improve air quality in the area.
USING AD TO GENERATE ELECTRICITY AND FERTILIZER

ReFED | Retail Food Waste Action Guide 24
1. REVERSE LOGISTICS FOR RECYCLING
Reverse Logistics for Recycling uses store-to-distribution routes to move unsalable and unsafe-for-consumption food to a centralized location for recycling onsite or pickup for recycling offsite.
BENEFITS INCLUDE
• Low cost to retailers—trucks have to return to the distribution centers regardless.
• Potential for greater storage capacity at distribution centers compared to stores.
• Lowered fees for hauling to recycling facilities as a result of reduced number of pickup locations.
New Solutions
In 2014, Ahold USA’s Stop & Shop New England teamed up with Divert, Inc. to launch an on-site, end-of-life organics waste management system to provide energy to the chain’s Central Distribution center servicing 212 stores. Using Reverse Logistics for Recycling, the Green Energy Facility processes organic waste from 208 retail Stop & Shop northeastern locations and can generate enough energy to power up to 40% of the retail chain’s Distribution Center as well as produce a nutrient-dense compost additive.
KEY LEARNINGS
• Identify green energy partners within your community that will benefit from outputs of a digester, such as compost producers looking for solid digestate to produce high-quality compost.
• Mixing food waste with complementary feedstock, e.g., farm waste or outputs from wastewater treatment facilities, can increase energy output from a digester.
• Partner with your municipal or state government to navigate permits and other potential regulatory roadblocks, as well as to identify rebates and financial incentives.50
USING REVERSE LOGISTICS TO PROVIDE ENERGY TO A RETAIL CHAIN
Implementation Effort
Initial Capital Requirement
Medium Low

25
2. SMALL-SCALE ANAEROBIC DIGESTION (AD)
Small-Scale Anaerobic Digestion (AD) uses new AD technologies that require more limited amounts of biomass feedstock and smaller footprints to create energy and digestate. Deployed most often on farms, this solution could also be used at large stores or distribution centers (depending on feedstock availability) with lower financing requirements and easier installation and startup than Centralized AD. Small-scale AD eliminates the need for transportation, reducing costs and potentially increasing the economic viability of AD.
Implementation Effort
Initial Capital Requirement
High High

ReFED | Retail Food Waste Action Guide 26
SETTING THE STRATEGY AND APPROACHFood waste reduction solutions require significant customization—there is no “one-size-fits-all” fix. Integrating Imperfect Produce into inventory may work for a retailer with customers who seek more affordable prices, but be more challenging for a retailer known for consistently superior quality at higher prices. Retailers with their own fleet of trucks, meanwhile, will find Cold Chain Management easier to implement than those relying on third party logistics (3PL) providers.
Successful implementation of food waste solutions requires a strong base of support in people, processes, and technologies.
STRATEGYFood waste reduction efforts should be based on a defined strategy that outlines goals, activities, and responsibilities backed by senior-level commitment.
• The most successful strategies directly connect action on food waste to corporate and business objectives—reducing costs, building supplier relationships, improving fresh perceptions, etc. Such food waste reduction programs are not perceived as “nice to have,” but as critical to achieving corporate goals, and therefore worth the effort and investment.
• Food waste reduction goals should be quantitative, tied to business metrics such as cost, revenue, or growth, and time-bound. Leading retailers, for example, are setting absolute and net-zero waste goals and reporting externally on their food waste.
• A defined approach to identifying and testing emerging technologies and innovations is important to adopt when so many food waste solutions rely on new and innovative tools. This includes a well-defined pilot process, and, ideally, access to dedicated funding.
GOVERNANCE Governance is critical to food waste reduction efforts that rely on engagement from all parts of an organization, from the C-suite to store employees. In addition to clear leadership and incentives to encourage change, good governance should include:
• A senior-level food waste leader in charge of waste reduction “end-to-end” across the business. This point person should engage business leaders and external stakeholders, e.g., industry collaborations and NGOs, and report to the corporate suite to ensure adequate resourcing and support.
• Structures and practices that facilitate cross-functional collaboration. Departments such as Procurement, Merchandising, Supply Chain, Logistics/Distribution, and Store Operations are all vital to successful implementation of a food waste reduction strategy, but may not have experience collaborating. In some cases, these functions may inadvertently be incentivized to create waste in other parts of the company. Overarching executive support and governance structures can bring these various departments to the table to increase understanding of how waste occurs across the business and resolve conflicts in incentives.
• Mechanisms that reward corporate-level managers and department heads. Many retailers have had success with making reduction part of annual performance goals for business function leaders and store managers and tying bonuses to corporate-level food waste performance.

27
FINANCINGAppropriate funding is instrumental to achieving food waste reduction goals. Investments in solution implementation should be closely tracked to ensure they create value and to help justify continued funding.
In addition to a dedicated fund to invest in piloting new or emerging reduction technologies, retailers can consider funding mechanisms including:
• Financial metrics besides return on investment such as internal rate of return, hurdle rate, and net profit potential.
• Non-financial key performance indicators, e.g., greenhouse gas emissions and water use.
• The use of utility and government rebates and incentives for capital improvement projects.
• Public-private partnerships to gain access to government funds for large infrastructure or other projects.
MEASUREMENT AND COMMUNICATIONSMeasuring food waste may involve significant effort for retailers, yet is crucial for establishing a baseline, setting goals, identifying priority hot-spots, and tracking progress.
• Data collection on food waste across the value chain is key to opening the doors of many solutions and investments. All retailers should consider using the Food Loss and Waste Accounting and Reporting Standard, developed by the Food Loss & Waste Protocol, to ensure consistency and transparency in data collection and reporting.52
• A best practice is to use automated tools linked to IT systems to track food waste metrics and generate performance reports. These tools integrate food waste data with sales data, foot traffic, and other operational data, enabling advanced analytics and real-time tracking of freshness and food waste for supply chain and operational decision making.
• Measurement also enables internal and external communications on food waste reductions.
- Measurement efforts can provide internal location-specific food waste scorecards to compare performance over time and across facilities as a way of spurring employee action. Food waste performance metrics should also be built into supplier scorecards for use in discussions on improvement opportunities.
- Retailers can gain reputational benefits by integrating measurement results into external reporting (e.g., corporate responsibility and sustainability reports, annual reports, and media stories).

ReFED | Retail Food Waste Action Guide 28
STAKEHOLDER EDUCATIONBecause retailers can reduce food waste along the entire value chain, from supplier to consumer, there is an enormous opportunity to multiply impact through stakeholder education.
Employee EducationInspiring and motivating employees, particularly in stores, can make the difference in whether a waste reduction program succeeds or not.
• Employees are often excited to learn about food waste reduction opportunities and efforts, as food insecurity is present in so many communities and is a very relatable issue. Retailers can enable action by integrating well-defined waste management procedures into employee manuals and holding regular training sessions and awareness-raising activities (e.g., an annual Food Waste Week).
• Employees may also be motivated to implement food waste reduction efforts by incentives that reward stores and distribution centers with food waste reduction achievements (e.g., linked to waste tracking) (see above). Retailers can also establish a formal suggestions structure or other mechanisms for staff to give feedback on waste reduction up the management chain.
Customer EngagementBecause of the regular interactions that occur with their customers, retailers are in a unique position to educate and motivate consumers on food waste. Consumer Education Campaigns is one of the top diversion potential and economic value solutions identified in the Roadmap.53
• Retailers can promote waste reduction activities consistently through signage and promotional materials throughout the stores. This approach is often most impactful when done as part of implementing another solution—putting up signs to explain stock outs of fresh product for example, or to explain marked down products, can help build a retailer’s brand for environmental and social responsibility in customer interactions that could otherwise be perceived negatively.
• Employee training on food waste reduction activities can also spur engagement with customers and education about the retailers’ efforts. For example, produce department staff should be trained to engage with customers about “ugly” food offerings, why they look different from other produce, and how they can benefit the customer while helping to reduce waste.
29
THE PATH AHEADThis Guide presents practical solutions for retailers to take action on reducing food waste. Activity on the three fronts of prevention, recovery, and recycling can be achieved by developing a top-down food waste reduction culture that flows from the executive suite to store employees and permeates every department in support of a defined strategy and goals. By delving into new prevention solutions enabled by emerging digital technologies, taking advantage of the PATH Act to improve the economics of recovery, and utilizing new tools and the outputs of recycling, retailers can create competitive cost advantages and build revenues.
There is a major opportunity for the retail industry to lead national food waste reduction initiatives. The Retail Food Waste Action Guide calls upon every retail business in the U.S. to rise to the challenge and take part in turning food waste from a costly burden into a valuable resource.
Together, we can reduce food waste by 20 percent in the next decade For more details and to join ReFED, please contact us at info@refed.

ReFED | Retail Food Waste Action Guide 30

31
CONTRIBUTORS & REVIEWERSWe thank the following individuals for their feedback and contributions through participation in interviews, site visits, and reviews of the Guide.
Christine GallagherAhold Delhaize
George ParmenterAhold Delhaize
John LaugheadAhold Delhaize
Darcie RennAlbertsons Companies LLC
Jonathan MayesAlbertsons Companies LLC
Kate ColerAlbertsons Companies LLC
Carrie CalvertFeeding America
Andy HarigFood Marketing Institute
Rick SteinFood Marketing Institute
Justin EvansGiant Eagle
Shelly SponholzGiant Eagle
Meghan StaszGrocery Manufacturers Association
Denise OsterhuesThe Kroger Company
Sonya FioriniLoblaw Companies Limited
Lisa RobertsPublix Super Markets, Inc.
Michael HewettPublix Super Markets, Inc.
Scott TudorSobeys Inc.
Justin KacerSprouts Farmers Market, Inc.
Lisa LinnellTarget Corporation
Suzanne ForbesWakefern Food Corporation
Anna VinogradovaWalmart Stores, Inc.
Kate WorleyWalmart Stores, Inc.
Jason WadsworthWegmans Food Markets, Inc.
Patti OlenickWeis Markets, Inc.
Kylie SaleWhole Foods Market Inc.

ReFED | Retail Food Waste Action Guide 32
Each solution has been evaluated along six dimensions: profit potential, implementation effort, extent of upfront capital investment required, industry prevalence, diversion potential, and societal economic value.
PROFIT POTENTIALExpected net annual profit, not including the upfront investment costs.
• High: net annual profit >2.5% of total food costs
• Medium: net annual profit of 0.5%-2.5% of total food costs
• Low: net annual profit of <0.5% of total food costs
FEASIBILITYA combination of implementation effort and upfront capital requirement.
Implementation EffortThe extent of procedural updates, staff training, and systems needed to implement a solution.
• High: The change can be made with procedural updates and ongoing training, combined with new systems.
• Medium: The change can be made with procedural updates and initial training, combined with new systems.
• Low: The change can be made with only minor procedural updates and training, but no new systems.
Initial Capital RequirementThe estimated amount of upfront financial capital is needed to implement a solution.
• High: Upfront capital investment >5% of total annual food costs
• Medium: Upfront capital investment is 1%-5% of total annual food costs
• Low: Upfront capital investment <1% of total annual food costs
INDUSTRY PREVALENCEEstimated percentage of the retail industry that has implemented the solution.
• High: Prevalence within industry >50%
• Medium: 25%-50% Prevalence within industry
• Low: Prevalence within industry <25%
DIVERSION POTENTIAL*Portion of all food waste (by weight) that could be diverted from landfill through the implementation of a solution.
• High diversion potential means that the solution, if successfully implemented, could divert over 0.5% of all food waste from landfill.
• Medium diversion potential means that, if successfully implemented, between 0.1% and 0.5% of food waste could be diverted from landfill.
• Low diversion potential means that, if successfully implemented, less than 0.1% of food waste could be diverted from landfill.
SOCIETAL ECONOMIC VALUE*Annual aggregate financial benefit of a solution to society minus all investment and costs.
• High economic value means that the solution, if successfully implemented, could create over $1B of total annual economic value.
• Medium economic value means that the solution, if successfully implemented, could create between $100M and $1B of total annual economic value.
• Low economic value means that the solution, if successfully implemented, could create less than $100M of total annual economic value.
APPENDIX A: Retail Solution Dimensions
*Rankings are based on findings from The Roadmap. Any potential benefits would be considered soci-ety-wide, not just within the scope of the retail sector.

33
APPENDIX B: Retail Solution Matrix Detail
SOLUTIONPROFIT
POTENTIALFEASIBILITY
INDUSTRY PREVALENCE
ROADMAP DATA
DIVERSION POTENTIAL
ECONOMIC VALUE
Consumer Educa-tion Campaigns
Low High Implementation Effort: Low Medium High High
Initial Capital Intensity: Low
Enhanced Demand Forecasting
High Low Implementation Effort: High Low High High
Initial Capital Intensity: High
Standardized Date Labeling
Low High Implementation Effort: Medium Low High High
Initial Capital Intensity: Low
Reduced Handling Low High Implementation Effort: Low Medium Low Low
Initial Capital Intensity: Low
Secondary Resellers
Low High Implementation Effort: Medium Medium Medium Low
Initial Capital Intensity: Low
Spoilage Prevention Packaging
Low High Implementation Effort: Medium Low Low Medium
Initial Capital Intensity: Low
Direct-to-Customer Delivery
Medium Low Implementation Effort: High Medium Medium Medium
Initial Capital Intensity: High
Dynamic Pricing & Markdowns
High Low Implementation Effort: High Low High Medium
Initial Capital Intensity: High
Dynamic Routing High Low Implementation Effort: High Low High Medium
Initial Capital Intensity: High
Produce Specifications
Low High Implementation Effort: Medium Low Medium Medium
Initial Capital Intensity: Low
Cold Chain Management
High Low Implementation Effort: High Medium High Medium
Initial Capital Intensity: High
Improved Inventory Management
High Low Implementation Effort: High Low High High
Initial Capital Intensity: High
Meal Kits Medium Medium Implementation Effort: High Low Medium High
Initial Capital Intensity: Medium
Packaging Adjustments
Low High Implementation Effort: Medium Medium Medium Medium
Initial Capital Intensity: Low

ReFED | Retail Food Waste Action Guide 34
SOLUTIONPROFIT
POTENTIALFEASIBILITY
INDUSTRY PREVALENCE
ROADMAP DATA
DIVERSION POTENTIAL
ECONOMIC VALUE
Reverse Logistics for Recovery
Low Medium Implementation Effort: Medium Low Low Low
Initial Capital Intensity: Low
Donation Liability Education
Low High Implementation Effort: Medium Low Low Medium
Initial Capital Intensity: Low
Donation Matching Software
Low High Implementation Effort: Low Low Medium Medium
Initial Capital Intensity: Low
Donation Storage & Handling
Low Medium Implementation Effort: Medium Low Medium Medium
Initial Capital Intensity: Low
Donation Tax Incentives
Low Medium Implementation Effort: Medium Medium High Medium
Initial Capital Intensity: Low
Donation Transportation
Low Medium Implementation Effort: Medium Low Medium Medium
Initial Capital Intensity: Low
Standardized Donation Regulation
Low High Implementation Effort: Low Low Medium Medium
Initial Capital Intensity: Low
Animal Feed Low High Implementation Effort: Medium Medium Low Low
Initial Capital Intensity: Low
Centralized AD Low Medium Implementation Effort: Medium Low High Low
Initial Capital Intensity: Medium
Centralized Composting
Low Medium Implementation Effort: Medium Low High Low
Initial Capital Intensity: Medium
Reverse Logistics for Recycling
Low Medium Implementation Effort: Medium Low Low Low
Initial Capital Intensity: Low
WWRF with AD Low Medium Implementation Effort: Medium Medium High Low
Initial Capital Intensity: Medium
Small-Scale AD Low Low Implementation Effort: High Low Low Low
Initial Capital Intensity: High

35
RETAIL FOOD WASTE PREVENTION SOLUTIONS
SOLUTION CATEGORY SOLUTION DESCRIPTION
STAKEHOLDERS
INTERNAL EXTERNAL
PACKAGING & PRODUCT
Enhanced Demand Forecasting
Use big data and advanced analytics to improve the sophistication of demand forecasting and buying, specifically by taking into account store sales variability, seasonality of products and sales, and existing inventory on hand, coupled with external demand sensing
Procurement, Store Operations, Merchandising, IT
Suppliers, IT Vendors, Entrepreneurs
Produce Specifications*
Accept and integrate the sale of off-grade produce (short shelf life, different size/ shape/ color), also known as “ugly” produce, for retail sale
Procurement, Food Safety / Quality Assurance, Store Operations, Marketing, Merchandising
Suppliers, Foundations, State & Federal Governments
Meal Kits Provide pre-proportioned fresh ingredients in kits for home meal preparation to reduce over-buying by consumers and food waste in homes
Procurement, Food Safety / Quality Assurance, Store Operations, Marketing, Merchandising
Suppliers
Standardized Date Labeling*
Standardize food label dates and instructions as outlined by the Food Marketing Institute and Grocery Manufacturers Association to reduce consumer confusion
Procurement, Food Safety / Quality Assurance, Legal, Store Operations, Merchandising
Suppliers, Nonprofits
Packaging Adjustments*
Optimize private label food packaging size and design to enable full product use and avoid waste
Procurement, Distribution, Marketing,Store Operations, Food Safety / Quality Assurance, Merchandising
Suppliers,Researchers,Entrepreneurs
Spoilage Prevention Packaging*
Use active intelligent packaging to prolong product freshness and slow spoilage of perishable fruit and meat
Procurement, Distribution, Food Safety / Quality Assurance, Store Operations, Merchandising
Suppliers,Entrepreneurs,Researchers
OPERATIONAL & SUPPLY CHAIN EFFICIENCY
Cold Chain Management*
Reduce product loss during shipment to retail distribution centers by using direct shipments and cold-chain-certified carriers
Procurement, Distribution, Food Safety / Quality Assurance, Transportation & Logistics, Store Operations
Entrepreneurs, Suppliers
Dynamic Routing
Use sensors to collect data on product freshness and nearly expired food so that food with a shorter-than-expected shelf life can be re-routed on the spot to closer distribution centers and stores.
Procurement, Distribution, Food Safety / Quality Assurance, Transportation & LogisticsStore Operations, IT
Entrepreneurs, Suppliers, IT Vendors
Reduced Handling
Change distribution and in-store merchandising practices to reduce the frequency of produce handling and decrease damage. Encourage customers to avoid produce handling through signage, etc.
Distribution, Food Safety / Quality Assurance, Transportation & Logistics, Store Operations
Direct-to-Customer Delivery
Transport food directly from distribution centers or stores to customers to improve product velocity and freshness
Procurement, Distribution, Transportation & Logistics, Store Operations, IT, Marketing
Entrepreneurs, Suppliers, IT Vendors, Transportation Vendors
Improved Inventory Management*
Improve the ability of retail inventory management systems to track an average product’s remaining shelf life and inform efforts to reduce the length of time an item has gone unsold
Procurement, Distribution,Food Safety / Quality Assurance, Store Operations, Merchandising
Entrepreneurs, Suppliers
Dynamic Pricing & Markdowns
Use sensors to gather real-time data about quantity and quality of inventory on hand and incoming orders to enable product price adjustments in stores
Procurement, Store Operations, IT Entrepreneurs, Suppliers, IT Vendors
Secondary Resellers*
Sell excess product to businesses that purchase unwanted processed food and produce direct from manufacturers/distributors for discounted retail sale to consumers
Distribution, Transportation & Logistics, Legal, Store Operations
Nonprofits
CONSUMER EDUCATION
Consumer Education Campaigns*
Participate in large-scale consumer advocacy campaigns to raise awareness of food waste and educate consumers on ways to save money and reduce wasted food
Marketing, Merchandising, Store Operations
Nonprofits, Foundations, Local / state / federal governments
APPENDIX C: Solution Details

ReFED | Retail Food Waste Action Guide 36
RETAIL FOOD SURPLUS RECOVERY SOLUTIONS
SOLUTION CATEGORY SOLUTION DESCRIPTION
STAKEHOLDERS
INTERNAL EXTERNAL
DONATION POLICY
Donation Tax Incentives
Advocate for expansion of federal tax benefits for food donations to all businesses and simplification of donation reporting for tax deductions. Work with finance / tax departments to take advantage of tax incentives
Finance / Tax, Public Affairs / Policy, Legal, Sustainability / Foundation
State & Federal Governments, Foundations, Food Recovery Organizations
Standardized Donation Regulation
Advocate for standardization of local and state health department regulations for safe handling and donation of food through federal policy
Public Affairs / Policy, Legal Federal Government, Food Recovery Organizations, Local & State Health Departments, Foundations
Donation Liability Education
Educate retail store and distribution center employees on donation liability laws
Store Operations, Distribution , Food Safety / Quality Assurance, Legal
Nonprofits, Federal Government
DONATION INFRASTRUCTURE
Donation Matching Software
Use a technology platform to connect retail stores and distribution centers with excess food for donation with recipient organizations to reach smaller-scale food donations
Store Operations, Distribution, Sustainability / Foundation
Entrepreneurs, Food Recovery Organizations
Donation Storage & Handling
Expand temperature-controlled food distribution infrastructure (e.g., refrigeration, warehouses); add labor needed to process and package additional donation volumes
Store Operations, Distribution, Transportation & Logistics, Legal
Suppliers, Food Recovery Organizations, Entrepreneurs, Foundations
Donation Transportation
Provide small-scale transportation infrastructure for local recovery and long-haul transport capabilities
Transportation & Logistics, Legal Food Recovery Organizations, Foundations, Local / state / federal governments
Reverse Logistics for Recovery
Use store-to-distribution center routes to move product available for recovery to centralized pickup locations
Transportation & Logistics, Legal, Sustainability / Foundation
Food Recovery, Organizations, Local / state / federal governments
RETAIL FOOD WASTE RECYCLING SOLUTIONS
SOLUTION CATEGORY SOLUTION DESCRIPTION
STAKEHOLDERS
INTERNAL EXTERNAL
ENERGY & DIGESTATE
Centralized Anaerobic Digestion (AD)*
Transport food waste to a centralized facility where microorganisms transform it into biogas and digestate. Different AD technologies include wet and dry versions, the latter better suited to food waste mixed with yard waste.
Store Operations, Distribution, Waste Management
Local / state / federal governments, Operators, Haulers
Small-Scale Anaerobic Digestions (AD)
Use new AD technologies at large stores or distribution centers that require more limited amounts of biomass feedstock and smaller footprints to create energy and digestate
Store Operations, Distribution, Waste Management, Finance, Legal
Local / state / federal governments
Water Resource Recovery Facility with AD
Deliver food waste by truck or through existing sink disposal pipes to a municipal WRRF, where it is treated with anaerobic digestion; the biosolids can be applied to land for beneficial reuse
Store Operations, Distribution, Waste Management
Haulers, Local governments
AGRICULTURAL PRODUCTS
Centralized Composting
Transport food waste to a centralized facility where it is transformed into compost
Store Operations, Distribution, Waste Management
Local / state / federal governments, Operators, Haulers
Animal Feed* Provide food waste to famers to feed animals after it is heat-treated and dehydrated; either mixed with dry feed or directly fed
Store Operations, Distribution, Waste Management, Legal
Farmers
RECYCLING INFRASTRUCTURE
Reverse Logistics for Recycling
Use store-to-distribution routes to move unsalable and unsafe-for-consumption food to a centralized location for recycling onsite or pickup for recycling offsite
Store Operations, Distribution, Waste Management, Legal
Local / state / federal governments, Haulers

37
REFERENCES
1 “A Roadmap to Reduce U.S. Food Waste by 20 Percent.” ReFED. 2016. Pg. 5-6, 23-25. http://www.refed.com/download.
2 ReFED has adopted the U.S. Department of Agriculture definition of “food waste,” which includes all types of food loss and waste as defined by other leading institutions, and refers to wasted food that happens anywhere along the supply chain.
“A Roadmap to Reduce U.S. Food Waste by 20 Percent.” ReFED. 2016. Pg. 10-12. http://www.refed.com/download.
3 “USDA and EPA Join with Private Sector, Charitable Organizations to Set Nation's First Food Waste Reduction Goals”. U.S. Department of Agriculture. 16 September 2015. https://www.usda.gov/media/press-releases/2015/09/16/usda-and-epa-join-private-sector-charitable-organizations-set.
4 “A Roadmap to Reduce U.S. Food Waste by 20 Percent.” ReFED. 2016. Pg. 5. http://www.refed.com/download.
5 As of September 2017, Ahold Delhaize, Kroger, and Walmart have all set public quantitative goals for food waste to landfill reduction.
6 Consumer Goods Forum’s goal is to halve food waste within the operations of its 400 retailer and manufacturer members by 2025.
“Consumer Goods Industry Commits to Food Waste Reduction”. The Consumer Goods Forum. 2015. http://www.theconsumergoodsforum.com/consumer-goods-industry-commits-to-food-waste-reduction.
7 Champions 12.3 is a global coalition of executives from governments, businesses, international organizations, research institutions, farmer groups, and civil society dedicated to inspiring ambition, mobilizing action, and accelerating progress toward achieving the U.N.’s Sustainable Development Goals Target 12.3 by 2030.
“About.” Champions 12.3. https://champions123.org/about.
8 U.S. Food Loss and Waste 2030 Champions are businesses and organizations that have joined with the U.S. Department of Agriculture and Environmental Protection Agency to make a public commitment to reduce food loss and waste in their own operations in the United States by 50 percent by the year 2030.
“About the U.S. Food Loss and Waste 2030 Champions”. U.S. Environmental Protection Agency. 2017. https://www.epa.gov/sustainable-management-food/united-states-food-loss-and-waste-2030-champions#about.
9 Calculation based on Food Wasted by Weight and Value of Waste from “A Roadmap to Reduce U.S. Food Waste by 20 Percent.” ReFED. 2016. Pg. 13. http://www.refed.com/download.
10 Deloitte Internal Research based on Confidential Retailer Data.
11 IBISWorld Industry Report 44511. Supermarkets & Grocery Stores in the US. January 2017. http://clients1.ibisworld.com/reports/us/industry/default.aspx?entid=1040.
12 Deloitte Internal Research based on Confidential Retailer Data.
13 “Federal Enhanced Tax Deduction for Food Donation: A Legal Guide.” Harvard Food Law and Policy Clinic and University of Arkansas Food Recovery Project. April 2016. https://www.chlpi.org/wp-content/uploads/2013/12/Food-Donation-Fed-Tax-Guide-for-Pub-2.pdf.
14 Savethefood.com. Natural Resources Defense Council and the Ad Council. 2017. https://www.savethefood.com.
15 “Episode 45: Food Waste.” Last Week Tonight with John Oliver. 19 July 2015. http://www.hbo.com/last-week-tonight-with-john-oliver/episodes/02/45-july-19-2015/video/ep-45-clip-food-waste.html?autoplay=true.
“New food labels released to prevent food waste”. CBS Evening News. 18 December 2016. https://www.cbsnews.com/videos/new-food-labels-released-to-prevent-food-waste.
“Never waste food again: What expiration dates really mean”. The Today Show. 11 July 2016. https://www.today.com/series/30-seconds-to-know/never-waste-food-again-what-expiration-dates-really-mean-t100715.
“SCRAPS.” FYI,. http://www.fyi.tv/shows/scraps.
“Wasted! The Story of Food Waste”. Super Ltd. 2017. http://www.wastedfilm.com/.
16 “Food Recovery Hierarchy.” U.S. Environmental Protection Agency. 2017. https://www.epa.gov/sustainable-management-food/food-recovery-hierarchy.
17 “Federal Enhanced Tax Deduction for Food Donation: A Legal Guide.” Harvard Food Law and Policy Clinic and University of Arkansas Food Recovery Project. April 2016. https://www.chlpi.org/wp-content/uploads/2013/12/Food-Donation-Fed-Tax-Guide-for-Pub-2.pdf.
18 “A Roadmap to Reduce U.S. Food Waste by 20 Percent.” ReFED. 2016. Pg. 53. http://www.refed.com/download.
19 “A Roadmap to Reduce U.S. Food Waste by 20 Percent.” ReFED. 2016. Pg.19-29. http://www.refed.com/download.
20 “A Roadmap to Reduce U.S. Food Waste by 20 Percent.” ReFED. 2016. Pg. 28. http://www.refed.com/download.
21 Interview with Denise Osterhues, The Kroger Company. 27 September 2017.
22 “Grocery Industry Launches New Initiative to Reduce Consumer Confusion on Product Date Labels.” Grocery Manufacturers Association. 15 February 2017. http://www.gmaonline.org/news-events/newsroom/grocery-industry-launches-new-initiative-to-reduce-consumer-confusion-on-pr/.
23 “Companies Commit to Simplify Food Date Labels Worldwide by 2020, Reducing Food Waste.” Consumer Goods Forum. 20 September 2017. http://www.theconsumergoodsforum.com/companies-commit-to-simplify-food-date-labels-worldwide-by-2020,-reducing-food-waste.
24 Interview with Anna Vinogradova, Wal-Mart Stores, Inc. 28 September 2017.
25 “A Roadmap to Reduce U.S. Food Waste by 20 Percent.” ReFED. 2016. Pg. 21. http://www.refed.com/download.
26 “A Roadmap to Reduce U.S. Food Waste by 20 Percent.” ReFED. 2016. Pg. 40. http://www.refed.com/download.
27 ReFED. 2016. A Roadmap to Reduce U.S. Food Waste by 20 Percent Technical Appendix. pg. 17.
28 “Analysis of U.S. Food Waste among Food Manufacturers, Retailers, and Restaurants.” A joint project by the Food Marketing Institute, the Grocery Manufacturers Association and the National Restaurant Association. 2016. http://www.foodwastealliance.org/about-our-work/assessment/.
29 “A Roadmap to Reduce U.S. Food Waste by 20 Percent.” ReFED. 2016. Pg. 40. http://www.refed.com/download.

ReFED | Retail Food Waste Action Guide 38
30 “Federal Enhanced Tax Deduction for Food Donation: A Legal Guide.” Harvard Food Law and Policy Clinic and University of Arkansas Food Recovery Project. April 2016. https://www.chlpi.org/wp-content/uploads/2013/12/Food-Donation-Fed-Tax-Guide-for-Pub-2.pdf.
“Charitable contributions of food: A new PATH. A brochure prepared for Feeding America and its nation-wide network of food banks.” Deloitte and Feeding America. 2016. http://www.feedingamerica.org/about-us/how-we-work/securing-meals/deloitte-food-donation.pdf.
31 “A Roadmap to Reduce U.S. Food Waste by 20 Percent.” ReFED. 2016. Pg. 40-41. http://www.refed.com/download.
32 “A Roadmap to Reduce U.S. Food Waste by 20 Percent.” ReFED. 2016. Pg. 43. http://www.refed.com/download.
33 “A Roadmap to Reduce U.S. Food Waste by 20 Percent.” ReFED. 2016. Pg. 45. http://www.refed.com/download.
34 “A Roadmap to Reduce U.S. Food Waste by 20 Percent.” ReFED. 2016. Pg. 41. http://www.refed.com/download.
35 Interview with Anna Vinogradova, Wal-Mart Stores, Inc. 28 September 2017.
36 Interview with Justin Kacer, Sprouts Farmers Market, Inc. 9 August 2017.
37 “A Roadmap to Reduce U.S. Food Waste by 20 Percent.” ReFED. 2016. Pg. 22, 50. http://www.refed.com/download.
38 “A Roadmap to Reduce U.S. Food Waste by 20 Percent.” ReFED. 2016. Pg. 53. http://www.refed.com/download.
39 “A Roadmap to Reduce U.S. Food Waste by 20 Percent.” ReFED. 2016. Pg. 13. http://www.refed.com/download.
40 “A Roadmap to Reduce U.S. Food Waste by 20 Percent.” ReFED. 2016. Pg. 57. http://www.refed.com/download.
41 “A Roadmap to Reduce U.S. Food Waste by 20 Percent.” ReFED. 2016. Pg. 51. http://www.refed.com/download.
42 “A Roadmap to Reduce U.S. Food Waste by 20 Percent.” ReFED. 2016. Pg. 21. http://www.refed.com/download.
43 “A Roadmap to Reduce U.S. Food Waste by 20 Percent.” ReFED. 2016. Pg. 24. http://www.refed.com/download.
44 “A Roadmap to Reduce U.S. Food Waste by 20 Percent.” ReFED. 2016. Pg. 52. http://www.refed.com/download.
45 “A Roadmap to Reduce U.S. Food Waste by 20 Percent.” ReFED. 2016. Pg. 49-56. http://www.refed.com/download.
46 A Roadmap to Reduce U.S. Food Waste by 20 Percent.” ReFED. 2016. Pg. 56. http://www.refed.com/download.
47 “A Roadmap to Reduce U.S. Food Waste by 20 Percent.” ReFED. 2016. Pg. 49-56. http://www.refed.com/download.
48 “A Roadmap to Reduce U.S. Food Waste by 20 Percent.” ReFED. 2016. Pg. 52. http://www.refed.com/download.
49 “A Roadmap to Reduce U.S. Food Waste by 20 Percent.” ReFED. 2016. Pg. 77. http://www.refed.com/download.
50 Interview with Christine Gallagher, Ahold Delhaize. 20 July 2017.
51 Interview with Denise Osterhues, The Kroger Company. 27 September 2017.
52 “Food Loss and Waste Accounting and Reporting Standard”. Food Loss and Waste Protocol. 2017. http://flwprotocol.org/wp-content/uploads/2017/05/FLW_Standard_final_2016.pdf.
53 “A Roadmap to Reduce U.S. Food Waste by 20 Percent.” ReFED. 2016. Pg. 5. http://www.refed.com/download.

39
ReFED RESOURCES
OTHER RESOURCESPREVENTION
A Strategic Guide on Using Data to Drive Food Loss and Waste Reductionsbit.ly/2vRmtUD
EPA Food Waste Cost Calculatorbit.ly/2xhLQ2S
EPA Food Waste and Packaging Tracking Toolbit.ly/2yMudfc
EPA Guide on How to Conduct and Analyze Food Waste Characterizationbit.ly/2iugVgW
Unilever’s “Wise Up on Waste” Appbit.ly/1oUt9NF
Food Loss and Waste Accounting and Reporting Standardflwprotocol.org
RECOVERY
412 Food Rescue412foodrescue.org
Copiagocopia.com
Fact Sheet from the Harvard Food Law and Policy Clinicbit.ly/2yJdQ2o
Feeding Americafeedingamerica.org
Food Donation Connectionfoodtodonate.com
Food Donation Management Practicesbit.ly/2yXzHAe
Food Recovery Networkfoodrecoverynetwork.org
Food Recovery Verifiedfoodrecoverynetwork.org/frv
Information on the Bill Emerson Good Samaritan Food Donation Actbit.ly/2fo7ptj
Iowa Hunger Directoryiowahungersummit.org/en/the_iowa_hunger_directory
Keeping Food Out of the Landfill: Policy Ideas for States and Localitiesbit.ly/2gsU6GB
RECYCLING
BioCycle’s Find a Composterfindacomposter.com
Keeping Food Out of the Landfill: Policy Ideas for States and Localities bit.ly/2gsU6GB
Waste Dive: Solid Waste & Recycling Newswww.wastedive.com
U.S. FOOD WASTE POLICY FINDER INNOVATOR DATABASE
refed.com/policy refed.com/innovators

ReFED | Retail Food Waste Action Guide 40