Embed Size (px)
Citation preview
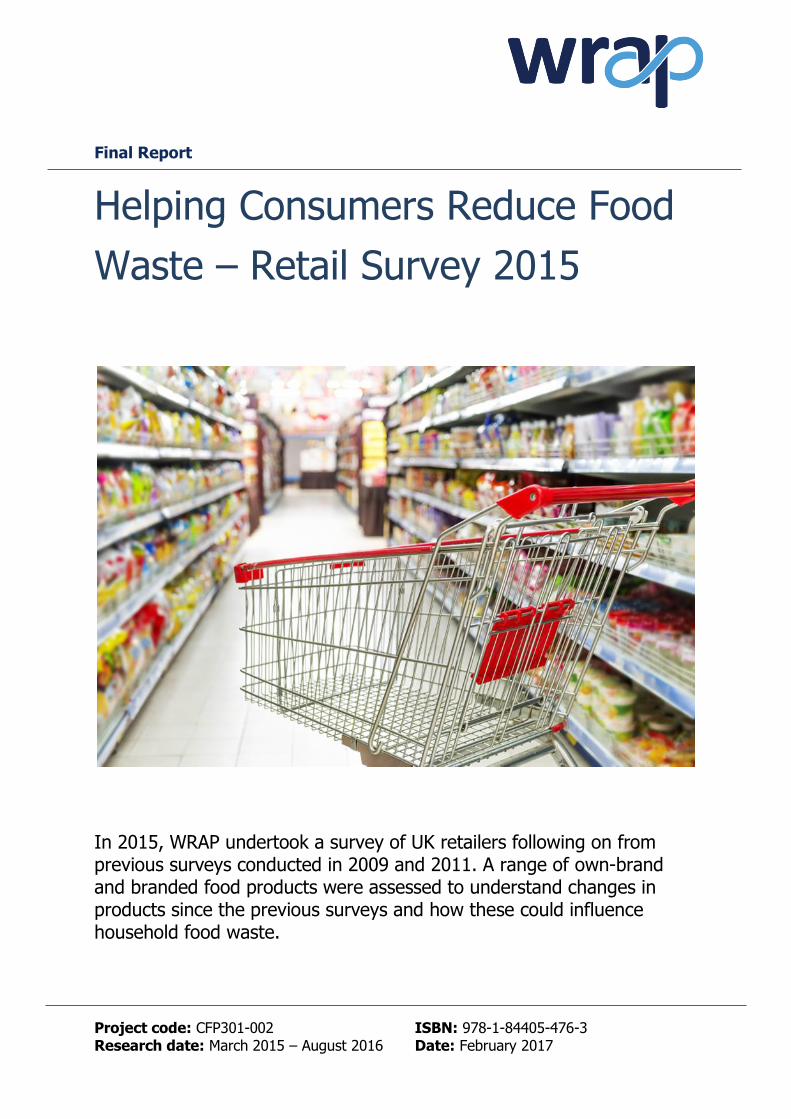
Final Report
Helping Consumers Reduce Food
Waste – Retail Survey 2015
In 2015, WRAP undertook a survey of UK retailers following on from previous surveys conducted in 2009 and 2011. A range of own-brand and branded food products were assessed to understand changes in products since the previous surveys and how these could influence household food waste.
Project code: CFP301-002 ISBN: 978-1-84405-476-3 Research date: March 2015 – August 2016 Date: February 2017
WRAP’s vision is a world in which resources are used sustainably. Our mission is to accelerate the move to a sustainable resource-efficient economy through re-inventing how we design, produce and sell products; re-thinking how we use and consume products; and re-defining what is possible through re-use and recycling.
Find out more at www.wrap.org.uk Document reference: [e.g. WRAP, 2006, Report Name (WRAP Project TYR009-19. Report prepared by…..Banbury, WRAP]
Written by: Marcel Arsand and Andrew Parry (WRAP) Based on research and a technical report authored by: Katherine Page, Nia Owen, Tim Lineham, and Adam Read (Ricardo Energy & Environment)
Front cover photography: Supermarket trolley in empty supermarket aisle
While we have tried to make sure this report is accurate, WRAP does not accept liability for any loss, damage, cost or expense incurred or arising from reliance on this report.
Readers are responsible for assessing the accuracy and conclusions of the content of this report. Quotations and case studies have been drawn from the public domain, with
permissions sought where practicable. This report does not represent endorsement of the examples used and has not been endorsed by the organisations and individuals
featured within it. This material is subject to copyright. You can copy it free of charge and may use excerpts from it provided they are not used in a misleading context and you
must identify the source of the material and acknowledge WRAP’s copyright. You must not use this report or material from it to endorse or suggest WRAP has endorsed a
commercial product or service. For more details please see WRAP’s terms and conditions on our website at www.wrap.org.uk
WRAP – Helping Consumers Reduce Food Waste – Retail Survey 2015 3
Executive summary
Around a fifth of food brought in to UK homes ends up as waste. Of this 7.3 million tonnes, 4.4 million tonnes is defined as avoidable, and has a retail value of £13 billion1. Previous research commissioned by WRAP identified not only how much food is thrown away from UK households but key insights into why this happens2. The reasons why food is wasted at home are many and often interrelated. Aspects of food product labelling, design and functionality combined with consumers understanding of how to make best use of these can be key contributors3. In addition to changes in behaviour reducing food waste, technical changes in food products, packaging and labelling can also lead to less food being wasted, through enabling consumers to buy the most appropriate amounts of food and make greater use of what is bought (for example through having longer to eat the food bought). Around 2 million tonnes of food is thrown away from households due to ‘not being used in time’, and for a third of this, the date guidance on the pack is cited as a factor. Giving consumers longer to make use of the food they buy has the potential to significantly reduce household food waste. This can be influenced for example by the choice of date mark applied (‘Best Before’ rather than ‘Use By’), the length of time between purchase and the date expiring (so called ‘closed life), guidance on how long a product can be consumed once it has been opened (‘open life’) and optimal storage/freezing advice. Although it is challenging to separate out the potential impacts of specific technical changes, it was estimated by WRAP that around 15% of the 1 million tonne reduction in household food waste from 2007 to 2015 was the result of such innovations (preventing around £400 million of food from being wasted). WRAP also estimated the potential further impact of technical changes, as much as possible in isolation from any significant behaviour change. For example changes to storage or freezing guidance alone are likely to have a modest impact limited to those reading and adhering to information on labels, but a much greater impact would be achieved through communication and engagement on the benefits of more optimal storage, supported by changes to labelling. This analysis suggested that around 350,000 tonnes of avoidable food waste (worth around £1 billion a year) could be prevented through technical changes, an 8% reduction in avoidable food waste or a 5% reduction in total food waste, compared to 2015 levels4. Based on an extensive evidence base, and in consultation with the food industry, WRAP has developed a series of recommendations for how changes to products, packaging and labelling can help consumers buy the right amount of food and waste less of what they buy5. This report provides an updated snapshot of relevant aspects of the key products at a particular point in time. The aim of this work was to a) assess the degree of progress since 2011, and b) identify where the focus going forwards should be to ensure maximum implementation of WRAPs recommendations. It seeks to inform WRAP’s work with retailers and manufacturers through the Courtauld Commitment 20256, in order to enable change and widespread adoption of good practice, with the aim of further reducing household food waste.
1 Household Food Waste in the UK, 2015; WRAP 2016 2 See Household Food and Drink Waste Resource Listing 3 Household Food and Drink Waste- A Product Focus 2014; WRAP 2014 4 UK food waste – Historical changes and how amounts might be influenced in the future; WRAP 2014 5 Solutions to prevent household food waste and Concept to Consumer 6 See http://www.wrap.org.uk/category/initiatives/courtauld-commitment for more information.
WRAP - Helping Consumers Reduce Food Waste – Retail Survey 2015 4
In 2009 a retail survey7 was conducted to review approximately 10,000 individual items across 19 product categories. In 2011 data was collected for approximately 12,000 individual items from 20 product categories. The retail survey was repeated in 2015 to assess key changes across the same product categories since the surveys were conducted in 2009 and 2011. Data was collected for approximately 9,000 individual items. A total of 78 stores were surveyed, across England, Wales and Scotland, including 5 online orders. The main areas of interest were changes to date labels, storage guidance, freezing and defrosting guidance and the availability of a range of pack sizes. Key findings
● There has been an almost complete removal of ‘Display Until’ dates used in combination with either ‘Use By’ or ‘Best Before’, but there are a few examples that should be addressed. WRAP will reinforce the importance of not having more than one date on packs, which has been shown to cause consumer confusion and potentially undermine the importance of the important date marks (‘Best Before’ and ‘Use By’).
● There are two good examples (hard cheese and pasteurised fruit juice) of products shifting from a ‘Use By’ to ‘Best Before’ date, but other examples where the opposite has happened (for example yoghurts and some world breads). WRAP worked closely with Dairy UK and the British Soft Drink Association in 2011/12 to develop sector specific guidance relating to the application of date marks, and the changes to how hard cheese and pasteurised fruit juices are now labelled illustrate what can be achieved. Such changes give consumers the confidence and option to make use of products after the ‘Best Before’ date if for whatever reason they are not eaten before the date passes. There are legitimate reasons why some products may change from a ‘Best Before’ date to a ‘Use By’, for example due to changes in ingredients, preservatives or processing and packaging technologies, but this decision should always be made on the basis of food safety, rather than becoming a default position. Further discussions are required with industry to understand the reasons behind the move from ‘Best Before’ to ‘Use By’ on some yoghurts and world breads.
● There is increasing divergence around what date (‘Best Before’ or ‘Display Until’), or no date at all, is applied to pre-packed fresh produce. The current situation is potentially confusing to consumers, with different types of fresh produce in the same store having different dates, or some with a date and some not having one. WRAPs 2011 research suggested that the majority of consumers (>85%) relied on judgement to decide whether or not to eat fresh produce rather than a date, but a significant minority (25%) felt uncomfortable with the idea of buying fresh produce without a date. WRAP currently recommends that a ‘Best Before’ date is applied to fresh produce, to help consumers manage the food they buy. Further research would be beneficial to assess the impact of having a date or not on packs of fresh produce, and as there are already different approaches being deployed in store WRAP will discuss potential research with retailers. WRAP guidance will be updated based on the new evidence obtained through this work.
● There has been good progress on when to provide open life guidance (only where there is a food safety risk) but several examples of the duration of open life being reduced (for example for chilled chicken and cooking sauces, and milk). Such changes will reduce the time available for consumers to make use of the product.
7 Helping consumers reduce food waste – a retail survey; WRAP, 2009.
WRAP - Helping Consumers Reduce Food Waste – Retail Survey 2015 5
● Most products carry some form of storage guidance, and in the majority of cases this is consistent with WRAP recommendations. However attention needs to be paid to bread (where guidance not to store in the fridge is being removed) and potatoes (some inconsistency around advice to store in the fridge). WRAP and FSA have been discussing whether the guidance relating to potatoes could be updated, as currently there is inconsistent guidance given to those working in commercial kitchens and consumers. Once these discussions and any necessary work have been completed guidance to industry can be updated. This is an important area to focus on as 160,000 tonnes of potatoes are thrown away every year due to not being used in time.
● Where guidance is given to keep products refrigerated most is consistent with WRAP/FSA recommendations, but three main alternatives are being used. In some cases (chilled cooking sauces and yoghurts) a significant percentage (10% and 16% respectively) of products have temperature ranges outside of the current guidelines. WRAP will work with FSA to reinforce the value to indicate temperature ranges when giving advice to refrigerate foods, and what this range should be. Having consistent wording on pack, including the temperature range, would support wider awareness raising work needed to encourage consumers to check and if necessary modify their refrigerator temperature.
● Good progress has been made in moving away from ‘Freeze on day of purchase’, but there is much to do, particularly for meat and bakery products. The use of the snowflake logo to indicate suitability for home freezing has reduced, possibly due to pressure on pack space. There is a need to reinforce the value of having this on pack.
● There have been increases in the availability of smaller packs in a number of categories, including bagged salads, pre-packed apples, carrots, potatoes, mayonnaise and cheese. However, the frequency of smaller pack sizes has decreased in a number of other product categories particularly in pre-packed bread and a range of world breads. Smaller loaves of bread are still significantly more expensive on a per kilo basis than larger ones.
Areas of good progress The most significant and positive changes since WRAP started these Retailer Surveys are:
● A simplification of date labelling to move away from almost 40% of packs having two dates (A ‘Display Until’ date used in combination with either ‘Use By’ or ‘Best Before’), which caused consumer confusion and the premature throwing of food, to less than 3%.
● Two high-volume products (hard cheese and pasteurised fruit juice) moving away from predominantly carrying a ‘Use By’ to overwhelmingly carrying ‘Best Before’ dates. This gives consumers more flexibility to consume products after the date, but also illustrates that industry can reassess what date mark products should carry and make significant changes.
● Good progress has been made in moving away from ‘Freeze on day of purchase’, following the publication of new guidance from WRAP/FSA in 2010, particularly in categories such as pre-prepared foods.
WRAP - Helping Consumers Reduce Food Waste – Retail Survey 2015 6
Priorities for action by retailers and manufacturers
The areas where less progress has been made against WRAP recommendations, or even a reversal, and where more action could have a significant impact on household food waste are:
● Reviewing the choice of date mark on products that currently carry a ‘Use By’ date and are wasted in high volumes (for example many yoghurts and fresh milk), to establish whether this is justified from a food safety perspective. If not, moving to a ‘Best Before’ could help reduce food waste at home, and also in the supply chain (for example removing one of the barriers to additional redistribution).
● Reviewing both the ‘closed’ and ‘open’ life set for products that are wasted in large amounts due to not being used in time (for example fresh meat, milk and pre-prepared foods), and assessing the potential to extend the time available for consumers to make use of food at home. WRAP research suggests that there is potential to achieve this without new innovations, although new processes and packaging technologies could deliver additional benefits.
● Reviewing refrigeration guidance - WRAP (and FSA) recommend that ‘keep refrigerated below 5°C’ guidance should be used where temperature information is stated on-pack, and that this statement should be used in full where guidance is given to keep refrigerated.
● Cheese and yoghurts showed the greatest variety in terms of temperature ranges, with six different ones observed in 2015
● Continuing to implement WRAP/FSA Guidance on freezing advice, across all products that can be frozen at home, including maintaining or reinstating use of the snowflake logo.
● Review the availability and relative pricing of smaller packs/split packs for products that are wasted in high volumes and primarily due to not being used in time (bread being a priority).
Priorities for Government, WRAP and the FSA
WRAP will be working with Governments and the FSA to develop updated guidance to industry on the application of date and related (for example storage and freezing) advice on-pack, and this will be published in Autumn 2017. WRAP will also continue working with food manufacturers and retailers to raise awareness of how changes to products, packaging and labelling can help consumers reduce food wasted at home, disseminating the insights from this research and the updated guidance and monitoring progress. New research is required around fresh produce labelling, and potato storage guidance, and WRAP will work with FSA, food businesses and Governments to explore how best to progress this.
WRAP – Helping Consumers Reduce Food Waste – Retail Survey 2015 7
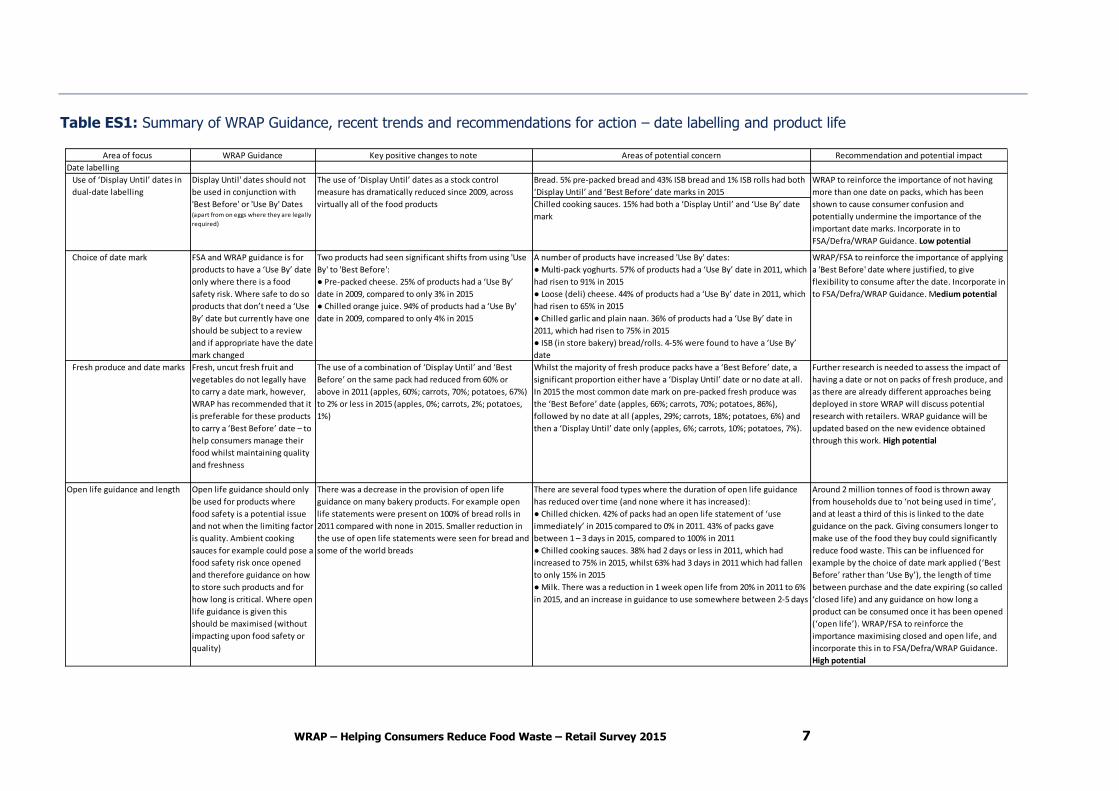
Table ES1: Summary of WRAP Guidance, recent trends and recommendations for action – date labelling and product life
Area of focus WRAP Guidance Key positive changes to note Areas of potential concern Recommendation and potential impact
Date labelling
Bread. 5% pre-packed bread and 43% ISB bread and 1% ISB rolls had both
‘Display Until’ and ‘Best Before’ date marks in 2015
Chilled cooking sauces. 15% had both a ‘Display Until’ and ‘Use By’ date
mark
Choice of date mark FSA and WRAP guidance is for
products to have a ‘Use By’ date
only where there is a food
safety risk. Where safe to do so
products that don’t need a ‘Use
By’ date but currently have one
should be subject to a review
and if appropriate have the date
mark changed
Two products had seen significant shifts from using 'Use
By' to 'Best Before':
● Pre-packed cheese. 25% of products had a ‘Use By’
date in 2009, compared to only 3% in 2015
● Chilled orange juice. 94% of products had a ‘Use By’
date in 2009, compared to only 4% in 2015
A number of products have increased 'Use By' dates:
● Multi-pack yoghurts. 57% of products had a ‘Use By’ date in 2011, which
had risen to 91% in 2015
● Loose (deli) cheese. 44% of products had a ‘Use By’ date in 2011, which
had risen to 65% in 2015
● Chilled garlic and plain naan. 36% of products had a ‘Use By’ date in
2011, which had risen to 75% in 2015
● ISB (in store bakery) bread/rolls. 4-5% were found to have a ‘Use By’
date
WRAP/FSA to reinforce the importance of applying
a 'Best Before' date where justified, to give
flexibility to consume after the date. Incorporate in
to FSA/Defra/WRAP Guidance. Medium potential
Fresh produce and date marks Fresh, uncut fresh fruit and
vegetables do not legally have
to carry a date mark, however,
WRAP has recommended that it
is preferable for these products
to carry a ‘Best Before’ date – to
help consumers manage their
food whilst maintaining quality
and freshness
The use of a combination of ‘Display Until’ and ‘Best
Before’ on the same pack had reduced from 60% or
above in 2011 (apples, 60%; carrots, 70%; potatoes, 67%)
to 2% or less in 2015 (apples, 0%; carrots, 2%; potatoes,
1%)
Whilst the majority of fresh produce packs have a ‘Best Before’ date, a
significant proportion either have a ‘Display Until’ date or no date at all.
In 2015 the most common date mark on pre-packed fresh produce was
the ‘Best Before’ date (apples, 66%; carrots, 70%; potatoes, 86%),
followed by no date at all (apples, 29%; carrots, 18%; potatoes, 6%) and
then a ‘Display Until’ date only (apples, 6%; carrots, 10%; potatoes, 7%).
Further research is needed to assess the impact of
having a date or not on packs of fresh produce, and
as there are already different approaches being
deployed in store WRAP will discuss potential
research with retailers. WRAP guidance will be
updated based on the new evidence obtained
through this work. High potential
Open life guidance and length Open life guidance should only
be used for products where
food safety is a potential issue
and not when the limiting factor
is quality. Ambient cooking
sauces for example could pose a
food safety risk once opened
and therefore guidance on how
to store such products and for
how long is critical. Where open
life guidance is given this
should be maximised (without
impacting upon food safety or
quality)
There was a decrease in the provision of open life
guidance on many bakery products. For example open
life statements were present on 100% of bread rolls in
2011 compared with none in 2015. Smaller reduction in
the use of open life statements were seen for bread and
some of the world breads
There are several food types where the duration of open life guidance
has reduced over time (and none where it has increased):
● Chilled chicken. 42% of packs had an open life statement of ‘use
immediately’ in 2015 compared to 0% in 2011. 43% of packs gave
between 1 – 3 days in 2015, compared to 100% in 2011
● Chilled cooking sauces. 38% had 2 days or less in 2011, which had
increased to 75% in 2015, whilst 63% had 3 days in 2011 which had fallen
to only 15% in 2015
● Milk. There was a reduction in 1 week open life from 20% in 2011 to 6%
in 2015, and an increase in guidance to use somewhere between 2-5 days
Around 2 million tonnes of food is thrown away
from households due to ‘not being used in time’,
and at least a third of this is linked to the date
guidance on the pack. Giving consumers longer to
make use of the food they buy could significantly
reduce food waste. This can be influenced for
example by the choice of date mark applied (‘Best
Before’ rather than ‘Use By’), the length of time
between purchase and the date expiring (so called
‘closed life) and any guidance on how long a
product can be consumed once it has been opened
(‘open life’). WRAP/FSA to reinforce the
importance maximising closed and open life, and
incorporate this in to FSA/Defra/WRAP Guidance.
High potential
Display Until' dates should not
be used in conjunction with
'Best Before' or 'Use By' Dates (apart from on eggs where they are legally
required)
WRAP to reinforce the importance of not having
more than one date on packs, which has been
shown to cause consumer confusion and
potentially undermine the importance of the
important date marks. Incorporate in to
FSA/Defra/WRAP Guidance. Low potential
Use of ‘Display Until’ dates in
dual-date labelling
The use of ‘Display Until’ dates as a stock control
measure has dramatically reduced since 2009, across
virtually all of the food products
WRAP - Helping Consumers Reduce Food Waste – Retail Survey 2015 8
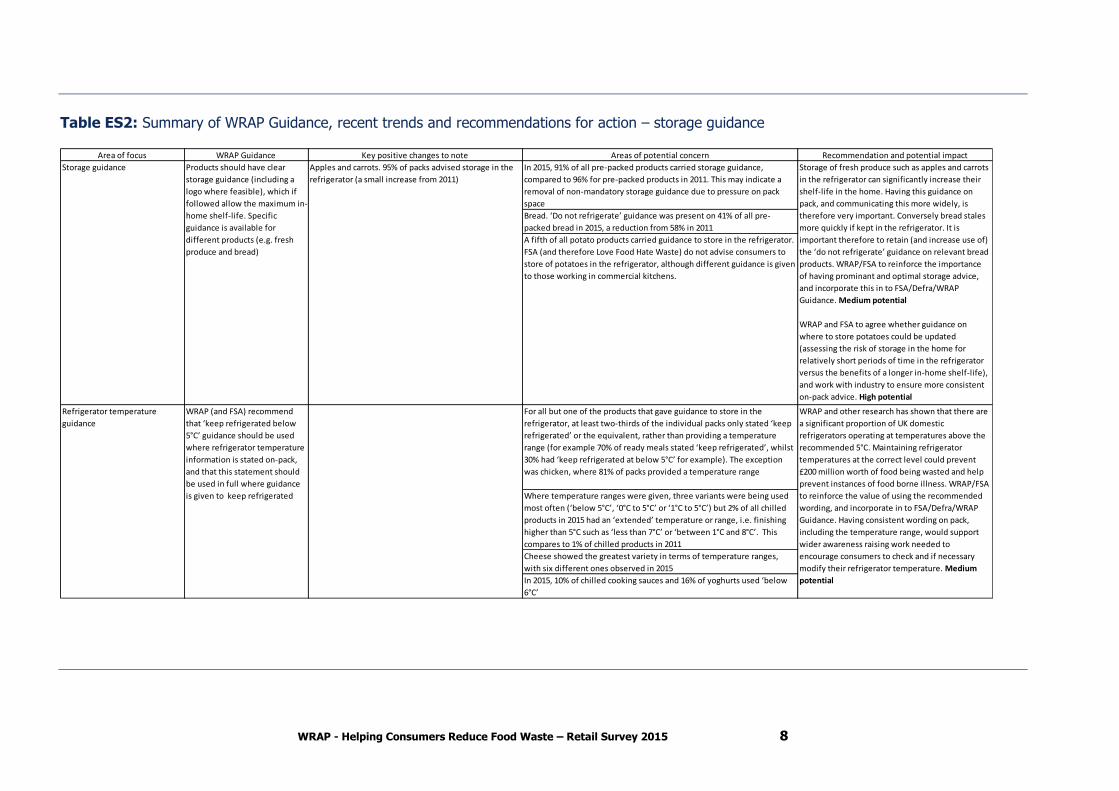
Table ES2: Summary of WRAP Guidance, recent trends and recommendations for action – storage guidance
Area of focus WRAP Guidance Key positive changes to note Areas of potential concern Recommendation and potential impact
In 2015, 91% of all pre-packed products carried storage guidance,
compared to 96% for pre-packed products in 2011. This may indicate a
removal of non-mandatory storage guidance due to pressure on pack
space
Bread. ‘Do not refrigerate’ guidance was present on 41% of all pre-
packed bread in 2015, a reduction from 58% in 2011
A fifth of all potato products carried guidance to store in the refrigerator.
FSA (and therefore Love Food Hate Waste) do not advise consumers to
store of potatoes in the refrigerator, although different guidance is given
to those working in commercial kitchens.
For all but one of the products that gave guidance to store in the
refrigerator, at least two-thirds of the individual packs only stated ‘keep
refrigerated’ or the equivalent, rather than providing a temperature
range (for example 70% of ready meals stated ‘keep refrigerated’, whilst
30% had ‘keep refrigerated at below 5°C’ for example). The exception
was chicken, where 81% of packs provided a temperature range
Where temperature ranges were given, three variants were being used
most often (‘below 5°C’, ‘0°C to 5°C’ or ‘1°C to 5°C’) but 2% of all chilled
products in 2015 had an ‘extended’ temperature or range, i.e. finishing
higher than 5°C such as ‘less than 7°C’ or ‘between 1°C and 8°C’. This
compares to 1% of chilled products in 2011
Cheese showed the greatest variety in terms of temperature ranges,
with six different ones observed in 2015
In 2015, 10% of chilled cooking sauces and 16% of yoghurts used ‘below
6°C’
Products should have clear
storage guidance (including a
logo where feasible), which if
followed allow the maximum in-
home shelf-life. Specific
guidance is available for
different products (e.g. fresh
produce and bread)
Storage guidance Apples and carrots. 95% of packs advised storage in the
refrigerator (a small increase from 2011)
Storage of fresh produce such as apples and carrots
in the refrigerator can significantly increase their
shelf-life in the home. Having this guidance on
pack, and communicating this more widely, is
therefore very important. Conversely bread stales
more quickly if kept in the refrigerator. It is
important therefore to retain (and increase use of)
the ‘do not refrigerate’ guidance on relevant bread
products. WRAP/FSA to reinforce the importance
of having prominant and optimal storage advice,
and incorporate this in to FSA/Defra/WRAP
Guidance. Medium potential
WRAP and FSA to agree whether guidance on
where to store potatoes could be updated
(assessing the risk of storage in the home for
relatively short periods of time in the refrigerator
versus the benefits of a longer in-home shelf-life),
and work with industry to ensure more consistent
on-pack advice. High potential
WRAP and other research has shown that there are
a significant proportion of UK domestic
refrigerators operating at temperatures above the
recommended 5°C. Maintaining refrigerator
temperatures at the correct level could prevent
£200 million worth of food being wasted and help
prevent instances of food borne illness. WRAP/FSA
to reinforce the value of using the recommended
wording, and incorporate in to FSA/Defra/WRAP
Guidance. Having consistent wording on pack,
including the temperature range, would support
wider awareness raising work needed to
encourage consumers to check and if necessary
modify their refrigerator temperature. Medium
potential
Refrigerator temperature
guidance
WRAP (and FSA) recommend
that ‘keep refrigerated below
5°C’ guidance should be used
where refrigerator temperature
information is stated on-pack,
and that this statement should
be used in full where guidance
is given to keep refrigerated
WRAP - Helping Consumers Reduce Food Waste – Retail Survey 2015 9
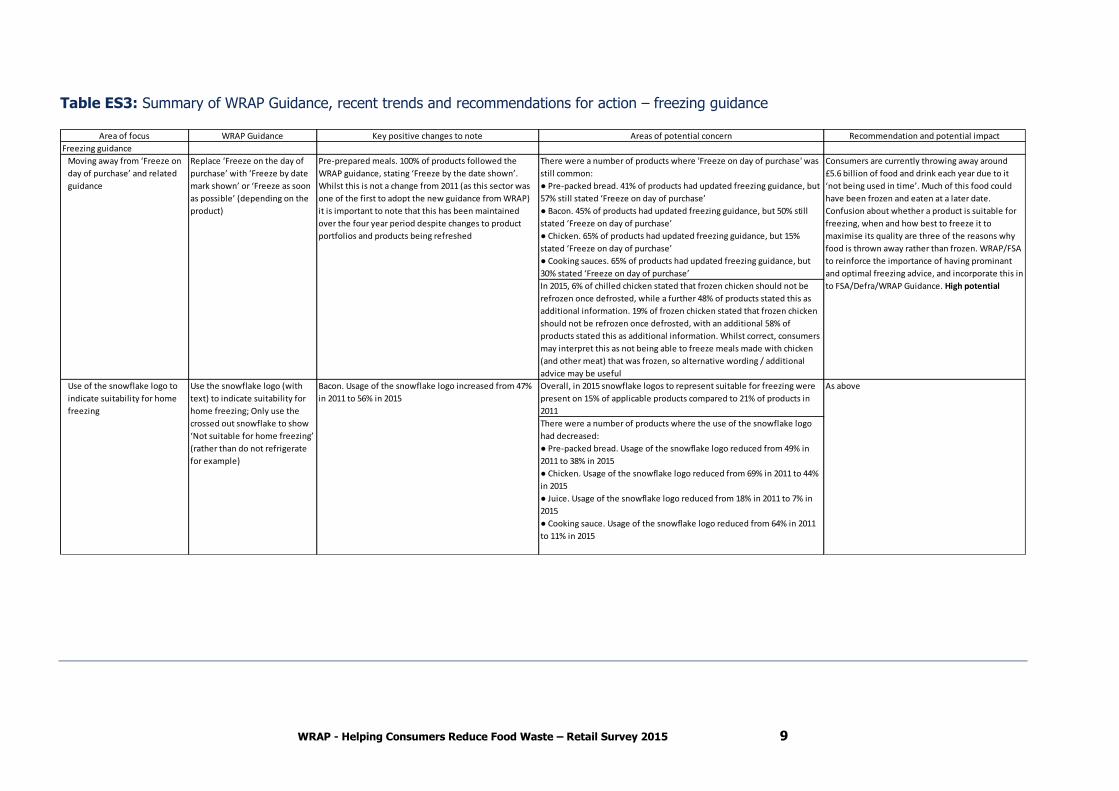
Table ES3: Summary of WRAP Guidance, recent trends and recommendations for action – freezing guidance
Area of focus WRAP Guidance Key positive changes to note Areas of potential concern Recommendation and potential impact
Freezing guidance
There were a number of products where 'Freeze on day of purchase' was
still common:
● Pre-packed bread. 41% of products had updated freezing guidance, but
57% still stated ‘Freeze on day of purchase’
● Bacon. 45% of products had updated freezing guidance, but 50% still
stated ‘Freeze on day of purchase’
● Chicken. 65% of products had updated freezing guidance, but 15%
stated ‘Freeze on day of purchase’
● Cooking sauces. 65% of products had updated freezing guidance, but
30% stated ‘Freeze on day of purchase’
In 2015, 6% of chilled chicken stated that frozen chicken should not be
refrozen once defrosted, while a further 48% of products stated this as
additional information. 19% of frozen chicken stated that frozen chicken
should not be refrozen once defrosted, with an additional 58% of
products stated this as additional information. Whilst correct, consumers
may interpret this as not being able to freeze meals made with chicken
(and other meat) that was frozen, so alternative wording / additional
advice may be useful
Overall, in 2015 snowflake logos to represent suitable for freezing were
present on 15% of applicable products compared to 21% of products in
2011
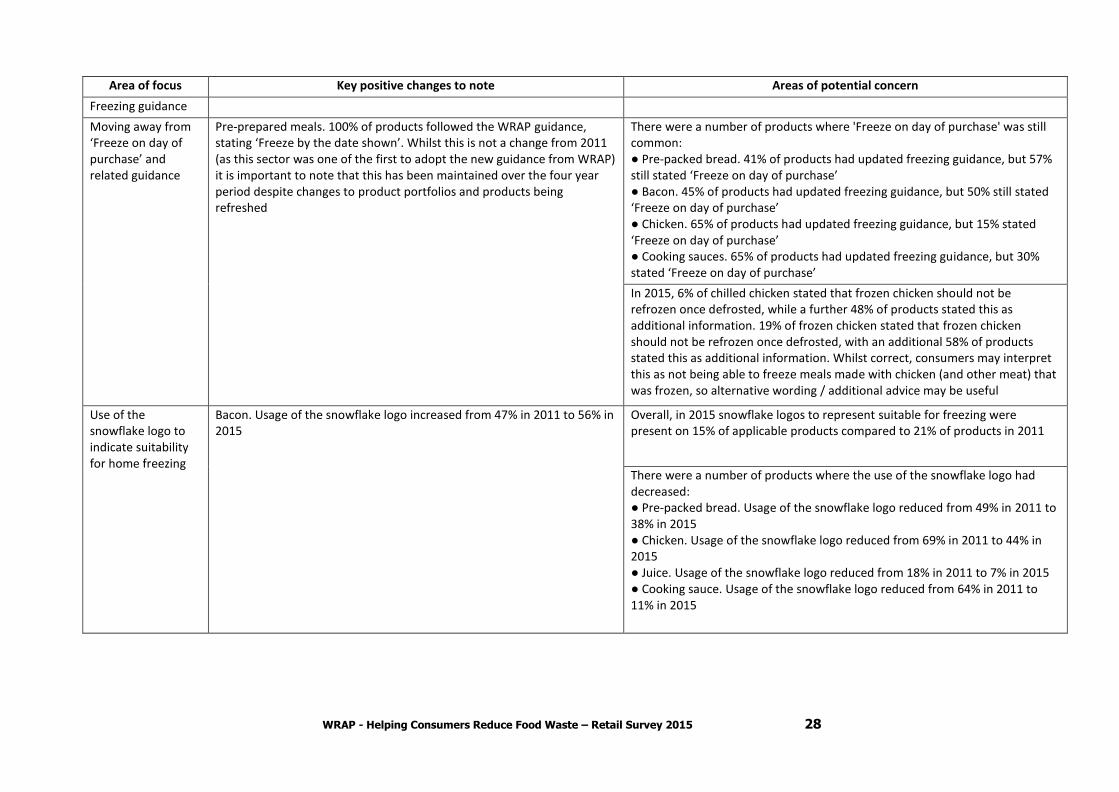
There were a number of products where the use of the snowflake logo
had decreased:
● Pre-packed bread. Usage of the snowflake logo reduced from 49% in
2011 to 38% in 2015
● Chicken. Usage of the snowflake logo reduced from 69% in 2011 to 44%
in 2015
● Juice. Usage of the snowflake logo reduced from 18% in 2011 to 7% in
2015
● Cooking sauce. Usage of the snowflake logo reduced from 64% in 2011
to 11% in 2015
Replace ‘Freeze on the day of
purchase’ with ‘Freeze by date
mark shown’ or ‘Freeze as soon
as possible’ (depending on the
product)
Use the snowflake logo (with
text) to indicate suitability for
home freezing; Only use the
crossed out snowflake to show
‘Not suitable for home freezing’
(rather than do not refrigerate
for example)
Moving away from ‘Freeze on
day of purchase’ and related
guidance
Pre-prepared meals. 100% of products followed the
WRAP guidance, stating ‘Freeze by the date shown’.
Whilst this is not a change from 2011 (as this sector was
one of the first to adopt the new guidance from WRAP)
it is important to note that this has been maintained
over the four year period despite changes to product
portfolios and products being refreshed
Use of the snowflake logo to
indicate suitability for home
freezing
Bacon. Usage of the snowflake logo increased from 47%
in 2011 to 56% in 2015
Consumers are currently throwing away around
£5.6 billion of food and drink each year due to it
‘not being used in time’. Much of this food could
have been frozen and eaten at a later date.
Confusion about whether a product is suitable for
freezing, when and how best to freeze it to
maximise its quality are three of the reasons why
food is thrown away rather than frozen. WRAP/FSA
to reinforce the importance of having prominant
and optimal freezing advice, and incorporate this in
to FSA/Defra/WRAP Guidance. High potential
As above
WRAP - Helping Consumers Reduce Food Waste – Retail Survey 2015 10
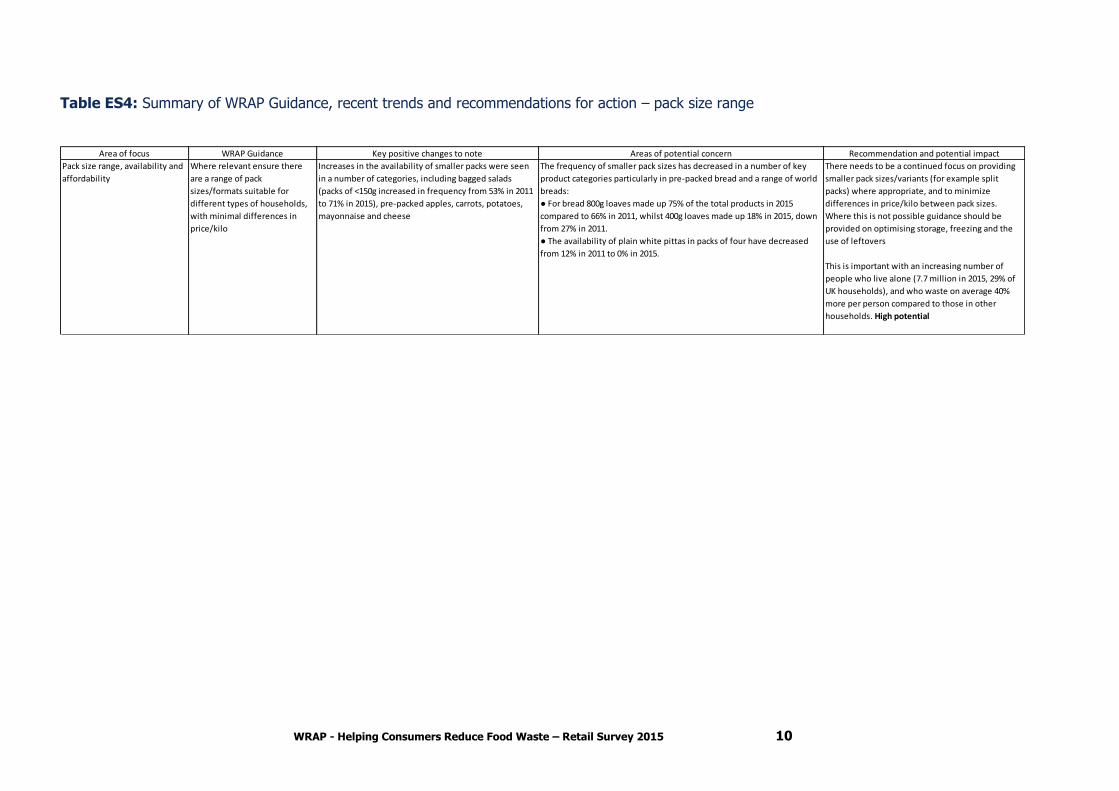
Table ES4: Summary of WRAP Guidance, recent trends and recommendations for action – pack size range
Area of focus WRAP Guidance Key positive changes to note Areas of potential concern Recommendation and potential impact
Pack size range, availability and
affordability
Where relevant ensure there
are a range of pack
sizes/formats suitable for
different types of households,
with minimal differences in
price/kilo
Increases in the availability of smaller packs were seen
in a number of categories, including bagged salads
(packs of <150g increased in frequency from 53% in 2011
to 71% in 2015), pre-packed apples, carrots, potatoes,
mayonnaise and cheese
The frequency of smaller pack sizes has decreased in a number of key
product categories particularly in pre-packed bread and a range of world
breads:
● For bread 800g loaves made up 75% of the total products in 2015
compared to 66% in 2011, whilst 400g loaves made up 18% in 2015, down
from 27% in 2011.
● The availability of plain white pittas in packs of four have decreased
from 12% in 2011 to 0% in 2015.
There needs to be a continued focus on providing
smaller pack sizes/variants (for example split
packs) where appropriate, and to minimize
differences in price/kilo between pack sizes.
Where this is not possible guidance should be
provided on optimising storage, freezing and the
use of leftovers
This is important with an increasing number of
people who live alone (7.7 million in 2015, 29% of
UK households), and who waste on average 40%
more per person compared to those in other
households. High potential
WRAP – Helping Consumers Reduce Food Waste – Retail Survey 2015 11
Contents
1.0 Introduction ............................................................................................... 13 2.0 Methodology ............................................................................................... 15 3.0 Results and discussion ............................................................................... 17
3.1 Date labelling........................................................................................... 17 3.1.1 Use of ‘Display Until’ dates .............................................................. 17 3.1.2 Choice of date mark ....................................................................... 17 3.1.3 Fresh produce and date marks ........................................................ 18 3.1.4 Reinforcing the meaning of ‘Use By’ dates ........................................ 19
3.2 Open life guidance and length ................................................................... 19 4.0 Storage guidance ........................................................................................ 20
4.1 Storage guidance for potatoes................................................................... 20 4.2 Refrigerator temperature guidance ............................................................ 21
5.0 Freezing guidance ...................................................................................... 22 5.1 Moving away from ‘Freeze on day of purchase’ and related guidance............ 22 5.2 Use of the snowflake logo to indicate suitability for home freezing ............... 23
6.0 Pack size range ........................................................................................... 23 7.0 Summary and conclusions .......................................................................... 24 Appendix 1: Detailed methodology ...................................................................... 30 Appendix 2: Product categories ........................................................................... 34
WRAP - Helping Consumers Reduce Food Waste – Retail Survey 2015 12
Glossary
● Best before – Appropriate for the vast majority of foods and indicates the period for
which a food can reasonably be expected to retain its optimal condition (e.g. taste,
texture, aroma, appearance). Refers to the quality of food rather than its safety. A food
which is past its ‘Best Before’ date should be safe to eat, but may not be at its best
quality after this date.
● Deli – Products available loose on food service counters. Customers can commonly
choose how much they would like to buy based on weight, volume or price.
● Display Until – A date mark used by shop staff to help with stock control and ensure
product is not available to shoppers beyond that date. May be used in conjunction with a
‘Best Before’ or ‘Use By’ date which are for shoppers/consumers.
● Fascia – The type of store. e.g. supermarket, convenience/local store, online, click and
collect.
● ISB – In-store bakery. Products baked in-store and either packaged in store or sold
loose.
● Open-life – The number of days given to the consumer to consume the product once it
has been opened, as according to the instructions (e.g. use within ‘X’ days).
● Product categories – Description of each product type reviewed within this research.
● Product variant – Another parameter of the product. For example, white long grain
rice, a variance would be boil in the bag or microwave.
● Snowflake logo – Used to show consumers the product is suitable for freezing.
● Use By – Is the required form of date mark for those foods which are highly perishable
from a microbiological point of view and which are in consequence likely after a relatively
short period to present a risk of food poisoning, and so relates to the safety of the food.
Acknowledgements
The authors would like to thank the staff at the major UK retailers who helped and supported the in-store surveys, and Liz Stretton at the Food Standards Agency for commenting on this report.
WRAP - Helping Consumers Reduce Food Waste – Retail Survey 2015 13
1.0 Introduction Ricardo Energy & Environment was commissioned by WRAP to conduct the 2015 Retailer Survey. This survey follows on from retail surveys commissioned by WRAP in 2009 and 2011. This report presents the key findings and recommendations from the 2015 retail survey that aimed to assess key trends and changes in packaging since the surveys in 2009 and 2011. Around a fifth of food brought in to UK homes ends up as waste. Of this 7.3 million tonnes, 4.4 million tonnes is defined as avoidable, and has a retail value of £13 billion8. Previous research commissioned by WRAP has identified not only how much food is thrown away but key insights into why this happens9. The reasons why food is wasted at home are many and often interrelated. Aspects of food product labelling, design and functionality combined with consumers understanding of how to make best use of these can be key contributors10. In addition to changes in behaviour reducing food waste, changes in food products, packaging and labelling can also lead to less food being wasted, through enabling consumers to buy the most appropriate amounts of food and make greater use of what is bought (for example through having longer to eat the food bought). Around 2 million tonnes of food is thrown away from households due to ‘not being used in time’, and for a third of this, the date guidance on the pack is cited as a factor. Giving consumers longer to make use of the food they buy has the potential to significantly reduce household food waste. This can be influenced for example by the choice of date mark applied (‘Best Before’ rather than ‘Use By’), the length of time between purchase and the date expiring (so called ‘closed life), any guidance on how long a product can be consumed once it has been opened (‘open life’) and optimal storage/freezing advice. Although it is challenging to separate out the potential impacts of specific technical changes, it was estimated by WRAP that around 15% of the 1 million tonne reduction in household food waste from 2007 to 2015 was the result of such innovations (preventing around £400 million of food from being wasted). WRAP also estimated the potential further impact of technical changes, as much as possible in isolation from any significant behaviour change. For example changes to storage or freezing guidance alone are likely to have a modest impact limited to those reading and adhering to information on labels, but a much greater impact would be achieved through communication and engagement on the benefits of more optimal storage, supported by changes to labelling. This analysis suggested that around 350,000 tonnes of avoidable food waste (worth around £1 billion a year) could be prevented through technical changes, an 8% reduction in avoidable food waste or a 5% reduction in total food waste, compared to 2015 levels11. Based on an extensive evidence base, and in consultation with the food industry, WRAP has developed a series of recommendations for how changes to products, packaging and labelling can help consumers buy the right amount of food and waste less of what they buy12. WRAP and the grocery sector recognise this, and this report aims to provide an updated snapshot of relevant aspects of the key products at a particular point in time. The aim of this work was to a) assess the degree of progress since 2011, and b) identify where the focus going forwards should be to ensure maximum implementation of WRAPs recommendations. It seeks to inform WRAP’s work with retailers and manufacturers through the Courtauld Commitment 202513, in order to enable change and widespread adoption of good practice, with the aim of further reducing household food waste.
8 Household Food Waste in the UK, 2015; WRAP 2016 9See Household Food and Drink Waste Resource Listing 10 Household Food and Drink Waste- A product focus 2014; WRAP 2014 11 UK food waste – Historical changes and how amounts might be influenced in the future; WRAP 2014 12 Solutions to prevent household food waste, and Concept to Consumer 13 See: http://www.wrap.org.uk/category/initiatives/courtauld-commitment for more information.
WRAP - Helping Consumers Reduce Food Waste – Retail Survey 2015 14
In 2009 a retail survey14 was conducted to review approximately 10,000 individual items across 19 product categories. The aim was to identify good practices that could be adopted across the industry in relation to pack labels, size and functionality. The study also aimed to identify areas of inconsistency or lack of clarity in packaging and labelling information that could be addressed to improve households understanding and confidence in relation to the purchase and use of food, thereby reducing household food waste. One of the recommendations from the 2009 research was to repeat the survey to assess changes in the sector against the best practice identified by WRAP. In 2011 the labelling and packaging of key products in the UK retail sector was reviewed, and this study further assesses the changes in 2015. Data was collected for approximately 12,000 individual items from 20 product categories. After taking sub-categories and pack sizes in to account, this represented circa 2,600 unique products. The survey would help to understand the changes in labels and packaging of products that were present on the shelf in 2009 and also those that had been launched subsequent to that. The retail survey was repeated in 2015 to assess key trends and changes in packaging across the same product categories since the surveys were conducted in 2009 and 2011. Data was collected for approximately 9,000 individual items from 20 product categories. The main areas of interest were changes to date labels, storage guidance, freezing and defrosting guidance and the availability of a range of pack sizes for key products.
14 Helping consumers reduce food waste – a retail survey; WRAP, 2009.
WRAP - Helping Consumers Reduce Food Waste – Retail Survey 2015 15
2.0 Methodology This section provides a summary of the approach used for the Retailer Survey 2015. See Appendix 1 for a more detailed methodology. Store visit programme Data capture relied primary on individual store visits. The number of stores visited was broadly in line with retailer market share. Market information was used to identify a number of stores that covered the range of store formats or fascias15, as well as providing UK geographic coverage. Nine retailers participated in the 2015 survey: Aldi, Asda, Lidl, Morrisons, M&S, Sainsbury’s, The Co-Operative, Tesco and Waitrose. A total of 78 stores were surveyed across England, Wales and Scotland, including 5 online orders.
Data capture Ricardo Energy & Environment worked with WRAP and the retailer partners to arrange site visits across all nine retailers’ store formats and fascias. During the store visits, visual inspection was made of information and labelling on the primary and secondary packaging of food products within the scope of the project. The products surveyed are those that are commonly wasted in the home, based on research conducted by WRAP16. A detailed breakdown by product sub-category is provided in Appendix 1, but the food types these represent are listed below:
● Apples
● Bacon
● Bread rolls
● Bread
● Carrots
● Cheese
● Chicken
● Chilled juice
● Cooking sauce
● Eggs
● Ham
● Mayonnaise
● Milk
● Dried pasta
● Potatoes
● Ready meals
● Rice
● Salad
● World breads
● Yoghurt
The number of individual products surveyed varied, from approximately 10,000 in 2009, 12,000 in 2011 and 9,000 in 2015. The variation in the number of products surveyed within the product categories is due to changes in the particular product markets or small modifications within the product specification between the surveys.
15 Shop format or fascia is related to size and format of a supermarket store, for example a smaller local store selling a smaller range of products compared to superstores that will be large, have a wide range of products as well as other departments such as homeware, clothing and electrical items. 16 Solutions to prevent household food waste, and Concept to Consumer
WRAP - Helping Consumers Reduce Food Waste – Retail Survey 2015 16
Data analysis Primary data analysis involves importing raw data into Excel and then analysing using Excel’s inbuilt functionality including tools such as Pivot tables to produce the required outputs. The analysis focused primarily on replicating the same type of information presented previously in the 2011 survey report but updated to reflect the position in 2015. One of the primary outputs from the survey is a robust data capture system to incorporate the results from the 2009, 2011 and the 2015 surveys including all the photographic images of the product labelling. This is searchable to enable data to be accessed by individual food product or by retailer.
WRAP - Helping Consumers Reduce Food Waste – Retail Survey 2015 17
3.0 Results and discussion 3.1 Date labelling WRAP recommends that best practice to reduce food waste at home is to17:
● Remove ‘Display Until’ dates (where they are being used as a stock control date alongside either a ‘Best Before’ or ‘Use By’ date)18;
● Ensure the appropriate type of date mark is applied, i.e. ‘Use By’ or ‘Best Before’; and
● If a ‘Use By’ date is used, labels should reinforce its importance, e.g. ‘Do not exceed the Use By date’.
3.1.1 Use of ‘Display Until’ dates In 2015, only 8% of all products had a ‘Display Until’ date (in combination with another date mark), compared to 35% of products 2011 and 39% in 2009. If eggs are excluded from the 2015 analysis, as they are legally required to carry a ‘Display Until’ date, then only 3% of products had a ‘Display Until’ date in 2015. Key positive changes to note:
● The use of ‘Display Until’ dates as a stock control measure has dramatically reduced since 2009, across virtually all of the food products
Areas of potential concern:
● Bread. 5% pre-packed bread and 43% ISB bread and 1% ISB rolls had both ‘Display Until’ and ‘Best Before’ date marks in 2015
● Chilled cooking sauces. 15% had both a ‘Display Until’ and ‘Use By’ date mark
In both of the above cases there had been a reduction in the use of ‘Display Until’ dates from 2011 to 2015 but WRAP will reinforce the importance of not having more than one date on packs, which has been shown to cause consumer confusion and potentially undermine the importance of the important date marks (‘Best Before’ and ‘Use By’)19. 3.1.2 Choice of date mark In 2015, overall, 54% of products had a ‘Best Before’ date, 36% had a ‘Use By’ date, with the remaining 10% having no date mark or an alternative (such as ‘Display Until’ only). The Food Standards Agency (FSA) and WRAP guidance is for products to have a ‘Use By’ date only where there is a food safety risk20. Where safe to do so products that don’t need a ‘Use By’ date but currently have one should be subject to a review and if appropriate have the date mark changed.
17 How to apply date labels to help prevent food waste; WRAP 2012 18 Where legally permissible to do so, i.e. there are a small number of products where a ‘Display Until’ date is required, such as on eggs 19 See Consumer insight: date labels and storage guidance; WRAP 2011 20 Guidance on the application of date labels to food; Defra 2011
WRAP - Helping Consumers Reduce Food Waste – Retail Survey 2015 18
Key positive changes to note:
● Pre-packed cheese. 25% of products had a ‘Use By’ date in 2009, compared to only 3% in 2015
● Chilled orange juice. 94% of products had a ‘Use By’ date in 2009, compared to only 4% in 2015
Areas of potential concern:
● Multi-pack yoghurts. 57% of products had a ‘Use By’ date in 2011, which had risen to 91% in 2015
● Loose (deli) cheese. 44% of products had a ‘Use By’ date in 2011, which had risen to 65% in 2015
● Chilled garlic and plain naan. 36% of products had a ‘Use By’ date in 2011, which had risen to 75% in 2015
● ISB (in store bakery) bread/rolls. 4-5% were found to have a ‘Use By’ date
There are legitimate reasons why some products may change from a ‘Best Before’ date to a ‘Use By’, for example due to changes in ingredients, preservatives or processing and packaging technologies, but this decision should always be made on the basis of food safety, rather than becoming a default position. WRAP worked closely with Dairy UK and the British Soft Drink Association in 2011/12 to develop sector specific guidance relating to the application of date marks, and the changes to how hard cheese and pasteurised fruit juices are now labelled illustrate what can be achieved. Such changes give consumers the confidence and option to make use of products after the ‘Best Before’ date if for whatever reason they are not eaten before the date passes. 3.1.3 Fresh produce and date marks Fresh, uncut fresh fruit and vegetables do not legally have to carry a date mark as they are included in a list of specific exemptions to the labelling regulations. However, WRAP has recommended that based on currently available research it would be preferable for pre-packed uncut fresh produce to carry a ‘Best Before’ date – to help consumers manage the food they have whilst maintaining quality and freshness. In 2015 the most common date mark on pre-packed fresh produce was the ‘Best Before’ date (apples, 66%; carrots, 70%; potatoes, 86%), followed by no date at all (apples, 29%; carrots, 18%; potatoes, 6%) and then a ‘Display Until’ date only (apples, 6%; carrots, 10%; potatoes, 7%). Key positive changes to note:
● The use of a combination of ‘Display Until’ and ‘Best Before’ on the same pack had reduced from 60% or above in 2011 (apples, 60%; carrots, 70%; potatoes, 67%) to 2% or less in 2015 (apples, 0%; carrots, 2%; potatoes, 1%).
Areas of potential concern:
● Whilst the majority of fresh produce packs have a ‘Best Before’ date, a significant proportion either have a ‘Display Until’ date or no date at all.
WRAP - Helping Consumers Reduce Food Waste – Retail Survey 2015 19
The current situation is potentially confusing to consumers, with different types of fresh produce in the same store having different dates, or some with a date and some not having one. WRAPs 2011 research suggested that the majority of consumers (>85%) relied on judgement to decide whether or not to eat fresh produce rather than a date, but a significant minority (25%) felt uncomfortable with the idea of buying fresh produce without a date21. Further research is needed to assess the impact of having a date or not on packs, and as there are already different approaches being deployed in store WRAP will discuss potential research with retailers. WRAP guidance will be updated based on the new evidence obtained through this work. 3.1.4 Reinforcing the meaning of ‘Use By’ dates There was evidence of ‘Use By’ dates being reinforced on 54% of products. For example, advice on the product would state ‘once opened use within 2 days and before the ‘Use By’ date’. This is a substantial increase from 14% of ‘Use By’ dates being reinforced in 2011. 3.2 Open life guidance and length It is recommended by WRAP that open life guidance is only used for products where food safety is a potential issue and not when the limiting factor is quality. Ambient cooking sauces for example could pose a food safety risk once opened and therefore guidance on how to store such products and for how long is critical. However, for other products such as standard bread, where there is no food safety risk, guidance on storage to maintain quality is helpful but ‘use within x days’ is less so. Key positive changes to note:
● There was a decrease in the provision of open life guidance on many bakery products. For example open life statements were present on 100% of bread rolls in 2011 compared with none in 2015. Smaller reduction in the use of open life statements were seen for bread and some of the world breads.
Areas of potential concern:
● There are several food types where the duration of open life guidance has reduced over time (and none where it has increased):
● Chilled chicken. 42% of packs had an open life statement of ‘use immediately’ in 2015 compared to 0% in 2011. 43% of packs gave between 1 – 3 days in 2015, compared to 100% in 2011.
● Chilled cooking sauces. 38% had 2 days or less in 2011, which had increased to 75% in 2015, whilst 63% had 3 days in 2011 which had fallen to only 15% in 2015.
● Milk. There was a reduction in 1 week open life from 20% in 2011 to 6% in 2015, and an increase in guidance to use somewhere between 2-5 days.
Around 2 million tonnes of food is thrown away from households due to ‘not being used in time’, and for a third of this the date guidance on the pack is cited as a factor22. Giving consumers longer to make use of the food they buy has the potential to significantly reduce household food
21 See Consumer insight: date labels and storage guidance, WRAP 2011 22 See Household food and drink waste: A Product Focus; WRAP 2014
WRAP - Helping Consumers Reduce Food Waste – Retail Survey 2015 20
waste23. This can be influenced for example by the choice of date mark applied (‘Best Before’ rather than ‘Use By’, as discussed in 3.1.2), the length of time between purchase and the date expiring (so called ‘closed life), any guidance on how long a product can be consumed once it has been opened (‘open life’) and optimal storage/freezing advice.
4.0 Storage guidance Storing food under the right conditions is obviously important to maintain quality and where a ‘Use By’ date is carried, food safety. In the context of reducing household food waste this is particularly important for those products which have relatively short shelf-lives and are wasted in large volumes. WRAP developed recommendations for storage guidance for fresh produce and bread based on consumer and technical research and discussions with industry24. In 2015, 87% of all products carried storage guidance, and when restricted to pre-packed products (excluding loose/deli items) this rose to 91%, compared to 96% for pre-packed products in 2011. This may indicate a removal of non-mandatory storage guidance due to pressure on pack space. Key positive changes to note:
● Apples and carrots. 95% of packs advised storage in the refrigerator (a small increase from 2011).
Areas of potential concern:
● Bread. ‘Do not refrigerate’ guidance was present on 41% of all pre-packed bread in 2015, a reduction from 58% in 2011.
Storage of fresh produce such as apples and carrots in the refrigerator can significantly increase their shelf-life in the home, and whilst the majority of consumers take note of this for carrots and other vegetables, most people still keep fruit that would benefit from being stored in the refrigerator at room temperature. Having this guidance on pack, and communicating this more widely, is therefore very important. Conversely bread stales around 6 times more quickly if kept in the refrigerator, and whilst only around 10% of consumers do store bread in the refrigerator this could translate in to a lot of food waste. It is important therefore to retain (and increase use of) the ‘do not refrigerate’ guidance on relevant bread products. 4.1 Storage guidance for potatoes A significant difference was found in the guidance given to consumers on the storage of potatoes. Three retailers carried guidance which included a recommendation for storage in the fridge on their own-label potatoes. This represented 19% of all potato products recorded. Examples included: ‘At home potatoes will last longer if stored in a cool dark dry place or in the fridge’, ‘To keep your potatoes at their best store in the fridge or in a cool dry dark place’ and ‘Keep refrigerated 0 to 5 Degrees’.
23 For example see Extending product life to reduce food waste; WRAP 2015 and The Milk Model: Simulating food waste in the home; WRAP 2013 24 For example see Helping consumers reduce fruit and vegetable waste; WRAP 2008 and Reducing household bakery waste; WRAP 2011
WRAP - Helping Consumers Reduce Food Waste – Retail Survey 2015 21
Areas of potential concern:
● A fifth of all potato products carried guidance to store in the refrigerator. FSA (and therefore Love Food Hate Waste) do not advise consumers to store of potatoes in the refrigerator, for food safety reasons25.
WRAP and FSA have been discussing whether the guidance relating to potatoes could be updated, as currently there is inconsistent guidance given to those working in commercial kitchens and consumers. Once these discussions and any necessary work have been completed guidance to industry can be updated. This is an important area to focus on as 160,000 tonnes of potatoes are thrown away every year due to not being used in time. 4.2 Refrigerator temperature guidance WRAP’s and others research has shown that there are a significant proportion of UK domestic refrigerators operating at temperatures above the recommended 5°C26 (only around 30% of fridges were operating within the recommended temperature range), with another third actually operating at 9oC or above). Maintaining refrigerator temperatures at the correct level could prevent £200 million worth of food being wasted and help prevent instances of food borne illness. FSA recommends that ‘keep refrigerated below 5°C’ guidance should be used where refrigerator temperature information is stated on-pack. For all but one of the products that gave guidance to store in the refrigerator, at least two-thirds of the individual packs only stated ‘keep refrigerated’ or the equivalent, rather than providing a temperature range (for example 70% of ready meals stated ‘keep refrigerated’, whilst 30% had ‘keep refrigerated at below 5°C’ for example). The exception was chicken, where 81% of packs provided a temperature range. Temperature ranges commonly observed in 2015 included ‘0° to 5°C’, ‘-2 to 4°C’, ‘below 4°C’ and ‘below 5°C’. There were a number of examples of temperature ranges exceeding 5°C, for example ‘below 6°C’, ‘1° to 6°C’ or even ‘1° to 8°C’. Areas of potential concern:
● The majority of products that either need to be stored in the refrigerator, or would benefit from this, do not reinforce the correct temperature refrigerators should be set to.
● Where temperature ranges were given, three variants were being used most often (‘below 5°C’, ‘0°C to 5°C’ or ‘1°C to 5°C’) but 2% of all chilled products in 2015 had an ‘extended’ temperature or range, i.e. finishing higher than 5°C such as ‘less than 7°C’ or ‘between 1°C and 8°C’. This compares to 1% of chilled products in 2011.
● Cheese showed the greatest variety in terms of temperature ranges, with six different ones observed in 2015.
● In 2015, 10% of chilled cooking sauces and 16% of yoghurts used ‘below 6°C’.
WRAP will work with FSA to reinforce the value to indicate temperature ranges when giving advice to refrigerate foods, and what this range should be.
25 For example see https://www.nidirect.gov.uk/articles/storing-food-safely-potatoes and https://www.food.gov.uk/news-updates/campaigns-0/germwatch/science-fsw/fridge-temperatures 26 See Insights around the domestic refrigerator; WRAP 2010 and The impact of using your fridge and freezer more effectively; WRAP 2013
WRAP - Helping Consumers Reduce Food Waste – Retail Survey 2015 22
5.0 Freezing guidance WRAP recommend the following freezing and defrosting guidance to the food industry27:
● Use the snowflake logo (with text) to indicate suitability for home freezing;
● Only use the crossed out snowflake to show ‘Not suitable for home freezing’;
● Replace ‘Freeze on the day of purchase’ with ‘Freeze by date mark shown’ or ‘Freeze as soon as possible’ (depending on the product);
● Give information on how long a product can be kept frozen, e.g. one month; and
● Include defrosting and/ or cook from frozen guidance, e.g. defrost in fridge and use within 24 hours.
5.1 Moving away from ‘Freeze on day of purchase’ and related guidance Overall in 2015, there were improvements in the presence of suitable freezing and defrosting statements across applicable products, but there is still much more to do. Consumers are currently throwing away around £5.6 billion of food and drink each year due to it ‘not being used in time’. Much of this food could have been frozen and eaten at a later date. Confusion about whether a product is suitable for freezing and how best to freeze it to maximise its quality are two of the reasons why food is thrown away rather than frozen28. Key positive changes to note:
● Pre-prepared meals. 100% of products followed the WRAP guidance, stating ‘Freeze by the date shown’. Whilst this is not a change from 2011 (as this sector was one of the first to adopt the new guidance from WRAP) it is important to note that this has been maintained over the four year period despite changes to product portfolios and products being refreshed.
Areas of potential concern:
● Pre-packed bread. 41% of products had updated freezing guidance, but 57% still stated ‘Freeze on day of purchase’
● Bacon. 45% of products had updated freezing guidance, but 50% still stated ‘Freeze on day of purchase’
● Chicken. 65% of products had updated freezing guidance, but 15% stated ‘Freeze on day of purchase’
● Cooking sauces. 65% of products had updated freezing guidance, but 30% stated ‘Freeze on day of purchase’
In 2015, 6% of chilled chicken stated that frozen chicken should not be refrozen once defrosted, while a further 48% of products stated this as additional information. 19% of frozen chicken stated that frozen chicken should not be refrozen once defrosted, with an additional 58% of products stated this as additional information. Whilst correct, consumers may interpret this as not being able to freeze meals made with chicken (and other meat) that was frozen, so alternative wording/additional advice may be useful.
27 Freezing guidance to prevent food waste; WRAP 2012 28 Understanding consumer use of the freezer; WRAP 2010
WRAP - Helping Consumers Reduce Food Waste – Retail Survey 2015 23
5.2 Use of the snowflake logo to indicate suitability for home freezing
Overall, in 2015 snowflake logos to represent suitable for freezing were present on 15% of applicable products compared to 21% of products in 2011. Snowflake logos and suitable for freezing statements were commonly presented in different locations on the product packaging to reinforce the information; 13% of products with a snowflake logo/ freezer statement had it in 2 places on the packaging, i.e. front and back. Key positive changes to note:
● Bacon. Usage of the snowflake logo increased from 47% in 2011 to 56% in 2015. Areas of potential concern:
● Pre-packed bread. Usage of the snowflake logo reduced from 49% in 2011 to 38% in 2015
● Chicken. Usage of the snowflake logo reduced from 69% in 2011 to 44% in 2015
● Juice. Usage of the snowflake logo reduced from 18% in 2011 to 7% in 2015
● Cooking sauce. Usage of the snowflake logo reduced from 64% in 2011 to 11% in 2015
WRAP guidance is to make use of the snowflake logo to indicate/reinforce suitability for home freezing, but pressure on pack space may be leading to its removal in some cases. 6.0 Pack size range In the 2011 report, it was recommended that there were continued improvements in the availability of smaller pack sizes/variants where appropriate. It was suggested that where it was not possible to provide a smaller pack the food industry could investigate how to provide guidance on optimising storage, freezing and use of leftovers and to minimize differences in price/kilo between pack sizes. This is important with an increasing number of people who live alone (7.7 million in 2015, 29% of UK households), and who waste on average 40% more per person compared to those in other households29. Key positive changes to note:
● Increases in the availability of smaller packs were seen in a number of categories, including bagged salads (packs of <150g increased in frequency from 53% in 2011 to 71% in 2015), pre-packed apples, carrots, potatoes, mayonnaise and cheese.
Areas of potential concern:
● The frequency of smaller pack sizes has decreased in a number of key product categories particularly in pre-packed bread and a range of world breads:
● For bread 800g loaves made up 75% of the total products in 2015 compared to 66% in 2011, whilst 400g loaves made up 18% in 2015, down from 27% in 2011.
● The availability of plain white pittas in packs of four have decreased from 12% in 2011 to 0% in 2015.
29 Household food and drink waste in the UK 2012; WRAP 2013
WRAP - Helping Consumers Reduce Food Waste – Retail Survey 2015 24
It was also noted that the per kilo price differential for bread widened for branded loaves between 2011 and 2015, whilst reducing for own-brand loaves. However, there remained a significant differential for both:
● Branded: 400g = £2.01/kg; 800g = £1.25/kg
● Own-brand: 400g = £1.75/kg; 800g = £0.88/kg
This is a particularly important area as bread is one of the most wasted products from UK homes (460,000 tonnes), and most of this is due to packs being opened but not finished in time (before they stale or go mouldy). 7.0 Summary and conclusions Table 1 provides a summary of key positive changes between 2011 and 2015 and areas of potential concern. The more significant ones are:
● There has been an almost complete removal of ‘Display Until’ dates used in combination with either ‘Use By’ or ‘Best Before’, but there are a few examples that should be addressed. WRAP will reinforce the importance of not having more than one date on packs, which has been shown to cause consumer confusion and potentially undermine the importance of the important date marks (‘Best Before’ and ‘Use By’).
● There are two good examples (hard cheese and pasteurised fruit juice) of products shifting from a ‘Use By’ to ‘Best Before’ date, but other examples where the opposite has happened. WRAP worked closely with Dairy UK and the British Soft Drink Association in 2011/12 to develop sector specific guidance relating to the application of date marks, and the changes to how hard cheese and pasteurised fruit juices are now labelled illustrate what can be achieved. Such changes give consumers the confidence and option to make use of products after the ‘Best Before’ date if for whatever reason they are not eaten before the date passes. There are legitimate reasons why some products may change from a ‘Best Before’ date to a ‘Use By’, for example due to changes in ingredients, preservatives or processing and packaging technologies, but this decision should always be made on the basis of food safety, rather than becoming a default position. Further discussions are required with industry to understand the reasons behind the move from ‘Best Before’ to ‘Use By’ on some yoghurts and world breads.
● There is increasing divergence around what date (‘Best Before’ or ‘Display Until’), or no date at all, is applied to pre-packed fresh produce. The current situation is potentially confusing to consumers, with different types of fresh produce in the same store having different dates, or some with a date and some not having one. WRAPs 2011 research suggested that the majority of consumers (>85%) relied on judgement to decide whether or not to eat fresh produce rather than a date, but a significant minority (25%) felt uncomfortable with the idea of buying fresh produce without a date. WRAP currently recommends that a ‘Best Before’ date is applied to fresh produce, to help consumers manage the food they buy. Further research would be beneficial to assess the impact of having a date or not on packs of fresh produce, and as there are already different approaches being deployed in store WRAP will discuss potential research with retailers. WRAP guidance will be updated based on the new evidence obtained through this work.
● There has been good progress on when to provide open life guidance (only where there is a food safety risk) but several examples of the duration of open life being reduced (for example
WRAP - Helping Consumers Reduce Food Waste – Retail Survey 2015 25
for chilled chicken and cooking sauces, and milk). Such changes will reduce the time available for consumers to make use of the product.
● Around 2 million tonnes of food is thrown away from households due to ‘not being used in time’, and for a third of this the date guidance on the pack is cited as a factor. Giving consumers longer to make use of the food they buy has the potential to significantly reduce household food waste. This can be influenced for example by the choice of date mark applied (‘Best Before’ rather than ‘Use By’), the length of time between purchase and the date expiring (so called ‘closed life), any guidance on how long a product can be consumed once it has been opened (‘open life’) and optimal storage/freezing advice.
● Most products carry some form of storage guidance, and in the majority of cases this is consistent with WRAP recommendations. However attention needs to be paid to bread (where guidance not to store in the fridge is being removed) and potatoes (increasing inconsistency around advice to store in the fridge). WRAP and FSA have been discussing whether the guidance relating to potatoes could be updated, as currently there is inconsistent guidance given to those working in commercial kitchens and consumers. Once these discussions and any necessary work have been completed guidance to industry can be updated. This is an important area to focus on as 160,000 tonnes of potatoes are thrown away every year due to not being used in time.
● Where guidance is given to keep products refrigerated most is consistent with WRAP/FSA recommendations, but three main alternatives are being used. In some cases (chilled cooking sauces and yoghurts) a significant percentage of products have temperature ranges outside of the current guidelines. WRAP will work with FSA to reinforce the value to indicate temperature ranges when giving advice to refrigerate foods, and what this range should be. Having consistent wording on pack, including the temperature range, would support wider awareness raising work needed to encourage consumers to check and if necessary modify their refrigerator temperature.
● Good progress has been made in moving away from ‘Freeze on day of purchase’, but there is much to do, particularly for meat and bakery products. The use of the snowflake logo to indicate suitability for home freezing has reduced, possibly due to pressure on pack space. There is a need to reinforce the value of having this on pack.
● There have been increases in the availability of smaller packs in a number of categories, including bagged salads, pre-packed apples, carrots, potatoes, mayonnaise and cheese. However, the frequency of smaller pack sizes has decreased in a number of other product categories particularly in pre-packed bread and a range of world breads. Smaller loaves of bread are still significantly more expensive on a per kilo basis than larger ones.
WRAP will be working with Governments and the FSA to develop updated guidance to industry on the application of date and related (for example storage and freezing) advice on-pack, and this will be published in Autumn 2017. WRAP will also continue working with food manufacturers and retailers to raise awareness of how changes to products, packaging and labelling can help consumers reduce food wasted at home.
WRAP - Helping Consumers Reduce Food Waste – Retail Survey 2015 26
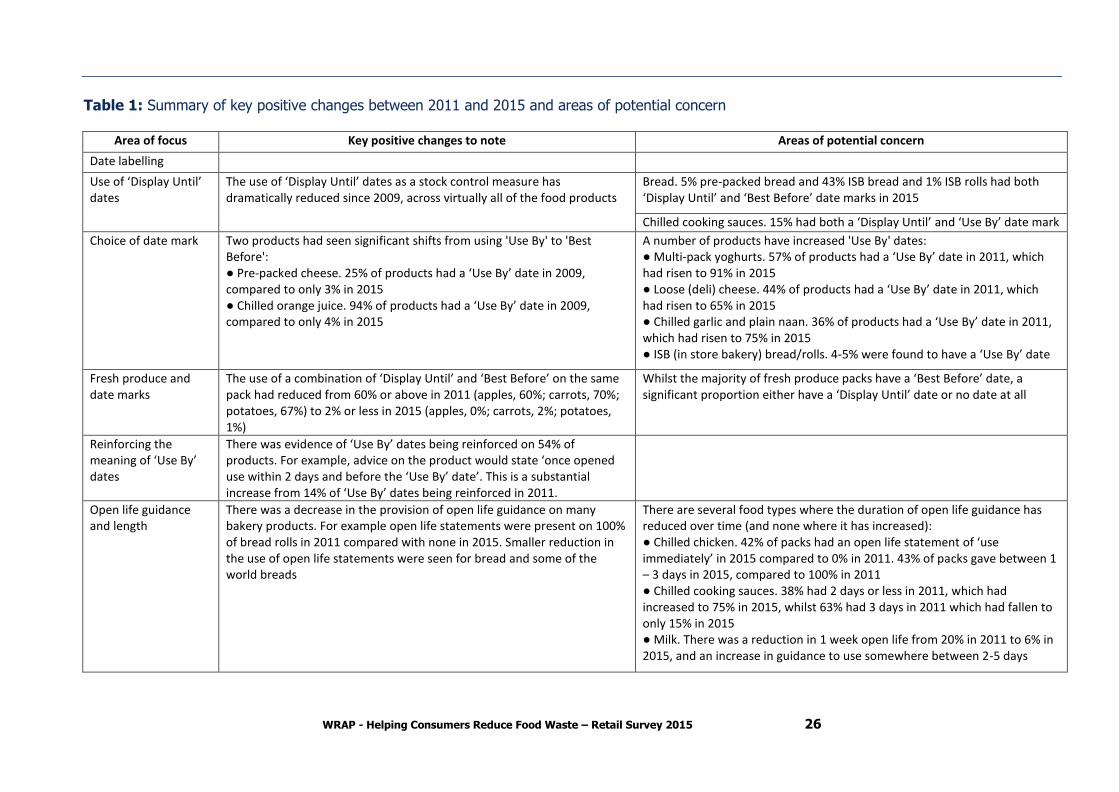
Table 1: Summary of key positive changes between 2011 and 2015 and areas of potential concern
Area of focus Key positive changes to note Areas of potential concern
Date labelling
Use of ‘Display Until’ dates
The use of ‘Display Until’ dates as a stock control measure has dramatically reduced since 2009, across virtually all of the food products
Bread. 5% pre-packed bread and 43% ISB bread and 1% ISB rolls had both ‘Display Until’ and ‘Best Before’ date marks in 2015
Chilled cooking sauces. 15% had both a ‘Display Until’ and ‘Use By’ date mark
Choice of date mark Two products had seen significant shifts from using 'Use By' to 'Best Before': ● Pre-packed cheese. 25% of products had a ‘Use By’ date in 2009, compared to only 3% in 2015 ● Chilled orange juice. 94% of products had a ‘Use By’ date in 2009, compared to only 4% in 2015
A number of products have increased 'Use By' dates: ● Multi-pack yoghurts. 57% of products had a ‘Use By’ date in 2011, which had risen to 91% in 2015 ● Loose (deli) cheese. 44% of products had a ‘Use By’ date in 2011, which had risen to 65% in 2015 ● Chilled garlic and plain naan. 36% of products had a ‘Use By’ date in 2011, which had risen to 75% in 2015 ● ISB (in store bakery) bread/rolls. 4-5% were found to have a ‘Use By’ date
Fresh produce and date marks
The use of a combination of ‘Display Until’ and ‘Best Before’ on the same pack had reduced from 60% or above in 2011 (apples, 60%; carrots, 70%; potatoes, 67%) to 2% or less in 2015 (apples, 0%; carrots, 2%; potatoes, 1%)
Whilst the majority of fresh produce packs have a ‘Best Before’ date, a significant proportion either have a ‘Display Until’ date or no date at all
Reinforcing the meaning of ‘Use By’ dates
There was evidence of ‘Use By’ dates being reinforced on 54% of products. For example, advice on the product would state ‘once opened use within 2 days and before the ‘Use By’ date’. This is a substantial increase from 14% of ‘Use By’ dates being reinforced in 2011.
Open life guidance and length
There was a decrease in the provision of open life guidance on many bakery products. For example open life statements were present on 100% of bread rolls in 2011 compared with none in 2015. Smaller reduction in the use of open life statements were seen for bread and some of the world breads
There are several food types where the duration of open life guidance has reduced over time (and none where it has increased): ● Chilled chicken. 42% of packs had an open life statement of ‘use immediately’ in 2015 compared to 0% in 2011. 43% of packs gave between 1 – 3 days in 2015, compared to 100% in 2011 ● Chilled cooking sauces. 38% had 2 days or less in 2011, which had increased to 75% in 2015, whilst 63% had 3 days in 2011 which had fallen to only 15% in 2015 ● Milk. There was a reduction in 1 week open life from 20% in 2011 to 6% in 2015, and an increase in guidance to use somewhere between 2-5 days
WRAP - Helping Consumers Reduce Food Waste – Retail Survey 2015 27
Area of focus Key positive changes to note Areas of potential concern
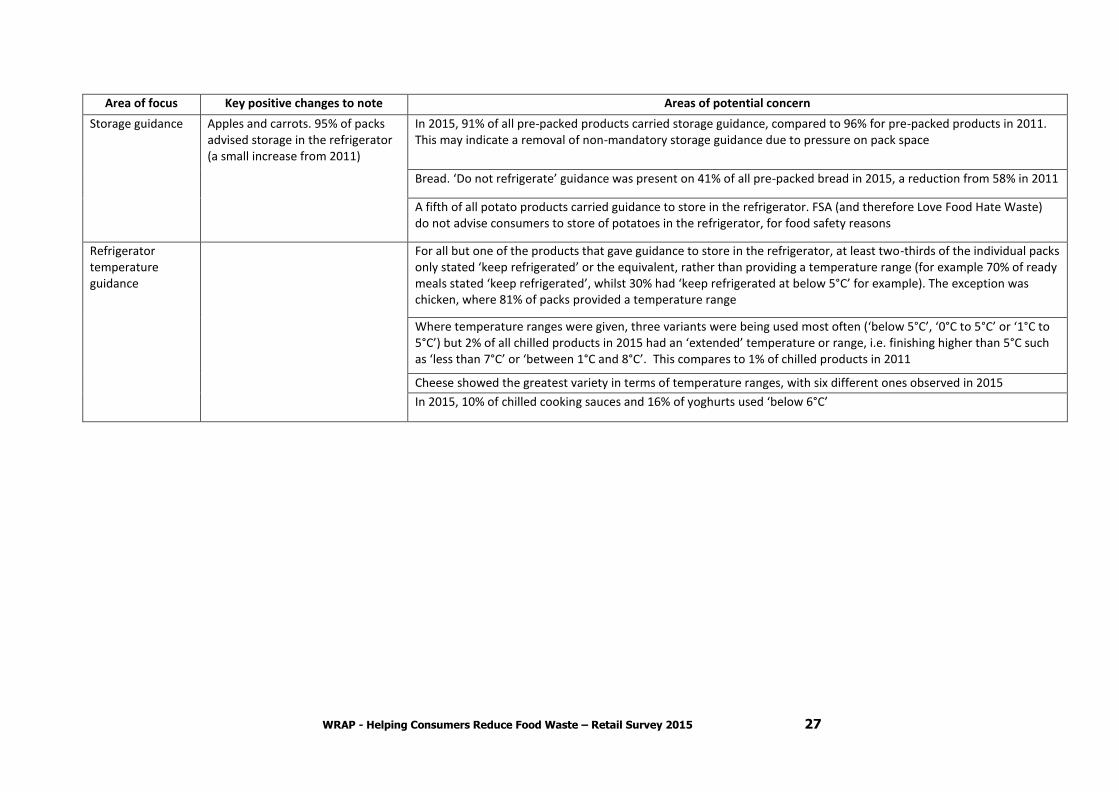
Storage guidance Apples and carrots. 95% of packs advised storage in the refrigerator (a small increase from 2011)
In 2015, 91% of all pre-packed products carried storage guidance, compared to 96% for pre-packed products in 2011. This may indicate a removal of non-mandatory storage guidance due to pressure on pack space
Bread. ‘Do not refrigerate’ guidance was present on 41% of all pre-packed bread in 2015, a reduction from 58% in 2011
A fifth of all potato products carried guidance to store in the refrigerator. FSA (and therefore Love Food Hate Waste) do not advise consumers to store of potatoes in the refrigerator, for food safety reasons
Refrigerator temperature guidance
For all but one of the products that gave guidance to store in the refrigerator, at least two-thirds of the individual packs only stated ‘keep refrigerated’ or the equivalent, rather than providing a temperature range (for example 70% of ready meals stated ‘keep refrigerated’, whilst 30% had ‘keep refrigerated at below 5°C’ for example). The exception was chicken, where 81% of packs provided a temperature range
Where temperature ranges were given, three variants were being used most often (‘below 5°C’, ‘0°C to 5°C’ or ‘1°C to 5°C’) but 2% of all chilled products in 2015 had an ‘extended’ temperature or range, i.e. finishing higher than 5°C such as ‘less than 7°C’ or ‘between 1°C and 8°C’. This compares to 1% of chilled products in 2011
Cheese showed the greatest variety in terms of temperature ranges, with six different ones observed in 2015
In 2015, 10% of chilled cooking sauces and 16% of yoghurts used ‘below 6°C’
WRAP - Helping Consumers Reduce Food Waste – Retail Survey 2015 28
Area of focus Key positive changes to note Areas of potential concern
Freezing guidance
Moving away from ‘Freeze on day of purchase’ and related guidance
Pre-prepared meals. 100% of products followed the WRAP guidance, stating ‘Freeze by the date shown’. Whilst this is not a change from 2011 (as this sector was one of the first to adopt the new guidance from WRAP) it is important to note that this has been maintained over the four year period despite changes to product portfolios and products being refreshed
There were a number of products where 'Freeze on day of purchase' was still common: ● Pre-packed bread. 41% of products had updated freezing guidance, but 57% still stated ‘Freeze on day of purchase’ ● Bacon. 45% of products had updated freezing guidance, but 50% still stated ‘Freeze on day of purchase’ ● Chicken. 65% of products had updated freezing guidance, but 15% stated ‘Freeze on day of purchase’ ● Cooking sauces. 65% of products had updated freezing guidance, but 30% stated ‘Freeze on day of purchase’
In 2015, 6% of chilled chicken stated that frozen chicken should not be refrozen once defrosted, while a further 48% of products stated this as additional information. 19% of frozen chicken stated that frozen chicken should not be refrozen once defrosted, with an additional 58% of products stated this as additional information. Whilst correct, consumers may interpret this as not being able to freeze meals made with chicken (and other meat) that was frozen, so alternative wording / additional advice may be useful
Use of the snowflake logo to indicate suitability for home freezing
Bacon. Usage of the snowflake logo increased from 47% in 2011 to 56% in 2015
Overall, in 2015 snowflake logos to represent suitable for freezing were present on 15% of applicable products compared to 21% of products in 2011
There were a number of products where the use of the snowflake logo had decreased: ● Pre-packed bread. Usage of the snowflake logo reduced from 49% in 2011 to 38% in 2015 ● Chicken. Usage of the snowflake logo reduced from 69% in 2011 to 44% in 2015 ● Juice. Usage of the snowflake logo reduced from 18% in 2011 to 7% in 2015 ● Cooking sauce. Usage of the snowflake logo reduced from 64% in 2011 to 11% in 2015
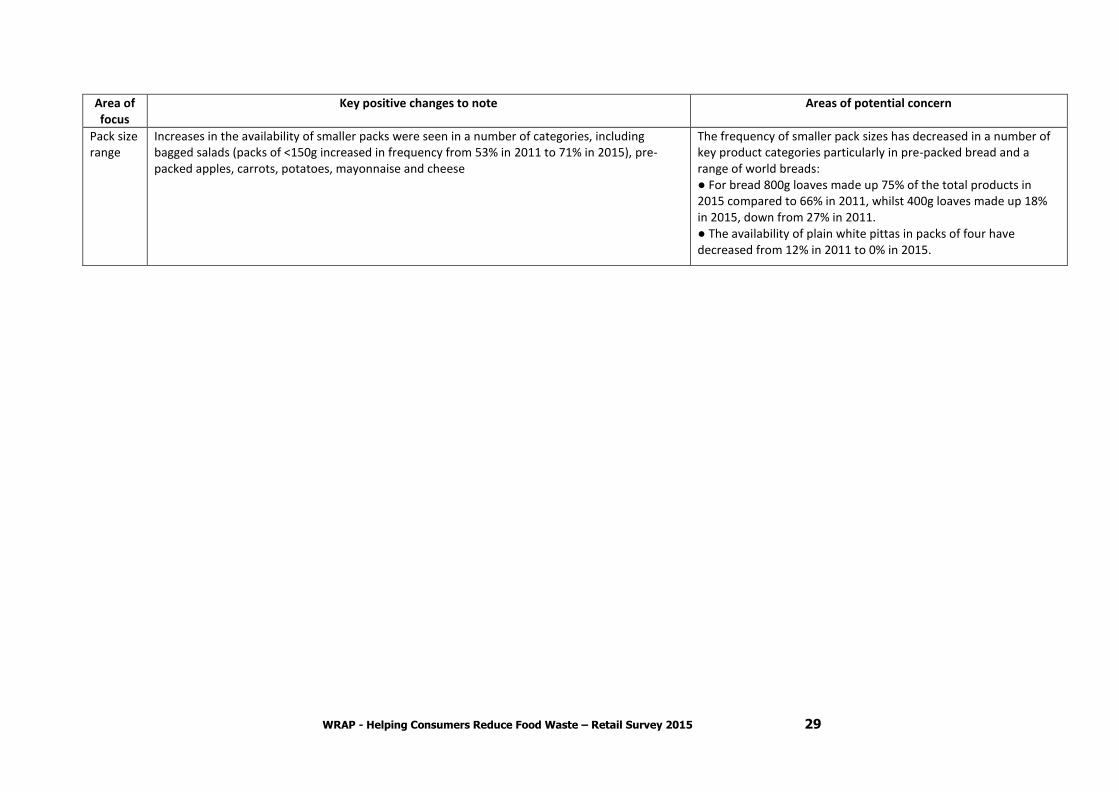
WRAP - Helping Consumers Reduce Food Waste – Retail Survey 2015 29
Area of focus
Key positive changes to note Areas of potential concern
Pack size range
Increases in the availability of smaller packs were seen in a number of categories, including bagged salads (packs of <150g increased in frequency from 53% in 2011 to 71% in 2015), pre-packed apples, carrots, potatoes, mayonnaise and cheese
The frequency of smaller pack sizes has decreased in a number of key product categories particularly in pre-packed bread and a range of world breads: ● For bread 800g loaves made up 75% of the total products in 2015 compared to 66% in 2011, whilst 400g loaves made up 18% in 2015, down from 27% in 2011. ● The availability of plain white pittas in packs of four have decreased from 12% in 2011 to 0% in 2015.
WRAP - Helping Consumers Reduce Food Waste – Retail Survey 2015 30
Appendix 1: Detailed methodology
Background Individual retailer surveys have been undertaken in 2009, 2011 and 2015. The same or very similar methods were used in the surveys, although some changes were made to reflect changes in the market. In 2009 the aim of the retail survey30 was to identify good practice that could be adopted across the industry in relation to pack labels, size and functionality. The study also aimed to identify areas of inconsistency or lack of clarity in packaging and labelling information that could be addressed to improve households understanding and confidence in relation to the purchase and use of food, thereby reducing household food waste. One of the recommendations from the 2009 research was to repeat the survey to assess changes in the sector against the best practice identified by WRAP. In 2011, the labelling and packaging of key products in the UK retail sector was reviewed, and was further assessed in 2015. The main areas of interest in the 2011 and 2015 surveys were changes to date labels, storage guidance, freezing and defrosting guidance and the use of logos and in-store activity to raise awareness and encourage changes to consumer behaviour. From the findings, examples of best practice were identified to help drive further developments within the retail sector to help consumers reduce food waste. Store visit programme Data capture relied primary on individual store visits. The number of stores visited was broadly in line with retailer market share. According to research from the IGD31, grocery sales amounted to £174.5 billion in 2014:
● 42% hypermarkets or superstores (i.e. large format stores, 25-60,000 ft2 selling both grocery
items but with substantial non-food range(s) for example Tesco Extra)
● 20% smaller supermarkets (food focused stores 3-25,000 ft2)
● 21% convenience stores (< 3000 ft2 such as Tesco Metro, Sainsbury’s Local, etc.),
● 6% from discounters including Aldi, Lidl and others
● 4% online and
● 5% from other retailers (including grocery sales from predominately non-food retailers such
as M&S).
This information was then used to identify a number of stores that covered the range of store formats or fascias32, as well as providing UK geographic coverage. Nine retailers participated in the 2015 survey: Aldi, Asda, Lidl, Morrisons, M&S, Sainsbury’s, The Co-Operative, Tesco and Waitrose. A total of 78 stores were surveyed between March and September 2015, across England, Wales and Scotland, including 5 online orders. Table A1 presents the geographical spread of store visits in 2015, including five online store orders which were made from different geographical locations as part of staff training and familiarisation with the data collection software.
30 Helping consumers reduce food waste – a retail survey, 2009; WRAP 2010 31 IGD UK Grocery: Market and channel forecast 2015-2020, June 2014. Available from http://www.igd.com/About-us/Media/IGD-news-and-press-releases/UK-grocery-market-to-be-worth-203bn-by-2019/ 32 Shop format or fascia is related to size and format of a supermarket store, for example a smaller local store selling a smaller range of products compared to superstores that will be large, have a wide range of products as well as other departments such as homeware, clothing and electrical items.
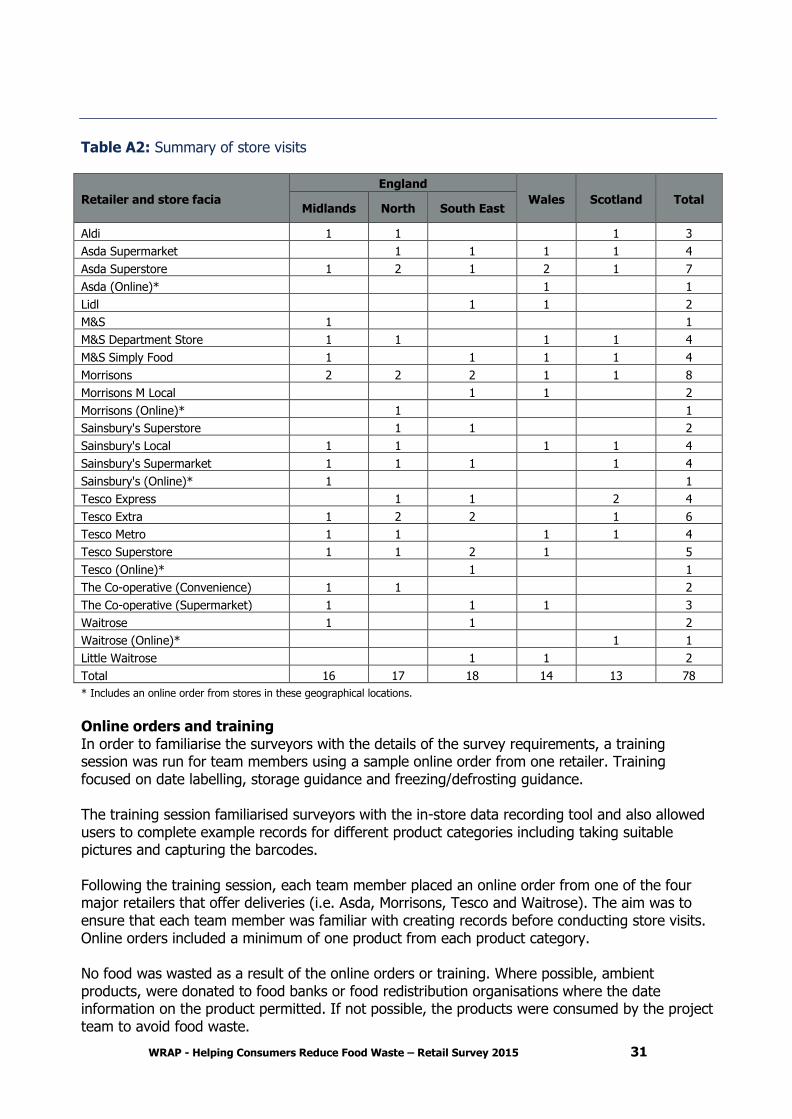
WRAP - Helping Consumers Reduce Food Waste – Retail Survey 2015 31
Table A2: Summary of store visits
Retailer and store facia
England
Wales Scotland Total Midlands North South East
Aldi 1 1 1 3
Asda Supermarket 1 1 1 1 4
Asda Superstore 1 2 1 2 1 7
Asda (Online)* 1 1
Lidl 1 1 2
M&S 1 1
M&S Department Store 1 1 1 1 4
M&S Simply Food 1 1 1 1 4
Morrisons 2 2 2 1 1 8
Morrisons M Local 1 1 2
Morrisons (Online)* 1 1
Sainsbury's Superstore 1 1 2
Sainsbury's Local 1 1 1 1 4
Sainsbury's Supermarket 1 1 1 1 4
Sainsbury's (Online)* 1 1
Tesco Express 1 1 2 4
Tesco Extra 1 2 2 1 6
Tesco Metro 1 1 1 1 4
Tesco Superstore 1 1 2 1 5
Tesco (Online)* 1 1
The Co-operative (Convenience) 1 1 2
The Co-operative (Supermarket) 1 1 1 3
Waitrose 1 1 2
Waitrose (Online)* 1 1
Little Waitrose 1 1 2
Total 16 17 18 14 13 78
* Includes an online order from stores in these geographical locations.
Online orders and training In order to familiarise the surveyors with the details of the survey requirements, a training session was run for team members using a sample online order from one retailer. Training focused on date labelling, storage guidance and freezing/defrosting guidance. The training session familiarised surveyors with the in-store data recording tool and also allowed users to complete example records for different product categories including taking suitable pictures and capturing the barcodes. Following the training session, each team member placed an online order from one of the four major retailers that offer deliveries (i.e. Asda, Morrisons, Tesco and Waitrose). The aim was to ensure that each team member was familiar with creating records before conducting store visits. Online orders included a minimum of one product from each product category. No food was wasted as a result of the online orders or training. Where possible, ambient products, were donated to food banks or food redistribution organisations where the date information on the product permitted. If not possible, the products were consumed by the project team to avoid food waste.
WRAP - Helping Consumers Reduce Food Waste – Retail Survey 2015 32
Data capture Ricardo Energy & Environment worked with WRAP and the retailer partners to arrange site visits across all nine retailers’ store formats and fascias. Once Ricardo Energy & Environment received permission to conduct store visits from the retailers, store specific managers were contacted to confirm the date and time of the site visit. During the store visits, visual inspection was made of information and labelling on the primary and secondary packaging of food products within the scope of the project. The products surveyed are those that are commonly wasted in the home, based on research conducted by WRAP33. A detailed breakdown by product sub-category is provided in Appendix 1. The key data collected on each product surveyed included:
● Type and details of dates displayed on packaging
● Storage guidance (both presence of, and detail)
● Freezing instructions (both presence of, and detail)
● Defrosting instructions (both presence of, and detail)
● Pack size, features and format
● Presence of symbols
In addition the following contextual information (where relevant) was recorded:
● Retailer
● Store type (fascia)
● Store location ( geographical)
● Sub-type of product (if relevant)
● Whether branded or own-label, and if own-label, whether ‘premium’, ‘standard’ or ‘value’
● Brand/sub brand
● Variant (e.g. extra strong; Mediterranean; wafer thin)
● In store location (whether chilled, ambient, frozen or from the deli counter)
The number of individual products surveyed varied, from approximately 10,000 in 2009, 12,000 in 2011 and 9,000 in 2015. The variation in the number of products surveyed within the product categories is due to changes in the particular product markets or small modifications within the product specification between the surveys. Duplicate products were removed from the 2011 and 2015 data sets. For the follow-up store visits conducted in September 2015 (to fill gaps in data gathering), additional store checks were completed with store managers to ensure all product categories were available. In the event that the store was not suitable on the day of the surveyor, a backup store of similar size and fascia was available to contact and complete the survey. Additional storage labels can be found underneath the outer packaging for products such as bacon and chicken. Where applicable, surveyors purchased one pack size from each range to ensure that any internal labels were recorded. It was assumed that the internal storage labels
33 Solutions to prevent household food waste and Concept to Consumer
WRAP - Helping Consumers Reduce Food Waste – Retail Survey 2015 33
were the same within brands and ranges and therefore to reduce waste only one pack size was purchased. Data was captured for an individual product via a pre-designed iPad FileMaker Pro form that had the capacity to scan EAN8/EAN13 barcodes and capture high-resolution photographs of the product and the relevant date/storage/freezing information via pre-defined lists or free text fields. This included other information such as price or promotions. FileMaker Pro software allows users to quickly configure a data capture application to run on a mobile device such as an iPad. It comes with pre-defined controls allowing the application to use the devices' camera for data entry of barcodes and products photos. The application was designed with validation controls to limit data input error. Drop-down menus were designed to aid data recording; however drop down menus could also be manually overwritten to input alternative results when applicable. The FileMaker Pro software and the FileMaker Go app were available on iPads and iPhones, which gave additional flexibility and a backup device in case of failure of the tablet. The in-store survey tool allowed information on the presence or absence of an item to be recorded (e.g. date label, snowflake, storage icon, storage guidance, etc.) and, if present, where the information was on the item (e.g. front, back, side, top, underneath, inside top, etc.) and then a selection list option for the recording of further information (e.g. defrost thoroughly, defrost for 12 hours in a refrigerator). Data collation and analysis Primary data analysis involves importing raw data into Excel and then analysing using Excel’s inbuilt functionality including tools such as Pivot tables to produce the required outputs. The analysis focused primarily on replicating the same type of information presented previously in the 2011 survey report but updated to reflect the position in 2015 so that trend analysis could be carried out and any particular data inconsistencies or anomalies could be identified and checked.
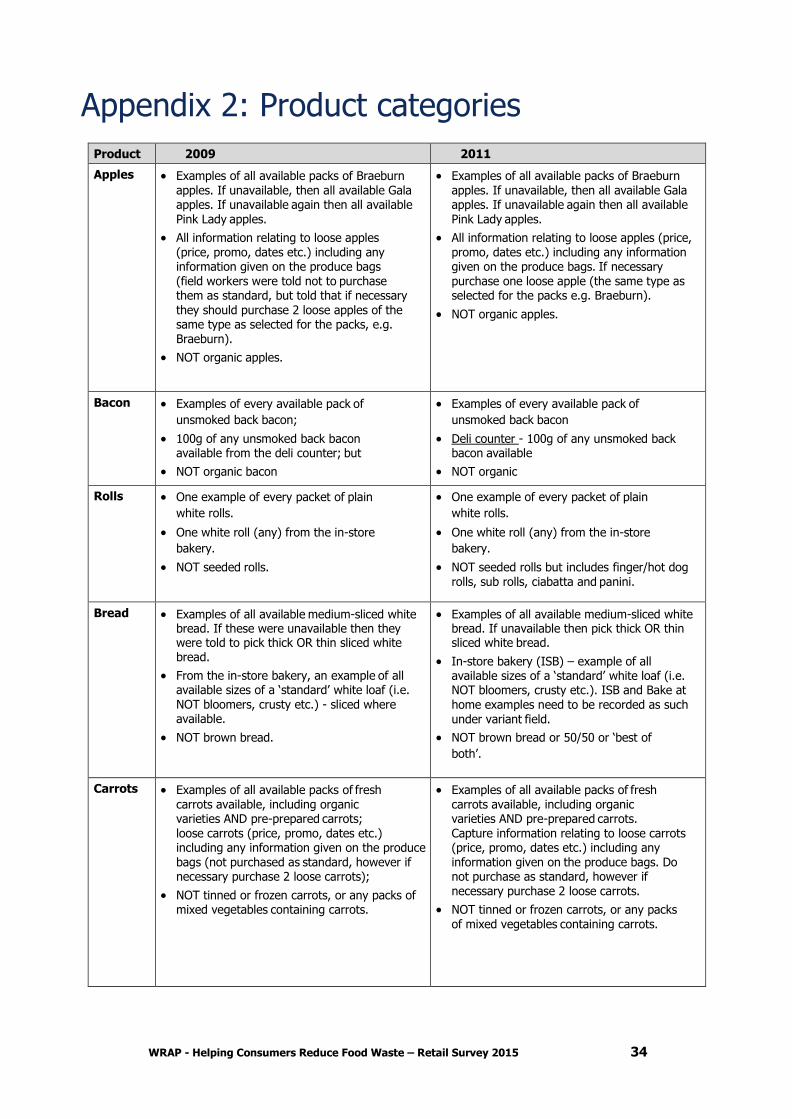
WRAP - Helping Consumers Reduce Food Waste – Retail Survey 2015 34
Appendix 2: Product categories
Product 2009 2011
Apples Examples of all available packs of Braeburn apples. If unavailable, then all available Gala apples. If unavailable again then all available Pink Lady apples.
All information relating to loose apples (price, promo, dates etc.) including any information given on the produce bags (field workers were told not to purchase them as standard, but told that if necessary
they should purchase 2 loose apples of the same type as selected for the packs, e.g. Braeburn).
NOT organic apples.
Examples of all available packs of Braeburn apples. If unavailable, then all available Gala apples. If unavailable again then all available Pink Lady apples.
All information relating to loose apples (price, promo, dates etc.) including any information given on the produce bags. If necessary purchase one loose apple (the same type as selected for the packs e.g. Braeburn).
NOT organic apples.
Bacon Examples of every available pack of
unsmoked back bacon;
100g of any unsmoked back bacon available from the deli counter; but
NOT organic bacon
Examples of every available pack of
unsmoked back bacon
Deli counter - 100g of any unsmoked back bacon available
NOT organic
Rolls One example of every packet of plain
white rolls.
One white roll (any) from the in-store
bakery.
NOT seeded rolls.
One example of every packet of plain
white rolls.
One white roll (any) from the in-store
bakery.
NOT seeded rolls but includes finger/hot dog rolls, sub rolls, ciabatta and panini.
Bread Examples of all available medium-sliced white bread. If these were unavailable then they were told to pick thick OR thin sliced white bread.
From the in-store bakery, an example of all available sizes of a ‘standard’ white loaf (i.e. NOT bloomers, crusty etc.) - sliced where available.
NOT brown bread.
Examples of all available medium-sliced white bread. If unavailable then pick thick OR thin sliced white bread.
In-store bakery (ISB) – example of all available sizes of a ‘standard’ white loaf (i.e. NOT bloomers, crusty etc.). ISB and Bake at home examples need to be recorded as such
under variant field.
NOT brown bread or 50/50 or ‘best of
both’.
Carrots Examples of all available packs of fresh carrots available, including organic varieties AND pre-prepared carrots; loose carrots (price, promo, dates etc.) including any information given on the produce bags (not purchased as standard, however if necessary purchase 2 loose carrots);
NOT tinned or frozen carrots, or any packs of mixed vegetables containing carrots.
Examples of all available packs of fresh carrots available, including organic varieties AND pre-prepared carrots. Capture information relating to loose carrots (price, promo, dates etc.) including any information given on the produce bags. Do not purchase as standard, however if necessary purchase 2 loose carrots.
NOT tinned or frozen carrots, or any packs
of mixed vegetables containing carrots.

WRAP - Helping Consumers Reduce Food Waste – Retail Survey 2015 35
Product 2009 2011
Cheese Examples of all mature cheddar
available;
100g of ANY mature cheddar at the deli
counter where available;
NOT grated/sliced cheese or soft cheese
(e.g. Philadelphia, Dairylea etc.).
Examples of all mature cheddar
available.
Where a range of sizes available, please select smallest size (only one pack size of each type/brand required for purchase). Please log an example of all pack sizes available across the cheese category.
Deli – 100g of ANY mature Cheddar.
NOT grated/sliced cheese or soft cheese (e.g.
Philadelphia, Dairylea etc.).
Include organic versions of produce.
Chicken An example of every available pack of whole skinless chicken breast fillets (NOT mini or diced chicken fillets).
All available sizes i.e. small (1-2 fillets), medium (3-4 fillets) and large (5-8 fillets) chicken fillets if available.
Chilled and frozen versions.
NOT organic chicken.
Examples of every available pack of whole skinless chicken breast fillets (NOT mini or diced chicken fillets).
Log all available sizes of packs of chicken fillets i.e. small (1-2 fillets), medium (3-4 fillets) and large (5-8 fillets) if available.
Chilled and frozen versions.
NOT organic.
Cooking sauce
Examples of all available standard tomato/original or tomato and herb sauce. Where both variants are available for the same brand, tomato/original sauce should be used.
If no tomato/original or tomato/herb sauce available for that brand, then Bolognese sauce e.g. Dolmio sell neither tomato/original nor tomato/herb sauce but do sell a Bolognese sauce.
Chilled and ambient versions.
All pack formats and sizes available e.g. Jar,
pouch, plastic tub etc.
NOT pesto, or any other flavours of sauce (e.g. mushroom, onion & garlic etc.).
Examples of all available standard tomato/original or tomato and herb sauce. Where both variants are available for the same brand, tomato/original sauce should be used.
If no tomato/original or tomato/herb sauce available for that brand, then please select Bolognese sauce e.g. Dolmio sell neither tomato/original nor tomato/herb sauce but do sell a Bolognese sauce.
Chilled and ambient versions.
Include all pack formats and sizes available e.g. Jar, pouch, plastic tub etc.
NOT pesto, or any other flavours of sauce
(e.g. mushroom, onion & garlic etc.).
Eggs Examples of all hen eggs available (e.g.
free-range, barn, organic etc.);
Where a range of sizes were available for a particular brand, medium size eggs - if unavailable then an alternative size (only one egg size of each type/brand);
An example of all pack sizes available across the egg brands e.g. 4 medium eggs, 6 medium eggs, 10 medium eggs, etc.
Examples of all hen eggs available e.g.
caged, free-range, barn, organic etc.
Where ranges of egg sizes are available for a particular brand, please select medium. If unavailable then please select alternative size (only one egg size of each type/brand required).
Please log an example of all pack sizes available across the egg category e.g. 4 medium eggs, 6 medium eggs, 10 medium eggs, etc.
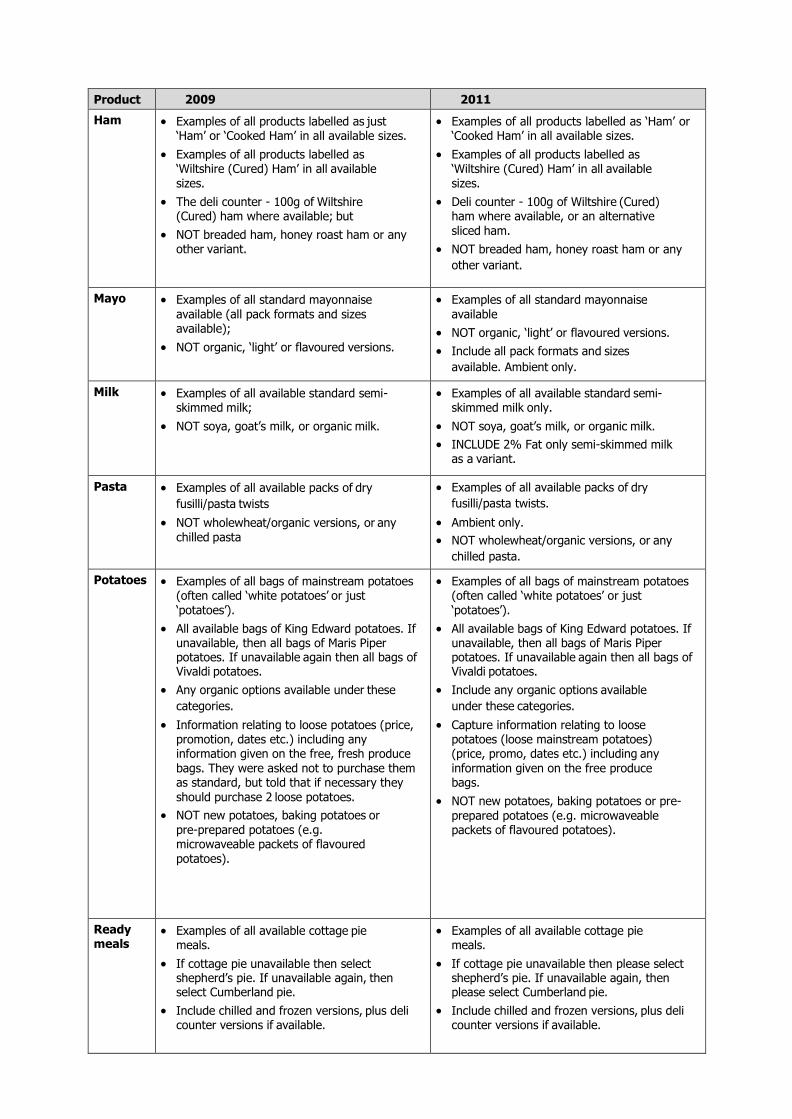
Product 2009 2011
Ham Examples of all products labelled as just ‘Ham’ or ‘Cooked Ham’ in all available sizes.
Examples of all products labelled as ‘Wiltshire (Cured) Ham’ in all available sizes.
The deli counter - 100g of Wiltshire (Cured) ham where available; but
NOT breaded ham, honey roast ham or any other variant.
Examples of all products labelled as ‘Ham’ or ‘Cooked Ham’ in all available sizes.
Examples of all products labelled as ‘Wiltshire (Cured) Ham’ in all available sizes.
Deli counter - 100g of Wiltshire (Cured) ham where available, or an alternative sliced ham.
NOT breaded ham, honey roast ham or any
other variant.
Mayo Examples of all standard mayonnaise
available (all pack formats and sizes available);
NOT organic, ‘light’ or flavoured versions.
Examples of all standard mayonnaise
available
NOT organic, ‘light’ or flavoured versions.
Include all pack formats and sizes
available. Ambient only.
Milk Examples of all available standard semi- skimmed milk;
NOT soya, goat’s milk, or organic milk.
Examples of all available standard semi- skimmed milk only.
NOT soya, goat’s milk, or organic milk.
INCLUDE 2% Fat only semi-skimmed milk as a variant.
Pasta Examples of all available packs of dry
fusilli/pasta twists
NOT wholewheat/organic versions, or any chilled pasta
Examples of all available packs of dry
fusilli/pasta twists.
Ambient only.
NOT wholewheat/organic versions, or any
chilled pasta.
Potatoes Examples of all bags of mainstream potatoes (often called ‘white potatoes’ or just ‘potatoes’).
All available bags of King Edward potatoes. If unavailable, then all bags of Maris Piper potatoes. If unavailable again then all bags of Vivaldi potatoes.
Any organic options available under these
categories.
Information relating to loose potatoes (price, promotion, dates etc.) including any information given on the free, fresh produce bags. They were asked not to purchase them as standard, but told that if necessary they should purchase 2 loose potatoes.
NOT new potatoes, baking potatoes or pre-prepared potatoes (e.g. microwaveable packets of flavoured potatoes).
Examples of all bags of mainstream potatoes (often called ‘white potatoes’ or just ‘potatoes’).
All available bags of King Edward potatoes. If unavailable, then all bags of Maris Piper potatoes. If unavailable again then all bags of Vivaldi potatoes.
Include any organic options available
under these categories.
Capture information relating to loose potatoes (loose mainstream potatoes) (price, promo, dates etc.) including any information given on the free produce bags.
NOT new potatoes, baking potatoes or pre-prepared potatoes (e.g. microwaveable packets of flavoured potatoes).
Ready meals
Examples of all available cottage pie meals.
If cottage pie unavailable then select shepherd’s pie. If unavailable again, then select Cumberland pie.
Include chilled and frozen versions, plus deli counter versions if available.
Examples of all available cottage pie meals.
If cottage pie unavailable then please select shepherd’s pie. If unavailable again, then please select Cumberland pie.
Include chilled and frozen versions, plus deli counter versions if available.
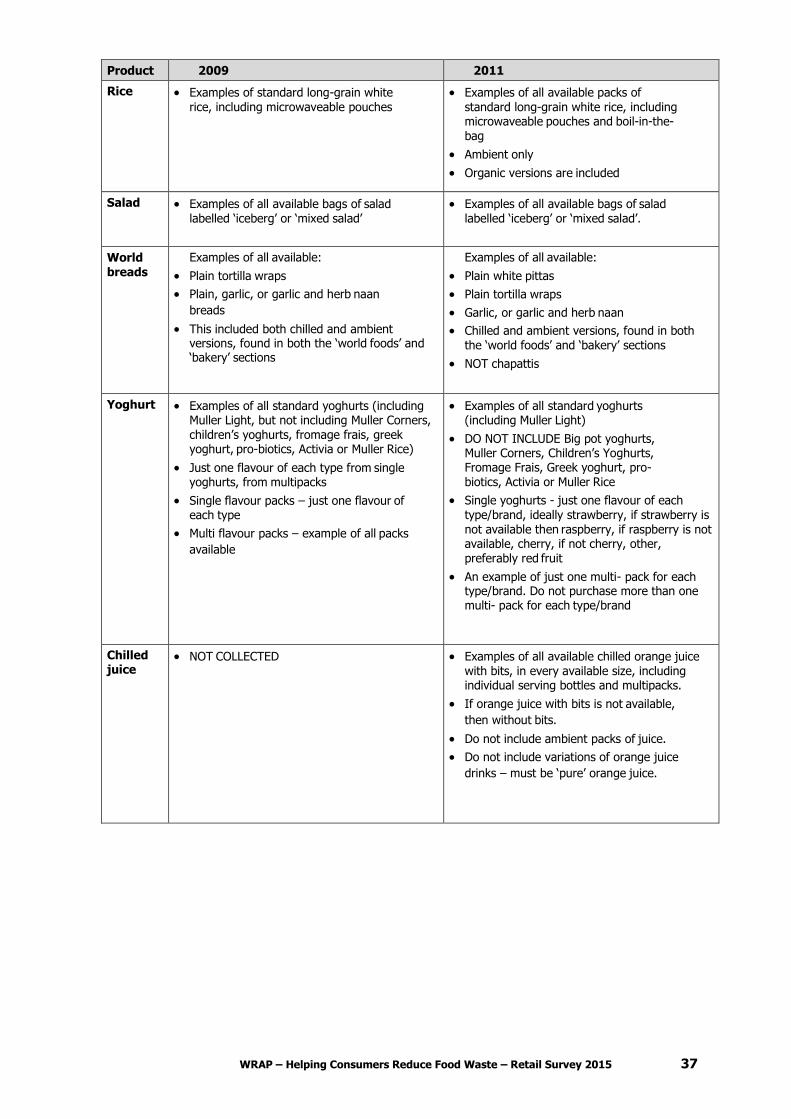
WRAP – Helping Consumers Reduce Food Waste – Retail Survey 2015 37
Product 2009 2011
Rice Examples of standard long-grain white
rice, including microwaveable pouches
Examples of all available packs of
standard long-grain white rice, including microwaveable pouches and boil-in-the-bag
Ambient only
Organic versions are included
Salad Examples of all available bags of salad labelled ‘iceberg’ or ‘mixed salad’
Examples of all available bags of salad labelled ‘iceberg’ or ‘mixed salad’.
World breads
Examples of all available:
Plain tortilla wraps
Plain, garlic, or garlic and herb naan
breads
This included both chilled and ambient versions, found in both the ‘world foods’ and ‘bakery’ sections
Examples of all available:
Plain white pittas
Plain tortilla wraps
Garlic, or garlic and herb naan
Chilled and ambient versions, found in both the ‘world foods’ and ‘bakery’ sections
NOT chapattis
Yoghurt Examples of all standard yoghurts (including Muller Light, but not including Muller Corners, children’s yoghurts, fromage frais, greek yoghurt, pro-biotics, Activia or Muller Rice)
Just one flavour of each type from single yoghurts, from multipacks
Single flavour packs – just one flavour of each type
Multi flavour packs – example of all packs
available
Examples of all standard yoghurts (including Muller Light)
DO NOT INCLUDE Big pot yoghurts, Muller Corners, Children’s Yoghurts, Fromage Frais, Greek yoghurt, pro- biotics, Activia or Muller Rice
Single yoghurts - just one flavour of each
type/brand, ideally strawberry, if strawberry is not available then raspberry, if raspberry is not available, cherry, if not cherry, other, preferably red fruit
An example of just one multi- pack for each type/brand. Do not purchase more than one multi- pack for each type/brand
Chilled juice
NOT COLLECTED Examples of all available chilled orange juice with bits, in every available size, including individual serving bottles and multipacks.
If orange juice with bits is not available,
then without bits.
Do not include ambient packs of juice.
Do not include variations of orange juice
drinks – must be ‘pure’ orange juice.