Embed Size (px)
Citation preview
Commercial Bank of QatarFinancial Results
For the year ended 31 December 2012
14 February 2013
Main Title of Presentation
Forward Looking Statements
This presentation and subsequent discussion may contain certain forward-looking statements withrespect to certain plans and current goals and expectations of Commercialbank and its associatedcompanies relating to their future financial condition and performance. These forward-lookingstatements do not relate only to historical or current facts but also represent Commercialbank’sexpectations and beliefs concerning future events. By their nature forward-looking statementsinvolve known and unknown risks and uncertainty because they relate to future events andcircumstances including a number of factors which are beyond Commercialbank’s control. As aresult, Commercialbank’s actual future results or performance may differ materially from theplans, goals and expectations expressed or implied in such statements.
Any forward-looking statements made by or on behalf of Commercialbank speak only as of thedate they are made. Commercialbank does not undertake to update forward-looking statementsto reflect any changes in Commercialbank’s expectations with regard thereto or any changes inevents, conditions or circumstances on which any such statement is based. The information,statements and opinions contained in this presentation do not constitute a public offer under anyapplicable legislation or an offer to sell or solicitation of an offer to buy any securities or financialinstruments or any advice or recommendation with respect to such securities or other financialinstruments.
Content
KEY HIGHLIGHTS
Financial Performance
Business Performance
Outlook
Key Highlights – Year Ended 31 December 2012
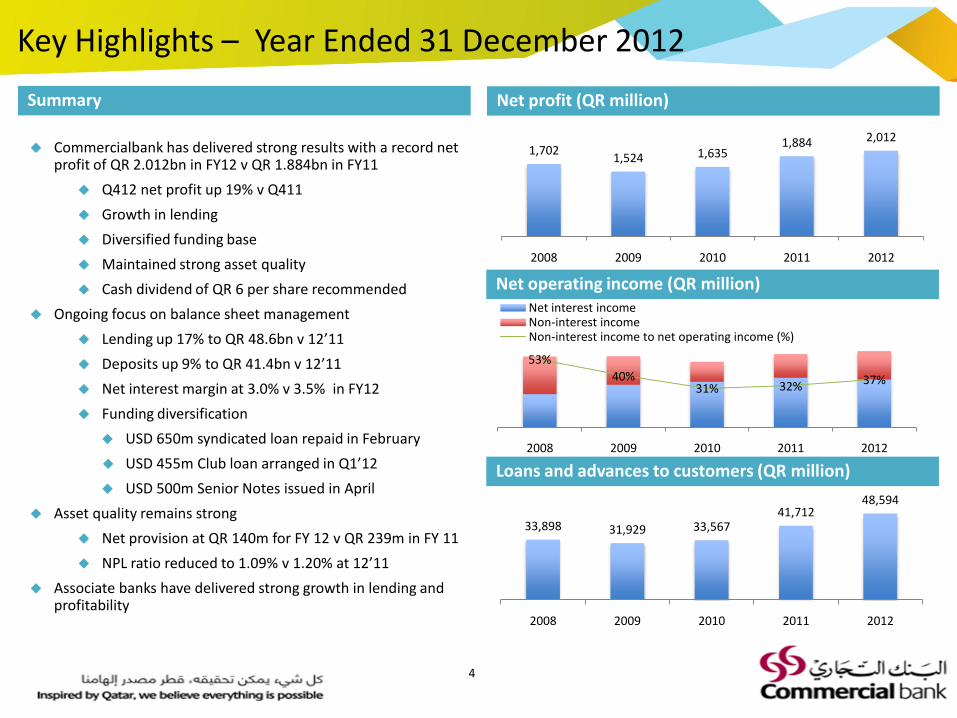
Commercialbank has delivered strong results with a record net profit of QR 2.012bn in FY12 v QR 1.884bn in FY11
Q412 net profit up 19% v Q411
Growth in lending
Diversified funding base
Maintained strong asset quality
Cash dividend of QR 6 per share recommended
Ongoing focus on balance sheet management
Lending up 17% to QR 48.6bn v 12’11
Deposits up 9% to QR 41.4bn v 12’11
Net interest margin at 3.0% v 3.5% in FY12
Funding diversification
USD 650m syndicated loan repaid in February
USD 455m Club loan arranged in Q1’12
USD 500m Senior Notes issued in April
Asset quality remains strong
Net provision at QR 140m for FY 12 v QR 239m in FY 11
NPL ratio reduced to 1.09% v 1.20% at 12’11
Associate banks have delivered strong growth in lending and profitability
Summary Net profit (QR million)
1,7021,524 1,635
1,884 2,012
2008 2009 2010 2011 2012
Net operating income (QR million)
33,898 31,929 33,56741,712
48,594
2008 2009 2010 2011 2012
53%
40%31% 32% 37%
2008 2009 2010 2011 2012
Net interest incomeNon-interest incomeNon-interest income to net operating income (%)
Loans and advances to customers (QR million)
4
Key Highlights
FINANCIAL PERFORMANCE
Business Performance
Outlook
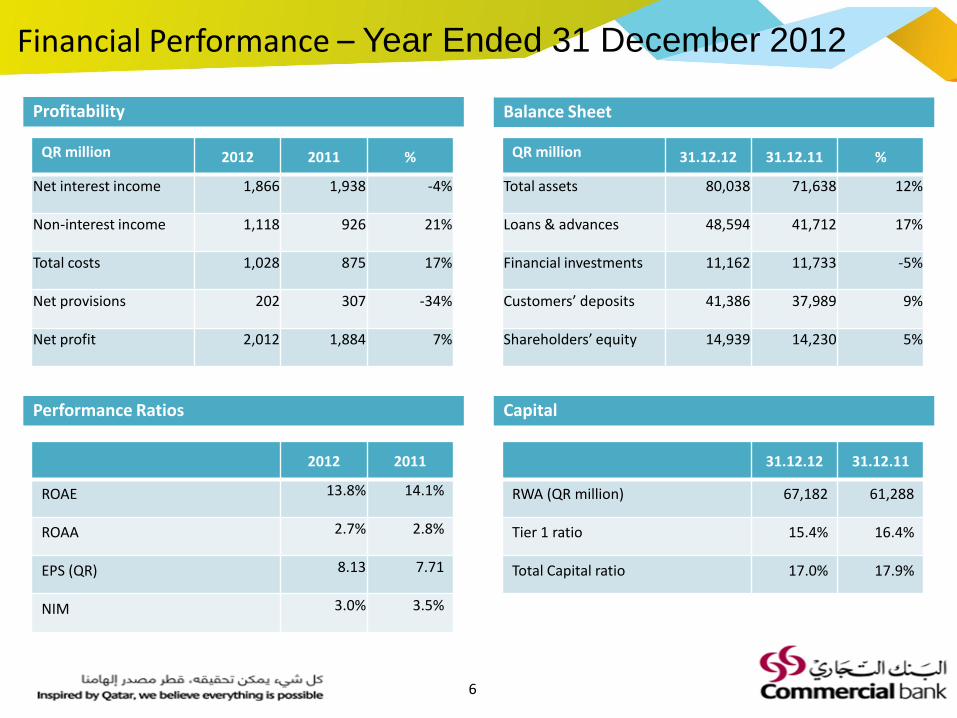
Financial Performance – Year Ended 31 December 2012
Profitability Balance Sheet
Performance Ratios Capital
QR million 2012 2011 %
Net interest income 1,866 1,938 -4%
Non-interest income 1,118 926 21%
Total costs 1,028 875 17%
Net provisions 202 307 -34%
Net profit 2,012 1,884 7%
QR million 31.12.12 31.12.11 %
Total assets 80,038 71,638 12%
Loans & advances 48,594 41,712 17%
Financial investments 11,162 11,733 -5%
Customers’ deposits 41,386 37,989 9%
Shareholders’ equity 14,939 14,230 5%
2012 2011
ROAE 13.8% 14.1%
ROAA 2.7% 2.8%
EPS (QR) 8.13 7.71
NIM 3.0% 3.5%
31.12.12 31.12.11
RWA (QR million) 67,182 61,288
Tier 1 ratio 15.4% 16.4%
Total Capital ratio 17.0% 17.9%
6
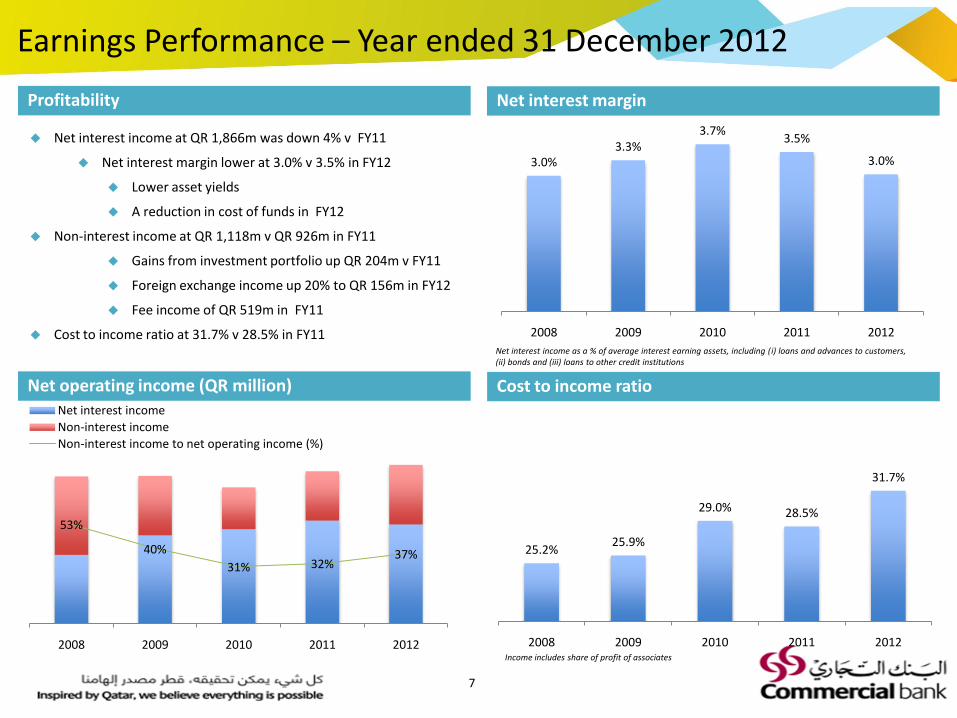
Earnings Performance – Year ended 31 December 2012
Profitability Net interest margin
Net operating income (QR million) Cost to income ratio
53%
40%
31% 32%37%
2008 2009 2010 2011 2012
Net interest income
Non-interest income
Non-interest income to net operating income (%)
25.2%25.9%
29.0% 28.5%
31.7%
2008 2009 2010 2011 2012Income includes share of profit of associates
3.0%3.3%
3.7%3.5%
3.0%
2008 2009 2010 2011 2012
Net interest income as a % of average interest earning assets, including (i) loans and advances to customers, (ii) bonds and (iii) loans to other credit institutions
Net interest income at QR 1,866m was down 4% v FY11
Net interest margin lower at 3.0% v 3.5% in FY12
Lower asset yields
A reduction in cost of funds in FY12
Non-interest income at QR 1,118m v QR 926m in FY11
Gains from investment portfolio up QR 204m v FY11
Foreign exchange income up 20% to QR 156m in FY12
Fee income of QR 519m in FY11
Cost to income ratio at 31.7% v 28.5% in FY11
7
2008 2009 2010 2011 2012
OthersInvestment in AssociatesSecuritiesLiquid AssetsLoans
3% 3%
2%
3%
2008 2009 2010 2011 2012
Due to Banks and Financial Institutions Customers' deposits
Other Borrowed Funds Other Liabilities
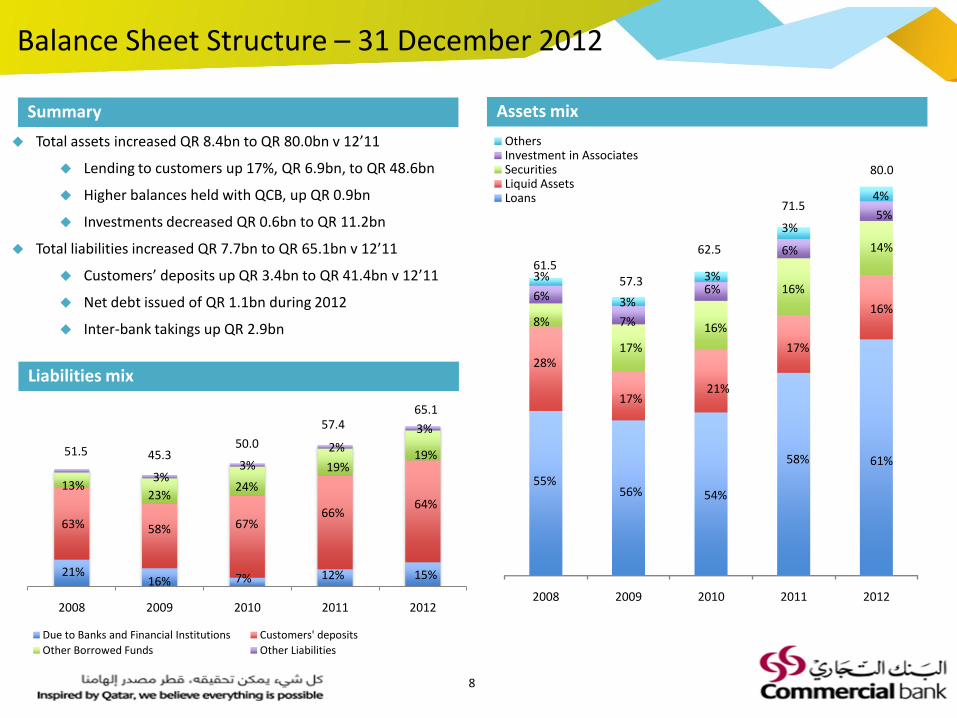
Balance Sheet Structure – 31 December 2012
Summary Assets mix
Liabilities mix
Total assets increased QR 8.4bn to QR 80.0bn v 12’11
Lending to customers up 17%, QR 6.9bn, to QR 48.6bn
Higher balances held with QCB, up QR 0.9bn
Investments decreased QR 0.6bn to QR 11.2bn
Total liabilities increased QR 7.7bn to QR 65.1bn v 12’11
Customers’ deposits up QR 3.4bn to QR 41.4bn v 12’11
Net debt issued of QR 1.1bn during 2012
Inter-bank takings up QR 2.9bn
51.5
13%
63%
21%
45.3
23%
58%
16%
50.0
24%
67%
7%
57.4
19%
66%
55%
28%
8%
6%
3%61.5
56%
17%
17%
7%
3%
57.3
54%
21%
16%6%3%
62.5
58%
17%
16%
3%
71.5
6%
8
12% 15%
64%
19% 61%
16%
14%
5%
4%
80.0
65.1
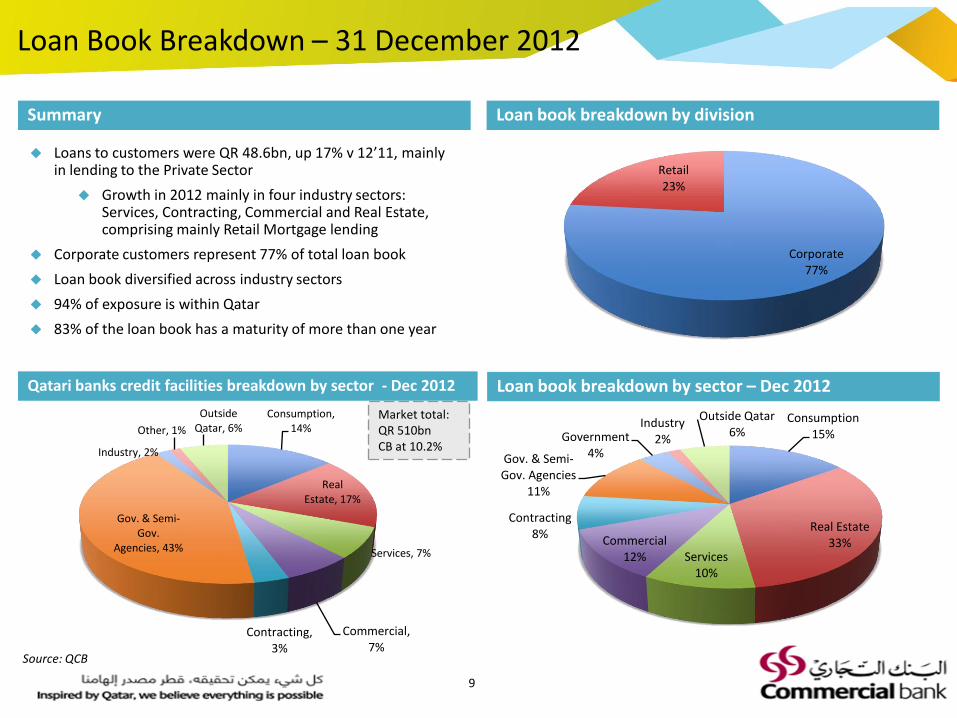
Corporate77%
Retail23%
Loan Book Breakdown – 31 December 2012
Summary Loan book breakdown by division
Qatari banks credit facilities breakdown by sector - Dec 2012 Loan book breakdown by sector – Dec 2012
Loans to customers were QR 48.6bn, up 17% v 12’11, mainly in lending to the Private Sector
Growth in 2012 mainly in four industry sectors: Services, Contracting, Commercial and Real Estate, comprising mainly Retail Mortgage lending
Corporate customers represent 77% of total loan book
Loan book diversified across industry sectors
94% of exposure is within Qatar
83% of the loan book has a maturity of more than one year
Consumption15%
Real Estate33%
Services10%
Commercial12%
Contracting8%
Gov. & Semi-Gov. Agencies
11%
Government4%
Industry2%
Outside Qatar6%
Consumption, 14%
Real Estate, 17%
Services, 7%
Commercial, 7%
Contracting, 3%
Gov. & Semi-Gov.
Agencies, 43%
Industry, 2%
Other, 1%
Outside Qatar, 6%
Market total: QR 510bn CB at 10.2%
Source: QCB
9
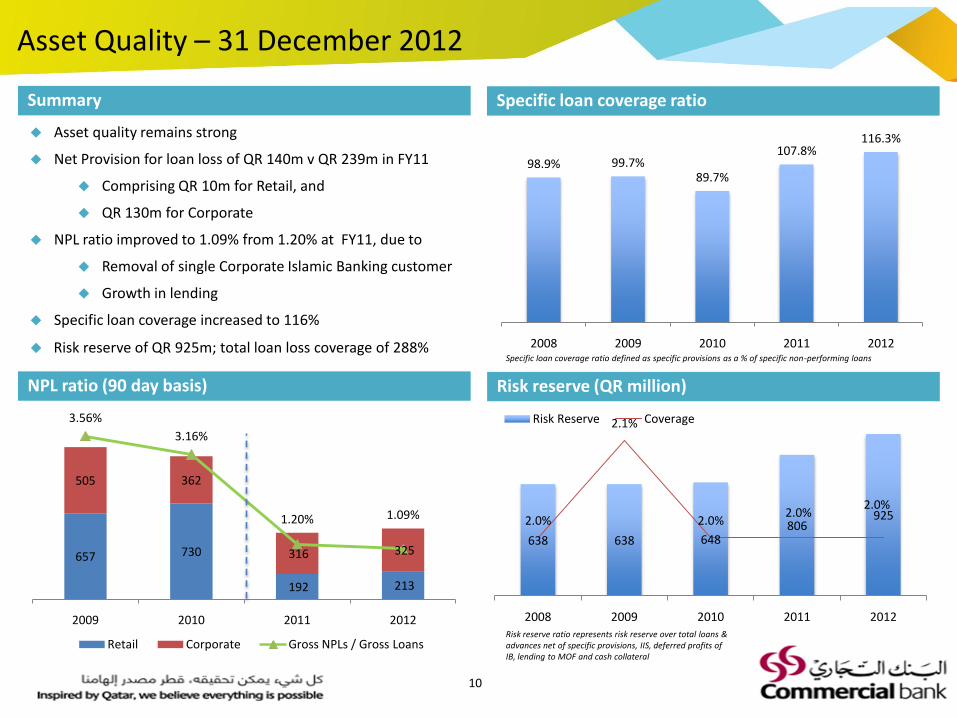
657 730
192 213
505 362
316 325
3.56%
3.16%
1.20% 1.09%
2009 2010 2011 2012
Retail Corporate Gross NPLs / Gross Loans
638 638 648806
9252.0%
2.1%
2.0%2.0%
2.0%
2008 2009 2010 2011 2012
Risk Reserve Coverage
Asset Quality – 31 December 2012
Summary Specific loan coverage ratio
NPL ratio (90 day basis) Risk reserve (QR million)
Asset quality remains strong
Net Provision for loan loss of QR 140m v QR 239m in FY11
Comprising QR 10m for Retail, and
QR 130m for Corporate
NPL ratio improved to 1.09% from 1.20% at FY11, due to
Removal of single Corporate Islamic Banking customer
Growth in lending
Specific loan coverage increased to 116%
Risk reserve of QR 925m; total loan loss coverage of 288%
98.9% 99.7%89.7%
107.8%116.3%
2008 2009 2010 2011 2012Specific loan coverage ratio defined as specific provisions as a % of specific non-performing loans
Risk reserve ratio represents risk reserve over total loans & advances net of specific provisions, IIS, deferred profits of IB, lending to MOF and cash collateral
10
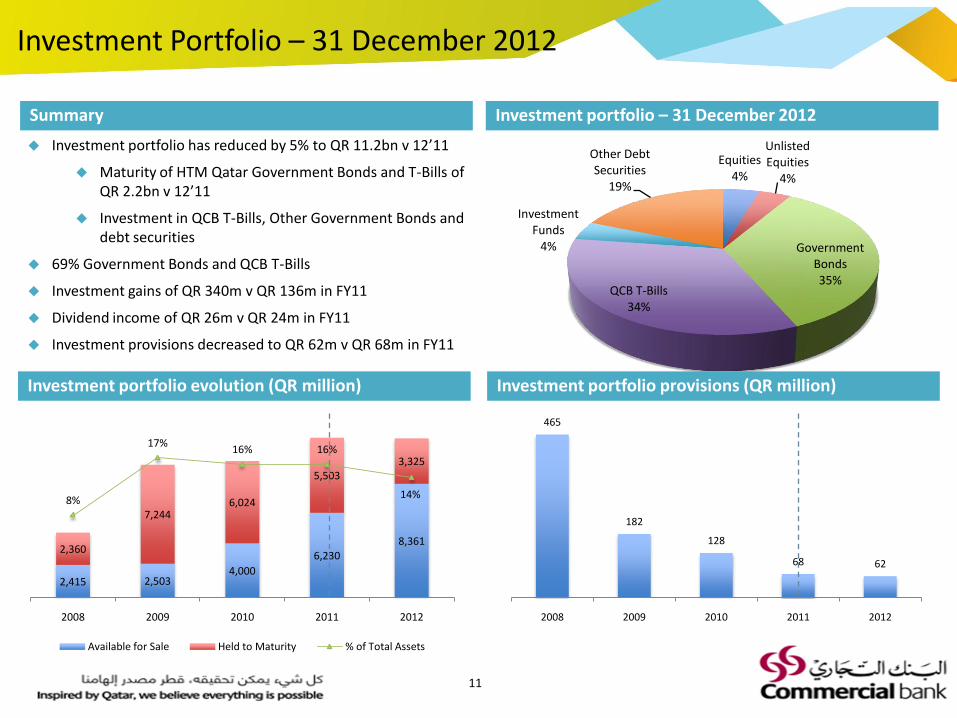
Equities4%
Unlisted Equities
4%
Government Bonds35%
QCB T-Bills34%
Investment Funds
4%
Other Debt Securities
19%
2,415 2,5034,000
6,2308,361
2,360
7,2446,024
5,5033,325
8%
17%16% 16%
14%
2008 2009 2010 2011 2012
Available for Sale Held to Maturity % of Total Assets
465
182
128
68 62
2008 2009 2010 2011 2012
Investment Portfolio – 31 December 2012
Summary Investment portfolio – 31 December 2012
Investment portfolio evolution (QR million) Investment portfolio provisions (QR million)
Investment portfolio has reduced by 5% to QR 11.2bn v 12’11
Maturity of HTM Qatar Government Bonds and T-Bills of QR 2.2bn v 12’11
Investment in QCB T-Bills, Other Government Bonds and debt securities
69% Government Bonds and QCB T-Bills
Investment gains of QR 340m v QR 136m in FY11
Dividend income of QR 26m v QR 24m in FY11
Investment provisions decreased to QR 62m v QR 68m in FY11
11
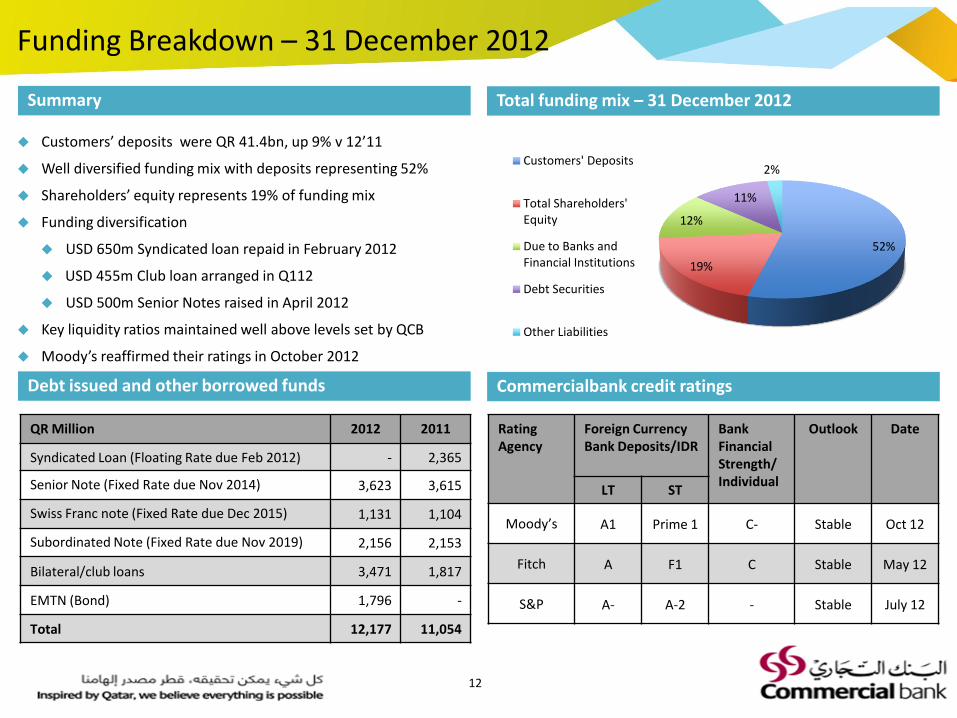
52%
19%
12%
11%
2%Customers' Deposits
Total Shareholders' Equity
Due to Banks and Financial Institutions
Debt Securities
Other Liabilities
Funding Breakdown – 31 December 2012
Summary Total funding mix – 31 December 2012
Debt issued and other borrowed funds Commercialbank credit ratings
Customers’ deposits were QR 41.4bn, up 9% v 12’11
Well diversified funding mix with deposits representing 52%
Shareholders’ equity represents 19% of funding mix
Funding diversification
USD 650m Syndicated loan repaid in February 2012
USD 455m Club loan arranged in Q112
USD 500m Senior Notes raised in April 2012
Key liquidity ratios maintained well above levels set by QCB
Moody’s reaffirmed their ratings in October 2012
QR Million 2012 2011
Syndicated Loan (Floating Rate due Feb 2012) - 2,365
Senior Note (Fixed Rate due Nov 2014) 3,623 3,615
Swiss Franc note (Fixed Rate due Dec 2015) 1,131 1,104
Subordinated Note (Fixed Rate due Nov 2019) 2,156 2,153
Bilateral/club loans 3,471 1,817
EMTN (Bond) 1,796 -
Total 12,177 11,054
Rating Agency
Foreign Currency Bank Deposits/IDR
Bank Financial Strength/Individual
Outlook Date
LT ST
Moody’s A1 Prime 1 C Stable Oct 12
Fitch A F1 C Stable May 12
S&P A- A-2 - Stable July 12
12
Corporate49%
Individuals28%
Gov. & Semi-Gov. Agencies
15%
Government 8%
2008 2009 2010 2011 2012
Time Deposits Savings Deposits Demand & Call Deposits
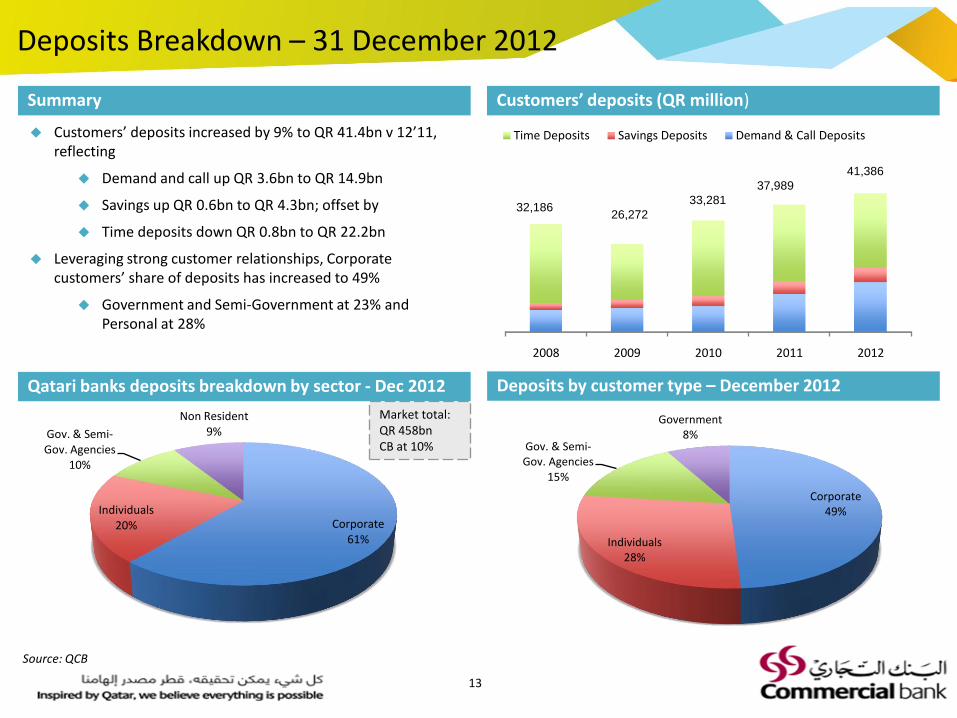
Deposits Breakdown – 31 December 2012
Summary Customers’ deposits (QR million)
Qatari banks deposits breakdown by sector - Dec 2012 Deposits by customer type – December 2012
Customers’ deposits increased by 9% to QR 41.4bn v 12’11, reflecting
Demand and call up QR 3.6bn to QR 14.9bn
Savings up QR 0.6bn to QR 4.3bn; offset by
Time deposits down QR 0.8bn to QR 22.2bn
Leveraging strong customer relationships, Corporate customers’ share of deposits has increased to 49%
Government and Semi-Government at 23% and Personal at 28%
Corporate61%
Individuals20%
Gov. & Semi-Gov. Agencies
10%
Non Resident9%
Market total: QR 458bn CB at 10%
32,18626,272
33,281
37,989
Source: QCB
13
41,386
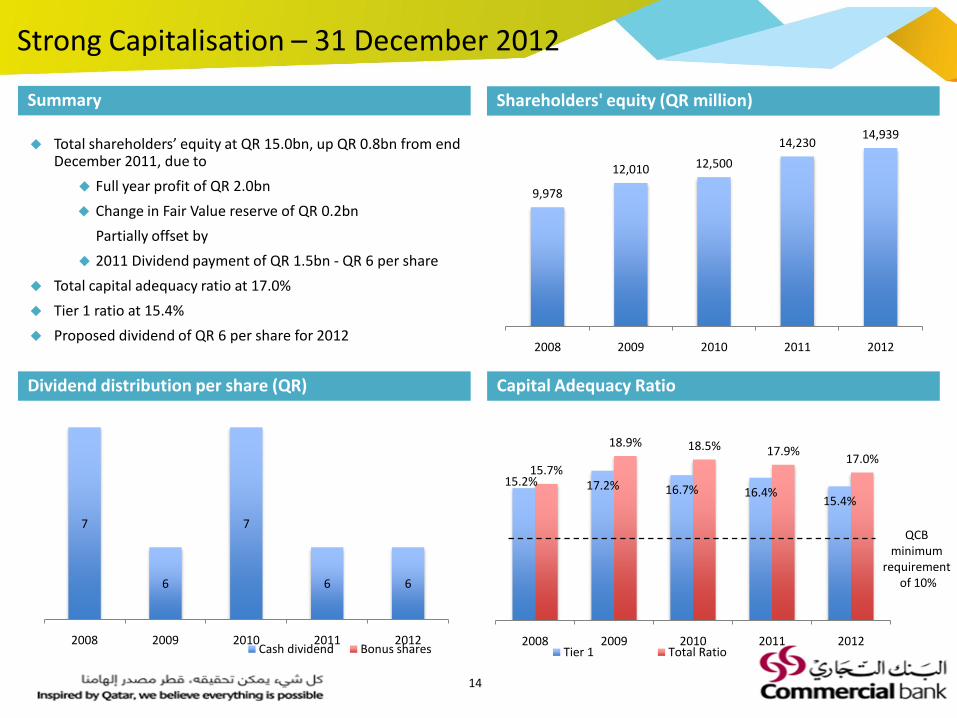
15.2% 17.2% 16.7% 16.4%15.4%
15.7%
18.9% 18.5% 17.9%17.0%
2008 2009 2010 2011 2012Tier 1 Total Ratio
9,978
12,010 12,500
14,23014,939
2008 2009 2010 2011 2012
7
6
7
6 6
2008 2009 2010 2011 2012Cash dividend Bonus shares
Strong Capitalisation – 31 December 2012
Summary Shareholders' equity (QR million)
Dividend distribution per share (QR) Capital Adequacy Ratio
Total shareholders’ equity at QR 15.0bn, up QR 0.8bn from end December 2011, due to
Full year profit of QR 2.0bn
Change in Fair Value reserve of QR 0.2bn
Partially offset by
2011 Dividend payment of QR 1.5bn - QR 6 per share
Total capital adequacy ratio at 17.0%
Tier 1 ratio at 15.4%
Proposed dividend of QR 6 per share for 2012
QCB minimum
requirementof 10%
14
Key Highlights
Financial Performance
BUSINESS PERFORMANCE
Outlook
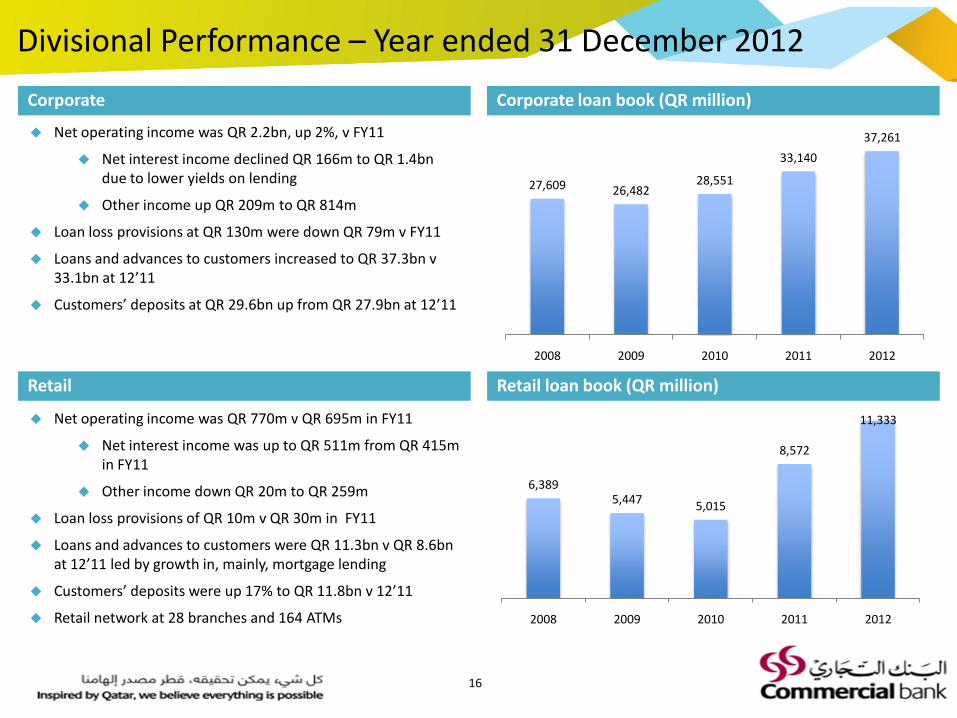
6,3895,447
5,015
8,572
11,333
2008 2009 2010 2011 2012
27,609 26,48228,551
33,140
37,261
2008 2009 2010 2011 2012
Divisional Performance – Year ended 31 December 2012
Corporate Corporate loan book (QR million)
Retail Retail loan book (QR million)
Net operating income was QR 2.2bn, up 2%, v FY11
Net interest income declined QR 166m to QR 1.4bn due to lower yields on lending
Other income up QR 209m to QR 814m
Loan loss provisions at QR 130m were down QR 79m v FY11
Loans and advances to customers increased to QR 37.3bn v 33.1bn at 12’11
Customers’ deposits at QR 29.6bn up from QR 27.9bn at 12’11
Net operating income was QR 770m v QR 695m in FY11
Net interest income was up to QR 511m from QR 415m in FY11
Other income down QR 20m to QR 259m
Loan loss provisions of QR 10m v QR 30m in FY11
Loans and advances to customers were QR 11.3bn v QR 8.6bn at 12’11 led by growth in, mainly, mortgage lending
Customers’ deposits were up 17% to QR 11.8bn v 12’11
Retail network at 28 branches and 164 ATMs
16
8882 78
92 99
45
2127
3441
2008 2009 2010 2011 2012
Operating Income
Profit
419471 490
581
765
250 281 308 330410
2008 2009 2010 2011 2012
Operating Income
Profit
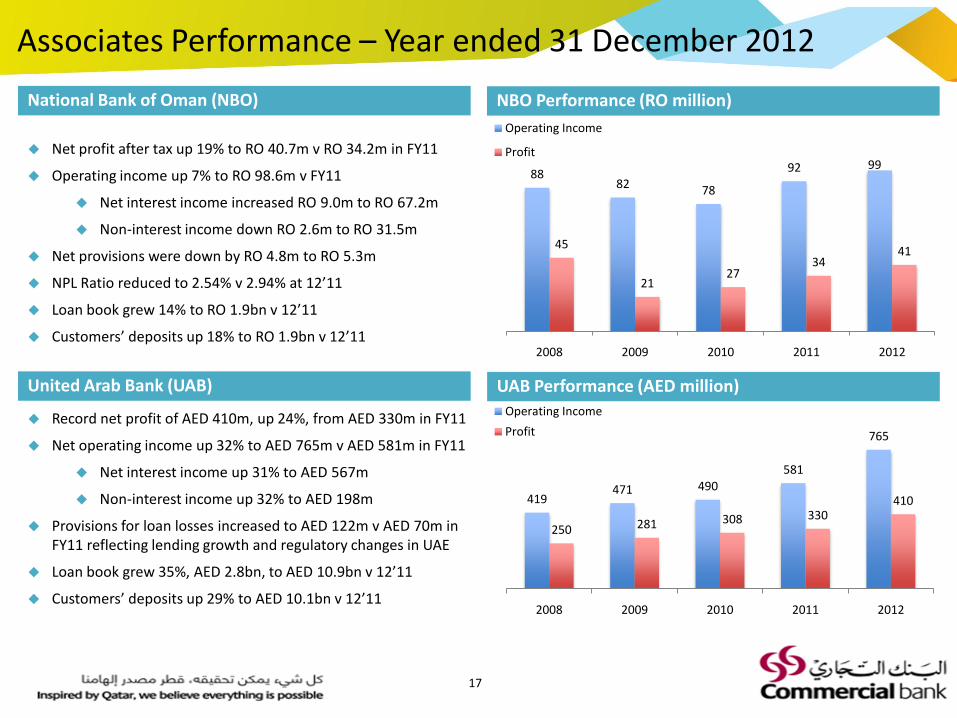
Associates Performance – Year ended 31 December 2012
National Bank of Oman (NBO) NBO Performance (RO million)
United Arab Bank (UAB) UAB Performance (AED million)
Net profit after tax up 19% to RO 40.7m v RO 34.2m in FY11
Operating income up 7% to RO 98.6m v FY11
Net interest income increased RO 9.0m to RO 67.2m
Non-interest income down RO 2.6m to RO 31.5m
Net provisions were down by RO 4.8m to RO 5.3m
NPL Ratio reduced to 2.54% v 2.94% at 12’11
Loan book grew 14% to RO 1.9bn v 12’11
Customers’ deposits up 18% to RO 1.9bn v 12’11
Record net profit of AED 410m, up 24%, from AED 330m in FY11
Net operating income up 32% to AED 765m v AED 581m in FY11
Net interest income up 31% to AED 567m
Non-interest income up 32% to AED 198m
Provisions for loan losses increased to AED 122m v AED 70m in FY11 reflecting lending growth and regulatory changes in UAE
Loan book grew 35%, AED 2.8bn, to AED 10.9bn v 12’11
Customers’ deposits up 29% to AED 10.1bn v 12’11
17
Key Highlights
Financial Performance
Business Performance
OUTLOOK
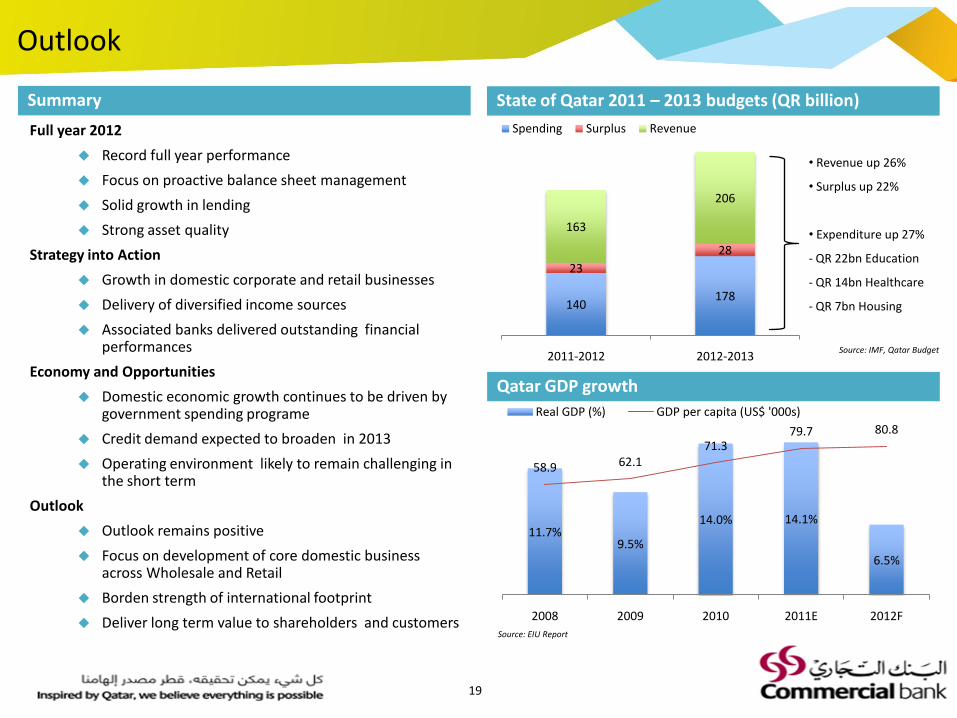
Outlook
Summary State of Qatar 2011 – 2013 budgets (QR billion)
Qatar GDP growth
Full year 2012
Record full year performance
Focus on proactive balance sheet management
Solid growth in lending
Strong asset quality
Strategy into Action
Growth in domestic corporate and retail businesses
Delivery of diversified income sources
Associated banks delivered outstanding financial performances
Economy and Opportunities
Domestic economic growth continues to be driven by government spending programe
Credit demand expected to broaden in 2013
Operating environment likely to remain challenging in the short term
Outlook
Outlook remains positive
Focus on development of core domestic business across Wholesale and Retail
Borden strength of international footprint
Deliver long term value to shareholders and customersSource: EIU Report
19
140178
23
28
163
206
2011-2012 2012-2013
Spending Surplus Revenue
• Revenue up 26%
• Surplus up 22%
• Expenditure up 27%
- QR 22bn Education
- QR 14bn Healthcare
- QR 7bn Housing
Source: IMF, Qatar Budget
11.7%9.5%
14.0% 14.1%
6.5%
58.9 62.171.3
79.7 80.8
2008 2009 2010 2011E 2012F
Real GDP (%) GDP per capita (US$ '000s)
Thank you