Embed Size (px)
Citation preview

Results of the St. Kitts & Nevis Protected Area Ecological GAP Workshops
November 13-14, 2008 & June 22 & 23, 2009
Overview
Experts from the Nature Conservancy (TNC), a US-based non-profit environmental
organization, visited St Kitts & Nevis during the weeks of November 13-14, 2008 and
June 22 & 23, 2009 to assist the Department of Planning & Natural resources and the
Organization of Eastern Caribbean States (OECS) conduct a protected area ecological
gap assessment. Results of these workshops are being used to determine where and how
to scientifically strengthen the design of St. Kitts & Nevis’s protected area network in
order to fully represent the wide variety of biodiversity that exists on the islands and
surrounding marine waters.
The first workshop was geared towards identifying the terrestrial, freshwater, and marine
key species and ecological systems (also called targets) that need protection, setting
conservation goals for each target, and documenting the associated threats to the targets.
During this workshop, several mapping gaps were identified and a plan was outlined to
fill these data gaps. Notes from this meeting can be found in Appendix I.
Following the first workshop, TNC worked closely with the Department of Planning,
Natural Resources, and the Environment to manually digitize many of the missing targets
and refine those targets that needed further validation using the 2004 and 2007 IKONOS
imagery.
At the second workshop, local experts reviewed the spatial distribution for each of the
target layers, paying particular attention to the new targets that had been mapped using
the imagery. Prior to the meeting it was difficult to obtain significant information
pertaining to Nevis. Great care was taken in the workshop to review each Nevis threat
and target and to make necessary changes to the mapped files as needed. Notes from this
meeting can be found in Appendix I.
Participants were also given an introduction to the software Marxan, freely available
software created by the University of Queensland in Australia (Ball and Possingham,
2000). This software is widely adopted around the world as a tool for spatially optimizing
conservation goals and requires the input of conservation targets, goals and
corresponding threats. The Marxan software is able to arrive at an optimal conservation
solution that efficiently meets all or most target goals. These areas are often times refined
by manual inclusion and/or exclusion of areas based on the likelihood that they can be
adopted into a government approved protected area plan.
After completing the necessary edits to threats and targets, workshop participants were
presented with the results of a Marxan run using their target data, goals and threats. After
reviewing the analysis outputs participants felt that additional target information needed
to be collected and included in the run before significant work to refine the Marxan
analysis could be done.

The final outcome of the second workshop produced a series of maps that show the
spatial distribution of marine and terrestrial targets and threats. These maps and can be
found in Appendix I. Following the second workshop, the additional targets requested by
the workshop participants was collected and included in the Marxan analysis. Two
results were chosen for their ability to best meet conservation target goals. These two
analysis runs produced a series of maps that show the optimal spatial configuration of a
protected area network according to the Marxan software. These maps will need to be
reviewed and refined by the Systems Plan consultants and local experts for incorporation
into the Systems Plan.
This exercise was undertaken as part of the revision of the System of Protected Areas for
St Kitts & Nevis, which is ongoing. The Systems Plan is currently being created with
support from the OECS Protected Areas and Associated Livelihoods (OPAAL) Project.
Information from this National Ecological Gap Assessment will be used by the Systems
Plan consultants, Ecoengineering Caribbean Limited, when they create their final
Systems Plan recommendation.
Identification of Targets and Threats
One key step in performing an ecological gap assessment is to determine the conservation
targets for the country and the present and potential threats to these targets. Conservation
targets are defined as the elements of biodiversity and related cultural features that will be
the focus of conservation and management planning efforts. These may be marine or
terrestrial, and can include:
• broad habitats and ecosystems;
• important areas for target species;
• rare or imperiled communities;
• places of cultural significance;
• threatened species;
• endemic and flagship species; and
• species of cultural significance, or economic importance.
Threats to the conservation targets are also included in undertaking a gap assessment, and
may be natural (natural disasters, climate change, etc) or human-induced (extractive
activities, unsustainable land practices, urban development, pollution, etc). In an effort to
ensure widespread consultation and participation in the review process, TNC sought input
from a large number of natural resource management agencies, local environmental
groups, and interested individuals in determining the conservation targets and threats over
the course of the two workshops and subsequent one-on-one meetings/interviews.
A distinction was made between coarse-filter targets (habitats, ecosystems, etc) and fine-
filter targets (e.g. species). In some cases, critical species were listed as potential
conservation targets. However, either due to lack of supporting GIS data, or lack of
information on specific habitats, they were not selected as conservation targets. In other
cases, although the species were deemed significant, the inability to map specific

locations due to widespread occurrences resulted in them not being included on the target
list.
In addition, participants at each workshop assisted in verifying the quality and accuracy
of data to be used in modeling the ecological gaps, and consequently creating a network
of protected areas for effective biodiversity conservation. Where GIS data was
unavailable, participants used institutional knowledge to manually mark targets on a map
of Saint Lucia. Discussion was also held on potential sources for additions to, or
verification of the existing data. Once conservation targets were agreed and finalized, a
conservation goal was assigned, so that a draft model of the protected area system can be
produced.
Target Descriptions Table 1 is a list of conservation target that were identified as important to protect in St.
Kitts & Nevis. This list reflects edits that were made subsequent to the first meeting and
with feedback from the second meeting. Local experts set conservation goals for each
target and efforts were made to spatially map each target in the most efficient and
accurate way possible in order to be used in the Marxan software. Maps all of each target
can be found in Appendix II.
Table 1. Terrestrial and Marine targets for the St. Kitts & Nevis National Ecological Gap
Assessment. N/A indicates data not relevant or available at time of the analysis.
Terrestrial
Percentage Goal Data Included in
Marxan Analysis Target
SKB NVS SKB NVS
Notes on Data Source
Intake springs 100 100 yes yes
For NVS used the intake springs file only. Did not
use the springs file. For SKB used Department of
Physical Planning "Intake Springs" file.
Turtle nesting 60 60 yes yes
Used combination of data from TNC. Verified
with local experts. Removed some sites from TNC
file and turned point data into line data to cover
entire beaches.
Salt water ponds 50 N/A yes N/A File from Department of Physical Planning.
Removed fresh water ponds.
Freshwater ponds 100 N/A yes N/A Located by experts. Digitized by TNC.
Brackish ponds N/A 90 N/A yes Used NV_Natres07 and clipped "ponds"
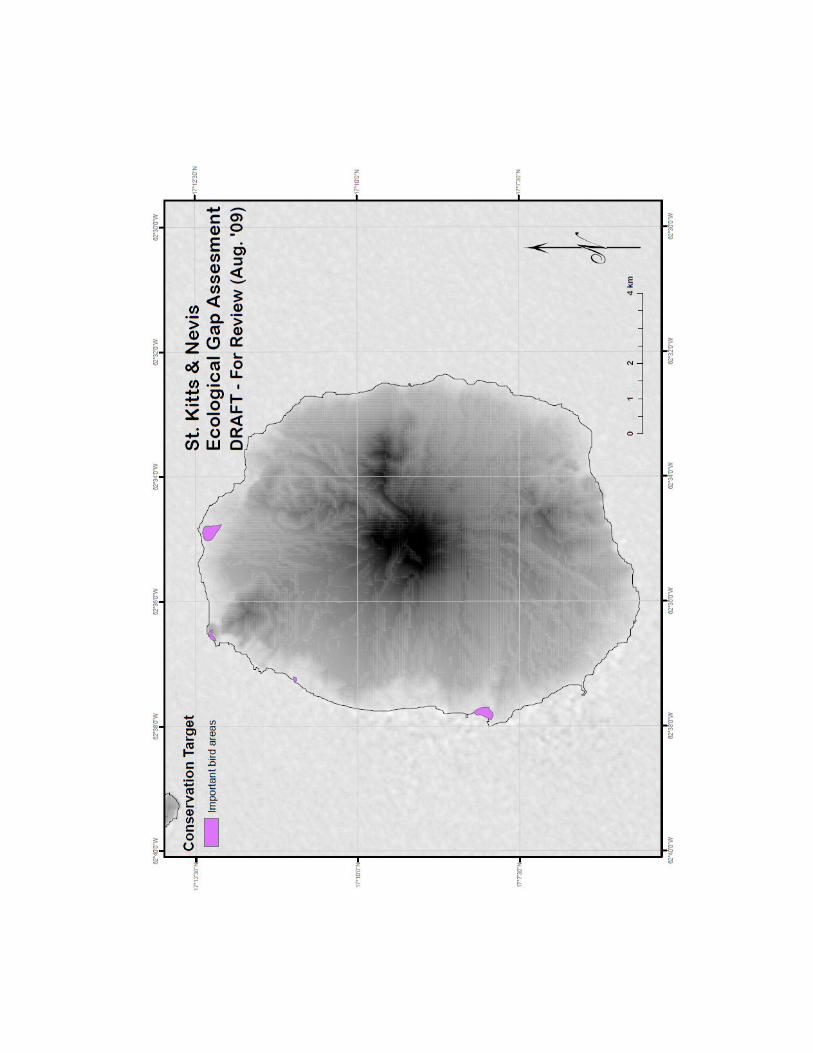
Bird nesting sites 50 60 yes yes Located by local experts & digitized or digitized at
June 09 meeting.
Aquifers 50 50 yes no SKB digitized by Department of Physical Planning.
Data not available for Nevis.
Drought deciduous
open woodland 10 25 yes yes Land cover*
Deciduous
evergreen coastal & 20 25 yes yes Land cover*

mixed forest
succulent
Steep and montane
non forest
vegetation
100 100 yes yes Land cover*
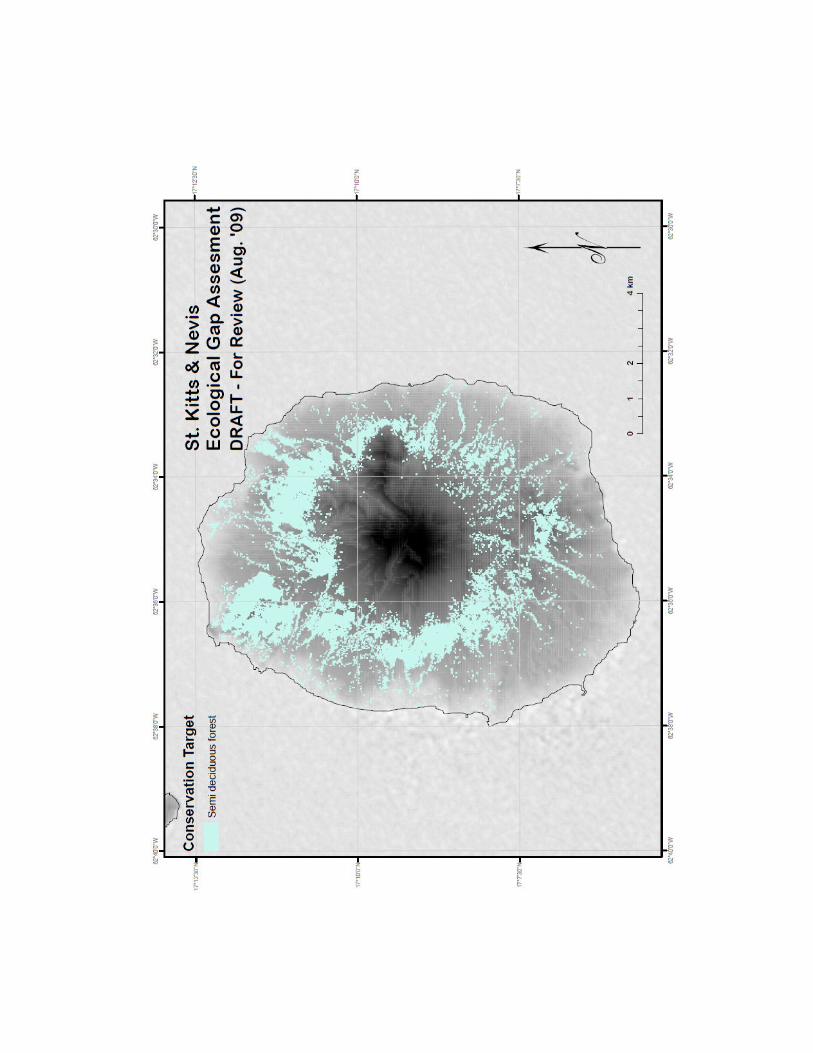
Semi-deciduous
forest (includes
semi-evergreen
forest)
20 20 yes yes Land cover*
Evergreen forest w/
coconut palms 10 10 yes yes Land cover*
Seasonal evergreen
forests 50 50 yes yes Land cover*
Emergent wetland 100 100 N/A yes Land cover*
Elfin and Sierra palm
cloud forest 100 100 yes yes Land cover*
Sierra palm,
transitional an tall
cloud forest
100 100 yes yes Land cover*
Evergreen forest
(including Sierra
palm forest)
100 100 yes yes Land cover*
Seasonally flooded
savannahs and
woodlands
N/A 100 N/A yes Land cover*
Rain fall greater than
75 inches/year 100 100 yes no
digitized using rainfall contours. Creating polygon
from everything greater than the 75" rainfall
contour. Data not available for Nevis.
Marine
Percentage Goal Data Included in
Marxan Analysis Target
SKB NVS SKB NVS
Notes on Data Source
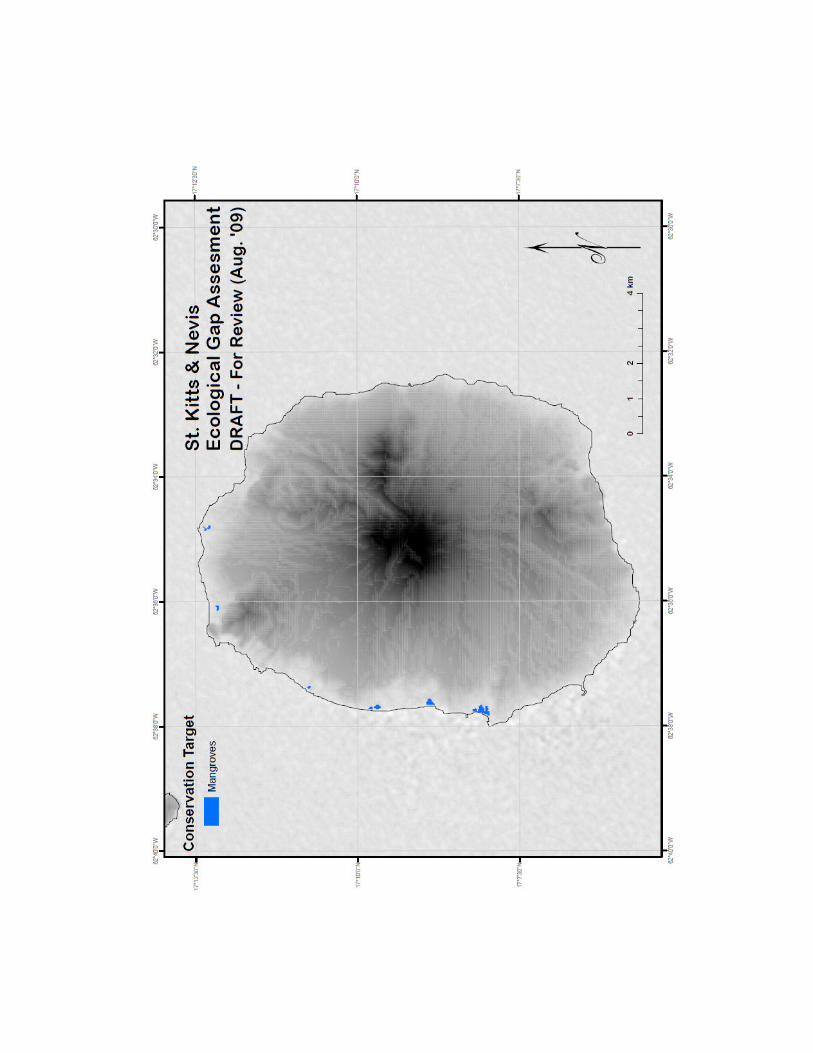
Mangroves 100 100 yes yes taken from the land cover* data set for NVS and
the TNC data set for SKB---then merged together
Fringe coral reefs 90 90 yes yes
NV taken from NV_CRI_07 "coral" attribute.
Added KN_reefFlat.shp and KN_NonReefFlat.shp.
SKB used merged/dissolved KN_reefFlat and
KNNonReefFlat.

SPAG’s/nursery
(Nags Head) 100 N/A yes N/A Digitized with Department of Physical Planning.
Lobster spawning/
migratory route 60 60 yes yes Digitized with Department of Physical Planning
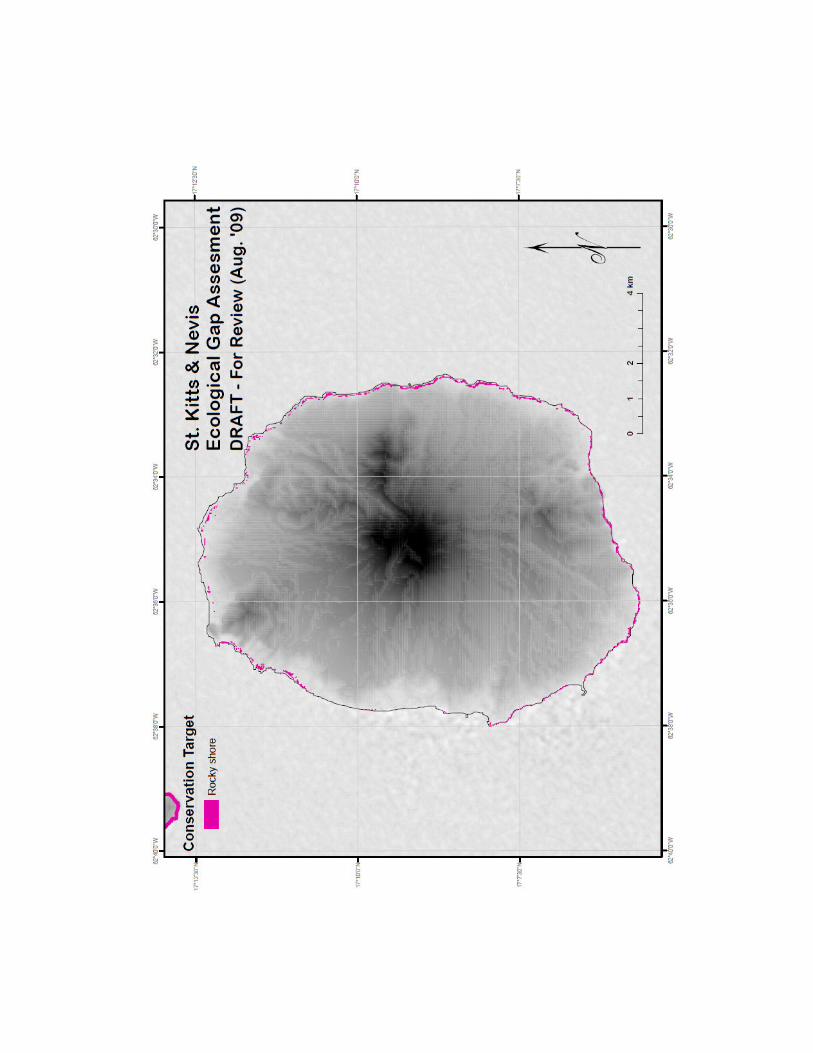
Rocky shore 40 70 yes yes
SKB from SK_COASTYPE_01--used the "coble",
"rocks", and "cliff& rocks" attributes. Dissolved
file and generated a 50meter buffer for
SKB_rocky_shores. NV-used the
"coastal_sand_rocky_shore_or_bare_ground.shp"
file from land cover* file---erased the
"NV_Beaches.shp" file (obtained from Planning).
Sea moss 50 80 yes yes Digitized with Department of Physical Planning for
SKB.
Thermal sea vents 50 80 yes yes SKB-digitized by Department of Physical Planning.
Monkey Shoal N/A 100 N/A yes Digitized from admiral maps.
Southern Bank N/A 50 N/A yes Digitized from admiral maps.
*Land cover data developed by the International Institute of Tropical Forestry, USDA, Forest Service in 2005, as
part of a joint project between USFS, USGS - Center for EROS, TNC, NASA, CSU - CEMML, USAID - Caribbean
Program Office, Ministry of Agriculture, Fisheries, Cooperatives, Land and Housing, St. Kitts and Nevis, Nevis Island
Department of Agriculture, Department of Physical Planning, Environment and Natural Resources, Physical
Planning and Environment - Nevis and Physical Planning Division - St. Kitts, and Brimstone Hill National Park.
Landsat imagery provided by NASA - GOFC, USGS - Center for EROS, and IITF.
Threat Model
GIS-based models called Environmental Risk Surfaces (ERS) were developed using
mapped risk elements (e.g. human activities) to explore the overlap between risk
elements and biodiversity features. A risk element can be defined as anything identified
by experts as having a negative influence on the health of conservation targets, such as
critical habitats or key species. The ERS models were designed to spatially identify
habitats of low (intact) and high (threatened) risk areas, based on the spatial interaction of
underlying risk elements, and serve as input cost models for Marxan software (Ball and
Possingham, 2000). In this way, an ERS model can be used to focus conservation site
selection by steering selection away from high-risk areas where the abatement of
pressures on biodiversity seems less likely. The composite or disaggregated individual
surfaces can also be used to locate the specific environmental risks on the landscape that
may be degrading the viability of particular conservation targets.
The Environmental Risk Surface tool is a freely available GIS-based tool developed in
Visual Basic (ArcObjects) within ArcGIS 9.2, GIS software (ESRI, Redlands, CA)
(Schill and Raber, 2006; download at http://www.gispatools.org). The first step in
creating an ERS model requires assembling a suite of the best available GIS data that
spatially represent the risk elements that are most likely to impact the health of terrestrial,
freshwater, and/or marine habitat or species. All risk element features must be spatially
mapped on the landscape as points, lines, or polygons using expert opinion to create or
obtain the most accurate GIS data layers available. Human-induced landscape features
such as agricultural and urbanized areas, tourism zones and hotels, roads, industrial areas,
and surrogate indicators for human impacts such as population density are examples of
risk elements that can be used in the creation of an ERS. The ERS models used for the St.
Kitts ecological gap assessment were designed based on available input data and expert
assessments for each risk element. The combination of risk elements and their respective
intensity values and influence distances varies for each realm surface, thus accounting for
the different ways that human activities impact biodiversity in each of the habitat realms
(McPherson et al, 2008)
The intensity value represents the relative level of threat that the risk element poses to the
targeted habitat or species. Separate intensity values were assigned to each risk element
to capture the different relative levels of impact on different biodiversity targets. The
intensity scores do not represent an absolute measure of the impact of risk elements on
the biodiversity feature but rather the relative degree to which the biodiversity target in
question is more likely to survive in one place over another based on the presence of one
risk element in comparison to another. After the intensity values have been assigned, the
next step is to determine the influence distance of each risk element. The influence
distance is the spatial extent or footprint of the activity on the landscape and represents
the maximum distance at which the feature has a negative impact on biodiversity. The
influence distance is used to attribute an intensity value to risk elements outside of the
immediate area of direct impact. As the distance of the buffer increases away from the
center of the area (point, line or polygon) where the risk element is taking place, the
intensity values of the cells within the buffers diminish progressively (distance decay)
and the risk to the habitat is gradually lessened until the limit of the influence distance
after which the feature is no longer considered to pose a risk to a given target.
Risk element tables were developed to indicate the intensity and influence distance of
each risk element as assigned independently to each class and subclass based on the
perceived threat level to terrestrial, freshwater or marine biodiversity (Table 2). These
values were incorporated into the GIS coverage tables of each risk element for use in the
development of the ERS. The final threat model can be seen in Appendix III and

demonstrates how individual polygon, line, and point risk elements translate into
modeled risk surfaces with varying intensity values over their influence distances. The
red areas represent higher combined risk and the blue areas, lower risk as modeled by the
mapped risk element features. For a more detailed explanation on the creation of ERS
models, please see McPherson et al, 2008.
Table 2. List of Risk Elements used in the St Kitts & Nevis Environmental Risk Surface Model and
Associated Intensity and Influence Distances. N/A indicates data was not applicable or not available
at the time of the analysis.
Data
available
or used in
final
analysis
Human Activity Terrestrial
Intensity
Terrestrial
Distance
(meters)
Marine
Intensity
Marine
Distance
(meters)
Data Sources
SKB NVS
ATV Trails 60 100 80 100 yes N/A
Rail Road 10 25 0 0 yes N/A
Paved Roads 70 100 60 100 yes yes
Unpaved roads 80 150 70 100
shp file from
Department of Physical
Planning N/A yes
Hospital Grey Water
Point Source 0 0 95 600
Digitized with
Department of Physical
Planning for SK. Still
need NV.
yes N/A
Hotel/Resort:
Tourism Hotel rooms
1-6
11 100 11 50 yes yes
Hotel/Resort:
Tourism Hotel rooms
7-14
25 500 25 300 yes yes
Hotel/Resort:
Tourism Hotel rooms
15-24
27 500 27 300 yes yes
Hotel/Resort:
Tourism Hotel rooms
25-49
35 500 35 500 yes yes
Hotel/Resort:
Tourism Hotel rooms
50-149
40 500 60 1600 yes yes
Hotel/Resort:
Tourism Hotel rooms
150+
40 500 80 1600
Final layer was modified
to include room data
from the TNC shapefile,
verified against the
Tourism Development
Corporation’s record
keeping and a list of
hotel names used by the
Physical Planning
Department.
yes yes
Point Source Siltation
(ghaut outlets) 40 50 80 1600
SKB information
gathered at November
2008 GAP meeting then
digitized. NVS points
digitized at June 09
meeting.
yes yes

Squatters 50 500 50 50
shp file from
Department of Physical
Planning
yes N/A
Airport 100 1000 60 1600
Digitized with
Department of Physical
Planning
yes yes
Anchoring 0 0 75 20
Digitized with
Department of Physical
Planning for SKB—
Digitized at June 09
meeting for NVS
yes yes
Boat Yards 90 500 90 1000
Digitized with
Department of Physical
Planning
yes N/A
Marinas 35 300 90 100
Digitized with
Department of Physical
Planning for SKB
yes N/A
Sea Ports
(tourists) 80 800 90 3200
Data obtained from
various planning
department data files,
which were verified and
amended at June 09
meeting.
yes N/A
Industrial Port
(commercial) 90 800 60 3200
Data obtained from
various planning
department data files,
which were verified and
amended at June 09
meeting.
yes yes
Overnight Boating 0 0 30 5
Digitized at June 09
meeting. Same file as
anchoring.
yes yes
Docks & Piers 60 100 70 1600
Digitized & verified at
June 09 meeting. Groins
were not included.
yes yes
Jetties 25 15 50 150
Digitized with
Department of Physical
Planning for SKB-- Jetties
built on pillars were left
out. Only solid jetties
were included. With this
definition, Nevis did not
have any jetties.
yes yes
Golf Course 40 50 40 100
Nevis is 50 terrestrial-
distance- Digitized from
imagery for both SKB &
NVS. Expert verification.
yes yes
Landfills 100 800 30 30
Digitized with
Department of Physical
Planning for SKB—NVS
Digitized at June 09
meeting
yes yes
Livestock Facility 90 50 10 25
Nevis: same as a marina
distance//intensity=80--
Digitized SKB file with
Department of Physical
Planning for SK. NVS
was digitized at the June
09 meeting.
yes yes
Power Plant 100 500 0 0
SKB shp file from
Department of Physical
Planning. NVS file
digitized at June 09
meeting
yes yes
Quarries 95 800 0 0
Nevis: Marine intensity=
90 distance=1000---SK
digitized with
Department of Physical
Planning. NV used land
cover file.
yes yes
Sewage Plant @
Frigate Bay 50 0 50 600
Digitized with
Department of Physical
Planning.
yes N/A
Desalinization Plant 60 10 70 200 Digitized at June 09
meeting yes N/A
Low Density 20 100 20 50
Used Low Density Build
up Land; Rural or
residential attribute
from the land cover file
yes yes
High & Med Density 40 500 80 1600
Used high & medium
density residential
attribute from the land
cover file
Marxan Results
The results of the Marxan analysis can be found in Appendix IV. The two runs that are
presented in this report demonstrate possible solutions to achieving the most efficient
protection of the selected targets. No solution was able to meet all goals at the set levels.
Appendix IV indicates the level to which each run was able to meet the specified targets.
For use in the systems plan it is recommended that these runs be used as a base for the
systems plan. However, it should be noted that Monkey Shoal should be added to the
portfolio as well as additional mangroves for both St. Kitts and Nevis. Although no run

was able to meet the goals set for several other targets, the mapped results, inset tables,
and associated graphs indicate that other than Monkey Shoal and mangroves, the other
targets were very close to being met.
References
Ball, I & H. Possingham. 2000. Marxan (v1.8.2): Marine reserve design using spatially
explicit annealing. A manual prepared for The Great Barrier Reef Marine Park
Authority.
McPherson, M., S. Schill, G. Raber, K. John, N. Zenny, and K. Thurlow, 2008, GIS-
Based Modeling of Environmental Risk Surfaces (ERS) for Conservation Planning in
Jamaica,” Journal of Conservation Planning Vol 4:60-89.

APPENDIX I
Meeting Notes

National Ecological Gap Assessment Workshop Minutes Thursday 13th to Friday 14th November, 2008
Ocean Terrace Inn Fishermans Wharf, St. Kitts, W.I.
Opening The National Ecological Gap Assessment Workshop began at approximately 9:15 A.M.
on November 13, 2008. The meeting convened at Ocean Terrace Inn on St. Kitts. Mr.
Randolph Edmead from the St. Kitts Department of Physical Planning & Environment
opened the meeting. This workshop took place over two days.
Present See Appendix 1.
Day 1: Welcome & Introductions Mr. Randolph Edmead from the St. Kitts Department of Physical Planning &
Environment welcomed participants and explained the purpose of the two day workshop.
He explained that the two day workshop was part of the National Ecological Gap
Assessment being undertaken in collaboration with the OECS- Environment and
Sustainable Development Unit, working in partnership with The Nature Conservancy.
The National Ecological Gap Assessment will be used as a basis for assessing existing
biodiversity assets and identifying areas which may be included in a National Protected
Areas System.
Mr. Edmead explained that St. Kitts is part of the OECS Protected Areas and Associated
Livelihood (OPAAL) Project and that one of its components is the establishment of a
Protected Areas Systems Plan. The OPAAL Project is undertaken in the independent
member states of the OECS and is aimed primarily at protecting and conserving
biological diversity endemic to the region.
The project is financed by the World Bank, the French Government and the OAS. The
OPAAL Project falls under the wider umbrella of the Convention on Biological Diversity
(CBD). The Project forms part of the CBD’s Programme of work on Protected Areas
which has as one of its goals, “to establish and strengthen National and Regional Systems
of Protected Areas, integrated into a global network, to reduce the rate of biodiversity
loss.”
In St. Kitts-Nevis there is currently only one officially declared protected area, the
Central Forest Reserve. The goal is to develop a system of Protected Areas with both
terrestrial and marine areas represented. The Ecological Gap Assessment process will
help identify if and where the current Protected Areas System falls short of protecting
important biodiversity.

Mr. Edmead explained that in addition to the Central Forest Reserve, which is the
OPAAL Project Demonstration Site, the national aim is for the establishment of other
Protected Areas in St. Kitts and Nevis. For example:
1. The Basseterre Valley Project which is undertaken as part of Integrated Watershed and Coastal Areas Management (IWCAM) Project.
2. The Proposed Marine Management Area, focusing on the protection of the
coastal ecosystem between St. Kitts and Nevis.
3. The proposal by the Nevis Island Administration to declare the area around
Nevis Peak protected.
It is anticipated that these areas will be included in the National Protected Areas System.
Mr. Edmead explained that The Nature Conservancy (TNC) has agreed to work with the
OECS in assisting Member States in undertaking the Ecological Gap Analysis as part of
the implementation activities for the OPAAL Project.
Mr. Edmead concluded his welcome by underscoring the workshop objectives:
1. To identify conservation targets for terrestrial and marine ecosystems.
2. To identify the environmental threats for terrestrial and marine ecosystems.
3. To identify data gaps.
4. To set a work plan to fill the gaps.
Agenda Review, and Introduction to The Nature Conservancy & Protected Area System Planning Ms. Ruth Blyther from The Nature Conservancy, explained that TNC has worked in the
Mesoamerica and Caribbean region for the last 30 years. This region is the
Conservancy’s longest running international program and the relationship with partners
here is well established. The Conservancy has been working in the Caribbean for the last
20 years and currently has offices in St. Croix, Jamaica, Bahamas, the Dominican
Republic and the Florida Keys.
Ms. Blyther expressed excitement on behalf of The Nature Conservancy to have the
opportunity to work with the government and partners of St. Kitts and Nevis to help meet
the CBD’s goal of marine and terrestrial area protection for 2010 and 2012. This
workshop is the first of many to focus on the ecological gap analysis for St. Kitts and
Nevis.
Ms Blyther explained that she is the Eastern Caribbean’s Partnership Specialist, based in
St. Croix, US Virgin Islands. For the past two years she has worked with partner
governments and organizations in the Eastern Caribbean to conserve biodiversity and
build regional capacity for sustainable management of the environment, especially in and
surrounding protected areas
Ms. Blyther then went on to introduce her two colleagues Ms. Shawn Margles and Mr.
John English Knowles. Ms. Margles is the Southeastern Caribbean Conservation Planner
for the Nature Conservancy’s Insular Caribbean Operation Unit also based in St. Croix.
She has worked with partners in St. Croix to develop a spatial database and worked on
the Jamaica ecological gap.
Mr. Knowles is the Conservation Information Manager for the Conservancy’s Insular
Caribbean Operation Unit based in the Florida Keys. He supports the spatial data
management, map making, analysis and ecological gap work for the Insular Caribbean.
Both Ms Margles and Mr. Knowles have extensive experience with geographic
information systems (GIS).
Ms. Blyther then introduced Ms. Sarah George from the OECS and the OPAAL project.
Ms. George expressed the pleasure of the OECS to be partnering with TNC in providing
this support to St Kitts and Nevis. She explained that the work complements the systems
planning element of the OECS Protected Areas and Associated Livelihoods (OPAAL)
project which is designed to enable the Participating Member States to update pre-
existing PA systems plans or develop new ones for countries where no such plan has
existed before. St. Kitts-Nevis is such a case and the gap analysis is an important means
to assess what sites and values exists and determine what factors may affect proposed
sites which would be necessary to conserve national biodiversity while providing for
sustainable livelihoods for local communities.
OPAAL is a five year regional project which works in all 6 independent Member States
of the OECS. It supports policy, legal and institutional reform, PA establishment and
management, capacity building and public awareness which allows for improved
management of PAs within the region. OECS has a Memorandum of Understanding with
TNC to collaborate on the above mentioned areas and this jointly facilitated gap analysis
workshop is one demonstration of this partnership.
The development objective of OPAAL for projects is that when implemented, they will
contribute to the economic development of the participating member states by:
1. Strengthening existing and creating new protected areas
2. Providing environmentally sustainable economic opportunities for communities living
in the surrounding areas.
Participating Member States are St. Kitts and Nevis, Antigua and Barbuda, Dominica,
Saint Lucia, St. Vincent and the Grenadines, and Grenada.

Introduction to GAP Analysis Components Ms. Margles explained that the GAP is a participatory process of stakeholders that
identifies important biodiversity targets and the threats that impact them.
Conservation targets represent biodiversity across biological scales (species and
ecosystems) and biological realms (terrestrial, freshwater, and marine). The aim of
defining conservation targets is to capture the full array of biodiversity in the country.
The goal of full representation is to conserve representative samples of all species and
ecosystems within the country, at sufficient scale to ensure their long term persistence.
These focal biodiversity elements define species, communities, and ecological systems to
be evaluated in the gap analysis and are intended to represent the full range of
biodiversity (freshwater, marine, and terrestrial).
Environmental risk factors are human activities that apply pressure to or threaten the
viability of conservation targets. These may include roads, hotels, anchoring sites,
agriculture, tourism, and others. Environmental risk factors and their distance of
influence and relative intensity must be defined.
Ms. Margles explained that the gap analysis will use coarse and fine filter conservation
targets defined at this two day meeting. Coarse filter elements (e.g. all native/natural
ecological systems) represent common and widely distributed species, natural
communities, and the ecological processes that support them. Fine filter elements are
native species, species, assemblages, and communities that are not well captured by the
coarse filter and require individual attention in order to be effectively represented in the
conservation plan.
Ms. Margles explained that all data must be:
• Country wide
• Spatial
• Standardized/ collected in a consistent manor
• Directly related to inform this effort
Ms. Margles went on to describe how these data would then be used in a three part
analysis. A summary of these calculations are as follows:
Relative Abundance Calculation (RAC): The relative abundance calculation identifies
planning units with relative high abundance of the conservation targets. The RAC for
each planning unit is directly proportional to the amount of conservation target present in
the planning unit (e.g. hectares of habitat, length of stream or number of occurrences).
This calculation can be used to identify the best remaining areas, in terms of target
abundance, for each target or set of targets at the planning unit or the landscape scale.
The RAC calculates the relative uniqueness or rareness of a habitat or species across the
landscape.

Impact Analysis: The impact analysis is a modeled surface developed using mapped
risk elements identified by the expert group. The impact analysis measures cumulative
levels of impacts across the landscape. Each identified impact is given a marine and
terrestrial impact and distance score by the expert group. The impact analysis is used to
determine mean impact scores for each planning unit.
Irreplaceablity Index: The irreplaceablity index is determined using MARXAN
software. MARXAN uses stochastic optimization routines (Simulated Annealing), which
generates spatial reserve systems that achieve particular biodiversity representation goals
with reasonable optimality. The simulated annealing algorithm attempts to minimize the
total cost of the reserve system, while achieving a set of conservation goals. During the
simulated annealing procedure, an initial portfolio of planning units is selected. Planning
units are then added and removed in an attempt to improve the efficiency of the portfolio.
Early in the procedure, changes in the portfolio that do not improve efficiency can be
made in order to allow the possibility of finding a more efficient overall portfolio. The
requirement to accept only those changes that improve efficiency becomes stricter as the
algorithm progresses through a set of iterations. For any set of conservation targets and
goals, there may be many efficient and representative portfolios that meet all
conservation goals, but most of these networks would have a number of planning units in
common. Many runs of the algorithm are used to find the most efficient portfolio and to
calculate a measure of irreplaceablity (used here to indicate the number of times a
particular unit is chosen). In some cases, conservation targets are only found in limited
sites–areas of high irreplaceablity–that are always chosen in any representative portfolio.
Additionally, areas of high irreplaceablity also include planning units, whose exclusion
would require a proportionally larger conservation area network to achieve the same level
of representation, resulting in a loss of portfolio efficiency. The algorithm attempts to
minimize portfolio total ‘cost’ whilst meeting conservation goals in a spatially compact
network of sites.
Defining the Terrestrial Conservation Targets
Ms. Margles and Mr. Knowles then led the group through an exercise to identify
terrestrial conservation targets and percentage goals. The group was asked to brain storm
conservation targets while Mr. Knowles recorded each on a flip chart. After a list of
conservation targets was exhausted, the group proceeded to set conservation goals that
would be used to help guide the Irreplaceablity Index calculation.
Multiple coarse and fine filter targets were identified, but not all will be used in the
assessment. A list of conservation targets and goals to be included and a data layer
assessment can be found in Appendix 2. The full list of brainstormed items is as follows:
- Heliconia (rare and endemic)/
- Hummingbird
- Littoral forests
- Dry forests
- Rain forest
- Great salt ponds

- Deer
- Beaches/turtle nesting sites (St. Kitts and Nevis)
- Freshwater system
o Wingfield River
o Drainage
o Freshwater river eel
o Rivers
o Crawfish in Cayon River
o Freshwater ponds
- Sand Dunes in Nevis (need to draw)
- Mangroves
- Bassaterre Valley Watershed
- Catchment areas (in Central Forest Reserve)
- New River watersheds - aquifer
- Nevis peak
- Camps Spring watershed
- Bats, frogs, lizards, snakes (Heritage Society)
- Wetlands
- Pelican sites
- Important Bird Area from Birdlife International or migratory bird stopovers
- Clay Slough
- Endemic bird sites
- Pollinating insects, bees, and butterflies
- Cultural targets
Defining Terrestrial Environmental Risk Surface
After completing the conservation targets exercise, Ms. Margles and Mr. Knowles
explained how the Environmental Impact Analysis would be conducted. They then led
the group through an exercise to identify both Marine and terrestrial threats. Many
threats were identified, but not all will be used in the assessment. The finalized threats
can be found in Appendix 3. Below is a list of threats that were brained stormed by
participants. The threats in bold were incomplete and participants attempted to map them
on paper:
- Mining/Quarrying
- Livestock (cows, goats, sheep)
- Monkeys
- Cuban frog/cane toad
- Snakes
- Fire ants
- Black widow
- Coconut palms
- Insecticide – Agricultural chemicals (fertilizer intensive crops)
- Mongoose
- Power plants
- Desalinization plant (St. Kitts)

- Sugar factory
- Industrial port
- (maybe deer)
- Donkey
- Development (Rail, Residential (High and Low), Industrial (proposed and
existing), Airport, Roads)
- Tourism (Hotels by size)
- Golf courses
- Illegal dump sites
- Landfill
Specific marine threats were identified. Many threats were identified, but not all will be
used in the assessment. The threats in bold were incomplete and participants attempted
to map them on paper:
- Anchoring
- Ghost traps
- Undersize catches (beach seining)
- Siltation
- Proposed hotels
- Jetties
- Gray water point sources
- Marinas
- Boat yards
After reviewing the existing data and missing data the group agreed that further data
collection and digitization would be necessary.
Ms. Margles and Mr. Knowles explained that on the following day distance and intensity
values would be assigned to each threat. The meeting adjourned at approximately 3 pm.
Day 2: Completing Defining Terrestrial and Marine Intensity and Distance Values for Environmental Risk Surface To begin the second day Ms. Margles and Mr. Knowles explained that the intensity and
distance values for threat factors needed to be assigned by participants. Participants had
a group discussion to determine on a scale of 0-100 how intense the impact of each
identified activity was and how far from its point source the influence traveled. The
distance and intensity scores that were agreed upon by participants can be found in
Appendix 3.
Defining the Marine Conservation Targets After participants completed assigning intensity and distance values, marine conservation
targets were brainstormed. Mangroves, seagrass beds, fringe coral reefs (additions need
to be made to Nevis), artificial reefs, SPAG’s/nursery (Nags Head), lobster spawning and
migratory routes, rocky shore, sea moss, thermal sea vents, underwater sea mounts
(location unsure) and offshore reef were included in the list. Participants then assigned
percentage conservation goals in the same fashion as had been done the previous day for
terrestrial conservation targets. A complete list of marine conservation targets and
percentage goals can be found in Appendix 4.
Set work plan to fill data gaps
Key participants will be contacted over the next couple of months to clarify and help
obtain missing data.
Wrap-up
The next steps were outlined. First the data needed for the analysis needs to be collected
and organized. The Conservancy will work with Department of Physical Planning &
Environment to coordinate this effort. After the data is ready the analysis will be conducted
and an initial portfolio of potential protected areas will be generated. This information will
be presented to workshop participants at another meeting so they may review the analysis
outputs and make any necessary changes. The objective is to have a portfolio ready for
review by February 2009.
Participants were thanked for their hard work, time and focus on getting through a lot of
material over the two days of the workshop. Their expertise and acceptance of the
process is invaluable to the success of a protected areas system plan.
The meeting adjourned at approximately 3 p.m.

Participant’s List of Attendees for the National Ecological Gap Assessment Analysis
Workshop, 13-14th November, 2008.
NAMES
ORGANISATION
CONTACT INFORMATION
Randolph Edmead Department of Physical
Planning & Environment
465-2277
Sarah George OECS 1-758-455-6327
Shawn Margles The Nature Conservancy 1-340-244-6172
John Knowles The Nature Conservancy 1-980-253-7803
James Greene Department of Maritime
Affairs
466-4648
Karen Douglas Department of Economic
Affairs
467-1252
Racquel Williams Ministry of Agriculture [email protected]
Graeme Browne Department of Physical
Planning & Environment
762-6037
Eduardo Mattenet GIS/IT Consultant [email protected]
Stuart Laplace Clarentz Fitzroy Bryant
College (Science Dept.)
667-0778
Joe Simmonds Department of Fisheries
( St. Kitts)
465-8045
Lemuel Pemberton Department of Fisheries
(Nevis)
469-5522 ext 2088
Ronel Browne Department of Physical
Planning & Environment
663-8341
Andy Blanchette Department of Physical
Planning & Environment
662-7992, 465-2277
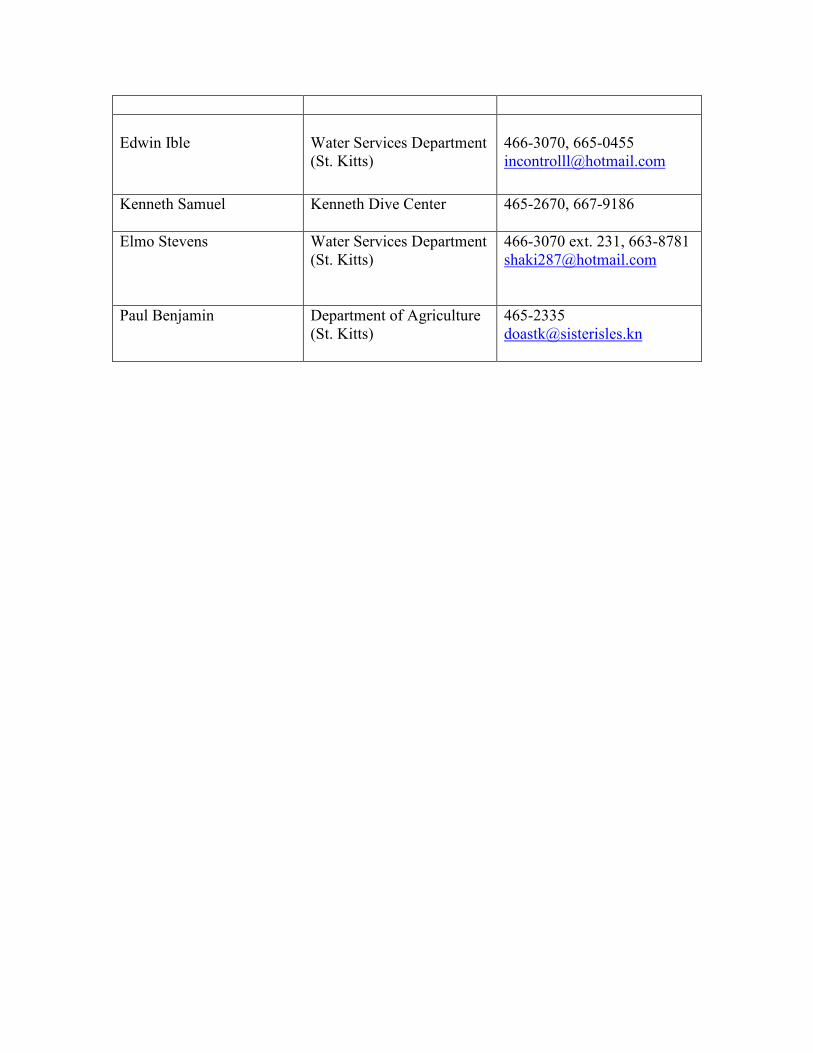
Edwin Ible
Water Services Department
(St. Kitts)
466-3070, 665-0455
Kenneth Samuel Kenneth Dive Center 465-2670, 667-9186
Elmo Stevens Water Services Department
(St. Kitts)
466-3070 ext. 231, 663-8781
Paul Benjamin Department of Agriculture
(St. Kitts)
465-2335

Terrestrial Conservation Target Goals Target Goal (%) Target
100 Intake springs
60 Turtle nesting (St. Kitts and Nevis)
50 Salt water ponds
100 Freshwater ponds
90 Brackish ponds (Nevis)
60 Bird nesting sites (Nevis)
50 Bird nesting sites (St. Kitts)
50 Aquifers
25 Drought deciduous open woodland (Nevis)
10 Drought deciduous open woodland (St. Kitts)
20 Deciduous evergreen coastal & mixed forest succulent (St. Kitts)
25 Deciduous evergreen coastal & mixed forest succulent (Nevis)
20 Semi-deciduous forest (includes semi-evergreen forest) (St. Kitts & Nevis)
10 Evergreen forest w/ coconut palms (St. Kitts and Nevis)
50 Seasonal evergreen forests (St. Kitts and Nevis)
Data Layer Assessment
Include Data Layer Additions Comments
Yes Nesting bird
sites
Egrets/trees Major existing sites, but
dwindling.
Yes Turtle nesting
sites
Dc – St. Kitts, Ei – Nevis. Use
both in-house and WIDECAST
data. Sandy Point has had sand
mining.
Yes, but edit Sandy Beach
Layer
“Western White
House Bay used
to have sand, but
it is not coming
back.”
Some removals
Yes Aquifer layer
Yes Pond Split file.
Brackish water
ponds in Nevis
Salt and freshwater (2 center
ones).
Yes, partly Waterwells Intakes – natural and springs in
forest areas (*target). Wells
and reservoirs are manmade
(not targets). Flagging entire
watershed system was
suggested by Sarah George.
Yes Wingsfield
Watershed
Designated
watershed/catchment
Maybe Soils *Need soil layer Break out fertile soil. Digitize

for Nevis hard copy report that breaks
down soil by crop type.
Landcover
Data
Mangroves layer
needs more, but
mostly good.
Digitize data
from Lemuel on
Nevis’
mangroves.
Management
plan has more
data.
Dates collected – 2000-2003.
This is after the hurricane,
which is good. Deciduous,
evergreen, coastal and mixed
forest includes most of littoral.
Combine montane and steep
forest.

Terrestrial and Marine Environmental Impact Factors with Distance & Intensity Scores
Human ActivityType or value
range
Terrestrial
Intensity
Terrestrial
Distance
(meters)
Marine
Intensity
Marine
Distance
(meters)
Notes
Power Plant 100 500 100 1600
Rail Road 10 25 0 0
Roads 60 100 80 100
Airport 100 1000 60 1600
Boat Yards 90 500 90 1000
ATV Trails 60 100 80 100
Squatters 50 500 50 50
Sea Ports 80 800 100 3200
Quarries 95 800 0 0
Nevis: Marine intensity= 90
distance=1000
Hotel/Resort: Tourism 1-6 11 100 11 50
Hotel/Resort: Tourism rooms 7-14 25 500 25 300
Hotel/Resort: Tourism 15-24 27 500 27 300
Hotel/Resort: Tourism 25-49 35 500 35 500
Hotel/Resort: Tourism 50-149 40 500 60 1600
Hotel/Resort: Tourism 150+ 40 500 80 1600
Anchoring 0 0 75 20
Ghost Traps 0 0 85 80
Point Source Siltation (ghauts) 40 50 80 1600
Overnight Boating 0 0 30 5
Jetties 25 15 50 150
Hospital Grey Water Point Source 0 0 95 600 Nevis: has different impact.
Desalinization Plant 60 10 70 200
Residential - High 40 500 80 1600
Residential - Medium 35 500 35 500
Residential - Low 11 100 11 50
Illegal Dumping sites 85 10 85 50
Landfills 100 800 30 30
Golf Course 40 50 40 100 Nevis is 50 terrestrial-distance
Marinas 35 300 90 100
Nevis Marine
Intensity=90//Terrestrial
Intensity=90
Livestock Facility 90 50 10 25
Nevis: same as a marina
distance//intensity=80
Invasive: Monkey
Invasive: Cuban Frog/Cane Toad
Invasive: Snakes
Invasive: Fire ants
Invasive: Black widows
Invasive: Mongoose
Invasive: Deer
Invasive: Coconut Palms
Invasive: Donkey
Industrial Port
Sewage Plant @ Frigate Bay 50 0 50 600
Needs to be dealt with in the system plan.

Marine Conservation Targets and Conservation Goals
Target Goal (%)
St. Kitts Nevis
Target
100 100 Mangroves
100 100 Seagrass beds
90 90 Fringe coral reefs
100 100 Artificial reefs
100 SPAG’s/nursery (Nags Head)
60 Lobster spawning/ migratory route
40 70 Rocky shore
50 80 Sea moss
50 80 Thermal sea vents
Underwater sea mounts (location unsure)
100 100 Offshore reef
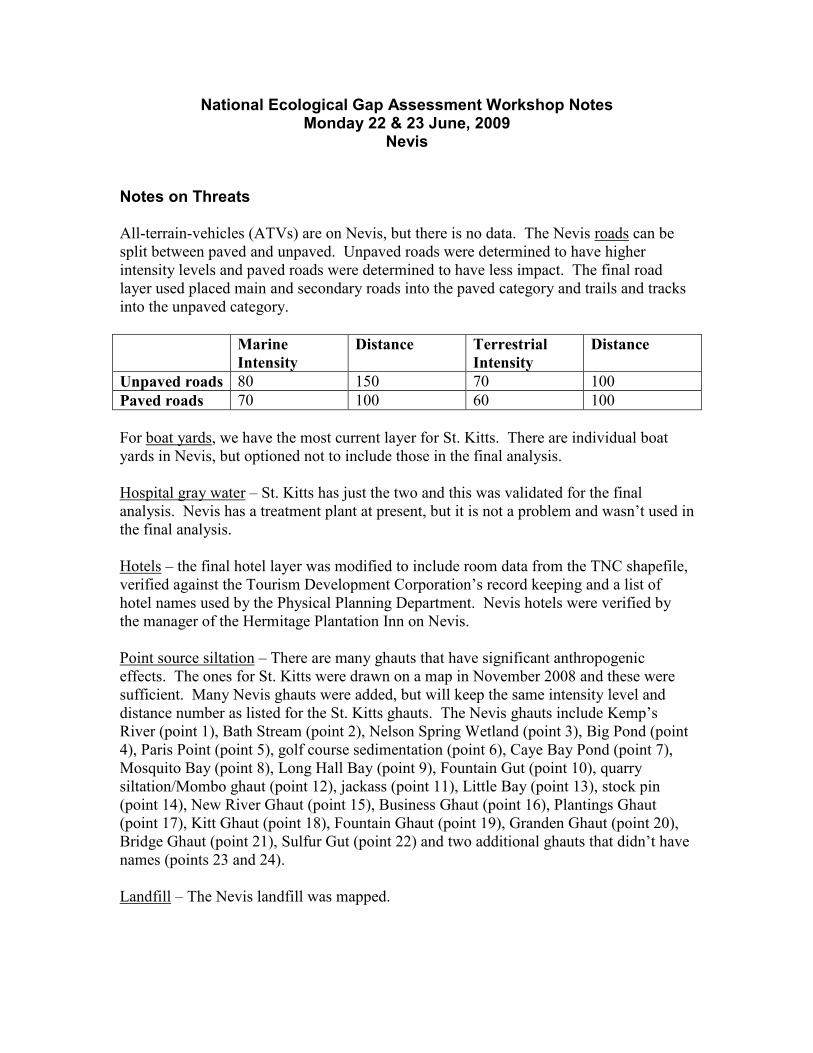
National Ecological Gap Assessment Workshop Notes Monday 22 & 23 June, 2009
Nevis
Notes on Threats
All-terrain-vehicles (ATVs) are on Nevis, but there is no data. The Nevis roads can be
split between paved and unpaved. Unpaved roads were determined to have higher
intensity levels and paved roads were determined to have less impact. The final road
layer used placed main and secondary roads into the paved category and trails and tracks
into the unpaved category.
Marine
Intensity
Distance Terrestrial
Intensity
Distance
Unpaved roads 80 150 70 100
Paved roads 70 100 60 100
For boat yards, we have the most current layer for St. Kitts. There are individual boat
yards in Nevis, but optioned not to include those in the final analysis.
Hospital gray water – St. Kitts has just the two and this was validated for the final
analysis. Nevis has a treatment plant at present, but it is not a problem and wasn’t used in
the final analysis.
Hotels – the final hotel layer was modified to include room data from the TNC shapefile,
verified against the Tourism Development Corporation’s record keeping and a list of
hotel names used by the Physical Planning Department. Nevis hotels were verified by
the manager of the Hermitage Plantation Inn on Nevis.
Point source siltation – There are many ghauts that have significant anthropogenic
effects. The ones for St. Kitts were drawn on a map in November 2008 and these were
sufficient. Many Nevis ghauts were added, but will keep the same intensity level and
distance number as listed for the St. Kitts ghauts. The Nevis ghauts include Kemp’s
River (point 1), Bath Stream (point 2), Nelson Spring Wetland (point 3), Big Pond (point
4), Paris Point (point 5), golf course sedimentation (point 6), Caye Bay Pond (point 7),
Mosquito Bay (point 8), Long Hall Bay (point 9), Fountain Gut (point 10), quarry
siltation/Mombo ghaut (point 12), jackass (point 11), Little Bay (point 13), stock pin
(point 14), New River Ghaut (point 15), Business Ghaut (point 16), Plantings Ghaut
(point 17), Kitt Ghaut (point 18), Fountain Ghaut (point 19), Granden Ghaut (point 20),
Bridge Ghaut (point 21), Sulfur Gut (point 22) and two additional ghauts that didn’t have
names (points 23 and 24).
Landfill – The Nevis landfill was mapped.

Squatters – Squatters in St. Kitts is complete for the coast areas, but points are missing
for squatters in the mountains. Nevis does not really have squatters.
Airport – The two airports were correct for St. Kitts and Nevis.
Golf courses – St. Kitts has 3 golf courses. One (1) is established and two (2) are in
development. The golf course at Sandy Point was drawn in by the group and the site
plans for the new golf courses were also drawn in. Nevis has one (1) golf course.
Anchoring – There were a few modifications for the anchoring sites for St. Kitts. The
Northern Bay site was brought closer to shore. The Turtle Bay site was increase.
Monkey Shoals was added as an anchoring spot. For Nevis, many anchoring sites were
added. The first was off of the Four Seasons property. Second was the Gallows Bay in
Charlestown. Third was the official anchoring area off Charlestown (polygon 4). Fourth
was Mosquito Bay, fifth was Jones Bay, sixth was New Castle, seventh was Long Horn
and last was the Delta Anchorage.
Jetties – Jetties built on pillars were left out. Only solid jetties were included.
Docks and Piers – The sea bridge and ferry terminal were added for Nevis. Groins were
not included. For Nevis only, the intensity and distance value are as follows:
Terrestrial Marine
Intensity Distance Intensity Distance
60 100m 70 1 miles
Seaports and industrial ports – For St. Kitts seaports were considered as tourist facilities
and industrial ports were considered as commercial facilities. Nevis has Long Point and
it has the same intensity and distance values as Basseterre. In Nevis, it is considered a
deep water harbor. The intensity and distance value for these facilities in St. Kitts are as
follows:
Terrestrial Marine
Intensity Distance Intensity Distance
Seaports
(tourists)
80 Same 80 Same
Industrial Ports
(commercial)
90 Same 60 Same
Livestock – Unmanaged livestock has a big impact, but is not mapped. For St. Kitts there
were some additions. These include Philips Egg Farm, a 200 acre facility and a pig
facility by the airport. The historic dairy farm on the east coast was deleted from the
threat layer. The Nevis additions include the following: a northeast piggery was added
(200 pigs), 2 north end piggeries were added next to the airport, chicken farm in the east,
and a 200 pig Blackwell piggery. A northeast end pasture was not added and a big
grazing land in the south was deleted.

Power plant –The boundary and location of the St. Kitts power plant war verified. The
Nevis power plant was drawn in. However, the marine intensity and distance was
changed to zero for all power plants.
Quarries – The quarry in St. Kitts was determined to not be affecting the marine area,
however there was some disagreement among some. Four (4) were added for Nevis.
Low Density – For low residential, it was determined that the marine and terrestrial
intensity would both be 20.
Desalinization plant – There is one (1) on St. Kitts
Ghost traps – this was omitted from the final analysis, but it should be mentioned in the
report.
Illegal dumping sites - this was omitted from the final analysis, but it should be
mentioned in the report. Illegal dumping is indiscriminate on land.
Greg from the Nevis Historical Society wanted to include the local drag strip and the
horse race trap as a threat. Both of these did not make the final cut.
Notes on Targets
Intake springs – Green hill was in question.
IBA (Important Bird Areas) – For St. Kitts, Nags head was included. It was stated that
nesting and foraging sites should be separate, but they were eventually merged into one
polygon layer.
Seamounts – present on admiralty maps and need to be mapped.
Sea moss – mapped for Nevis
Thermal sea vents – 3 at least. Kenneth Samuels can tell you were they are, but are likely
included in the point data he handed over to Mr. Hobson of Maritime Affairs.
Lobster – a large polygon was drawn along the coast of Nevis and in the Narrows.
Birds – For Nevis, four sites were included.
Turtles – Three sites were added and mapped for Nevis.
Attendees
Ecological GAP Analysis June 22-23, 2009 Nevis (Day 1)
Name Organization Contact No. and/or Email D. Reyes Ecoengineering Consultants Ltd. 868-645-4420 [email protected]
G. K. Sammy Ecoengineering Consultants Ltd. 868-645-4420 [email protected]
J. C. Meerman Ecoengineering Consultants Ltd. meerman@biological_diversity.??
Andy Blanchette
Department of Physical Planning and Environment (SKB) [email protected]
Ronel Browne
Department of Physical Planning and Environment (SKB) [email protected]
Eduardo Mattenet
Department of Physical Planning and Environment (SKB) [email protected]
Angela Delpeche
Department of Physical Planning and Environment (SKB) [email protected]
James Greene Department of Maritime Affairs [email protected]
Erin Haney Nevis Historical and Conservation Society [email protected]
Greg DeVries Nevis Historical and Conservation Society [email protected]
Joe Simmonds Department of Fisheries - St. Kitts [email protected]
Daisy Mottram St. Christopher Heritage Society [email protected]
George Morris Nevis Water Department 663-2253 [email protected]
June Hughes Department of Physical Planning and Environment (SKB) [email protected]
Emile Pemberton Department of Fisheries - Nevis [email protected]
Carl Williams Ministry of Tourism - Nevis [email protected]
Lewis Newton
Department of Physical Planning and Environment (SKB) [email protected]
Rene Walters
Department of Physical Planning and Environment (SKB) [email protected]
Michael Daniel Department of Fisheries - Nevis 663-8908
Jacqueline Armory St. Christopher Heritage Society 764-2942 [email protected]
Clivin Christmas Department of Fisheries - Nevis
663-3301 [email protected]

Ecological GAP Analysis June 22-23, 2009 Nevis (Day 2)
Name Organization Contact No. and/or Email D. Reyes Ecoengineering Consultants Ltd. 868-645-4420 [email protected]
J. C. Meerman Ecoengineering Consultants Ltd. meerman@biological_diversity.??
James Greene Department of Maritime Affairs [email protected]
Carl Williams Ministry of Tourism - Nevis [email protected]
June Hughes Department of Physical Planning and Environment (SKB) [email protected]
Eduardo Mattenet
Department of Physical Planning and Environment (SKB) [email protected]
Shawn Margles TNC
(340) 718-5575 [email protected]
John Knowles TNC [email protected]
Ruth Blyther TNC [email protected]
Lemuel Pemberton Department of Fisheries - Nevis [email protected]
Lewis Newton
Department of Physical Planning and Environment (SKB) [email protected]
Rene Walters Department of Physical Planning and Environment (SKB) [email protected]
Ronel Browne
Department of Physical Planning and Environment (SKB) [email protected]
Erin Haney Nevis Historical and Conservation Society [email protected]
Greg DeVries Nevis Historical and Conservation Society [email protected]
Andy Blanchette
Department of Physical Planning and Environment (SKB) [email protected]
George Morris Nevis Water Department 663-2253 [email protected]
Angela Delpeche
Department of Physical Planning and Environment (SKB) [email protected]

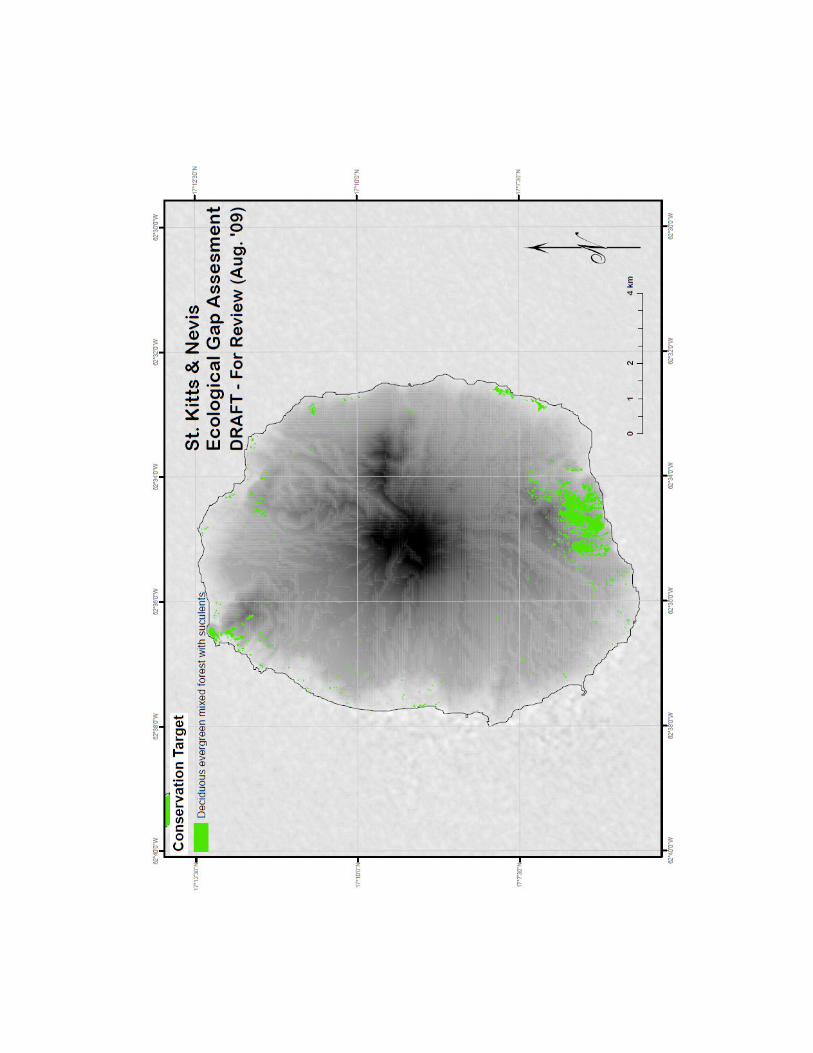
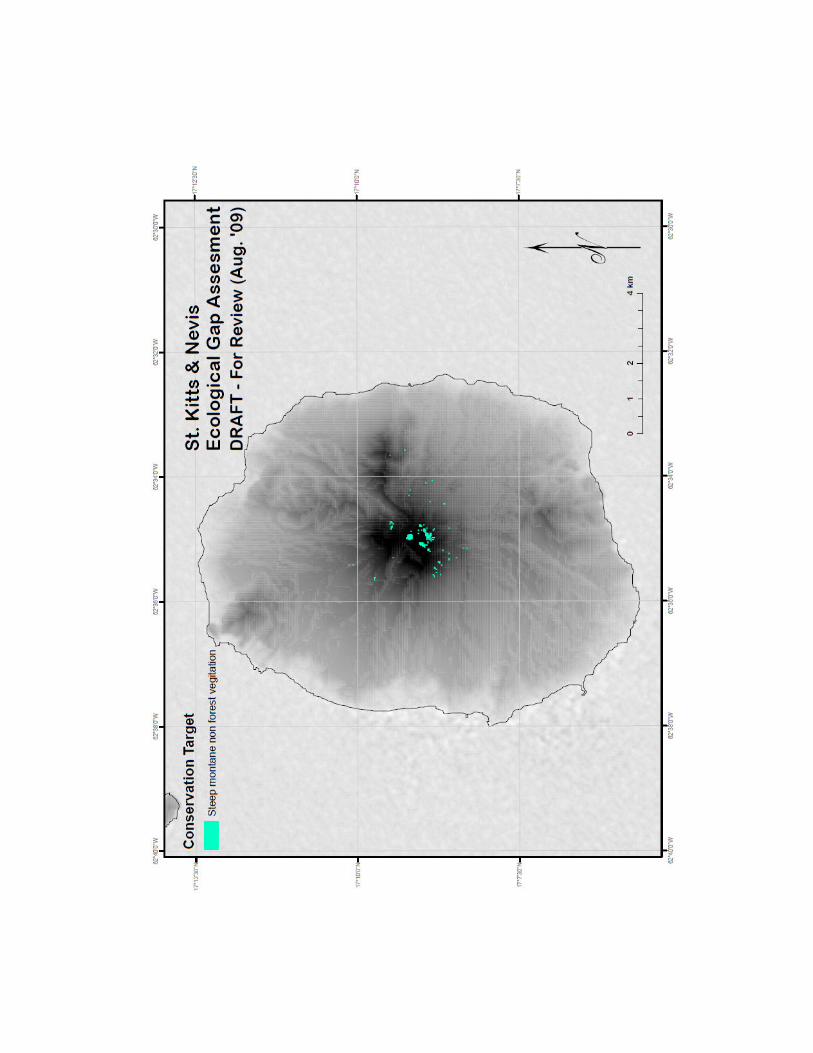
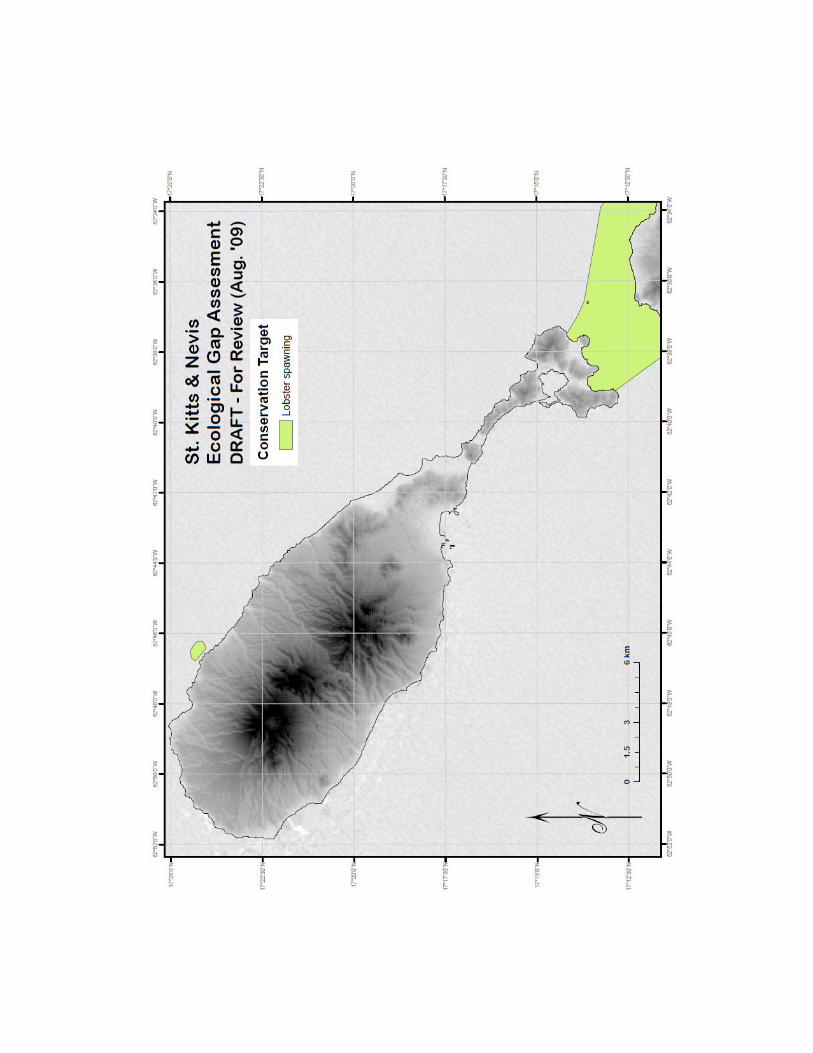
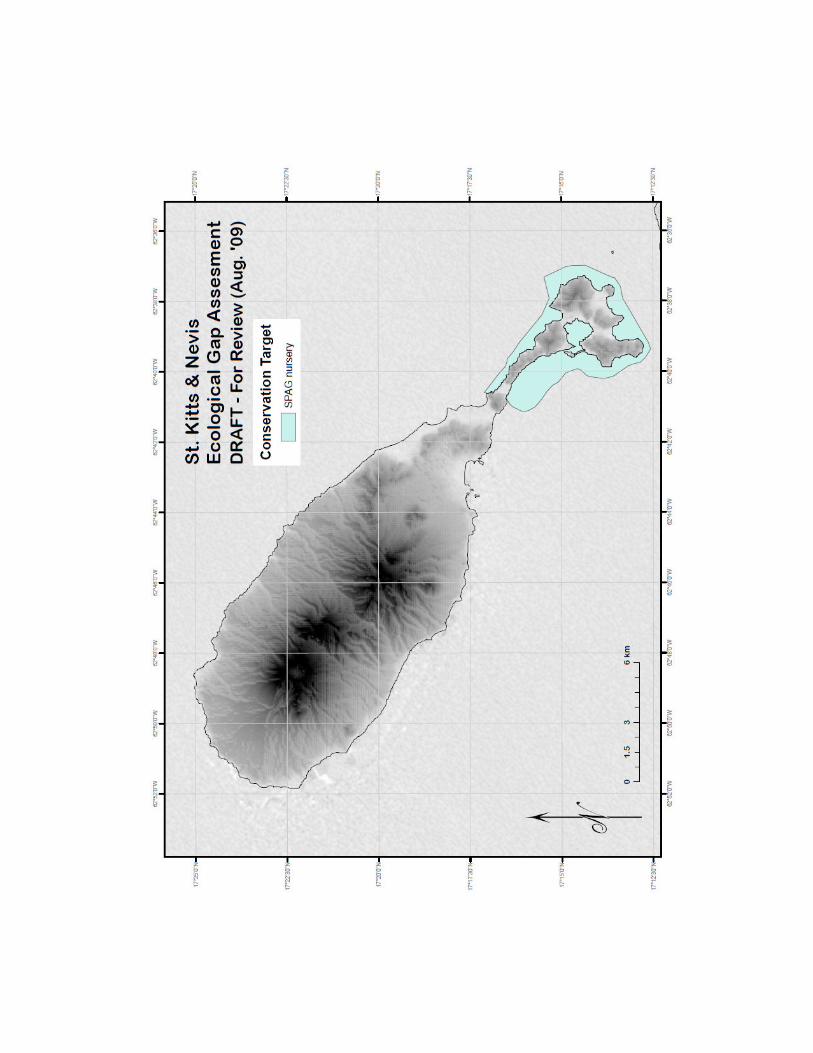
APPENDIX II
ST. KITTS & NEVIS
MARINE & TERRESTRIAL
TARGETS


APPENDIX III
ENVIRONMENTAL RISK SURFACE

Figure 1. Environmental Risk Surface (ERS) model showing the “human footprint” of St.
Kitts & Nevis. This model is the results of several GIS files that represent certain human
activities that have been assigned intensity and influence distances (Table 2) and have
been aggregated together. The darker red areas indicate higher levels of human activity.

APPENDIX IV
MARXAN RESULTS

Figure 1. Marxan output showing a solution perform
ed relative to the set goals (Table 1). Inset table shows the target goals that were not met with this solution.
Feature Name: Name of the target for which a goal is set; Goal: The desired level of representation for that conservation feature; Amount Held: The amount of
that target captured in the reserve system; Percentage Goal M
et: Percentage of the goal m
et.

Figure 2 M
arxan output showing a solution perform
ed relative to the set goals (Table 1). Inset table shows the target goals that were not met with this solution.
Feature Name: Name of the target for which a goal is set; Goal: The desired level of representation for that conservation feature; Amount Held: The amount of
that target captured in the reserve system; Percentage Goal M
et: Percentage of the goal m
et.
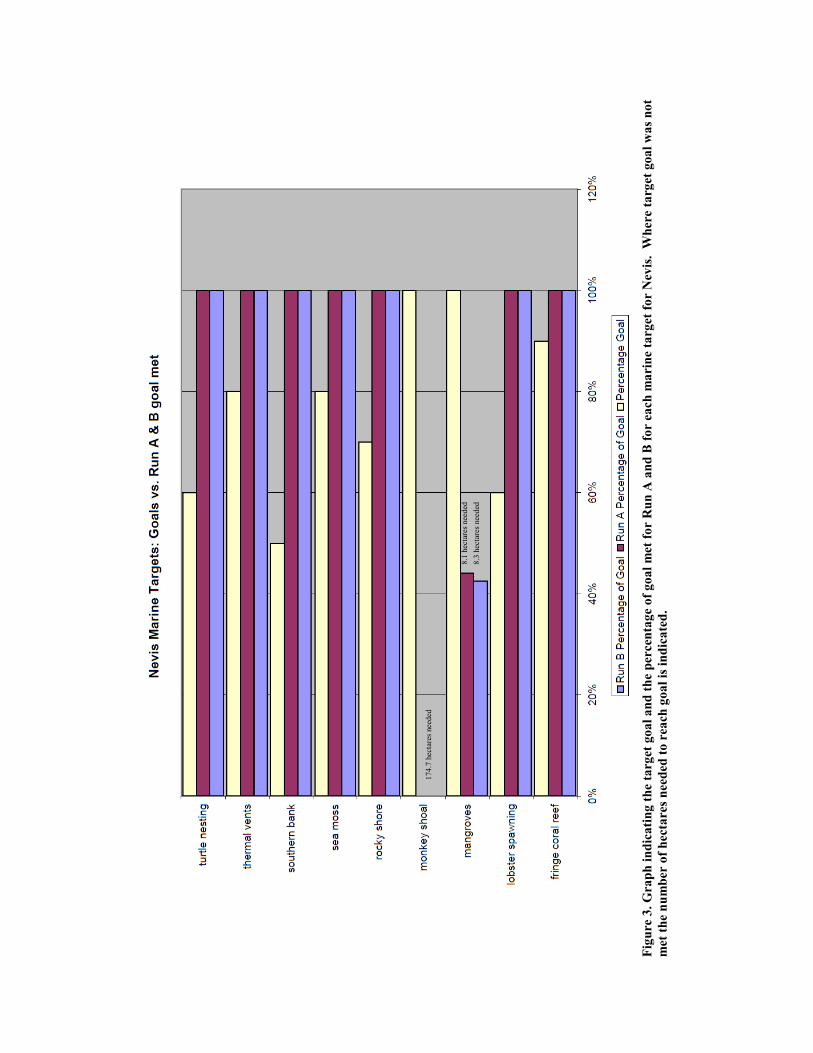
Figure 3. Graph indicating the target goal and the percentage of goal met for Run A and B for each m
arine target for Nevis. W
here target goal was not
met the number of hectares needed to reach goal is indicated.
8.3 hectares needed
8.1 hectares needed
174.7 hectares needed

Figure 4. Graph indicating the target goal and the percentage of goal met for Run A and B for each terrestrial target for Nevis. W
here target goal was
not met the number of hectares needed to reach goal is indicated.
1.0 hectares needed
0.05 hectares needed
2.9 hectares needed
3.5 hectares needed
2.7 hectares needed
103.1 hectares needed
30.8 hectares needed

Figure 5. Graph indicating the target goal and the percentage of goal met for Run A and B for each m
arine target for St. K
itts. W
here target goal was
not met the number of hectares needed to reach goal is indicated.
272.8 hectares needed
468.3 hectares needed
114.9 hectares needed
123.1 hectares needed

Figure 6. Graph indicating the target goal and the percentage of goal met for Run A and B for each terrestrial target for St. K
itts. W
here target goal
was not met the number of hectares needed to reach goal is indicated.
145.9 hectares needed
141.6 hectares needed


![The generation gap: implications for education and - [email protected]](https://img.pdfslide.us/doc/110x75/613d6c60736caf36b75d2866/the-generation-gap-implications-for-education-and-emailprotected.jpg)
