Embed Size (px)
Citation preview
Contributed Paper
Spatial, socio-economic, and ecological implicationsof incorporating minimum size constraints in marineprotected area network designKristian Metcalfe,∗§ Gregory Vaughan,† Sandrine Vaz,‡ and Robert J. Smith∗ ¶∗Durrell Institute of Conservation and Ecology (DICE), School of Anthropology and Conservation, University of Kent, Canterbury,Kent, CT2 7NR, United Kingdom†Geospatial Services, 2/35 Arthur Road, Holloway, London, United Kingdom‡Institut Francais de Recherche pour l’xploitation de la Mer (Ifremer), UMR MARBEC, Av. Jean Monnet, B.P.171, 34200 Sete, France§Centre for Ecology and Conservation, College of Life and Environmental Sciences, University of Exeter, Penryn Campus, Cornwall,TR10 9FE, UK, and Environment and Sustainability Institute, University of Exeter, Penryn Campus, Cornwall, TR10 9FE, UnitedKingdom
Abstract: Marine protected areas (MPAs) are the cornerstone of most marine conservation strategies, butthe effectiveness of each one partly depends on its size and distance to other MPAs in a network. Despite this,current recommendations on ideal MPA size and spacing vary widely, and data are lacking on how theseconstraints might influence the overall spatial characteristics, socio-economic impacts, and connectivity ofthe resultant MPA networks. To address this problem, we tested the impact of applying different MPA sizeconstraints in English waters. We used the Marxan spatial prioritization software to identify a network ofMPAs that met conservation feature targets, whilst minimizing impacts on fisheries; modified the Marxanoutputs with the MinPatch software to ensure each MPA met a minimum size; and used existing data onthe dispersal distances of a range of species found in English waters to investigate the likely impacts of suchspatial constraints on the region’s biodiversity. Increasing MPA size had little effect on total network area orthe location of priority areas, but as MPA size increased, fishing opportunity cost to stakeholders increased. Inaddition, as MPA size increased, the number of closely connected sets of MPAs in networks and the averagedistance between neighboring MPAs decreased, which consequently increased the proportion of the planningregion that was isolated from all MPAs. These results suggest networks containing large MPAs would bemore viable for the majority of the region’s species that have small dispersal distances, but dispersal betweenMPA sets and spill-over of individuals into unprotected areas would be reduced. These findings highlight theimportance of testing the impact of applying different MPA size constraints because there are clear trade-offsthat result from the interaction of size, number, and distribution of MPAs in a network.
Keywords: connectivity, Marxan, MinPatch, spatial conservation prioritization, spill-over and export, systematicconservation planning, viability
Implicaciones Espaciales, Socio-Economicas y Ecologicas de la Incorporacion de Limitantes de Tamano Mınimo alDiseno de Redes de Areas Marinas Protegidas
Resumen: Las areas marinas protegidas (AMPs) son el pilar de la mayorıa de las estrategias de conservacionmarina, pero la efectividad de cada una depende en parte de su tamano y de la distancia a otras AMPs enla red. A pesar de esto, las recomendaciones actuales para el tamano ideal de una AMP y el espaciado entreellas varıa ampliamente, y la informacion carece de datos sobre como estas limitantes influyen en general alas caracterısticas espaciales, los impactos socio-economicos y la conectividad de la red de AMPs resultante.Para atender este problema, evaluamos el impacto de la aplicacion de diferentes limitantes del tamano dela AMP en aguas inglesas. Utilizamos el software de priorizacion espacial Marxan para identificar una redde AMPs que cumpliera con los objetivos distintivos de la conservacion, a la vez que minimizara el impactode las pesqueras. Despues modificamos los resultados del Marxan con el software MinPatch para asegurar
¶Address correspondence to R.J. Smith, email [email protected] submitted March 21, 2014; revised manuscript accepted March 31, 2015.
1615Conservation Biology, Volume 29, No. 6, 1615–1625C© 2015 Society for Conservation BiologyDOI: 10.1111/cobi.12571
1616 Marine Protected Area Size
que cada AMP cumpliera con un tamano mınimo. Finalmente utilizamos datos existentes de las distanciasde dispersion de una gama de especies que se hallan en aguas inglesas para investigar los impactos probablesde dichas limitantes espaciales sobre la biodiversidad de la region. El incremento del tamano de la AMPtuvo un efecto mınimo sobre el total del area de la red o la ubicacion de areas prioritarias, pero conformeincremento el tamano de la AMP, el costo de la oportunidad de pesca para los accionistas incremento. Ademas,conforme incremento el tamano de la AMP, el numero de conjuntos de AMPs cercanamente conectados enlas redes y la distancia promedio entre las AMPs colindantes disminuyo, lo que en consecuencia incrementola proporcion de la region de planeacion que se aislo de todas las AMPs. Estos resultados sugieren que lasredes que contienen AMPs grandes serıan mas viables para la mayorıa de las especies de la region que tienendistancias de dispersion reducidas, pero la dispersion entre conjuntos de AMPs y el derrame de individuoshacia areas sin proteccion se verıa reducida. Estos hallazgos resaltan la importancia de evaluar el impactode la aplicacion de las diferentes limitantes de tamano de las AMPs ya que hay compensaciones evidentes queresultan de la interaccion del tamano, el numero y la distribucion de las AMPs en una red.
Palabras Clave: conectividad, derrame y exportacion, Marxan, MinPatch, planeacion sistematica de la conser-vacion, priorizacion de la conservacion espacial, viabilidad
Introduction
Marine protected areas (MPAs) can produce a widerange of ecological, economic, and social benefits,making them a cornerstone of most marine conservationstrategies (Klein et al. 2013). However, these benefitscan only accrue if MPA networks are well designed, soscientists have identified 6 ecological goals that shouldunderpin the design process: representation, replication,adequacy, viability, connectivity, and protection (Airameet al. 2003; Roberts et al. 2003; Edgar et al. 2014). Acommonly used approach to help achieve these goals in-volves identifying important conservation features (e.g.,species and habitat types), setting quantitative targetsfor how much of each feature should be conserved, andthen using conservation planning software to identifywhere new MPAs should be located to meet these targets(Moilanen et al. 2009). This approach is termed spatialconservation prioritization and addresses several stageswithin a systematic conservation planning framework byexplicitly accounting for MPA network representation,replication, and adequacy. These factors are accountedfor because the approach seeks to represent a range ofhabitats; includes replicates of each habitat, and identifiesa sufficient amount of each habitat for protection toadequately conserve a range of associated species,communities, and physical characteristics (Moilanenet al. 2009).
Marine conservation planning, however, needs tomove beyond simply representing biodiversity features,so there is increasing emphasis on incorporating targetsrelated to viability, connectivity, and protection withinthe planning process (Magris et al. 2014). Whilst the de-velopment of new conservation planning software nowbetter accounts for protection by letting users set targetsfor the amount of each feature allocated to different man-agement zones (Watts et al. 2009; Metcalfe et al. 2015),viability and connectivity targets are still rarely accountedfor in MPA network design (Magris et al. 2014). This isparticularly problematic because MPAs need to be large
enough to encompass the typical movements of speciesand support viable populations that are self-sustainingthroughout natural cycles of variation (Airame et al. 2003;Roberts et al. 2003) and be spaced close enough to main-tain connectivity between individual MPAs, a processlargely driven by dispersal of propagules and movementof adults (Palumbi 2003).
This is why design criteria such as the minimum sizeof and maximum spacing between MPAs are increasinglybeing adopted (Table 1). Such size and spacing targets aretypically developed to account for viability and connec-tivity goals by considering the movement and dispersalcharacteristics of a broad range of target species. Forexample, the minimum size of an MPA can be basedon the maximum home range of target species, andthe maximum spacing between MPAs can be based onthe dispersal requirements that would benefit the widestrange of species (Moffitt et al. 2010; Green et al. 2014).However, developing these targets is inherently difficultbecause marine organisms vary greatly in their movementability (Palumbi 2003; Shanks et al. 2003) and most MPAplanning initiatives lack dispersal data for species in thearea. Therefore, whilst studies of home ranges, tagging,and dispersal characteristics would ideally be used toinform size and spacing targets, practitioners often relyon previously developed rules of thumb.
Nevertheless, incorporating these size and spacingtargets into spatial prioritization analyses has untilrecently been restricted by the functionality of theavailable software. In particular, software such as Marxanand Zonation (Ball et al. 2009; Moilanen et al. 2009)allows users to influence only whether MPA networksare clumped or fragmented and not to set minimum sizeconstraints. This has had two negative effects. First, ithas been impossible to account for minimum MPA sizein spatial prioritization analyses, so planners typicallyhave to modify software outputs post hoc. Whilst suchmodifications are not unusual to meet stakeholderrequirements (Pressey et al. 2013), large changes arelikely to produce less efficient results (Moilanen et al.
Conservation BiologyVolume 29, No. 6, 2015
Metcalfe et al. 1617
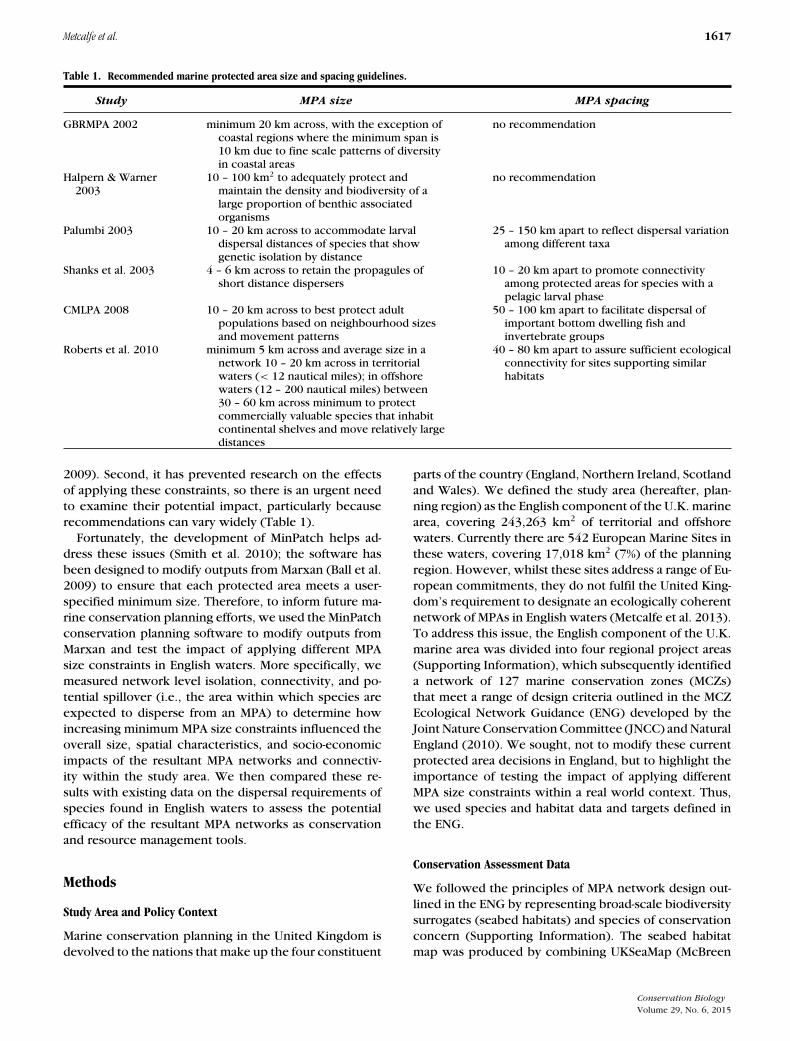
Table 1. Recommended marine protected area size and spacing guidelines.
Study MPA size MPA spacing
GBRMPA 2002 minimum 20 km across, with the exception ofcoastal regions where the minimum span is10 km due to fine scale patterns of diversityin coastal areas
no recommendation
Halpern & Warner2003
10 – 100 km2 to adequately protect andmaintain the density and biodiversity of alarge proportion of benthic associatedorganisms
no recommendation
Palumbi 2003 10 – 20 km across to accommodate larvaldispersal distances of species that showgenetic isolation by distance
25 – 150 km apart to reflect dispersal variationamong different taxa
Shanks et al. 2003 4 – 6 km across to retain the propagules ofshort distance dispersers
10 – 20 km apart to promote connectivityamong protected areas for species with apelagic larval phase
CMLPA 2008 10 – 20 km across to best protect adultpopulations based on neighbourhood sizesand movement patterns
50 – 100 km apart to facilitate dispersal ofimportant bottom dwelling fish andinvertebrate groups
Roberts et al. 2010 minimum 5 km across and average size in anetwork 10 – 20 km across in territorialwaters (< 12 nautical miles); in offshorewaters (12 – 200 nautical miles) between30 – 60 km across minimum to protectcommercially valuable species that inhabitcontinental shelves and move relatively largedistances
40 – 80 km apart to assure sufficient ecologicalconnectivity for sites supporting similarhabitats
2009). Second, it has prevented research on the effectsof applying these constraints, so there is an urgent needto examine their potential impact, particularly becauserecommendations can vary widely (Table 1).
Fortunately, the development of MinPatch helps ad-dress these issues (Smith et al. 2010); the software hasbeen designed to modify outputs from Marxan (Ball et al.2009) to ensure that each protected area meets a user-specified minimum size. Therefore, to inform future ma-rine conservation planning efforts, we used the MinPatchconservation planning software to modify outputs fromMarxan and test the impact of applying different MPAsize constraints in English waters. More specifically, wemeasured network level isolation, connectivity, and po-tential spillover (i.e., the area within which species areexpected to disperse from an MPA) to determine howincreasing minimum MPA size constraints influenced theoverall size, spatial characteristics, and socio-economicimpacts of the resultant MPA networks and connectiv-ity within the study area. We then compared these re-sults with existing data on the dispersal requirements ofspecies found in English waters to assess the potentialefficacy of the resultant MPA networks as conservationand resource management tools.
Methods
Study Area and Policy Context
Marine conservation planning in the United Kingdom isdevolved to the nations that make up the four constituent
parts of the country (England, Northern Ireland, Scotlandand Wales). We defined the study area (hereafter, plan-ning region) as the English component of the U.K. marinearea, covering 243,263 km2 of territorial and offshorewaters. Currently there are 542 European Marine Sites inthese waters, covering 17,018 km2 (7%) of the planningregion. However, whilst these sites address a range of Eu-ropean commitments, they do not fulfil the United King-dom’s requirement to designate an ecologically coherentnetwork of MPAs in English waters (Metcalfe et al. 2013).To address this issue, the English component of the U.K.marine area was divided into four regional project areas(Supporting Information), which subsequently identifieda network of 127 marine conservation zones (MCZs)that meet a range of design criteria outlined in the MCZEcological Network Guidance (ENG) developed by theJoint Nature Conservation Committee (JNCC) and NaturalEngland (2010). We sought, not to modify these currentprotected area decisions in England, but to highlight theimportance of testing the impact of applying differentMPA size constraints within a real world context. Thus,we used species and habitat data and targets defined inthe ENG.
Conservation Assessment Data
We followed the principles of MPA network design out-lined in the ENG by representing broad-scale biodiversitysurrogates (seabed habitats) and species of conservationconcern (Supporting Information). The seabed habitatmap was produced by combining UKSeaMap (McBreen
Conservation BiologyVolume 29, No. 6, 2015
1618 Marine Protected Area Size
et al. 2011) with intertidal habitat data (DEFRA 2010)and Mapping European Seabed Habitat (MESH) data forremaining gaps in coverage (Coltman et al. 2008). Theresult was 30 broad-scale habitats based on the EuropeanNature Information System (EUNIS) level 3 habitat classi-fication hierarchy. The species of conservation concernwere based on point distribution data for 26 species (fouralgae, two annelids, four small bony fish, seven cnidaria,three crustaceans, and six molluscs) that have a restricteddistribution and limited mobility and so require site basedprotection in each regional MCZ project area where theyoccur (JNCC & Natural England 2010). Species data weredownloaded from the U.K. National Biodiversity NetworkGateway (NBN 2010), and records were restricted tothose from 1980–2009 (n = 429) to better reflect theircurrent distribution.
Targets for 17 of the 30 habitats were developed usingthe species-area relationship based approach (JNCC &Natural England 2010); thus, they reflect the minimumamount of habitat area required to represent 80% ofspecies known to occur in each habitat type (SupportingInformation). Limited data meant that eight habitats didnot have targets specified in the ENG, so we set theseby calculating the mean of the targets for habitat typesbelonging to the same EUNIS level 3 habitat class. How-ever, none of the six deep-sea habitats had targets, sogiven they are only found at two locations, we set theirtargets as being the same as the habitat type with thehighest target listed in the ENG (Supporting Information).Species targets were developed to ensure that each MCZproject area contained a minimum of 3 replicates of eachspecies where they occur, with the exception of thosewith < 3 records whose targets were based on the totalnumber of records (Supporting Information).
To provide flexibility in the selection of priority areas ininshore waters, where there is more fine-scale variation inhabitat types than offshore (Supporting Information) andto address recommendations that MPAs in English watersshould generally be smaller inshore than those offshore(Roberts et al. 2010; Table 1), we divided the planningregion into 5 km2 and 25 km2 hexagonal planning unitsinshore (0–12 nautical miles) and offshore (> 12 nauti-cal miles), respectively. The boundaries of the hexagonswere then overlaid with a theme of existing EuropeanMarine Sites (Supporting Information), which resulted inMPAs that were divided up into hexagons or segments ofhexagons at their boundaries. We then removed planningunits that were <1 ha (0.01 km2; n = 579) to reduceprocessing time in MinPatch and calculated the amountof each conservation feature in the remaining planningunits (n = 22553).
Opportunity cost data are commonly used in spatialprioritization exercises to influence the location of MPAs.We used commercial fishing effort as our planning unitcost metric. We did not consider data from other sec-tors (e.g., energy production, shipping, and recreationalactivity), partly because of a lack of fine-scale data and
partly because combining data on these different indus-tries into one metric that accurately reflects potentialimpacts on each stakeholder was beyond the scope ofthis project. Data were based on U.K. vessels >15 m inlength (classified according to six gear types: dredges,hooks and lines, nets, seines, traps, and trawls) and de-rived from vessel monitoring system (VMS) data from2007 (Lee et al. 2010). To examine the relative valueof areas to fisheries, we combined the estimated fishingeffort reported as the time spent fishing (in hours) perunit area for each gear type to produce a single fishingeffort layer. We then calculated the cost for all planningunits based on the mean number of hours fished andmultiplied it by the area of each planning unit to reflectthe opportunity cost of excluding fishing within eachplanning unit (Supporting Information). To account forplanning units with no recorded VMS data, 1 was addedto the value of all planning units so there was a cost forselecting every planning unit.
Running the Conservation Assessment
Marxan is a systematic conservation planning softwarepackage that identifies near-optimal portfolios of plan-ning units that meet conservation feature targets whilstminimizing costs and reducing fragmentation levels.Marxan uses a simulated annealing approach to identifythese portfolios, which involves running the software anumber of times and identifying the best solution (i.e.,the portfolio with the lowest overall cost based on anobjective function that sums the combined planning unitcosts, penalty costs for any unmet targets, and a costbased on the portfolio’s boundary length) and a selectionfrequency output that counts the number of times eachplanning unit appears in the different portfolios (Ball et al.2009). We ran Marxan 200 times; each run consistedof 5 million iterations. Based on results of a sensitivityanalysis, we used a boundary length modifier (BLM) of0.25 because this represented an acceptable trade-offbetween minimizing the boundary of the selected areas(portfolio fragmentation) and minimizing the combinedplanning unit cost values of the portfolio (portfolio op-portunity cost) (Stewart & Possingham 2005). In addi-tion, we locked in each of the European Marine Sites sothat Marxan automatically selected these planning unitsand identified priority areas that met the current shortfallin the features targeted for protection. However, giventhat modifying the boundaries of European Marine Siteswould be politically contentious (Metcalfe et al. 2013)and that new MPAs are to be managed separately (JNCC& Natural England 2010), we excluded adjacent planningunits to ensure that Marxan would not modify these ex-isting European Marine Site boundaries.
MinPatch is a software package designed to modifyportfolios identified in Marxan so that each MPA meets auser-specified minimum size (Smith et al. 2010). For each
Conservation BiologyVolume 29, No. 6, 2015
Metcalfe et al. 1619
Marxan portfolio this involves identifying each planningunit cluster (hereafter, MPAs); removing all MPAs thatdo not meet minimum size thresholds (unless it formspart of an existing protected area network); adding en-tirely new planning unit clusters to form the basis of newMPAs of the minimum size; and removing planning units(through a process named simulated whittling) that arenot required to meet targets whilst minimizing bound-ary costs and ensuring each MPA meets the minimumsize. To best represent the range of MPA size guidelinesthat have been developed by MPA projects in the UnitedKingdom and internationally (Table 1), we modified Min-Patch so we could apply different MPA size constraints ininshore and offshore waters. We then used this updatedversion of MinPatch to modify each of the 200 portfoliosproduced by Marxan (scenario 1) to investigate four fur-ther scenarios (scenario 2, inshore 10 km2 and offshore90 km2; scenario 3, inshore 25 km2 and offshore 225km2; scenario 4, inshore 50 km2 and offshore 450 km2;scenario 5, inshore 100 km2 and offshore 900 km2).
To control whether new MPAs identified by MinPatchare compact or elongated, the user can adjust a parametercalled the added patch radius value (Smith et al. 2010).Thus, to ensure that the initial patches identified by Min-Patch did not contain many superfluous planning unitsand so could not be whittled down to elongated shapes,we specified an added patch radius value of the thresholdarea plus an additional 60% and set the BLM value used inthe simulated whittling stage to be the same value usedin the Marxan analysis.
Spatial, Socio-economic, and Ecological Implications
To identify the potential impact of applying differentMPA size constraints on the overall spatial characteris-tics and socio-economic impact of the resultant MPA net-works, we performed Spearman’s rank tests to determinethe similarity of the best outputs identified by Marxanand MinPatch (significance values were not recorded be-cause these data are influenced by spatial autocorrelation[Delavenne et al. 2012]) and used Kruskal–Wallis teststo determine whether differences existed in the mediannumber and area of individual MPAs and median area ofportfolios and planning unit costs. We also conductedpost-hoc Mann Whitney tests with Bonferroni correctionfor multiple comparisons to investigate differences be-tween scenarios.
To investigate the ecological implications of applyingdifferent MPA size constraints we conducted two spa-tial analyses on the best outputs for each Marxan andMinPatch portfolio (scenarios 1 through 5; n = 5). First,we investigated network level isolation and connectivitybased on the principle that MPA networks comprisedof more isolated MPAs (i.e., those with large distancesbetween their nearest neighboring MPA) are less likelyto contribute to the overall ecological coherence of the
network (Airame et al. 2003; Palumbi 2003). Therefore,for each scenario we used the “near” function in ArcGISto calculate both the average distance of each MPA toits nearest neighbor and the proportion of MPAs thatfell within six species dispersal distance classes. Theseclasses were based on a previous study that summarizedthe available movement data for species recorded inEnglish waters (Roberts et al. 2010). We also used theminimum bounding geometry function in ArcGIS to cal-culate the maximum width of each MPA in each scenarioand then calculated the proportion of MPAs that werewider than the six species dispersal distance classes toassess dispersal within MPAs.
Second, we investigated potential network levelspillover and export for each of these six species disper-sal classes. This analysis was based on the principle thatas populations within an MPA increase, both adult andjuvenile species will likely spillover or enhance surround-ing areas through export of larvae and other propagules(Palumbi 2003). So, here we set buffers around each MPAbased on the six dispersal classes and calculated the pro-portion of the planning region falling within each buffer.This procedure allowed us to quantify the potential areawithin which species in these classes are expected todisperse to and from MPAs, which is important becauseareas that are periodically disturbed by fisheries requirefunctional connectivity to MPAs to ensure populationsare replenished (Magris et al. 2014).
Results
Spatial and Socio-Economic Implications
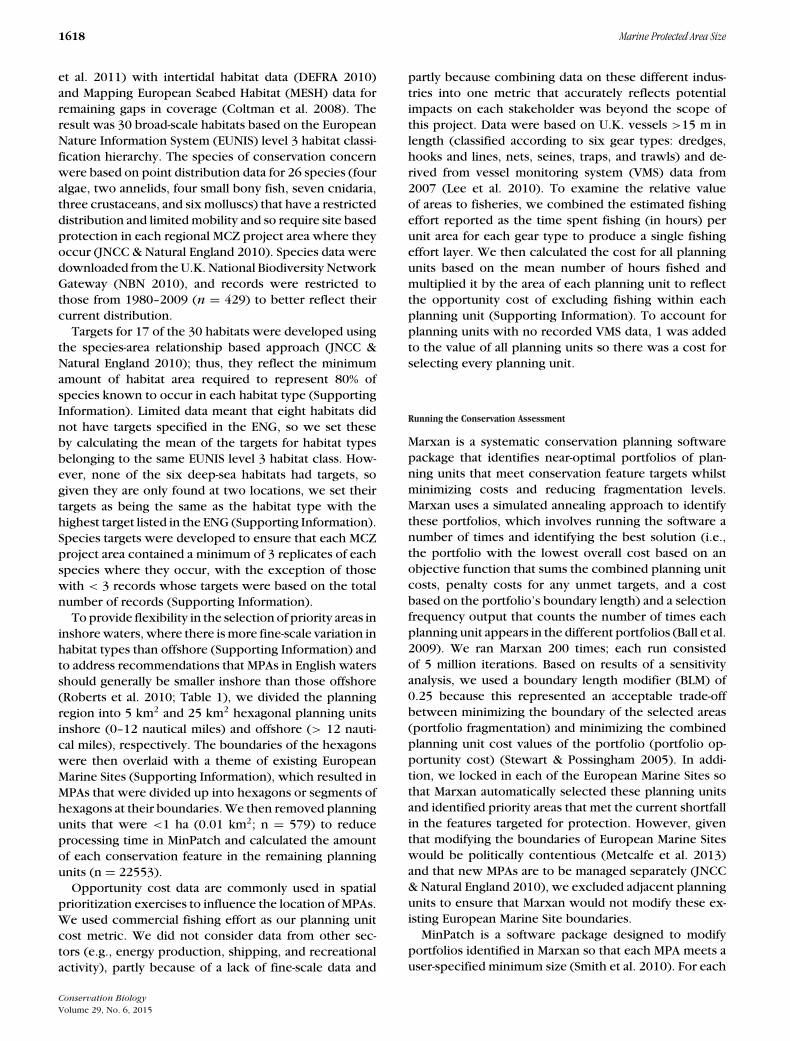
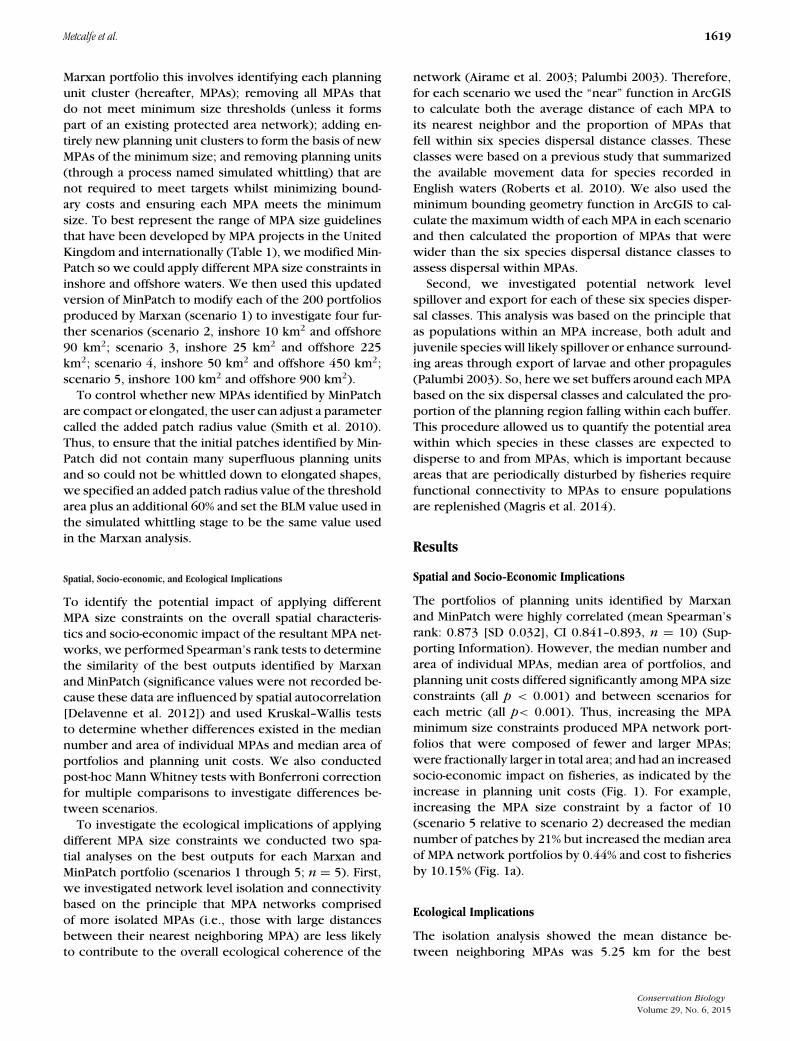
The portfolios of planning units identified by Marxanand MinPatch were highly correlated (mean Spearman’srank: 0.873 [SD 0.032], CI 0.841–0.893, n = 10) (Sup-porting Information). However, the median number andarea of individual MPAs, median area of portfolios, andplanning unit costs differed significantly among MPA sizeconstraints (all p < 0.001) and between scenarios foreach metric (all p< 0.001). Thus, increasing the MPAminimum size constraints produced MPA network port-folios that were composed of fewer and larger MPAs;were fractionally larger in total area; and had an increasedsocio-economic impact on fisheries, as indicated by theincrease in planning unit costs (Fig. 1). For example,increasing the MPA size constraint by a factor of 10(scenario 5 relative to scenario 2) decreased the mediannumber of patches by 21% but increased the median areaof MPA network portfolios by 0.44% and cost to fisheriesby 10.15% (Fig. 1a).
Ecological Implications
The isolation analysis showed the mean distance be-tween neighboring MPAs was 5.25 km for the best
Conservation BiologyVolume 29, No. 6, 2015
1620 Marine Protected Area Size
Figure 1. (a) The spatial and socio-economic characteristics of the 200 marine protected area (MPA) networkportfolios identified by each Marxan (1) and MinPatch (2 - 5) scenario and (b) selected planning units with thelowest total portfolio cost for each Marxan (1) and MinPatch (2 - 5) scenario.
Conservation BiologyVolume 29, No. 6, 2015
Metcalfe et al. 1621
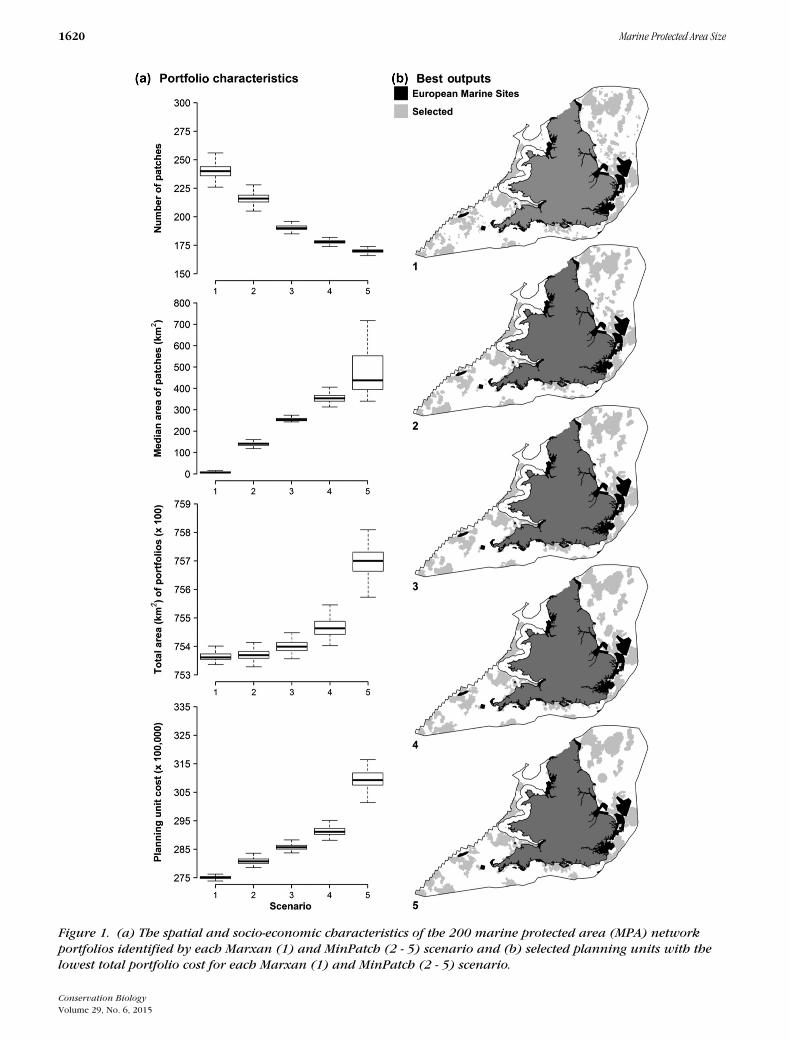
Figure 2. Ecological connectivity for speciesas reflected in (a) frequency distribution ofdispersal distances for 72 adult marinespecies for which data from English waterswere available (species categorized bydispersal class according to a logarithmicscale [0, 0–1, 1–10, 10–100, 100–1000 and1000-10000 km], data from Roberts et al.[2010]); (b) cumulative proportion of MPAsin each of the 6 classes of species dispersalfor each of the best outputs identified foreach Marxan (scenario 1) and MinPatch(scenarios 2 - 5) scenario; and (c)proportion of MPAs wider than each of the6 species dispersal classes for each of thebest outputs identified for each Marxan (1)and MinPatch (2 - 5) scenario.
output from the Marxan analysis (i.e., no minimum sizeconstraints). Distance range was 3.96-4.32 km for thebest outputs from the 4 MinPatch analyses (SupportingInformation). All the networks identified in our analysesallowed species in English waters to disperse between ev-ery individual MPA (Figs. 2a and 2b). Species with shorterdispersal distances were more restricted, especially thosethat disperse 0–1 km, although the proportion of MPAswithin their dispersal ranges varied between 0.254 for theMarxan analysis to 0.630 for the MinPatch analysis withthe highest minimum MPA size threshold (Fig. 2b). Thus,increasing the minimum size threshold promoted betterconnectivity between MPAs for short distance dispersers.
All the MPAs identified in all 5 analyses were wideenough for 81% of species to disperse within them,
whereas no MPAs were wide enough for the 2.7% ofspecies with dispersal ranges of 1,000-10,000 km (Fig.2c). However, for species with a dispersal distance of 10–1000 km, there was a general trend that increasing theminimum MPA size threshold increased the proportionof MPAs large enough for species to disperse withinthem (Fig. 2c).
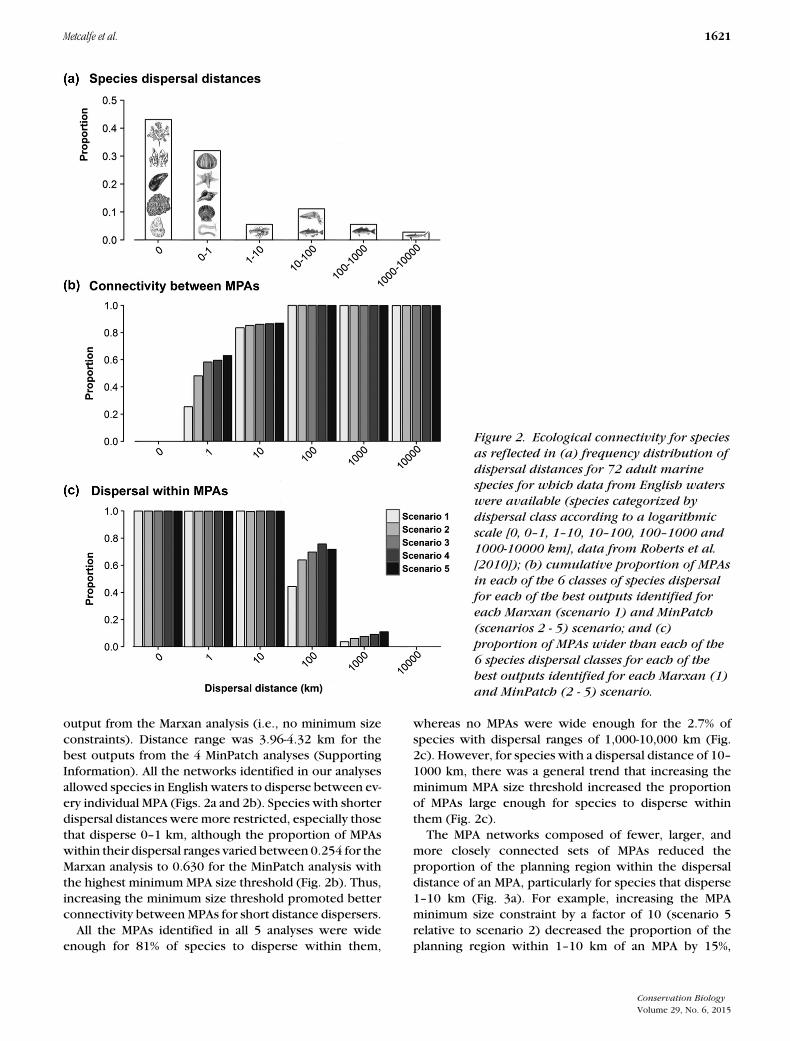
The MPA networks composed of fewer, larger, andmore closely connected sets of MPAs reduced theproportion of the planning region within the dispersaldistance of an MPA, particularly for species that disperse1–10 km (Fig. 3a). For example, increasing the MPAminimum size constraint by a factor of 10 (scenario 5relative to scenario 2) decreased the proportion of theplanning region within 1–10 km of an MPA by 15%,
Conservation BiologyVolume 29, No. 6, 2015
1622 Marine Protected Area Size
Figure 3. Contribution of marineprotected area (MPA) networks tosurrounding areas: (a) proportion ofplanning region within the 6 classesof species dispersal (0, 0–1, 1–10,10–100, 100–1000 and 1000-10000km) from the MPAs identified byMarxan in each of the best outputs(1) and by MinPatch (2 - 5) and(b) extent of spillover of species andexport of propagules intounprotected areas for each Marxan(1) and MinPatch (2 - 5) scenario.This highlights the changingproportions of the planning regionwithin dispersal distances of an MPAas the minimum size constraint onMPAs increases.
whereas the proportion of the planning region within10–100 km of an MPA increased by 12% (Fig. 3a). Thissuggests that incorporating MPA size constraints into thedesign process could potentially reduce the contributionvalue of MPAs to areas beyond their boundaries,particularly for short distance dispersers (Fig. 3b).
Discussion
A fundamental question in marine conservation plan-ning concerns the minimum size and spacing of MPAsin a network to ensure the persistence of features tar-geted for protection (Moffitt et al. 2010). However, until
Conservation BiologyVolume 29, No. 6, 2015
Metcalfe et al. 1623
recently, incorporating MPA size constraints into theplanning process, particularly within a systematic andtransparent framework, has been limited by the function-ality of existing spatial prioritization software. We arethe first to investigate potential trade-offs associated withapplying different MPA size constraints, so we consideredthe spatial, socio-economic and ecological implications ofincreasing the minimum size of MPAs.
Spatial and Socio-Economic Implications of MPA Size
Incorporating MPA size constraints into the planningprocess had very little impact on the overall locationof priority areas relative to those identified by Marxan(i.e., no minimum size constraints). Increasing MPA sizedid, however, have a significant impact on the overallcost of MPA network portfolios, whereby increasing theMPA minimum size constraint resulted in portfolios thatwere marginally larger but significantly more costly tostakeholders. This occurred because MPAs identified byMarxan were generally located in low cost areas, soMinPatch tended to remove planning units belonging tosmaller MPAs and either identified new MPAs of the spec-ified size in areas that were more important for fisheriesor added planning units at the more expensive edgesof MPAs of the specified minimum size already identi-fied by Marxan. Therefore, planning units in these loca-tions that were rarely selected by Marxan would have amuch higher selection frequency in MinPatch, resultingin MPA portfolios consisting of fewer and larger MPAswith a greater impact on stakeholders. These findingsecho those of previous studies that show that networks ofsmaller MPAs have lower opportunity costs (e.g., Stewart& Possingham 2005).
Ecological Implications of MPA Size
Our findings show that establishing MPA networkscontaining fewer and larger MPAs reduced the aver-age distance between neighboring MPAs. This proba-bly occurred because the ideal conditions for situatinglarge MPAs were not uniformly distributed, so MinPatchtended to select planning units in the same parts of theplanning region, removing the more isolated MPAs. Thismeant that applying these spatial constraints could en-hance network connectivity and increase species persis-tence by making it easier to disperse between individualMPAs (Palumbi 2003). This is in addition to the knownecological benefits that come from larger MPAs havingless edge, which reduces the potential impacts associatedwith “fishing the line,” (i.e., fishing effort is concentratedon MPA boundaries) (Stelzenmueller et al. 2008). How-ever, we also found that MPA networks composed offewer, larger, and less isolated sets of MPAs can havenegative implications on the potential value of a MPA net-work to contribute to surrounding areas. This is because
increasing MPA size reduced the number of isolated MPAsin a network and, as a consequence, increased both theproportion of the planning region beyond the dispersallimits of some species and outside the dispersal distanceof an MPA. These findings thus highlight the inherenttrade-offs involved in setting minimum size thresholds inMPA network design.
When considering these trade-offs, one needs to bemindful of the limitations of our approach. We didnot include measures of habitat quality, and such datashould ideally be used when available (Klein et al. 2013).More importantly, MinPatch only ensures that each MPAis above a certain size threshold and does not considerwhether each MPA is large enough to satisfy the habitatrequirements of individual species. Thus, it is possiblethat the MPAs may contain habitat patches that are nei-ther sufficient in size or condition to maintain viable pop-ulations of target species. However, incorporating suchminimum habitat requirements within MPA network de-sign is difficult (Gaines et al. 2010), given a frequent lackof relevant data and the complexity of the problem. Thus,in the absence of alternatives, we believe our MinPatch-based method can make an important contribution be-cause it provides an efficient approach for designing MPAnetworks (Smith et al. 2010) that meet the types of targetsand constraints used in real-world conservation planning,the aim of which is to benefit the widest range of species.
Understanding the Local Context
The trade-offs we identified also need to be consideredin the context of marine conservation in English waters.One key aspect comes from the previous finding that 92%of species found in this region have dispersal distancesof 100 km or less (Roberts et al. 2010). Thus, our resultssuggest that the U.K. should adopt a network of moder-ately sized MPAs that are relatively widely spaced (e.g.,scenario 2) (Fig. 1b) if it wants to meet its requirementto designate an ecologically coherent MPA network thatcontributes to fisheries (JNCC & Natural England 2010).Such a network would be more effective at promotingconnectivity between MPAs and increasing spillover intosurrounding areas relative to an MPA network of fewerand larger MPAs (e.g., scenario 5) (Fig. 1b). Moreover,if the objective of the U.K. Government is to balancesocio-economic interests with the need to improve thestatus of the marine environment, then such a networkof moderately sized MPAs is likely to be less politicallycontentious because there would be less overlap withimportant fishing areas. Though, larger MPAs are cheaperto establish and manage (Ban et al. 2011; McCrea-Strubet al. 2011).
However, given the dynamic nature of marine ecosys-tems, the optimal size of MPAs is also likely to dependon how these MPAs are managed (Roberts et al. 2010).For example, in contrast to partially protected areas,
Conservation BiologyVolume 29, No. 6, 2015
1624 Marine Protected Area Size
no-take MPAs are characterized by improved habitatcomplexity and structure as well as the increased abun-dance, biomass, density, and diversity of species (Lester& Halpern 2008). These MPAs are therefore likely tosupport larger and more natural population structuresand so export more propagules and remain connectedby exchange of offspring and larvae over larger distances(Birkeland & Dayton 2005; Roberts et al. 2010). The U.K.Government’s planning process did not set targets forhow much of the resultant network should be no-takeMPAs, and this has led to relatively few fully protectedsites being designated and to widespread criticism byconservation scientists (Carrington 2013). Thus, deci-sions about MPA network design need to account fora wide range of factors, and further work is needed toevaluate the impact of MPA size on population persis-tence for target species under different MPA managementscenarios.
Marine protected area size and spacing guidelines area simple and useful way to incorporate viability andconnectivity goals into the MPA network design pro-cess. However, our study demonstrates that practition-ers should approach the design of MPA networks as aniterative process, calibrating the optimal design by in-vestigating the trade-offs associated with MPA size onother network objectives. This is important consideringgovernments typically favor ease of establishment (i.e.,MPA networks that minimize conflict and cost) over theneed for ecological coherence and protection (Devillerset al. 2014). We found there were clear trade-offs be-tween MPA size and MPA impact on stakeholders andecological connectivity that were mediated by the inter-action of the size, number, and distribution of MPAs ina network. These findings thus highlight the importanceof testing the impact of applying MPA size constraintsbefore making recommendations about their adoption inMPA network design.
Acknowledgments
This work was funded by the European Union InterregIVA Programme as part of the Channel Integrated Ap-proach for Marine Resource Management Project. We aregrateful to Cefas, JNCC, and Natural England for providingdata and to J.E. Bicknell, C.M. Roberts, D.L. Roberts, B.Stoker, S. Wells, two anonymous reviewers, and C. Kleinfor constructive comments.
Supporting Information
Details of the conservation features and targets (Ap-pendix S1), Spearman’s rank correlations for each Marxanand MinPatch scenario (Appendix S2), conservationassessment data (Appendix S3), and mean distance
between neighboring MPAs for each Marxan and Min-Patch scenario (Appendix S4) are available online. Theauthors are solely responsible for the content and func-tionality of these materials. Queries (other than absenceof the material) should be directed to the correspondingauthors.
Literature Cited
Airame S, Dugan JE, Lafferty KD, Leslie H, McArdle DA, Warner RR.2003. Applying ecological criteria to marine reserve design: A casestudy from the California Channel Islands. Ecological Applications13:S170–S184.
Ball IR, Possingham HP, Watts ME. 2009. Marxan and relatives: Softwarefor spatial conservation prioritisation in A. Moilanen, K. A. Wilson,H. P. Possingham, editors. Spatial conservation prioritisation: Quan-titative methods and computational tools. Oxford University Press,Oxford, United Kingdom.
Ban NC, Adams V, Pressey RL, Hicks J. 2011. Promise and problems forestimating management costs of marine protected areas. Conserva-tion Letters 4:241–252.
Birkeland C, Dayton PK. 2005. The importance in fishery managementof leaving the big ones. Trends in Ecology & Evolution 20:356–358.
Carrington D. 2013. Scientists attack government climbdown on marineprotection. The Guardian 22 April: http://www.theguardian.com/environment/2013/apr/22/marine-scientists-government-marine-protection.
CMLPA (California Marine Life Protection Act). 2008. Master plan formarine protected areas. CMLPA, California Department of Fish &Game, Sacramento, CA, USA.
Coltman N, Golding N, Verling E. 2008. Developing a broadscale pre-dictive EUNIS habitat map for the MESH study area. JNCC, UnitedKingdom.
DEFRA (Department for Environment Food and Rural Affairs). 2010.Accessing and developing the required biophysical datasets anddata layers for marine protected areas network planning and widermarine spatial planning purposes. Report 24. DEFRA, London.
Delavenne J, Metcalfe K, Smith RJ, Vaz S, Martin CS, Dupuis L, CoppinF, Carpentier A. 2012. Systematic conservation planning in the east-ern English Channel: comparing the Marxan and Zonation decision-support tools. ICES Journal of Marine Science 69:75–83.
Devillers R, Pressey RL, Grech A, Kittinger JN, Edgar GJ, Ward T, WatsonR. 2014. Reinventing residual reserves in the sea: Are we favouringease of establishment over need for protection? Aquatic Conserva-tion: Marine and Freshwater Ecosystems. DOI: 10.1002/aqc.2445.
Edgar GJ, Stuart-Smith RD, Willis TJ, Kininmonth S, Baker SC, BanksS, Barrett NS, Becerro MA, Bernard AT, Berkhout J. 2014. Globalconservation outcomes depend on marine protected areas with fivekey features. Nature 506:216–220.
Gaines SD, Lester SE, Grorud-Colvert K, Costello C, Pollnac R. 2010.Evolving science of marine reserves: New developments and emerg-ing research frontiers. Proceedings of the National Academy of Sci-ences of the United States of America 107:18251–18255.
GBRMPA. 2002. Biophysical operating principles as recommended bythe Scientific Steering Committee for the Representative Areas Pro-gram. Technical information sheet 6. Great Barrier Reef Marine ParkAuthority, Townsville.
Green AL, Maypa AP, Almany GR, Rhodes KL, Weeks R, Abesamis RA,Gleason MG, Mumby PJ, White AT. 2014. Larval dispersal and move-ment patterns of coral reef fishes, and implications for marine re-serve network design. Biological Reviews. DOI: 10.1111/brv.12155.
Halpern BS, Warner RR. 2003. Matching marine reserve design to re-serve objectives. Proceedings of the Royal Society of London SeriesB-Biological Sciences 270:1871–1878.
Conservation BiologyVolume 29, No. 6, 2015
Metcalfe et al. 1625
JNCC (Joint Nature Conservation Committee and Natural England) andNatural England. 2010. Marine conservation zone project. Ecologicalnetwork guidance. JNCC, United Kingdom.
Klein CJ, Tulloch VJ, Halpern BS, Selkoe KA, Watts ME, Steinback C,Scholz A, Possingham HP. 2013. Tradeoffs in marine reserve de-sign: habitat condition, representation, and socioeconomic costs.Conservation Letters 6:324–332.
Lee J, South AB, Jennings S. 2010. Developing reliable, repeatable, andaccessible methods to provide high-resolution estimates of fishing-effort distributions from vessel monitoring system (VMS) data. ICESJournal of Marine Science 67:1260–1271.
Lester SE, Halpern BS. 2008. Biological responses in marine no-takereserves versus partially protected areas. Marine Ecology-ProgressSeries 367:49–56.
Magris RA, Pressey RL, Weeks R, Ban NC. 2014. Integrating connectivityand climate change into marine conservation planning. BiologicalConservation 170:207–221.
McBreen F, Askew N, Cameron A, Connor DW, Ellwood H, Carter A.2011. UKSeaMap 2010: Predictive mapping seabed habitats in UKwaters. Report 446. Joint Nature Conservation Committee, Pete-rborough, United Kingdom.
McCrea-Strub A, Zeller D, Sumaila UR, Nelson J, Balmford A, Pauly D.2011. Understanding the cost of establishing marine protected areas.Marine Policy 35:1–9.
Metcalfe K, Roberts TM, Smith RJ, Harrop SR. 2013. Marine conserva-tion science and governance in North-West Europe: conservationplanning and international law and policy. Marine Policy 39:289–295.
Metcalfe K, Vaz S, Engelhard GH, Villanueva MC, Smith RJ, Mackinson S.2015. Evaluating conservation and fisheries management strategiesby linking spatial prioritisation software and ecosystem and fisheriesmodelling tools. Journal of Applied Ecology 52:665–674.
Moffitt EA, Wilson White J, Botsford LW. 2010. The utility andlimitations of size and spacing guidelines for designing marine
protected area (MPA) networks. Biological Conservation 144:306–318.
Moilanen A, Wilson KA, Possingham HP, editors. 2009. Spatial Conser-vation prioritization: quantitative methods and computational tools.Oxford University Press, Oxford.
NBN (National Biodiversity Network). 2010. National Biodiversity Net-work gateway Version 3.4.1. NBN, United Kingdom. Available fromhttps://data.nbn.org.uk/.
Palumbi SR. 2003. Population genetics, demographic connectivity, andthe design of marine reserves. Ecological Applications 13:S146-S158.
Pressey RL, Mills M, Weeks R, Day JC. 2013. The plan of the day:Managing the dynamic transition from regional conservation designsto local conservation actions. Biological Conservation 166:155–169.
Roberts CM, et al. 2003. Ecological criteria for evaluating candidate sitesfor marine reserves. Ecological Applications 13:S199–S214.
Roberts CM, Hawkins JP, Fletcher J, Hands S, Raab K, Ward S. 2010.Guidance on the size and spacing of marine protected areas in Eng-land (NECR037). Commissioned report. Sheffield, United Kingdom.
Shanks AL, Grantham BA, Carr MH. 2003. Propagule dispersal distanceand the size and spacing of marine reserves. Ecological Applications13:S159–S169.
Smith RJ, Minin E, Linke S, Segan D, Possingham HP. 2010. An approachfor ensuring minimum protected area size in systematic conserva-tion planning. Biological Conservation 143:2525–2531.
Stelzenmueller V, et al. 2008. Spatial assessment of fishing effort aroundEuropean marine reserves: Implications for successful fisheries man-agement. Marine Pollution Bulletin 56:2018–2026.
Stewart RR, Possingham HP. 2005. Efficiency, costs and trade-offs in ma-rine reserve system design. Environmental Modeling & Assessment10:203–213.
Watts ME, Ball IR, Stewart RS, Klein CJ, Wilson K, Steinback C, LourivalR, Kircher L, Possingham HP. 2009. Marxan with Zones: software foroptimal conservation based land- and sea-use zoning. EnvironmentalModelling & Software 24:1513–1521.
Conservation BiologyVolume 29, No. 6, 2015