Embed Size (px)
Citation preview
Matt Smith, FCA, EA, MAAA,
State Actuary
Results of Actuarial Valuation and Demographic Experience Study
July 28, 2014
Offic
e o
f the S
tate
Actu
ary
1 O:\PFC\2014\OSA_July_28_Presentation.pptx
Today’s Presentation
Recap of results from latest experience study and actuarial valuation
Full presentation provided in June
Budget impact of assumption changes and updated contribution rates
Managing budget and rate impacts
Offic
e o
f the S
tate
Actu
ary
2 O:\PFC\2014\OSA_July_28_Presentation.pptx
Results Are Final
Concurrent actuarial audit now complete
No changes to preliminary results
Final reports available this fall and will reflect PFC action
Offic
e o
f the S
tate
Actu
ary
3 O:\PFC\2014\OSA_July_28_Presentation.pptx
Summary Of Updates To Current Assumptions From Experience Study
Mortality
Changes to reflect lower mortality rates since last study
Updates to projected increases in life spans
Increases short-term costs
Most significant assumption change in this experience study
Retirement
Changes to reflect later retirement; except in WSPRS
Decreases short-term costs
Termination
Changes to reflect fewer early career terminations; except TRS
Changes to reflect more late career terminations (20+ YOS)
Decreases short-term costs (due to TRS changes)
Offic
e o
f the S
tate
Actu
ary
4 O:\PFC\2014\OSA_July_28_Presentation.pptx
Summary Of Updates To Current Assumptions From Experience Study (Continued)
Disability
Minor adjustments made to most plans
Salary increases
Changes to “service based” salary increase assumptions
Lowered early career increases and increased/extended salary scale
Increases short-term costs
Miscellaneous assumptions
Increases short-term costs
Supporting data provided in Attachments A-G from June meeting
Offic
e o
f the S
tate
Actu
ary
5 O:\PFC\2014\OSA_July_28_Presentation.pptx
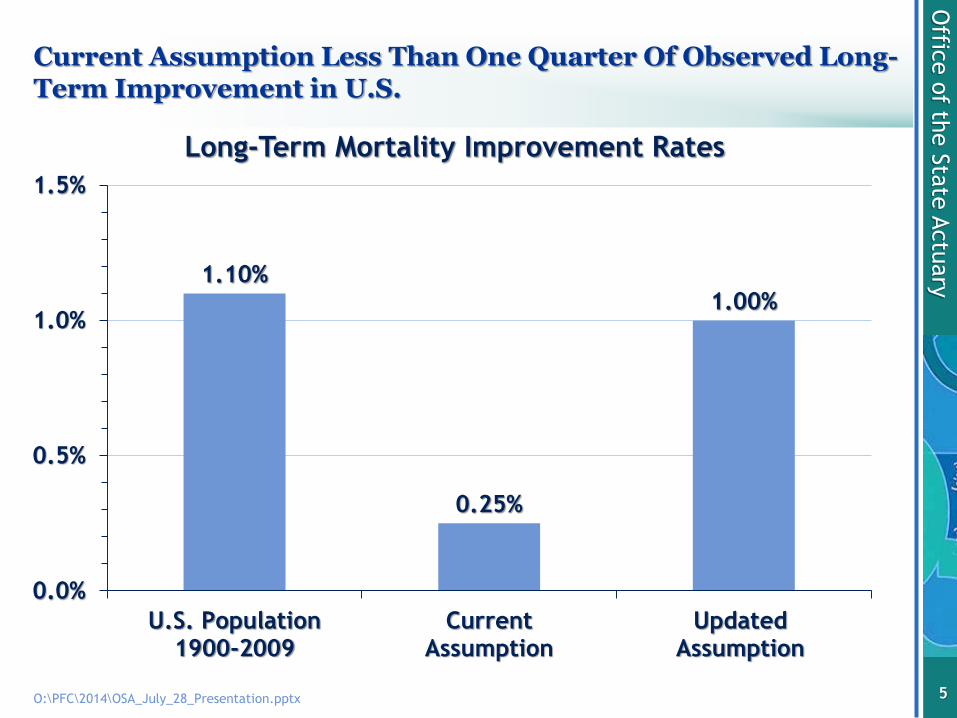
Current Assumption Less Than One Quarter Of Observed Long-Term Improvement in U.S.
1.10%
0.25%
1.00%
0.0%
0.5%
1.0%
1.5%
U.S. Population1900-2009
CurrentAssumption
UpdatedAssumption
Long-Term Mortality Improvement Rates
Offic
e o
f the S
tate
Actu
ary
6 O:\PFC\2014\OSA_July_28_Presentation.pptx
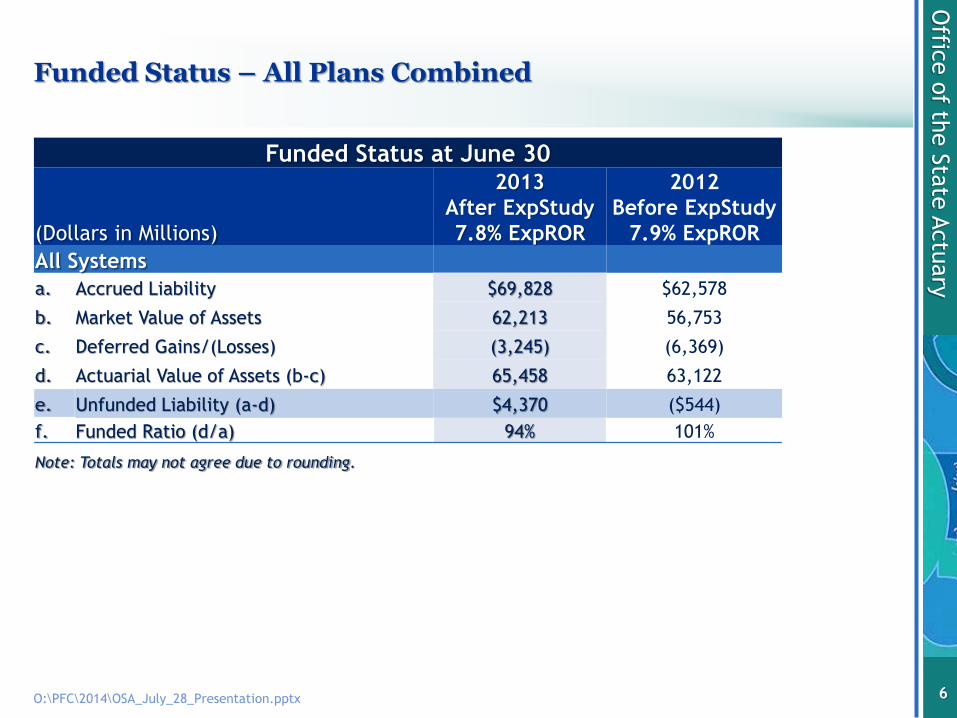
Funded Status – All Plans Combined
Funded Status at June 30
(Dollars in Millions)
2013
After ExpStudy
7.8% ExpROR
2012
Before ExpStudy
7.9% ExpROR
All Systems
a. Accrued Liability $69,828 $62,578
b. Market Value of Assets 62,213 56,753
c. Deferred Gains/(Losses) (3,245) (6,369)
d. Actuarial Value of Assets (b-c) 65,458 63,122
e. Unfunded Liability (a-d) $4,370 ($544)
f. Funded Ratio (d/a) 94% 101%
Note: Totals may not agree due to rounding.
Offic
e o
f the S
tate
Actu
ary
7 O:\PFC\2014\OSA_July_28_Presentation.pptx
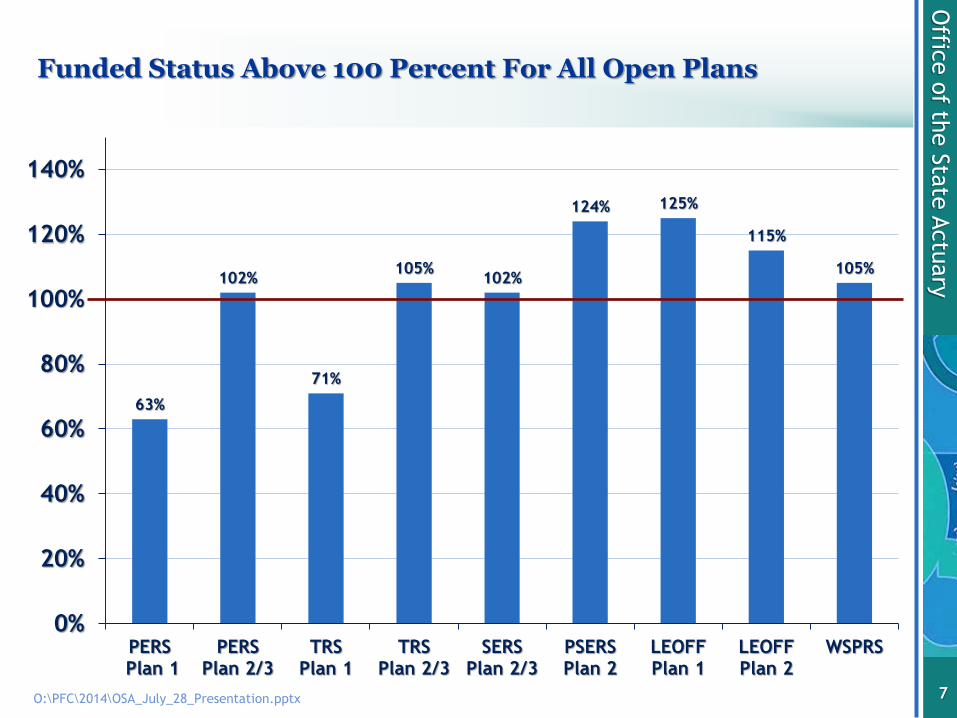
Funded Status Above 100 Percent For All Open Plans
63%
102%
71%
105% 102%
124% 125%
115%
105%
0%
20%
40%
60%
80%
100%
120%
140%
PERS Plan 1
PERSPlan 2/3
TRSPlan 1
TRSPlan 2/3
SERSPlan 2/3
PSERSPlan 2
LEOFFPlan 1
LEOFFPlan 2
WSPRS
Offic
e o
f the S
tate
Actu
ary
8 O:\PFC\2014\OSA_July_28_Presentation.pptx
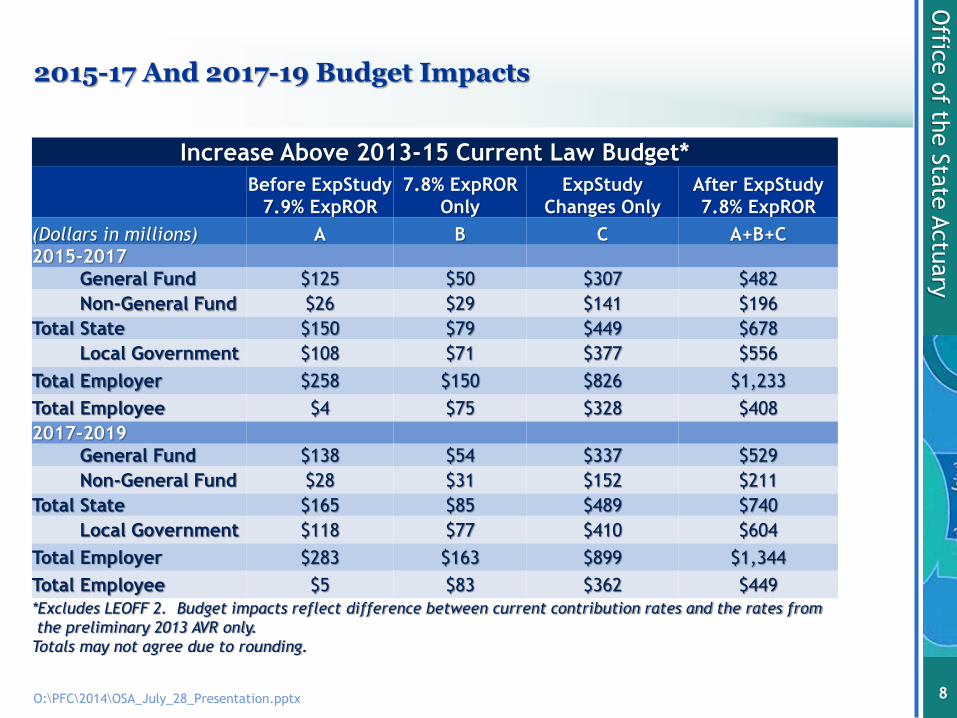
2015-17 And 2017-19 Budget Impacts
Increase Above 2013-15 Current Law Budget*
Before ExpStudy
7.9% ExpROR
7.8% ExpROR
Only
ExpStudy
Changes Only
After ExpStudy
7.8% ExpROR
(Dollars in millions) A B C A+B+C
2015-2017
General Fund $125 $50 $307 $482
Non-General Fund $26 $29 $141 $196
Total State $150 $79 $449 $678
Local Government $108 $71 $377 $556
Total Employer $258 $150 $826 $1,233
Total Employee $4 $75 $328 $408
2017-2019
General Fund $138 $54 $337 $529
Non-General Fund $28 $31 $152 $211
Total State $165 $85 $489 $740
Local Government $118 $77 $410 $604
Total Employer $283 $163 $899 $1,344
Total Employee $5 $83 $362 $449
*Excludes LEOFF 2. Budget impacts reflect difference between current contribution rates and the rates from
the preliminary 2013 AVR only.
Totals may not agree due to rounding.
Offic
e o
f the S
tate
Actu
ary
9 O:\PFC\2014\OSA_July_28_Presentation.pptx
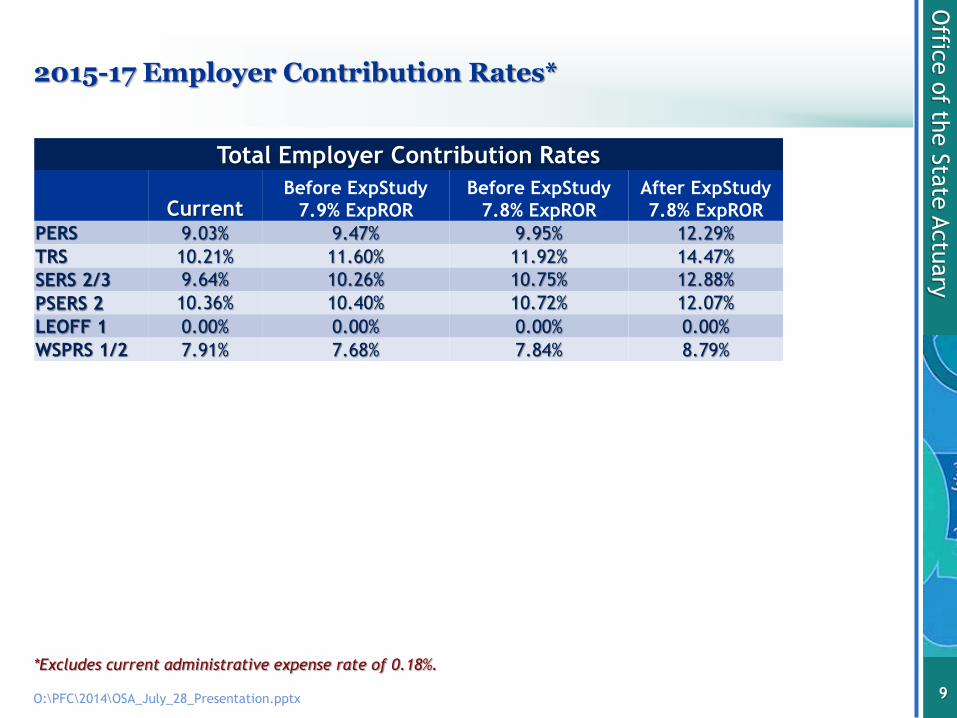
2015-17 Employer Contribution Rates*
*Excludes current administrative expense rate of 0.18%.
Total Employer Contribution Rates
Current Before ExpStudy
7.9% ExpROR
Before ExpStudy
7.8% ExpROR
After ExpStudy
7.8% ExpROR
PERS 9.03% 9.47% 9.95% 12.29%
TRS 10.21% 11.60% 11.92% 14.47%
SERS 2/3 9.64% 10.26% 10.75% 12.88%
PSERS 2 10.36% 10.40% 10.72% 12.07%
LEOFF 1 0.00% 0.00% 0.00% 0.00%
WSPRS 1/2 7.91% 7.68% 7.84% 8.79%
Offic
e o
f the S
tate
Actu
ary
10 O:\PFC\2014\OSA_July_28_Presentation.pptx
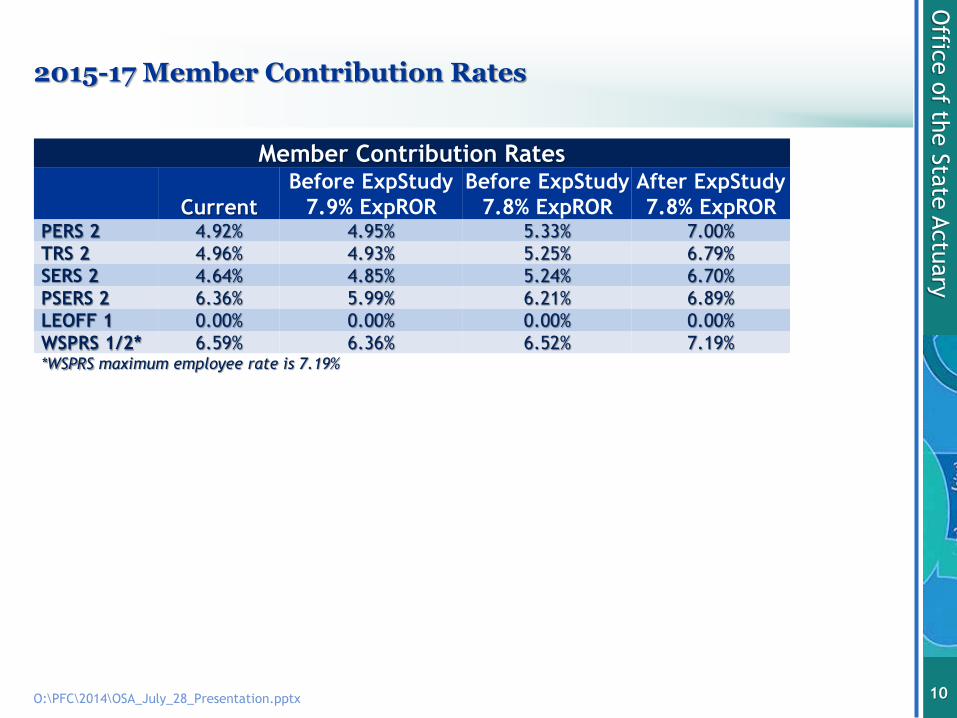
2015-17 Member Contribution Rates
Member Contribution Rates
Current
Before ExpStudy
7.9% ExpROR
Before ExpStudy
7.8% ExpROR
After ExpStudy
7.8% ExpROR PERS 2 4.92% 4.95% 5.33% 7.00%
TRS 2 4.96% 4.93% 5.25% 6.79%
SERS 2 4.64% 4.85% 5.24% 6.70%
PSERS 2 6.36% 5.99% 6.21% 6.89%
LEOFF 1 0.00% 0.00% 0.00% 0.00%
WSPRS 1/2* 6.59% 6.36% 6.52% 7.19% *WSPRS maximum employee rate is 7.19%
Offic
e o
f the S
tate
Actu
ary
11 O:\PFC\2014\OSA_July_28_Presentation.pptx
Managing Budget And Rate Impacts
PFC and Legislature may consider short-term funding policy changes
to manage the short-term impacts of assumption changes
Balancing act
Pay now or pay more later
Finding the sweet spot; affordable now and later
Options to manage budget and rate impacts
Recognize full cost and rate increases from assumption changes now; or
Spread cost of assumption changes over more than one biennium