Embed Size (px)
Citation preview
Level 31 / 35 Collins StreetMelbourne Vic 3000
T 03 8601 7000
—
—
Victorian Auditor -General’s Office
Results of 2017 Audits: Universities
2017–18: 20M
ay 2018
Independent assurance report to Parliament2017–18: 20
Results of 2017 Audits: Universities
May 2018
14874 VAGO_Results of 2017 Audits- Universities_Cover.pdf | Page 1 of 1 14874 VAGO_Results of 2017 Audits- Universities_Cover.pdf | Page 1 of 1


Results of 2017 Audits: Universities
Ordered to be published
VICTORIAN GOVERNMENT PRINTER
May 2018
PP no 395, Session 2014–18

This report is printed on Monza Recycled paper. Monza Recycled is certified Carbon Neutral by The Carbon Reduction Institute
(CRI) in accordance with the global Greenhouse Gas Protocol and ISO 14040 framework. The Lifecycle Analysis for Monza
Recycled is cradle to grave including Scopes 1, 2 and 3. It has FSC Mix Certification combined with 55% recycled content.
ISBN 978 1 925678 18 5

The Hon Bruce Atkinson MLC The Hon Colin Brooks MP
President Speaker
Legislative Council Legislative Assembly
Parliament House Parliament House
Melbourne Melbourne
Dear Presiding Officers
Under the provisions of section 16AB of the Audit Act 1994, I transmit my report Results of
2017 Audits: Universities.
Yours faithfully
Andrew Greaves
Auditor-General
23 May 2018


Victorian Auditor‐General’s Report Results of 2017 Audits: Universities 5
Contents
Report overview ........................................................................................................... 7
Conclusion ......................................................................................................................................... 7 Findings .............................................................................................................................................. 7 Recommendation ............................................................................................................................ 11 Responses to recommendation ....................................................................................................... 11
1 Context .................................................................................................................. 13
1.1 Legislative and reporting framework ..................................................................................... 15 1.2 Report structure ..................................................................................................................... 16
2 Results of audits .................................................................................................... 17
2.1 Financial report audit opinions ............................................................................................... 17 2.2 Key audit themes .................................................................................................................... 19 2.3 Quality of financial reporting in the sector ............................................................................ 20 2.4 Upcoming changes to Australian Accounting Standards ........................................................ 25
3 Internal controls .................................................................................................... 27
3.1 Internal control observations ................................................................................................. 27 3.2 Status of internal control issues raised in previous audits ..................................................... 30
4 Financial outcomes and sustainability .................................................................. 33
4.1 Conclusion .............................................................................................................................. 33 4.2 Financial results ...................................................................................................................... 34 4.3 A sustainable Victorian university sector ............................................................................... 36 4.4 Sustainable resource management ........................................................................................ 44 4.5 Asset maintenance ................................................................................................................. 48
Appendix A. Audit Act 1994 section 16—submissions and comments ..................... 57
Appendix B. Audit opinions ........................................................................................ 63
Appendix C. Financial reporting better practice elements ........................................ 65
Appendix D. Control issues risk ratings ...................................................................... 67
Appendix E. Financial sustainability risk indicators ................................................... 69
Appendix F. Glossary .................................................................................................. 75
6 Results of 2017 Audits: Universities Victorian Auditor‐General’s Report
Acronyms
AASB Australian Accounting Standards Board
ANAM Australian National Academy of Music
DET Department of Education and Training
EFTSL Total equivalent full‐time student load
FMA Financial Management Act 1994
HESA Act Higher Education Support Act 2003
TEQSA Act Tertiary Education Quality and Standards Agency Act 2011
VAGO Victorian Auditor‐General’s Office
Victorian Auditor‐General’s Report Results of 2017 Audits: Universities 7
Report overview
In Victoria, there are eight public universities, which control a further 50 entities
that we audit. Each year, we conduct the financial audits of these 58 entities.
This report outlines the results of these financial audits and our observations
for the year ended 31 December 2017. We also discuss asset maintenance and
management, and comment on the financial sustainability of the sector.
Overall, the university sector’s financial reports are reliable, except for those of
Deakin University and the University of Melbourne. The sector overall continues
to be financially and operationally sustainable, and its assets are being managed
well to meet future demand.
In contrast to the rest of the sector, Victoria University and Federation
University Australia have had declining financial results and student numbers.
Federation University Australia should still be sustainable in the medium term,
as it has significant financial assets and relatively low liabilities. Victoria
University needs to address its short‐term liquidity. Both universities should
review key aspects of their operations to ensure their viability in the long term.
Audit opinions
For the financial year ended 31 December 2017, we issued clear audit opinions
to six of the eight universities (six in 2016) and 41 of the 50 controlled entities
that we audit (50 of 51 in 2016).
At the date of this report, the audits of nine controlled entities had not been
finalised, as these entities had not yet signed their financial reports. This delay is
related to the small size of these entities, which can mean that the universities’
attention had been focused on completing their financial reports and those of
their larger consolidated entities. This led to delays in commencing the
preparation of the smaller entities’ financial reports.
Revenue recognition
We qualified the audit opinions for the financial reports of two entities
(three in 2016) because, in our opinion, the entities’ recognition of Australian,
state and local government financial assistance did not conform with Australian
Accounting Standards. This has caused a material misstatement in the financial
reports of:
Deakin University
the University of Melbourne.
In 2016, we qualified the financial reports of a third entity, the Australian
National Academy of Music (ANAM), for the same reason. Our audit of ANAM’s
financial report for 2017 was still in progress at the date of this report.
Conclusion
Findings
Controlled entities are entities that the universities receive benefits from, and are able to influence the extent of those benefits through any rights they have to direct the activities of those entities.
A qualified audit opinion is issued when the auditor concludes that a clear opinion cannot be expressed because of a conflict with the applicable reporting framework or a limitation of scope.
8 Results of 2017 Audits: Universities Victorian Auditor‐General’s Report
Revenue recognition is a longstanding issue in the sector. Deakin University
and the University of Melbourne have received this qualification for over
10 consecutive years. Within the next two years, new accounting standards on
revenue will become applicable. Now is the time for universities to review and
realign their accounting policies to ensure they comply with the new standards,
as this will require a significant amount of work.
Key audit themes
This year, AASB 124 Related Party Disclosures applied to the sector for the
first time. As a result, all universities needed to disclose information about
related‐party relationships and transactions if they were material. Overall, we
found that the universities’ processes for capturing and reporting the required
information were appropriate. Across the universities, most disclosures under
this standard related to relationships and transactions between the university
and private non‐government entities.
With no other significant changes to accounting standards applicable during the
year, all eight universities took the opportunity to partially or fully streamline
and simplify their financial reports. Their financial reports were more concise
and easier to understand. We encourage the sector to continue to improve and
enhance the relevance of financial reports to users.
Quality of financial reporting in the sector
We assessed the quality of the sector’s financial reporting by looking at the
timeliness of their financial reports, and the number and value of errors in draft
financial reports we identified during our audits. Overall, the sector continues to
produce quality financial reports, but there are areas for improvement.
Seven of the eight universities met the statutory deadline for finalising their
financial report (eight in 2016). Victoria University did not sign its 2017 financial
report until 19 April 2018 because more work was needed to assess the
assumptions and methodology the university and the valuer used to value the
university’s physical assets. This complex issue delayed Victoria University’s
financial report due to the material impact on its overall asset balances.
Across the sector, we identified a low error rate in the universities’ draft
financial reports, with university management correcting 70 per cent of the
errors found before the audit opinion was signed. The remaining errors were
immaterial, apart from the two resulting in the qualified opinions for Deakin
University and the University of Melbourne.
A related‐party relationship exists when a person or entity is linked to the entity preparing their financial report.
Financial statements refers to an entity’s comprehensive income statement, balance sheet, cash flow statement, and statement of changes in equity.
A financial report is a document that reports the financial outcome and position of an entity for a financial year. It comprises an entity’s financial statements, explanatory notes and a certification by the entity’s governing body.
Victorian Auditor‐General’s Report Results of 2017 Audits: Universities 9
The processes used by most universities for compiling and preparing their
financial reports for audit were sound. However, all universities could improve
their processes by implementing more rigorous quality control and assurance
procedures, especially by:
reviewing complex accounting matters early and ensuring that the
appropriate disclosures have been included in the draft financial report
reviewing large and unusual transactions earlier in the reporting process
reviewing key supporting documentation to check that it supports the
information in the draft financial report.
Internal controls
To the extent that we tested them, we found overall that the universities had
adequate internal controls to ensure reliable financial reporting. Consistent with
the previous years, the most significant area for improvement across the sector
remains its IT control environments. Universities rely heavily on their IT systems
and controls, and weaknesses in these systems increase the risk of undetected
fraud or errors. Additionally, entities with weaker IT control environments face
an increased risk of cyber‐security issues.
University management is taking corrective action on the issues we report—
two‐thirds of the issues we raised in prior years had been resolved during 2017.
Three high‐risk issues relating to the IT control environment at Deakin University
and Swinburne University of Technology remain unresolved more than
12 months after we first identified them. While we acknowledge the actions
the universities have taken to fix these control weaknesses, failure to do so in
a timely manner reduces the effectiveness of the internal control environment
at these entities.
Financial outcomes and sustainability
The sector generally remains financially sound, generating a combined net
result of $664 million for 2017 ($537 million in 2016). This positive outcome is
driven largely by student enrolments, which have increased by 17 per cent over
the past five years.
The growth in student numbers has allowed the sector to diversify its revenue.
While government grants continue to account for almost half of the sector’s
revenue, when compared to the national average, Victorian universities
are beginning to rely less on Commonwealth funding and more on fees
from international students. This diversification may assist these universities
in mitigating the possible impact from any potential changes to the
Commonwealth funding model.
10 Results of 2017 Audits: Universities Victorian Auditor‐General’s Report
While the overall sustainability of the sector continues to be strong, the
indicators for Victoria University and Federation University Australia are starting
to show that they may face financial sustainability issues in the longer term. In a
period of student growth and positive results for the sector, both universities:
experienced a fall in student numbers over the past five years
generated net result deficits in 2017
had weaker employee benefit ratios when compared to the rest of the
sector.
It would be prudent for these two universities to assess the relevance and
financial sustainability of their current course offerings, as well as their staff
profile. This may help them address any issues early.
Asset maintenance and management
To deliver its services, the sector held $15.1 billion of property, plant and
equipment assets at 31 December 2017 ($13.9 billion in 2016). It is important
that universities keep these assets in good condition and, when required,
replace them or add new assets.
Our review of asset indicators found that the sector is building or acquiring
new assets or replacing existing assets at a greater rate than the depreciation
of its existing assets, continuing a positive trend from 2016. The universities are
managing existing assets to make sure they continue to be fit for use.
A key part of ensuring that assets are maintained to appropriate standards
is to have a strong asset maintenance framework in place. We conducted a
review of the asset maintenance framework at each university and observed
that most universities have developed a framework that includes most of the
better practice elements we would expect to see. However, the frameworks
at Federation University Australia and Victoria University were relatively less
well developed. Weak frameworks reduce the entity’s ability to plan and
manage its maintenance expenditure, and increase the risk that assets may
not allow the university to deliver the required services.
We acknowledge that Victoria University is currently developing an asset
management framework that is intended to comply with ISO 55001:2014
Asset Management.
Overall, the sector has an asset maintenance and refurbishment backlog of
$1.13 billion at 31 December 2017 ($1.15 billion in 2016). However, when we
assess this backlog against the value of assets that need to be maintained, we
have established that, in general, the universities are keeping up with their
maintenance requirements.
One university, RMIT University, had all the elements of a better practice
asset maintenance framework in place. The asset life cycle model that
RMIT University uses to manage its asset portfolio allows it to better manage
the risks relating to its physical assets, and improves the effectiveness of and
accountability for its capital expenditure.
Victorian Auditor‐General’s Report Results of 2017 Audits: Universities 11
We recommend that universities:
1. strengthen their asset maintenance frameworks by, where necessary:
documenting and regularly reviewing their asset maintenance policy to
give effect to their asset maintenance strategies and plans
including in their asset maintenance policies funding requirements for
maintenance
using life cycle modelling as a basis for managing their asset
portfolios (see Section 4.5).
We have consulted with the Department of Education and Training (DET)
and the eight public universities in Victoria, and we considered their views
when reaching our audit conclusions. As required by section 16(3) of the
Audit Act 1994, we gave a draft copy of this report, or relevant extracts, to those
agencies and asked for their submissions or comments. We also provided a copy
of the report to the Department of Premier and Cabinet.
The following is a summary of those responses. The full responses are included
in Appendix A.
We received three submissions from the sector and a response from DET.
DET supports our recommendation.
Deakin University does not agree with our interpretation of the nature of its
revenue that resulted in us issuing a qualified audit opinion on its financial
report—this is discussed further in Part 2.
Deakin University has provided details of its plan to address the high‐risk IT
issue we discuss in Part 3.
Federation University Australia has accepted our findings. It has provided details
about how it intends to address the findings on the accuracy of its financial
report, its long‐term financial sustainability and its asset maintenance policies
and procedures.
Victoria University has provided details of how it plans to address its long‐term
financial sustainability risks.
Recommendation
Responses to recommendation

Victorian Auditor‐General’s Report Results of 2017 Audits: Universities 13
Context
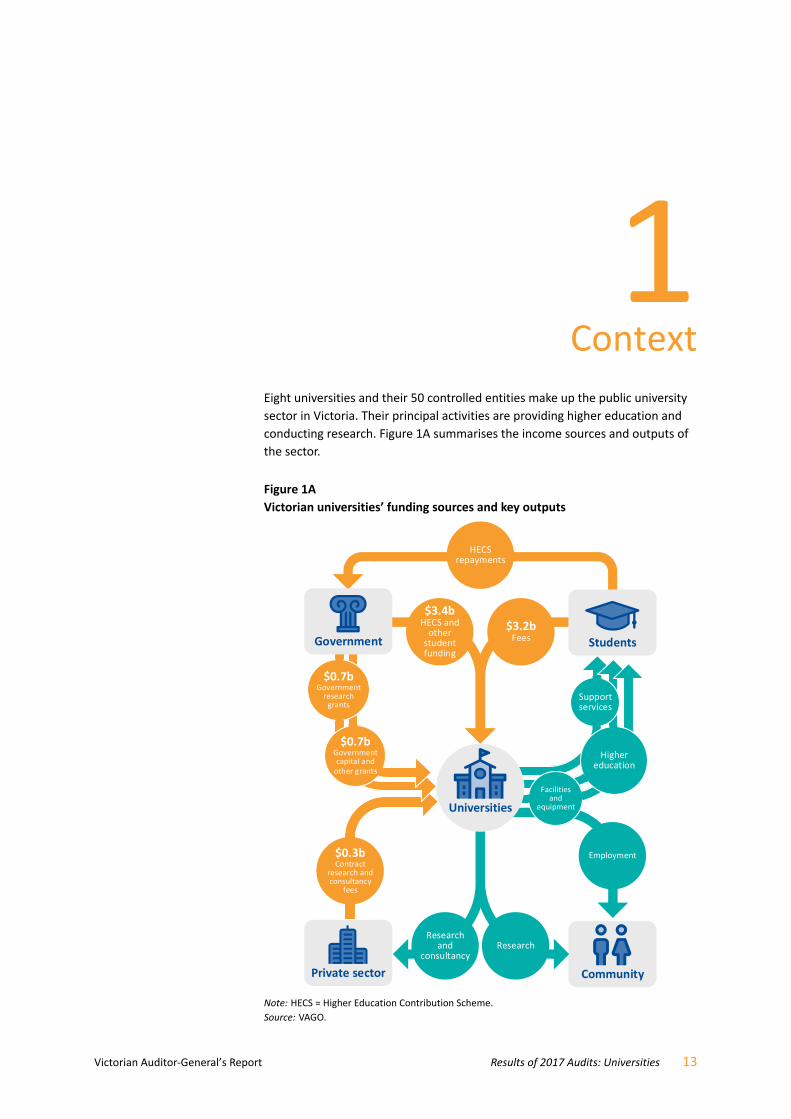
Eight universities and their 50 controlled entities make up the public university
sector in Victoria. Their principal activities are providing higher education and
conducting research. Figure 1A summarises the income sources and outputs of
the sector.
Figure 1A Victorian universities’ funding sources and key outputs
Note: HECS = Higher Education Contribution Scheme.
Source: VAGO.
HECS repayments
Students
Community
Employment
$3.4bHECS and other student funding
$3.2bFees
$0.3bContract
research and consultancy
fees
ResearchResearch
and consultancy
Universities
Private sector
Support services
Higher education
Government
$0.7bGovernment research grants
$0.7bGovernment capital and other grants
Facilities and
equipment
14 Results of 2017 Audits: Universities Victorian Auditor‐General’s Report
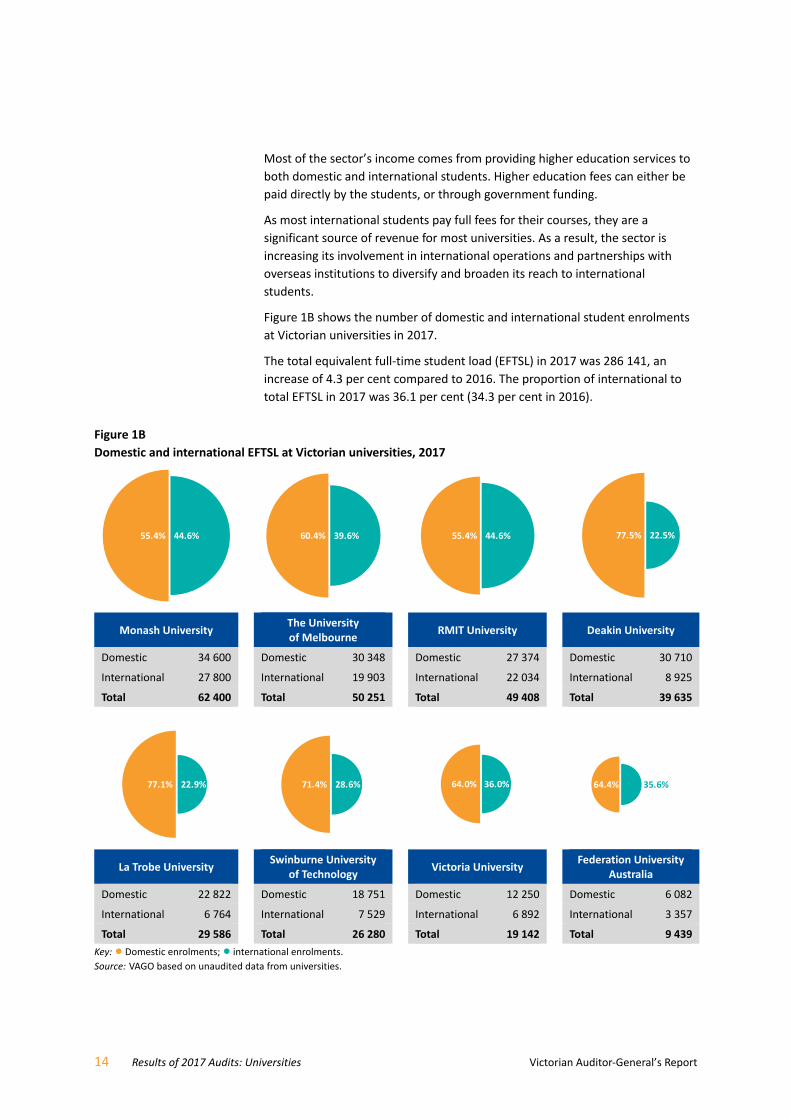
Most of the sector’s income comes from providing higher education services to
both domestic and international students. Higher education fees can either be
paid directly by the students, or through government funding.
As most international students pay full fees for their courses, they are a
significant source of revenue for most universities. As a result, the sector is
increasing its involvement in international operations and partnerships with
overseas institutions to diversify and broaden its reach to international
students.
Figure 1B shows the number of domestic and international student enrolments
at Victorian universities in 2017.
The total equivalent full‐time student load (EFTSL) in 2017 was 286 141, an
increase of 4.3 per cent compared to 2016. The proportion of international to
total EFTSL in 2017 was 36.1 per cent (34.3 per cent in 2016).
Figure 1B Domestic and international EFTSL at Victorian universities, 2017
Monash University The University of Melbourne
RMIT University Deakin University
Domestic 34 600 Domestic 30 348 Domestic 27 374 Domestic 30 710
International 27 800 International 19 903 International 22 034 International 8 925
Total 62 400 Total 50 251 Total 49 408 Total 39 635
La Trobe University Swinburne University
of Technology Victoria University
Federation University Australia
Domestic 22 822 Domestic 18 751 Domestic 12 250 Domestic 6 082
International 6 764 International 7 529 International 6 892 International 3 357
Total 29 586 Total 26 280 Total 19 142 Total 9 439
Key: Domestic enrolments; international enrolments.
Source: VAGO based on unaudited data from universities.
55.4% 44.6% 60.4% 39.6% 55.4% 44.6% 77.5% 22.5%
77.1% 22.9% 71.4% 28.6% 64.0% 36.0% 64.4% 35.6%
Victorian Auditor‐General’s Report Results of 2017 Audits: Universities 15
One of the unique features of universities, when compared to other higher
education providers, is that they conduct research. This contributes to
expanding knowledge and advancing technology not just in the state, but also
nationally and globally. This research is funded by both public and private
sources.
The remainder of the sector’s income comes from other sources, such as:
investment income
capital grants from the Commonwealth and state governments
rents from operating leases
fees for other ancillary services such as accommodation, and health and
fitness facilities.
The universities and their controlled entities are subject to a range of complex
accountability and financial reporting frameworks, with many and varied
reporting requirements.
In Victoria, public universities are established by their own respective enabling
legislations. As a result, they fall within the definition of a public body under the
Financial Management Act 1994 (FMA) and must comply with its requirements
for the preparation of annual financial reports. However, since the universities
are not controlled by the State of Victoria, their financial results are not
consolidated into the state’s annual financial report.
From the perspective of the Commonwealth, universities:
are registered with the Tertiary Education Quality and Standards Agency
and are, therefore, subject to the regulation of the Tertiary Education
Quality and Standards Agency Act 2011 (TEQSA Act)
receive the majority of their grant funding from the Commonwealth
Government and fall within the scope of any legislation associated with this
funding, including the Higher Education Support Act 2003 (HESA Act).
The TEQSA and HESA Acts, and many of the funding agreements that underpin
the funding universities receive for research and other purposes, also impose
other financial reporting requirements on the universities in addition to the
requirements of the state‐legislated FMA. The Commonwealth requires some
of these reporting requirements to be included in universities’ annual financial
reports. As a result, universities’ annual financial reports contain disclosures
that are not usually found in general‐purpose financial reports.
Many universities and their controlled entities are registered charities with the
Australian Charities and Not‐for‐profits Commission. This means they have
further reporting obligations under the Australian Charities and Not-for-profits
Commission Act 2012.
Entities controlled by the universities do not automatically fall within the scope
of the FMA, but may be required by the respective enabling legislation of their
parent university to produce financial reports in a form approved by the
minister administering part 7 of the FMA.
1.1 Legislative and reporting
framework
16 Results of 2017 Audits: Universities Victorian Auditor‐General’s Report
In this report, we provide information on the outcomes of our financial audits
of the eight Victorian universities and their 50 controlled entities for the year
ended 31 December 2017. The financial results of controlled entities are
consolidated into those of their respective parent entities. We restrict our
comments on the controlled entities to the extent that they are relevant and
significant to the consolidated results of their respective groups.
We identify and report on the key matters arising from our audits and analyse
the information included in the universities’ financial reports.
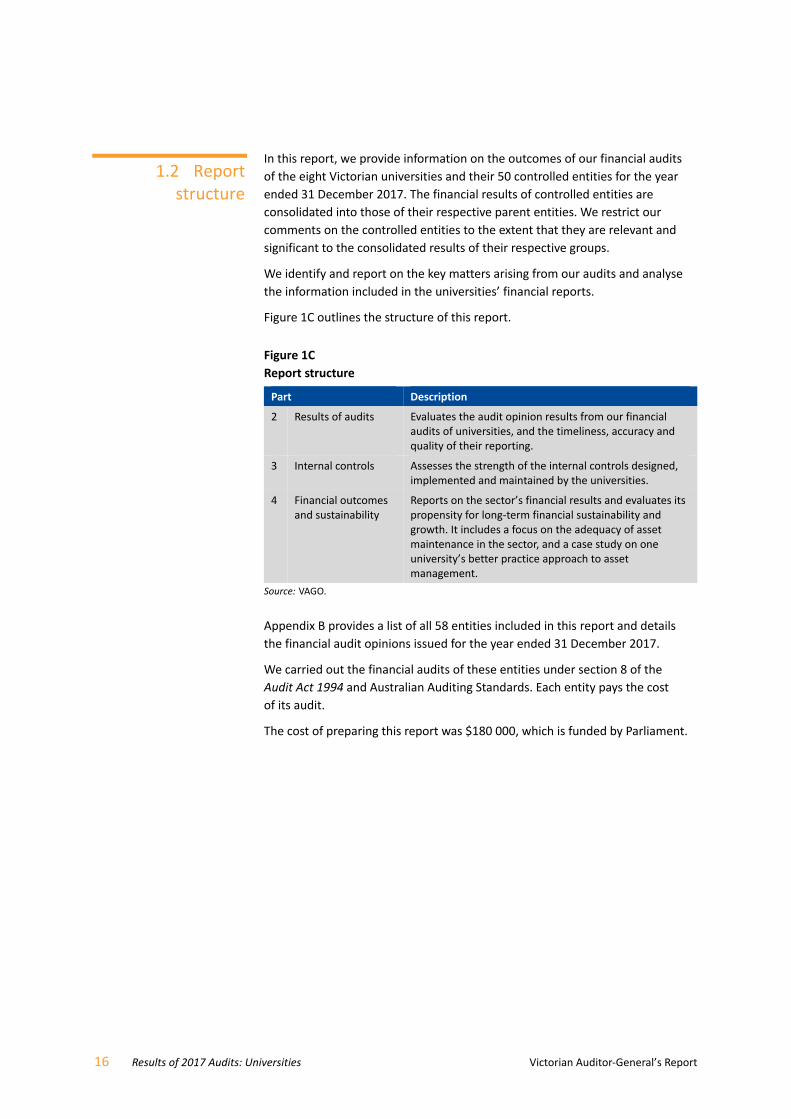
Figure 1C outlines the structure of this report.
Figure 1C Report structure
Part Description
2 Results of audits Evaluates the audit opinion results from our financial audits of universities, and the timeliness, accuracy and quality of their reporting.
3 Internal controls Assesses the strength of the internal controls designed, implemented and maintained by the universities.
4 Financial outcomes and sustainability
Reports on the sector’s financial results and evaluates its propensity for long‐term financial sustainability and growth. It includes a focus on the adequacy of asset maintenance in the sector, and a case study on one university’s better practice approach to asset management.
Source: VAGO.
Appendix B provides a list of all 58 entities included in this report and details
the financial audit opinions issued for the year ended 31 December 2017.
We carried out the financial audits of these entities under section 8 of the
Audit Act 1994 and Australian Auditing Standards. Each entity pays the cost
of its audit.
The cost of preparing this report was $180 000, which is funded by Parliament.
1.2 Report structure
Victorian Auditor‐General’s Report Results of 2017 Audits: Universities 17
Results of audits
Independent audit opinions add credibility to financial reports by providing
reasonable assurance that the information reported is reliable and accurate.
A clear audit opinion confirms that the financial report presents fairly the
transactions and balances for the reporting period, in keeping with the
requirements of relevant accounting standards and applicable legislation.
We carried out our financial audits of the entities in the university sector in
accordance with Australian Auditing Standards.
We issued clear audit opinions for the financial year ended 31 December 2017
to six of the eight universities (six in 2016) and 41 of the 50 controlled entities
(50 of 51 in 2016). We included an emphasis of matter paragraph in the audit
opinions of two of the 41 controlled entities, due to these entities preparing
financial reports for the special purpose of meeting minimum reporting
requirements of the Australian Charities and Not‐for‐profits Commission. These
financial reports were not prepared in accordance with a general purpose
framework.
At the date of this report, the audits of nine controlled entities had not been
finalised. Appendix B provides a list of the dates we issued our auditor’s reports.
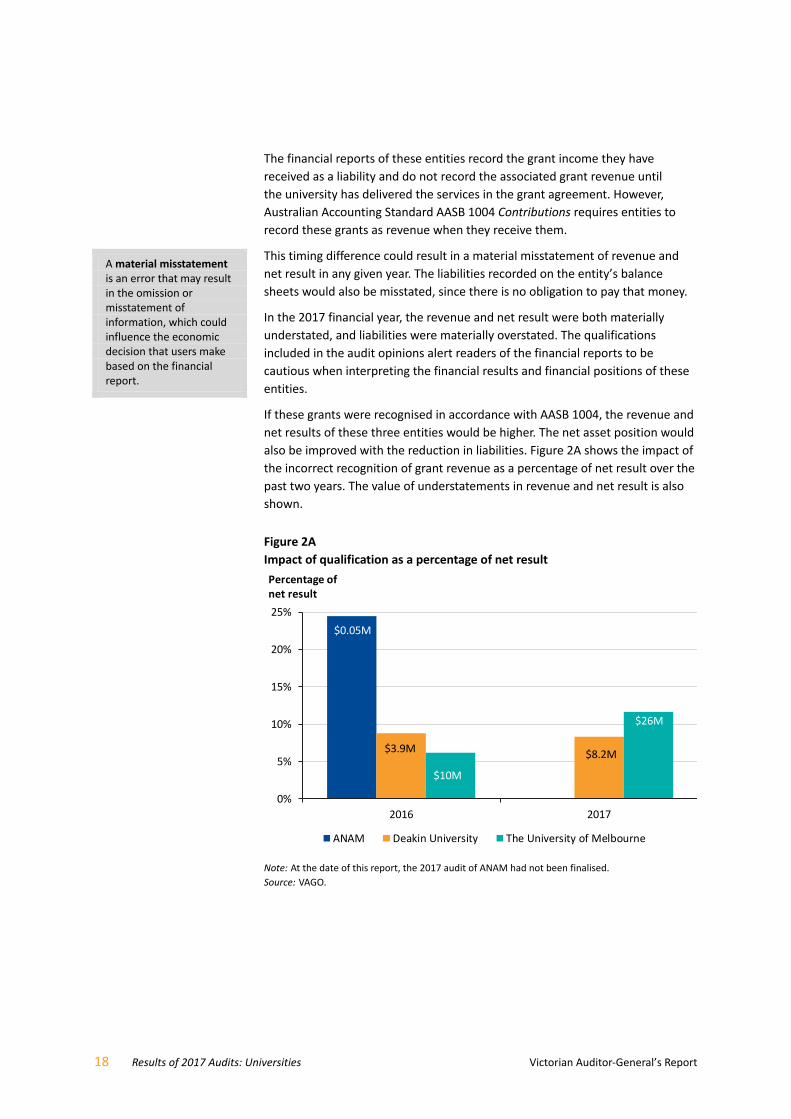
Incorrect recognition of grant revenue
We qualified the audit opinions of two entities’ financial reports in 2017
(three in 2016) because, in our opinion, their recognition of Australian, state
and local government financial assistance did not conform with Australian
Accounting Standards. This has caused a material misstatement in the financial
reports of:
Deakin University
the University of Melbourne.
In 2016, we also qualified the financial report of ANAM. At the date of this
report, our audit of ANAM had not been finalised.
2.1 Financial report audit
opinions
Emphasis of matter is a paragraph included in an audit opinion that refers to a matter appropriately presented or disclosed in the financial report that, in the auditor’s judgement, is of such importance that it is fundamental to users’ understanding of the financial report.
18 Results of 2017 Audits: Universities Victorian Auditor‐General’s Report
The financial reports of these entities record the grant income they have
received as a liability and do not record the associated grant revenue until
the university has delivered the services in the grant agreement. However,
Australian Accounting Standard AASB 1004 Contributions requires entities to
record these grants as revenue when they receive them.
This timing difference could result in a material misstatement of revenue and
net result in any given year. The liabilities recorded on the entity’s balance
sheets would also be misstated, since there is no obligation to pay that money.
In the 2017 financial year, the revenue and net result were both materially
understated, and liabilities were materially overstated. The qualifications
included in the audit opinions alert readers of the financial reports to be
cautious when interpreting the financial results and financial positions of these
entities.
If these grants were recognised in accordance with AASB 1004, the revenue and
net results of these three entities would be higher. The net asset position would
also be improved with the reduction in liabilities. Figure 2A shows the impact of
the incorrect recognition of grant revenue as a percentage of net result over the
past two years. The value of understatements in revenue and net result is also
shown.
Figure 2A Impact of qualification as a percentage of net result
Note: At the date of this report, the 2017 audit of ANAM had not been finalised.
Source: VAGO.
$0.05M
$8.2M$3.9M
$26M
$10M
0%
5%
10%
15%
20%
25%
2016 2017
Percentage of net result
ANAM Deakin University The University of Melbourne
A material misstatement is an error that may result in the omission or misstatement of information, which could influence the economic decision that users make based on the financial report.

Victorian Auditor‐General’s Report Results of 2017 Audits: Universities 19
Revenue recognition is a longstanding issue in the sector. Deakin University
and the University of Melbourne have received this qualification for over
10 consecutive years. This situation may change when new revenue standards
are introduced within the next two years. This is an opportune time for the
universities to review and realign their accounting policies, as complying with
these standards will require a significant amount of work. See Section 2.4 for
further information about the new standards.
Each financial year, as we plan our audit work across the sector, we seek to
identify key audit risks. We communicate these key risks in our audit strategy
documents, which we present to those charged with governance at each
university before the end of the financial year. These risks, if not addressed,
may lead to material misstatements in financial reporting.
The similar nature of universities means that there are often common risk
themes across the sector.
The main themes influencing the financial reporting by universities for the year
ended 31 December 2017 were:
the implementation of Australian Accounting Standard AASB 124 Related
Party Disclosures
streamlining of financial reports.
AASB 124 Related Party Disclosures
The most significant change this year was the requirement for not‐for‐profit
entities to apply AASB 124 Related Party Disclosures for the first time. This
meant that all universities needed to disclose information about material
related‐party relationships and transactions that may have affected their
financial performance or position. The application of AASB 124 created
challenges for both those preparing financial reports and for their auditors,
in making sure the information disclosed was complete and accurate.
Across the sector, material related‐party relationships that required disclosure
included:
key management personnel and their close family members
other entities controlled by key management personnel
all other entities controlled by the university.
The level of disclosures varied across the sector. In total, 72 per cent of the
related‐party relationships and transactions that the universities disclosed
regarding key management personnel were with private non‐government
entities.
Overall, we found the universities had appropriate processes in place to capture
and disclose the information needed to meet the requirements of AASB 124.
2.2 Key audit themes
Materiality—in the context of financial reporting, information is material if its omission, misstatement or non‐disclosure has the potential to affect the economic decisions of users of the financial report, or the discharge of accountability by management or those charged with governance.
The size, value and nature of the information and the circumstances of its omission or misstatement help in deciding how material it is.
20 Results of 2017 Audits: Universities Victorian Auditor‐General’s Report
Streamlining of financial reports
Streamlined financial reports aim to:
comply with the Australian Accounting Standards and relevant legislation
present only relevant information by removing disclosures that are not
material in the context of the financial report taken as a whole
tailor the presentation of financial information to focus on the objectives,
service delivery, financial performance and financial position of the
university
enhance the report’s readability and make it more user friendly.
Although streamlining was not mandatory for universities, we were encouraged
that all eight universities took the opportunity to partially or fully streamline
their financial reports to realign and refresh the structure and content.
Overall, we found the readability of the financial reports for the sector has
improved. Four of the eight universities further simplified their financial reports
by reducing the volume of irrelevant note disclosures. This resulted in a more
concise financial report.
The sector can further customise and improve the usefulness of financial
reports by:
removing immaterial disclosures in the context of an individual university’s
financial report to increase relevance
grouping immaterial items on the financial statements and streamlining the
presentation.
We encourage the sector to continue to streamline and enhance the relevance
of financial reports for users. The materiality assessment is critical to the
streamlining process—entities should document this assessment and seek input
from key stakeholders, such as audit committees and auditors.
Two important and inter‐related quality attributes of financial reporting are the
timeliness of the published financial reports and the accuracy of draft reports
presented for audit.
Timeliness
Timely financial reports enable users to make better‐informed and prompt
decisions. The later financial reports are produced after year‐end, the less useful
they become.
In line with the FMA, universities and their controlled entities must finalise their
financial reports and have them audited within 12 weeks after 31 December
each year.
2.3 Quality of financial reporting
in the sector

Victorian Auditor‐General’s Report Results of 2017 Audits: Universities 21
As shown in Figure 2B, seven of the eight universities met the statutory deadline
for finalising their financial reports. In 2016, all universities met the statutory
deadline.
Figure 2B Timeliness of universities’ financial reports
Source: VAGO.
Figure 2B shows one university, Victoria University, took more than 12 weeks
to finalise its financial report in 2017. Victoria University did not meet the
statutory deadline because more work was needed to assess the assumptions
and methodology the university and the valuer used in the valuation of the
university’s physical assets. This complex issue caused delays and meant the
university’s financial report was signed on 19 April 2018.
Streamlining financial reports can help universities to further improve their
timeliness by allowing management and auditors to focus on the areas that are
relevant to the users of the reports. This should help universities to improve
their reporting time lines in the future.
Accuracy
We measure the accuracy of draft financial reports by the number and size of
the errors we identify through our audit. Ideally, there should be no errors or
adjustments required as a result of an audit.
A quality draft financial report with few or no errors allows the audit to
be finalised on time and statutory deadlines to be met. It also signals to
management that the entity has effective financial reporting and quality
assurance processes in place.
7 9 11 13 15
2016
2017
Weeks after 31 December
● Universities' certification dates
Statutory deadline12.0 weeksMedian
10.5 weeks
Median10.5 weeks
Errors that are clearly trivial are clearly inconsequential, whether taken individually or in aggregate and whether judged by any criteria of size, nature or circumstances. An error that is not clearly trivial can still be immaterial to the financial report as a whole.

22 Results of 2017 Audits: Universities Victorian Auditor‐General’s Report
Unless they are clearly trivial, we raise errors that we find in the draft financial
reports with management for correction. Material errors must be corrected
before we can issue a clear opinion. Management can decide whether or not
to adjust errors that are not material.
During our 2017 audits, we identified a number of financial transaction, balance
and disclosure errors. Figure 2C summarises our findings.
Figure 2C Draft financial statement and disclosure errors identified in 2017
Source: VAGO.
As shown in Figure 2C, our audits identified 53 errors across the universities and
their controlled entities. This low error rate indicates that, while there is some
room for improvement, the sector’s draft financial reports provided to us were
generally accurate. Errors that are not adjusted by management provide an
indication of the accuracy of the financial reports when they are finalised and
signed.
Seventy per cent of errors identified by audit were adjusted by management.
Two of the 16 unadjusted errors resulted in a qualification on the financial
reports of Deakin University and the University of Melbourne, as discussed in
Section 2.1. We assessed the remaining 14 unadjusted errors to be immaterial
to the users of the financial reports.
1
1
3
3
4
4
2
3
1
1
15
6
9
0 5 10 15 20
Victoria University
RMIT University
Deakin University
La Trobe University
The University of Melbourne
Federation University
Swinburne University of Technology
Monash University
Number of errors
Unadjusted financial statement and disclosure errors
Adjusted financial statement and disclosure errors
Victorian Auditor‐General’s Report Results of 2017 Audits: Universities 23
While Federation University Australia was the first university in the sector to
finalise its financial report, it had the highest number of errors in the draft
document provided for audit. This highlights the need for balance between
quality and timeliness. The errors were largely caused by weak management
oversight, highlighting the importance of a robust quality assurance process.
Universities should not rely on the audit process as the quality assurance review
of their financial report.
The number of errors we identified at Monash University can be attributed to
the larger number of controlled entities that fall within the consolidated group.
These errors were small in the context of Monash University’s consolidated
financial report.
The errors we identified at Swinburne University of Technology could be
reduced with a robust quality assurance process.
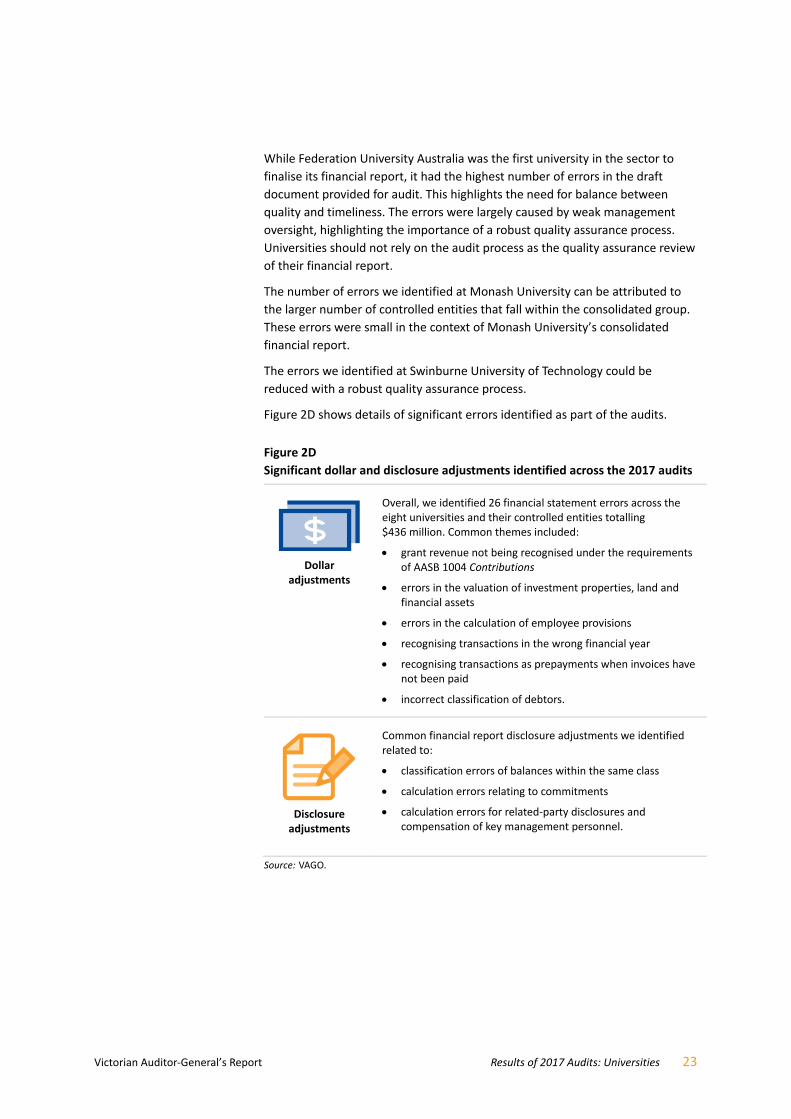
Figure 2D shows details of significant errors identified as part of the audits.
Figure 2D Significant dollar and disclosure adjustments identified across the 2017 audits
Dollar adjustments
Overall, we identified 26 financial statement errors across the eight universities and their controlled entities totalling $436 million. Common themes included:
grant revenue not being recognised under the requirements of AASB 1004 Contributions
errors in the valuation of investment properties, land and financial assets
errors in the calculation of employee provisions
recognising transactions in the wrong financial year
recognising transactions as prepayments when invoices have not been paid
incorrect classification of debtors.
Disclosure adjustments
Common financial report disclosure adjustments we identified related to:
classification errors of balances within the same class
calculation errors relating to commitments
calculation errors for related‐party disclosures and compensation of key management personnel.
Source: VAGO.

24 Results of 2017 Audits: Universities Victorian Auditor‐General’s Report
Quality of the financial report preparation process
We assessed the quality of universities’ financial reporting processes against
better practice criteria, detailed in Appendix C. Overall, the financial report
preparation processes of most of the universities were sound, as summarised
in Figure 2E.
Figure 2E Assessment of financial report preparation against better practice elements
Preparation plan
Proforma financial report
Monthly financial reporting
75% developing or developed
Over 60% developing or developed
Over 85% developed
Quality and assurance controls for report
preparation
Supporting documentation
50% developing
75% developed or better practice
Analytical reviews
Quality control and assurance review of draft financial report
75% developed
Over 85% developed or better practice
Source: VAGO.
As shown in Figure 2E, universities can improve their processes by implementing
rigorous quality control and assurance procedures for the compilation,
preparation and presentation of their financial reports.
Proforma financial report—a financial report prepared by management prior to balance date to assist with planning the structure and contents of the actual financial report.

Victorian Auditor‐General’s Report Results of 2017 Audits: Universities 25
We assessed the universities’ financial report preparation process against a
maturity criteria scale. We rated half of the universities as ‘developing’ because
we identified a number of errors during the audit process. Universities should
not use the audit process as a quality assurance review.
University management can improve quality control and assurance processes by
incorporating some of the following actions into the timetable for preparing
financial reports:
recalculating complex balances
checking large and unusual transactions
ensuring information in the draft financial report is supported by sufficient
and appropriate evidence
reviewing complex accounting matters and ensuring that the appropriate
disclosures have been included in the draft report
ensuring key reconciliations have been performed correctly.
There are several significant changes in accounting standards on the horizon
that will impact the university sector’s financial reporting.
New revenue standards
Two new revenue standards will apply to the universities’ 2019 financial reports.
The two new standards are:
AASB 15 Revenue from Contracts with Customers
AASB 1058 Income of Not-for-profit Entities.
Universities need to start collecting this information for the 2018 year to be
able to disclose comparative information and comply with the new standards
in 2019.
AASB 15 applies to all revenue received under enforceable contracts, including
government grants, research income and contract revenue. AASB 1058 applies
to all other revenue such as ‘peppercorn’ leases, research training programs,
income received for capital projects and donations.
Both standards will require a major change in how and when the university
sector recognises revenue. Revenue recognition under the new standards
focuses on meeting performance obligation criteria, while the current standard,
AASB 118 Revenue, focuses on transfer of risks and rewards. The new standards
will also require additional disclosures in universities’ financial reports.
2.4 Upcoming changes to Australian Accounting Standards
A performance obligation is a promise made in a contract to transfer goods and services to a customer.
26 Results of 2017 Audits: Universities Victorian Auditor‐General’s Report
Implementing these standards will require significant work by the universities
and their controlled entities, including:
reviewing all contractual arrangements in place and clearly defining the
performance obligations that drive revenue recognition
critically assessing each non‐contractual revenue stream and determining
the appropriate accounting treatment to apply
reviewing and adapting existing systems to ensure they can capture the
required performance obligation evidence needed to trigger revenue
recognition
developing plans that allow enough time to implement the changes to
systems, processes and policies.
We commend the sector for the proactive action taken so far to prepare for the
implementation of these standards. Victorian universities, in conjunction with
other major Australian universities, have engaged an independent firm to
analyse the treatment of common income streams in the sector. We have been
consulted as part of this work.
Each university will need to look closely at any of its unique income streams and
factors to ensure they fully comply with the new accounting standards. This will
include research income, donations, non‐Commonwealth scholarships and
other revenue.
VAGO has liaised with Victorian universities and requested position papers,
grant agreements and research contracts from them. As part of our audits from
2019, we will need to assess each university individually for compliance with the
new revenue standards.
New standard—AASB 16 Leases
This accounting standard will require universities to record all assets leased
from others with a term of more than 12 months on their balance sheet. The
major difference resulting from this change is that operating leases—currently
disclosed in the notes to the financial statements—will need to be recognised in
the balance sheet.
This accounting standard will have a significant impact on the financial position
of the sector—we expected to see a large spike in liabilities and property, plant
and equipment. However, the impact on the operating result will be marginal,
as leases on the balance sheet will be brought into the income statement over
time, with a corresponding depreciation and finance charge recognised over the
lease terms. Also, operating leases which are currently expensed as incurred will
no longer occur.
The new standard will apply from 1 January 2019. Universities can elect not to
restate the comparative prior‐year figures.
Victorian Auditor‐General’s Report Results of 2017 Audits: Universities 27
Internal controls
Effective internal controls help entities to reliably and cost‐effectively meet their
objectives. Entities require well‐designed and efficient internal controls to help
them deliver reliable, accurate and timely external and internal financial
reports.
In our annual financial audits, we consider the internal controls relevant to
financial reporting and assess whether entities have managed the risk that
their financial reports will not be complete and accurate. Poorly designed or
inefficient internal controls make it more difficult for an entity’s management
to comply with relevant legislation and may also increase the risk of fraud and
error.
To the extent that we tested them, universities’ internal controls for financial
reporting were adequate for ensuring the reliability of their financial reporting.
However, universities need to strengthen some important internal controls and
address a number of financial reporting matters.
During our 2017 audits, we identified 37 new internal control weaknesses and
financial reporting issues (47 in 2016), and reported them to university
management and audit committees.
Figure 3A shows the number of issues identified by risk rating and the areas
they relate to. This figure excludes the 15 low‐risk issues we reported directly
to the entities’ management teams, and we did not identify any extreme‐ or
high‐risk issues in 2017. We define each risk rating in Appendix D.
3.1 Internal control
observations
28 Results of 2017 Audits: Universities Victorian Auditor‐General’s Report
Figure 3A Internal control weaknesses identified in 2017 audits, by area and risk rating
Risk rating
Area of issue Extreme High Medium Total
IT controls – – 8 8
Policies and frameworks – – 6 6
Financial reporting – – 2 2
Expenditure and payables – – 2 2
Revenue and receivables – – 2 2
Property, plant and equipment – – 1 1
Payroll – – 1 1
Total – – 22 22
Source: VAGO.
Medium‐risk issues
During 2017, we reported 22 medium‐risk internal control weaknesses
(25 in 2016). Of these, 77 per cent have not been addressed by management.
Common themes in the medium‐risk control weaknesses require universities to
improve their:
IT controls
policies, procedures and practices for property, plant and equipment,
related‐party transactions and grant revenue
monitoring of controls for revenue, receivables and financial reporting.
IT controls
Of the medium‐risk issues we identified, 36 per cent (40 per cent in 2016)
related to the universities’ IT control environments.
IT controls protect computer applications, infrastructure and information assets
from threats to security and access. They reduce the risk that employees or
third parties can circumvent processes and gain unauthorised access to systems,
which may result in the destruction of data or recording of non‐existent
transactions. They also reduce the risk of a successful cyber‐attack.
To reduce the risk of a successful cyber‐attack, or potential fraud or errors
arising, it is imperative that universities address IT control deficiencies in a
timely manner.
A cyber‐attack is a deliberate act by a third party to gain unauthorised access to an entity’s data with the objective of damaging, denying, manipulating or stealing information.

Victorian Auditor‐General’s Report Results of 2017 Audits: Universities 29
The eight medium‐risk issues we identified in universities’ IT controls relate to
two key areas:
Weak user access management controls for finance‐related systems
Assigning users inappropriate and excessive access rights to systems may
result in unauthorised use of data and programs, leading to potential errors,
financial fraud and reputational loss.
Patches not applied in a timely manner
Periodic patching of IT systems is important because it reduces the risk of
security vulnerabilities in systems and enhances the overall security profile
of the IT infrastructure.
It is pleasing that management at two universities acted immediately on
these issues and implemented corrective action. This resolved five of the
eight medium‐risk IT controls issues during the year.
Policies and frameworks
Management teams at universities implement policies, procedures and
practices to help minimise business risks, reduce the risk of fraud and error,
and meet business objectives.
Three of the six issues we identified in this area relate to deficiencies in
universities’ asset maintenance framework. Property, plant and equipment
make up two‐thirds of the university sector’s total assets. It is important that
the universities have an effective asset maintenance framework in place to
ensure buildings and other assets are kept in a condition that allows them to
deliver the required services.
See Part 4 for further discussion of these deficiencies in asset maintenance and
our recommendations relating to them.
Monitoring controls
Monitoring controls are the methods used by management to observe internal
controls in practice and assess their effectiveness. This may be done through
ongoing supervision, periodic self‐assessments or separate evaluations.
Five of the 22 medium‐risk issues we identified relate to ineffective monitoring
controls for revenue and receivables, property, plant and equipment, and
financial reporting, which resulted in misstatements. Universities need to
improve their monitoring controls related to:
the reconciliation review process
quality control assurance processes for reviewing asset valuation reports
financial reporting disclosures.
It is important for universities to have effective monitoring controls to reduce
the risk of fraud and error.
A patch is an additional piece of software designed to fix security vulnerabilities or operational issues.

30 Results of 2017 Audits: Universities Victorian Auditor‐General’s Report
We monitor the status of internal control issues raised in our prior‐year
management letters to ensure they are resolved in a timely manner. Where
issues remain outstanding, we factor this into our risk assessment for the
following year’s audit.
Figure 3B shows the status of internal control issues that we identified in our
audits for the past three years.
Figure 3B Status of prior‐period internal control issues, by rating
Risk rating
Area of issue Extreme High Medium Total
Resolved – 6 20 26
Unresolved – 3 10 13
Total – 9 30 39
Note: Issues rated as low risk are excluded from this analysis.
Source: VAGO.
Thirty‐nine high‐ and medium‐risk internal control weaknesses raised during
previous audits were unresolved at the start of 2017 (70 in 2016).
Encouragingly, two‐thirds of these were resolved during 2017.
In line with better practice time lines for corrective action, we expect
management to implement a detailed action plan for any issue raised within
two months for high‐risk matters and within six months for medium‐risk
matters.
Three high‐risk and 10 medium‐risk issues raised in previous years remain
unresolved. We raised these issues more than 12 months ago but they have not
been corrected within the better practice time lines.
Details of the three unresolved high‐risk matters are shown in Figure 3C.
Figure 3C High‐risk unresolved matters identified in previous audits
University Description of issue
Deakin University
1 During 2015, we identified that the key financial system used by the university was unsupported.
Continued use of unsupported systems increases the risk of security vulnerabilities and may lead to compatibility issues with other operating systems and applications. In turn, this may lead to potential financial, reputational or operational issues.
The process for replacing a key financial system takes time. Management at Deakin University developed a formal plan to resolve this matter.
3.2 Status of internal control issues raised in previous audits

Victorian Auditor‐General’s Report Results of 2017 Audits: Universities 31
Figure 3C
High‐risk unresolved matters identified in previous audits—continued
University Description of issue
Swinburne University of Technology
2 During 2016, we found inappropriate user access rights assigned to financial‐related systems.
Effective user access management controls are needed to prevent unauthorised use and disclosure, modification or loss of data.
Management at Swinburne University of Technology has committed to a plan to resolve this issue. The university has actioned three of the four recommendations we made.
3 During 2016, we also found that the university needed to improve its password controls, as they did not align with better practice requirements.
Password controls reduce the risk of unauthorised access to systems. Inadequate password controls may lead to breaches of confidentiality, integrity and availability of business systems and data. Reputational and financial losses may also occur.
Management at Swinburne University of Technology has committed to a plan to resolve this issue.
Source: VAGO.
Figure 3D shows the areas and rating of unresolved prior‐year issues.
Figure 3D Unresolved prior‐year internal control issues, by area and rating
Source: VAGO.
Universities need to resolve issues we report in our management letters in a
timely manner. Failure to resolve these issues reduces the effectiveness of the
internal control environment. This may lead to universities not being able to
meet their business objectives or identify material misstatements.

Victorian Auditor‐General’s Report Results of 2017 Audits: Universities 33
Financial outcomes and sustainability
In this part of the report, we summarise the financial outcomes of the university
sector for the year ended 31 December 2017 and comment on the sustainability
of the sector in the context of information we obtained and observed during our
audits.
The detailed data and calculations that underpin our commentary are provided
in Appendix E, which lists our financial sustainability indicators, risk assessment
criteria, benchmarks and the results of each indicator for each of the
universities over the five financial years 2013 to 2017.
Overall, the sector is financially secure, and most universities have
demonstrated strong financial performance and sustainable financial and
operational management practices.
4.1 Conclusion
34 Results of 2017 Audits: Universities Victorian Auditor‐General’s Report
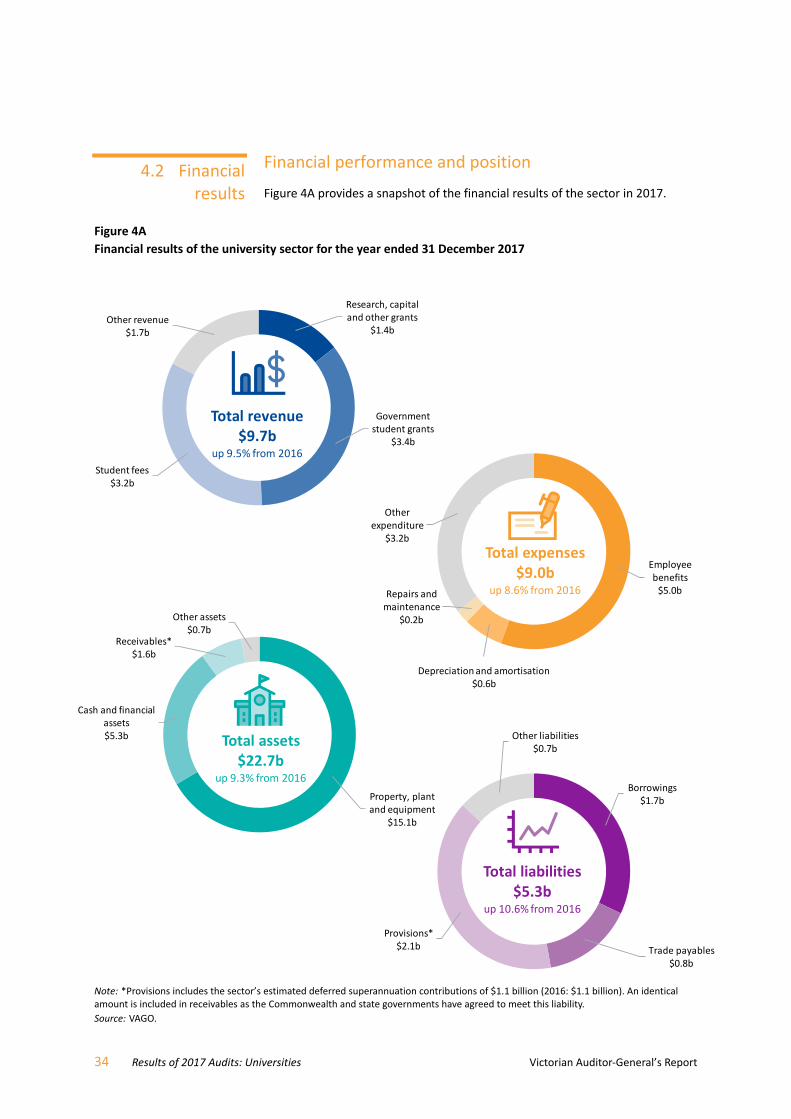
Financial performance and position
Figure 4A provides a snapshot of the financial results of the sector in 2017.
Figure 4A Financial results of the university sector for the year ended 31 December 2017
Note: *Provisions includes the sector’s estimated deferred superannuation contributions of $1.1 billion (2016: $1.1 billion). An identical amount is included in receivables as the Commonwealth and state governments have agreed to meet this liability.
Source: VAGO.
Property, plant and equipment
$15.1b
Cash and financial assets$5.3b
Receivables*$1.6b
Other assets$0.7b
Total assets$22.7b
up 9.3% from 2016
Research, capital and other grants
$1.4b
Government student grants
$3.4b
Student fees$3.2b
Other revenue$1.7b
Total revenue$9.7b
up 9.5% from 2016
Employee benefits$5.0b
Depreciation and amortisation$0.6b
Repairs and maintenance
$0.2b
Other expenditure
$3.2b
Total expenses$9.0b
up 8.6% from 2016
Borrowings$1.7b
Trade payables$0.8b
Provisions*$2.1b
Other liabilities$0.7b
Total liabilities$5.3b
up 10.6% from 2016
4.2 Financial results
Victorian Auditor‐General’s Report Results of 2017 Audits: Universities 35
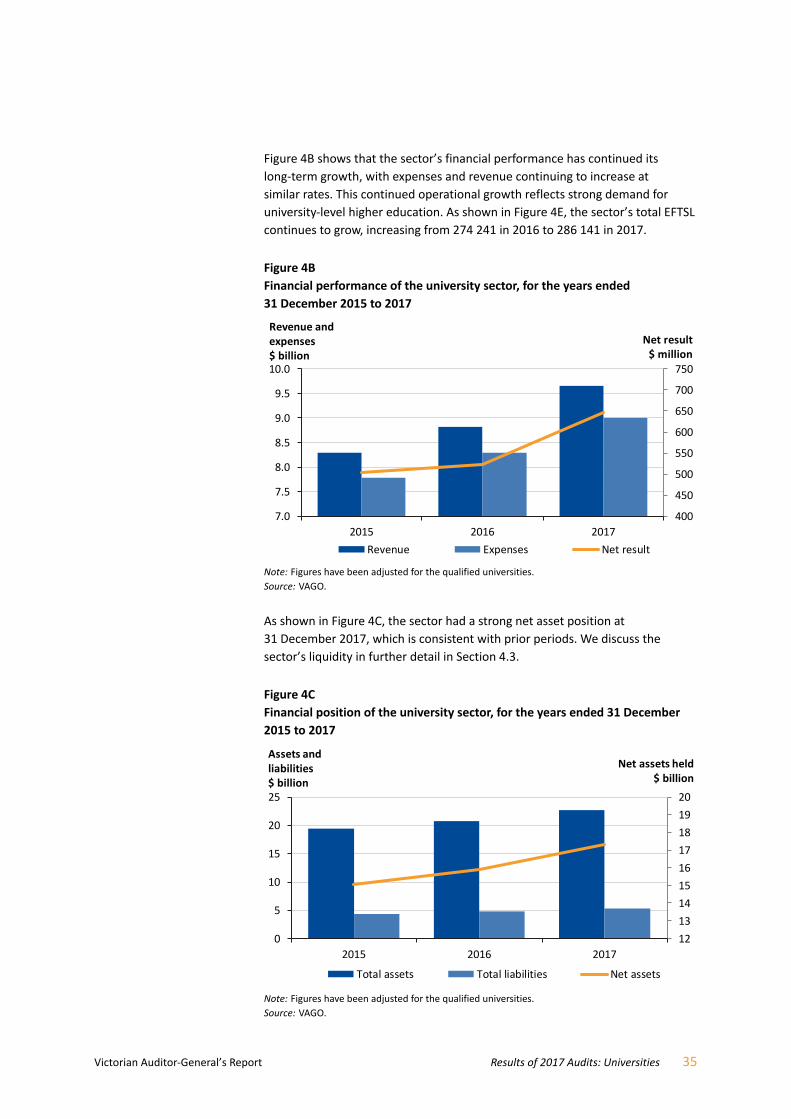
Figure 4B shows that the sector’s financial performance has continued its
long‐term growth, with expenses and revenue continuing to increase at
similar rates. This continued operational growth reflects strong demand for
university‐level higher education. As shown in Figure 4E, the sector’s total EFTSL
continues to grow, increasing from 274 241 in 2016 to 286 141 in 2017.
Figure 4B Financial performance of the university sector, for the years ended
31 December 2015 to 2017
Note: Figures have been adjusted for the qualified universities. Source: VAGO.
As shown in Figure 4C, the sector had a strong net asset position at
31 December 2017, which is consistent with prior periods. We discuss the
sector’s liquidity in further detail in Section 4.3.
Figure 4C Financial position of the university sector, for the years ended 31 December
2015 to 2017
Note: Figures have been adjusted for the qualified universities. Source: VAGO.
400
450
500
550
600
650
700
750
7.0
7.5
8.0
8.5
9.0
9.5
10.0
2015 2016 2017
Net result$ million
Revenue and expenses$ billion
Revenue Expenses Net result
12
13
14
15
16
17
18
19
20
0
5
10
15
20
25
2015 2016 2017
Net assets held$ billion
Assets and liabilities$ billion
Total assets Total liabilities Net assets
36 Results of 2017 Audits: Universities Victorian Auditor‐General’s Report
The value of assets held by the sector increased over 2017, reflecting its strong
financial performance, as well as further investments in capital projects to meet
the increased student demand. Some examples of the sector’s capital
expenditure include:
Monash University spending over $200 million in 2017 on major projects,
including new buildings and refurbishment of its libraries and other facilities
RMIT University spending around $200 million in 2017 on various
infrastructure and facilities upgrades, including its New Academic Street
project, which resulted in 32 000 square metres of new and refurbished
space for students
Swinburne University of Technology spending around $50 million on
infrastructure and IT upgrades, as well as some investment in its student
residences
Deakin University constructing additional student accommodation with
capacity for 500 students at a cost of $47 million.
To be sustainable, universities need to manage their financial resources and
infrastructure efficiently to enable them to meet the effects of future changes
to the sector and to manage foreseeable risks. They should achieve this without
any significant swings in the quality and level of the services they provide, and
without large fluctuations in their expenditure.
Large cash and investment reserves—in themselves comparable to the sector’s
total liabilities, detailed in Figure 4A—mean that the sector is likely to remain
financially secure in the short to medium term. To remain sustainable in the
longer term, universities must continually address their operational and
financial risks, including reducing unnecessary costs, managing dependency on
particular revenue streams and ensuring that they remain relevant to
stakeholder needs.
Sustainable financial performance
Net result margin
The net result margin compares the sector’s net result as a percentage of
total revenue. It gives an indication of how efficiently the sector is using its
operational and other income. Figure 4D shows the net result margin for the
sector over the past five years.
4.3 A sustainable Victorian
university sector

Victorian Auditor‐General’s Report Results of 2017 Audits: Universities 37
Figure 4D Net result margin for the university sector and selected universities, for the
years ended 31 December 2013 to 2017
Note: Figures have been adjusted for the qualified universities. Source: VAGO.
The sector’s net result margin improved in 2017 by 76 basis points but remained
relatively stable overall. Individually, most universities showed strong and
consistent results over the five‐year period, indicating that they are managing
their costs well while continuing to attract more revenue for their services. The
key drivers of a net result margin are revenue and expenditure on staff.
However, Federation University Australia and Victoria University posted negative
net operating results, and therefore had a negative net result margins.
As shown in Figure 4D, over the past five years the net result margins for these
two universities have been relatively weak compared to the rest of the sector.
Victoria University has recorded a deficit since 2014, with 2017 being its largest
deficit to date. This is the first year Federation University Australia has recorded
a deficit, but its results have been declining since 2015.
‐7%
‐5%
‐3%
‐1%
1%
3%
5%
7%
2013 2014 2015 2016 2017
Net result margin
University sector Federation University Australia Victoria University
One basis point is one hundredth of a per cent, or 0.01%.

38 Results of 2017 Audits: Universities Victorian Auditor‐General’s Report
As Figure 4E shows, student numbers in the sector overall continue to increase.
However, Federation University Australia and Victoria University are the only
universities in the sector whose student numbers have declined over the past
five years.
Figure 4E EFTSL for the university sector and selected universities, for the years ended
31 December 2013 to 2017
Source: VAGO based on data from the Commonwealth Department of Education and Training, and unaudited data from public sector universities.
Difficulties in attracting students is contributing to the weaker financial
performance of Federation University Australia and Victoria University. Given
this, it would be prudent for these two universities to assess the relevance and
financial sustainability of their current course offerings, as well as their staff
profile.
Federation University Australia has significant cash and investments, and a
relatively strong balance sheet. As such, it is likely to be solvent for the short
to medium term. However, such a review would enable it to improve its
financial performance in the longer term. We comment on Victoria University’s
short‐term liquidity in further detail below.
5 000
7 000
9 000
11 000
13 000
15 000
17 000
19 000
21 000
2013 2014 2015 2016 2017
220 000
230 000
240 000
250 000
260 000
270 000
280 000
290 000
EFTSLsector total
Sector total Federation University Australia Victoria University
EFTSLselected universities

Victorian Auditor‐General’s Report Results of 2017 Audits: Universities 39
Revenue diversity
The diversity of the sector’s income types and income sources is an important
factor in its resilience. The more diverse the revenue, the better the sector will
be able to withstand changes in its operating environment.
Figure 4F Revenue sources for Victorian and Australian universities
Note: Figures have been adjusted for the qualified universities. Source: VAGO and Commonwealth Department of Education and Training.
As shown in Figure 4F, at both the state and national level, a significant portion
of the sector’s income comes from Commonwealth funding. In December 2017,
changes to the Commonwealth Grants Scheme were proposed, including a
two‐year freeze and a shift to performance‐based funding by 2020. Other
proposed measures include reducing the threshold for repayments of, and
imposing a lifetime limit on, student loans. Given this, the sector should look to
reduce its dependency on Commonwealth funding and strengthen its internally
generated sources of income.
Some universities in the sector are already responding to this risk by:
increasing their involvement in international partnerships and other joint
operations with overseas partners—this should increase income from fees
and private research grants from international sources
providing online or cloud‐based learning, which allows the university to
offer courses to people who previously may not have been able to attend
due to geographical challenges—this should increase fee and grant income
from domestic sources.
Commonwealth grants State grants International student fees Domestic student fees Other revenue
Government grants Student fees
48.8%
2.8%
26.7%
4.2%
17.5%
Revenueconcentration:
Victorian universities
for year ended31 December 2017
57.7%
2.4%
17.8%
4.7%
17.4%
Revenueconcentration:Australian
universitiesfive‐year average
to 2016

40 Results of 2017 Audits: Universities Victorian Auditor‐General’s Report
These diversification efforts have already had some success—the proportion
of revenues from government grants in the Victorian university sector is
lower than the five‐year national average. Most of this difference is due to
international student revenue, which has increased to its present 26.7 per cent
of total revenue, up from 19.9 per cent in 2013.
Staff spending
The sector’s largest recurring expenditure is employee benefits. Universities rely
on their employees to deliver teaching services and research, and to perform
administrative functions. In 2017, the sector spent $4.98 billion on employee
benefits, which accounted for around 55 per cent (55 per cent in 2016) of sector
expenses. This is in line with prior years, and slightly below the five‐year
national average (2012 to 2016) of 57.7 per cent.
To gain an insight of how efficiently each university uses its staff to deliver
revenue‐generating services, we can compare the ratio of employee benefits
expenditure to the total revenue received by a university in the financial year.
We then compare this to the national five‐year average of 54 per cent.
Generally, a smaller ratio indicates a more efficient and sustainable workforce.
The ratios for the year ended 31 December 2017 are shown in Figure 4G.
Figure 4G Employee benefits ratio for the year ended 31 December 2017, compared to the national five‐year average
Note: * For the purposes of this analysis only, we have adjusted Swinburne University of Technology’s total revenue to remove a significant one‐off gain resulting from the sale of an investment, which did not reflect the university’s day‐to‐day operations.
Note: Figures have been adjusted for the qualified universities. Source: VAGO and the Commonwealth Department of Education and Training.
30%
35%
40%
45%
50%
55%
60%
65%
70%
National five‐year average to 2016
Victorian Auditor‐General’s Report Results of 2017 Audits: Universities 41
Consistent with our observations about their net result margin, Victoria
University and Federation University Australia were significantly above the
benchmark for this indicator. This indicates they need to improve the efficiency
of their staffing structure.
Sustainable financial position
Solvency
To remain solvent, universities must be able to settle their debts as they are
due. As the sector leverages more debt, the risk of a university becoming
insolvent increases. Given the universities’ approach to managing their finances,
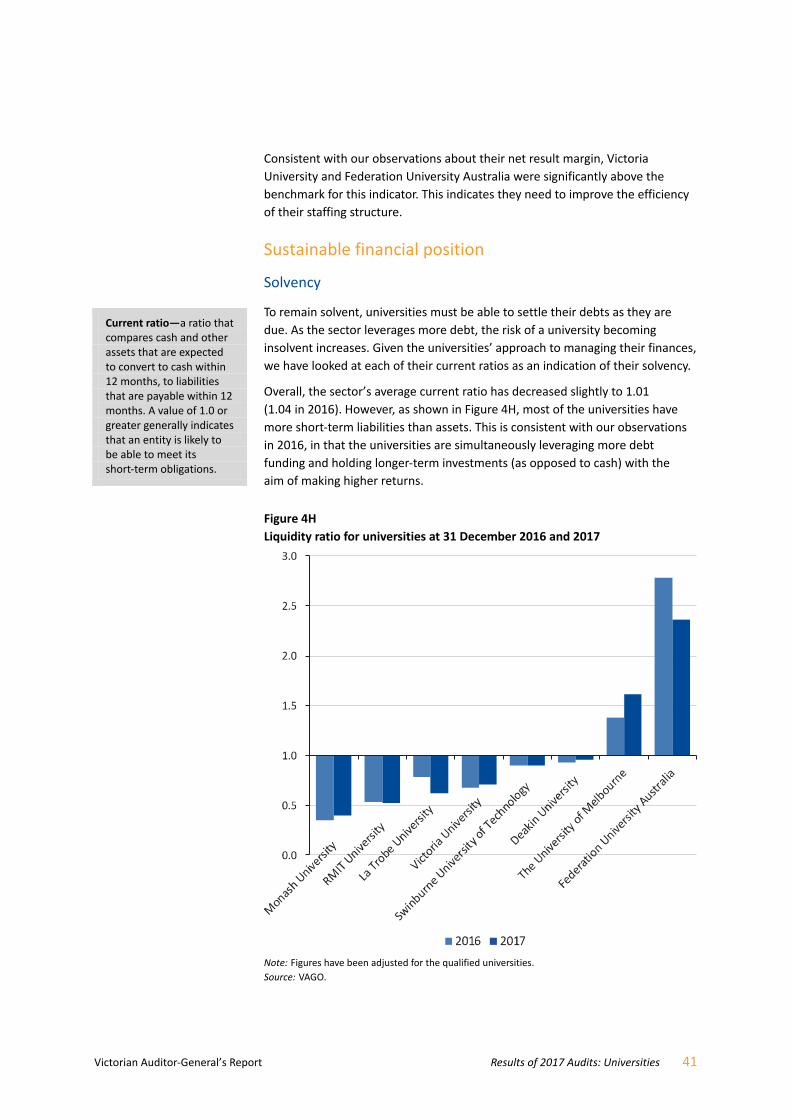
we have looked at each of their current ratios as an indication of their solvency.
Overall, the sector’s average current ratio has decreased slightly to 1.01
(1.04 in 2016). However, as shown in Figure 4H, most of the universities have
more short‐term liabilities than assets. This is consistent with our observations
in 2016, in that the universities are simultaneously leveraging more debt
funding and holding longer‐term investments (as opposed to cash) with the
aim of making higher returns.
Figure 4H Liquidity ratio for universities at 31 December 2016 and 2017
Note: Figures have been adjusted for the qualified universities. Source: VAGO.
Current ratio—a ratio that compares cash and other assets that are expected to convert to cash within 12 months, to liabilities that are payable within 12 months. A value of 1.0 or greater generally indicates that an entity is likely to be able to meet its short‐term obligations.
42 Results of 2017 Audits: Universities Victorian Auditor‐General’s Report
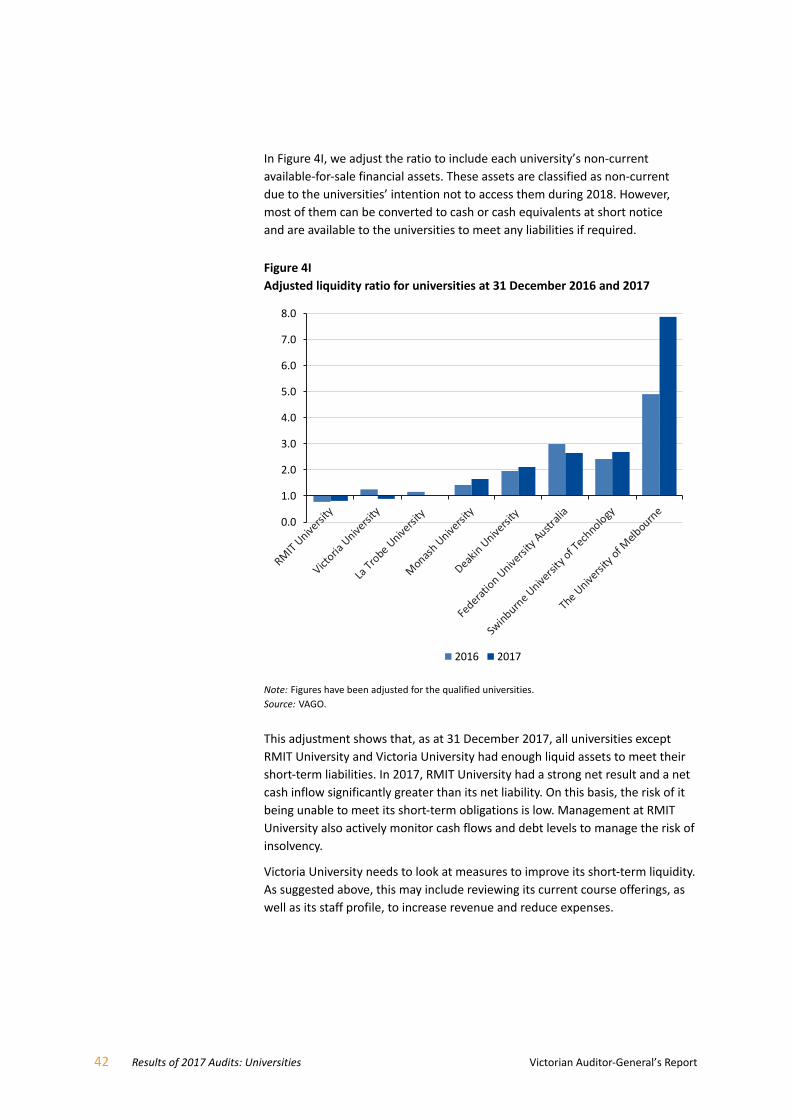
In Figure 4I, we adjust the ratio to include each university’s non‐current
available‐for‐sale financial assets. These assets are classified as non‐current
due to the universities’ intention not to access them during 2018. However,
most of them can be converted to cash or cash equivalents at short notice
and are available to the universities to meet any liabilities if required.
Figure 4I Adjusted liquidity ratio for universities at 31 December 2016 and 2017
Note: Figures have been adjusted for the qualified universities. Source: VAGO.
This adjustment shows that, as at 31 December 2017, all universities except
RMIT University and Victoria University had enough liquid assets to meet their
short‐term liabilities. In 2017, RMIT University had a strong net result and a net
cash inflow significantly greater than its net liability. On this basis, the risk of it
being unable to meet its short‐term obligations is low. Management at RMIT
University also actively monitor cash flows and debt levels to manage the risk of
insolvency.
Victoria University needs to look at measures to improve its short‐term liquidity.
As suggested above, this may include reviewing its current course offerings, as
well as its staff profile, to increase revenue and reduce expenses.
0.0
1.0
2.0
3.0
4.0
5.0
6.0
7.0
8.0
2016 2017

Victorian Auditor‐General’s Report Results of 2017 Audits: Universities 43
Dependence on external sources of funding
An increase in debt (as opposed to equity) as a source of funding increases the
risk that universities may become insolvent, as they will generally be required
to repay debt and interest at agreed and fixed times. By looking at the sector’s
debt‐to‐equity ratio, we can get an understanding of how reliant the sector is on
debt for funding—see Figure 4J.
Figure 4J Debt‐to‐equity ratio for university sector at 31 December
Note: 2017 national data was not yet available at the time of this report. We have forecast the 2017 national average based on historical results for the five years ended 31 December 2016.
Note: Figures have been adjusted for the qualified universities. Source: VAGO and Commonwealth Department of Education and Training.
As shown in Figure 4J, the sector does not rely excessively on debt funding.
Although the ratio continues to increase, it is relatively low, at 6.5 per cent
(5.6 per cent in 2016) and still well below the projected national equivalent
of 8.2 per cent (8.0 per cent in 2016).
Consistent with our earlier observations, this trend reflects the sector’s use of
debt as a financial management tool to maximise the return on the assets it has
available for investment.
0%
1%
2%
3%
4%
5%
6%
7%
8%
9%
2013 2014 2015 2016 2017
Victoria National Forecast
Debt to equity ratio—the total of the sector’s current and non‐current borrowings, expressed as a percentage against the sector’s equity (net assets).
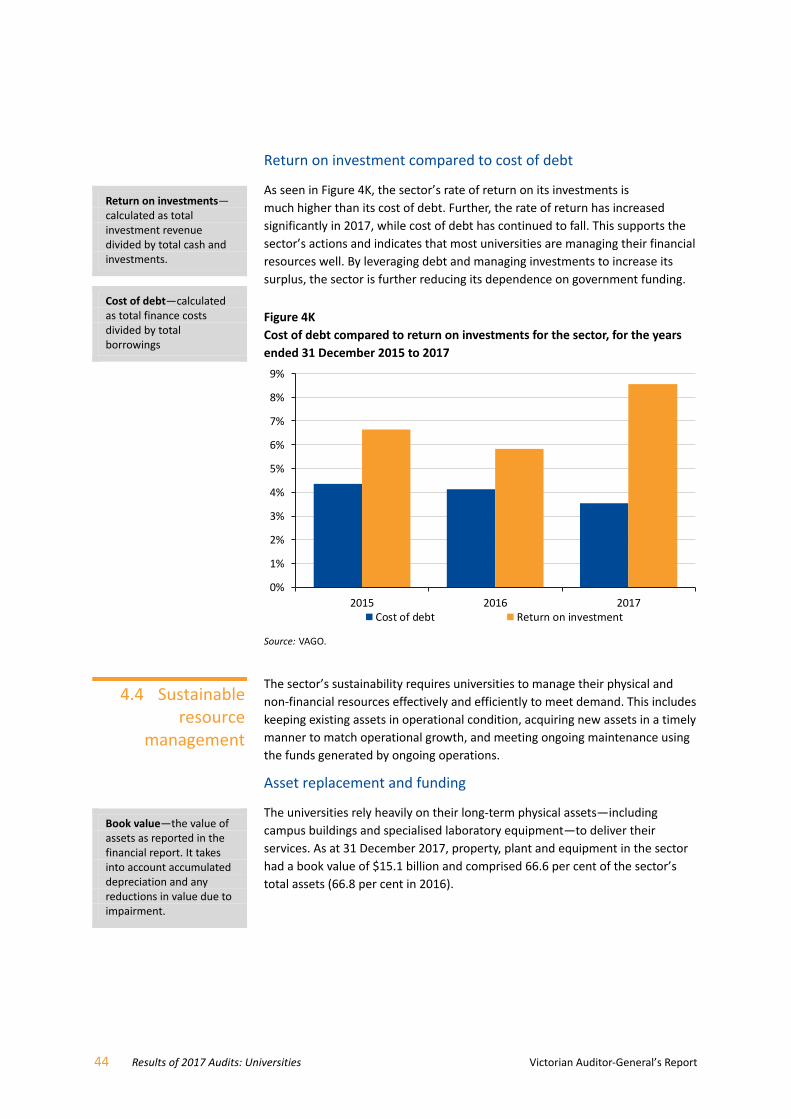
44 Results of 2017 Audits: Universities Victorian Auditor‐General’s Report
Return on investment compared to cost of debt
As seen in Figure 4K, the sector’s rate of return on its investments is
much higher than its cost of debt. Further, the rate of return has increased
significantly in 2017, while cost of debt has continued to fall. This supports the
sector’s actions and indicates that most universities are managing their financial
resources well. By leveraging debt and managing investments to increase its
surplus, the sector is further reducing its dependence on government funding.
Figure 4K Cost of debt compared to return on investments for the sector, for the years
ended 31 December 2015 to 2017
Source: VAGO.
The sector’s sustainability requires universities to manage their physical and
non‐financial resources effectively and efficiently to meet demand. This includes
keeping existing assets in operational condition, acquiring new assets in a timely
manner to match operational growth, and meeting ongoing maintenance using
the funds generated by ongoing operations.
Asset replacement and funding
The universities rely heavily on their long‐term physical assets—including
campus buildings and specialised laboratory equipment—to deliver their
services. As at 31 December 2017, property, plant and equipment in the sector
had a book value of $15.1 billion and comprised 66.6 per cent of the sector’s
total assets (66.8 per cent in 2016).
0%
1%
2%
3%
4%
5%
6%
7%
8%
9%
2015 2016 2017Cost of debt Return on investment
Return on investments—calculated as total investment revenue divided by total cash and investments.
Cost of debt—calculated as total finance costs divided by total borrowings
4.4 Sustainable resource
management
Book value—the value of assets as reported in the financial report. It takes into account accumulated depreciation and any reductions in value due to impairment.

Victorian Auditor‐General’s Report Results of 2017 Audits: Universities 45
Figure 4L Proportion of types of property, plant and equipment by book value at
31 December 2017
Source: VAGO.
To deliver services efficiently, effectively and safely, universities need to
adequately maintain their assets. Where appropriate, they must also replace
or refurbish these assets at the end of their useful lives, to enable them to
continue to provide services.
Figure 4M compares the sector’s repairs and maintenance expenditure against
the value of its completed buildings, plant and equipment. Generally, a higher
proportion of maintenance expenditure indicates adequate maintenance.
By comparing it to the national average, we get an understanding of the
adequacy of the Victorian universities’ expenditure on repairs and maintenance
compared to the national universities sector. The Victorian universities have a
similar or higher ratio of repairs and maintenance spend compared to the
five‐year national average. On this basis, it appears that repairs and
maintenance spending is adequate.
60%23%
12%
5%
Buildings
Land
Plant and equipment
Assets under construction

46 Results of 2017 Audits: Universities Victorian Auditor‐General’s Report
Figure 4M Ratio of repairs and maintenance spend to book value of maintainable assets,
for the years ended 31 December 2013 to 2017
Source: VAGO.
To understand whether universities are replacing or renewing their assets in a
timely manner, we compare their capital spend on depreciating assets to their
depreciation expense for the year, as shown in Figure 4N. A ratio of less than
100 per cent on an ongoing basis may indicate that a university is allowing its
assets to deteriorate at a greater rate than the rate at which it is renewing or
replacing them.
Figure 4N Asset renewal ratio, for the year ended 31 December 2017
Source: VAGO.
1.9%
2.0%
2.1%
2.2%
2.3%
2.4%
2.5%
2.6%
2013 2014 2015 2016 2017
Victorian universities National five‐year average to 2016
0%
50%
100%
150%
200%
250%
300%
350%
400%
2016 2017 Minimum level for sustainable practices
Depreciating assets— assets whose values erode over time due to use and/or consumption. Common examples of depreciating assets include buildings, plant and equipment, motor vehicles and furniture and fittings.
Examples of non‐depreciating assets include land and cultural art works as their value does not generally deteriorate due to age or use.

Victorian Auditor‐General’s Report Results of 2017 Audits: Universities 47
All universities had asset renewal ratios above the 100 per cent benchmark in
2017, including those with ratios below the benchmark in 2016. This indicates
that the universities are adequately renewing their long‐term assets. However,
this indicator does not distinguish between new assets and the replacement of
existing assets. Universities need to ensure that existing assets continue to be fit
for service. Part of this involves maintaining the assets to a good standard.
At 31 December 2017, the sector had an asset maintenance and refurbishment
backlog of $1.13 billion ($1.15 billion in 2016). We analysed the trend of the
sector’s maintenance and refurbishment backlog against the replacement value
of its maintainable assets (buildings, plant and equipment) to assess whether
maintenance practices support the sustainability of the sector—see Figure 4O.
Figure 4O Ratio of maintenance and refurbishment backlog to buildings, plant and
equipment, at 31 December 2013 to 2017
Source: VAGO and unaudited data obtained from sector universities—the universities report this to the Tertiary Education Facilities Management Association annually. We obtained this information directly from the universities.
The sector’s average ratio has been decreasing since 2014, indicating that
universities in general are spending adequately on maintenance. There was a
slight rise in the average ratio from 2016 to 2017, and this was a result of a
spike in the ratio for Victoria University in 2017. This spike resulted from
Victoria University being in a period of transition, bringing its previously
outsourced asset management function in‐house. We discuss the issues
around Victoria University’s asset maintenance framework in further detail
in Section 4.5.
0.00
0.02
0.04
0.06
0.08
0.10
0.12
0.14
0.16
0.18
2013 2014 2015 2016 2017
Sector average Victoria University
Backlog maintenance refers to the cost of maintenance works that are due and necessary to prevent the deterioration of assets or their functions, but which have not been carried out.

48 Results of 2017 Audits: Universities Victorian Auditor‐General’s Report
Adequacy of infrastructure
One indicator of whether a university’s infrastructure is adequate to support
demand from enrolled students is whether its gross floor area is increasing at a
rate that matches its growth in EFTSL.
As shown in Figure 4P, the sector’s ratio of gross floor area to onshore EFTSL has
been relatively constant over the past five years. This indicates that universities
are increasing their capacity at a rate that matches their growth in student load.
Figure 4P Ratio of gross floor area per onshore EFTSL, at 31 December 2013 to 2017
Source: Unaudited data obtained directly from public sector universities—the universities report this to the Tertiary Education Facilities Management Association annually.
It is important that the universities have an effective asset maintenance
framework in place to ensure buildings and other assets are kept to the
standard required to deliver services. The key elements of an effective asset
maintenance framework are detailed in Figure 4Q.
0%
2%
4%
6%
8%
10%
12%
14%
16%
18%
20%
2013 2014 2015 2016 2017
4.5 Asset maintenance
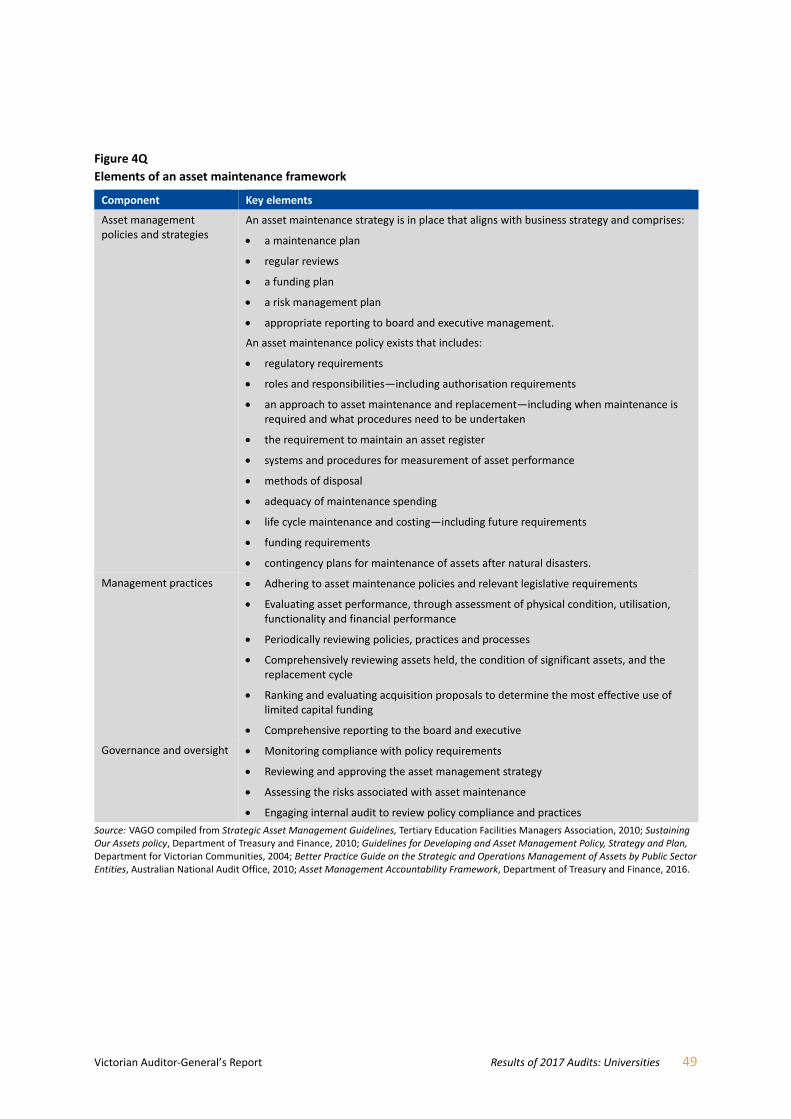
Victorian Auditor‐General’s Report Results of 2017 Audits: Universities 49
Figure 4Q Elements of an asset maintenance framework
Component Key elements
Asset management policies and strategies
An asset maintenance strategy is in place that aligns with business strategy and comprises:
a maintenance plan
regular reviews
a funding plan
a risk management plan
appropriate reporting to board and executive management.
An asset maintenance policy exists that includes:
regulatory requirements
roles and responsibilities—including authorisation requirements
an approach to asset maintenance and replacement—including when maintenance is required and what procedures need to be undertaken
the requirement to maintain an asset register
systems and procedures for measurement of asset performance
methods of disposal
adequacy of maintenance spending
life cycle maintenance and costing—including future requirements
funding requirements
contingency plans for maintenance of assets after natural disasters.
Management practices Adhering to asset maintenance policies and relevant legislative requirements
Evaluating asset performance, through assessment of physical condition, utilisation, functionality and financial performance
Periodically reviewing policies, practices and processes
Comprehensively reviewing assets held, the condition of significant assets, and the replacement cycle
Ranking and evaluating acquisition proposals to determine the most effective use of limited capital funding
Comprehensive reporting to the board and executive
Governance and oversight Monitoring compliance with policy requirements
Reviewing and approving the asset management strategy
Assessing the risks associated with asset maintenance
Engaging internal audit to review policy compliance and practices
Source: VAGO compiled from Strategic Asset Management Guidelines, Tertiary Education Facilities Managers Association, 2010; Sustaining Our Assets policy, Department of Treasury and Finance, 2010; Guidelines for Developing and Asset Management Policy, Strategy and Plan, Department for Victorian Communities, 2004; Better Practice Guide on the Strategic and Operations Management of Assets by Public Sector Entities, Australian National Audit Office, 2010; Asset Management Accountability Framework, Department of Treasury and Finance, 2016.
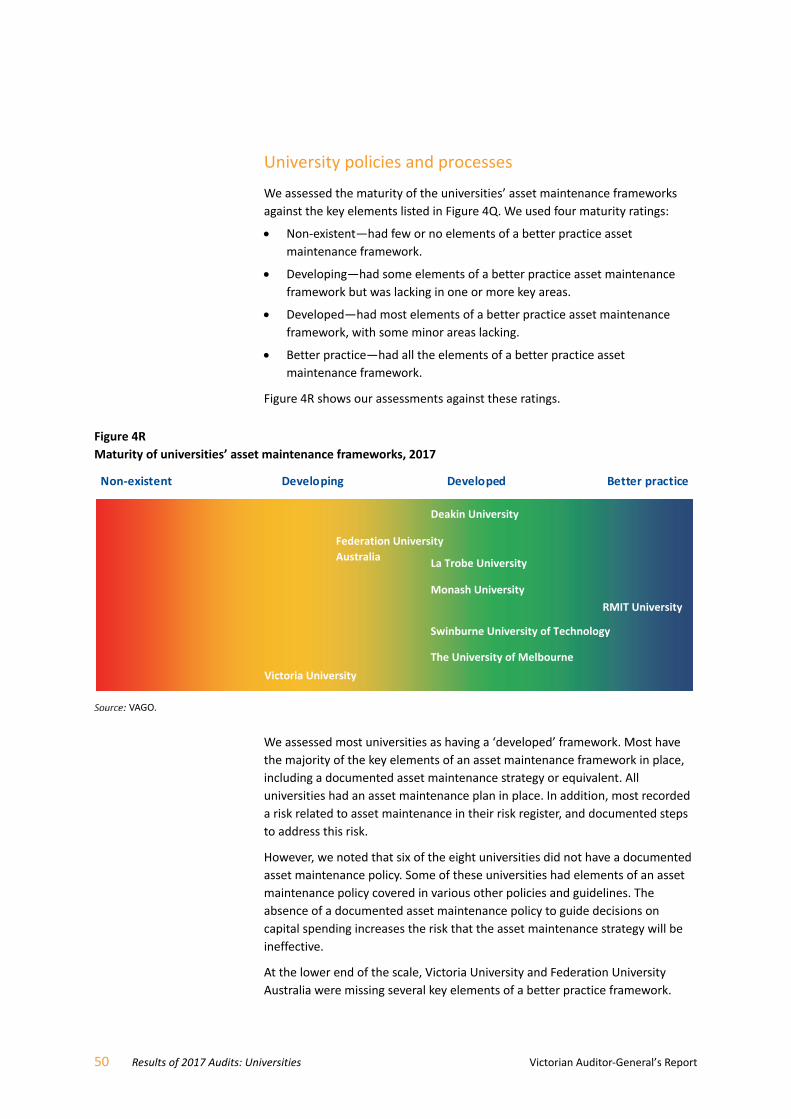
50 Results of 2017 Audits: Universities Victorian Auditor‐General’s Report
University policies and processes
We assessed the maturity of the universities’ asset maintenance frameworks
against the key elements listed in Figure 4Q. We used four maturity ratings:
Non‐existent—had few or no elements of a better practice asset
maintenance framework.
Developing—had some elements of a better practice asset maintenance
framework but was lacking in one or more key areas.
Developed—had most elements of a better practice asset maintenance
framework, with some minor areas lacking.
Better practice—had all the elements of a better practice asset
maintenance framework.
Figure 4R shows our assessments against these ratings.
Figure 4R Maturity of universities’ asset maintenance frameworks, 2017
VAGO.
We assessed most universities as having a ‘developed’ framework. Most have
the majority of the key elements of an asset maintenance framework in place,
including a documented asset maintenance strategy or equivalent. All
universities had an asset maintenance plan in place. In addition, most recorded
a risk related to asset maintenance in their risk register, and documented steps
to address this risk.
However, we noted that six of the eight universities did not have a documented
asset maintenance policy. Some of these universities had elements of an asset
maintenance policy covered in various other policies and guidelines. The
absence of a documented asset maintenance policy to guide decisions on
capital spending increases the risk that the asset maintenance strategy will be
ineffective.
At the lower end of the scale, Victoria University and Federation University
Australia were missing several key elements of a better practice framework.
Non‐existent Better practiceDeveloping Developed
Monash University
The University of Melbourne
RMIT University
Deakin University
La Trobe University
Swinburne University of Technology
Victoria University
Federation University
Australia

Victorian Auditor‐General’s Report Results of 2017 Audits: Universities 51
While Federation University Australia had an asset maintenance policy, it was
missing critical elements including:
documented processes for funding asset maintenance
specific asset maintenance procedures including whether to repair or
replace an asset.
Asset maintenance operations at Federation University Australia are confined to
one division, and decisions to repair or replace major plant are assessed on a
case‐by‐case basis as the need arises. This is currently not reflected in the
university’s asset policy, but we recommend that the university address this.
The gaps in Federation University Australia’s asset maintenance framework
increase the risk of significant unexpected maintenance costs and the potential
for key assets to be unavailable for use.
Victoria University had previously outsourced the management of its asset
maintenance function and recently brought this back in house. It is currently
undertaking a project to establish an asset management framework that is
intended to comply with ISO 55001:2014 Asset Management.
At the time of our audit, Victoria University’s asset maintenance framework had
not been established, and most of its asset maintenance was being conducted
on an ad‐hoc basis. Most of the key elements of a better practice asset
maintenance plan were also absent, and the university did not record asset
maintenance as a risk in its risk register. While we note management’s intention
to obtain ISO 55001 certification, not having a developed asset maintenance
framework in place in the interim exposes the university to the risk that its
assets will not be maintained, and that they may be unsuitable to deliver the
services required.
Asset management and life cycle modelling at RMIT University
Within the Victorian university sector, we observed that RMIT University has all
the elements of a better practice asset maintenance plan and strategy in place,
held together in a cohesive framework. As evidence of this, in early 2018,
RMIT University became the first Australian university to be certified under
ISO 55001:2014 Asset Management. Underlying this framework is an asset
life cycle modelling system that provides RMIT University’s management team
with detailed information that enables it to implement the university’s asset
maintenance policies and plans effectively.
In 2015, RMIT University’s property services team initiated a project to overhaul
its asset maintenance framework to improve its service delivery and better align
its asset management strategy to the university’s long‐term strategic objectives.
This involved shifting from a focus on scheduled asset maintenance to
monitoring asset life cycles and using data modelling to predict the university’s
asset management needs over the long term.

52 Results of 2017 Audits: Universities Victorian Auditor‐General’s Report
Over 2016 and 2017, the property services team conducted an extensive
process to catalogue the entire physical asset portfolio under its responsibility,
and audited the condition of each individual asset. This included concealed
components and infrastructure such as lifts, piping and in‐ground assets. The
property services team gathered information about each asset’s nature,
installation date, expected life and current condition.
The information gathered from this process was compiled onto an asset
management system developed by the university’s School of Engineering. This
system has comprehensive data analytics and visualisation abilities which
enables the property services team to have a detailed understanding of the
condition of its portfolio and to accurately forecast its asset needs in any given
period.
The information allows RMIT University to assign each asset a condition risk
rating based on the likelihood of failure, as well as the magnitude of the
consequences of failure should it occur. It can then focus its maintenance
activity on assets at higher risk.
To keep the information up to date, RMIT University performs audits on an
annual cyclical basis. This ensures that information on the condition and risk
associated with individual assets is current. The university has also implemented
comprehensive policies and procedures for additions, disposals, maintenance
expenditure and other asset‐related transactions to ensure that these are
captured in the system.
The benefits of RMIT University’s asset management system
The ability to analyse detailed asset information allows the property services
team to align its asset maintenance and management programs very closely
with the university’s strategic plan and business plan. In many aspects, this
results in the asset management strategy not just supporting, but helping to
advance RMIT University’s strategic goals.
A better awareness and understanding of the physical asset portfolio
As a result of the implementation of the system, RMIT University’s asset
registers went from having just under 6 000 known maintainable assets in
2015 to over 55 000 in 2017. The comprehensive audits and controls around
additions and disposals that RMIT has in place, as well as the data captured and
recorded on the asset management system, allow management to have a very
detailed understanding of the assets in its portfolio.
This, in turn, allows the university to manage that portfolio efficiently and
sustainably, as discussed below.

Victorian Auditor‐General’s Report Results of 2017 Audits: Universities 53
Risk‐focused maintenance activity and streamlined budgeting
Having access to detailed information about the condition of its assets, how
important they are to the university’s operations, as well as their life cycle stage,
allows RMIT University to forecast its required maintenance spend very
accurately. It is also able to prepare informative, evidence‐based reports for
decision‐makers. This allows the decision‐makers, such as the university’s
council or its delegated subcommittee, to make informed decisions about the
approval of budgeted maintenance expenditure, in less time and with more
confidence that funds will be spent on areas likely to have the greatest impact
to the university’s operations and reputation.
The detailed information in the model also allows RMIT University to forecast
changes in its maintenance and capital expenditure according to changes in
demand, allowing decision‐makers to take forecast growth in operations into
consideration.
Reduced reactive maintenance leading to more operational efficiency and reduced costs
The life cycle modelling developed by RMIT University, in conjunction with the
risk ratings, allows it to make better decisions about whether to repair, refurbish
or replace an asset. For example, based on its life cycle model, the university is
able to forecast when critical assets such as climate control units or elevators
are likely to require replacement. The university is then able to schedule the
necessary maintenance or replacement of these assets slightly ahead of the end
of their useful lives, rather than waiting for the assets to actually fail.
This results in a better ratio of scheduled maintenance to reactive maintenance.
As at the first quarter of 2018, the university had improved its ratio of scheduled
to reactive maintenance above the generally accepted 70:30 industry
benchmark, described in NASA’s Reliability-centred maintenance guide for
facilities and collateral equipment (2008).
As a result of being able to plan and schedule a greater portion of its repairs and
maintenance activity, the university has started to realise the following benefits:
Staff and students experience improved health and safety, as assets are
refurbished or replaced before they fail.
There is reduced operational downtime, as alternative arrangements can be
planned and made ahead of time. Also, replacement parts or units can be
ordered in advance, reducing the impact of lead times.
Funding is used more efficiently. Planned orders also allow the university to
take better advantage of economies of scale by ordering the required items
in bulk.
Reactive maintenance, also known as ‘breakdown maintenance’, is unscheduled repairs and maintenance work that is performed due to an asset breaking down. Reactive maintenance generally costs more than scheduled maintenance, as there are higher costs and longer operational down times associated with the short notice.
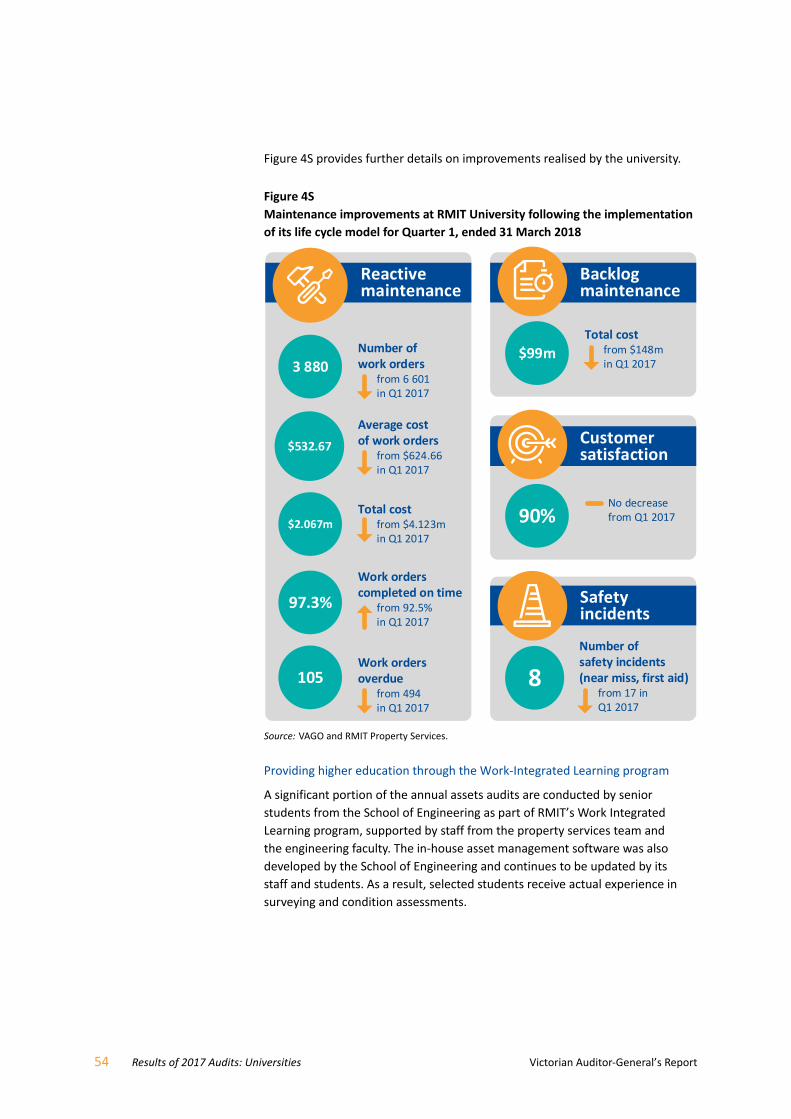
54 Results of 2017 Audits: Universities Victorian Auditor‐General’s Report
Figure 4S provides further details on improvements realised by the university.
Figure 4S Maintenance improvements at RMIT University following the implementation
of its life cycle model for Quarter 1, ended 31 March 2018
Source: VAGO and RMIT Property Services.
Providing higher education through the Work‐Integrated Learning program
A significant portion of the annual assets audits are conducted by senior
students from the School of Engineering as part of RMIT’s Work Integrated
Learning program, supported by staff from the property services team and
the engineering faculty. The in‐house asset management software was also
developed by the School of Engineering and continues to be updated by its
staff and students. As a result, selected students receive actual experience in
surveying and condition assessments.
3 880
97.3%
$2.067m
$532.67
Number ofwork orders
from 6 601in Q1 2017
Work orderscompleted on time
from 92.5%in Q1 2017
Total costfrom $4.123min Q1 2017
Average costof work orders
from $624.66in Q1 2017
Reactive maintenance
Backlog maintenance
$99mTotal cost
from $148min Q1 2017
Customer satisfaction
90%No decrease from Q1 2017
8
Number ofsafety incidents (near miss, first aid)
from 17 inQ1 2017
Safety incidents
105Work ordersoverdue
from 494in Q1 2017
Victorian Auditor‐General’s Report Results of 2017 Audits: Universities 55
By involving students as a core component of its asset management strategy,
RMIT University is leveraging its own asset management needs to provide
hands‐on experiences to its students. From this perspective, the university’s
asset management strategy not only supports its operations by ensuring its
asset portfolio is in operational condition, it also directly aligns to the
university’s organisational objective of providing higher education through
practical experiences and preparing each student for future employment.
Conclusion
The shift to asset life cycle modelling has given RMIT University the information
it needs to implement an asset management strategy that will allow it to better
manage its sustainability risks over the longer term, and to cope with forecast
changes in the size of its operations. It will also allow the university to better
manage its asset‐related expenditure and improve the effectiveness of and
accountability for the way capital grants and other public funding are spent.
These are benefits that should be of interest to public sector entities in general.
We recommend that the other universities weigh the costs and benefits of
implementing an asset life cycle modelling system that will provide them with
the information needed to support an effective asset management framework
that aligns directly to their organisations’ strategic and long‐term objectives.

Victorian Auditor‐General’s Report Results of 2017 Audits: Universities 57
Appendix A Audit Act 1994 section 16— submissions and comments
We have consulted with DET and the eight public universities in Victoria, and we
considered their views when reaching our audit conclusions. As required by
section 16(3) of the Audit Act 1994, we gave a draft copy of this report, or
relevant extracts, to those agencies and asked for their submissions and
comments. We also provided a copy of the report to the Department of Premier
and Cabinet.
Responsibility for the accuracy, fairness and balance of those comments rests
solely with the agency head.
Responses were received as follows:
DET ...................................................................................................................... 58
Deakin University ................................................................................................. 59
Federation University Australia ........................................................................... 61
Victoria University ............................................................................................... 62

58 Results of 2017 Audits: Universities Victorian Auditor‐General’s Report
RESPONSE provided by the Secretary, DET
Victorian Auditor‐General’s Report Results of 2017 Audits: Universities 59
RESPONSE provided by the Vice‐Chancellor, Deakin University
60 Results of 2017 Audits: Universities Victorian Auditor‐General’s Report
RESPONSE provided by the Vice‐Chancellor, Deakin University—continued
Victorian Auditor‐General’s Report Results of 2017 Audits: Universities 61
RESPONSE provided by the Vice‐Chancellor and President, Federation University Australia

62 Results of 2017 Audits: Universities Victorian Auditor‐General’s Report
RESPONSE provided by the Vice‐Chancellor and President, Victoria University

Victorian Auditor‐General’s Report Results of 2017 Audits: Universities 63
Appendix B Audit opinions
Figure B1 lists the entities included in this report. It details the date an audit
opinion was issued to each entity for their 2017 financial reports, and the
nature of the opinion.
Figure B1 Audit opinions issued for universities and their controlled entities
Entity Clear audit
opinion issued Auditor‐General’s report signed date
Deakin University Qualified(a) 19 March 2018
Deakin Cyber Security Accelerator Pty Ltd 21 March 2018
Deakin Digital Pty Ltd 20 March 2018
Deakin Residential Services Pty Ltd 21 March 2018
iHosp Pty Ltd 21 March 2018
FLAIM Systems Pty Ltd 21 March 2018
Unilink Limited 21 March 2018
Federation University Australia 27 February 2018
Brisbane Educational Services Pty Ltd 9 March 2018
Datascreen Pty Ltd 9 March 2018
Inskill Pty Ltd 9 March 2018
The School of Mines and Industries Ballarat Limited 9 March 2018
UB Housing Pty Ltd 9 March 2018
La Trobe University 22 March 2018
Unitemps La Trobe Ltd n/a n/a
Monash University 25 March 2018
Monash Accommodation Services Pty Ltd 22 March 2018
Monash College Pty Ltd 20 February 2018
Monash Commercial Pty Ltd 22 March 2018
Monash Custodians Pty Ltd n/a n/a
Monash Investment Holdings Pty Ltd 19 March 2018
Monash Investment Trust 19 March 2018
Monash Property South Africa Pty Ltd n/a n/a
Monash University Foundation Pty Ltd 9 March 2018
Monash University Foundation Trust 9 March 2018
Monash University Indonesia Limited n/a n/a
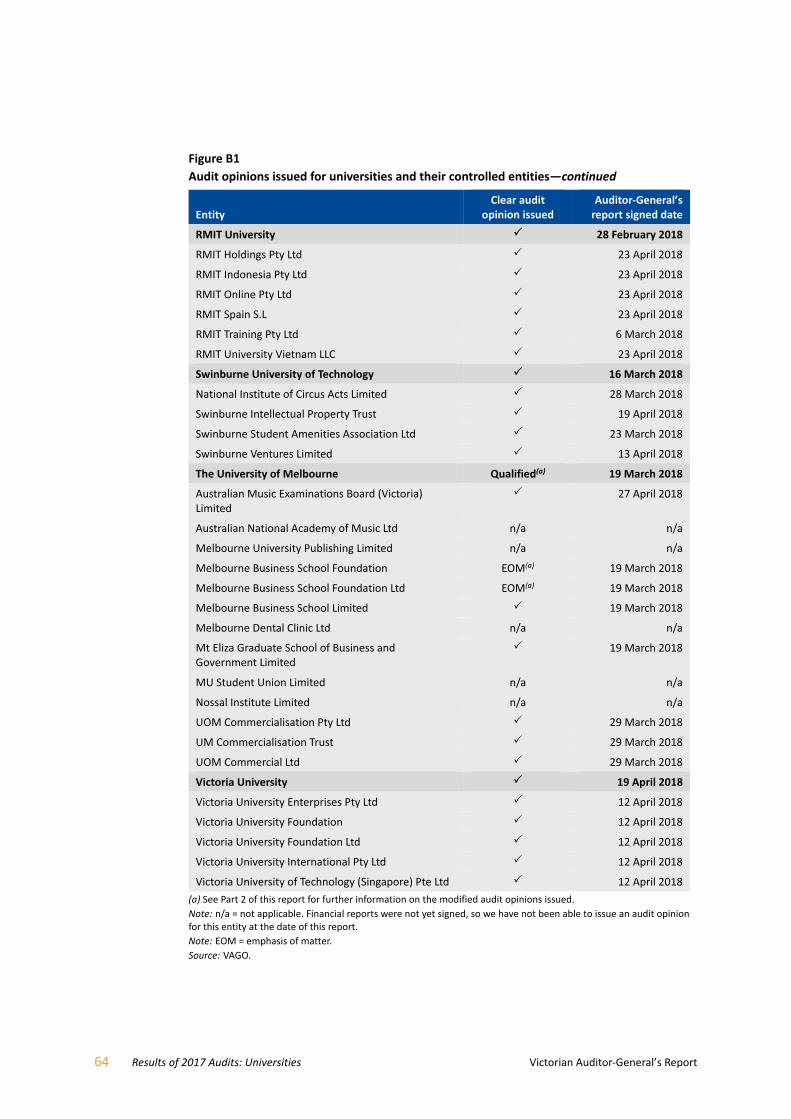
64 Results of 2017 Audits: Universities Victorian Auditor‐General’s Report
Figure B1
Audit opinions issued for universities and their controlled entities—continued
Entity Clear audit
opinion issued Auditor‐General’s report signed date
RMIT University 28 February 2018
RMIT Holdings Pty Ltd 23 April 2018
RMIT Indonesia Pty Ltd 23 April 2018
RMIT Online Pty Ltd 23 April 2018
RMIT Spain S.L 23 April 2018
RMIT Training Pty Ltd 6 March 2018
RMIT University Vietnam LLC 23 April 2018
Swinburne University of Technology 16 March 2018
National Institute of Circus Acts Limited 28 March 2018
Swinburne Intellectual Property Trust 19 April 2018
Swinburne Student Amenities Association Ltd 23 March 2018
Swinburne Ventures Limited 13 April 2018
The University of Melbourne Qualified(a) 19 March 2018
Australian Music Examinations Board (Victoria) Limited
27 April 2018
Australian National Academy of Music Ltd n/a n/a
Melbourne University Publishing Limited n/a n/a
Melbourne Business School Foundation EOM(a) 19 March 2018
Melbourne Business School Foundation Ltd EOM(a) 19 March 2018
Melbourne Business School Limited 19 March 2018
Melbourne Dental Clinic Ltd n/a n/a
Mt Eliza Graduate School of Business and Government Limited
19 March 2018
MU Student Union Limited n/a n/a
Nossal Institute Limited n/a n/a
UOM Commercialisation Pty Ltd 29 March 2018
UM Commercialisation Trust 29 March 2018
UOM Commercial Ltd 29 March 2018
Victoria University 19 April 2018
Victoria University Enterprises Pty Ltd 12 April 2018
Victoria University Foundation 12 April 2018
Victoria University Foundation Ltd 12 April 2018
Victoria University International Pty Ltd 12 April 2018
Victoria University of Technology (Singapore) Pte Ltd 12 April 2018
(a) See Part 2 of this report for further information on the modified audit opinions issued.
Note: n/a = not applicable. Financial reports were not yet signed, so we have not been able to issue an audit opinion for this entity at the date of this report.
Note: EOM = emphasis of matter.
Source: VAGO.
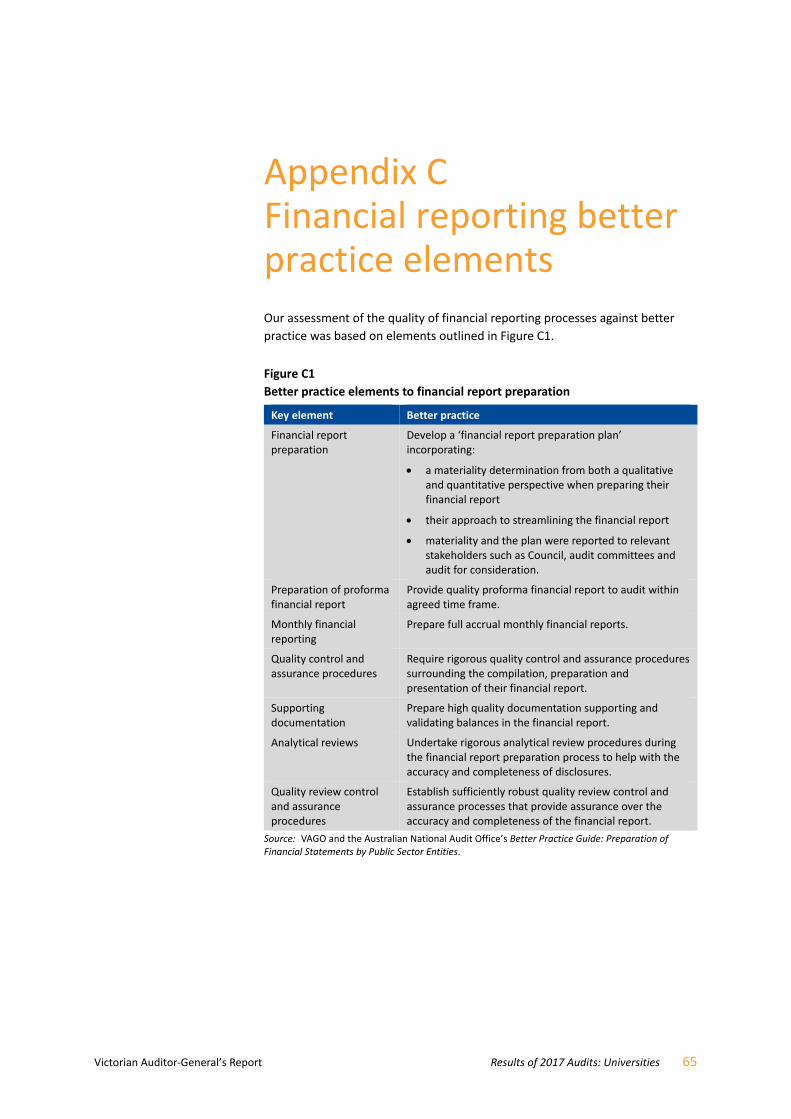
Victorian Auditor‐General’s Report Results of 2017 Audits: Universities 65
Appendix C Financial reporting better practice elements
Our assessment of the quality of financial reporting processes against better
practice was based on elements outlined in Figure C1.
Figure C1 Better practice elements to financial report preparation
Key element Better practice
Financial report preparation
Develop a ‘financial report preparation plan’ incorporating:
a materiality determination from both a qualitative and quantitative perspective when preparing their financial report
their approach to streamlining the financial report
materiality and the plan were reported to relevant stakeholders such as Council, audit committees and audit for consideration.
Preparation of proforma financial report
Provide quality proforma financial report to audit within agreed time frame.
Monthly financial reporting
Prepare full accrual monthly financial reports.
Quality control and assurance procedures
Require rigorous quality control and assurance procedures surrounding the compilation, preparation and presentation of their financial report.
Supporting documentation
Prepare high quality documentation supporting and validating balances in the financial report.
Analytical reviews Undertake rigorous analytical review procedures during the financial report preparation process to help with the accuracy and completeness of disclosures.
Quality review control and assurance procedures
Establish sufficiently robust quality review control and assurance processes that provide assurance over the accuracy and completeness of the financial report.
Source: VAGO and the Australian National Audit Office’s Better Practice Guide: Preparation of Financial Statements by Public Sector Entities.

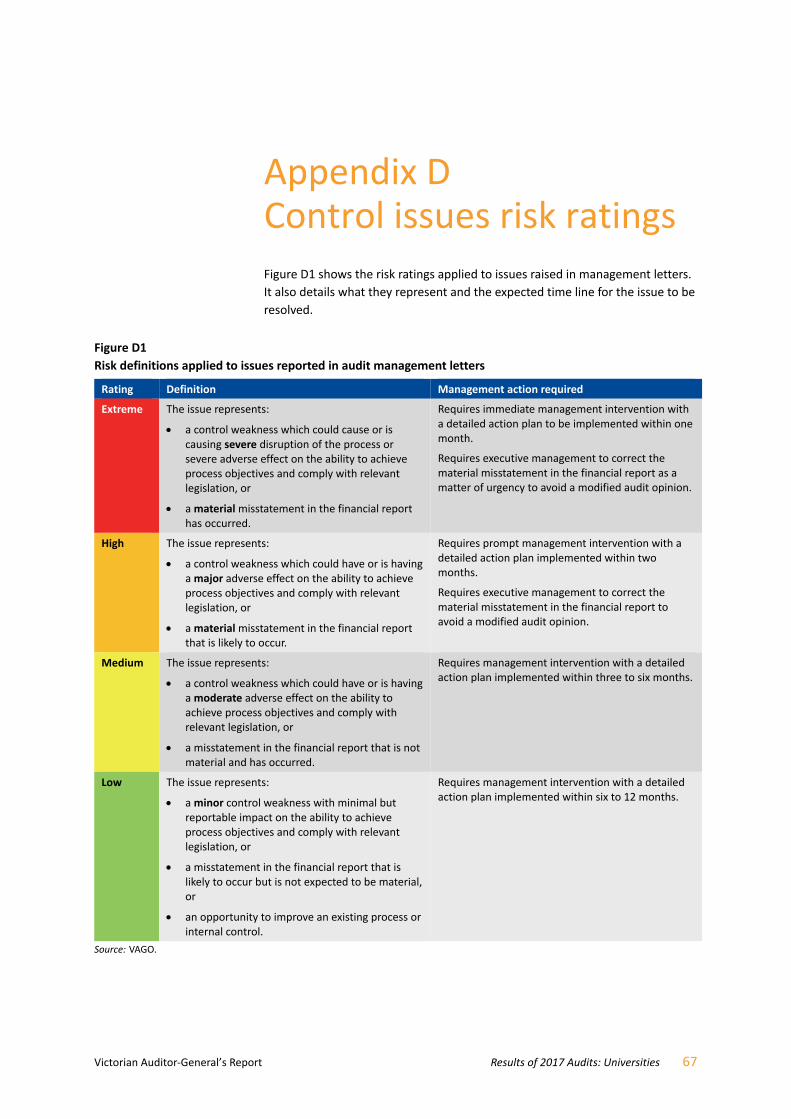
Victorian Auditor‐General’s Report Results of 2017 Audits: Universities 67
Appendix D Control issues risk ratings
Figure D1 shows the risk ratings applied to issues raised in management letters.
It also details what they represent and the expected time line for the issue to be
resolved.
Figure D1 Risk definitions applied to issues reported in audit management letters
Rating Definition Management action required
Extreme The issue represents:
a control weakness which could cause or is causing severe disruption of the process or severe adverse effect on the ability to achieve process objectives and comply with relevant legislation, or
a material misstatement in the financial report has occurred.
Requires immediate management intervention with a detailed action plan to be implemented within one month.
Requires executive management to correct the material misstatement in the financial report as a matter of urgency to avoid a modified audit opinion.
High The issue represents:
a control weakness which could have or is having a major adverse effect on the ability to achieve process objectives and comply with relevant legislation, or
a material misstatement in the financial report that is likely to occur.
Requires prompt management intervention with a detailed action plan implemented within two months.
Requires executive management to correct the material misstatement in the financial report to avoid a modified audit opinion.
Medium The issue represents:
a control weakness which could have or is having a moderate adverse effect on the ability to achieve process objectives and comply with relevant legislation, or
a misstatement in the financial report that is not material and has occurred.
Requires management intervention with a detailed action plan implemented within three to six months.
Low The issue represents:
a minor control weakness with minimal but reportable impact on the ability to achieve process objectives and comply with relevant legislation, or
a misstatement in the financial report that is likely to occur but is not expected to be material, or
an opportunity to improve an existing process or internal control.
Requires management intervention with a detailed action plan implemented within six to 12 months.
Source: VAGO.

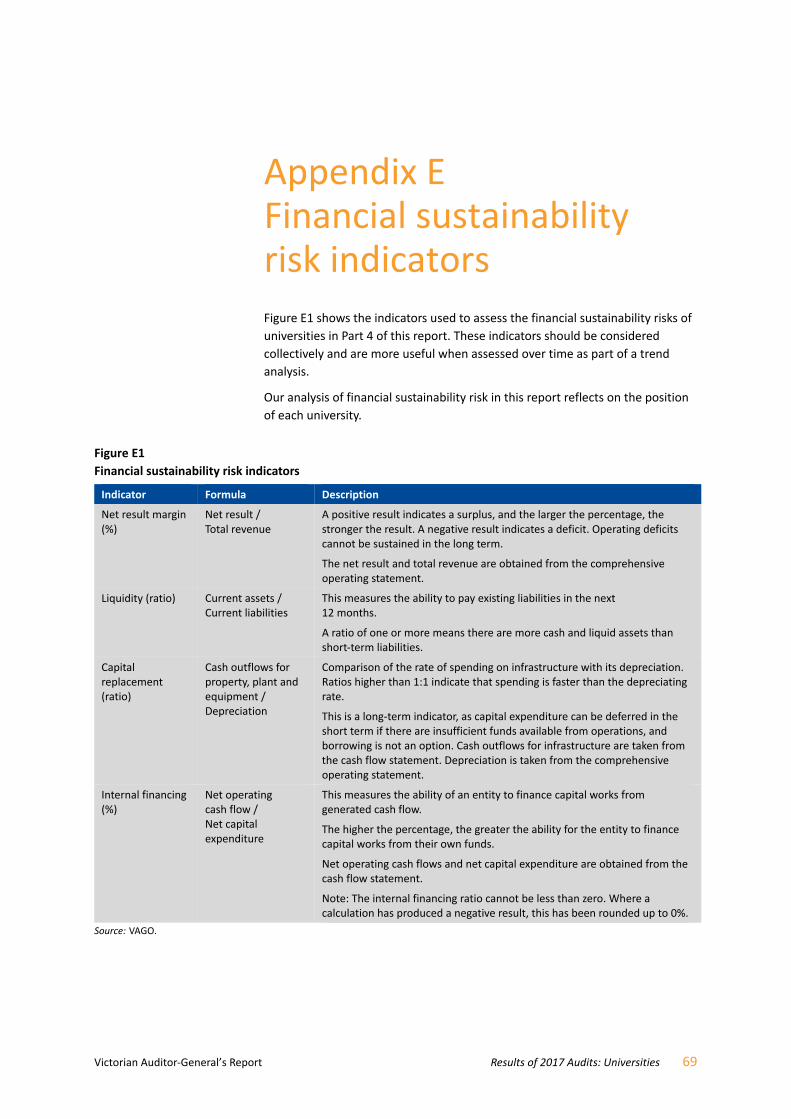
Victorian Auditor‐General’s Report Results of 2017 Audits: Universities 69
Appendix E Financial sustainability risk indicators
Figure E1 shows the indicators used to assess the financial sustainability risks of
universities in Part 4 of this report. These indicators should be considered
collectively and are more useful when assessed over time as part of a trend
analysis.
Our analysis of financial sustainability risk in this report reflects on the position
of each university.
Figure E1 Financial sustainability risk indicators
Indicator Formula Description
Net result margin (%)
Net result / Total revenue
A positive result indicates a surplus, and the larger the percentage, the stronger the result. A negative result indicates a deficit. Operating deficits cannot be sustained in the long term.
The net result and total revenue are obtained from the comprehensive operating statement.
Liquidity (ratio) Current assets / Current liabilities
This measures the ability to pay existing liabilities in the next 12 months.
A ratio of one or more means there are more cash and liquid assets than short‐term liabilities.
Capital replacement (ratio)
Cash outflows for property, plant and equipment / Depreciation
Comparison of the rate of spending on infrastructure with its depreciation. Ratios higher than 1:1 indicate that spending is faster than the depreciating rate.
This is a long‐term indicator, as capital expenditure can be deferred in the short term if there are insufficient funds available from operations, and borrowing is not an option. Cash outflows for infrastructure are taken from the cash flow statement. Depreciation is taken from the comprehensive operating statement.
Internal financing (%)
Net operating cash flow / Net capital expenditure
This measures the ability of an entity to finance capital works from generated cash flow.
The higher the percentage, the greater the ability for the entity to finance capital works from their own funds.
Net operating cash flows and net capital expenditure are obtained from the cash flow statement.
Note: The internal financing ratio cannot be less than zero. Where a calculation has produced a negative result, this has been rounded up to 0%.
Source: VAGO.
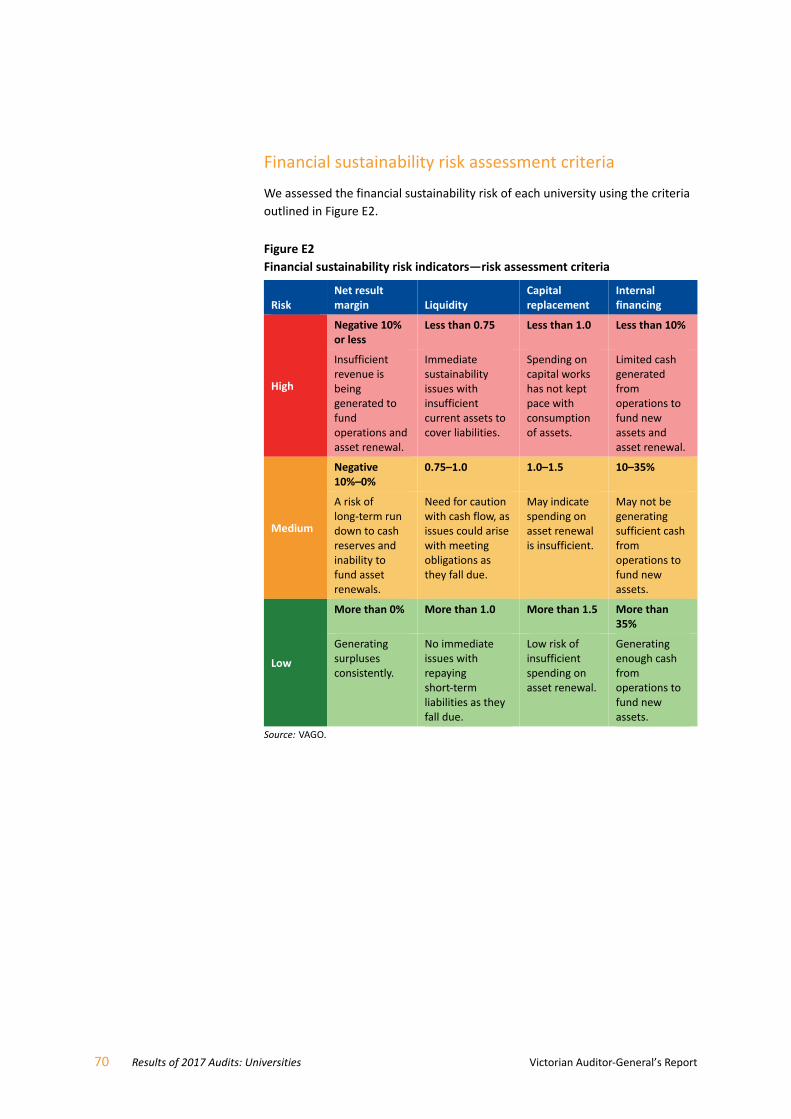
70 Results of 2017 Audits: Universities Victorian Auditor‐General’s Report
Financial sustainability risk assessment criteria
We assessed the financial sustainability risk of each university using the criteria
outlined in Figure E2.
Figure E2 Financial sustainability risk indicators—risk assessment criteria
Risk Net result margin Liquidity
Capital replacement
Internal financing
High
Negative 10% or less
Less than 0.75 Less than 1.0 Less than 10%
Insufficient revenue is being generated to fund operations and asset renewal.
Immediate sustainability issues with insufficient current assets to cover liabilities.
Spending on capital works has not kept pace with consumption of assets.
Limited cash generated from operations to fund new assets and asset renewal.
Medium
Negative 10%–0%
0.75–1.0 1.0–1.5 10–35%
A risk of long‐term run down to cash reserves and inability to fund asset renewals.
Need for caution with cash flow, as issues could arise with meeting obligations as they fall due.
May indicate spending on asset renewal is insufficient.
May not be generating sufficient cash from operations to fund new assets.
Low
More than 0% More than 1.0 More than 1.5 More than 35%
Generating surpluses consistently.
No immediate issues with repaying short‐term liabilities as they fall due.
Low risk of insufficient spending on asset renewal.
Generating enough cash from operations to fund new assets.
Source: VAGO.
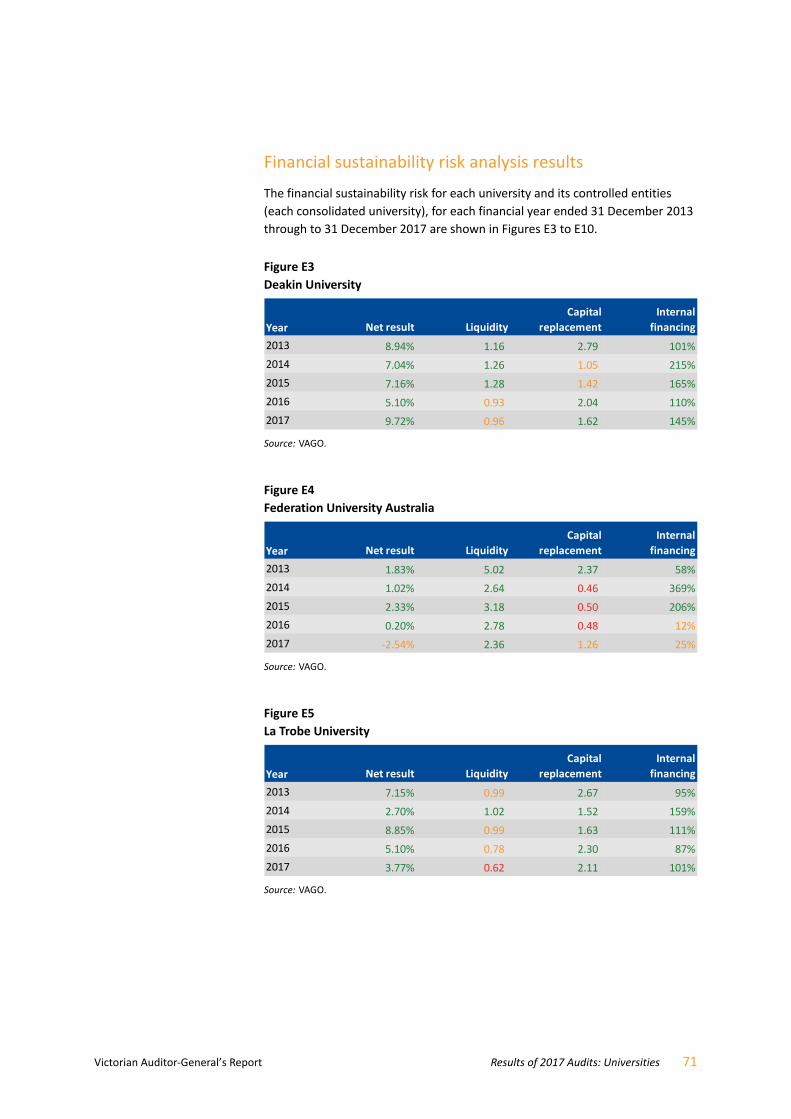
Victorian Auditor‐General’s Report Results of 2017 Audits: Universities 71
Financial sustainability risk analysis results
The financial sustainability risk for each university and its controlled entities
(each consolidated university), for each financial year ended 31 December 2013
through to 31 December 2017 are shown in Figures E3 to E10.
Figure E3 Deakin University
Source: VAGO.
Figure E4 Federation University Australia
Source: VAGO.
Figure E5 La Trobe University
Source: VAGO.
2013 8.94% 1.16 2.79 101%
2014 7.04% 1.26 1.05 215%
2015 7.16% 1.28 1.42 165%
2016 5.10% 0.93 2.04 110%
2017 9.72% 0.96 1.62 145%
Year Net result Liquidity
Capital
replacement
Internal
financing
2013 1.83% 5.02 2.37 58%
2014 1.02% 2.64 0.46 369%
2015 2.33% 3.18 0.50 206%
2016 0.20% 2.78 0.48 12%
2017 ‐2.54% 2.36 1.26 25%
Year Net result Liquidity
Capital
replacement
Internal
financing
2013 7.15% 0.99 2.67 95%
2014 2.70% 1.02 1.52 159%
2015 8.85% 0.99 1.63 111%
2016 5.10% 0.78 2.30 87%
2017 3.77% 0.62 2.11 101%
Year Net result Liquidity
Capital
replacement
Internal
financing
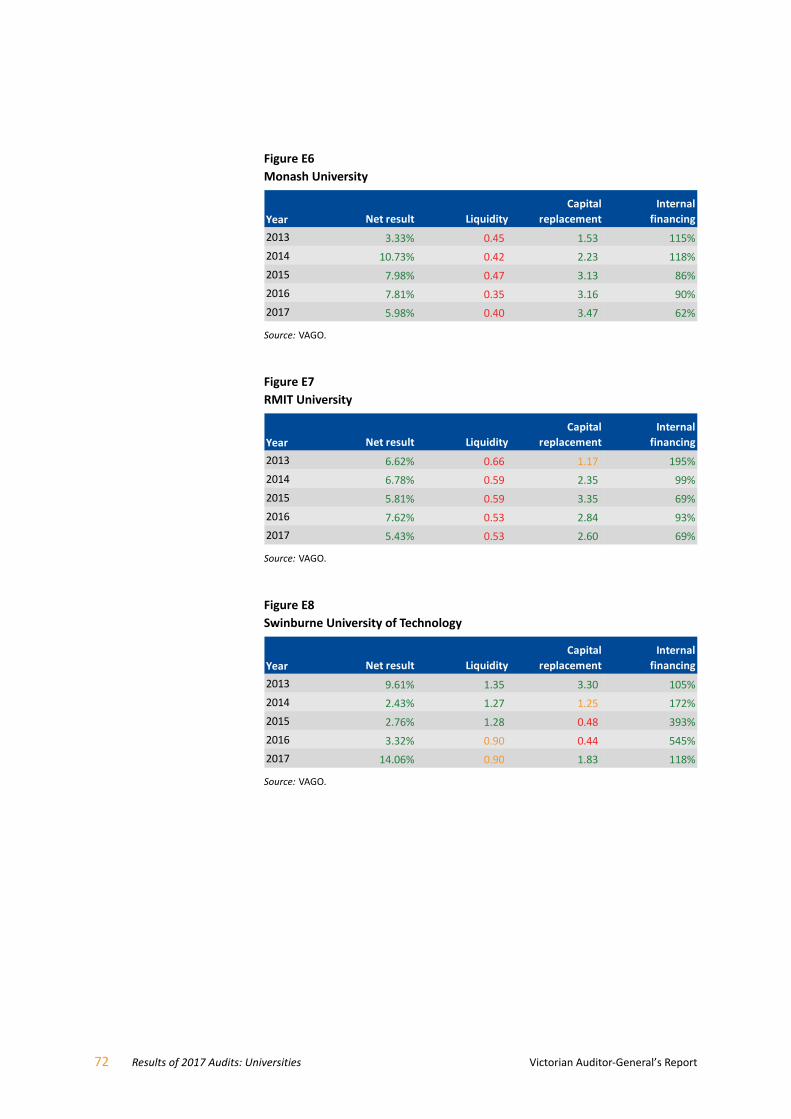
72 Results of 2017 Audits: Universities Victorian Auditor‐General’s Report
Figure E6 Monash University
Source: VAGO.
Figure E7 RMIT University
Source: VAGO.
Figure E8 Swinburne University of Technology
Source: VAGO.
2013 3.33% 0.45 1.53 115%
2014 10.73% 0.42 2.23 118%
2015 7.98% 0.47 3.13 86%
2016 7.81% 0.35 3.16 90%
2017 5.98% 0.40 3.47 62%
Year Net result Liquidity
Capital
replacement
Internal
financing
2013 6.62% 0.66 1.17 195%
2014 6.78% 0.59 2.35 99%
2015 5.81% 0.59 3.35 69%
2016 7.62% 0.53 2.84 93%
2017 5.43% 0.53 2.60 69%
Year Net result Liquidity
Capital
replacement
Internal
financing
2013 9.61% 1.35 3.30 105%
2014 2.43% 1.27 1.25 172%
2015 2.76% 1.28 0.48 393%
2016 3.32% 0.90 0.44 545%
2017 14.06% 0.90 1.83 118%
Year Net result Liquidity
Capital
replacement
Internal
financing
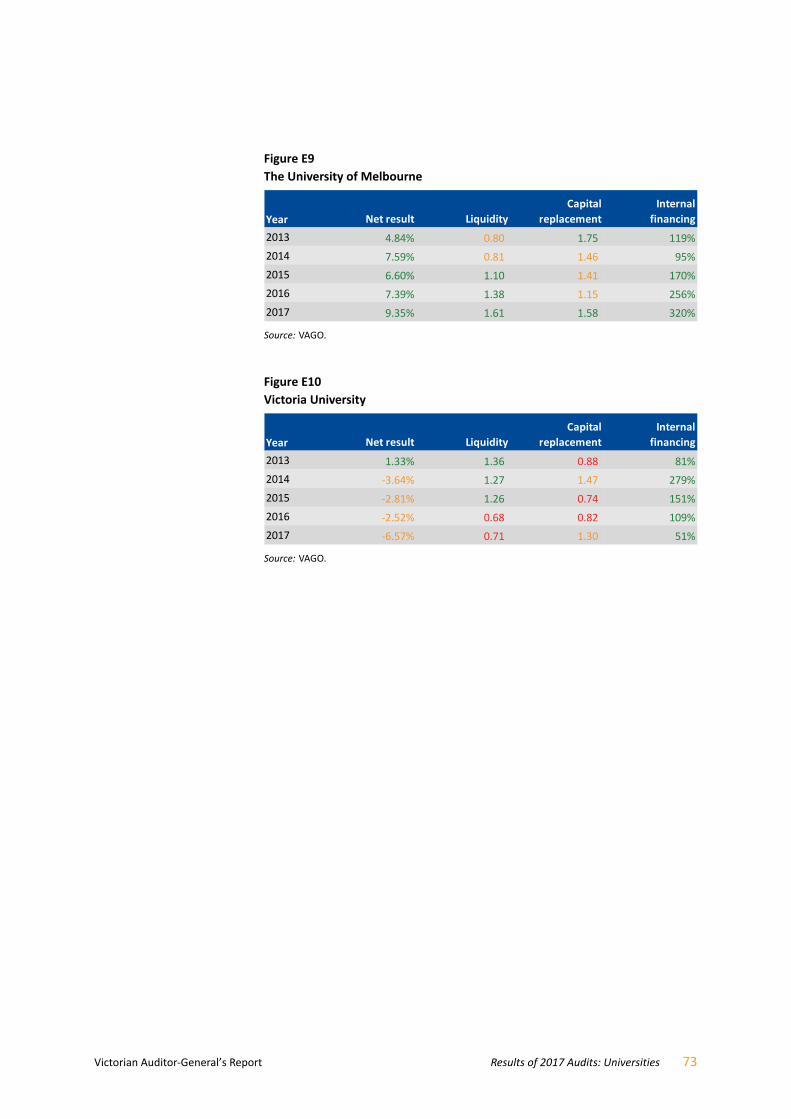
Victorian Auditor‐General’s Report Results of 2017 Audits: Universities 73
Figure E9 The University of Melbourne
Source: VAGO.
Figure E10 Victoria University
Source: VAGO.
2013 4.84% 0.80 1.75 119%
2014 7.59% 0.81 1.46 95%
2015 6.60% 1.10 1.41 170%
2016 7.39% 1.38 1.15 256%
2017 9.35% 1.61 1.58 320%
Year Net result Liquidity
Capital
replacement
Internal
financing
2013 1.33% 1.36 0.88 81%
2014 ‐3.64% 1.27 1.47 279%
2015 ‐2.81% 1.26 0.74 151%
2016 ‐2.52% 0.68 0.82 109%
2017 ‐6.57% 0.71 1.30 51%
Year Net result Liquidity
Capital
replacement
Internal
financing

Victorian Auditor‐General’s Report Results of 2017 Audits: Universities 75
Appendix F Glossary
Accountability
Responsibility of public entities to achieve their objectives in reliability of
financial reporting, effectiveness and efficiency of operations, compliance with
applicable laws, and reporting to interested parties.
Activity‐based funding
Method of allocating funding based on unit prices for each activity undertaken
and the volume of that activity an entity is to perform.
Adverse opinion
An audit opinion expressed if the auditor has sufficient appropriate audit
evidence and concludes that misstatements, individually and in aggregate, are
both material and pervasive in the financial report.
Amortisation
The systematic allocation of the depreciable amount of an intangible asset over
its expected useful life.
Asset
An item or resource controlled by an entity that will be used to generate future
economic benefits.
Asset valuation
The fair value of a non‐current asset on a specified date.
Audit Act 1994
Victorian legislation establishing the Auditor‐General’s operating powers and
responsibilities and detailing the nature and scope of audits that the
Auditor‐General may carry out.
Audit committee
Helps a governing board to fulfil its governance and oversight responsibilities
and strengthen accountability of senior management.
Audit opinion
A written expression, within a specified framework, indicating the auditor’s
overall conclusion about a financial (or performance) report based on audit
evidence.
Calendar year
A period of a year beginning with January 1 and ending with December 31.
76 Results of 2017 Audits: Universities Victorian Auditor‐General’s Report
Capital expenditure
Money an entity spends on:
new physical assets, including buildings, infrastructure, plant and
equipment
renewing existing physical assets to extend the service potential or life of
the asset.
Capital grant/capital purpose income
Government funding for an agency to acquire or build capital assets such as
buildings, land or equipment.
Carrying value
The original cost of an asset, less the accumulated amount of any depreciation
or amortisation, less the accumulated amount of any asset impairment.
Clear audit opinion
A positive written expression provided when the financial report has been
prepared and presents fairly the transactions and balances for the reporting
period in keeping with the requirements of the relevant legislation and
Australian Accounting Standards—also referred to as an unqualified audit
opinion.
Control environment
Processes within an entity’s governance and management structure that
provide reasonable assurance about the achievement of an entity’s objectives in
reliability of financial reporting, effectiveness and efficiency of operations, and
compliance with applicable laws and regulations.
Corporations Act 2001
Commonwealth legislation governing corporations, including their financial
reporting framework.
Credit rating
The rating that credit rating agencies assign to the bonds of an issuer.
Current asset
An asset that will be sold or realised within 12 months of the end of the
financial year being reported on, such as term deposits maturing in three
months or stock items available for sale.
Current liability
A liability that will be settled within 12 months of the end of the financial year
being reported on, such as payment of a creditor for services provided to the
entity.
Debt
Money owed by one party to another party.
Deficit
When total expenses are more than total revenue.
Victorian Auditor‐General’s Report Results of 2017 Audits: Universities 77
Depreciated replacement cost
Current replacement cost less accumulated depreciation to reflect the economic
benefits of the assets that have been consumed.
Depreciation
Systematic allocation of the value of an asset over its expected useful life,
recorded as an expense.
Disclaimer of opinion
Conclusion expressed if the auditor is unable to obtain sufficient appropriate
audit evidence on which to base an audit opinion, and the auditor concludes
that the possible effects on the financial (or performance) report of undetected
misstatements, if any, could be both material and pervasive.
Eliminations
Removing the effect of transactions between entities when preparing a
consolidated financial report.
Emphasis of matter
A paragraph included in an audit opinion that refers to a matter appropriately
presented or disclosed in the financial report that, in the auditor’s judgement, is
of such importance that it is fundamental to users’ understanding of the
financial report.
Entity
A corporate or unincorporated body that has a public function to exercise on
behalf of the state or is wholly owned by the state, including departments,
statutory authorities, statutory corporations and government business
enterprises.
Equity or net assets
Residual interest in the assets of an entity after deducting its liabilities.
Expense
The outflow of assets or the depletion of assets an entity controls during the
financial year, including expenditure and the depreciation of physical assets. An
expense can also be the incurrence of liabilities during the financial year, such as
increases to a provision.
Fair value
The price that would be received if an asset was sold or the price paid to
transfer a liability in an orderly transaction between market participants at the
measurement date.
Financial Management Act 1994
Victorian legislation governing public sector entities, as determined by the
Minister of Finance, including their financial reporting framework.
78 Results of 2017 Audits: Universities Victorian Auditor‐General’s Report
Financial Reporting Directions
Issued by the Minister of Finance for entities reporting under the Financial
Management Act 1994, with the aim of:
achieving consistency and improved disclosure in financial reporting for
Victorian public entities by eliminating or reducing divergence in accounting
practices
prescribing the accounting treatment and disclosure of financial
transactions in circumstances where there are choices in accounting
treatment, or where existing accounting procurements have no guidance or
requirements.
Financial sustainability
An entity’s ability to manage financial resources so it can meet its current and
future spending commitments, while maintaining assets in the condition
required to provide services.
Financial year
A period of 12 months for which a financial report is prepared, which may be a
different period to the calendar year.
Fiscal targets
Targets set by the government to meet short‐ and medium‐term economic
objectives.
General purpose framework
A financial reporting framework that dictates the presentation, disclosure and
treatment of items in a financial report in a manner intended to meet the needs
of common users of the financial report who may not be in a position to obtain
the information they need directly from the entity that prepared it. An example
of a general purpose framework is the Australian Accounting Standards and
Conceptual Framework issued by the Australian Accounting Standards Board.
Going concern
An entity that is expected to be able to pay its debts when they fall due, and
continue in operation without any intention or necessity to liquidate or
otherwise wind up its operations.
Governance
The control arrangements used to govern and monitor an entity’s activities to
achieve its strategic and operational goals.
Impairment (loss)
The amount by which the value of an entity’s asset exceeds its recoverable
value.
Income
The inflow of assets or decrease of liabilities during the financial year, including
receipt of cash and the reduction of a provision.

Victorian Auditor‐General’s Report Results of 2017 Audits: Universities 79
Income approach
A valuation technique that converts future amounts, such as cash flows or
income and expense, to a single current (discounted) amount. The fair value is
measured as the value indicated by current market expectations about those
future amounts.
Intangible asset
An identifiable non‐financial asset, controlled by an entity, that cannot be
physically seen, such as software licences or a patent.
Internal audit
A function of an entity’s governance framework that examines and reports to
management on the effectiveness of the entity’s risk management, internal
controls and governance processes.
Internal control
A method of directing, monitoring and measuring an entity’s resources and
processes to prevent and detect error and fraud.
Investment
The expenditure of funds intended to result in medium‐ to long‐term service
and/or financial benefits arising from the development and/or use of
infrastructure assets by either the public or private sectors.
Issues
Weaknesses or other concerns in the governance structure of an entity
identified during a financial audit, which are reported to the entity in a
management letter.
Liability
A present obligation of the entity arising from past events, the settlement of
which is expected to result in an outflow of assets from the entity.
Management letter
A letter the auditor writes to the governing body, the audit committee and the
management of an entity outlining issues identified during the financial audit.
Material error or adjustment
An error that may result in the omission or misstatement of information, which
could influence the economic decision of users taken on the basis of the
financial report.
Materiality
Information is material if its omission, misstatement or non‐disclosure has the
potential to affect the economic decisions of users of the financial report, or the
discharge of accountability by management or those charged with governance.
The size, value and nature of the information and the circumstances of its
omission or misstatement help in deciding how material it is.

80 Results of 2017 Audits: Universities Victorian Auditor‐General’s Report
Modified opinion
The auditor’s expressed qualified opinion, adverse opinion or disclaimer of
opinion.
Net result
The value that an entity has earned or lost over the stated period—usually a
financial year—calculated by subtracting an entity’s total expenses from the
total revenue for that period.
Non‐current asset
An asset that will be sold or realised later than 12 months after the end of the
financial year being reported on, such as investments with a maturity date of
two years or physical assets the entity holds for long‐term use.
Non‐current liability
A liability that will be settled later than 12 months after the end of the financial
year being reported on, such as repayments on a five‐year loan that are not due
in the next 12 months.
Non‐reciprocal transfers
Transfers in which an entity receives assets without directly giving equal value in
exchange to the other party to the transfer.
Other comprehensive income
Revenues, expenses, gains and losses under Australian Accounting Standards
that are excluded from net income on the income statement and are instead
listed after net income.
Peppercorn lease
The right to use an asset, usually land or building is given for a very small token
amount.
Physical asset
A non‐financial asset that is a tangible item an entity controls, and that will be
used by the entity for more than 12 months to generate profit or provide
services, such as building, equipment or land.
Present value
A current estimate of the present discounted value of the future net cash flows
in the normal course of business.
Qualified audit opinion
An opinion issued when the auditor concludes that an unqualified opinion
cannot be expressed because of:
disagreement with those charged with governance or
conflict between applicable financial reporting frameworks or
limitation of scope.
A qualified opinion is considered to be unqualified except for the effects of the
matter that relates to the qualification.

Victorian Auditor‐General’s Report Results of 2017 Audits: Universities 81
Revaluation
The restatement of a value of non‐current assets at a particular point in time.
Revenue
Inflows of funds or other assets or savings in outflows of service potential, or
future economic benefits in the form of increases in assets or reductions in
liabilities of an entity, other than those relating to contributions by owners, that
result in an increase in equity during the reporting period.
Risk
The chance of a negative or positive impact on the objectives, outputs or
outcomes of an entity.
Risk register
A tool an entity uses to help identify, monitor and mitigate risks. The register
may appear in the form of a plot graph or a table.
Self‐funding entities
Entities that generate most of their revenue from their operations, rather than
from government funding.
Specific purpose funds/specific purpose grants
Grant funding provided by the Commonwealth to the state government for a
particular area or service.
Strategic plan
A document an entity provides to its staff and board to communicate its
organisational goals, the actions needed to achieve those goals and other
critical elements developed during the planning exercise.
Unmodified opinion
The audit opinion that the auditor expresses when concluding that the financial
(or performance) report is prepared, in all material respects, in keeping with the
applicable reporting framework.
Whole‐of‐life cost
The cost to buy or construct an asset, plus the cost of maintaining the asset over
its life.


Auditor‐General’s reports tabled during 2017–18
Report title Date tabled
V/Line Passenger Services (2017–18:1) August 2017
Internal Audit Performance (2017–18:2) August 2017
Effectively Planning for Population Growth (2017–18:3) August 2017
Victorian Public Hospital Operating Theatre Efficiency (2017–18:4) October 2017
Auditor‐General’s Report on the Annual Financial Report of the State
of Victoria, 2016–17 (2017–18:5)
November 2017
Results of 2016–17 Audits: Water Entities (2017–18:6) November 2017
Results of 2016–17 Audits: Public Hospitals (2017–18:7) November 2017
Results of 2016–17 Audits: Local Government (2017–18:8) November 2017
ICT Disaster Recovery Planning (2017–18:9) November 2017
Managing the Level Crossing Removal Program (2017–18:10) December 2017
Improving Victoria’s Air Quality (2017–18:11) March 2018
Local Government and Economic Development (2017–18:12) March 2018
Managing Surplus Government Land (2017–18:13) March 2018
Protecting Victoria’s Coastal Assets (2017–18:14) March 2018
Safety and Cost Effectiveness of Private Prisons (2017–18:15) March 2018
Fraud and Corruption Control (2017–18:16) March 2018
Maintaining the Mental Health of Child Protection Practitioners
(2017–18:17)
May 2018
Assessing Benefits from the Regional Rail Link Project (2017–18:18) May 2018
Results of 2017 Audits: Technical and Further Education Institutes
(2017–18:19)
May 2018
All reports are available for download in PDF and HTML format on our website
www.audit.vic.gov.au
Victorian Auditor‐General’s Office
Level 31, 35 Collins Street
Melbourne Vic 3000
AUSTRALIA
Phone +61 3 8601 7000
Email [email protected]