Embed Size (px)
Citation preview
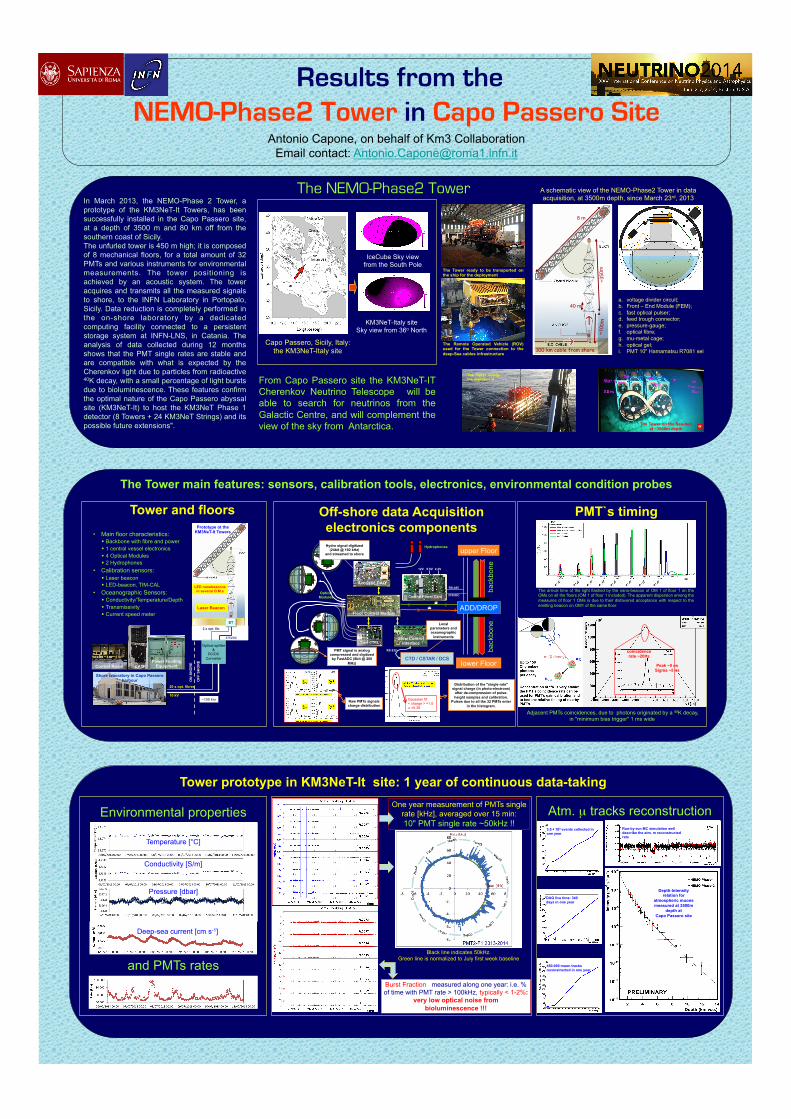
Results from the NEMO-Phase2 Tower in Capo Passero Site
The NEMO-Phase2 Tower
Capo Passero, Sicily, Italy: the KM3NeT-Italy site
In March 2013, the NEMO-Phase 2 Tower, a prototype of the KM3NeT-It Towers, has been successfully installed in the Capo Passero site, at a depth of 3500 m and 80 km off from the southern coast of Sicily. The unfurled tower is 450 m high; it is composed of 8 mechanical floors, for a total amount of 32 PMTs and various instruments for environmental measurements. The tower positioning is achieved by an acoustic system. The tower acquires and transmits all the measured signals to shore, to the INFN Laboratory in Portopalo, Sicily. Data reduction is completely performed in the on-shore laboratory by a dedicated computing facility connected to a persistent storage system at INFN-LNS, in Catania. The analysis of data collected during 12 months shows that the PMT single rates are stable and are compatible with what is expected by the Cherenkov light due to particles from radioactive 40K decay, with a small percentage of light bursts due to bioluminescence. These features confirm the optimal nature of the Capo Passero abyssal site (KM3NeT-It) to host the KM3NeT Phase 1 detector (8 Towers + 24 KM3NeT Strings) and its possible future extensions".
From Capo Passero site the KM3NeT-IT Cherenkov Neutrino Telescope will be able to search for neutrinos from the Galactic Centre, and will complement the view of the sky from Antarctica.
A schematic view of the NEMO-Phase2 Tower in data acquisition, at 3500m depth, since March 23rd, 2013
The Tower main features: sensors, calibration tools, electronics, environmental condition probes
Tower prototype in KM3NeT-It site: 1 year of continuous data-taking
IceCube Sky view from the South Pole
KM3NeT-Italy site Sky view from 36o North
Tower and floors
Atm. µ tracks reconstruction
Antonio Capone, on behalf of Km3 Collaboration Email contact: [email protected] 2014 JINST 9 C03045
(a) (b)
Figure 1. (a): the Capo Passero site, about 80 km offshore from the coast the south-most part of the Sicily,in Italy. (b): a sketch of the Phase 2 Tower.
data are real-time processed and filtered. Finally the center provides space and lodging for onsitepersonnel.
2.3 The Data Acquisition system
On each floor, the data stream from the four optical OMs and from the other instruments is gatheredby the FCM electronic board; the stream from all the floors is multiplexed at the base of the toweraccording to the Dense Wavelength Division Multiplexing (DWDM) protocol and sent to shorethrough the 100 km optical fibers along the EOC cable; once onshore and de-multiplexed, eachdata-stream originated from one FCM is addressed a specific board, called Ethernet Floor ControlModules (EFCM), twin to the FCM offshore but with some additional features like the ethernet portused to transfer the data to the onshore Trigger and Data Acquisition System (TriDAS), describedahead in this section.
To minimize the number of possible failure points in the abyssal site, and to open to sciencenot foreseen at the time of the detector building, no hardware triggers are added to the underwaterdetector, and all the measured signals are sent to the shore station. We refer to this approach as alldata to shore. The total available bandwidth for the optical data from the tower is 2 Gbps ( andcan be expanded up to 5 Gbps) which is well overabundant for the the specific optical conditionsin the NEMO Phase 2 case. In fact, as it will be shown in section 6, the optical background at theCapo Passero abyssal site is dominated by single photon hits on the PMTs after random 40K decays
– 4 –
40 m
8 m
~100
m
100 km cable from shore
2014 JINST 9 C03045
(a) (b)
Figure 1. (a): the Capo Passero site, about 80 km offshore from the coast the south-most part of the Sicily,in Italy. (b): a sketch of the Phase 2 Tower.
data are real-time processed and filtered. Finally the center provides space and lodging for onsitepersonnel.
2.3 The Data Acquisition system
On each floor, the data stream from the four optical OMs and from the other instruments is gatheredby the FCM electronic board; the stream from all the floors is multiplexed at the base of the toweraccording to the Dense Wavelength Division Multiplexing (DWDM) protocol and sent to shorethrough the 100 km optical fibers along the EOC cable; once onshore and de-multiplexed, eachdata-stream originated from one FCM is addressed a specific board, called Ethernet Floor ControlModules (EFCM), twin to the FCM offshore but with some additional features like the ethernet portused to transfer the data to the onshore Trigger and Data Acquisition System (TriDAS), describedahead in this section.
To minimize the number of possible failure points in the abyssal site, and to open to sciencenot foreseen at the time of the detector building, no hardware triggers are added to the underwaterdetector, and all the measured signals are sent to the shore station. We refer to this approach as alldata to shore. The total available bandwidth for the optical data from the tower is 2 Gbps ( andcan be expanded up to 5 Gbps) which is well overabundant for the the specific optical conditionsin the NEMO Phase 2 case. In fact, as it will be shown in section 6, the optical background at theCapo Passero abyssal site is dominated by single photon hits on the PMTs after random 40K decays
– 4 –
2013 JINST 8 P07001
Figure 1. Schematic view of the main components of an optical module: (a) voltage divider circuit; b) Front-end module (FEM); (c) fast optical pulser of the Tim-Cal; (d) feed trough connector; (e) pressure-gauge; (f)optical fibre; (g) mu-metal cage; (h) optical gel; (i) PMT.
mu-metal wire cage is used as a shield against the Earth’s magnetic field. Inside the OM also thevoltage supply circuit soldered to the PMT, the Front End Module (FEM) and an optical system forTiming Calibration (Tim-Cal) are housed. An extensive R&D study has been carried out over thepast few years in order to select each element of the optical module and to optimize the productionprocedure. This work is summarized in the following sections.
2.1 The transparent high-pressure vessel
The requirements for the high-pressure vessel of the optical module are:
• capability to withstand hydrostatic pressure, up to 400 atm;
• transparency to photons in the 350-600 nm wavelength range and a refractive index thatensures a good optical matching between the sea-water and the PMT.
A standard 13-inch spherical deep-sea instrumentation vessel in borosilicate glass, produced byNautilus1 was selected. This sphere is smaller than the 17-inch vessel adopted in Phase-1 of theNEMO project inline of the choice made by the ANTARES project [8].
Indeed, many tests proved that a 10-inch PMT could be safely contained in a smaller vessel.This solution simplifies many technical and mechanical aspects of the tower construction.
Each glass sphere is composed by two hemi-spherical halves: one supports the PMT and themu-metal cage, glued to the glass inner surface using an optical gel. The inner surface of the second
1Nautilus Marine Service GmbH, Heferwende 3, D-28357 Bremen, Germany, web-site: www.nautilus-gmbh.de
– 3 –
a. voltage divider circuit; b. Front – End Module (FEM); c. fast optical pulser; d. feed trough connector; e. pressure-gauge; f. optical fibre; g. mu-metal cage; h. optical gel; i. PMT 10" Hamamatsu R7081 sel
~350
m
One year measurement of PMTs single rate [kHz], averaged over 15 min: 10" PMT single rate ~50kHz !!
Black line indicates 50kHz. Green line is normalized to July first week baseline
Anchor
The ROV
The Tower during the deployment
• Main floor characteristics: § Backbone with fibre and power § 1 central vessel electronics § 4 Optical Modules § 2 Hydrophones
• Calibration sensors: § Laser beacon § LED-beacon, TIM-CAL
• Oceanographic Sensors: § Conductivity/Temperature/Depth § Transmissivity § Current speed meter
20 x opt. fib.
10 kV ~100 km
Prototype ot the KM3NeT-It Towers
375VDC
2 x opt. fib.
Optical splitter &
DC/DC Converter
Shore laboratory in Capo Passero harbour
Control Room DAQ Power Feeding
Equipment
20 x opt. fibres
ON
SH
OR
E O
FF S
HO
RE
BT
Laser Beacon
LED nanobeacons in several O.M.s
Off-shore data Acquisition electronics components
upper Floor Hydrophones
Optical Modules
Hydro signal digitized (24bit @ 192 kHz)
and streamed to shore
Slow Control Interface
Acoustic DAQ
lower Floor
375VDC
RS-485
12V 5.5V 4.2V
CPS
Floor Control Module
CTD / CSTAR / DCS
Time CTRL
RS-232
ADD/DROP
back
bone
ba
ckbo
ne
Control Power Card
PMT signal is analog compressed and digitized by FastADC (8bit @ 200
MHz)
Local parameters and oceanographic
instruments
Distribution of the "single-rate" signal charge (in photo-electrons)
after de-compression of pulse-height samples and calibration.
Pulses due to all the 32 PMTs enter in the histogram.
Raw PMTs signals charge distribution
Gaussian fit: < charge > =1.0 σ =0.36
Environmental properties
Temperature [°C]
Conductivity [S/m]
Pressure [dbar]
Deep-sea current [cm s-1]
and PMTs rates
3.5 � 109 events collected in one year
Run-by-run MC simulation well describe the atm. m reconstructed rate
Depth-Intensity relation for
atmospheric muons measured at 3500m
depth at Capo Passero site
DAQ live time: 340 days in one year
450.000 muon tracks reconstructed in one year
Burst Fraction measured along one year: i.e. % of time with PMT rate > 100kHz, typically < 1-2%:
very low optical noise from bioluminescence !!!
PMT`s timing
Adjacent PMTs coincidences, due to photons originated by a 40K decay, in "minimum bias trigger" 1 ms wide
Figure 7: Time coincidences in µs of the 40K between OM 0 and 1 of the first floor of theNEMO detector during May13. The characteristic triangle shape is clearly visible.
Figure 8: Zoom of the time coincidences in µs of the 40K between OM 0 and 1 of the firstfloor of the NEMO detector in the period May13. The fit function is superimposed to thehistogram.
17
coincidence rate ~20Hz
2014 JINST 9 C03045
Figure 3. The arrival time of the light flashed by the nanobeacon of OM 1 of floor 1 on the OMs on all thefloors (OM 1 of floor 1 included). As it is explained in the text, the time-stamp recorded by the higher OMsis older because of the delay when receiving the sync signal. The apparent dispersion among the measuresof floor 1 OMs is due to their disfavored acceptance with respect to the emitting beacon on OM1 of thesame floor.
actually sampled the hit ( note that the hit time resolution can be boosted to better than 1 ns witha more precise elaboration of the hit waveform, which is performed offline). The higher is thefloor, the longer is the fiber which connects it to the base of the tower. For this reason the variousFCMs receive the clock information with a delay proportional to their height. This means that thetimeline of the higher floors is backward shifted: a signal seen simultaneously by all the OMs willbe recorded with older time-stamps by the topmost FEMs. The time-offsets which have to be addedto the time-stamps recorded by the various OMs are evaluated with special time calibration runs.
As previously reported in section 2.1, some reference OM is equipped with one nanobeaconthat is used to flash light with a given wavelength. Taking into account the light propagation inwater, it is possible to compute the time-offset by matching the detecting time of the flashed lightby each OMs with the reference one. The calibration runs have a duration of 10 minutes. Theflashing rate is set to 2 kHz. Figure 3 shows, for a particular calibration run using the nanobeaconof OM1 in floor 1 as emitter, the collected time of detections of the flashed light made by all theOMs. The time offsets are computed correlating the various time of arrival with respect to theearliest one.
5 40K coincidences
When 40K decays occur very close to a pair of nearby OMs at the end of the floors, two photonsoriginated in the same decay can hit separately each of the two PMTs. In this case, a very narrowtime coincidence (expected to be smaller than 10 ns) is triggered on such PMTs. This kind ofcoincidences has a random occurrence and affect only a pair of close PMTs, being uncorrelatedwith all the others. Figure 4(a) shows, for OMs 3 and 4 of floor 1, the distribution of the timedifferences in the range [- 1 µs, 1 µs ] matching all the hits recorded by the two OMs in a period of3 days of data taking. The apparent triangular distribution confirms the general lack of correlation
– 7 –
The arrival time of the light flashed by the nano-beacon of OM 1 of floor 1 on the OMs on all the floors (OM 1 of floor 1 included). The apparent dispersion among the measures of floor 1 OMs is due to their disfavored acceptance with respect to the emitting beacon on OM1 of the same floor.
Peak ~0 ns Sigma ~5 ns
The Tower ready to be transported on the ship for the deployment
The Tower on the Sea-bed at ~3500m depth
The Remote Operated Vehicle (ROV) used for the Tower connection to the deep-Sea cables infrastructure


![[Jshopen] Phase2 Final](https://img.pdfslide.us/doc/110x75/577d259b1a28ab4e1e9f3ae3/jshopen-phase2-final.jpg)