Embed Size (px)
Citation preview

Results From the 2014 National Wilderness Manager Survey
Ramesh Ghimire, Ken Cordell, Alan Watson, Chad Dawson, and Gary T. Green
United States Department of Agriculture
Forest Rocky Mountain General TechnicalService Research Station Report RMRS-GTR-336 September 2015

To learn more about RMRS publications or search our online titles:
www.fs.fed.us/rm/publicationswww.treesearch.fs.fed.us/
Ghimire, Ramesh; Cordell, Ken; Watson, Alan; Dawson, Chad; Green, Gary T. 2015. Results From the 2014 National Wilderness Manager Survey. Gen. Tech. Rep. RMRS-GTR-336. Fort Collins, CO: U.S. Department of Agriculture, Forest Service, Rocky Mountain Research Station. 96 p.
Abstract A national survey of managers was developed to support interagency wilderness strategic planning. The focus was on major challenges, perceived needs for science and training, and accomplishments of 1995 Strategic Plan objectives. The survey was administered to manag-ers at the four federal agencies with wilderness management responsibilities: the Bureau of Land Management, National Park Service, U.S. Fish and Wildlife Service, and U.S. Forest Service. In spring 2014, responses were received from 368 managers. The highest rank-ing threat perceived was “lack of political and financial support for wilderness protection and management,” followed by “invasive species,” “disconnected urban audiences” and “adjacent land use and management.” The greatest need for science-based information was “public at-titudes toward intervention to adapt to climate change influences” and “public attitudes toward ecological restoration activities.” The majority of managers commonly perceived no or only slight accomplishment of previous strategic plan objectives.
Keywords: Wilderness, manager survey, wilderness science, wilderness training, wilderness values.
AuthorsRamesh Ghimire is a postdoctoral research associate at the University of Georgia, Athens, Georgia, [email protected]; Ken Cordell is a scientist emeritus at the Aldo Leopold Wilderness Research Institute, Missoula, Montana, and with the U.S. Department of Agriculture, Forest Service, Southern Research Station, Athens, Georgia, [email protected]; Alan Watson is a social scientist at the Aldo Leopold Wilderness Research Institute with the U.S. Department of Agriculture, Forest Service, Rocky Mountain Research Station, Missoula, Montana, [email protected]; Chad Dawson is a professor emeritus at the College of Environmental Science and Forestry, State University of New York, Syracuse, N.Y., and is editor-in-chief of the International Journal of Wilderness, [email protected]; Gary T. Green is an associate professor at the University of Georgia, Athens, Georgia, [email protected].

Contents
Introduction and Methods . . . . . . . . . . . . . . . . . . . . . . . . . . . . . . . . . . . . . . . . . 1The Survey and How It Was Distributed to Managers . . . . . . . . . . . . . . . . . 1Pilot Testing and Pilot Results . . . . . . . . . . . . . . . . . . . . . . . . . . . . . . . . . . . 2Wilderness Manager Survey Response Metadata . . . . . . . . . . . . . . . . . . . . 3Data Analysis. . . . . . . . . . . . . . . . . . . . . . . . . . . . . . . . . . . . . . . . . . . . . . . . . 3The Survey Team . . . . . . . . . . . . . . . . . . . . . . . . . . . . . . . . . . . . . . . . . . . . . 4
Results. . . . . . . . . . . . . . . . . . . . . . . . . . . . . . . . . . . . . . . . . . . . . . . . . . . . . . . . . 4Manager Profiles . . . . . . . . . . . . . . . . . . . . . . . . . . . . . . . . . . . . . . . . . . . . . . 4Values That Managers Attach to Wilderness. . . . . . . . . . . . . . . . . . . . . . . . . 9Level of Potential Threats . . . . . . . . . . . . . . . . . . . . . . . . . . . . . . . . . . . . . . 10Major Challenges . . . . . . . . . . . . . . . . . . . . . . . . . . . . . . . . . . . . . . . . . . . . 12Two Most Important Problems. . . . . . . . . . . . . . . . . . . . . . . . . . . . . . . . . . . 13
Training and Research . . . . . . . . . . . . . . . . . . . . . . . . . . . . . . . . . . . . . . . . . . . 14Level of Need for Manager Training . . . . . . . . . . . . . . . . . . . . . . . . . . . . . . 14Training Needs . . . . . . . . . . . . . . . . . . . . . . . . . . . . . . . . . . . . . . . . . . . . . . 14Research Needs Categories . . . . . . . . . . . . . . . . . . . . . . . . . . . . . . . . . . . . 15Adequacy and Availability of Decision-Making Information . . . . . . . . . . . . . 15
Accomplishment of 1995 Strategic Plan Objectives . . . . . . . . . . . . . . . . . . . 16Introduction . . . . . . . . . . . . . . . . . . . . . . . . . . . . . . . . . . . . . . . . . . . . . . . . . 16Level of Accomplishment of Management Goals and Objectives . . . . . . . . 17
Summary of Survey Findings . . . . . . . . . . . . . . . . . . . . . . . . . . . . . . . . . . . . . 22
References . . . . . . . . . . . . . . . . . . . . . . . . . . . . . . . . . . . . . . . . . . . . . . . . . . . . 25
Appendix 1: Introduction and Methods . . . . . . . . . . . . . . . . . . . . . . . . . . . . . 25Survey Instruments . . . . . . . . . . . . . . . . . . . . . . . . . . . . . . . . . . . . . . . . . . . 25Example Letter to Prospective Respondents . . . . . . . . . . . . . . . . . . . . . . . 36Time Burden of the Survey as Indicated by the Pilot Respondents . . . . . . 37
Appendix 2. Manager Profiles, Importance of Wilderness Values, Perceived Threats, Challenges and Strategic Issues . . . . . . . . . . . . . . . . 44
Appendix 3: Training and Research . . . . . . . . . . . . . . . . . . . . . . . . . . . . . . . . 59Appendix 4: Accomplishment of the 1995 NWPS Strategic Plan Objectives. . . . . . . . . . . . . . . . . . . . . . . . . . . . . . . . . . . . . . . . . . . . . . . 66
Appendix 5. Qualitative Analysis Results . . . . . . . . . . . . . . . . . . . . . . . . . . . 75A5.1 Major challenges . . . . . . . . . . . . . . . . . . . . . . . . . . . . . . . . . . . . . . . . 75A5.2 Two most important problems . . . . . . . . . . . . . . . . . . . . . . . . . . . . . . 79A5.3 Specific training needs . . . . . . . . . . . . . . . . . . . . . . . . . . . . . . . . . . . . 84A5.4 Five specific research needs . . . . . . . . . . . . . . . . . . . . . . . . . . . . . . . 89A5.5 Other threats (open ended responses) . . . . . . . . . . . . . . . . . . . . . . . 93A5.6 Final comments. . . . . . . . . . . . . . . . . . . . . . . . . . . . . . . . . . . . . . . . . . 95
USDA Forest Service RMRS-GTR-336. 2015. 1
Introduction and MethodsThe year 2014 marked the 50th anniversary of the passage of the U.S. Wilderness Act (Public Law 88-577). Across the nation, many celebrations; community events; ac-knowledgements in scientific journals, popular magazines and newspaper articles; and official actions celebrated the past and looked at the future of the National Wilderness Preservation System (NWPS), which the Act established. One official action in 2014 was release of a strategic planning document: 2020 Vision (http://www.wilderness.net/toolboxes/documents/50th/2020_Vision.pdf) by the four agencies charged with wilder-ness management on federal lands: the Bureau of Land Management (BLM), the National Park Service (NPS), the U.S. Fish and Wildlife Service (USFWS), and the U.S. Forest Service (USFS). The only previous national, interagency wilderness strategic plan was released in 1995, just after the 30th anniversary of the Wilderness Act (Bureau of Land Management and others 1995).
The National Wilderness Preservation System has changed since 1995, and the public’s relationships with it have also changed. The system now encompasses nearly 110 million acres, and hopes and methods of protecting wilderness values have spread around the world. The U.S. population is larger and more diverse and reasons for valuing wilder-ness have become more clear. The Nation’s economy, leisure patterns, and scientific knowledge have changed, and the landscape is under pressure from many political and environmental forces. In 2013, the Interagency Wilderness Policy Council directed the Arthur Carhart National Wilderness Training Center and the Aldo Leopold Wilderness Research Institute to facilitate revision of the 1995 plan, as documented by the 2020 Vision. Both the Carhart Center and Leopold Institute provided oversight of the 2014 National Wilderness Manager Survey (NWMS) to inform this plan revision.
The Survey and How It Was Distributed to ManagersAlthough the 2020 Vision plan is intended to guide activities for only the next 5 years, the NWMS asked managers in all four agencies to consider the challenges facing wilderness stewardship over the next 20 years. Questions about the adequacy of scientific informa-tion concerned the current availability of knowledge, implying that if we are short of information now, these areas should be targeted for knowledge development. Depending upon the subject, these could be short-term emphases on knowledge transfer or could refer to long-term basic and applied science.
The NWMS was administered online. It included questions about the respondent and featured open-ended as well as categorical response options about major challenges, threats, training, science needs, and strategic planning issues. Information gathered about respondents included their duties and tenure in wilderness management, years with the agency, duty station, and wilderness area in which most of their wilderness manage-ment work was done. Open-ended questions asked respondents to list major challenges, identify specific threats, suggest training topics, identify research needs, and list the two most important problems facing future wilderness stewardship. These items were deemed important for the strategic plan to address.

2 USDA Forest Service RMRS-GTR-336. 2015.
Categorical questions typically asked managers to rate, on a multi-point scale, their per-ceived level of threat to the wilderness experience or resource, and the need for additional training and research. Two optional modules at the end of the survey could be completed at the discretion of the respondent on: (1) the importance of each of 13 previously studied wilderness values (Cordell et al. 2008) on a multi-point scale (asked of the general public in a nationwide survey), and (2) levels of perceived accomplishment of the 1995 NWPS strategic plan objectives (Bureau of Land Management and others 1995).
The survey instrument went through many rounds of team reviews and revisions. Both the instrument and its administration through SurveyMonkey® 1 (http://www.surveymon-key.com) were pilot-tested by a panel of career-rich retired wilderness managers who had worked at a variety of levels in one or more of the managing agencies.
Survey administration of the final revised NWMS was meant to include all managers working with the NWPS. However, full population inclusion or even meaningful sam-pling was not possible owing to differences in management organizations across the four agencies, and, even within agencies, differences in job responsibilities across regions, parks, or states. The e-mail contact system in all agencies is oriented toward individuals, not wilderness management units. Therefore, we did not have an accurate estimate of the number of wilderness managers (survey population) nor up-to-date identification of spe-cific employees who had been assigned wilderness management duties. To approximate the population of managers, requests to participate were sent to the field, regional, and national offices by a representative of each agency.
Wilderness management by all four agencies was broadly defined to include resource and visitor management, law enforcement, public information, planning, and policy develop-ment. All levels of the organization were included, from the field to their Washington, D.C., offices. Completed surveys were forwarded automatically by SurveyMonkey to team members at the University of Georgia, Athens, Georgia, for analysis. The analysis reported here summarizes survey data provided by NWPS managers overall, but has also been reported, in most cases, separately by the agency. The survey instrument and an example letter sent to prospective respondents are included in appendix 1.
Pilot Testing and Pilot Results A pilot test of the survey instrument and data collection methods was conducted by using a selected group of recently retired wilderness managers. Requesting retirees to complete and comment on the survey avoided using current managers for piloting and thus losing data from those respondents. Pilot respondents were asked to complete the survey, offer critiques of the question wording and survey instrument, and indicate how much time it took. A total of 17 retirees completed the pilot test survey, Although it was designed to take about 30 minutes to complete, some respondents reported that it took longer than anticipated. See appendix 1 for the approximate time burden they noted.
The questionnaire was reduced in length and wording of items clarified based on feed-back from this pilot test. Hence, the knowledge and experience these retired managers brought to the pilot test helped us improve the survey before submitting it to current managers within the agencies.
USDA Forest Service RMRS-GTR-336. 2015. 3
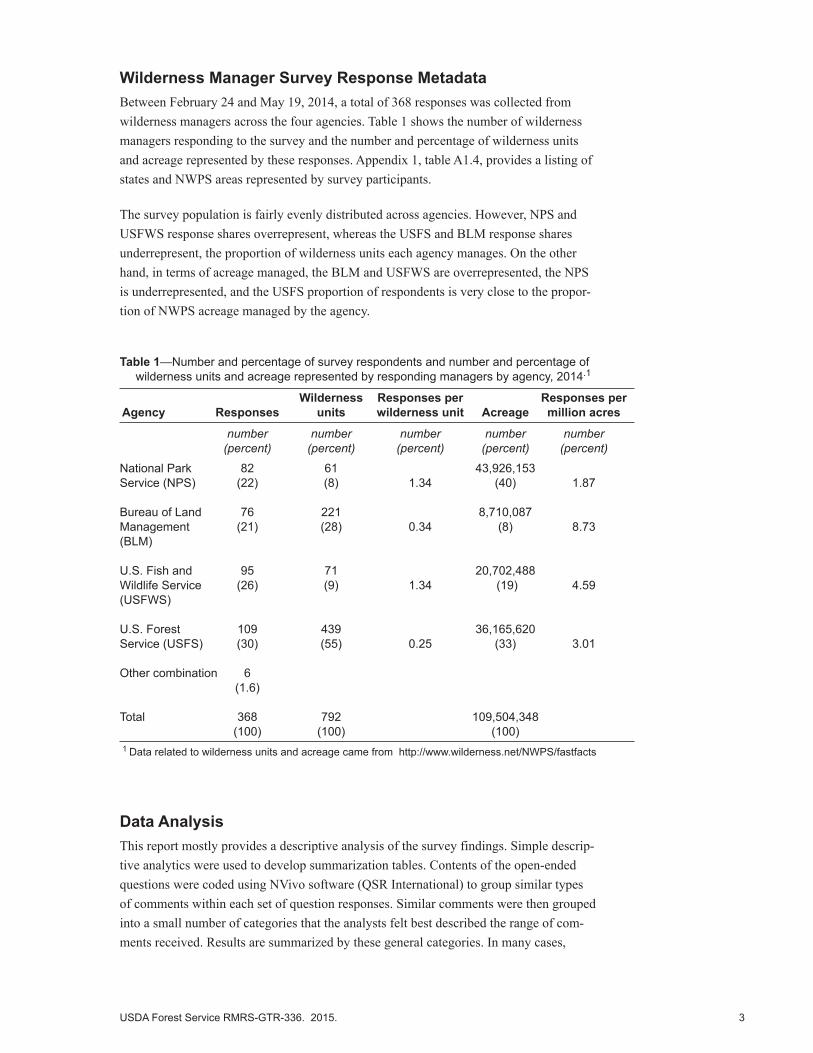
Wilderness Manager Survey Response Metadata Between February 24 and May 19, 2014, a total of 368 responses was collected from wilderness managers across the four agencies. Table 1 shows the number of wilderness managers responding to the survey and the number and percentage of wilderness units and acreage represented by these responses. Appendix 1, table A1.4, provides a listing of states and NWPS areas represented by survey participants.
The survey population is fairly evenly distributed across agencies. However, NPS and USFWS response shares overrepresent, whereas the USFS and BLM response shares underrepresent, the proportion of wilderness units each agency manages. On the other hand, in terms of acreage managed, the BLM and USFWS are overrepresented, the NPS is underrepresented, and the USFS proportion of respondents is very close to the propor-tion of NWPS acreage managed by the agency.
Table 1—Number and percentage of survey respondents and number and percentage of wilderness units and acreage represented by responding managers by agency, 2014.1
Wilderness Responses per Responses per Agency Responses units wilderness unit Acreage million acres
number number number number number (percent) (percent) (percent) (percent) (percent)
National Park 82 61 43,926,153Service (NPS) (22) (8) 1.34 (40) 1.87
Bureau of Land 76 221 8,710,087Management (21) (28) 0.34 (8) 8.73(BLM)
U.S. Fish and 95 71 20,702,488Wildlife Service (26) (9) 1.34 (19) 4.59(USFWS)
U.S. Forest 109 439 36,165,620Service (USFS) (30) (55) 0.25 (33) 3.01
Other combination 6 (1.6)
Total 368 792 109,504,348 (100) (100) (100)1 Data related to wilderness units and acreage came from http://www.wilderness.net/NWPS/fastfacts
Data AnalysisThis report mostly provides a descriptive analysis of the survey findings. Simple descrip-tive analytics were used to develop summarization tables. Contents of the open-ended questions were coded using NVivo software (QSR International) to group similar types of comments within each set of question responses. Similar comments were then grouped into a small number of categories that the analysts felt best described the range of com-ments received. Results are summarized by these general categories. In many cases,

4 USDA Forest Service RMRS-GTR-336. 2015.
contents of more complex responses were sufficiently diverse to fit into multiple group-ings. Hence, the count of responses or comments for open-ended questions across groups was greater than total number of respondents or responses. Some of the responses were very brief, sometimes just one word (for example, fire, technology, management). In these cases, analyst judgment was relied on for placement into groups.
The Survey Team The National Wilderness Manager Survey was developed by a national team of expe-rienced social scientists. This Survey Team was assembled to design, test, execute, and report results for use in development of the national interagency strategic plan and to in-form policy decisions over the next several years. The team included both federal agency and university collaborators.
Initial instrument content was developed by Alan Watson, research social scientist, Aldo Leopold Wilderness Research Institute, Forest Service, Missoula, Montana and Chad Dawson, professor emeritus, College of Environmental Sciences and Forestry, State University of New York, Syracuse, N.Y. Additional modules, design, piloting, testing, revision, data management, and analyses were executed by team members in Athens, Georgia. The Athens team included Ramesh Ghimire, post-doctoral research associ-ate, University of Georgia; Ken Cordell, scientist emeritus, Aldo Leopold Wilderness Research Institute, and Gary T. Green, associate professor, University of Georgia. Other team members involved in all phases of the project included Rudy Schuster, branch chief, U.S. Geological Survey, and Troy Hall, professor, Oregon State University, Corvallis, Oregon.1
ResultsManager ProfilesThe profiles of responding managers can be described in terms of years in current posi-tion, years of wilderness management experience, agency employment, and location of wilderness management assignment.
Respondents by agency and years in current positionManagers reported an average of 8 years of tenure in their current position (appendix 2, table A2.1), though a slight majority (55 percent) reported 0 to 5 years (fig. 1). Number of years in current position varied somewhat though the patterns were similar across agen-cies. The BLM and the USFS, however, had higher percentages of respondents with more than 20 years of experience than did the other agencies.
1 We thank Alexandra Fulmer (graduate student at the Warnell School of Forestry and Natural Resources at the University of Georgia) for her help in qualitative data analysis.

USDA Forest Service RMRS-GTR-336. 2015. 5
Respondents by years of having responsibility for wilderness stewardshipOn average, responding managers had worked for about 12 years with responsibilities for wilderness stewardship (appendix 2, table A2.2). The USFS had a much smaller percent-age of respondents with 5 or fewer years of stewardship assignment (21 percent), whereas the USFWS had a larger percentage (42 percent) of respondents with 5 or fewer years (fig. 2).
0
10
20
30
40
50
60
Overall BLM NPS USFS USFWS
Percen
t of respo
nden
ts
Respondents by agency
0-‐5 years
6-‐10 years
11-‐15 years
16-‐20 years
>20 years
Figure 1—Respondent managers by agency and by years in current position.
Figure 2—Respondent managers by years of responsibility for wilderness stewardship for all agencies and for each agency.
0 5
10 15 20 25 30 35 40 45
Overall BLM NPS USFS USFWS
Percen
t of respo
nden
ts
Respondents by agency
0-‐5 years
6-‐10 years
11-‐15 years
16-‐20 years
>20 years
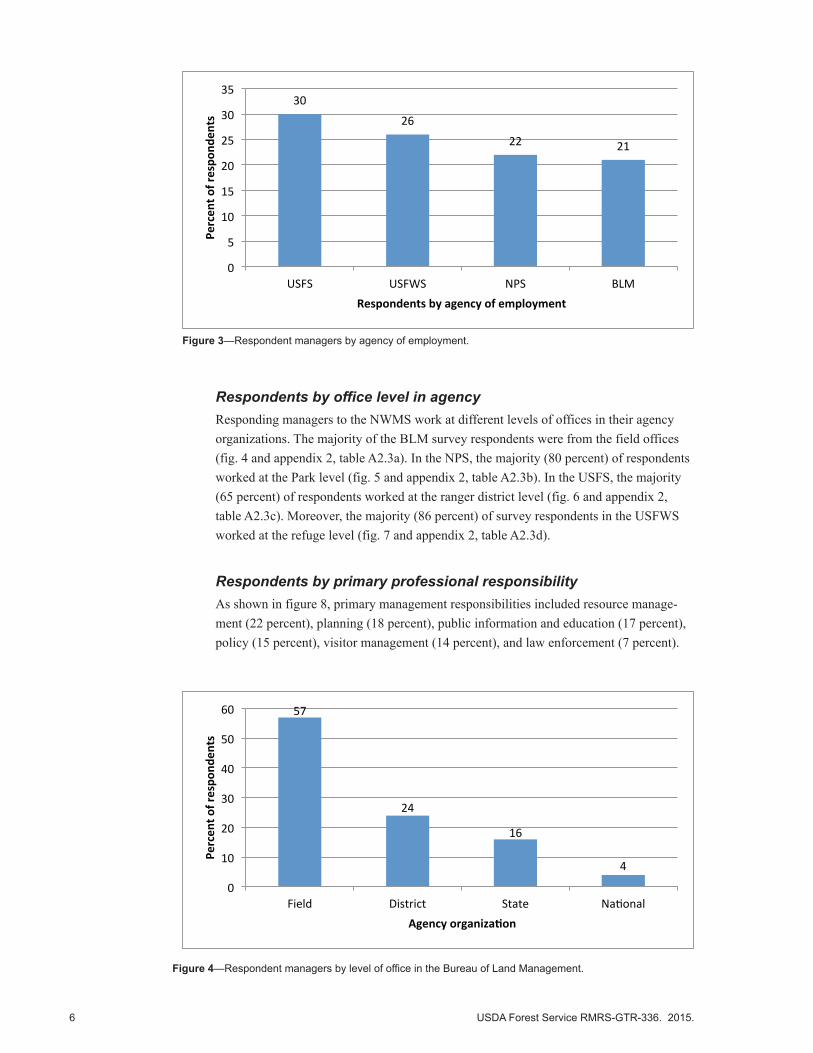
Respondents by employing agencyThe largest percentage of respondents (30 percent) was from the USFS, followed by USFWS (26 percent), NPS (22 percent), and BLM (21 percent) (fig. 3 and appendix 2, table A2.3). Hence, respondent numbers were somewhat evenly spread across agencies.
6 USDA Forest Service RMRS-GTR-336. 2015.
Respondents by office level in agencyResponding managers to the NWMS work at different levels of offices in their agency organizations. The majority of the BLM survey respondents were from the field offices (fig. 4 and appendix 2, table A2.3a). In the NPS, the majority (80 percent) of respondents worked at the Park level (fig. 5 and appendix 2, table A2.3b). In the USFS, the majority (65 percent) of respondents worked at the ranger district level (fig. 6 and appendix 2, table A2.3c). Moreover, the majority (86 percent) of survey respondents in the USFWS worked at the refuge level (fig. 7 and appendix 2, table A2.3d).
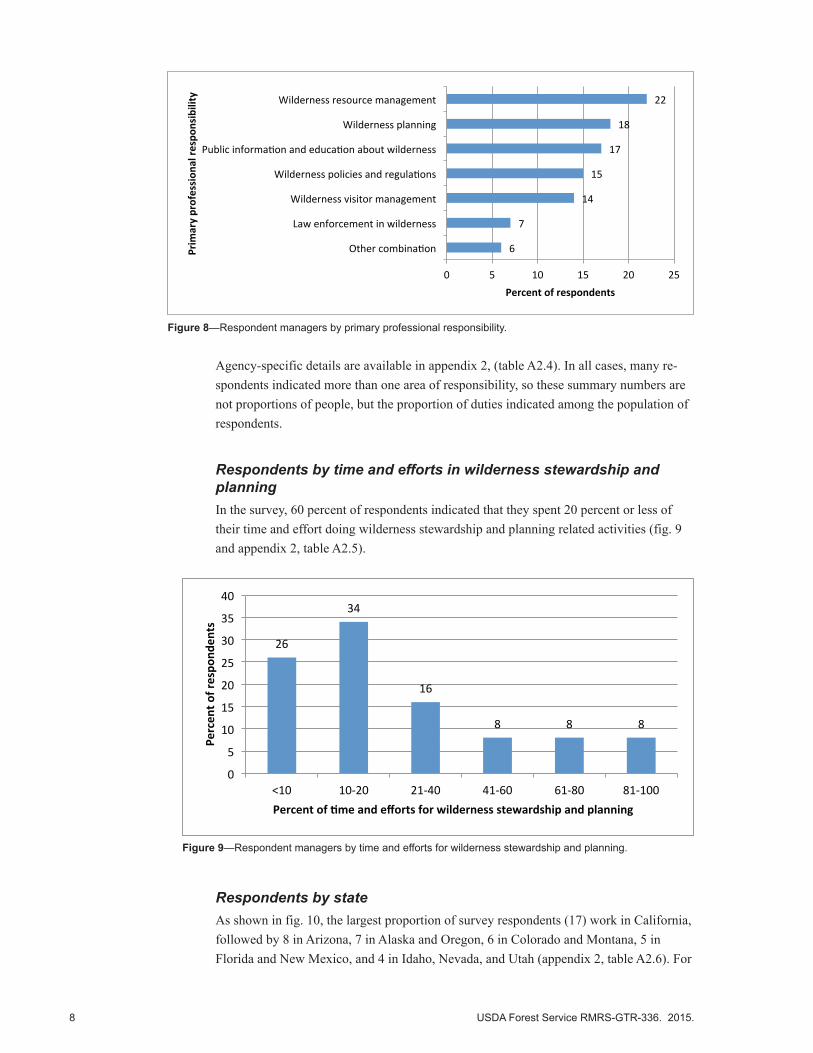
Respondents by primary professional responsibilityAs shown in figure 8, primary management responsibilities included resource manage-ment (22 percent), planning (18 percent), public information and education (17 percent), policy (15 percent), visitor management (14 percent), and law enforcement (7 percent).
Figure 3—Respondent managers by agency of employment.
30
26
22 21
0
5
10
15
20
25
30
35
USFS USFWS NPS BLM
Percen
t of respo
nden
ts
Respondents by agency of employment
57
24
16
4
0
10
20
30
40
50
60
Field District State Na7onal
Percen
t of respo
nden
ts
Agency organiza3on
Figure 4—Respondent managers by level of office in the Bureau of Land Management.

USDA Forest Service RMRS-GTR-336. 2015. 7
80
10 10
0 10 20 30 40 50 60 70 80 90
Park Regional Na8onal
Percen
t of respo
nden
ts
Respondents by NPS office level
65
23
7 5
0
10
20
30
40
50
60
70
District Forest Regional Na9onal
Percen
t of respo
nden
ts
Respondents by office level in the USFS
86
8 5
0 10 20 30 40 50 60 70 80 90
100
Refuge Regional Na7onal
Percen
t of respo
nden
ts
Respondents by office level in USFWS
Figure 5—Respondent managers by level of office in the National Park Service.
Figure 6—Respondent managers by level of office in the U.S. Forest Service.
Figure 7—Respondent managers by office level in the U.S. Fish and Wildlife Service.
8 USDA Forest Service RMRS-GTR-336. 2015.
Agency-specific details are available in appendix 2, (table A2.4). In all cases, many re-spondents indicated more than one area of responsibility, so these summary numbers are not proportions of people, but the proportion of duties indicated among the population of respondents.
Respondents by time and efforts in wilderness stewardship and planning In the survey, 60 percent of respondents indicated that they spent 20 percent or less of their time and effort doing wilderness stewardship and planning related activities (fig. 9 and appendix 2, table A2.5).
Figure 8—Respondent managers by primary professional responsibility.
6
7
14
15
17
18
22
0 5 10 15 20 25
Other combina6on
Law enforcement in wilderness
Wilderness visitor management
Wilderness policies and regula6ons
Public informa6on and educa6on about wilderness
Wilderness planning
Wilderness resource management
Percent of respondents
Prim
ary profession
al re
spon
sibility
Figure 9—Respondent managers by time and efforts for wilderness stewardship and planning.
26
34
16
8 8 8
0
5
10
15
20
25
30
35
40
<10 10-‐20 21-‐40 41-‐60 61-‐80 81-‐100
Percen
t of respo
nden
ts
Percent of -me and efforts for wilderness stewardship and planning
Respondents by state As shown in fig. 10, the largest proportion of survey respondents (17) work in California, followed by 8 in Arizona, 7 in Alaska and Oregon, 6 in Colorado and Montana, 5 in Florida and New Mexico, and 4 in Idaho, Nevada, and Utah (appendix 2, table A2.6). For

USDA Forest Service RMRS-GTR-336. 2015. 9
the number of survey respondents by name of the wilderness unit in which they conduct the most of their work effort, see appendix 1, table A1.4.
Values That Managers Attach to WildernessManagers were asked to rate the importance (from not at all important to extremely important) of each of 13 wilderness values. These wilderness value descriptions are well established and have been used extensively in previous studies to convey how the American public perceives benefits from protecting wilderness (Cordell et al. 2008). Respondents returned 157 completed responses to this optional Wilderness Values mod-ule. The statement selected by the largest percentage of responding managers as the most important of the 13 (among those rated very or extremely important) was to ensure that
1
2
3
4
5
6
7
8
17
0 2 4 6 8 10 12 14 16 18
ME,TX,HI,LA,MI,MN,MO,ND,NE,MA,NJ,OH,SD,VA,WI
GA,MS,NH,SC,WY
WA
ID,NV,UT
FL,NM
CO,MT
AK,OR
AZ
CA
Percent of respondents
Respon
dents b
y state
0 10 20 30 40 50 60 70 80 90 100
Providing income for tourism industry Providing recrea=on opportuni=es
Preserving natural areas for science Providing spiritual inspira=on
Providing scenic beauty Protec=ng air quality
Having op=on to visit WA in future Knowing that WA exists
Protec=ng rare and endangered species Protec=ng wildlife habitat Protec=ng water quality
Preserving unique wild plants & animals Knowing future genera=ons will have WA
Percent of respondents indica/ng very or extremely important
Reason
s to preserve wild
erne
ss
The public Managers
Figure 10—Respondent managers by state.
Figure 11—Percentage of the public and of managers which assigned very to extreme importance to each of 13 reasons to preserve wilderness.

10 USDA Forest Service RMRS-GTR-336. 2015.
future generations will have wilderness areas (97 percent). Following very closely was preserving unique wild plants and animals (94 percent) (see fig. 11 and appendix 2, table A2.7a for the agency breakdown).
Percentages of the managers were compared with percentages of the American public (from an earlier separate study) in rating the importance of the same 13 wilderness val-ues. Data for ranking wilderness values by the public were based on the National Survey on Recreation and the Environment, conducted in 2008.2 This comparison revealed some interesting differences (see fig. 11 and appendix 2, table A2.7b). Although a larger percentage of managers placed greatest importance (very to extremely important) on protecting wilderness to assure that future generations will have wilderness to visit or oth-erwise appreciate, the largest percentage of the public placed greatest importance (very or extreme importance) on wilderness for protecting air and water qualities. Protecting air quality and protecting water quality were the 3rd and 8th most important reasons identified by managers. Although managers and the public valued wilderness somewhat differently, they both indicated that the purpose of providing income for the tourism industry was the least important reason (ranked 13th) to preserve wilderness and recreation was also low (ranked 12th by managers and 10th by the public). Hence, both managers and the public demonstrate strong support beyond recreation and economic values of wilderness (ap-pendix 2, table A2.7b).
Level of Potential ThreatsManagers were provided a list of 24 potential threats that could possibly degrade or dam-age wilderness character, specific resources, or visitor experiences over the next 20 years. Table 2 summarizes the percentage of managers who rated each of these potential threats high or very high to the wilderness area or wilderness areas where they work.
Lack of political and financial support for wilderness protection and management, invasive plant and animal species, disconnected urban audiences, adjacent land manage-ment and use, and designation legislation that included language that was viewed as compromising natural conditions or containing special provisions for management were the top five potential threats to resources or visitor experiences identified by managers. Percentages vary across agencies. The NPS and the USFS rated lack of political or finan-cial support as a much higher threat than did the BLM and USFWS (table 2). The USFS rated many (7 out of 24) and NPS rated almost half (11 out of 24) of the listed threats higher than did the other agencies. The USFWS only rated two items as larger threats than the other agencies (water quality impacts and sea level rise/coastal erosion threats) (For details on each agency responses, please see appendix 2, table A2.8).
2 National Survey on Recreation and the Environment (NSRE) (2008), The Interagency National Consortium; coordinated by the USDA Forest Service, Recreation, Wilderness, and Demograph-ics Trends Research Group, Athens, Georgia, and the Human Dimensions Research Laboratory, University of Tennessee, Knoxville, Tennessee.

USDA Forest Service RMRS-GTR-336. 2015. 11
Table 2—Percentage of managers indicating level of potential threat to be high or very high for all agencies and for each agency.
AllPotential Threats* Agency BLM NPS USFS USFWS
Lack of political and financial support for wilderness protection and management 74 61 80 88 63
Invasive species 56 60 73 48 46
Disconnected urban audiences 53 39 62 58 50
Adjacent land management and use 44 48 52 37 40
Legislation designating wilderness with compromised wilderness conditions or special provisions for management 41 39 41 52 30
Wild-land fire suppression and management 39 44 33 57 15
Motorized and mechanical equipment trespass and illegal use 38 50 22 48 27
Fragmentation and isolation of wilderness as ecological islands 38 37 38 40 34
Aircraft noise and airspace reservations 37 19 55 41 31
Increasing or changing non-commercial recreation 35 26 30 52 27
Air quality impacts 31 23 39 34 25
Risk of wildfire damage (outside wilderness) originating in wilderness 31 40 29 34 19
Visitor use of advanced technology and electronic equipment for navigation or communication 29 24 30 38 19
Disruption of wildlife corridors 29 26 34 24 28
Urbanization and encroaching development 28 32 25 30 22
Energy development and resource extraction 27 23 35 23 28
Increasing or changing commercial recreation 25 16 30 29 24
Pressure on threatened and endangered species management 25 24 26 24 23
Water quality impacts 23 14 19 20 33
Administrative access, facilities, or other administrative exceptions 22 20 32 24 13
Water projects facilities 19 15 29 22 8
Livestock grazing 18 21 18 23 7
Sea level rise; coastal erosion 15 8 14 5 37
Private inholdings and their uses 15 24 15 13 8* Respondents were provided a five-point Likert-type scale (none to very high potential threat) and a “not sure”
option to rate the level of potential threat over the next 20 years at the wilderness area or areas in which they work. This table summarizes the percentage of respondents that rated the level of potential threats high or very high.

12 USDA Forest Service RMRS-GTR-336. 2015.
Major ChallengesManagers were asked to describe up to five major challenges they will likely face over the next 20 years in wilderness stewardship or planning activities. Challenges were de-fined in the survey as “…type of wilderness stewardship or planning activities [that] will demand the most time and effort by wilderness managers or planners like you to be suc-cessfully accomplished.” A total of 1,355 challenges were described in this open-ended question by 368 responding managers. These challenges can be grouped into six broad categories, as shown in figure 12 (in appendix 5, see the “Major Challenges” section and table A5.1 for a detailed description of these categories and/or wording provided by respondents). Please note that, in many cases, contents of more complex responses were sufficiently diverse to fit into multiple groupings.
5
7
20
21
32
44
0 5 10 15 20 25 30 35 40 45 50
Managing other resources
Public awareness
Sustaining natural condi<ons
Visitor and experience management
Resources and policy for management
Management of external threats
Percent of respondents
Challenges in wild
erne
ss stew
ardship/
plan
ning
Figure 12—Six categories of major challenges in wilderness stewardship or planning.
Management of external threats (such as encroachment, human-caused wildfire, climate change, invasive species, and impacts of external factors) was the category with the largest number of major challenges described by managers. Other categories of chal-lenges included having inadequate resources and policies to support management (staff, funding, law enforcement, agency policy, agency priority, improving legal and physical access, etc.), managing visitors and conditions for their experiences (visitor management, maintaining wilderness values, protecting visitors’ experiences, protecting wilderness character, dealing with technologies that are sometimes inappropriate), sustaining natural conditions (restoring natural conditions, appropriately managing natural resources, at-tending to stewardship responsibilities, and adequately monitoring to detect change in character), public awareness (e.g., gaining public support), and managing resources other than natural resources (trails, cultural resource, etc.).

USDA Forest Service RMRS-GTR-336. 2015. 13
Two Most Important ProblemsIn appendix 5, section A5.2 provides a detailed description of these categories and word-ing provided by respondents. A total of 632 problem descriptions were collected from the 368 responding managers. These were grouped into five broad categories, shown in figure 13. In appendix 5, the “Two Most Important Problems” section and table A5.2 provide a detailed description of these categories and wording provided by respondents.
Figure 13—Potential problems facing NWPS managing agencies in the next 20 years.
Adequately monitoring and sustaining natural conditions (for example, protecting wilderness character; fire management; monitoring change in wilderness character; and maintaining and adequately monitoring air and water quality), external threats and their impacts (climate change, impact of human activities, encroachment, invasive species and weed control, adjacent land-use, etc.), adequate resources and policies to support management (funding, resources, workforce, protection of wilderness values, training for managers, relevant science for decisionmaking, etc.), building public awareness and support (increasing public awareness, educating the public, engaging urban populations, engaging the public in wilderness stewardship and management, developing partnerships, etc.), and on-site visitor and experience management (visitor management, increased visi-tation in wilderness, increased visitor access to wilderness, etc.) are the areas identified by managers as the most significant groups of problems that need to be addressed in the coming 20 years.
7
22
25
29
32
0 5 10 15 20 25 30 35
On-‐site visitor and experience management
Building public awareness and support
Resources and policy for management
External threats and impacts
Monitoring and sustaining natural condiEons
Percent of respondents
List of p
oten
/al problem
s faced
by
NWPS

14 USDA Forest Service RMRS-GTR-336. 2015.
Training and ResearchLevel of Need for Manager TrainingWilderness managers were asked to provide input on the level of need for training top-ics during the next 20 years for building greater competencies within their agencies. Responding managers were provided a listing of seven different training topics and asked to evaluate the level of need for each of the topics. Table 3 summarizes the percentages of managers indicating a high or very high need. Appendix 3, table A3.1, provides more detail for all levels of need from very high to no need.
Table 3—Percentage of managers indicating high or very high need for training for all agencies and for each agency.
All Training Needs* Agencies BLM NPS USFS USFWS
Wilderness history, law, regulation, and policy 58 53 62 61 51
Wilderness planning 57 51 71 61 47
Management skills related to communication, problem-solving, decision-making, and organizational management 57 56 57 61 50
Visitor use management and monitoring 55 51 61 68 41
Natural and cultural resources management and monitoring 51 44 66 45 47
Wilderness field skills 42 40 41 63 22
Managing special provisions 37 42 46 34 28
* Respondents were provided a five-point ranking scale (none to very high need) as well as a “not sure” response option.
The highest rated training needs identified included wilderness history, law, regulation, and policy; wilderness planning; management skills related to communication, problem-solving, decisionmaking, and organizational management; visitor use management and monitoring; and natural and cultural resources management and monitoring. There were some differences in needs ratings across agencies. Generally, the USFWS managers rated the needs lower than managers in other agencies. The NPS and USFS managers rated most of the listed training topics higher.
Training NeedsThe NWMS asked managers to describe (open-ended question) the top five specific train-ing measures needed for themselves. A total of 1,272 responses were received from the 368 respondents. These training needs were grouped into six broad categories, as shown in appendix A, Table A5.3.
Wilderness resource management (economic and noneconomic resources, adjustments for staff and budget cuts, establishment of baselines, monitoring, maintaining wilderness character and values, fire management, etc.) was the top category of training need. This was followed by skills, technology and analytical competencies (specific skills, using science in decisionmaking, more competency in information technology, approaches to minimum requirements analysis, decision guides, etc.), threats management (responding

USDA Forest Service RMRS-GTR-336. 2015. 15
to climate change influences, managing invasive species, soundscape protection, restora-tion guidance, etc.), building partnerships and education (building partnership, public education and outreach, communicating wilderness values, consultation, communication with tribal groups, responding to political pressure, etc.), laws, regulations and policy (wilderness regulations, wilderness policy, wilderness planning, wilderness laws, legal and policy context including ANILCA, etc.), and wilderness recreation management (visitor management, commercial use of wilderness, search and rescue, safe access for people with disabilities, control of motorized activities, carrying capacity analysis, etc.).
Research Needs CategoriesFive research needs categories for resource and visitor management in wilderness areas are explained in appendix 5, section A5.4. A total of 1,173 responses have been grouped into four categories.
The largest of these categories was threats and impacts management (impact on wil-derness resources and on opportunities for solitude resulting from human and natural factors, invasive species, climate change impact on wilderness character, monitoring/preserving soundscapes, ecosystem integrity, nearby land uses, etc.). The next largest category was wilderness resource management needs (such as emerging technologies to monitor wilderness use and access, how to incorporate science-based information into decisionmaking, fire, water resources, wilderness restoration, etc.), followed by building partnerships and education (employee development, communicating wilderness values with different public groups, partnership building, understanding wilderness values, and understanding public needs to get wilderness experience), and wilderness recreation man-agement (visitor management, sanitation and waste management, conflict management, visitor impacts on wilderness character, capacity analysis, etc.).
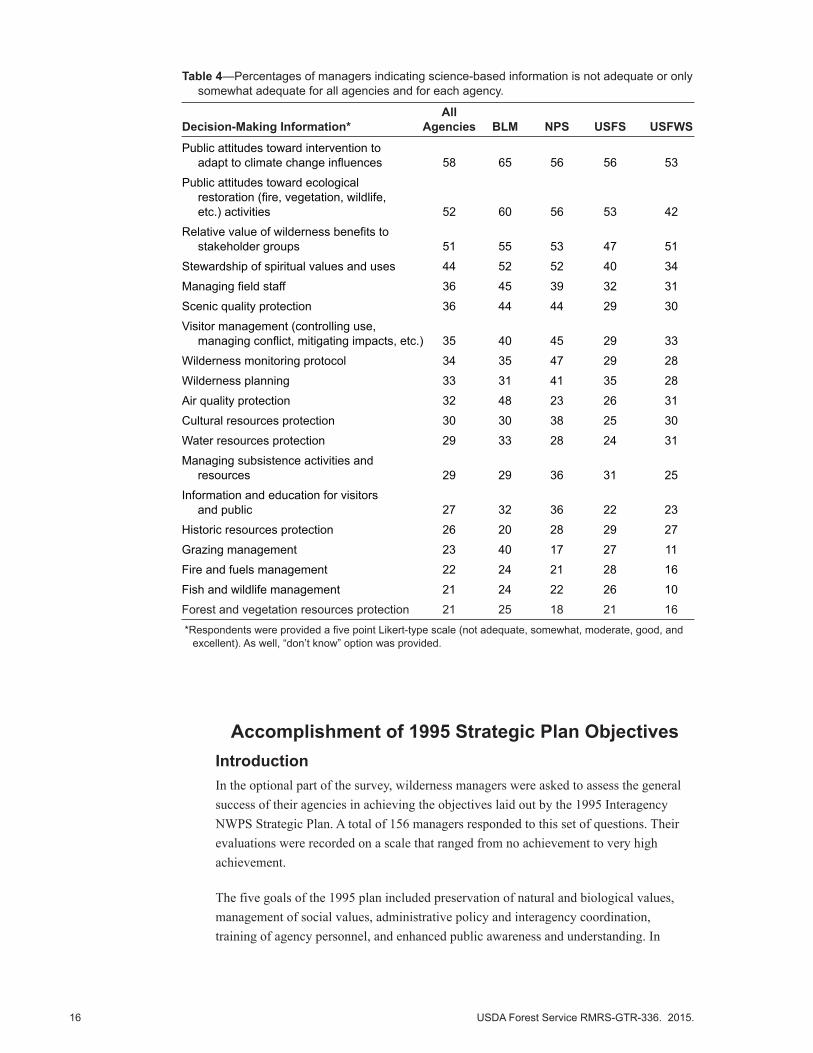
Adequacy and Availability of Decision-Making InformationResponding managers were asked about 19 specific aspects of wilderness management and planning and asked to indicate how adequate and available science-based informa-tion is for each of these topics. Table 4 includes the percentages of managers indicating that science-based information is not adequate and available, or that it is only somewhat adequate for each of the 19 aspects. Appendix 3, table A3.2, provides a breakdown of percentages for each level of information adequacy and availability.
The five management decisionmaking topics with the highest percentage of managers rat-ing them inadequate to somewhat adequate included public attitudes toward intervention to adapt to climate change, public attitudes toward ecological restoration activities (fire, vegetation, wildlife, etc.), relative value of wilderness benefits to different stakeholder groups, stewardship of spiritual values and uses, and managing field staff. Generally, higher percentages of the BLM managers felt that science-based information for these top five categories is neither adequate nor available. In contrast, relative to the other agen-cies, lower percentages of the USFWS managers felt that science-based information is not adequate.
16 USDA Forest Service RMRS-GTR-336. 2015.
Accomplishment of 1995 Strategic Plan ObjectivesIntroductionIn the optional part of the survey, wilderness managers were asked to assess the general success of their agencies in achieving the objectives laid out by the 1995 Interagency NWPS Strategic Plan. A total of 156 managers responded to this set of questions. Their evaluations were recorded on a scale that ranged from no achievement to very high achievement.
The five goals of the 1995 plan included preservation of natural and biological values, management of social values, administrative policy and interagency coordination, training of agency personnel, and enhanced public awareness and understanding. In
Table 4—Percentages of managers indicating science-based information is not adequate or only somewhat adequate for all agencies and for each agency.
All Decision-Making Information* Agencies BLM NPS USFS USFWS
Public attitudes toward intervention to adapt to climate change influences 58 65 56 56 53
Public attitudes toward ecological restoration (fire, vegetation, wildlife, etc.) activities 52 60 56 53 42
Relative value of wilderness benefits to stakeholder groups 51 55 53 47 51
Stewardship of spiritual values and uses 44 52 52 40 34
Managing field staff 36 45 39 32 31
Scenic quality protection 36 44 44 29 30
Visitor management (controlling use, managing conflict, mitigating impacts, etc.) 35 40 45 29 33
Wilderness monitoring protocol 34 35 47 29 28
Wilderness planning 33 31 41 35 28
Air quality protection 32 48 23 26 31
Cultural resources protection 30 30 38 25 30
Water resources protection 29 33 28 24 31
Managing subsistence activities and resources 29 29 36 31 25
Information and education for visitors and public 27 32 36 22 23
Historic resources protection 26 20 28 29 27
Grazing management 23 40 17 27 11
Fire and fuels management 22 24 21 28 16
Fish and wildlife management 21 24 22 26 10
Forest and vegetation resources protection 21 25 18 21 16*Respondents were provided a five point Likert-type scale (not adequate, somewhat, moderate, good, and
excellent). As well, “don’t know” option was provided.

USDA Forest Service RMRS-GTR-336. 2015. 17
the following section, survey results are provided for each of the five overall goals and the objectives under each goal. To draw attention to objectives that need attention, and perhaps should be included in new strategic planning, percentages of managers who indi-cated there had been no or only slight progress and accomplishment are reported.
Level of Accomplishment of Management Goals and ObjectivesPercentages of managers indicating no to slight accomplishment of the objectives are presented for each goal and its objectives. In the tables, the objectives are ranked from highest to lowest percentages indicating no or slight accomplishment by all agency.
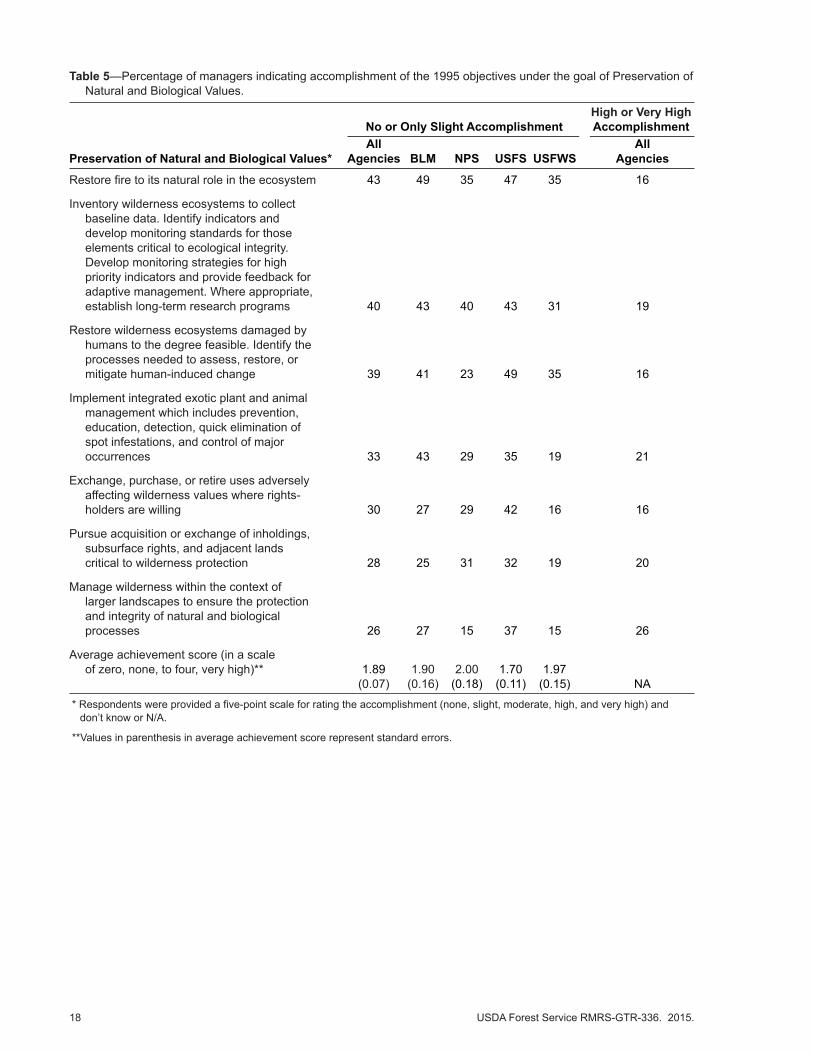
Preservation of natural and biological valuesThe top five objectives rated as underachieved are (1) restoring fire to its natural role in the ecosystem, (2) inventorying and monitoring wilderness ecosystems and establishing long-term research, (3) restoring wilderness ecosystems damaged by humans, and identi-fying the processes needed to mitigate human-induced change, (4) implementing exotics management, and (5) retiring uses adversely affecting wilderness values.. Restoration, mitigation of human disturbances, and monitoring ecosystem conditions are themes that link these objectives. There is significant variation in scoring among the agencies. In general, smaller percentages of USFWS and NPS managers indicated no or low achieve-ment of the seven natural and biological values management objectives stated in the 1995 Strategic Plan objectives. The USFS percentages tended to be the highest for scoring these objectives as not achieved or slightly achieved. The average achievement score for all managers and all agencies is 1.89 in a zero (none) to four (very high) scale, indicating a slight to moderate accomplishment of the natural and biological values management objective. Across agencies, the NPS has the highest score and the USFS has the lowest score (table 5 and appendix 4, table A4.1).
Management of social values The top five underachieved objectives across managers in all four agencies are (1) minimizing low-level overflights, (2) assessing and mitigating impacts of emerging technologies, (3) coordinating with neighboring agencies on use restrictions, (4) develop-ing and using evolving recreation management tools, and (5) minimizing the impact of structures.. Higher percentages of the BLM managers indicated concern that overflight and new technology objectives had not been achieved. Except for integration of new recreation management tools, the USFWS scored lower percentages indicating lack of achievement of social value management objectives. The average achievement score for all managers and all agencies is 1.78 on a zero (none) to four (very high) scale, indicating slight to moderate accomplishment of the social values management objectives (table 6 and appendix 4, table A4.2).
18 USDA Forest Service RMRS-GTR-336. 2015.
Table 5—Percentage of managers indicating accomplishment of the 1995 objectives under the goal of Preservation of Natural and Biological Values.
High or Very High No or Only Slight Accomplishment Accomplishment All AllPreservation of Natural and Biological Values* Agencies BLM NPS USFS USFWS Agencies
Restore fire to its natural role in the ecosystem 43 49 35 47 35 16
Inventory wilderness ecosystems to collect baseline data. Identify indicators and develop monitoring standards for those elements critical to ecological integrity. Develop monitoring strategies for high priority indicators and provide feedback for adaptive management. Where appropriate, establish long-term research programs 40 43 40 43 31 19
Restore wilderness ecosystems damaged by humans to the degree feasible. Identify the processes needed to assess, restore, or mitigate human-induced change 39 41 23 49 35 16
Implement integrated exotic plant and animal management which includes prevention, education, detection, quick elimination of spot infestations, and control of major occurrences 33 43 29 35 19 21
Exchange, purchase, or retire uses adversely affecting wilderness values where rights- holders are willing 30 27 29 42 16 16
Pursue acquisition or exchange of inholdings, subsurface rights, and adjacent lands critical to wilderness protection 28 25 31 32 19 20
Manage wilderness within the context of larger landscapes to ensure the protection and integrity of natural and biological processes 26 27 15 37 15 26
Average achievement score (in a scale of zero, none, to four, very high)** 1.89 1.90 2.00 1.70 1.97
(0.07) (0.16) (0.18) (0.11) (0.15) NA * Respondents were provided a five-point scale for rating the accomplishment (none, slight, moderate, high, and very high) and
don’t know or N/A.
**Values in parenthesis in average achievement score represent standard errors.

USDA Forest Service RMRS-GTR-336. 2015. 19
Table 6—Percentage of managers indicating accomplishment of the 1995 objectives under the goal of Management of Social Values.
High or Very High No or Only Slight Accomplishment Accomplishment All All Management of Social Values* Agencies BLM NPS USFS USFWS Agencies
Coordinate with Department of Defense agencies and the Federal Aviation Administration to develop procedures and guidelines to avoid or mitigate low-level overflights 55 67 46 59 39 13
Assess impacts of new and emerging technologies on traditional wilderness values. Develop public information and education programs to address these effects and mitigate any unacceptable impacts 53 60 49 55 43 7
Coordinate with neighboring agencies and interests on wilderness use restrictions (such as campsite and fire regulations) and on the establishment of policies for limits such as group size and numbers of packstock 33 30 37 34 27 20
Develop, identify, and distribute information on new or evolving recreation management tools and techniques 33 24 34 34 46 20
Evaluate all existing and proposed structures and installations to minimize their impact on wilderness values 31 41 23 32 23 17
Emphasize opportunities outside wilderness for recreation activities that are not dependent on a wilderness setting 21 19 26 26 12 23
Establish an interagency national information network to provide wilderness information for public and agency use 17 14 23 22 8 45
Average achievement score (in a scale of zero, none, to four, very high)** 1.78 1.77 1.88 1.72 1.84
(0.061) (0.124) (0.148) (0.095) (0.147) NA
* Respondents were provided a five point scaled for rating accomplishment (none, slight, moderate, high, and very high).
**Values in parenthesis in average achievement score are standard errors.
20 USDA Forest Service RMRS-GTR-336. 2015.
Administrative policy and interagency coordination The top five underachieved administrative and policy objectives as rated by managers include participation in local government planning, fiscal accountability, seeking new partnerships, expanding research, and ensuring flexible spending of fire funding. There is quite a range of differences between agencies. Generally, higher percentages of the USFS managers rated the listed objectives as not achieved while lower percentages of the NPS managers rated achievement of these objectives low. The average achievement score for all managers and all agencies is 1.86 on a zero (none) to four (very high) scale, indicating a slight to moderate accomplishment of the administrative and policy objectives. Across agencies, the NPS managers gave the highest scores and the USFWS managers gave the lowest score (table 7 and appendix 4, table A4.3).
Training of agency personnel Integrating wilderness manager and employee orientation training, expanding university partnerships, and developing a common understanding of wilderness management prin-ciples are the top three goals that are seen by managers as slightly or not at all achieved. Smaller percentages of the NPS managers rated the top two of these three objectives as underachieved while higher percentages of the USFS managers rated these two objectives as unachieved. The average achievement score for all managers and all agencies is 2.08 on a zero (none) to four (very high) scale, indicating a moderate accomplishment of the agency personnel training objectives. Across agencies, the BLM gave the highest scores and the USFWS gave the lowest scores (table 8 and appendix 4, table A4.4).
Public awareness and understanding The top three objectives evaluated by managers as underachieved were wilderness educa-tion, communication with diverse social groups, and creating a wilderness curriculum for K-12. Percentages across agencies varied with the BLM tending to show higher percent-ages and the NPS showing lower percentages indicating low achievement. The average achievement score for all managers and all agencies is 1.77 on a zero (none) to four (very high) scale, indicating a slight to moderate accomplishment of the public awareness and understanding objectives. Across agencies, the BLM had the highest score and the USFWS had the lowest score (table 9 and appendix 4, table A4.5).

USDA Forest Service RMRS-GTR-336. 2015. 21
Table 7—Percentage of managers indicating accomplishment of the 1995 objectives under the goal of Administrative Policy and Interagency Coordination.
High or Very High No or Only Slight Accomplishment Accomplishment Administrative Policy and All All Interagency Coordination* Agencies BLM NPS USFS USFWS Agencies
Participate in local government planning efforts to represent the wilderness resource 52 62 35 60 50 15
Ensure fiscal accountability in the budget process by identifying & tracking funding sources & accomplishments in the wilderness program 42 35 40 47 46 21
Aggressively seek new partnerships with diverse groups to support wilderness values and goals 34 33 29 37 42 18
Expand the emphasis of research to include natural and biological wilderness resources, and psychological and social values 33 43 29 28 35 16
Allow flexible spending of fire funding to cover prescribed fire 32 25 32 42 19 6
Maintain strong and professional leadership in wilderness stewardship at all levels. Each agency will: have a national wilderness coordinator; and require wilderness stewardship performance elements for those managing wilderness 31 8 34 42 35 34
Coordinate multiple-unit wildernesses to insure consistent administration 25 22 29 31 16 20
Create a National Interagency Steering Committee made up of the national wilderness coordinators of each agency to improve interagency understanding and consistency in managing the National Wilderness Preservation System, including: developing common guidelines, policies, and regulations on key wilderness issues; and identifying and coordinating research priorities for the Aldo Leopold Wilderness Research Institute, and training priorities with the Arthur Carhart Training Center 12 5 11 20 4 48
Average achievement score (in a scale of zero, none to four, very high)** 1.86 1.94 2.00 1.84 1.732 (0.088) (0.180) (0.213) (0.132) (0.259) NA
*Respondents were provided a five point Likert-type scale (none, slight, moderate, high, and very high) and don’t know or N/A to rate the level of achievements of the 1995 objectives.
**Values in parenthesis in average achievement score represent standard errors.

22 USDA Forest Service RMRS-GTR-336. 2015.
Table 8—Percentage of managers indicating accomplishment of the 1995 objectives under the goal of Training of Agency Personnel.
High or Very High No or Only Slight Accomplishment Accomplishment All All Agency Personnel Training* Agencies BLM NPS USFS USFWS Agencies
Integrate wilderness into other program training and vice versa. Develop basic wilderness orientation training for presentation to all agency personnel 50 52 43 52 50 14
Establish partnerships with colleges and universities to recruit volunteers, participate in curriculum development, provide training, and conduct research 32 27 17 40 38 15
Develop common understanding and training on wilderness principles such as the minimum tool concept 29 35 29 27 27 28
Identify the core competencies required for wilderness rangers, wilderness managers, and line officers with wilderness management responsibilities. Identify tools, methods, and techniques to master the needed abilities 27 29 37 23 20 31
Continue to develop, utilize, and support wilderness training programs 25 22 23 33 19 27
Each agency will support the Arthur Carhart Training Center and the Aldo Leopold Wilderness Research Institute 9 5 14 11 4 46
Average achievement score (in a scale of zero, none to four, very high)** 2.08 2.25 2.10 2.05 1.88 (0.064) (0.147) (0.140) (0.103) (0.147) NA
* Respondents were provided a five point Likert-type scale (none, slight, moderate, high, and very high) and don’t know or N/A to rate the level of achievements of the 1995 objectives.
**Values in parenthesis in average achievement score represent standard errors.
Summary of Survey FindingsIn support of interagency strategic planning for the National Wilderness Preservation System (NWPS), a national survey was administered to managers with the four federal agencies charged with management of the NWPS. Included were Forest Service, National Park Service, Bureau of Land Management, and Fish and Wildlife Service management personnel. The survey asked these managers about threats and challenges to stewardship of the NWPS. They were also asked to identify perceived needs for science information, and needed education and training to support decision-making over the next 20 years.
The National Wilderness Manager Survey conducted between February 24 and May 19, 2014, collected responses from 368 agency personnel across four federal agencies that are responsible to manage the National Wilderness Preservation System. Primary wilderness management responsibilities of these respondents included resource or visitor management (36 percent of respondents), planning (18 percent), public information and

USDA Forest Service RMRS-GTR-336. 2015. 23
education (17 percent), and policy (15 percent). Among them, about 60 percent of the managers participating in the survey spend 20 percent or less of their work time and ef-fort on wilderness stewardship and planning duties. Thirty-two percent of the responding managers had worked in wilderness for more than 15 years; 33 percent had worked five or fewer years.
Twenty-four potential threats were provided as one of the questions and managers were asked to identify which of these represented the most significant threats. Drawing the highest percentage of response was lack of political or financial support for wilderness protection and management. Next most frequently identified were invasive species, disconnected urban populations, incompatible adjacent land uses, and legislation that contained stipulations viewed as compromising stewardship and protection of the System. Managers were also asked about general and specific training needs to build greater competencies within their agencies. Topping the list of general needs were courses in wilderness history, law, regulation, and policy; wilderness planning; effective communication, problem-solving and decision-making tools; visitor use management and monitoring; and natural and cultural resource management and monitoring. More specific needs identified included field skills, technology applications, analytical tools, addressing threats, building partnerships, education, laws, regulations, specific policies and recre-ation management.
Table 9—Percentage of managers indicating accomplishment of the 1995 objectives under the goal of Public Awareness and Understanding.
High or Very High No or Only Slight Accomplishment Accomplishment Public Awareness All All and Understanding* Agencies BLM NPS USFS USFWS Agencies
Evaluate wilderness education programs to determine their effectiveness 54 60 49 49 58 7
Identify strategies to communicate wilderness education messages to diverse cultural, geographical, and sociological groups, including non-recreation users 53 57 46 55 50 12
Develop a wilderness curriculum for grades K through 12. Encourage state agencies to establish curricula for environmental/wilderness education in schools 38 38 37 42 31 14
Continue to support “Leave No Trace” as the official program for minimum impact recreation 8 8 12 4 12 61
Average achievement score (in a scale of zero, none to four, very high)** 1.77 1.88 1.82 1.80 1.36
(0.07) (0.17) (0.19) (0.11) (0.15) NA
* Respondents were provided a five-point rating scale (none, slight, moderate, high, and very high) and a “don’t know” or N/A option for rating level of achievements of the 1995 objectives.
**Values in parenthesis in average achievement score represent standard errors.

24 USDA Forest Service RMRS-GTR-336. 2015.
Managers were asked to identify general areas of research needs for resource and visi-tor management in wilderness areas they represent. The research needs identified were similar to identified training needs. Highest on their list was research focusing on threats and impacts management, followed by wilderness resource management, building part-nerships and education, and wilderness recreation management. Another approach for identifying research needs was to ask about the adequacy of information and approaches for decision-making. The areas identified as not being adequate included understanding public attitudes toward intervention to adapt to climate change, public attitudes toward ecological restoration, differences in views of the benefits of wilderness among stake-holder groups, understanding spiritual values and uses, and effective management of field staff.
The most significant problems that will need to be addressed in the next 20 years as identified by the respondent managers were maintaining and sustaining stewardship of natural conditions, managing external threats and their impacts, inadequate resources and policies for wilderness protection, and lack of public awareness and support and effective management for on-site visitors and experiences management.
In regard to how well the 1995 Strategic Plan objectives had been accomplished, manag-ers indicated only slight to moderate accomplishment of many of the plan objectives. Finally, out of a list of 13 wilderness value statements, the one selected by managers as most important was preserving wilderness so that it is there for future generations. Following the value for future generations were preservation of unique plants and ani-mals, contributions to water quality, protection of wildlife habitat, and protection for rare and endangered species. When presented with the same list of wilderness values in an earlier survey, the U.S. public listed contributions to air quality, contributions to water quality, having wilderness for future generations, protection of wildlife habitat, and pre-serving unique wild plants and animals as their top choices.
ReferencesBureau of Land Management, National Park Service, U.S. Fish and Wildlife Service, and
U.S. Forest Service. [BLM, NPS, USFWS, and USFS]. 1995. Interagency Wilderness Strategic Plan 1995. http://wilderness.nps.gov/document/I-21.pdf. (November 15, 2014).
Bureau of Land Management, National Park Service, U.S. Fish and Wildlife Service, U.S. Forest Service, and U.S. Geological Survey. [BLM, NPS, USFWS, USFS, and USGS]. 2014. 2020 Vision: Interagency stewardship priorities for America’s National Wilderness Preservation System. http://www.wilderness.net/toolboxes/documents/50th/2020_Vision.pdf. (November 15, 2014).
Cordell, H.K.; Betz, C.J.; Fly, J.M.; Mou, S.; Green, G.T. 2008. How do Americans view wilderness. Internet Research Information Series. Athens, GA: University of Georgia, Warnell School of Forestry & Natural Resources. http://warnell.forestry.uga.edu/nrrt/nsre/IRISWild/IrisWild1rptR.pdf. (November 15, 2014).
QSR International. NVivo10 for Windows. Doncaster, Victoria, Australia. http://www.qsrinternational.com/default.aspx.

USDA Forest Service RMRS-GTR-336. 2015. 25
Appendix 1. Introduction and MethodsA1.1 Survey instruments
Part One—Primary survey presented via SurveyMonkey to respondents
Please complete the following survey on wilderness management. You have been selected to be part of this survey based on your current or recent past agency responsibilities re-lated to wilderness in the National Wilderness Preservation System (NWPS). Your input will be included in development of the 2014 Inter-agency Strategic Plan for the NWPS.
The survey should take approximately 20-30 minutes to complete. Each question will need to be answered before the survey will advance. Your response is anonymous with no answers being associated with you personally. We will not share your individual answers with anyone else.
We appreciate your participation.
Your Connection to Wilderness
Q1. During 2013 (or during your most recent year in wilderness management), approxi-mately what percentage of your professional responsibilities was spent doing wilderness stewardship or planning-related activities? ______ % of 2013 (or most recent year) time and effort
Q2. During 2013 (or most recent year), what types of wilderness stewardship or planning activities were your primary professional responsibilities? (Check all that apply)
____ Law enforcement in Wilderness ____ Public information and education about Wilderness____ Wilderness resource management____ Wilderness visitor management____ Wilderness planning____ Wilderness policies and regulations____ Other (Please describe
Agency Employment
Q3. During 2013 (or most recent year), for which federal agency did you work in wilder-ness stewardship or planning? Please indicate your agency below and you will then be prompted to identify office level within your agency.
¨NPS ¨ National ¨ Regional ¨ Park, Preserve, Monument or National Seashore/Lakeshore¨ BLM ¨ National ¨ State ¨ District ¨ Field

26 USDA Forest Service RMRS-GTR-336. 2015.
¨ USFWS ¨ National ¨ Regional ¨ Refuge¨ USFS ¨ National ¨ Regional ¨ Forest ¨ District¨ Other affiliations or combinations? (please specify: __________________________ )
Q4. During 2013 (or during your most recent year working in wilderness management), in which one state and with which one wilderness area in that state did you spend the most time and effort in managing wilderness.
If you click on state name below, and then click next, you will see a drop-down list to select state.
¨ State name ¨ Not applicable
Please select the state from the drop-down list below. Then click next and from the list of wilderness areas provided for that state, select the wilderness area to which you devote the most time and effort.
Major Challenges
Q5. Please identify major challenges you think wilderness managers will face over the next 20 years, such as law enforcement, making decisions about fire management, making decisions about restoring natural conditions, making decisions about intervention to adapt to climate change influences, protecting visitor experiences, managing staff or budgets, protecting water resources, understanding the role of wilderness in reducing impacts of severe weather events, etc.
By major challenges, we mean what type of wilderness stewardship or planning activi-ties will demand the most time and effort by wilderness managers or planners like you to be successfully accomplished.
In the box below, please list up to five major challenges likely to be faced during the next 20 years.
Major challenges (please specify)1.2.3.4.5.

USDA Forest Service RMRS-GTR-336. 2015. 27
Potential Threat
Q6. For each item listed below, please rate the level of potential threat over the next 20 years to the wilderness resource or visitor experiences at the wilderness area or areas in which you work. By potential threats, we mean forces or changes that could degrade or damage wilderness character, specific resources, or visitor experiences.
Potential Threats
Level of threat predicted for the next 20 years
Non
e
Slig
ht
Mod
erat
e
Hig
h
Very
Hig
h
Not
Sur
e
Adjacent land management and useAdministrative access, facilities, or other administrative exceptionsVisitor use of advanced technology and electronic equipment for navigation or communicationAir quality impactsAircraft noise and airspace reservationsFragmentation and isolation of wilderness as ecological islandsIncreasing or changing non-commercial recreationIncreasing or changing commercial recreationLack of political and financial support for wilderness protec-tion and managementLegislation designating wilderness with compromised wilder-ness conditions or special provisions for managementLivestock grazing Energy development and resource extractionMotorized and mechanical equipment trespass and illegal useInvasive speciesRisk of wildfire damage (outside wilderness) originating in wildernessPrivate inholdings and their usesPressure on threatened and endangered species managementUrbanization and encroaching developmentWater projects facilities Water quality impactsWildland fire suppression and managementDisconnected urban audiencesDisruption of wildlife corridorsSea level rise; coastal erosionOther, please specify:
28 USDA Forest Service RMRS-GTR-336. 2015.
Training Programs
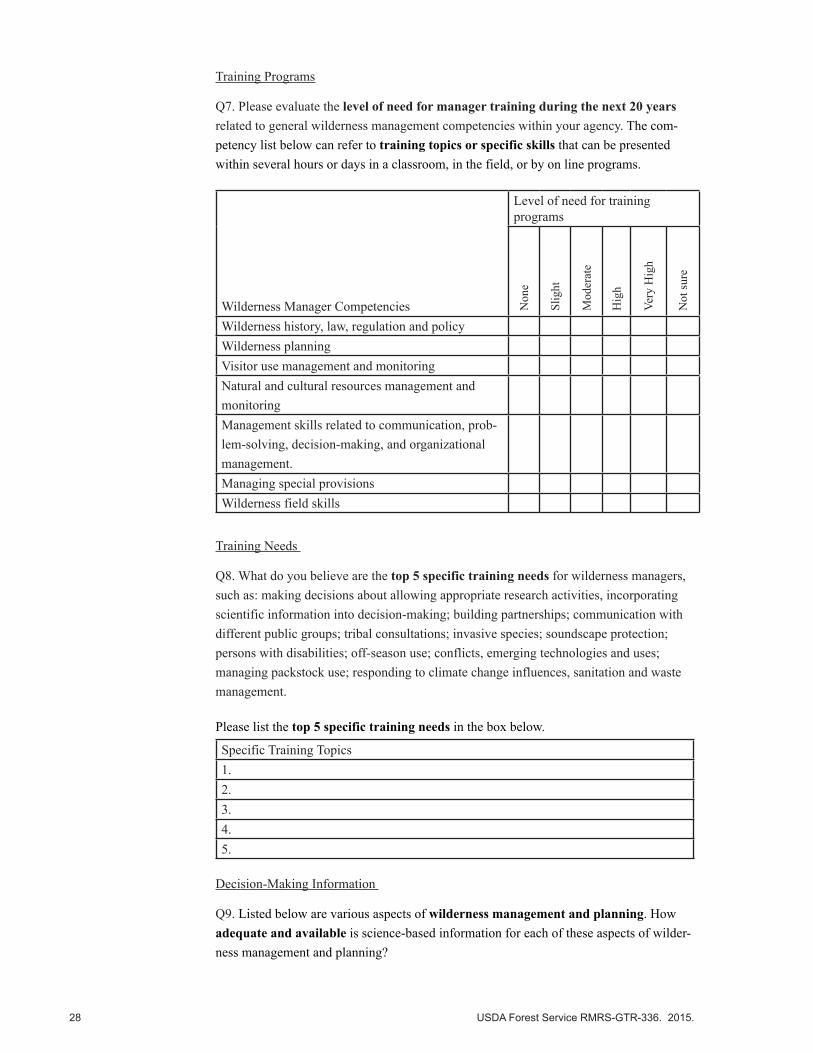
Q7. Please evaluate the level of need for manager training during the next 20 years related to general wilderness management competencies within your agency. The com-petency list below can refer to training topics or specific skills that can be presented within several hours or days in a classroom, in the field, or by on line programs.
Wilderness Manager Competencies
Level of need for training programs
Non
e
Slig
ht
Mod
erat
e
Hig
h
Very
Hig
h
Not
sure
Wilderness history, law, regulation and policyWilderness planningVisitor use management and monitoringNatural and cultural resources management and monitoringManagement skills related to communication, prob-lem-solving, decision-making, and organizational management.Managing special provisionsWilderness field skills
Training Needs
Q8. What do you believe are the top 5 specific training needs for wilderness managers, such as: making decisions about allowing appropriate research activities, incorporating scientific information into decision-making; building partnerships; communication with different public groups; tribal consultations; invasive species; soundscape protection; persons with disabilities; off-season use; conflicts, emerging technologies and uses; managing packstock use; responding to climate change influences, sanitation and waste management.
Please list the top 5 specific training needs in the box below.
Specific Training Topics 1.2.3.4.5.
Decision-Making Information
Q9. Listed below are various aspects of wilderness management and planning. How adequate and available is science-based information for each of these aspects of wilder-ness management and planning?

USDA Forest Service RMRS-GTR-336. 2015. 29
Aspects of Wilderness Management and Planning
Is the scientific information ad-equate on this topic?
Not
ade
quat
e
Som
ewha
t
Mod
erat
e
Goo
d
Exce
llent
Don
’t K
now
Air quality protectionCultural resources protectionFire and fuels management Fish and wildlife managementForest and vegetation resources protectionGrazing managementHistoric resources protectionInformation and education for visitors and publicManaging field staffScenic quality protectionVisitor management (controlling use, managing conflict, mitigating impacts, etc.)Water resources protectionWilderness monitoring protocolWilderness planningPublic attitudes toward intervention to adapt to climate change influencesPublic attitudes toward ecological restoration (fire, vegetation, wildlife, etc.) activitiesRelative value of wilderness benefits to stake-holder groupsManaging subsistence activities and resourcesStewardship of spiritual values and uses
Research Needs
Q10. Please identify your top 5 specific research needs for resource and visitor management in wilderness areas, such as: incorporating scientific information into deci-sion-making; building partnerships; communication with different public groups; tribal access and consultations; invasive species; soundscapes; workforce development; persons with disabilities; off-season use; visitor-to-visitor conflict, emerging technologies and uses; visitor fees; managing packstock use; sanitation and waste management; managing technological change.
Please list your top 5 specific research needs in the boxes below.
Specific Research1.2.3.4.5.

30 USDA Forest Service RMRS-GTR-336. 2015.
Two Most Important Problems
Q11. Please describe what you believe are the two most important problems manag-ers and agencies need to collectively address in strategic planning to protect wilderness qualities in the coming 20 years for the National Wilderness Preservation System.
a. ____________________________________________________________________________________________________________________________________________________________________________________________________________________________________________________________________________________
b. ____________________________________________________________________________________________________________________________________________________________________________________________________________________________________________________________________________________
Information about You
Q12. How many years have you been in your current position? ____ Years
Q13. How many years have you had (or did you have) responsibility for wilderness stewardship? ____ Years
Q14. How many years total have you been employed by your current agency? ____ Years
Q15. Are you willing to answer some follow-up questions aimed at providing input on two additional important topics: 1) rating the values for which we manage wilderness, and 2) assessing the general success at accomplishing tasks in the 1995 inter-agency NWPS strategic plan. If yes, you will be directed to these two surveys on line.
¨ Yes, I want to complete these two important additional survey topics.¨ No, thank you.
Do you have any comments to make about this survey or additional input to provide to the strategic planning process? If you do, please enter those comments here. Your opin-ions are highly valued.

USDA Forest Service RMRS-GTR-336. 2015. 31
Part Two—Values and Accomplishments for the 1995 NWPS Strategic Plan
Wilderness Values
Q1. Wilderness areas are designated and managed to provide a variety of purposes. Please indicate how much importance you attach to each of the following potential wilderness values. Check one response for each value listed.
Wilderness Values
Level of importanceNot at all important
(1) (2) (3) (4)Extremely
(5)For future generationsFor scientific studyFuture option to visitIncome for tourism industryJust knowing it existsPreserving ecosystemsProtecting air qualityProtecting water qualityProtection for endangered speciesProtection of wildlife habitatProviding spiritual inspirationRecreation opportunitiesScenic beauty
Accomplishment of 1995 Objectives
Q2. Please evaluate the degree to which you believe the 1995 Interagency Wilderness Strategic Plan objectives have been accomplished to date within your agency. Check one response for each objective listed, although some objectives have multiple parts.
Objectives
The level of accomplishment of 1995 objectives
None Slight Moderate HighVery High
Do not know or
N/A1. Preservation of natural and biological valuesManage wilderness within the context of large landscapes to ensure the protection and integrity of natural biological processes.

32 USDA Forest Service RMRS-GTR-336. 2015.
Objectives
The level of accomplishment of 1995 objectives
None Slight Moderate HighVery High
Do not know or
N/AInventory wilderness ecosys-tems to collect baseline data. Identify indicators and develop monitoring standards for those elements critical to ecological integrity. Develop monitoring strategies for high priority indi-cators and provide feedback for adaptive management. Where appropriate, establish long-term research programs.
Restore wilderness ecosystems damaged by humans to the degree feasible. Identify the processes needed to assess, restore, or mitigate human-induced change.Restore fire to its natural role in the ecosystem.Implement integrated exotic plant and animal management which includes prevention, edu-cation, detection, quick elimina-tion of spot infestations, and control of major occurrences.Exchange, purchase, or retire uses adversely affecting wilder-ness values where rights-hold-ers are willing.Pursue acquisition or exchange of inholdings, subsurface rights, and adjacent lands critical to wilderness protection.
Objectives
The level of accomplishment of 1995 objectives
None Slight Moderate HighVery High
Do not know
2. Management of Social ValuesEvaluate all existing and proposed structures and instal-lations to minimize the impact on wilderness values.Emphasize opportunities out-side wilderness for recreation activities that are not dependent on a wilderness setting.

USDA Forest Service RMRS-GTR-336. 2015. 33
Objectives
The level of accomplishment of 1995 objectives
None Slight Moderate HighVery High
Do not know
Coordinate with neighboring agencies and interests on wil-derness use restrictions (such as campsite and fire regulations) and on the establishment of policies for limits such as group size and numbers of packstock.Coordinate with Department of Defense agencies and the Federal Aviation Administra-tion to develop procedures and guidelines to avoid or mitigate low-level overflights.Develop, identify, and distribute information on new or evolving recreation management tools and techniques.Establish an interagency na-tional information network to provide wilderness information for public and agency use.Assess impacts of new and emerging technologies on traditional wilderness values. Develop public information and education programs to address these effects and mitigate any unacceptable impacts.
Objectives
The level of accomplishment of 1995 objectives
None Slight Moderate HighVery High
Do not know
3.Administrative Policy and Interagency CoordinationMaintain strong and profes-sional leadership in wilderness stewardship at all levels. Each agency will: have a national wilderness coordinator; and require wilderness stewardship performance elements for those managing wilderness.

34 USDA Forest Service RMRS-GTR-336. 2015.
Objectives
The level of accomplishment of 1995 objectives
None Slight Moderate HighVery High
Do not know
Create a National Interagency Steering Committee made up of the national wilderness coordinators of each agency to improve interagency under-standing and consistency in managing the National Wil-derness Preservation System, including: developing common guidelines, policies, and regula-tions on key wilderness issues; and identifying and coordi-nating research priorities for the Aldo Leopold Wilderness Research Institute, and train-ing priorities with the Arthur Carhart Training Center.Coordinate multiple-unit wil-dernesses to insure consistent administration.Expand the emphasis of re-search to include natural and biological wilderness resources, and psychological and social values.Aggressively seek new partner-ships with diverse groups to support wilderness values and goals.Participate in local government planning efforts to represent the wilderness resource.Ensure fiscal accountability in the budget process by identify-ing & tracking funding sources & accomplishments in the wilderness program.Allow flexible spending of fire funding to cover prescribed fire.

USDA Forest Service RMRS-GTR-336. 2015. 35
Objectives
The level of accomplishment of 1995 objectives
None Slight Moderate HighVery High
Do not know
4. Training of Agency PersonnelIdentify the core competencies required for wilderness rang-ers, wilderness managers, and line officers with wilderness management responsibilities. Identify tools, methods, and techniques to master the needed abilities.Integrate wilderness into other program training and vice versa. Develop basic wilderness orien-tation training for presentation to all agency personnel.Develop common understand-ing and training on wilderness principles such as the minimum tool concept.Continue to develop, utilize, and support wilderness training programs.Each agency will support the Arthur Carhart Training Center and the Aldo Leopold Wilder-ness Research Institute.Establish partnerships with col-leges and universities to recruit volunteers, participate in cur-riculum development, provide training, and conduct research.
Objectives
The level of accomplishment of 1995 objectives
None Slight Moderate HighVery High
Do not know
5. Public Awareness and UnderstandingEvaluate wilderness education programs to determine their ef-fectiveness.Identify strategies to commu-nicate wilderness education messages to diverse cultural, geographical, and sociological groups, including non-recreation users.

36 USDA Forest Service RMRS-GTR-336. 2015.
Objectives
The level of accomplishment of 1995 objectives
None Slight Moderate HighVery High
Do not know
Develop a wilderness curricu-lum for grades K through 12. Encourage state agencies to establish curricula for environ-mental/ wilderness education in schools.Continue to support “Leave No Trace” as the official program for minimum impact recreation.
A1.2 Example letter to prospective respondentsHello Wilderness Managers, Planners and others involved with Wilderness Stewardship in the Bureau of Land Management:
With this letter you are being invited to participate in the 2014 Wilderness Manager Survey (WMS). This survey is being sent to Wilderness managers throughout our agency, and as well, throughout the Park Service, Forest Service and Fish and Wildlife Service. Results from the WMS will be the foundation for developing a new Strategic Plan to guide management of the National Wilderness Preservation System (NWPS) over the next 20 years. The survey will be sent to managers from field level to national offices. Your perspectives on the issues covered in this survey are critical for future strategic planning for the Wilderness System.
Results from the WMS will go to an interagency team to be used in drafting the new NWPS Strategic Plan. The last plan was developed in 1995 (http://wilderness.nps.gov/document/I-21.pdf). Your agency scientists have collaborated with university researchers to develop, test, and implement the WMS to coincide with this 50th Anniversary year for the Wilderness Act. Results from you and your Wilderness manager peers will be pre-sented and discussed at the 50th anniversary conference this coming October. Results will be distributed through many channels. Watch for them!
There are two parts to the WMS. The first part looks at future challenges for management of the NWPS and should take only 25 to 30 minutes. The second, equally important part, asks you to reflect on what is valuable about wilderness, and on past accomplishments in managing the NWPS. This second part should require only about an additional 10 to 15 minutes. Upon completing the first part of the survey, you will be given the opportunity to open and complete the second part.
Please open this link (https://www.surveymonkey.com/s/CTGPBPD) as soon as you can and take the survey. All completed surveys will be forwarded by SurveyMonkey to Dr. Ramesh Ghimire at the University of Georgia. If you need more information you may phone Dr. Ghimire at 706-542-3098 or e-mail him at [email protected]. Thank you for helping make this a successful national, interagency effort. The success of the WMS and development of a new Strategic Plan for the National Wilderness Preservation System depend on your participation and knowledge.

USDA Forest Service RMRS-GTR-336. 2015. 37
A1.3 Time burden of the survey as indicated by the pilot respondentsFour respondents indicated how much time they had spent completing the survey (please see table A1.3a). In the comment box, one respondent mentioned it took 34 minutes to complete the survey (part I + part II). SurveyMonkey tracks the time used by each re-spondent in completing a survey (Table A1.3b).
Table A1.3a—Approximate time burden of the survey reported by pilot respondents Reported time to complete (in minutes) Total time (in Respondent Initials Part I Part II minutes)RO 23 7 30TC 20 9 29LT 46 20 66Average time 30 14 44
Table A1.3b—Approximate time burden of the survey tracked by SurveyMonkeyTime used to complete both parts (in minutes) Number of respondentsApproximately 30 minutes 535-50 minutes 2Approximately one hour 5More than one hour 5Average time 52 minutes
Table A1.4—Respondents by state and wilderness unitsRespondents in Alaska Number of Respondents PercentAleutian Islands Wilderness 2 9Becharof Wilderness 1 5Denali Wilderness 1 5Gates of the Arctic Wilderness 5 23Innoko Wilderness 1 5Izembek Wilderness 1 5Katmai Wilderness 1 5Kenai Wilderness 1 5Mollie Beattie Wilderness 4 18Togiak Wilderness 2 9Wrangell-Saint Elias Wilderness 1 5Other 2 9Total 22 100
Respondents in Alabama Number of Respondents PercentDugger Mountain Wilderness 1 100

38 USDA Forest Service RMRS-GTR-336. 2015.
Respondents in Arizona Number of Respondents PercentAravaipa Canyon Wilderness 1 4Baboquivari Peak Wilderness 1 4Cabeza Prieta Wilderness 1 4Chiricahua National Monument Wilderness 1 4Escudilla Wilderness 2 8Havasu Wilderness 1 4Hells Canyon Wilderness (AZ) 1 4Juniper Mesa Wilderness 1 4Kachina Peaks Wilderness 1 4Kendrick Mountain Wilderness 1 4Kofa Wilderness 1 4Organ Pipe Cactus Wilderness 1 4Paiute Wilderness 1 4Pajarita Wilderness 1 4Paria Canyon-Vermilion Cliffs Wilderness 1 4Red Rock-Secret Mountain Wilderness 1 4Saddle Mountain Wilderness 1 4West Clear Creek Wilderness 1 4Other 5 21Total 24 100
Respondents in California Number of Respondents PercentAgua Tibia Wilderness 1 2Ansel Adams Wilderness 1 2Bighorn Mountain Wilderness 1 2Carson-Iceberg Wilderness 1 2Cedar Roughs Wilderness 1 2Dead Mountains Wilderness 1 2Desolation Wilderness 2 4Domeland Wilderness 1 2Emigrant Wilderness 1 2Golden Trout Wilderness 1 2Grass Valley Wilderness 1 2Hoover Wilderness 2 4Imperial Refuge Wilderness 1 2Inyo Mountains Wilderness 2 4Ishi Wilderness 1 2Jacumba Wilderness 1 2John Krebs Wilderness 1 2John Muir Wilderness 1 2King Range Wilderness 1 2Lassen Volcanic Wilderness 1 2Marble Mountain Wilderness 2 4Mojave Wilderness 2 4Monarch Wilderness 2 4Mt. Shasta Wilderness 1 2Rocks and Islands Wilderness 1 2San Gorgonio Wilderness 2 4Santa Rosa Wilderness 2 4Sequoia-Kings Canyon Wilderness 6 11South Fork Eel River Wilderness 1 2Trinity Alps Wilderness 1 2Ventana Wilderness 2 4Yolla Bolly-Middle Eel Wilderness 1 2Yosemite Wilderness 2 4Other 5 9Total 53 100

USDA Forest Service RMRS-GTR-336. 2015. 39
Respondents in Colorado Number of Respondents PercentBlack Canyon of the Gunnison Wilderness 2 11Comanche Peak Wilderness 1 5Dominguez Canyon Wilderness 1 5Gunnison Gorge Wilderness 1 5Indian Peaks Wilderness 2 11Mount Evans Wilderness 1 5Mount Massive Wilderness 1 5Rocky Mountain National Park Wilderness 1 5Sarvis Creek Wilderness 1 5Weminuche Wilderness 3 16Other 5 26Total 19 100
Respondents in Florida Number of Respondents PercentCedar Keys Wilderness 2 13Florida Keys Wilderness 2 13J.N. “Ding” Darling Wilderness 2 13Lake Woodruff Wilderness 2 13Marjory Stoneman Douglas Wilderness 3 19Pelican Island Wilderness 1 6St. Marks Wilderness 3 19Other 1 6Total 16 100
Respondent in Georgia Number of Respondents PercentBrasstown wilderness 1 17Cohutta wilderness 1 17Okefenokee wilderness 3 50Wolf Island Wilderness 1 17Total 6 100
Respondents in Hawaii Number of Respondents PercentHawaii Volcanoes Wilderness 3 100
Respondents in Idaho Number of Respondents PercentBig Jacks Creek Wilderness 1 8Bruneau-Jarbidge Rivers Wilderness 1 8Frank Church-River of No Return Wilderness 4 33Little Jacks Creek Wilderness 1 8Owyhee River Wilderness 3 25Selway-Bitterroot Wilderness 1 8Other 1 8Total 12 100
Respondents in Illinois Number of Respondents PercentCrab Orchard Wilderness 1 100
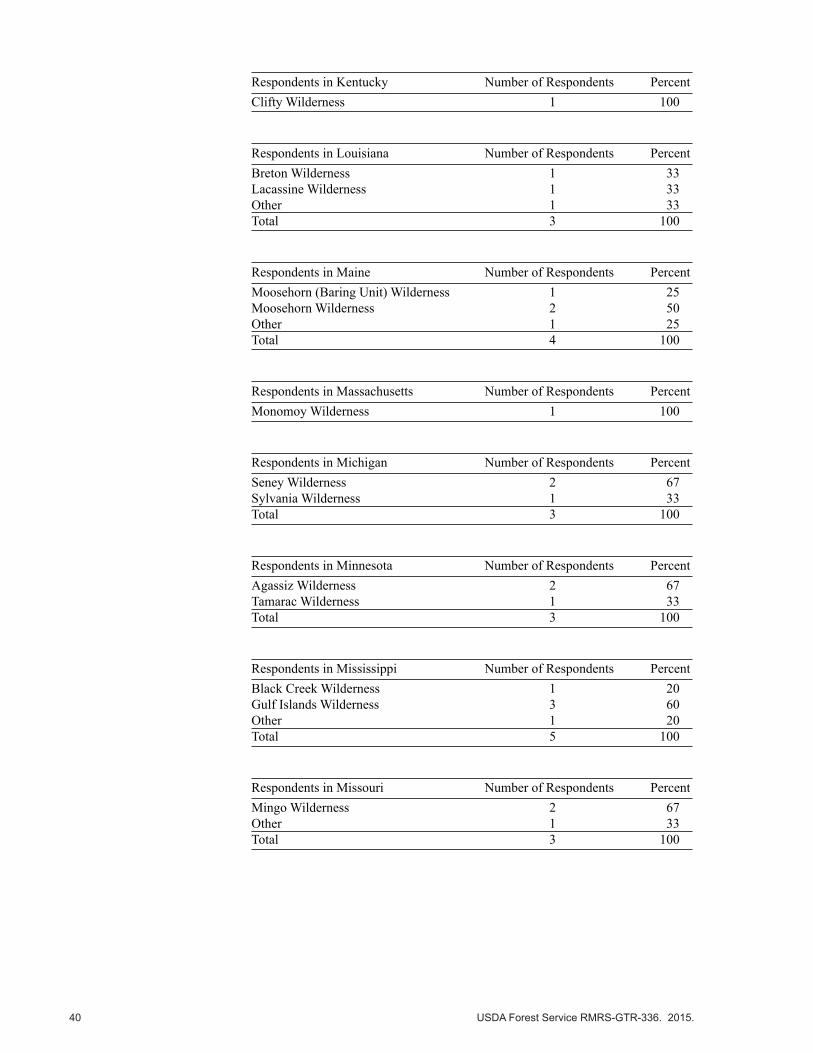
40 USDA Forest Service RMRS-GTR-336. 2015.
Respondents in Kentucky Number of Respondents PercentClifty Wilderness 1 100
Respondents in Louisiana Number of Respondents PercentBreton Wilderness 1 33Lacassine Wilderness 1 33Other 1 33Total 3 100
Respondents in Maine Number of Respondents PercentMoosehorn (Baring Unit) Wilderness 1 25Moosehorn Wilderness 2 50Other 1 25Total 4 100
Respondents in Massachusetts Number of Respondents PercentMonomoy Wilderness 1 100
Respondents in Michigan Number of Respondents PercentSeney Wilderness 2 67Sylvania Wilderness 1 33Total 3 100
Respondents in Minnesota Number of Respondents PercentAgassiz Wilderness 2 67Tamarac Wilderness 1 33Total 3 100
Respondents in Mississippi Number of Respondents PercentBlack Creek Wilderness 1 20Gulf Islands Wilderness 3 60Other 1 20Total 5 100
Respondents in Missouri Number of Respondents PercentMingo Wilderness 2 67Other 1 33Total 3 100

USDA Forest Service RMRS-GTR-336. 2015. 41
Respondents in Montana Number of Respondents PercentAbsaroka-Beartooth 1 6Anaconda Pintler 3 19Bob Marshall 1 6Cabinet Mountains 2 13Lee Metcalf 3 19Medicine Lake 1 6Red Rock Lakes 1 6Selway-Bitterroot 1 6UL Bend 1 6Other 2 13Total 16 100
Respondents in Nebraska Number of Respondents PercentFort Niobrara Wilderness 1 50Other 1 50Total 2 100
Respondents in Nevada Number of Respondents PercentHigh Rock Canyon Wilderness 1 9Highland Ridge Wilderness 1 9La Madre Mountain Wilderness 1 9Mount Grafton Wilderness 1 9Mt. Moriah Wilderness 1 9Ruby Mountains Wilderness 1 9South Jackson Mountains Wilderness 1 9Spirit Mountain Wilderness 1 9Other 3 27Total 11 100
Respondents in New Hampshire Number of Respondents PercentPemigewasset Wilderness 2 40Presidential Range-Dry River Wilderness 2 40Wild River Wilderness 1 20Total 5 100
Respondents in New Jersey Number of Respondents PercentBrigantine Wilderness 1 50Great Swamp National Wildlife Refuge 1 50Total 2 100

42 USDA Forest Service RMRS-GTR-336. 2015.
Respondents in New Mexico Number of Respondents PercentAldo Leopold Wilderness 2 13Bandelier Wilderness 1 6Bisti/De-Na-Zin Wilderness 1 6Blue Range Wilderness 1 6Carlsbad Caverns Wilderness 1 6Gila Wilderness 2 13Pecos Wilderness 3 19Sabinoso Wilderness 1 6Salt Creek Wilderness 1 6Sandia Mountain Wilderness 2 13Other 1 6Total 16 100
Respondents in New York Number of Respondents PercentBrigantine Otis Pike Fire Island High Dune Wilderness 1 100
Respondents in North Dakota Number of Respondents PercentChase Lake Wilderness 1 33Lostwood Wilderness 2 67Total 3 100
Respondents in Ohio Number of Respondents PercentWest Sister Island Wilderness 2 100
Respondents in Oklahoma Number of Respondents PercentWichita Mountains Wilderness 1 100
Respondents in Oregon Number of Respondents PercentGearhart Mountain Wilderness 1 5Hells Canyon Wilderness (ID/OR) 3 14Oregon Badlands Wilderness 4 19Soda Mountain Wilderness 1 5Spring Basin Wilderness 1 5Steens Mountain Wilderness 5 24Table Rock Wilderness 1 5Three Sisters Wilderness 3 14Waldo Lake Wilderness 1 5Other 1 5Total 21 100
Respondents in South Carolina Number of Respondents PercentCape Romain Wilderness 2 40Congaree National Park Wilderness 3 60Total 5 100
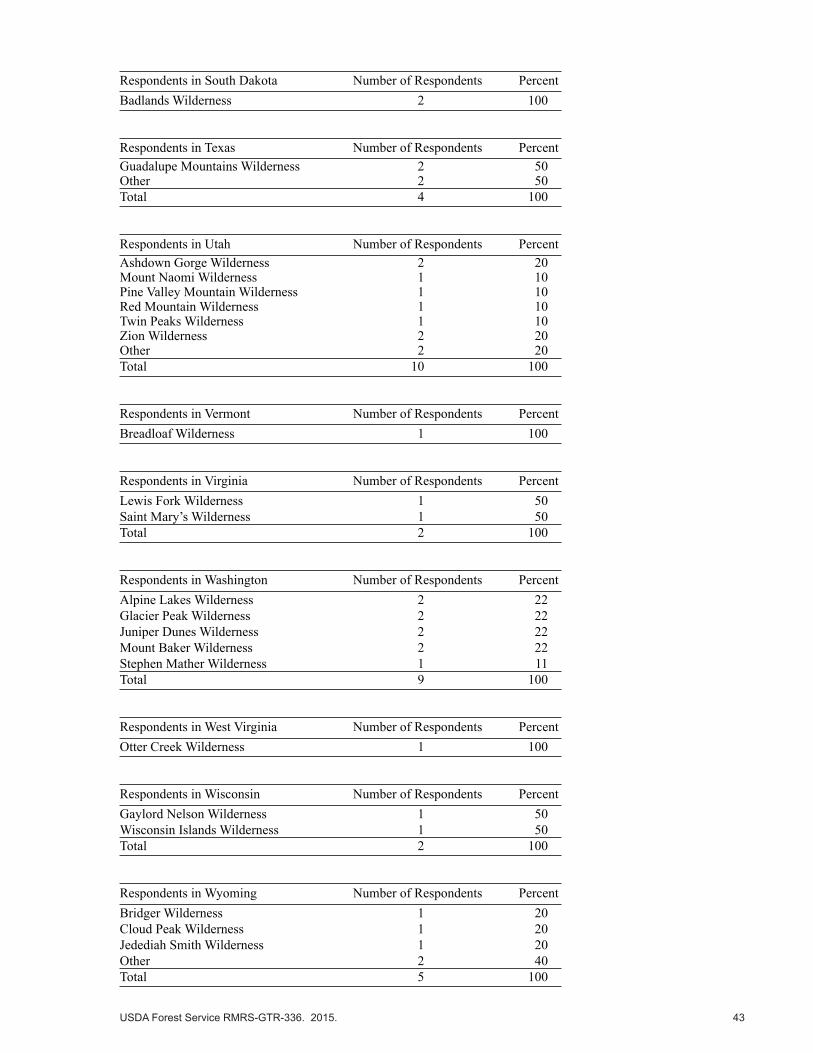
USDA Forest Service RMRS-GTR-336. 2015. 43
Respondents in South Dakota Number of Respondents PercentBadlands Wilderness 2 100
Respondents in Texas Number of Respondents PercentGuadalupe Mountains Wilderness 2 50Other 2 50Total 4 100
Respondents in Utah Number of Respondents PercentAshdown Gorge Wilderness 2 20Mount Naomi Wilderness 1 10Pine Valley Mountain Wilderness 1 10Red Mountain Wilderness 1 10Twin Peaks Wilderness 1 10Zion Wilderness 2 20Other 2 20Total 10 100
Respondents in Vermont Number of Respondents PercentBreadloaf Wilderness 1 100
Respondents in Virginia Number of Respondents PercentLewis Fork Wilderness 1 50Saint Mary’s Wilderness 1 50Total 2 100
Respondents in Washington Number of Respondents PercentAlpine Lakes Wilderness 2 22Glacier Peak Wilderness 2 22Juniper Dunes Wilderness 2 22Mount Baker Wilderness 2 22Stephen Mather Wilderness 1 11Total 9 100
Respondents in West Virginia Number of Respondents PercentOtter Creek Wilderness 1 100
Respondents in Wisconsin Number of Respondents PercentGaylord Nelson Wilderness 1 50Wisconsin Islands Wilderness 1 50Total 2 100
Respondents in Wyoming Number of Respondents PercentBridger Wilderness 1 20Cloud Peak Wilderness 1 20Jedediah Smith Wilderness 1 20Other 2 40Total 5 100

44 USDA Forest Service RMRS-GTR-336. 2015.
Table A2.1—Respondents by years in current position Bureau of National Park U.S. Forest U.S. Fish and Years All Agencies Land Management Service Service Wildlife Service - - - - - - - - - - - - - - - - - - - - - - - - number (percent)- - - - - - - - - - - - - - - - - - - - - - - 0-5 190 (55) 42 (56) 41 (54) 56 (54) 51 (58) 6-10 68 (20) 14 (19) 15 (20) 18 (17) 20 (23) 11-15 45 (13) 6 (8) 12 (16) 17 (17) 10 (11) 16-20 15 (4) 4 (5) 5 (7) 2 (2) 3 (3) >20 26 (8) 9 (12) 2 (3) 10 (10) 4 (5)Total* 344 (100) 75 (100) 75 (100) 103 (100) 88 (100)Mean 8 years 9 years 7 years 8 years 7 years* Three respondents belonged to other combinations.
Table A2.2—Respondents by years with responsibility for wilderness stewardship Bureau of National Park U.S. Forest U.S. Fish and Years All Agencies Land Management Service Service Wildlife Service - - - - - - - - - - - - - - - - - - - - - - - - number (percent)- - - - - - - - - - - - - - - - - - - - - - - 0-5 114 (33) 28 (37) 26 (35) 22 (21) 37 (42) 6-10 71 (21) 14 (19) 16 (21) 22 (21) 19 (22) 11-15 49 (14) 10 (13) 11 (15) 15 (15) 13 (15) 16-20 44 (13) 7 (9) 9 (12) 19 (19) 8 (9) >20 66 (19) 16(22) 13 (17) 25 (24) 11 (12)Total* 344 (100) 75 (100) 75 (100) 103 (100) 88 (100)Mean 12 years 12 years 12 years 15 years 10 years* Three respondents belonged to other combinations.
Appendix 2. Manager Profiles, Importance of Wilderness Values, Perceived Threats, Challenges
and Strategic Issues
Table A2.3—Respondents by agency of employmentAgency Number PercentBureau of Land Management 77 21National Park Service 82 22U.S. Forest Service 109 30U.S. Fish and Wildlife Service 96 26Other combinations 4 1Total 368 100
Table A2.3a—Respondents by level of office in Bureau of Land ManagementLevel Number PercentField 43 57District 18 24State 12 16National 3 4Total* 76 100
*Note: One respondent did not select Bureau of Land Management level.
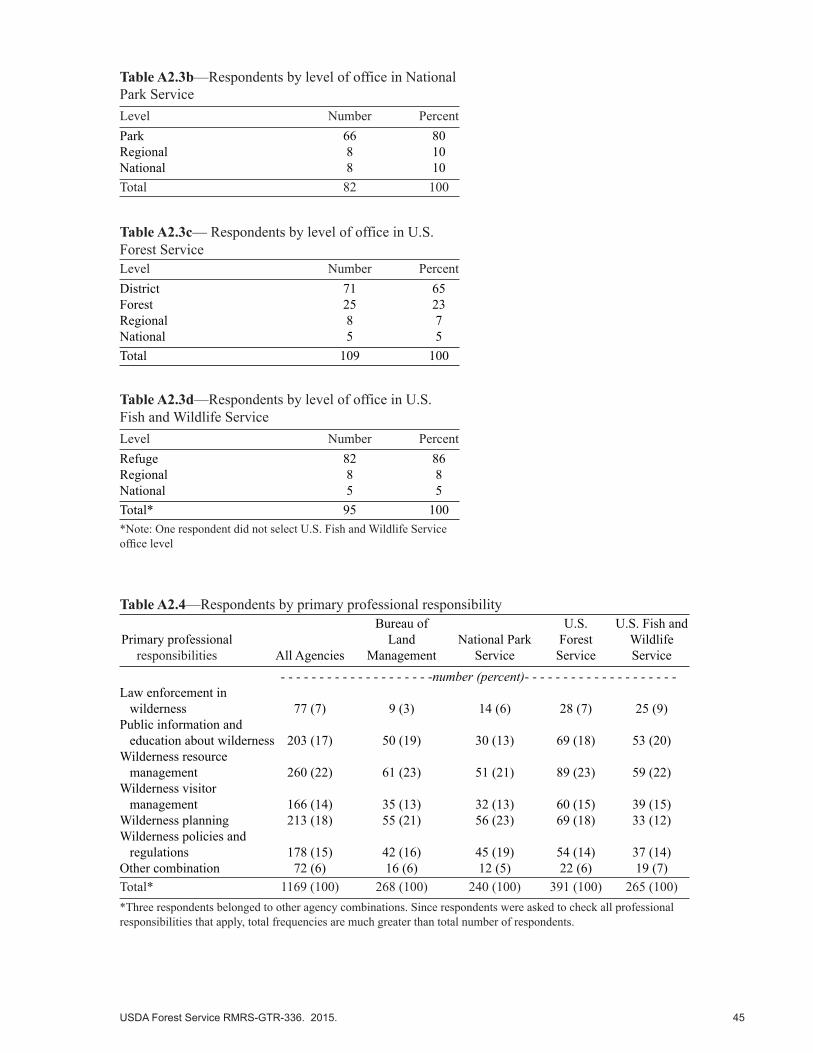
USDA Forest Service RMRS-GTR-336. 2015. 45
Table A2.3c— Respondents by level of office in U.S. Forest Service Level Number PercentDistrict 71 65Forest 25 23Regional 8 7National 5 5Total 109 100
Table A2.3d—Respondents by level of office in U.S. Fish and Wildlife ServiceLevel Number PercentRefuge 82 86Regional 8 8National 5 5Total* 95 100*Note: One respondent did not select U.S. Fish and Wildlife Service office level
Table A2.4—Respondents by primary professional responsibility Bureau of U.S. U.S. Fish and Primary professional Land National Park Forest Wildlife responsibilities All Agencies Management Service Service Service - - - - - - - - - - - - - - - - - - - -number (percent)- - - - - - - - - - - - - - - - - - - -Law enforcement in wilderness 77 (7) 9 (3) 14 (6) 28 (7) 25 (9)Public information and education about wilderness 203 (17) 50 (19) 30 (13) 69 (18) 53 (20)Wilderness resource management 260 (22) 61 (23) 51 (21) 89 (23) 59 (22)Wilderness visitor management 166 (14) 35 (13) 32 (13) 60 (15) 39 (15)Wilderness planning 213 (18) 55 (21) 56 (23) 69 (18) 33 (12)Wilderness policies and regulations 178 (15) 42 (16) 45 (19) 54 (14) 37 (14)Other combination 72 (6) 16 (6) 12 (5) 22 (6) 19 (7)Total* 1169 (100) 268 (100) 240 (100) 391 (100) 265 (100)*Three respondents belonged to other agency combinations. Since respondents were asked to check all professional responsibilities that apply, total frequencies are much greater than total number of respondents.
Table A2.3b—Respondents by level of office in National Park ServiceLevel Number PercentPark 66 80Regional 8 10National 8 10Total 82 100

46 USDA Forest Service RMRS-GTR-336. 2015.
Table A2.5—Respondents by time and effort on wilderness stewardship and planningProportion of Duties Number of Respondents Percent<10 93 2610-20 126 3421-40 55 1641-60 31 861-80 31 881-100 30 8Total 366 100Mean time and effort = 29 percent; Median time and effort = 20 percent
Table A2.6—Respondents by state Bureau of National Park U.S. Forest U.S. Fish and State All Agencies Land Management Service Service Wildlife Service - - - - - - - - - - - - - - - - - - - - - - - - number (percent)- - - - - - - - - - - - - - - - - - - - - - - - California 55 (17) 20 (28) 14 (21) 20 (21) 1 (1)Arizona 24 (8) 8 (11) 4 (6) 9 (10) 3 (4)Alaska 23 (7) 1 (1) 8 (11) — 14 (19)Oregon 21 (7) 15 (21) 1 (2) 5 (5) —Colorado 19 (6) 7 (10) 3 (4) 9 (9) —Montana 17 (6) 3 (4) 2 (3) 7 (8) 5 (7)Florida 16 (5) — 4 (6) — 12 (16)New Mexico 16 (5) 3 (4) 3 (5) 9 (9) 1 (1)Idaho 11 (4) 6 (8) — 5 (5) —Nevada 11 (4) 6 (8) 1 (2) 2 (2) 2 (3)Utah 11 (4) 1 (1) 5 (8) 5 (5) —Washington 9 (3) 2 (3) 1 (2) 6 (7) —Georgia 7 (2) — — 3 (3) 4 (5)Mississippi 5 (2) — 3 (5) 1 (1) 1 (1)New Hampshire 5 (2) — — 5 (5) —South Carolina 5 (2) — 3 (5) — 2 (3)Wyoming 5 (2) — 2 (3) 3 (3) —Maine 4 (1) — — — 4 (5)Texas 4 (1) — 4 (6) — —Hawaii 3 (1) — 3 (5) — —Louisiana 3 (1) — — — 3 (4)Michigan 3 (1) — — 1 (1) 2 (3)Minnesota 3 (1) — — — 3 (4)Missouri 3 (1) — — 1 (1) 2 (3)North Dakota 3 (1) — — — 3 (4)Nebraska 3 (1) — — — 3 (4)Massachusetts 2 (1) — — — 2 (3)New Jersey 2 (1) — — — 2 (3)Ohio 2 (1) — — — 2 (3)South Dakota 2 (1) — 2 (3) — —Virginia 2 (1) — — 2 (2) —Wisconsin 2 (1) — 1 (2) — 1 (1)Arkansas 1 (0) — — — 1 (1)Illinois 1 (0) — — — 1 (1)Kentucky 1 (0) — — 1 (1) —New York 1 (0) — 1 (2) — —Oklahoma 1 (0) — — — 1 (1)Vermont 1 (0) — — 1 (1) —West Virginia 1 (0) — — 1 (1) —Total 308 (100) 72 (100) 65 (100) 96 (100) 75 (100) Note: Dash in cells means no survey respondents. Percentages are rounded to the nearest integers.

USDA Forest Service RMRS-GTR-336. 2015. 47
Table A2.7—Values managers attach to wilderness
Table A2.7a—Number and percentage of respondents rating each wilderness value as very or extremely important Bureau of U.S. U.S. Fish and Land National Park Forest Wildlife Wilderness Value All Agencies Management Service Service Service - - - - - - - - - - - - - - - - - - - -number (percent)- - - - - - - - - - - - - - - - - - - -Knowing future generations will have Wilderness Areas 153 (97) 35 (95) 35 (100) 54 (98) 26 (96)Preserving unique wild plants & animals 148 (94) 36 (97) 33 (94) 50 (91) 26 (96)Protecting water quality 133 (85) 29 (79) 32 (91) 47 (85) 23 (85)Protecting of wildlife habitat 132 (84) 31 (84) 32 (92) 44 (80) 22 (81)Protecting rare and endangered species 124 (79) 32 (87) 28 (80) 42 (76) 20 (74)Knowing that Wilderness Areas exists 108 (69) 24 (65) 25 (72) 37 (67) 19 (70)Providing scenic beauty 101 (64) 23 (62) 25 (72) 34 (62) 18 (66)Protecting air quality 101 (64) 22 (59) 21 (60) 39 (71) 17 (63)Having option to visit Wilderness Areas in future 100 (64) 21 (56) 21 (60) 43 (78) 14 (52)Providing spiritual inspiration 100 (63) 24 (64) 23 (66) 36 (66) 16 (60)Preserving natural areas for science 94 (59) 19 (51) 25 (71) 31 (57) 17 (63)Providing recreation opportunities 91 (58) 21 (57) 17 (48) 36 (66) 17 (63)Providing income for tourism industry 15 (10) 4 (11) 3 (8) 4 (7) 4 (14)* Respondents were provided a five point Likert-type scale (not at all important to extremely important) to rate the importance of each wilderness value. This table summarizes the number and percentage of respondents that rated the wilderness values very or extremely important. Percentages are rounded to the nearest integers.

48 USDA Forest Service RMRS-GTR-336. 2015.
Table A2.7c—Number and percentage of respondents by all agencies and each agency rating each wilderness value
a. For future generations All Bureau of National Park U.S. Forest U.S. Fish andLevel of Importance Agencies Land Management Service Service Wildlife Service - - - - - - - - - - - - - - - - - - - - - - - number (percent)- - - - - - - - - - - - - - - - - - - - - - Extremely important 127 (81) 30 (81) 32 (91) 40 (73) 22 (81)Very important 26 (16) 5 (14) 3 (9) 14 (25) 4 (15)Moderately important 3 (2) 2 (5) 0 (0) 1 (2) 1 (4)Slightly important 1 (1) 0 (0) 0 (0) 0 (0) 0 (0)Not at all important 0 (0) 0 (0) 0 (0) 0 (0) 0 (0)Total 157 (100) 37 (100) 35 (100) 55 (100) 27 (100)
b. For scientific study All Bureau of National Park U.S. Forest U.S. Fish andLevel of Importance Agencies Land Management Service Service Wildlife Service - - - - - - - - - - - - - - - - - - - - - - - number (percent)- - - - - - - - - - - - - - - - - - - - - - Extremely important 32 (20) 6 (16) 10 (28) 9 (17) 6 (22)Very important 62 (39) 13 (35) 15 (43) 22 (40) 11 (41)Moderately important 51 (33) 16 (43) 9 (26) 18 (33) 7 (26)Slightly important 9 (6) 2 (6) 1 (3) 3 (5) 3 (11)Not at all important 3 (2) 0 (0) 0 (0) 3 (5) 0 (0)Total 157 (100) 37 (100) 35 (100) 55 (100) 27 (100)
Table A2.7b—Comparison of percentages of the managers and the public rating each value as very or extremely important Managers The public** Wilderness Values *2013 2008Knowing future generations will have WA 97 90Preserving unique wild plants & animals 94 84Protecting water quality 85 93Protecting of wildlife habitat 84 89Protecting rare and endangered species 79 83Knowing that WA exists 69 78Providing scenic beauty 64 80Protecting air quality 64 93Having option to visit WA in future 64 79Providing spiritual inspiration 63 60Preserving natural areas for science 59 67Providing recreation opportunities 58 72Providing income for tourism industry 10 38* Respondents were provided a five-point Likert-type scale (not at all important to extremely important) to rate the importance of each wilderness value. This table summarizes the percentage of respondents that rated the wilderness values statements very or extremely important.
**Data for ranking wilderness values by the public were based on the National Sur-vey on Recreation and the Environment (NSRE) conducted in 2008.

USDA Forest Service RMRS-GTR-336. 2015. 49
c. Future option to visit All Bureau of National Park U.S. Forest U.S. Fish andLevel of Importance Agencies Land Management Service Service Wildlife Service - - - - - - - - - - - - - - - - - - - - - - - number (percent)- - - - - - - - - - - - - - - - - - - - - - Extremely important 41 (26) 8 (21) 11 (31) 17 (31) 4 (15)Very important 59 (38) 13 (35) 10 (29) 26 (47) 10 (37)Moderately important 51 (32) 14 (38) 14 (40) 9 (16) 12 (44)Slightly important 5 (3) 1 (3) 0 (0) 3 (6) 1 (4)Not at all important 1 (1) 1 (3) 0 (0) 0 (0) 0 (0)Total 157 (100) 37 (100) 35 (100) 55 (100) 27 (100)
d. Income for tourism industry All Bureau of National Park U.S. Forest U.S. Fish andLevel of Importance Agencies Land Management Service Service Wildlife Service - - - - - - - - - - - - - - - - - - - - - - - number (percent)- - - - - - - - - - - - - - - - - - - - - - Extremely important 3 (2) 0 (0) 0 (0) 1 (2) 2 (7)Very important 12 (8) 4 (11) 3 (8) 3 (5) 2 (7)Moderately important 54 (34) 15 (41) 11 (31) 20 (36) 5 (19)Slightly important 63 (40) 13 (35) 15 (43) 24 (44) 11 (41)Not at all important 25 (16) 5 (13) 6 (17) 7 (13) 7 (26)Total 157 (100) 37 (100) 35 (100) 55 (100) 27 (100)
e. Just knowing it exists All Bureau of National Park U.S. Forest U.S. Fish andLevel of Importance Agencies Land Management Service Service Wildlife Service - - - - - - - - - - - - - - - - - - - - - - - number (percent)- - - - - - - - - - - - - - - - - - - - - - Extremely important 58 (37) 11 (30) 16 (46) 19 (34) 9 (33)Very important 50 (32) 13 (35) 9 (26) 18 (33) 10 (37)Moderately important 37 (24) 11 (30) 7 (20) 11 (20) 8 (30)Slightly important 8 (5) 1 (3) 2 (5) 5 (9) 0 (0)Not at all important 4 (3) 1 (3) 1 (3) 2 (4) 0 (0)Total 157 (100) 57 (100) 35 (100) 55 (100) 27 (100)
f. Preserving ecosystems All Bureau of National Park U.S. Forest U.S. Fish andLevel of Importance Agencies Land Management Service Service Wildlife Service - - - - - - - - - - - - - - - - - - - - - - - number (percent)- - - - - - - - - - - - - - - - - - - - - - Extremely important 107 (68) 26 (70) 25 (71) 39 (71) 16 (59)Very important 41 (26) 10 (27) 8 (23) 11 (20) 10 (37)Moderately important 6 (4) 1 (3) 1 (2) 3 (5) 1 (4)Slightly important 3 (2) 0 (0) 1 (3) 2 (4) 0 (0)Not at all important 0 (0) 0 (0) 0 (0) 0 (0) 0 (0)Total 157 (100) 37 (100) 35 (100) 55 (100) 27 (100)

50 USDA Forest Service RMRS-GTR-336. 2015.
g. Protecting air quality All Bureau of National Park U.S. Forest U.S. Fish andLevel of Importance Agencies Land Management Service Service Wildlife Service - - - - - - - - - - - - - - - - - - - - - - - number (percent)- - - - - - - - - - - - - - - - - - - - - - Extremely important 54 (34) 13 (35) 10 (29) 23 (42) 6 (22)Very important 47 (29) 9 (24) 11 (31) 16 (29) 11 (41)Moderately important 43 (27) 8 (22) 12 (34) 14 (25) 8 (30)Slightly important 9 (6) 5 (14) 2 (6) 0 (0) 2 (7)Not at all important 4 (3) 2 (5) 0 (0) 2 (4) 0 (0)Total 157 (100) 37 (100) 35 (100) 55 (10) 27 (100)
h. Protecting water quality All Bureau of National Park U.S. Forest U.S. Fish andLevel of Importance Agencies Land Management Service Service Wildlife Service - - - - - - - - - - - - - - - - - - - - - - - number (percent)- - - - - - - - - - - - - - - - - - - - - - Extremely important 77 (49) 18 (49) 15 (43) 32 (58) 10 (37)Very important 56 (36) 11 (30) 17 (48) 15 (27) 13 (48)Moderately important 19 (12) 5 (13) 2 (6) 7 (13) 4 (15)Slightly important 4 (3) 3 (8) 1 (3) 1 (2) 0 (0)Not at all important 1 (1) 0 (0) 0 (0) 0 (0) 0 (0)Total 157 (100) 37 (100) 35 (100) 55 (100) 27 (100)
i. Protection for endangered species All Bureau of National Park U.S. Forest U.S. Fish andLevel of Importance Agencies Land Management Service Service Wildlife Service - - - - - - - - - - - - - - - - - - - - - - - number (percent)- - - - - - - - - - - - - - - - - - - - - - Extremely important 66 (42) 18 (49) 15 (43) 22 (40) 9 (33)Very important 58 (37) 14 (38) 13 (37) 20 (36) 11 (41)Moderately important 26 (17) 3 (8) 7 (20) 10 (18) 5 (19)Slightly important 5 (3) 1 (3) 0 (0) 2 (4) 2 (7)Not at all important 2 (1) 1 (3) 0 (0) 1 (2) 0 (0)Total 157 (100) 37 (100) 35 (100) 55 (100) 27 (100)
j. Protection of wildlife habitat All Bureau of National Park U.S. Forest U.S. Fish andLevel of Importance Agencies Land Management Service Service Wildlife Service - - - - - - - - - - - - - - - - - - - - - - - number (percent)- - - - - - - - - - - - - - - - - - - - - - Extremely important 73 (46) 19 (51) 17 (49) 22 (40) 13 (48)Very important 59 (38) 12 (33) 15 (43) 22 (40) 9 (33)Moderately important 20 (13) 3 (8) 3 (8) 9 (16) 5 (19)Slightly important 4 (3) 3 (8) 0 (0) 1 (2) 0 (0)Not at all important 1 (1) 0 (0) 0 (0) 1 (2) 0 (0)Total 157 (100) 37 (100) 35 (100) 55 (100) 27 (100)

USDA Forest Service RMRS-GTR-336. 2015. 51
k. Providing spiritual inspiration All Bureau of National Park U.S. Forest U.S. Fish andLevel of Importance Agencies Land Management Service Service Wildlife Service - - - - - - - - - - - - - - - - - - - - - - - number (percent)- - - - - - - - - - - - - - - - - - - - - - Extremely important 49 (31) 12 (32) 9 (26) 19 (35) 8 (30)Very important 51 (32) 12 (32) 14 (40) 17 (31) 8 (30)Moderately important 40 (25) 9 (25) 9 (26) 14 (25) 7 (26)Slightly important 15 (10) 4 (11) 3 (8) 4 (7) 3 (11)Not at all important 2 (1) 0 (0) 0 (0) 1 (2) 1 (3)Total 157 (100) 37 (100) 35 (100) 55 (100) 27 (100)
l. Recreation opportunities All Bureau of National Park U.S. Forest U.S. Fish andLevel of Importance Agencies Land Management Service Service Wildlife Service - - - - - - - - - - - - - - - - - - - - - - - number (percent)- - - - - - - - - - - - - - - - - - - - - - Extremely important 31 (20) 10 (27) 5 (14) 12 (22) 4 (15)Very important 60 (38) 11 (30) 12 (34) 24 (44) 13 (48)Moderately important 50 (32) 15 (40) 15 (43) 15 (27) 4 (15)Slightly important 15 (10) 1 (3) 2 (6) 4 (7) 6 (22)Not at all important 1 (1) 0 (0) 1 (3) 0 (0) 0 (0)Total 157 (100) 37 (100) 35 (100) 55 (100) 27 (100)
m. Scenic beauty All Bureau of National Park U.S. Forest U.S. Fish andLevel of Importance Agencies Land Management Service Service Wildlife Service - - - - - - - - - - - - - - - - - - - - - - - number (percent)- - - - - - - - - - - - - - - - - - - - - - Extremely important 44 (28) 11 (30) 9 (26) 17 (31) 6 (22)Very important 57 (36) 12 (32) 16 (46) 17 (31) 12 (44)Moderately important 47 (30) 12 (32) 9 (26) 19 (34) 7 (26)Slightly important 7 (4) 2 (6) 0 (0) 2 (4) 2 (8)Not at all important 2 (1) 0 (0) 1 (3) 0 (0) 0 (0)Total 157 (100) 37 (100) 35 (100) 55 (100) 27 (100)

52 USDA Forest Service RMRS-GTR-336. 2015.
Table A2.8—Level of potential threats over the next 20 years to the wilderness resource or visitor experiences
a. Adjacent land management and use All Bureau of National Park U.S. Forest U.S. Fish andLevel of Threats Agencies Land Management Service Service Wildlife Service - - - - - - - - - - - - - - - - - - - - - - - number (percent)- - - - - - - - - - - - - - - - - - - - - - Very high 77 (22) 21 (28) 22 (29) 13 (12) 20 (22)High 77 (22) 15 (20) 18 (23) 27 (25) 16 (18)Moderate 116 (33) 23 (31) 22 (29) 37 (34) 33 (37)Slight 68 (19) 13 (17) 14 (18) 28 (26) 13 (15)None 13 (4) 3 (4) 1 (1) 3 (3) 6 (7)Not sure 1 (0) 0 (0) 0 (0) 0 (0) 1 (1)Total* 352 (100) 75 (100) 77 (100) 108 (100) 89 (100)*3 respondents belonged to other combination. Hence row total and column total are not equal.Percentages are rounded to the nearest integer.
b. Administrative access, facilities, or other administrative exceptions All Bureau of National Park U.S. Forest U.S. Fish andLevel of Threats Agencies Land Management Service Service Wildlife Service - - - - - - - - - - - - - - - - - - - - - - - number (percent)- - - - - - - - - - - - - - - - - - - - - - Very high 25 (7) 5 (7) 6 (8) 7 (6) 6 (7)High 54 (15) 10 (13) 19 (24) 19 (18) 5 (6)Moderate 105 (30) 23 (31) 26 (34) 30 (28) 26 (29)Slight 140 (40) 34 (45) 26 (34) 40 (37) 39 (44)None 21 (6) 2 (3) 0 (0) 10 (9 ) 9 (10)Not sure 7 (2) 1 (1) 0 (0) 2 (2) 4 (4)Total 352 (100) 75 (100) 77 (100) 108 (100) 89 (100)
c. Visitor use of advanced technology and electronic equipment for navigation or communication All Bureau of National Park U.S. Forest U.S. Fish andLevel of Threats Agencies Land Management Service Service Wildlife Service - - - - - - - - - - - - - - - - - - - - - - - number (percent)- - - - - - - - - - - - - - - - - - - - - - Very high 40 (12) 9 (12) 9 (12) 15 (14) 6 (7)High 61 (17) 9 (12) 14 (18) 26 (24) 11 (12)Moderate 103 (29) 19 (26) 25 (32) 37 (34) 21 (24)Slight 113 (32) 30 (40) 21 (27) 23 (21) 39 (44)None 27 (8) 4 (5) 7 (9) 6 (6) 10 (11)Not sure 8 (2) 4 (5) 1 (1) 1 (1) 2 (2)Total 352 (100) 75 (100) 77 (100) 108 (100) 89 (100)

USDA Forest Service RMRS-GTR-336. 2015. 53
d. Air quality impacts All Bureau of National Park U.S. Forest U.S. Fish andLevel of Threats Agencies Land Management Service Service Wildlife Service - - - - - - - - - - - - - - - - - - - - - - - number (percent)- - - - - - - - - - - - - - - - - - - - - - Very high 37 (11) 6 (8) 11 (14) 14 (13) 4 (4)High 72 (20) 11 (15) 19 (25) 23 (21) 18 (21)Moderate 107 (30) 17 (23) 25 (33) 43 (40) 22 (25)Slight 102 (29) 29 (39) 15 (19) 24 (22) 34 (38)None 25 (7) 10 (13) 4 (5) 4 (4) 7 (8)Not sure 9 (3) 2 (2) 3 (4) 0 (0) 4 (4)Total 352 (100) 75 (100) 77 (100) 108 (100) 89 (100)
e. Aircraft noise and airspace reservations All Bureau of National Park U.S. Forest U.S. Fish andLevel of Threats Agencies Land Management Service Service Wildlife Service - - - - - - - - - - - - - - - - - - - - - - - number (percent)- - - - - - - - - - - - - - - - - - - - - - Very high 59 (59) 2 (3) 23 (30) 20 (19) 12 (13)High 71 (20) 12 (16) 19 (25) 24 (22) 16 (18)Moderate 120 (34) 26 (35) 25 (32) 35 (32) 33 (37)Slight 87 (25) 31 (41) 10 (13) 24 (22) 22 (25)None 10 (3) 3 (4) 0 (0) 4 (4) 3 (3)Not sure 5 (1) 1 (1) 0 (0) 1 (1) 3 (3)Total 352 (100) 75 (100) 77 (100) 108 (100) 89 (100)
f. Fragmentation and isolation of wilderness as ecological islands All Bureau of National Park U.S. Forest U.S. Fish andLevel of Threats Agencies Land Management Service Service Wildlife Service - - - - - - - - - - - - - - - - - - - - - - - number (percent)- - - - - - - - - - - - - - - - - - - - - - Very high 55 (16) 12 (16) 15 (19) 15 (14) 13 (15)High 76 (22) 16 (21) 15 (19) 28 (26) 17 (19)Moderate 83 (23) 20 (27) 19 (25) 27 (25) 15 (17)Slight 106 (30) 20 (27) 17 (22) 33 (30) 35 (39)None 25 (7) 6 (8) 8 (10) 5 (5) 6 (7)Not sure 7 (2) 1 (1) 3 (4) 0 (0) 3 (3)Total 352 (100) 75 (100) 77 (100) 108 (100) 89 (100)
g. Increasing or changing non-commercial recreation All Bureau of National Park U.S. Forest U.S. Fish andLevel of Threats Agencies Land Management Service Service Wildlife Service - - - - - - - - - - - - - - - - - - - - - - - number (percent)- - - - - - - - - - - - - - - - - - - - - - Very high 50 (14) 4 (5) 6 (8) 28 (26) 10 (11)High 75 (21) 16 (21) 17 (22) 28 (26) 14 (16)Moderate 114 (32) 22 (29) 30 (39) 31 (29) 31 (35)Slight 90 (26) 30 (40) 20 (26) 16 (15) 23 (26)None 17 (5) 2 (3) 3 (4) 3 (3) 9 (10)Not sure 6 (2) 1 (1) 1 (1) 2 (2) 2 (2)Total 352 (100) 75 (100) 77 (100) 108 (100) 89 (100)

54 USDA Forest Service RMRS-GTR-336. 2015.
h. Increasing or changing commercial recreation All Bureau of National Park U.S. Forest U.S. Fish andLevel of Threats Agencies Land Management Service Service Wildlife Service - - - - - - - - - - - - - - - - - - - - - - - number (percent)- - - - - - - - - - - - - - - - - - - - - - Very high 29 (8) 0 (0) 11 (14) 11 (10) 6 (7)High 59 (17) 12 (16) 12 (16) 20 (19) 15 (17)Moderate 131 (37) 28 (37) 25 (32) 48 (44) 28 (31)Slight 102 (29) 31 (41) 25 (32) 24 (22) 22 (25)None 27 (8) 4 (5) 3 (4) 5 (5) 15 (17)Not sure 4 (1) 0 (0) 1 (1) 0 (0) 3 (3)Total 352 (100) 75 (100) 77 (100) 108 (100) 89 (100)
i. Lack of political and financial support for wilderness protection and management All Bureau of National Park U.S. Forest U.S. Fish andLevel of Threats Agencies Land Management Service Service Wildlife Service - - - - - - - - - - - - - - - - - - - - - - - number (percent)- - - - - - - - - - - - - - - - - - - - - - Very high 153 (43) 24 (32) 37 (48) 63 (58) 26 (29)High 110 (31) 22 (29) 25 (32) 33 (30) 30 (34)Moderate 50 (14) 13 (17) 12 (16) 6 (6) 19 (21)Slight 29 (8) 12 (16) 3 (4) 4 (4) 10 (11)None 4 (1) 1 (1) 0 (0) 1 (1) 2 (2)Not sure 6 (2) 3 (4) 0 (0) 1 (1) 2 (2)Total 352 (100) 75 (100) 77 (100) 108 (100) 89 (100)
j. Legislation designating wilderness with compromised wilderness conditions or special provisions for management All Bureau of National Park U.S. Forest U.S. Fish andLevel of Threats Agencies Land Management Service Service Wildlife Service - - - - - - - - - - - - - - - - - - - - - - - number (percent)- - - - - - - - - - - - - - - - - - - - - - Very high 61 (17) 14 (19) 15 (19) 18 (17) 11 (12)High 86 (24) 15 (20) 17 (22) 38 (35) 16 (18)Moderate 74 (21) 14 (19) 21 (27) 19 (18) 20 (22)Slight 70 (20) 16 (21) 13 (17) 19 (18) 22 (25)None 40 (11) 12 (16) 4 (5) 12 (11) 12 (13)Not sure 21 (6) 4 (5) 7 (9) 2 (2) 8 (9)Total 352 (100) 75 (100) 77 (100) 108 (100) 89 (100)
k. Livestock grazing All Bureau of National Park U.S. Forest U.S. Fish andLevel of Threats Agencies Land Management Service Service Wildlife Service - - - - - - - - - - - - - - - - - - - - - - - number (percent)- - - - - - - - - - - - - - - - - - - - - - Very high 20 (6) 6 (8) 3 (4) 10 (9) 1 (1)High 41 (12) 10 (13) 11 (14) 15 (14) 5 (6)Moderate 72 (20) 27 (36) 11 (14) 27 (25) 5 (6)Slight 79 (22) 25 (33) 20 (26) 24 (22) 9 (10)None 134 (38) 7 (9) 30 (39) 32 (30) 65 (73)Not sure 6 (2) 0 (0) 2 (3) 0 (0) 4 (4)Total 352 (100) 75 (100) 77 (100) 108 (100) 89 (100)

USDA Forest Service RMRS-GTR-336. 2015. 55
l. Energy development and resource extraction All Bureau of National Park U.S. Forest U.S. Fish andLevel of Threats Agencies Land Management Service Service Wildlife Service - - - - - - - - - - - - - - - - - - - - - - - number (percent)- - - - - - - - - - - - - - - - - - - - - - Very high 51 (14) 9 (12) 15 (19) 14 (13) 13 (15)High 44 (13) 8 (11) 12 (16) 11 (10) 12 (13)Moderate 64 (18) 17 (23) 14 (18) 21 (19) 12 (13)Slight 91 (26) 19 (25) 9 (12) 42 (39) 19 (21)None 91 (26) 19 (25) 26 (34) 17 (16) 29 (33)Not sure 11 (3) 3 (4) 1 (1) 3 (3) 4 (5)Total 352 (100) 75 (100) 77 (100) 108 (100) 89 (100)
m. Motorized and mechanical equipment trespass and illegal use All Bureau of National Park U.S. Forest U.S. Fish andLevel of Threats Agencies Land Management Service Service Wildlife Service - - - - - - - - - - - - - - - - - - - - - - - number (percent)- - - - - - - - - - - - - - - - - - - - - - Very high 53 (15) 16 (21) 8 (10) 21 (19) 6 (7)High 81 (23) 22 (29) 9 (12) 31 (29) 18 (20)Moderate 125 (36) 20 (27) 33 (43) 39 (36) 33 (37)Slight 75 (21) 17 (23) 20 (26) 14 (13) 24 (27)None 15 (4) 0 (0) 7 (9) 3 (3) 5 (6)Not sure 3 (1) 0 (0) 0 (0) 0 (0) 3 (3)Total 352 (100) 75 (100) 77 (100) 108 (100) 89 (100)
n. Invasive species All Bureau of National Park U.S. Forest U.S. Fish andLevel of Threats Agencies Land Management Service Service Wildlife Service - - - - - - - - - - - - - - - - - - - - - - - number (percent)- - - - - - - - - - - - - - - - - - - - - - Very high 87 (25) 18 (24) 24 (31) 17 (16) 27 (30)High 109 (31) 27 (36) 32 (42) 35 (32) 14 (16)Moderate 115 (32) 20 (27) 18 (23) 46 (43) 30 (34)Slight 36 (10) 10 (13) 3 (4) 8 (7) 15 (17)None 2 (1) 0 (0) 0 (0) 2 (2) 0 (0)Not sure 3 (1) 0 (0) 0 (0) 0 (0) 3 (3)Total 352 (100) 75 (100) 77 (100) 108 (100) 89 (100)
o. Risk of wildfire damage (outside wilderness) originating in wilderness All Bureau of National Park U.S. Forest U.S. Fish andLevel of Threats Agencies Land Management Service Service Wildlife Service - - - - - - - - - - - - - - - - - - - - - - - number (percent)- - - - - - - - - - - - - - - - - - - - - - Very high 45 (13) 14 (19) 8 (10) 16 (15) 6 (7)High 64 (18) 16 (21) 15 (19) 21 (19) 11 (12)Moderate 114 (32) 21 (28) 30 (39) 37 (34) 26 (29)Slight 95 (27) 21 (28) 16 (21) 29 (27) 28 (31)None 28 (8) 1 (1) 6 (8) 5 (5) 16 (18)Not sure 6 (2) 2 (3) 2 (3) 0 (0) 2 (2)Total 352 (100) 75 (100) 77 (100) 108 (100) 89 (100)

56 USDA Forest Service RMRS-GTR-336. 2015.
p. Private inholdings and their uses All Bureau of National Park U.S. Forest U.S. Fish andLevel of Threats Agencies Land Management Service Service Wildlife Service - - - - - - - - - - - - - - - - - - - - - - - number (percent)- - - - - - - - - - - - - - - - - - - - - - Very high 14 (4) 4 (5) 2 (3) 3 (3) 4 (4)High 39 (11) 14 (19) 9 (12) 11 (10) 4 (4)Moderate 99 (28) 20 (27) 21 (27) 36 (33) 22 (25)Slight 110 (31) 26 (35) 24 (31) 34 (31) 25 (28)None 82 (23) 10 (13) 18 (23) 24 (22) 30 (34)Not sure 8 (2) 1 (1) 3 (4) 0 (0) 4 (4)Total 352 (100) 75 (100) 77 (100) 108 (100) 89 (100)
q. Pressure on threatened and endangered species management All Bureau of National Park U.S. Forest U.S. Fish andLevel of Threats Agencies Land Management Service Service Wildlife Service - - - - - - - - - - - - - - - - - - - - - - - number (percent)- - - - - - - - - - - - - - - - - - - - - - Very high 30 (9) 7 (9) 7 (9) 7 (6) 9 (10)High 57 (16) 11 (15) 13 (17) 19 (18) 12 (13)Moderate 117 (33) 25 (33) 26 (34) 44 (41) 21 (24)Slight 113 (32) 21 (28) 25 (32) 34 (31) 33 (37)None 26 (7) 8 (11) 5 (6) 3 (3) 10 (11)Not sure 9 (3) 3 (4) 1 (1) 1 (1) 4 (5)Total 352 (100) 75 (100) 77 (100) 108 (100) 89 (100)
r. Urbanization and encroaching development All Bureau of National Park U.S. Forest U.S. Fish andLevel of Threats Agencies Land Management Service Service Wildlife Service - - - - - - - - - - - - - - - - - - - - - - - number (percent)- - - - - - - - - - - - - - - - - - - - - - Very high 41 (12) 10 (13) 7 (9) 13 (12) 10 (11)High 56 (16) 14 (19) 12 (16) 19 (18) 10 (11)Moderate 86 (24) 15 (20) 23 (30) 30 (28) 17 (19)Slight 106 (30) 19 (25) 22 (29) 36 (33) 29 (33)None 63 (18) 17 (23) 13 (17) 10 (9) 23 (26)Not sure 0 (0) 0 (0) 0 (0) 0 (0) 0 (0)Total 352 (100) 75 (100) 77 (100) 108 (100) 89 (100)
s. Water projects facilities All Bureau of National Park U.S. Forest U.S. Fish andLevel of Threats Agencies Land Management Service Service Wildlife Service - - - - - - - - - - - - - - - - - - - - - - - number (percent)- - - - - - - - - - - - - - - - - - - - - - Very high 21 (6) 3 (4) 6 (8) 10 (9) 1 (1)High 46 (13) 8 (11) 16 (21) 14 (13) 6 (7)Moderate 60 (17) 12 (16) 11 (14) 23 (21) 14 (16)Slight 107 (30) 33 (44) 23 (30) 28 (26) 23 (26)None 103 (29) 16 (21) 19 (24) 29 (26) 39 (44)Not sure 15 (4) 3 (4) 2 (3) 4 (4) 6 (7)Total 352 (100) 75 (100) 77 (100) 108 (100) 89 (100)

USDA Forest Service RMRS-GTR-336. 2015. 57
t. Water quality impacts All Bureau of National Park U.S. Forest U.S. Fish andLevel of Threats Agencies Land Management Service Service Wildlife Service - - - - - - - - - - - - - - - - - - - - - - - number (percent)- - - - - - - - - - - - - - - - - - - - - - Very high 31 (9) 4 (5) 7 (9) 8 (7) 11 (12)High 49 (14) 7 (9) 8 (10) 14 (13) 19 (21)Moderate 103 (29) 13 (18) 23 (30) 41 (38) 25 (28)Slight 126 (36) 34 (46) 29 (38) 37 (34) 26 (29)None 40 (11) 16 (21) 9 (12) 8 (7) 7 (8)Not sure 3 (1) 1 (1) 1 (1) 0 (0) 1 (1)Total 352 (100) 75 (100) 77 (100) 108 (100) 89 (100)
u. Wildland fire suppression and management All Bureau of National Park U.S. Forest U.S. Fish andLevel of Threats Agencies Land Management Service Service Wildlife Service - - - - - - - - - - - - - - - - - - - - - - - number (percent)- - - - - - - - - - - - - - - - - - - - - - Very high 66 (19) 14 (19) 15 (19) 28 (26) 8 (9)High 70 (20) 19 (25) 11 (14) 33 (31) 5 (6)Moderate 99 (28) 23 (31) 25 (32) 28 (26) 23 (26)Slight 77 (22) 15 (20) 21 (27) 13 (12) 28 (31)None 33 (9) 2 (3) 4 (5) 6 (6) 21 (24)Not sure 7 (2) 2 (3) 1 (1) 0 (0 4 (4)Total 352 (100) 75 (100) 77 (100) 108 (100) 89 (100)
v. Disconnected urban audiences All Bureau of National Park U.S. Forest U.S. Fish andLevel of Threats Agencies Land Management Service Service Wildlife Service - - - - - - - - - - - - - - - - - - - - - - - number (percent)- - - - - - - - - - - - - - - - - - - - - - Very high 95 (27) 14 (19) 23 (30) 35 (32) 20 (22)High 93 (26) 15 (20) 25 (32) 28 (26) 25 (28)Moderate 77 (22) 15 (20) 18 (23) 28 (26) 16 (18)Slight 53 (15) 18 (24) 6 (8) 10 (9) 19 (21)None 18 (5) 8 (11) 4 (5) 1 (1) 5 (6)Not sure 16 (5) 5 (6) 1 (1) 6 (6) 4 (4)Total 352 (100) 75 (100) 77 (100) 108 (100) 89 (100)
w. Disruption of wildlife corridors All Bureau of National Park U.S. Forest U.S. Fish andLevel of Threats Agencies Land Management Service Service Wildlife Service - - - - - - - - - - - - - - - - - - - - - - - number (percent)- - - - - - - - - - - - - - - - - - - - - - Very high 45 (13) 10 (13) 12 (16) 9 (8) 12 (13)High 55 (16) 10 (13) 14 (18) 17 (16) 13 (15)Moderate 104 (30) 22 (29) 20 (26) 37 (34) 25 (28)Slight 101 (29) 23 (31) 21 (27) 32 (30) 25 (28)None 41 (12) 9 (12) 9 (12) 9 (8) 14 (16)Not sure 6 (2) 1 (1) 1 (1) 4 (4) 0 (0)Total 352 (100) 75 (100) 77 (100) 108 (100) 89 (100)

58 USDA Forest Service RMRS-GTR-336. 2015.
x. Sea level rise; coastal erosion All Bureau of National Park U.S. Forest U.S. Fish andLevel of Threats Agencies Land Management Service Service Wildlife Service - - - - - - - - - - - - - - - - - - - - - - - number (percent)- - - - - - - - - - - - - - - - - - - - - - Very high 33 (9) 1 (1) 7 (9) 1 (1) 24 (27)High 22 (6) 5 (7) 4 (5) 4 (4) 9 (10)Moderate 40 (11) 6 (8) 12 (16) 9 (8) 12 (13)Slight 54 (15) 11 (15) 12 (16) 17 (16) 12 (13)None 185 (53) 44 (59) 40 (52) 71 (66) 30 (34)Not sure 18 (5) 8 (11) 2 (3) 6 (5) 2 (2)Total 352 (100) 75 (100) 77 (100) 108 (100) 89 (100)
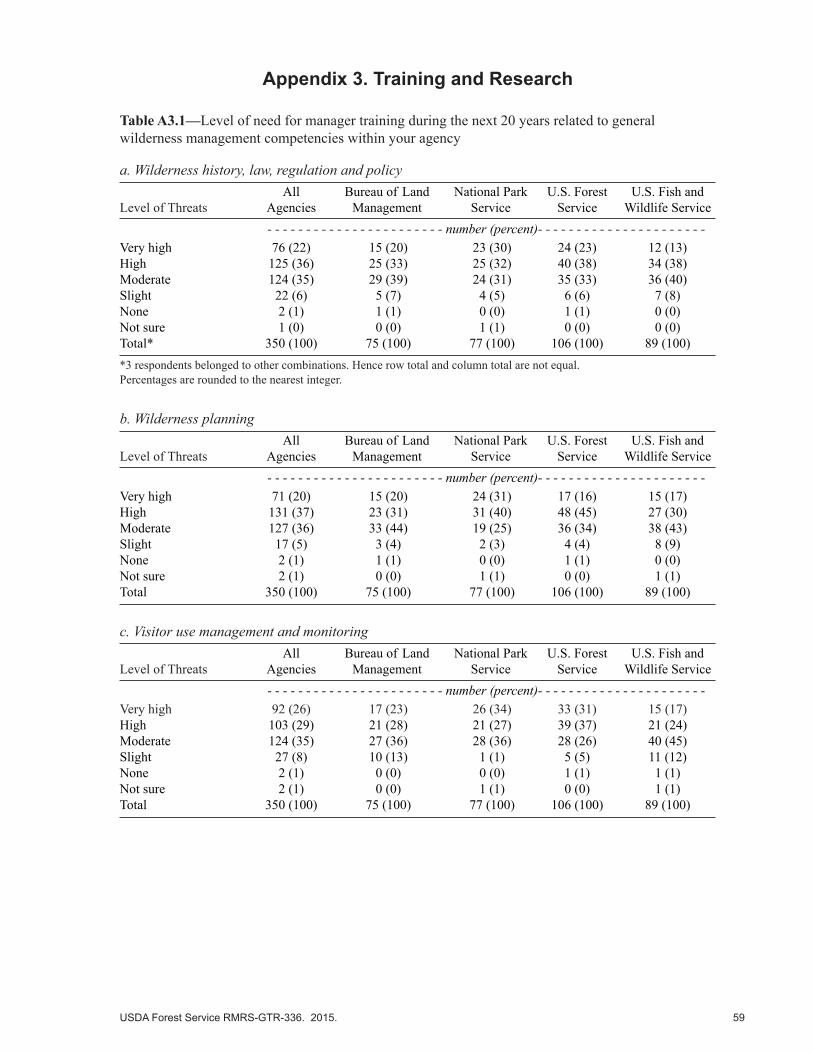
USDA Forest Service RMRS-GTR-336. 2015. 59
Appendix 3. Training and Research
Table A3.1—Level of need for manager training during the next 20 years related to general wilderness management competencies within your agency
a. Wilderness history, law, regulation and policy All Bureau of Land National Park U.S. Forest U.S. Fish andLevel of Threats Agencies Management Service Service Wildlife Service - - - - - - - - - - - - - - - - - - - - - - - number (percent)- - - - - - - - - - - - - - - - - - - - - - Very high 76 (22) 15 (20) 23 (30) 24 (23) 12 (13)High 125 (36) 25 (33) 25 (32) 40 (38) 34 (38)Moderate 124 (35) 29 (39) 24 (31) 35 (33) 36 (40)Slight 22 (6) 5 (7) 4 (5) 6 (6) 7 (8)None 2 (1) 1 (1) 0 (0) 1 (1) 0 (0)Not sure 1 (0) 0 (0) 1 (1) 0 (0) 0 (0)Total* 350 (100) 75 (100) 77 (100) 106 (100) 89 (100)*3 respondents belonged to other combinations. Hence row total and column total are not equal.Percentages are rounded to the nearest integer.
b. Wilderness planning All Bureau of Land National Park U.S. Forest U.S. Fish andLevel of Threats Agencies Management Service Service Wildlife Service - - - - - - - - - - - - - - - - - - - - - - - number (percent)- - - - - - - - - - - - - - - - - - - - - - Very high 71 (20) 15 (20) 24 (31) 17 (16) 15 (17)High 131 (37) 23 (31) 31 (40) 48 (45) 27 (30)Moderate 127 (36) 33 (44) 19 (25) 36 (34) 38 (43)Slight 17 (5) 3 (4) 2 (3) 4 (4) 8 (9)None 2 (1) 1 (1) 0 (0) 1 (1) 0 (0)Not sure 2 (1) 0 (0) 1 (1) 0 (0) 1 (1)Total 350 (100) 75 (100) 77 (100) 106 (100) 89 (100)
c. Visitor use management and monitoring All Bureau of Land National Park U.S. Forest U.S. Fish andLevel of Threats Agencies Management Service Service Wildlife Service - - - - - - - - - - - - - - - - - - - - - - - number (percent)- - - - - - - - - - - - - - - - - - - - - - Very high 92 (26) 17 (23) 26 (34) 33 (31) 15 (17)High 103 (29) 21 (28) 21 (27) 39 (37) 21 (24)Moderate 124 (35) 27 (36) 28 (36) 28 (26) 40 (45)Slight 27 (8) 10 (13) 1 (1) 5 (5) 11 (12)None 2 (1) 0 (0) 0 (0) 1 (1) 1 (1)Not sure 2 (1) 0 (0) 1 (1) 0 (0) 1 (1)Total 350 (100) 75 (100) 77 (100) 106 (100) 89 (100)

60 USDA Forest Service RMRS-GTR-336. 2015.
d. Natural and cultural resources management and monitoring All Bureau of Land National Park U.S. Forest U.S. Fish andLevel of Threats Agencies Management Service Service Wildlife Service - - - - - - - - - - - - - - - - - - - - - - - number (percent)- - - - - - - - - - - - - - - - - - - - - - Very high 69 (20) 10 (13) 27 (35) 15 (14) 14 (16)High 108 (31) 23 (31) 24 (31) 33 (31) 28 (31)Moderate 129 (37) 31 (41) 23 (30) 45 (42) 30 (34)Slight 36 (10 10 (13) 0 (0) 10 (9) 16 (18)None 4 (1) 0 (0) 1 (1) 3 (3) 0 (0)Not sure 4 (1) 1 (1) 2 (3) 0 (0) 1 (1)Total 350 (100) 75 (100) 77 (100) 106 (100) 89 (100)
e. Management skills related to communication, problem-solving, decision-making, and organiza-tional management. All Bureau of Land National Park U.S. Forest U.S. Fish andLevel of Threats Agencies Management Service Service Wildlife Service - - - - - - - - - - - - - - - - - - - - - - - number (percent)- - - - - - - - - - - - - - - - - - - - - - Very high 94 (27) 20 (27) 25 (32) 30 (28) 18 (20)High 104 (30) 22 (29) 19 (25) 35 (33) 27 (30)Moderate 112 (32) 25 (33) 30 (39) 34 (32) 22 (25)Slight 34 (10) 8 (11) 2 (3) 4 (4) 20 (22)None 4 (1) 0 (0) 0 (0) 3 (3) 1 (1)Not sure 2 (1) 0 (0) 1 (1) 0 (0) 1 (1)Total 350 (100) 75 (100) 77 (100) 106 (100) 89 (100)
f. Managing special provisions All Bureau of Land National Park U.S. Forest U.S. Fish andLevel of Threats Agencies Management Service Service Wildlife Service - - - - - - - - - - - - - - - - - - - - - - - number (percent)- - - - - - - - - - - - - - - - - - - - - - Very high 46 (13) 8 (11) 16 (21) 13 (12) 8 (9)High 84 (24) 23 (31) 19 (25) 23 (22) 17 (19)Moderate 149 (43) 28 (37) 31 (40) 48 (45) 42 (47)Slight 52 (15) 12 (16) 7 (9) 12 (11) 21 (24)None 10 (3) 3 (4) 1 (1) 6 (6) 0 (0)Not sure 9 (2) 1 (1) 3 (4) 4 (4) 1 (1)Total 350 (100) 75 (100) 77 (100) 106 (100) 89 (100)
g. Wilderness field skills All Bureau of Land National Park U.S. Forest U.S. Fish andLevel of Threats Agencies Management Service Service Wildlife Service - - - - - - - - - - - - - - - - - - - - - - - number (percent)- - - - - - - - - - - - - - - - - - - - - - Very high 68 (19) 11 (15) 14 (18) 34 (32) 9 (10)High 82 (23) 19 (25) 18 (23) 33 (31) 11 (12)Moderate 119 (34) 29 (39) 28 (36) 26 (25) 34 (38)Slight 66 (19) 13 (17) 14 (18) 11 (10) 28 (31)None 7 (2) 0 (0) 2 (3) 2 (2) 3 (3)Not sure 8 (2) 3 (4) 1 (1) 0 (0) 4 (5)Total 350 (100) 75 (100) 77 (100) 106 (100) 89 (100)

USDA Forest Service RMRS-GTR-336. 2015. 61
Table A3.2—Adequacy and availability of science-based information for decision-making
a. Air quality protectionScience-Based All Bureau of Land National Park U.S. Forest U.S. Fish andInformation Agencies Management Service Service Wildlife Service - - - - - - - - - - - - - - - - - - - - - - - number (percent)- - - - - - - - - - - - - - - - - - - - - - Not adequate 40 (12) 16 (21) 4 (5) 8 (8) 10 (11)Somewhat 70 (20) 20 (27) 14 (18) 19 (18) 17 (20)Moderate 71 (21) 12 (16) 18 (24) 31 (30) 10 (11)Good 78 (23) 9 (12) 27 (36) 22 (21) 19 (22)Excellent 20 (6) 1 (1) 6 (8) 8 (8) 5 (6)Don’t know 65 (19) 17 (23) 7 (9) 15 (15) 26 (30Total* 344 (100) 75 (100) 77 (100) 103 (100) 89 (100)*3 respondents belonged to other combinations. Hence row total and column total are not equal.Percentages are rounded to the nearest integer.
b. Cultural resources protectionScience-Based All Bureau of Land National Park U.S. Forest U.S. Fish andInformation Agencies Management Service Service Wildlife Service - - - - - - - - - - - - - - - - - - - - - - - number (percent)- - - - - - - - - - - - - - - - - - - - - - Not adequate 33 (10) 5 (7) 14 (18) 8 (8) 5 (6)Somewhat 70 (20) 17 (23) 15 (20) 17 (17) 21 (24)Moderate 91 (27) 23 (31) 18 (24) 30 (30) 18 (21)Good 103 (30) 17 (23) 26 (34) 37 (37) 23 (26)Excellent 20 (6) 8 (11) 2 (3) 6 (6) 4 (5)Don’t know 26 (8) 4 (5) 1 (1) 5 (5) 16 (18)Total 343 (100) 74 (100) 76 (100) 103 (100) 87 (100)
c. Fire and fuels managementScience-Based All Bureau of Land National Park U.S. Forest U.S. Fish andInformation Agencies Management Service Service Wildlife Service - - - - - - - - - - - - - - - - - - - - - - - number (percent)- - - - - - - - - - - - - - - - - - - - - - Not adequate 24 (7) 7 (9) 4 (5) 10 (10) 3 (3)Somewhat 52 (15) 11 (15) 12 (16) 18 (18) 11 (13)Moderate 103 (30) 28 (38) 19 (25) 33 (32) 22 (25)Good 98 (29) 17 (23) 26 (34) 29 (28) 25 (29)Excellent 34 (10) 8 (11) 12 (16) 8 (8) 5 (6)Don’t know 31 (9) 3 (4) 3 (4) 4 (4) 21 (24Total 342 (100) 74 (100) 76 (100) 102 (100) 87 (100)
d. Fish and wildlife managementScience-Based All Bureau of Land National Park U.S. Forest U.S. Fish andInformation Agencies Management Service Service Wildlife Service - - - - - - - - - - - - - - - - - - - - - - - number (percent)- - - - - - - - - - - - - - - - - - - - - - Not adequate 15 (4) 3 (4) 2 (3) 8 (8) 2 (2)Somewhat 57 (17) 15 (20) 14 (19) 19 (18) 7 (8)Moderate 104 (30) 25 (33) 25 (33) 31 (30) 22 (25)Good 126 (37) 22 (29) 26 (35) 36 (35) 42 (48)Excellent 22 (6) 6 (8) 6 (8) 4 (4) 6 (7)Don’t know 19 (6) 4 (5) 2 (3) 5 (5) 8 (9)Total 343 (100) 75 (100) 75 (100) 103 (100) 87 (100)
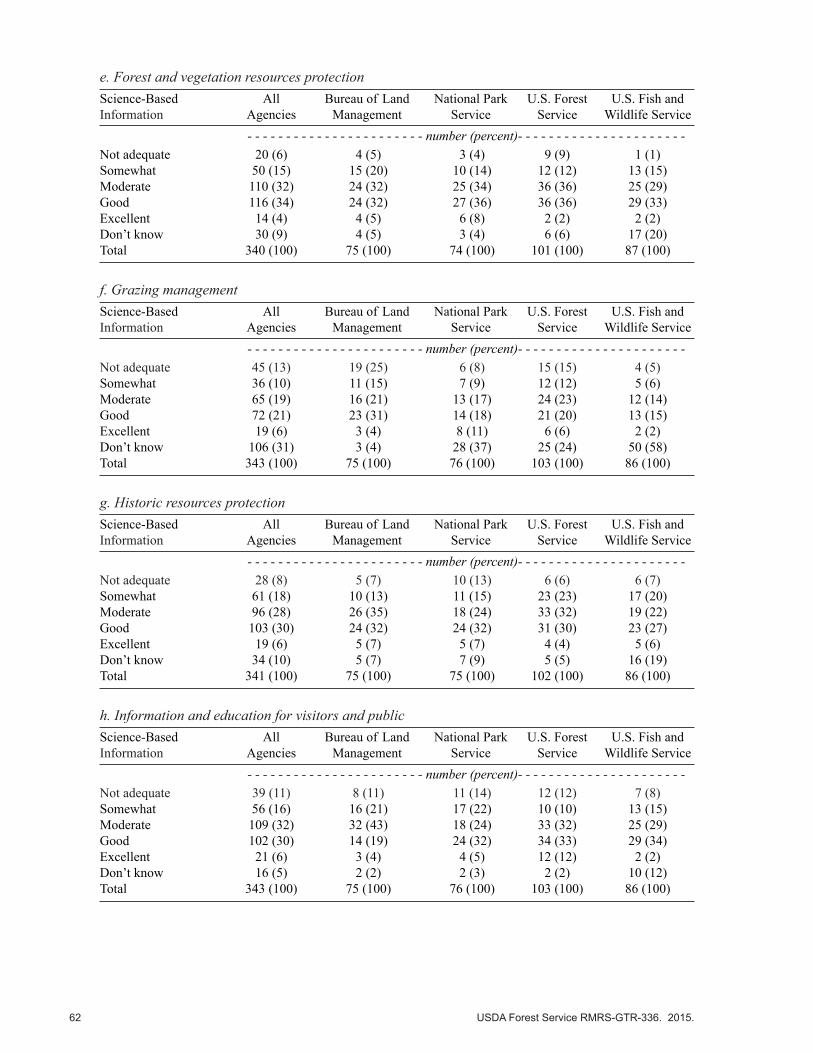
62 USDA Forest Service RMRS-GTR-336. 2015.
e. Forest and vegetation resources protectionScience-Based All Bureau of Land National Park U.S. Forest U.S. Fish andInformation Agencies Management Service Service Wildlife Service - - - - - - - - - - - - - - - - - - - - - - - number (percent)- - - - - - - - - - - - - - - - - - - - - - Not adequate 20 (6) 4 (5) 3 (4) 9 (9) 1 (1)Somewhat 50 (15) 15 (20) 10 (14) 12 (12) 13 (15)Moderate 110 (32) 24 (32) 25 (34) 36 (36) 25 (29)Good 116 (34) 24 (32) 27 (36) 36 (36) 29 (33)Excellent 14 (4) 4 (5) 6 (8) 2 (2) 2 (2)Don’t know 30 (9) 4 (5) 3 (4) 6 (6) 17 (20)Total 340 (100) 75 (100) 74 (100) 101 (100) 87 (100)
f. Grazing managementScience-Based All Bureau of Land National Park U.S. Forest U.S. Fish andInformation Agencies Management Service Service Wildlife Service - - - - - - - - - - - - - - - - - - - - - - - number (percent)- - - - - - - - - - - - - - - - - - - - - - Not adequate 45 (13) 19 (25) 6 (8) 15 (15) 4 (5)Somewhat 36 (10) 11 (15) 7 (9) 12 (12) 5 (6)Moderate 65 (19) 16 (21) 13 (17) 24 (23) 12 (14)Good 72 (21) 23 (31) 14 (18) 21 (20) 13 (15)Excellent 19 (6) 3 (4) 8 (11) 6 (6) 2 (2)Don’t know 106 (31) 3 (4) 28 (37) 25 (24) 50 (58)Total 343 (100) 75 (100) 76 (100) 103 (100) 86 (100)
g. Historic resources protectionScience-Based All Bureau of Land National Park U.S. Forest U.S. Fish andInformation Agencies Management Service Service Wildlife Service - - - - - - - - - - - - - - - - - - - - - - - number (percent)- - - - - - - - - - - - - - - - - - - - - - Not adequate 28 (8) 5 (7) 10 (13) 6 (6) 6 (7)Somewhat 61 (18) 10 (13) 11 (15) 23 (23) 17 (20)Moderate 96 (28) 26 (35) 18 (24) 33 (32) 19 (22)Good 103 (30) 24 (32) 24 (32) 31 (30) 23 (27)Excellent 19 (6) 5 (7) 5 (7) 4 (4) 5 (6)Don’t know 34 (10) 5 (7) 7 (9) 5 (5) 16 (19)Total 341 (100) 75 (100) 75 (100) 102 (100) 86 (100)
h. Information and education for visitors and publicScience-Based All Bureau of Land National Park U.S. Forest U.S. Fish andInformation Agencies Management Service Service Wildlife Service - - - - - - - - - - - - - - - - - - - - - - - number (percent)- - - - - - - - - - - - - - - - - - - - - - Not adequate 39 (11) 8 (11) 11 (14) 12 (12) 7 (8)Somewhat 56 (16) 16 (21) 17 (22) 10 (10) 13 (15)Moderate 109 (32) 32 (43) 18 (24) 33 (32) 25 (29)Good 102 (30) 14 (19) 24 (32) 34 (33) 29 (34)Excellent 21 (6) 3 (4) 4 (5) 12 (12) 2 (2)Don’t know 16 (5) 2 (2) 2 (3) 2 (2) 10 (12)Total 343 (100) 75 (100) 76 (100) 103 (100) 86 (100)

USDA Forest Service RMRS-GTR-336. 2015. 63
i. Managing field staffScience-Based All Bureau of Land National Park U.S. Forest U.S. Fish andInformation Agencies Management Service Service Wildlife Service - - - - - - - - - - - - - - - - - - - - - - - number (percent)- - - - - - - - - - - - - - - - - - - - - - Not adequate 49 (14) 13 (17) 11 (14) 14 (14) 10 (12)Somewhat 76 (22) 21 (28) 19 (25) 18 (18) 16 (19)Moderate 84 (25) 16 (21) 16 (21) 32 (31) 20 (24)Good 91 (27) 17 (23) 20 (26) 32 (31) 22 (26)Excellent 12 (4) 3 (4) 3 (4) 3 (3) 3 (4)Don’t know 29 (8) 5 (7) 7 (9) 3 (3) 14 (16)Total 341 (100) 75 (100) 76 (100) 102 (100) 85 (100)
j. Scenic quality protectionScience-Based All Bureau of Land National Park U.S. Forest U.S. Fish andInformation Agencies Management Service Service Wildlife Service - - - - - - - - - - - - - - - - - - - - - - - number (percent)- - - - - - - - - - - - - - - - - - - - - - Not adequate 41 (12) 9 (12) 10 (14) 11 (11) 9 (11)Somewhat 80 (24) 24 (32) 22 (30) 18 (18) 16 (19)Moderate 97 (29) 24 (32) 19 (26) 33 (33) 21 (25)Good 72 (21) 13 (18) 12 (16) 27 (27) 20 (23)Excellent 12 (4) 3 (4) 4 (5) 3 (3) 2 (2)Don’t know 35 (10) 1 (1) 7 (9) 9 (9) 17 (20)Total 337 (100) 74 (100) 74 (100) 101 (100) 85 (100)
k. Visitor management (controlling use, managing conflict, mitigating impacts, etc.)Science-Based All Bureau of Land National Park U.S. Forest U.S. Fish andInformation Agencies Management Service Service Wildlife Service - - - - - - - - - - - - - - - - - - - - - - - number (percent)- - - - - - - - - - - - - - - - - - - - - - Not adequate 46 (13) 10 (13) 9 (12) 12 (12) 14 (16)Somewhat 77 (22) 20 (27) 25 (33) 17 (17) 15 (17)Moderate 105 (31) 23 (31) 22 (29) 40 (39) 19 (22)Good 75 (22) 14 (19) 15 (20) 23 (22) 22 (25)Excellent 16 (5) 5 (7) 2 (3) 6 (6) 3 (3)Don’t know 24 (7) 3 (4) 3 (4) 4 (4) 14 (16)Total 343 (100) 75 (100) 76 (100) 102 (100) 87 (100)
l. Water resources protectionScience-Based All Bureau of Land National Park U.S. Forest U.S. Fish andInformation Agencies Management Service Service Wildlife Service - - - - - - - - - - - - - - - - - - - - - - - number (percent)- - - - - - - - - - - - - - - - - - - - - - Not adequate 35 (10) 9 (12) 5 (7) 6 (6) 14 (16)Somewhat 65 (19) 16 (21) 16 (21) 18 (18) 13 (15)Moderate 93 (27) 24 (32) 17 (22) 35 (34) 17 (20)Good 89 (26) 13 (17) 26 (34) 29 (28) 21 (24)Excellent 18 (5) 4 (5) 7 (9) 5 (5) 2 (2)Don’t know 43 (13) 9 (12) 5 (7) 9 (9) 20 (23)Total 343 (100) 75 (100) 76 (100) 102 (100) 87 (100)

64 USDA Forest Service RMRS-GTR-336. 2015.
m. Wilderness monitoring protocolScience-Based All Bureau of Land National Park U.S. Forest U.S. Fish andInformation Agencies Management Service Service Wildlife Service - - - - - - - - - - - - - - - - - - - - - - - number (percent)- - - - - - - - - - - - - - - - - - - - - - Not adequate 51 (15) 8 (11) 17 (22) 14 (14) 11 (13)Somewhat 65 (19) 18 (24) 19 (25) 15 (15) 13 (15)Moderate 80 (24) 17 (23) 22 (29) 23 (23) 18 (21)Good 105 (31) 26 (35) 13 (17) 37 (37) 28 (33)Excellent 21 (6) 4 (5) 4 (5) 9 (9) 3 (4)Don’t know 18 (5) 2 (3) 1 (1) 3 (3) 12 (14)Total 340 (100) 75 (100) 76 (100) 101 (100) 85 (100)
n. Wilderness planningScience-Based All Bureau of Land National Park U.S. Forest U.S. Fish andInformation Agencies Management Service Service Wildlife Service - - - - - - - - - - - - - - - - - - - - - - - number (percent)- - - - - - - - - - - - - - - - - - - - - - Not adequate 38 (11) 6 (8) 13 (17) 12 (12) 6 (7)Somewhat 76 (22) 17 (23) 18 (24) 23 (23) 18 (21)Moderate 101 (30) 23 (31) 18 (24) 33 (32) 27 (32)Good 96 (28) 25 (33) 24 (32) 29 (29) 16 (19)Excellent 9 (3) 1 (1) 3 (4) 2 (3) 3 (4)Don’t know 20 (6) 3 (4) 0 (0) 2 (2) 15 (18)Total 340 (100) 75 (100) 76 (100) 101 (100) 85 (100)
o. Public attitudes toward intervention to adapt to climate change influencesScience-Based All Bureau of Land National Park U.S. Forest U.S. Fish andInformation Agencies Management Service Service Wildlife Service - - - - - - - - - - - - - - - - - - - - - - - number (percent)- - - - - - - - - - - - - - - - - - - - - - Not adequate 104 (31) 27 (36) 25 (34) 28 (28) 22 (26)Somewhat 89 (27) 22 (29) 16 (22) 28 (28) 23 (27)Moderate 35 (10) 3 (4) 10 (14) 9 (9) 12 (14)Good 14 (4) 4 (5) 6 (8) 2 (2) 2 (3)Excellent 2 (1) 0 (0) 0 (0) 0 (0) 2 (3)Don’t know 91 (27) 19 (25) 16 (22) 33 (33) 23 (27)Total 335 (100) 75 (100) 73 (100) 100 (100) 84 (100)
p. Public attitudes toward ecological restoration (fire, vegetation, wildlife, etc.) activitiesScience-Based All Bureau of Land National Park U.S. Forest U.S. Fish andInformation Agencies Management Service Service Wildlife Service - - - - - - - - - - - - - - - - - - - - - - - number (percent)- - - - - - - - - - - - - - - - - - - - - - Not adequate 79 (23) 19 (25) 12 (16) 29 (28) 18 (21)Somewhat 100 (29) 26 (35) 30 (40) 26 (25) 18 (21)Moderate 63 (19) 13 (17) 10 (13) 20 (20) 18 (21)Good 35 (10) 5 (7) 10 (13) 8 (8) 12 (14)Excellent 5 (1) 4 (5) 0 (0) 0 (0) 1 (1)Don’t know 58 (17) 8 (11) 13 (18) 19 (19) 18 (21)Total 340 (100) 75 (100) 75 (100) 102 (100) 85 (100)

USDA Forest Service RMRS-GTR-336. 2015. 65
q. Relative value of wilderness benefits to stakeholder groupsScience-Based All Bureau of Land National Park U.S. Forest U.S. Fish andInformation Agencies Management Service Service Wildlife Service - - - - - - - - - - - - - - - - - - - - - - - number (percent)- - - - - - - - - - - - - - - - - - - - - - Not adequate 74 (22) 18 (25) 15 (20) 20 (20) 19 (22)Somewhat 100 (29) 22 (30) 25 (33) 28 (27) 25 (29)Moderate 69 (20) 11 (15) 16 (21) 26 (25) 16 (19)Good 46 (14) 16 (22) 8 (11) 14 (14) 8 (9)Excellent 5 (1) 0 (0) 2 (3) 2 (2) 1 (1)Don’t know 46 (14) 6 (8) 10 (13) 12 (12) 17 (20)Total 340 (100) 73 (100) 76 (100) 102 (100) 86 (100)
r. Managing subsistence activities and resourcesScience-Based All Bureau of Land National Park U.S. Forest U.S. Fish andInformation Agencies Management Service Service Wildlife Service - - - - - - - - - - - - - - - - - - - - - - - number (percent)- - - - - - - - - - - - - - - - - - - - - - Not adequate 25 (7) 5 (7) 5 (7) 6 (6) 9 (11)Somewhat 75 (22) 16 (22) 22 (29) 25 (25) 12 (14)Moderate 57 (17) 13 (18) 11 (15) 19 (19) 12 (14)Good 32 (9) 10 (14) 6 (8) 6 (6) 10 (12)Excellent 5 (1) 1 (1) 3 (4) 0 (0) 1 (1)Don’t know 144 (43) 28 (38) 28 (37) 46 (45) 41 (48)Total 338 (100) 73 (100) 75 (100) 102 (100) 85 (100)
s. Stewardship of spiritual values and usesScience-Based All Bureau of Land National Park U.S. Forest U.S. Fish andInformation Agencies Management Service Service Wildlife Service - - - - - - - - - - - - - - - - - - - - - - - number (percent)- - - - - - - - - - - - - - - - - - - - - - Not adequate 84 (24) 21 (28) 18 (24) 24 (23) 19 (22)Somewhat 67 (20) 18 (24) 21 (28) 17 (17) 10 (12)Moderate 58 (17) 12 (16) 13 (17) 22 (22) 11 (13)Good 27 (8) 6 (8) 6 (8) 9 (9) 6 (7)Excellent 1 (0) 1 (1) 0 (0) 0 (0) 0 (0)Don’t know 105 (31) 14 (23) 18 (24) 30 (29) 40 (47)Total 342 (100) 75 (100) 76 (100) 102 (100) 85 (100)

66 USDA Forest Service RMRS-GTR-336. 2015.
Appendix 4. Accomplishment of the 1995 NWPS Strategic Plan Objectives
Table A4.1—Preservation of natural and biological values
a. Manage wilderness within the context of larger landscapes to ensure the protection and integrity of natural and biological processesLevel of All Bureau of Land National Park U.S. Forest U.S. Fish andAccomplishment Agencies Management Service Service Wildlife Service - - - - - - - - - - - - - - - - - - - - - - - number (percent)- - - - - - - - - - - - - - - - - - - - - - None 3 (2) 0 (0) 2 (6) 1 (2) 0 (0)Slight 37 (24) 10 (27) 3 (9) 19 (35) 4 (15)Moderate 61 (39) 16 (43) 14 (40) 21 (38) 9 (35)High 28 (18) 7 (19) 8 (23) 7 (13) 6 (23)Very high 13 (8) 3 (8) 4 (11) 3 (5) 3 (12)Don’t know or N/A 14 (9) 1 (3) 4 (11) 4 (7) 4 (15)Total 156 (100) 37 (100) 35 (100) 55 (100) 26 (100)
b. Inventory wilderness ecosystems to collect baseline data. Identify indicators and develop monitor-ing standards for those elements critical to ecological integrity. Develop monitoring strategies for high priority indicators and provide feedback for adaptive management. Where appropriate, estab-lish long-term research programs.Level of All Bureau of Land National Park U.S. Forest U.S. Fish andAccomplishment Agencies Management Service Service Wildlife Service - - - - - - - - - - - - - - - - - - - - - - - number (percent)- - - - - - - - - - - - - - - - - - - - - - None 8 (5) 3 (8) 1 (3) 3 (5) 0 (0)Slight 55 (35) 13 (35) 13 (37) 21 (38) 8 (31)Moderate 51 (33) 12 (32) 10 (29) 20 (36) 9 (35)High 21 (13) 4 (11) 5 (14) 5 (9) 6 (23)Very high 9 (6) 3 (8) 3 (9) 3 (5) 0 (0)Don’t know or N/A 12 (8) 2 (5) 3 (9) 3 (5) 3 (12)Total 156 (100) 37 (100) 35 (100) 55 (100) 26 (100)
c. Restore wilderness ecosystems damaged by humans to the degree feasible. Identify the processes needed to assess, restore, or mitigate human-induced change.Level of All Bureau of Land National Park U.S. Forest U.S. Fish andAccomplishment Agencies Management Service Service Wildlife Service - - - - - - - - - - - - - - - - - - - - - - - number (percent)- - - - - - - - - - - - - - - - - - - - - - None 6 (4) 0 (0) 1 (3) 3 (5) 1 (4)Slight 54 (35) 15 (41) 7 (20) 24 (44) 8 (31)Moderate 57 (37) 12 (32) 19 (54) 16 (29) 9 (35)High 19 (12) 5 (14) 5 (14) 6 (11) 3 (31)Very high 7 (4) 4 (11) 0 (0) 3 (5) 0 (0)Don’t know or N/A 13 (8) 1 (3) 3 (9) 3 (5) 5 (19)Total 156 (100) 37 (100) 35 (100) 55 (100) 26 (100)

USDA Forest Service RMRS-GTR-336. 2015. 67
d. Restore fire to its natural role in the ecosystem.Level of All Bureau of Land National Park U.S. Forest U.S. Fish andAccomplishment Agencies Management Service Service Wildlife Service - - - - - - - - - - - - - - - - - - - - - - - number (percent)- - - - - - - - - - - - - - - - - - - - - - None 13 (8) 5 (14) 2 (6) 6 (11) 0 (0)Slight 54 (35) 13 (35) 10 (29) 20 (36) 9 (35)Moderate 48 (31) 12 (32) 11 (31) 19 (35) 6 (23)High 18 (12) 2 (5) 8 (23) 6 (11) 2 (8)Very high 6 (4) 3 (8) 0 (0) 1 (2) 2 (8)Don’t know or N/A 17 (11) 2 (5) 4 (11) 3 (5) 7 (27)Total 156 (100) 37 (100) 35 (100) 55 (100) 26 (100)
e. Implement integrated exotic plant and animal management which includes preservation, educa-tion, detection, quick elimination of spot infestations, and control of major occurrences.Level of All Bureau of Land National Park U.S. Forest U.S. Fish andAccomplishment Agencies Management Service Service Wildlife Service - - - - - - - - - - - - - - - - - - - - - - - number (percent)- - - - - - - - - - - - - - - - - - - - - - None 5 (3) 3 (8) 0 (0) 2 (4) 0 (0)Slight 46 (30) 13 (35) 10 (29) 17 (31) 5 (19)Moderate 55 (35) 11 (30) 13 (37) 21 (38) 10 (38)High 24 (15) 4 (11) 7 (20) 7 (13) 6 (23)Very high 10 (6) 4 (11) 2 (6) 3 (5) 1 (4)Don’t know or N/A 16 (10) 2 (5) 3 (9) 5 (9) 4 (15)Total 156 (100) 37 (100) 35 (100) 55 (100) 26 (100)
f. Exchange, purchase, or retire uses adversely affecting wilderness values where rights-holders are willing.Level of All Bureau of Land National Park U.S. Forest U.S. Fish andAccomplishment Agencies Management Service Service Wildlife Service - - - - - - - - - - - - - - - - - - - - - - - number (percent)- - - - - - - - - - - - - - - - - - - - - - None 6 (4) 2 (5) 2 (6) 2 (4) 0 (0)Slight 41 (26) 8 (22) 8 (23) 21 (38) 4 (16)Moderate 41 (26) 13 (35) 6 (17) 14 (25) 8 (31)High 19 (12) 5 (14) 4 (11) 7 (13) 2 (8)Very high 6 (4) 3 (8) 2 (6) 1 (2) 0 (0)Don’t know or N/A 43 (28) 6 (16) 13 (37) 10 (18) 12 (46)Total 156 (100) 37 (100) 35 (100) 55 (100) 26 (100)
g. Pursue acquisition or exchange of inholdings, subsurface rights, and adjacent lands critical to wil-derness protection.Level of All Bureau of Land National Park U.S. Forest U.S. Fish andAccomplishment Agencies Management Service Service Wildlife Service - - - - - - - - - - - - - - - - - - - - - - - number (percent)- - - - - - - - - - - - - - - - - - - - - - None 4 (3) 1 (3) 0 (0) 3 (5) 0 (0)Slight 39 (25) 8 (22) 11 (31) 15 (27) 5 (19)Moderate 45 (29) 12 (32) 6 (17) 19 (35) 8 (31)High 18 (12) 7 (19) 3 (9) 3 (5) 4 (15)Very high 12 (8) 6 (16) 2 (6) 4 (7) 0 (0)Don’t know or N/A 38 (24) 3 (8) 13 (37) 11 (20) 9 (35)Total 156 (100) 37 (100) 35 (100) 55 (100) 26 (100)

68 USDA Forest Service RMRS-GTR-336. 2015.
Table A4.2—Management of social values
a. Evaluate all existing and proposed structures and installations to minimize the impact on wilder-ness valuesLevel of All Bureau of Land National Park U.S. Forest U.S. Fish andAccomplishment Agencies Management Service Service Wildlife Service - - - - - - - - - - - - - - - - - - - - - - - number (percent)- - - - - - - - - - - - - - - - - - - - - - None 5 (3) 1 (3) 0 (0) 3 (5) 1 (4)Slight 43 (28) 14 (38) 8 (23) 15 (27) 5 (19)Moderate 62 (40) 9 (24) 19 (54) 25 (45) 8 (31)High 22 (14) 8 (22) 5 (14) 5 (9) 4 (15)Very high 5 (3) 1 (3) 1 (3) 1 (2) 2 (8)Don’t know or N/A 19 (12) 4 (11) 2 (6) 6 (11) 6 (23)Total 156 (100) 37 (100) 35 (100) 55 (100) 26 (100)
b. Emphasize opportunities outside wilderness for recreation activities that are not dependent on a wilderness settingLevel of All Bureau of Land National Park U.S. Forest U.S. Fish andAccomplishment Agencies Management Service Service Wildlife Service - - - - - - - - - - - - - - - - - - - - - - - number (percent)- - - - - - - - - - - - - - - - - - - - - - None 3 (2) 2 (5) 0 (0) 1 (2) 0 (0)Slight 30 (19) 5 (14) 9 (26) 13 (24) 3 (12)Moderate 68 (44) 16 (43) 16 (46) 25 (45) 10 (38)High 29 (19) 9 (24) 5 (14) 10 (18) 5 (19)Very high 6 (4) 3 (8) 1 (3) 2 (4) 0 (0)Don’t know or N/A 20 (13) 2 (5) 4 (11) 4 (7) 8 (31)Total 156 (100) 37 (100) 35 (100) 55 (100) 26 (100)
c. Coordinate with neighboring agencies and interests on wilderness use restrictions (such as camp-site and fire regulations) and on the establishment of policies for limits such as group size and num-bers of packstockLevel of All Bureau of Land National Park U.S. Forest U.S. Fish andAccomplishment Agencies Management Service Service Wildlife Service - - - - - - - - - - - - - - - - - - - - - - - number (percent)- - - - - - - - - - - - - - - - - - - - - - None 8 (5) 3 (8) 2 (6) 3 (5) 0 (0)Slight 44 (28) 8 (22) 11 (31) 16 (29) 7 (27)Moderate 50 (32) 17 (46) 9 (26) 20 (36) 4 (15)High 26 (17) 6 (16) 8 (23) 8 (15) 4 (15)Very high 5 (3) 1 (3) 1 (3) 3 (5) 0 (0)Don’t know or N/A 23 (15) 2 (5) 4 (11) 5 (9) 11 (42)Total 156 (100) 37 (100) 35 (100) 55 (100) 26 (100)

USDA Forest Service RMRS-GTR-336. 2015. 69
d. Coordinate with Department of Defense agencies and the Federal Aviation Administration to develop procedures and guidelines to avoid or mitigate low-level overflightsLevel of All Bureau of Land National Park U.S. Forest U.S. Fish andAccomplishment Agencies Management Service Service Wildlife Service - - - - - - - - - - - - - - - - - - - - - - - number (percent)- - - - - - - - - - - - - - - - - - - - - - None 31 (20) 13 (35) 3 (9) 13 (24) 2 (8)Slight 54 (35) 12 (32) 13 (37) 19 (35) 8 (31)Moderate 30 (19) 5 (14) 8 (23) 12 (22) 5 (19)High 17 (11) 3 (8) 6 (17) 6 (11) 2 (8)Very high 3 (2) 1 (3) 2 (6) 0 (0) 0 (0)Don’t know or N/A 21 (13) 3 (8) 3 (9) 5 (9) 9 (35)Total 156 (100) 37 (100) 35 (100) 55 (100) 26 (100)
e. Develop, identify, and distribute information on new or evolving recreation management tools and techniquesLevel of All Bureau of Land National Park U.S. Forest U.S. Fish andAccomplishment Agencies Management Service Service Wildlife Service - - - - - - - - - - - - - - - - - - - - - - - number (percent)- - - - - - - - - - - - - - - - - - - - - - None 10 (6) 2 (5) 1 (3) 5 (9) 2 (8)Slight 42 (27) 7 (19) 11 (31) 14 (25) 10 (38)Moderate 56 (36) 19 (51) 12 (34) 20 (36) 4 (15)High 27 (17) 4 (11) 5 (14) 13 (24) 4 (15)Very high 5 (3) 3 (8) 1 (3) 1 (2) 0 (0)Don’t know or N/A 16 (10) 2 (5) 5 (14) 2 (4) 6 (23)Total 156 (100) 37 (100) 35 (100) 55 (100) 26 (100)
f. Establish an interagency national information network to provide wilderness information for public and agency useLevel of All Bureau of Land National Park U.S. Forest U.S. Fish andAccomplishment Agencies Management Service Service Wildlife Service - - - - - - - - - - - - - - - - - - - - - - - number (percent)- - - - - - - - - - - - - - - - - - - - - - None 6 (4) 1 (3) 2 (6) 2 (4) 1 (4)Slight 21 (13) 4 (11) 6 (17) 10 (18) 1 (4)Moderate 40 (26) 8 (22) 10 (29) 16 (29) 5 (19)High 37 (24) 9 (24) 7 (20) 14 (25) 7 (27)Very high 32 (21) 12 (32) 5 (14) 9 (16) 5 (19)Don’t know or N/A 20 (13) 3 (8) 5 (14) 4 (7) 7 (27)Total 156 (100) 37 (100) 35 (100) 55 (100) 26 (100)
g. Assess impacts of new and emerging technologies on traditional wilderness values. Develop public information and education programs to address these effects and mitigate any unacceptable impactsLevel of All Bureau of Land National Park U.S. Forest U.S. Fish andAccomplishment Agencies Management Service Service Wildlife Service - - - - - - - - - - - - - - - - - - - - - - - number (percent)- - - - - - - - - - - - - - - - - - - - - - None 17 (11) 4 (11) 3 (9) 7 (13) 2 (8)Slight 65 (42) 18 (49) 14 (40) 23 (42) 9 (35)Moderate 45 (29) 9 (24) 12 (34) 18 (33) 6 (23)High 7 (4) 2 (5) 1 (3) 2 (4) 2 (8)Very high 5 (3) 2 (5) 1 (3) 2 (4) 0 (0)Don’t know or N/A 17 (11) 2 (5) 4 (11) 3 (5) 7 (27)Total 156 (100) 37 (100) 35 (100) 55 (100) 26 (100)
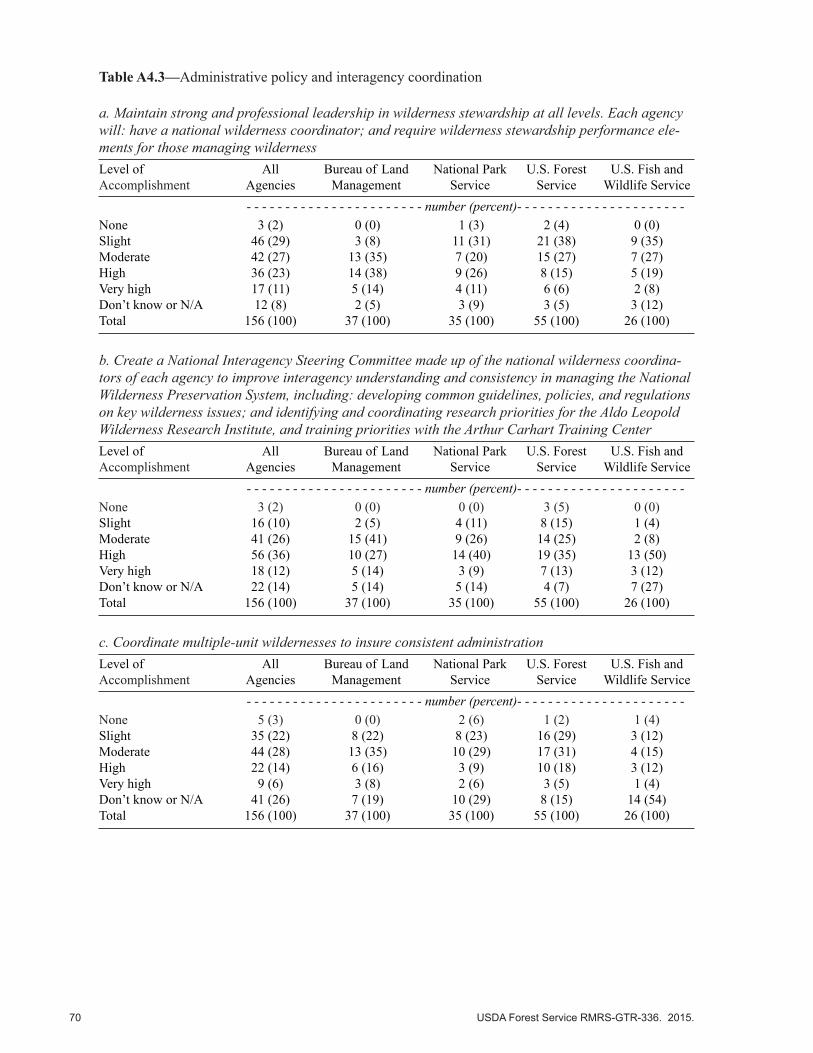
70 USDA Forest Service RMRS-GTR-336. 2015.
Table A4.3—Administrative policy and interagency coordination
a. Maintain strong and professional leadership in wilderness stewardship at all levels. Each agency will: have a national wilderness coordinator; and require wilderness stewardship performance ele-ments for those managing wildernessLevel of All Bureau of Land National Park U.S. Forest U.S. Fish andAccomplishment Agencies Management Service Service Wildlife Service - - - - - - - - - - - - - - - - - - - - - - - number (percent)- - - - - - - - - - - - - - - - - - - - - - None 3 (2) 0 (0) 1 (3) 2 (4) 0 (0)Slight 46 (29) 3 (8) 11 (31) 21 (38) 9 (35)Moderate 42 (27) 13 (35) 7 (20) 15 (27) 7 (27)High 36 (23) 14 (38) 9 (26) 8 (15) 5 (19)Very high 17 (11) 5 (14) 4 (11) 6 (6) 2 (8)Don’t know or N/A 12 (8) 2 (5) 3 (9) 3 (5) 3 (12)Total 156 (100) 37 (100) 35 (100) 55 (100) 26 (100)
b. Create a National Interagency Steering Committee made up of the national wilderness coordina-tors of each agency to improve interagency understanding and consistency in managing the National Wilderness Preservation System, including: developing common guidelines, policies, and regulations on key wilderness issues; and identifying and coordinating research priorities for the Aldo Leopold Wilderness Research Institute, and training priorities with the Arthur Carhart Training CenterLevel of All Bureau of Land National Park U.S. Forest U.S. Fish andAccomplishment Agencies Management Service Service Wildlife Service - - - - - - - - - - - - - - - - - - - - - - - number (percent)- - - - - - - - - - - - - - - - - - - - - - None 3 (2) 0 (0) 0 (0) 3 (5) 0 (0)Slight 16 (10) 2 (5) 4 (11) 8 (15) 1 (4)Moderate 41 (26) 15 (41) 9 (26) 14 (25) 2 (8)High 56 (36) 10 (27) 14 (40) 19 (35) 13 (50)Very high 18 (12) 5 (14) 3 (9) 7 (13) 3 (12)Don’t know or N/A 22 (14) 5 (14) 5 (14) 4 (7) 7 (27)Total 156 (100) 37 (100) 35 (100) 55 (100) 26 (100)
c. Coordinate multiple-unit wildernesses to insure consistent administrationLevel of All Bureau of Land National Park U.S. Forest U.S. Fish andAccomplishment Agencies Management Service Service Wildlife Service - - - - - - - - - - - - - - - - - - - - - - - number (percent)- - - - - - - - - - - - - - - - - - - - - - None 5 (3) 0 (0) 2 (6) 1 (2) 1 (4)Slight 35 (22) 8 (22) 8 (23) 16 (29) 3 (12)Moderate 44 (28) 13 (35) 10 (29) 17 (31) 4 (15)High 22 (14) 6 (16) 3 (9) 10 (18) 3 (12)Very high 9 (6) 3 (8) 2 (6) 3 (5) 1 (4)Don’t know or N/A 41 (26) 7 (19) 10 (29) 8 (15) 14 (54)Total 156 (100) 37 (100) 35 (100) 55 (100) 26 (100)

USDA Forest Service RMRS-GTR-336. 2015. 71
d. Expand the emphasis of research to include natural and biological wilderness resources, and psy-chological and social valuesLevel of All Bureau of Land National Park U.S. Forest U.S. Fish andAccomplishment Agencies Management Service Service Wildlife Service - - - - - - - - - - - - - - - - - - - - - - - number (percent)- - - - - - - - - - - - - - - - - - - - - - None 6 (4) 2 (5) 1 (3) 2 (4) 1 (4)Slight 46 (29) 14 (38) 9 (26) 13 (24) 8 (31)Moderate 53 (34) 11 (30) 15 (43) 22 (40) 5 (19)High 19 (12) 2 (5) 4 (11) 8 (15) 5 (19)Very high 6 (4) 3 (8) 2 (6) 1 (2) 0 (0)Don’t know or N/A 26 (17) 5 (14) 4 (11) 9 (16) 7 (27)Total 156 (100) 37 (100) 35 (100) 55 (100) 26 (100)
e. Aggressively seek new partnerships with diverse groups to support wilderness values and goalsLevel of All Bureau of Land National Park U.S. Forest U.S. Fish andAccomplishment Agencies Management Service Service Wildlife Service - - - - - - - - - - - - - - - - - - - - - - - number (percent)- - - - - - - - - - - - - - - - - - - - - - None 5 (3) 1 (3) 1 (3) 2 (4) 1 (4)Slight 49 (31) 11 (30) 9 (26) 18 (33) 10 (38)Moderate 51 (33) 16 (43) 13 (37) 15 (27) 6 (23)High 15 (10) 2 (5) 3 (9) 8 (15) 2 (8)Very high 12 (8) 4 (11) 2 (6) 6 (11) 0 (0)Don’t know or N/A 24 (15) 3 (8) 7 (20) 6 (11) 7 (27)Total 156 (100) 37 (100) 35 (100) 55 (100) 26 (100)
f. Participate in local government planning efforts to represent the wilderness resourceLevel of All Bureau of Land National Park U.S. Forest U.S. Fish andAccomplishment Agencies Management Service Service Wildlife Service - - - - - - - - - - - - - - - - - - - - - - - number (percent)- - - - - - - - - - - - - - - - - - - - - - None 13 (8) 4 (11) 3 (9) 4 (7) 2 (8)Slight 68 (44) 19 (51) 9 (26) 29 (53) 11 (42)Moderate 28 (18) 5 (14) 11 (31) 5 (9) 6 (23)High 15 (10) 5 (14) 5 (14) 4 (7) 1 (4)Very high 8 (5) 2 (5) 0 (0) 6 (11) 0 (0)Don’t know or N/A 24 (15) 2 (5) 7 (20) 7 (13) 6 (23)Total 156 (100) 37 (100) 35 (100) 55 (100) 26 (100)
g. Ensure fiscal accountability in the budget process by identifying & tracking funding sources & ac-complishments in the wilderness programLevel of All Bureau of Land National Park U.S. Forest U.S. Fish andAccomplishment Agencies Management Service Service Wildlife Service - - - - - - - - - - - - - - - - - - - - - - - number (percent)- - - - - - - - - - - - - - - - - - - - - - None 19 (12) 3 (8) 3 (9) 6 (11) 6 (23)Slight 47 (30) 10 (27) 11 (31) 20 (36) 6 (23)Moderate 31 (20) 10 (27) 7 (20) 11 (20) 3 (12)High 25 (16) 11 (30) 4 (11) 8 (15) 2 (8)Very high 8 (5) 2 (5) 1 (3) 5 (9) 0 (0)Don’t know or N/A 26 (17) 1 (3) 9 (26) 5 (9) 9 (35)Total 156 (100) 37 (100) 35 (100) 55 (100) 26 (100)

72 USDA Forest Service RMRS-GTR-336. 2015.
h. Allow flexible spending of fire funding to cover prescribed fireLevel of All Bureau of Land National Park U.S. Forest U.S. Fish andAccomplishment Agencies Management Service Service Wildlife Service - - - - - - - - - - - - - - - - - - - - - - - number (percent)- - - - - - - - - - - - - - - - - - - - - - None 17 (11) 4 (11) 3 (9) 8 (15) 1 (4)Slight 32 (21) 5 (14) 8 (23) 15 (27) 4 (15)Moderate 34 (22) 8 (22) 7 (20) 10 (18) 9 (35)High 6 (4) 1 (3) 3 (9) 0 (0) 2 (8)Very high 3 (2) 0 (0) 0 (0) 3 (5) 0 (0)Don’t know or N/A 64 (41) 19 (51) 14 (40) 19 (35) 10 (38)Total 156 (100) 37 (100) 35 (100) 55 (100) 26 (100)
Table A4.4—Training of agency personnel
a. Identify the core competencies required for wilderness rangers, wilderness managers, and line of-ficers with wilderness management responsibilities. Identify tools, methods, and techniques to master the needed abilitiesLevel of All Bureau of Land National Park U.S. Forest U.S. Fish andAccomplishment Agencies Management Service Service Wildlife Service - - - - - - - - - - - - - - - - - - - - - - - number (percent)- - - - - - - - - - - - - - - - - - - - - - None 11 (7) 2 (5) 2 (6) 4 (7) 3 (12)Slight 31 (20) 9 (24) 11 (31) 9 (16) 2 (8)Moderate 58 (37) 11 (30) 11 (31) 22 (40) 13 (50)High 39 (25) 10 (27) 8 (23) 15 (27) 6 (23)Very high 9 (6) 3 (8) 2 (6) 3 (5) 0 (0)Don’t know or N/A 8 (5) 2 (5) 1 (3) 2 (4) 2 (8)Total 156 (100) 37 (100) 35 (100) 55 (100) 26 (100)
b. Integrate wilderness into other program training and vice versa. Develop basic wilderness orien-tation training for presentation to all agency personnelLevel of All Bureau of Land National Park U.S. Forest U.S. Fish andAccomplishment Agencies Management Service Service Wildlife Service - - - - - - - - - - - - - - - - - - - - - - - number (percent)- - - - - - - - - - - - - - - - - - - - - - None 8 (5) 1 (3) 2 (6) 4 (7) 1 (4)Slight 70 (45) 18 (49) 13 (37) 25 (45) 12 (46)Moderate 49 (31) 13 (35) 11 (31) 17 (31) 8 (31)High 14 (9) 2 (5) 7 (20) 3 (5) 2 (8)Very high 7 (5) 3 (8) 0 (0) 4 (7) 0 (0)Don’t know or N/A 8 (5) 0 (0) 2 (6) 2 (4) 3 (12)Total 156 (100) 37 (100) 35 (100) 55 (100) 26 (100)

USDA Forest Service RMRS-GTR-336. 2015. 73
c. Develop common understanding and training on wilderness principles such as the minimum tool conceptLevel of All Bureau of Land National Park U.S. Forest U.S. Fish andAccomplishment Agencies Management Service Service Wildlife Service - - - - - - - - - - - - - - - - - - - - - - - number (percent)- - - - - - - - - - - - - - - - - - - - - - None 3 (2) 0 (0) 1 (3) 1 (2) 1 (4)Slight 42 (27) 13 (35) 9 (26) 14 (25) 6 (23)Moderate 61 (39) 12 (32) 14 (40) 23 (42) 10 (38)High 35 (22) 8 (22) 7 (20) 14 (25) 6 (23)Very high 10 (6) 4 (11) 3 (9) 2 (4) 1 (4)Don’t know or N/A 5 (3) 0 (0) 1 (3) 1 (2) 2 (8)Total 156 (100) 37 (100) 35 (100) 55 (100) 26 (100)
d. Continue to develop, utilize, and support wilderness training programsLevel of All Bureau of Land National Park U.S. Forest U.S. Fish andAccomplishment Agencies Management Service Service Wildlife Service - - - - - - - - - - - - - - - - - - - - - - - number (percent)- - - - - - - - - - - - - - - - - - - - - - None 2 (1) 0 (0) 0 (0) 1 (2) 1 (4)Slight 37 (24) 8 (22) 8 (23) 17 (31) 4 (15)Moderate 70 (45) 16 (43) 20 (57) 21 (38) 11 (42)High 30 (19) 8 (22) 3 (9) 12 (22) 7 (27)Very high 12 (8) 5 (14) 3 (9) 3 (5) 1 (4)Don’t know or N/A 5 (3) 0 (0) 1 (3) 1 (2) 2 (8)Total 156 (100) 37 (100) 35 (100) 55 (100) 26 (100)
e. Each agency will support the Arthur Carhart Training Center and the Aldo Leopold Wilderness Research InstituteLevel of All Bureau of Land National Park U.S. Forest U.S. Fish andAccomplishment Agencies Management Service Service Wildlife Service - - - - - - - - - - - - - - - - - - - - - - - number (percent)- - - - - - - - - - - - - - - - - - - - - - None 1 (1) 0 (0) 0 (0) 1 (2) 0 (0)Slight 13 (8) 2 (5) 5 (14) 5 (9) 1 (4)Moderate 42 (27) 4 (11) 11 (31) 18 (33) 8 (31)High 51 (33) 15 (41) 10 (29) 17 (31) 8 (31)Very high 20 (13) 9 (24) 3 (9) 5 (9) 3 (12)Don’t know or N/A 29 (19) 7 (19) 6 (17) 9 (16) 6 (23)Total 156 (100) 37 (100) 35 (100) 55 (100) 26 (100)
f. Establish partnerships with colleges and universities to recruit volunteers, participate in curricu-lum development, provide training, and conduct researchLevel of All Bureau of Land National Park U.S. Forest U.S. Fish andAccomplishment Agencies Management Service Service Wildlife Service - - - - - - - - - - - - - - - - - - - - - - - number (percent)- - - - - - - - - - - - - - - - - - - - - - None 3 (2) 0 (0) 0 (0) 3 (5) 0 (0)Slight 47 (30) 10 (27) 6 (17) 19 (35) 10 (38)Moderate 63 (40) 20 (54) 18 (51) 17 (31) 8 (31)High 15 (10) 0 (0) 7 (20) 7 (13) 1 (4)Very high 7 (5) 4 (11) 0 (0) 3 (5) 0 (0)Don’t know or N/A 21 (13) 3 (8) 4 (11) 6 (11) 7 (27)Total 156 (100) 37 (100) 35 (100) 55 (100) 26 (100)
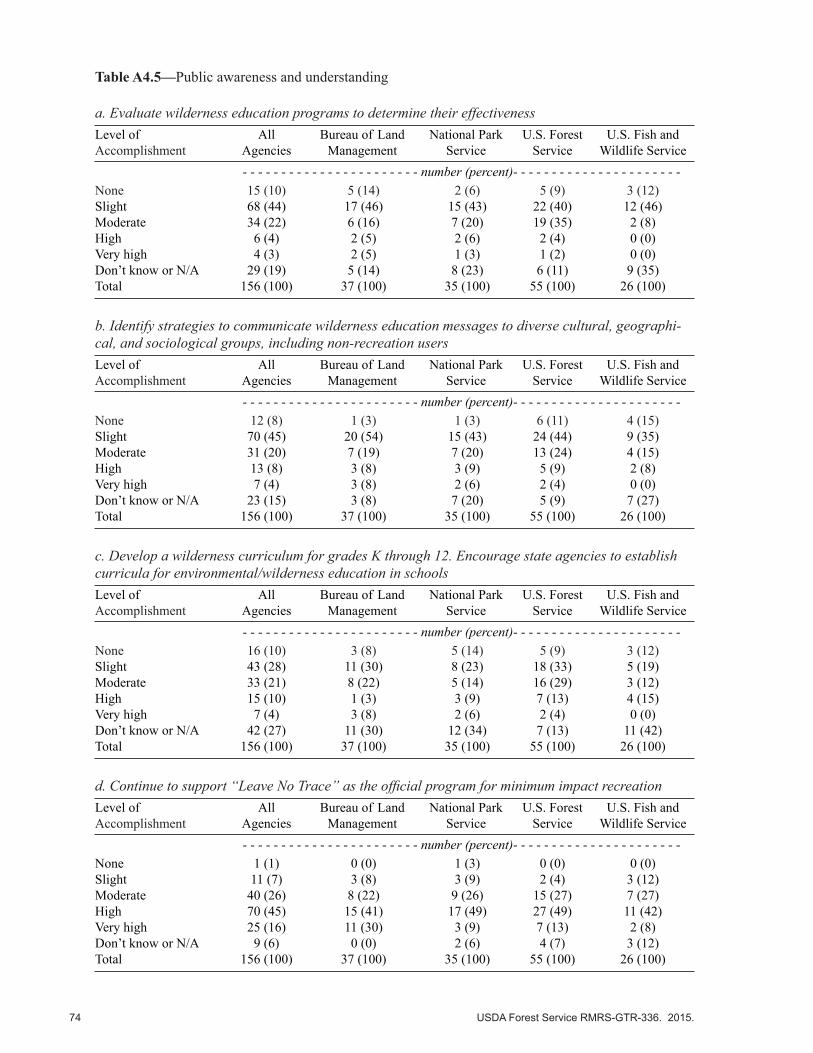
74 USDA Forest Service RMRS-GTR-336. 2015.
Table A4.5—Public awareness and understanding
a. Evaluate wilderness education programs to determine their effectivenessLevel of All Bureau of Land National Park U.S. Forest U.S. Fish andAccomplishment Agencies Management Service Service Wildlife Service - - - - - - - - - - - - - - - - - - - - - - - number (percent)- - - - - - - - - - - - - - - - - - - - - - None 15 (10) 5 (14) 2 (6) 5 (9) 3 (12)Slight 68 (44) 17 (46) 15 (43) 22 (40) 12 (46)Moderate 34 (22) 6 (16) 7 (20) 19 (35) 2 (8)High 6 (4) 2 (5) 2 (6) 2 (4) 0 (0)Very high 4 (3) 2 (5) 1 (3) 1 (2) 0 (0)Don’t know or N/A 29 (19) 5 (14) 8 (23) 6 (11) 9 (35)Total 156 (100) 37 (100) 35 (100) 55 (100) 26 (100)
b. Identify strategies to communicate wilderness education messages to diverse cultural, geographi-cal, and sociological groups, including non-recreation usersLevel of All Bureau of Land National Park U.S. Forest U.S. Fish andAccomplishment Agencies Management Service Service Wildlife Service - - - - - - - - - - - - - - - - - - - - - - - number (percent)- - - - - - - - - - - - - - - - - - - - - - None 12 (8) 1 (3) 1 (3) 6 (11) 4 (15)Slight 70 (45) 20 (54) 15 (43) 24 (44) 9 (35)Moderate 31 (20) 7 (19) 7 (20) 13 (24) 4 (15)High 13 (8) 3 (8) 3 (9) 5 (9) 2 (8)Very high 7 (4) 3 (8) 2 (6) 2 (4) 0 (0)Don’t know or N/A 23 (15) 3 (8) 7 (20) 5 (9) 7 (27)Total 156 (100) 37 (100) 35 (100) 55 (100) 26 (100)
c. Develop a wilderness curriculum for grades K through 12. Encourage state agencies to establish curricula for environmental/wilderness education in schoolsLevel of All Bureau of Land National Park U.S. Forest U.S. Fish andAccomplishment Agencies Management Service Service Wildlife Service - - - - - - - - - - - - - - - - - - - - - - - number (percent)- - - - - - - - - - - - - - - - - - - - - - None 16 (10) 3 (8) 5 (14) 5 (9) 3 (12)Slight 43 (28) 11 (30) 8 (23) 18 (33) 5 (19)Moderate 33 (21) 8 (22) 5 (14) 16 (29) 3 (12)High 15 (10) 1 (3) 3 (9) 7 (13) 4 (15)Very high 7 (4) 3 (8) 2 (6) 2 (4) 0 (0)Don’t know or N/A 42 (27) 11 (30) 12 (34) 7 (13) 11 (42)Total 156 (100) 37 (100) 35 (100) 55 (100) 26 (100)
d. Continue to support “Leave No Trace” as the official program for minimum impact recreationLevel of All Bureau of Land National Park U.S. Forest U.S. Fish andAccomplishment Agencies Management Service Service Wildlife Service - - - - - - - - - - - - - - - - - - - - - - - number (percent)- - - - - - - - - - - - - - - - - - - - - - None 1 (1) 0 (0) 1 (3) 0 (0) 0 (0)Slight 11 (7) 3 (8) 3 (9) 2 (4) 3 (12)Moderate 40 (26) 8 (22) 9 (26) 15 (27) 7 (27)High 70 (45) 15 (41) 17 (49) 27 (49) 11 (42)Very high 25 (16) 11 (30) 3 (9) 7 (13) 2 (8)Don’t know or N/A 9 (6) 0 (0) 2 (6) 4 (7) 3 (12)Total 156 (100) 37 (100) 35 (100) 55 (100) 26 (100)

USDA Forest Service RMRS-GTR-336. 2015. 75
Appendix 5. Qualitative Analysis ResultsThe National Wilderness Manager Survey 2014 asked a number of open-ended questions in order to identify major challenges in wilderness stewardship and planning, needs for training and research, and major problems likely to face the NWPS in the future. Respondents could list up to five major challenges, five specific training needs, five research needs for resource and visitor management, and two most important problems. At the end of the survey, responding managers were given the opportunity to provide any final comments about the survey or about the strategic planning process.
Contents of responses to each of the open-ended questions were coded to assist in in-terpreting and grouping the diversity of responses and comments. The coding was done through NVivo which is a qualitative data coding and analysis software (http://www.qsrinternational.com/default.aspx). This software is widely used for coding, analyzing and summarizing qualitative data, such as that produced by the open-ended question in the WMS. Initial groupings were based on analyst interpretations within NVivo, and were read and crosschecked manually to see if the groupings made sense and to identify whether there were similarities in contents within groups. In many cases, contents of more complex responses were sufficiently diverse to cover multiple topics and thus fell into more than one group. Hence, the count of responses or comments typically exceeded the number of respondents. In other cases, responses to the WMS open-ended questions were very brief, sometimes just one word (e.g., fire, technology, management). In these cases, analyst judgment was relied on for placement in categories and for interpretation.
A5.1 Major challenges Respondents were asked to indicate up to five major challenges they were likely to face over the next 20 years in wilderness stewardship or planning. A total of 1355 responses were collected from 368 respondent managers. These challenges were coded into six broad categories, as shown below in Figure A5.1. For detail category to these challenges, please see Table A5.1.
Figure A5.1—Major challenges in wilderness stewardship or planning
5
7
20
21
32
44
0 5 10 15 20 25 30 35 40 45 50
Managing other resources
Public awareness
Sustaining natural condi<ons
Visitor and experience management
Resources and policy for management
Management of external threats
Percent of respondents
Challenges in wild
erne
ss stew
ardship/
plan
ning
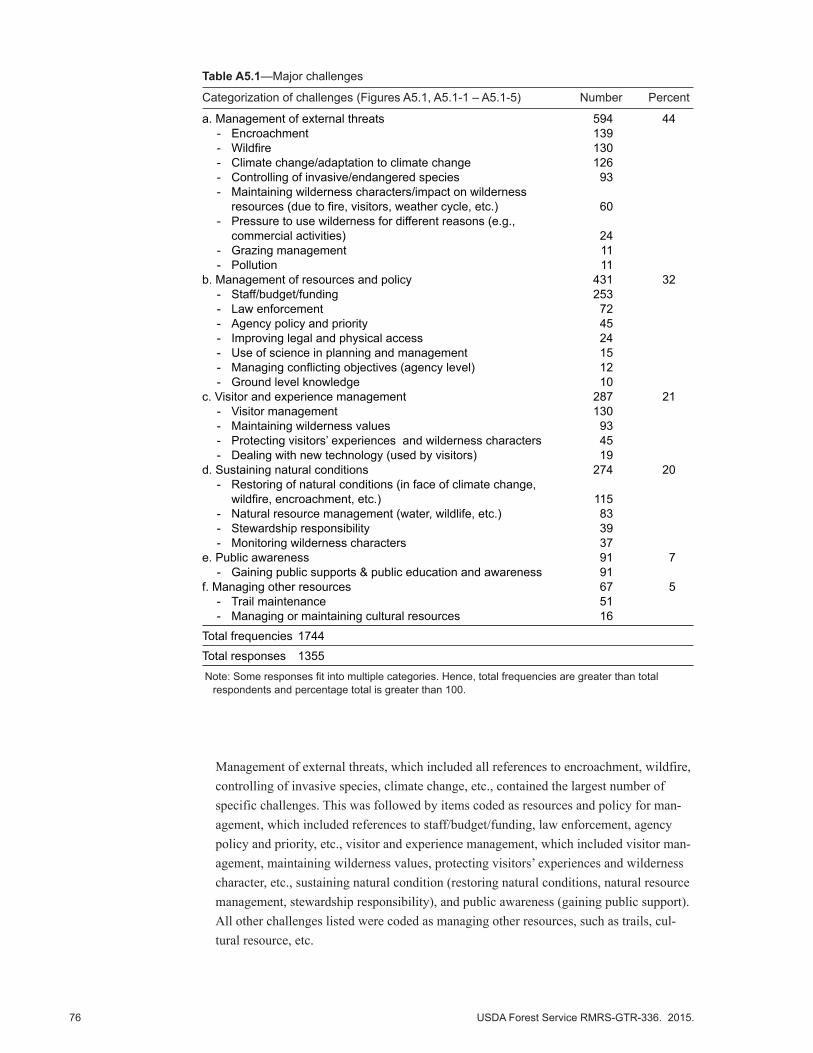
76 USDA Forest Service RMRS-GTR-336. 2015.
Table A5.1—Major challenges
Categorization of challenges (Figures A5.1, A5.1-1 – A5.1-5) Number Percent
a. Management of external threats 594 44 - Encroachment 139 - Wildfire 130 - Climate change/adaptation to climate change 126 - Controlling of invasive/endangered species 93 - Maintaining wilderness characters/impact on wilderness
resources (due to fire, visitors, weather cycle, etc.) 60 - Pressure to use wilderness for different reasons (e.g.,
commercial activities) 24 - Grazing management 11 - Pollution 11 b. Management of resources and policy 431 32 - Staff/budget/funding 253 - Law enforcement 72 - Agency policy and priority 45 - Improving legal and physical access 24 - Use of science in planning and management 15 - Managing conflicting objectives (agency level) 12 - Ground level knowledge 10 c. Visitor and experience management 287 21 - Visitor management 130 - Maintaining wilderness values 93 - Protecting visitors’ experiences and wilderness characters 45 - Dealing with new technology (used by visitors) 19 d. Sustaining natural conditions 274 20 - Restoring of natural conditions (in face of climate change,
wildfire, encroachment, etc.) 115 - Natural resource management (water, wildlife, etc.) 83 - Stewardship responsibility 39 - Monitoring wilderness characters 37 e. Public awareness 91 7 - Gaining public supports & public education and awareness 91 f. Managing other resources 67 5 - Trail maintenance 51 - Managing or maintaining cultural resources 16
Total frequencies 1744
Total responses 1355
Note: Some responses fit into multiple categories. Hence, total frequencies are greater than total respondents and percentage total is greater than 100.
Management of external threats, which included all references to encroachment, wildfire, controlling of invasive species, climate change, etc., contained the largest number of specific challenges. This was followed by items coded as resources and policy for man-agement, which included references to staff/budget/funding, law enforcement, agency policy and priority, etc., visitor and experience management, which included visitor man-agement, maintaining wilderness values, protecting visitors’ experiences and wilderness character, etc., sustaining natural condition (restoring natural conditions, natural resource management, stewardship responsibility), and public awareness (gaining public support). All other challenges listed were coded as managing other resources, such as trails, cul-tural resource, etc.

USDA Forest Service RMRS-GTR-336. 2015. 77
Figure A5.1-1—Potential sources of external threats
2
2
4
10
16
21
22
23
0 5 10 15 20 25
Pollu-on
Grazing management
Pressure to use wilderness
Maintaining wilderness character
Invasive/endangered species
Climate Change
Wildfire
Encroachment
Percent of responses
List of p
oten
.al externa
l threats
Below, each challenges category is explained with examples of items coded into that category of response:
a. Management of External Threats: External threats to wilderness come from different sources outside the wilderness and management of these threats could be a challenge in wilderness stewardship or planning in the next 20 years.
Encroachment of wilderness resources (from neighboring land owners, motorists, and urbanization) was the most common external threat listed in this category; followed by wildfire; climate change; controlling invasive species or protecting endangered spe-cies; managing wilderness character in the face of climate change, wildfire, excessive visitation, and weather cycles; pressure to use wilderness for different reasons (e.g., com-mercial activities); grazing management; and pollution (Figure A5.1-1).
b. Resources and Policy for Management: Many respondents indicated that resources and policies are a major category of challenges in wilderness stewardship or planning for the next 20 years.
Management of staff/budget/funding to protect wilderness and to conduct research was by far the most frequent set of items in this category. Law enforcement, managing con-flicting policies, improving legal and physical access to maintain wilderness character, use of science in planning and management, and improving ground level knowledge are the other miscellaneous resources and policy management related challenges listed by respondents (Figure A5.1-2).
c. Visitor and Experience Management: Visitor management issues dominated this category of challenges listed by managers. Maintaining wilderness values among the public, protecting visitors’ experiences and wilderness characteristics, and dealing with new technology used by visitors are also seen as challenges over the next 20 years (Figure˛A5.1-3).

78 USDA Forest Service RMRS-GTR-336. 2015.
d. Sustaining Natural Conditions: Restoring natural condition in the face of climate change uncertainties, wildfire, encroachment; management of natural resources (e.g., water, wildlife, etc.); the changing role in stewardship responsibility (gradually shifting stewardship responsibility toward the public); and monitoring wilderness characteristics are the major categories of challenges listed by managers to sustain natural condition over the next 20 years (Figure A5.1-4).
e. Public Awareness: A small proportion of respondents specifically mentioned gaining public support and maintaining public education and awareness as a major challenge over the next 20 years (Figure A5.1)
f. Managing Other Resources: Most of the other resources challenges were about trail maintenance and managing or maintaining cultural resources over the next 20 years (Figure A5.1-5).
2
3
6
13
17
59
0 10 20 30 40 50 60 70
Improving ground level knowledge
Use of science in planning and management
Improving legal and physical access
Agency policy and priority
Law enforcement
Staff/budget/funding
Percent of responses
Challenges in re
sources a
nd policy
for m
anagem
ent
7
16
32
45
0 5 10 15 20 25 30 35 40 45 50
Dealing with new technology
Protec9ng visitors experiences and wilderness characteris9cs
Maintaining wilderness values
Visitor management
Percent of responses
Challenges in visito
r and
experience
man
agem
ent
Figure A5.1-2—Challenges in resources and policy for management
Figure A5.1-3—Challenges in visitors and experience management

USDA Forest Service RMRS-GTR-336. 2015. 79
A5.2 Two most important problems Respondents were asked to describe the two most important problems managers and agencies need to collectively address in strategic planning to protect wilderness qualities in the coming 20 years. A total of 632 responses were collected from 368 responding managers and were grouped into five broad categories, shown in Figure A5.2. Appendix 5 (Table A5.2) provides a more detailed listing of the types of items included in these cat-egories and/or wording provided by respondents.
14
14
30
42
0 5 10 15 20 25 30 35 40 45
Monitoring wilderness characteris7cs
Stewardship responsibility
Natural resource management
Restoring natural condi7ons
Percent of responses
Challenges in su
staining natural
cond
i4on
s
24
76
0 10 20 30 40 50 60 70 80
Managing or maintaining cultural resources
Trail maintenance
Percent of responses
Challenges in m
anaging othe
r resources
Figure A5.1-4—Challenges in sustaining natural conditions
Figure A5.1-5—Challenges in managing other resources

80 USDA Forest Service RMRS-GTR-336. 2015.
7
22
25
29
32
0 10 20 30 40
Onsite visitor and experience management
Building public awareness and support
Resources and policy for management
External threats and impacts
Monitoring and sustaining natural condiEons
Percent of responses
List of p
oten
.al problem
s faced
by
NWPS
Figure A5.2—Potential problems faced by NWPS
Table A5.2—Two most important problems in NWPS
Categorization of problems in NWPS (Figures A5.5, A5.5-1 – A5.5-5) Number Percent
a. Monitoring and sustaining natural conditions 201 32 - Resource management (wilderness resource management
in face of climate change, wildfire, invasive species, budget and staff cuts, population growth and urbanization or encroachment, etc.) 60
- Protecting wilderness character (in face of climate change, budget/staff cuts) 34
- Fire management 23 - Scientific monitoring wilderness character (in face of
budget/staff cuts) 19 - Air and water quality maintaining and monitoring 18 - Wildlife management (in face of climate change, increased
visitation, improper grazing) 17 - Maintaining ecological function/ecological restoration 13 - Habitat conservation and preservation (endangered species,
native species) 9 - Protect the integrity of the wilderness act 8 b. External threats and impacts 181 29 - Climate change and wilderness resources (e.g., invasive
species, water, air) 61 - Impact of human and nonhuman factors on Wilderness
(human impact on the landscape, population growth, energy development, climate change) 30
- Encroachment (population growth, urbanization, technological changes, motorized access) 27
- Invasive species and weed controls 24 - Adjacent land use 10 - Disconnection to the natural world 9 - Controlling illegal activities (e.g., marijuana growing operation,
woodcutting, illegal motorized incursion, etc.) 7 - Commercial activities management (commercial filming,
commercial fishing, etc.) 7 - Lack of political supports to wilderness 6
(continued)

USDA Forest Service RMRS-GTR-336. 2015. 81
Table A5.2—Continued.
Categorization of problems in NWPS (Figures A5.5, A5.5-1 – A5.5-5) Number Percent
c. Management Resources and Policy 155 25 - Protecting wilderness values (upper level management
understanding wilderness values, better communication with different groups - public, top management) 28
- Funding/budget/resources 64 - Staff/workforce 45 - Use of science in decision making 7 - Train managers (skill development, management trainings to
older managers) 11 d. Building public awareness and supports 137 22 - Increasing public awareness (on wilderness and wilderness
stewardship, communicating the value of wilderness to the public, gaining public supports on wilderness stewardship) 85
- Educating public (importance of wilderness) 18 - Engaging urban population to wilderness 12 - Engaging public on wilderness stewardship and management 8 - Developing partnership (with people, volunteers) 8 - Connecting youth to wilderness 6 e. On-Site visitor and experience management 46 7 - Visitor management (increase in visitor use, conflict management) 25 - Increased visitation in wilderness 11 - Increased visitor access to wilderness 10
Total frequencies 720
Total responses 632
Note: Some responses fit into multiple categories. Hence, total frequencies are greater than total respondents and percentage total is greater than 100.
The category of monitoring and sustaining natural conditions included a broad cat-egory of wilderness resource management (in the face of such threats as climate change, wildfire, invasive species, budget and staff cuts, population growth, urbanization, and en-croachment), protecting wilderness character (in the face of climate change, budget/staff cuts), fire management, the need for more scientific monitoring of wilderness character, and maintaining/monitoring air and water quality (Figure A5.2-1). Lesser topics included those related to wildlife management, restoration, habitat conservation and protecting the integrity of the Wilderness Act.
The importance of focus on external threats and impacts for strategic planning was largely focused on climate change issues and protection of wilderness resources (e.g., in-vasive species, water, air, etc.), impacts (human impact on landscape, population growth, energy development, and climate change), encroachment (population growth, urbaniza-tion, technological change and motorized access), invasive species and weed control, and adjacent land-uses (Figure A5.2-2). Managers also listed a range of specific issues affecting them, including problems that are illegal activities, commercial exceptions, and lack of political support.

82 USDA Forest Service RMRS-GTR-336. 2015.
4
4
6
8
9
9
11
17
30
0 10 20 30 40
Protec1ng integrity of wilderness act
Habitat conserva1on and preserva1on
Maintaining ecological func1on/ecological restora1on
Wildlife management
Maintaining/monitoring air and water quality
Scien1fic monitoring wilderness characters
Fire management
Protec1ng wilderness character
Wilderness resource management
Percent of responses
List of p
roblem
s in mon
itorin
g an
d sustaining
natural con
di5o
ns
Figure A5.2-1—Problems in monitoring and sustaining natural conditions
3
4
4
5
6
13
15
17
34
0 5 10 15 20 25 30 35 40
Lack of poli3cal support
Commercial ac3vi3es management
Controlling illegal ac3vi3es
Disconnec3on to the natural world
Adjacent land use
Invasive species and weed control
Encroachment
Impact of human and nonhuman factors
Climate change and wilderness resources
Percent of responses
List of e
xterna
l threats to
wild
erne
ss
Figure A5.2-2—External threats to wilderness

USDA Forest Service RMRS-GTR-336. 2015. 83
Managers listed many important strategic planning issues that were categorized into resources and policy for management. These included protecting wilderness values (improving understanding of wilderness values among upper level management, better communicating wilderness values to different publics and top level management), fund-ing, budgets, staffing, use of science in decision making, and training managers (on using new technology) (Figure A5.2-3).
Increasing public awareness (of wilderness and wilderness stewardship, the values of wilderness, and gaining public support), engaging urban populations to wilderness, and developing partnerships (with publics, volunteers, etc.) were also combined into a category interpreted as building public awareness and support (Figure A5.2-4). Those suggestions about the need to address how to connect youth to wilderness were also included in this category.
Visitor use management (in the face of increased use and user conflicts) and threats to wilderness resources from increased visitation and visitor access were coded into the broad category of onsite visitor and experience management (Figure A5.2-5).
5
7
18
29
41
0 5 10 15 20 25 30 35 40 45
Use of science in decision making
Train managers
Protec<ng wilderness values
Staff/workforce
Funding/budget/resources
Percent of responses
List of top
ics in resources a
nd policy
for m
anagem
ent
Figure A5.2-3—Problems in resources and policy for management
Figure A5.2-4—Problems in building pub lic awareness and support
4
6
6
9
13
62
0 10 20 30 40 50 60 70
Connec0ng youth to wilderness
Developing partnerships
Engaging public on wilderness stewardship and management
Engaging urban popula0on to wilderness
Educa0on public
Increasing public awareness
Percent of responses
List of top
ics in bu
ilding pu
blic
awaren
ess a
nd su
pport

84 USDA Forest Service RMRS-GTR-336. 2015.
22
24
54
0 10 20 30 40 50 60
Increased visitor access to wilderness
Increased visita7on in wilderness
Visitor management
Percent of responses
Topics in onsite
visito
r and
expe
rience man
agem
ent
Figure A5.2-5—Problems in onsite visitor and experience management
A5.3 Specific training needsThe WMS asked respondents to indicate the top 5 specific training needs for wilderness managers. A total of 1272 responses were received from 368 respondent managers. The training needs suggested by managers have been grouped into six broad categories, as shown below in Figure A5.3.
A general category labeled wilderness resource management included the greatest num-ber of suggested training topics; followed by skills, technology and analytics; threats management; building partnership and education; law, regulation and policy; and wilder-ness recreation management (Figure A5.3). Please see Table A5.3 for details on these categories of training needs, as described below.
9
11
16
16
20
47
0 5 10 15 20 25 30 35 40 45 50
Wilderness recrea5on management
Law, regula5on, and policy
Building partnerships and educa5on
Threats management
Skills, technology, and analy5cs
Wilderness resource management
Percent of respondents
Training Top
ics
Figure A5.3—Training needs for wilderness managers

USDA Forest Service RMRS-GTR-336. 2015. 85
Table A5.3—Areas of specific training needs
Categorization of need for training (Figures A5.3, A5.3-1 – A5.3-6) Number Percent
a. Wilderness resource management 601 47 - Resource management (economic and non-economic
resources including adjustment with budget/staff cuts) 189 - Resource use (natural and non-natural - resource baseline
monitoring and management, dealing with growing resource extraction pressure, visual resource management) 116
- Wilderness monitoring 56 - Maintaining/communicating wilderness character/values 54 - Fire management 47 - Sanitation and waste management 34 - Conflicts management (conflict with other resource
management, e.g., grazing) 27 - Protection (landscape, species) 26 - Wildlife management 18 - Wilderness stewardship 18 - Assessment and monitoring water, air quality 16 b. Skills, technology and analytics 260 20 - Skills (field, traditional skills, mass communication) 61 - Incorporating science into decision making 47 - Information technology 45 - Emerging technology and use 42 - Minimum requirement analysis/decision guide 35 - Primitive or traditional skills 16 - GPS/GIS 9 - Funding opportunities and grant writing 5 c. Threat management 199 16 - Responding to climate change influences 86 - Managing invasive species 81 - Soundscape protection 18 - Restoration wilderness (e.g., weed control) 14 d. Building partnerships and education 198 - Building partnership (inside and outside constituencies for
wilderness) 82 - Public education and outreach/communication with different
public groups 72 - Communicating wilderness values (with different stockholders) 21 - Consultation, partnership, communication with tribal groups 18 - Responding to political pressure 5 e. Law, regulation and policy 143 11 - Wilderness law and regulation 40 - Wilderness policy 34 - Wilderness planning 34 - Improve understanding (wilderness acts, policies) 22 - Legal and policy context (including ANILCA wilderness) 13 f. Wilderness recreation management 112 9 - Visitor management training (excessive visitation, capacity
issues relative to permits and fees) 52 - Commercial use of wilderness (commercial filming, managing
commercial services to preserve wilderness characters, need assessment for commercial use) 29
- Search and rescue and safe access to people with disabilities 10 - Controlling of motorized activities 8 - Understanding carrying capacity training 7 - Communicating and transferring wilderness ethnics to visitors (e.g., leave no trace) 6
Total frequencies 1513
Total responses 1272
Note: Some responses fit into multiple categories. Hence, total frequencies are greater than total respondents and percentage total is greater than 100.
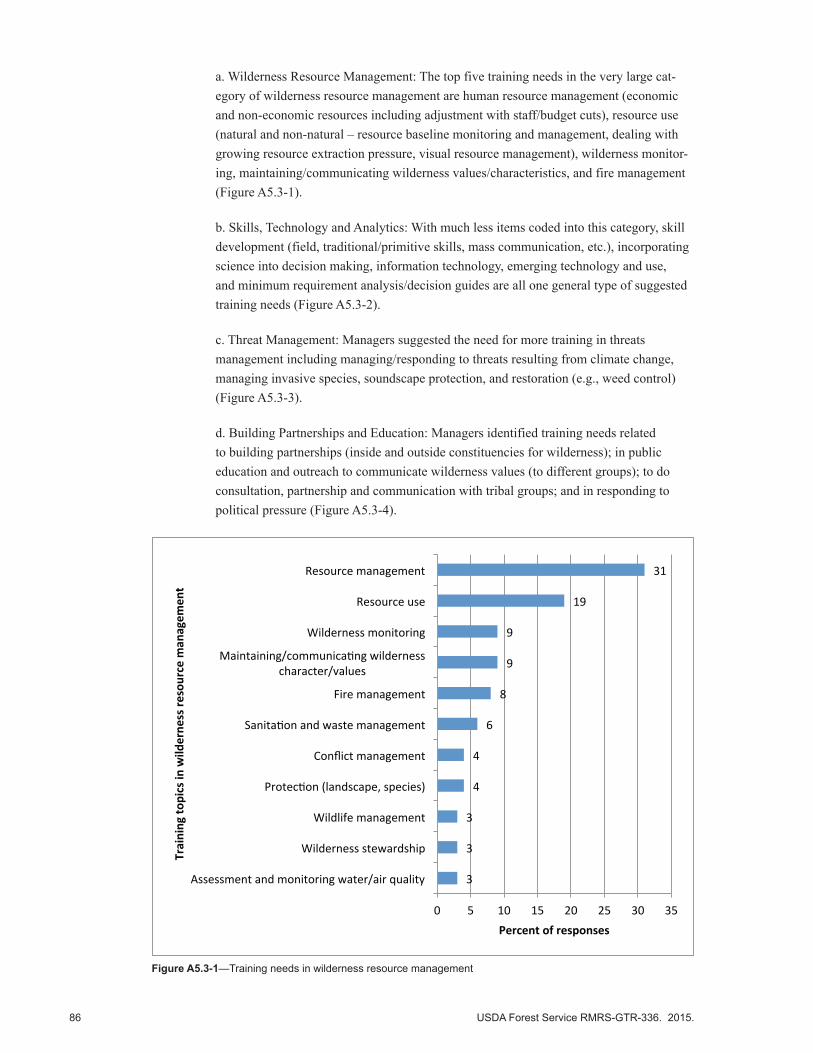
86 USDA Forest Service RMRS-GTR-336. 2015.
a. Wilderness Resource Management: The top five training needs in the very large cat-egory of wilderness resource management are human resource management (economic and non-economic resources including adjustment with staff/budget cuts), resource use (natural and non-natural – resource baseline monitoring and management, dealing with growing resource extraction pressure, visual resource management), wilderness monitor-ing, maintaining/communicating wilderness values/characteristics, and fire management (Figure A5.3-1).
b. Skills, Technology and Analytics: With much less items coded into this category, skill development (field, traditional/primitive skills, mass communication, etc.), incorporating science into decision making, information technology, emerging technology and use, and minimum requirement analysis/decision guides are all one general type of suggested training needs (Figure A5.3-2).
c. Threat Management: Managers suggested the need for more training in threats management including managing/responding to threats resulting from climate change, managing invasive species, soundscape protection, and restoration (e.g., weed control) (Figure A5.3-3).
d. Building Partnerships and Education: Managers identified training needs related to building partnerships (inside and outside constituencies for wilderness); in public education and outreach to communicate wilderness values (to different groups); to do consultation, partnership and communication with tribal groups; and in responding to political pressure (Figure A5.3-4).
3
3
3
4
4
6
8
9
9
19
31
0 5 10 15 20 25 30 35
Assessment and monitoring water/air quality
Wilderness stewardship
Wildlife management
ProtecCon (landscape, species)
Conflict management
SanitaCon and waste management
Fire management
Maintaining/communicaCng wilderness character/values
Wilderness monitoring
Resource use
Resource management
Percent of responses
Training to
pics in wild
erne
ss re
source m
anagem
ent
Figure A5.3-1—Training needs in wilderness resource management

USDA Forest Service RMRS-GTR-336. 2015. 87
2
3
6
13
16
17
18
23
0 5 10 15 20 25
Funding opportuni4es and grant wri4ng
GPS/GIS
Primi4ve or tradi4onal skills
Minimum requirement analysis/decision guide
Emerging technology and use
Informa4on technology
Incorpora4ng science into decision making
Skills development
Percent of responses
Training to
pics in sk
ills, te
chno
logy, and
an
aly6
cs
7
9
41
43
0 5 10 15 20 25 30 35 40 45 50
Restora1on in wilderness
Soundscape protec1on
Managing invasive species
Responding to climate change influences
Percent of responses
Training to
pics in th
reat
man
agem
ent
Figure A5.3-2—Training needs in skill, technology, and analytics
Figure A5.3-3—Training needs in threat management

88 USDA Forest Service RMRS-GTR-336. 2015.
3
9
11
36
41
0 5 10 15 20 25 30 35 40 45
Responding to poli5cal pressure
Consulta5on, partnership, communica5on with tribal groups
Communica5ng wilderness values
Public educa5on and outreach
Building partnership
Percent of responses
Training to
pics in building
partne
rship an
d ed
uca5
on
Figure A5.3-4—Training needs in building partnership and education
e. Law, Regulation and Policy: Areas for training needs in wilderness law, regulation, and policy include trainings to improve knowledge and understanding of various laws and regulations in wilderness, wilderness policy, wilderness planning, wilderness acts, and legal and policy context (including ANILCA wilderness) (Figure A5.3-5).
f. Wilderness Recreation Management: Some specific training topics in wilderness recre-ation management emerged, including general visitor management issues, like capacity issues relative to permits and fees, visitor conflicts and excessive visitation management. Managers also indicated interest in training about commercial uses of wilderness (com-mercial filming, managing commercial services and preserve wilderness characters, need assessment for commercial use), search and rescue operations and providing safe access to people with disabilities, controlling motorized activities, carrying capacity training, and communicating wilderness ethics to visitors (e.g., leave no trace) (Figure A5.3-6).
Figure A5.3-5—Training needs in wilderness law and regulation
9
15
24
24
28
0 5 10 15 20 25 30
Legal and policy context (including ANILCA wilderness)
Wilderness acts
Wilderness planning
Wilderness policy
Wilderness law and regulaCon
Percent of responses
Training to
pics in law, regula4
on,
and po
licy

USDA Forest Service RMRS-GTR-336. 2015. 89
Figure A5.3-6—Training needs in wilderness recreation management
5
6
7
9
26
46
0 5 10 15 20 25 30 35 40 45 50
Communica3ng wilderness ethics to visitors
Carrying capacity training
Controlling motorized ac3vi3es
Search and rescue and safe access to people with disabili3es
Commercial use of wilderness
Visitor management
Percent of responses
Training to
pics in wild
erne
ss
recrea3o
n man
agem
ent
A5.4 Five specific research needs Respondents were asked to identify their top five research needs for resource and visitor management in wilderness areas. A total of 1173 responses were collected from 368 re-spondent managers. These responses have been grouped into four very general categories, shown below in Figure A5.4. In the broadest sense, these research needs were described as threats and impact management, wilderness resource management, building partner-ships and education, and wilderness recreation management. Please see Table A5.4 for details about these categories.
24
24
28
35
0 5 10 15 20 25 30 35 40
Wilderness recrea3on management
Building partnerships and educa3on
Wilderness resource management
Threats and impact management
Percent of responses
Topics/areas fo
r research ne
eds
Figure A5.4—Research needs in resource and visitor management

90 USDA Forest Service RMRS-GTR-336. 2015.
Table A5.4—Areas of specific research needs
Categorization to research need (Figures A5.4, A5.4-1 – A5.4-4) Number Percent
a. Threats and impact management 412 35 - Impact assessment (impact on wilderness resources and
solitude due to human and nonhuman/natural factors) 109 - Invasive species (survey, impact assessment, etc.) 104 - Climate change impacts on wilderness characters 54 - Soundscape (monitoring soundscape, preserving soundscapes
and ecosystem integrity) 33 - Land use, land management 25 - Managing wilderness character (in face of technological changes,
internal/external threats) 23 - Ecosystem fragmentation and ecosystem health 20 - Urban encroachment 15 - Weed management (e.g., controls) 11 - Impacts from improper grazing (livestock, wild horse, and wildlife) 10 - Impact of commercial activities (including visitor attitude toward
commercial services in wilderness) 8 b. Wilderness resource management 333 28 - Technological changes (emerging technology to monitor
wilderness, emerging technology visitor can use to gain access to wilderness areas, impact on wilderness character, etc.) 84
- Incorporating scientific information into decision-making 52 - Fire (impact, fire history, post fire effects, and natural fire regime) 42 - Water resources (quality/quantity assessment and monitoring) 32 - Wilderness restoration (ecosystem, habitat, etc.) 28 - Wildlife management 22 - Resource management (natural resources, cultural/heritage to
preserve wilderness character) 20 - Inventories of wilderness resources (e.g., species, flora and
fauna, etc.) 15 - Ecological changes (e.g., monitoring) 12 - Native species (e.g., survey, stock, impact assessment) 9 - Landscape archaeological research 9 - Island ecology 8 c. Building partnerships and education 287 24 - Human resource development 80 - Communicating wilderness values (with different public groups) 54 - Partnership building (with different groups - locals/government
officials, etc.) 39 - Understanding wilderness values (public attitude, ecological
values, benefit of wilderness) 29 - Understanding public needs - to get wilderness experience, etc. 27 - Tribal access and consultations 21 - Attitude toward wilderness (public and employees) 18 - Wilderness benefits (intangible benefits of wilderness) 11 - Social values (social values of wilderness) 8 d. Wilderness recreation management 285 24 - Visitor management (overuse of wilderness, user group conflict,
visitor use monitoring, use of new technology to monitor wilderness/in face of new technology used by visitors) 158
- Sanitation and waste management 40 - Conflict management (visitor to visitor conflicts, human-wildlife
conflicts) 31 - Wilderness character and visitor impacts (due to excessive
use of wilderness resources) 23 - Capacity analysis (carrying capacity of wilderness areas/resources) 15 - User charges (fees to charge) 12 - Visitor demographics (user group demographics) 6
Total frequencies 1317
Total responses 1173
Note: Some responses fit into multiple categories. Hence, total frequencies are greater than total respondents and percentage total is greater than 100.

USDA Forest Service RMRS-GTR-336. 2015. 91
a. Threats and Impact Management: Impact assessments (gauging the impact on wilder-ness resources and solitude from human and nonhuman/natural forces), invasive species surveys, climate change impact on wilderness characteristics, soundscape (monitoring soundscapes, preserving soundscapes and ecosystem integrity), and land-use and land management impacts are the top five research needs identified by respondent and placed in this general category (Figure A5.4-1).
b. Wilderness Resource Management: Technological changes (emerging technology to monitor wilderness, emerging technology visitors can use to gain access to wilderness areas, impact on wilderness characteristics), incorporating scientific information into decision-making, fire (impact, fire history, post-fire effects, and natural fire regime), water resources (quality/quantity assessment and monitoring), and wilderness restoration (ecosystem, habitat) research questions were all gathered into wilderness resource man-agement (Figure A5.4-2).
c. Building Partnerships and Education: Science to support human resource development, communicating wilderness values (with different public groups), partnership building (with different groups – locals/government officials), understanding wilderness values, and understanding public needs (to get wilderness experience) are one large category of research needs identified (Figure A5.4-3).
2
2
3
4
5
6
6
8
13
25
26
0 5 10 15 20 25 30
Impact of commercial ac6vi6es
Impacts from improper grazing
Weed management
Urban encroachment
Ecosystem fragmenta6on and ecosystem health
Managing wilderness character
Land use, land management
Soundscape
Climate change impacts on wilderness character
Invasive species
Impact assessment
Percent of responses
Topics in th
reats a
nd im
pact m
anagem
ent
Figure A5.4-1—Research needs in threat and impact management
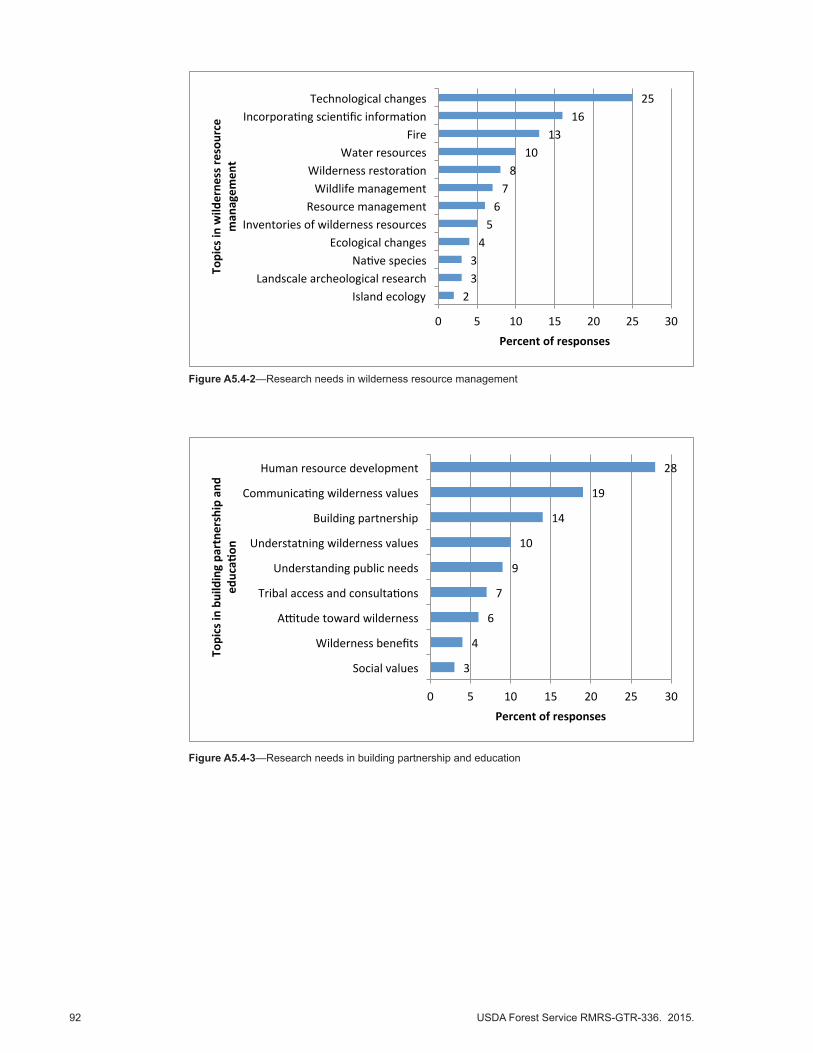
92 USDA Forest Service RMRS-GTR-336. 2015.
2 3 3 4 5 6 7 8
10 13
16 25
0 5 10 15 20 25 30
Island ecology Landscale archeological research
Na;ve species Ecological changes
Inventories of wilderness resources Resource management Wildlife management
Wilderness restora;on Water resources
Fire Incorpora;ng scien;fic informa;on
Technological changes
Percent of responses
Topics in wild
erne
ss re
source
man
agem
ent
Figure A5.4-2—Research needs in wilderness resource management
3
4
6
7
9
10
14
19
28
0 5 10 15 20 25 30
Social values
Wilderness benefits
A>tude toward wilderness
Tribal access and consultaAons
Understanding public needs
Understatning wilderness values
Building partnership
CommunicaAng wilderness values
Human resource development
Percent of responses
Topics in building pa
rtne
rship an
d ed
uca5
on
Figure A5.4-3—Research needs in building partnership and education

USDA Forest Service RMRS-GTR-336. 2015. 93
d. Wilderness Recreation Management: The long-standing wilderness research topics of visitor management, including issues of overuse of wilderness resources, user group conflicts, visitor use monitoring, monitoring wilderness using new technology/in face of new technology used by visitors, sanitation and waste management, other conflict man-agement (e.g., human-wildlife conflicts), research about wilderness character and visitor impacts (due to excessive use of wilderness resources), and capacity analysis (carrying capacity of wilderness areas/resources) remain to have needs expressed by managers for information to guide decisions (Figure A5.4-4).
Figure A5.4-4—Research needs in wilderness recreation management
24
24
28
35
0 5 10 15 20 25 30 35 40
Wilderness recrea3on management
Building partnerships and educa3on
Wilderness resource management
Threats and impact management
Percent of responses
Topics/areas fo
r research ne
eds
A5.5 Other threats (open ended responses) Those taking the survey were also provided a single-line opportunity to describe any “other” threats they perceive to exist to wilderness over the next 20 years. Only 37 managers “wrote in” items and these responses fall into three broad categories, shown in Figure A5.5.
Managers mostly listed threats that result from human use of wilderness resources (e.g., encroachment, energy development, illegal activities, overuse of wilderness resources, etc.), lack of support for wilderness and wilderness management (lack of budget or funding, lack of political support, influence of interest groups, etc.), and natural threats (climate change, availability of water, etc.). Please see Table A5.5 for additional details about these categories.
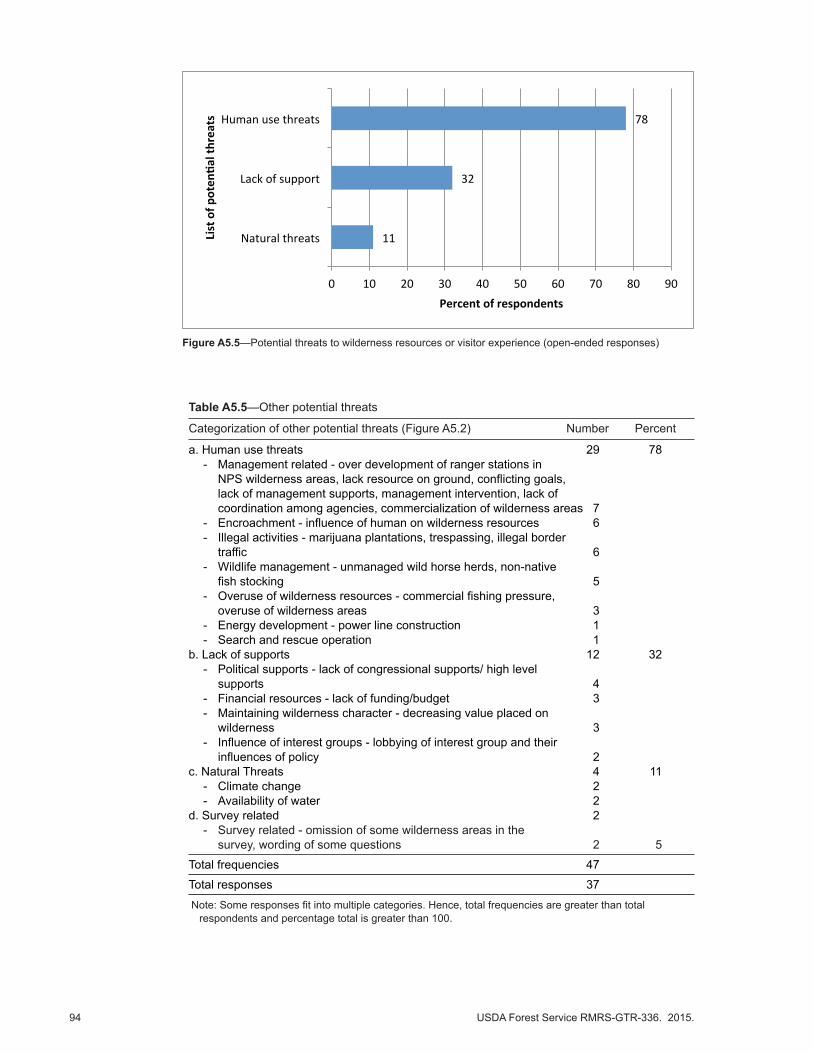
94 USDA Forest Service RMRS-GTR-336. 2015.
11
32
78
0 10 20 30 40 50 60 70 80 90
Natural threats
Lack of support
Human use threats
Percent of respondents
List of p
oten
/al threats
Figure A5.5—Potential threats to wilderness resources or visitor experience (open-ended responses)
Table A5.5—Other potential threats
Categorization of other potential threats (Figure A5.2) Number Percent
a. Human use threats 29 78 - Management related - over development of ranger stations in
NPS wilderness areas, lack resource on ground, conflicting goals, lack of management supports, management intervention, lack of coordination among agencies, commercialization of wilderness areas 7
- Encroachment - influence of human on wilderness resources 6 - Illegal activities - marijuana plantations, trespassing, illegal border
traffic 6 - Wildlife management - unmanaged wild horse herds, non-native
fish stocking 5 - Overuse of wilderness resources - commercial fishing pressure,
overuse of wilderness areas 3 - Energy development - power line construction 1 - Search and rescue operation 1 b. Lack of supports 12 32 - Political supports - lack of congressional supports/ high level
supports 4 - Financial resources - lack of funding/budget 3 - Maintaining wilderness character - decreasing value placed on
wilderness 3 - Influence of interest groups - lobbying of interest group and their
influences of policy 2 c. Natural Threats 4 11 - Climate change 2 - Availability of water 2 d. Survey related 2 - Survey related - omission of some wilderness areas in the survey, wording of some questions 2 5
Total frequencies 47
Total responses 37
Note: Some responses fit into multiple categories. Hence, total frequencies are greater than total respondents and percentage total is greater than 100.

USDA Forest Service RMRS-GTR-336. 2015. 95
A5.6 Final commentsRespondents were provided an opportunity to provide any final comments about the sur-vey or the strategic planning process. A total of 82 managers provided responses to this question, which fall into six broad categories, as shown below in Figure A5.6. Please see Table A5.6 for details about these categories.
Forty-four percent of comments are wilderness management related (e.g., connection to wilderness is no longer a necessary goal, continued emphasis from the Chief’s Office with clear expectations is critical, better priority to get more budget, staffs, need to des-ignate more lands, need for region specific survey, cohesive and coordinated approach to manage wilderness by 4 agencies is important, need to place priority on fire and resources, outreach to youth, utilize partnership to manage wilderness, etc.). Likewise, thirty-seven percent of the comments are survey related and respondents want to use survey findings in the formulation of wilderness policy (e.g., wording of some survey questions, some questions are not relevant to all respondents, appreciation for the survey, need to cover more ground level reality, etc.). The rest of the comments are personal experiences and appreciation for conducting the survey, budgets/staff/resource related, comments about wilderness values, public support, and appreciation (gaining public support – better communication with the public and with agencies, educating the public, conflict in priority – higher priority at the national level, but no priority at the field level, etc.), agency policy and priority (e.g., conflicting priority – higher priority at the national level, but no priority at the field level, need for wildfire emergency action plan, etc.).
4
5
12
18
37
44
0 5 10 15 20 25 30 35 40 45 50
Agency policy and priority
Wilderness values, public support, and apprecia>on
Budget/staff/resources at grounds
Personal experience and apprecia>on to conduc>ng the survey
Survey related and use of survey findings for policy formula>on
Wilderness management
Percent of respondents
List of top
ics c
onvered in fina
l com
men
ts
Figure A5.6—Categories of final comments

96 USDA Forest Service RMRS-GTR-336. 2015.
Table A5.6—Final comments
Categorization of final comments (Figure A5.6) Number Percent
a. Wilderness management 36 44 - Management related (connection to wilderness is no longer a
necessary goal, continued emphasis from the Chief’s Office with clear expectations is critical, better priority to get more budget, staffs, need to designate more lands, need for region specific survey, cohesive and coordinated approach to manage wilderness by the 4 agencies is important, place priority on fire and resources, outreach to youth, utilize partnership to manage wilderness, etc.) 34
- Adaptation to climate change (climate smart change adaptation) 2 b. Survey related and use of survey findings for policy formulation 30 37 - Survey related (make it simple and easily understandable, some
questions are not relevant to all respondents, appreciation to the survey, need to cover more ground level problems, time is not suitable for the survey so send it early spring/late fall, future use of the survey findings, seasonal workforce are out of the survey, etc.) 26
- Use of survey for policy (results of this survey must guide development of a new strategic plan for the NWPS and include measurable objectives) 4
c. Personal experience and appreciation to conducing survey 15 18 - No comments (e.g., just thank you and appreciation to
conducting the survey) 8 - Personal experiences (different geographic regions have
different problems or challenges, wilderness managers work in multiple wilderness so geo-specific question is misleading, etc.) 7
d. Budget/staff/resources 10 12 - Lack of budget/staffs (need more hands and resources at grounds,
funding, create more position at ground level, etc.) 10 e. Wilderness values, public support, and appreciation 4 5 - Gaining public supports (better communication with the public
and with agencies, educating the public, etc.) 3 - Technology related (development of new apps and make it
available for users to increase public attachment and appreciation) 1 f. Agency policy and priority 3 4 - Agency policy (need for wildfire emergency action plan, no
recognition of conservation component in the BLM) 2 - Conflict in priority (higher priority at the national level, but no priority at the field level) 1
Total frequencies 82
Total responses 98
Note: Some responses fit into multiple categories. Hence, total frequencies are greater than total respondents and percentage total is greater than 100.

To learn more about RMRS publications or search our online titles:
www.fs.fed.us/rm/publications
www.treesearch.fs.fed.us
In accordance with Federal civil rights law and U.S. Department of Agriculture (USDA) civil rights regulations and policies, the USDA, its Agencies, offices, and employees, and institutions participating in or administering USDA programs are prohibited from discriminating based on race, color, national origin, religion, sex, gender identity (including gender expression), sexual orientation, disability, age, marital status, family/parental status, income derived from a public assistance program, political beliefs, or reprisal or retaliation for prior civil rights activity, in any program or activity conducted or funded by USDA (not all bases apply to all programs). Remedies and complaint filing deadlines vary by program or incident.
Persons with disabilities who require alternative means of communication for program information (e.g., Braille, large print, audiotape, American Sign Language, etc.) should contact the responsible Agency or USDA’s TARGET Center at (202) 720-2600 (voice and TTY) or contact USDA through the Federal Relay Service at (800) 877-8339. Additionally, program information may be made available in languages other than English.
To file a program discrimination complaint, complete the USDA Program Discrimination Complaint Form, AD-3027, found online at http://www.ascr.usda.gov/complaint_filing_cust.html and at any USDA office or write a letter addressed to USDA and provide in the letter all of the information requested in the form. To request a copy of the complaint form, call (866) 632-9992. Submit your completed form or letter to USDA by: (1) mail: U.S. Department of Agriculture, Office of the Assistant Secretary for Civil Rights, 1400 Independence Avenue, SW, Washington, D.C. 20250-9410; (2) fax: (202) 690-7442; or (3) email: [email protected].


![NET PRIMARY PRODUCTIVITY OF SUBALPINE MEADOWS IN …winapps.umt.edu/winapps/media2/leopold/pubs/801.pdfB.L. Wilson & Sami Gray [synonym C. brew-eri]) series, which occurs on very gentle](https://img.pdfslide.us/doc/110x75/5e270bfcaa3d0449c11e65c8/net-primary-productivity-of-subalpine-meadows-in-bl-wilson-sami-gray-synonym.jpg)