Embed Size (px)
Citation preview

RESULTS FOR THE FINANCIAL YEAR ENDED31 DECEMBER 201031 DECEMBER 2010

1. AWARDS & ACCOLADES

AWARDS & ACCOLADES
Awards won by the ARA Group …
• Asia’s “200 Best Under a Billion” 2010, Forbes Asia• Thomson Reuters Extel Asia IR Survey 2010
• Hong Kong Institute of Directors, Directors of the Year Awards 2010y
o CEO (Property & REITs – Asia), 2nd – Mr. John Lim, Group CEO
o CFO (Property & REITs – Asia), 2nd – Ms. Cheryl Seow, Group Finance Director
• IR Magazine South East Asia Awards
o Mr. Chiu Kwok Hung, Justin, Chairman• International Annual Report Competition Awards
o Gold Award – Printing and Production, 2010o Honors Award – Illustration, 2010o Honors Award – Non Traditional Annual Report 2010
o Certificate of Excellence, 2009
o Best Investor Relations for an IPO, 2008
o Honors Award – Non Traditional Annual Report, 2010o Honors Award – Overall Annual Report REIT, 2009o Bronze Award – Printing and Production, 2009
• International GALAXY Awardso Bronze Award – Annual Report, 2010
• Annual International Mercury Awards
• Securities Investors Association of Singapore Investors’ Choice Awardso Runner Up – Most Transparent Company Award (REITs),
2005 2006 2008 2009 2010
• Annual International Mercury Awardso Bronze Award – Interim Report 2010
• The Community Chest of Hong Kongo Platinum Award – Corporate & Employee Contribution
Programme, 2010/20112005, 2006, 2008, 2009, 2010
• International GALAXY Awards o Gold Award – Annual Report, 2010
3FY2010 Results

AWARDS & ACCOLADES
... a sterling recognition of ARA’s commitment to excellence & corporate governance
• International GALAXY Awards o Bronze Award – Annual Report, 2010
• Singapore Experience Awardso Best Business Venue Experience – 2006, 2009, 2010
o Honors Award –Annual Report Design, 2010o Gold Award – Annual Report Design, 2009o Silver Award – Annual Report, 2009o Honors Award – Annual Report, 2008
• Mercury Excellence Award Bronze Winner Overall Presentation of Annual Report 2009
o Most Innovative Marketing Initiative – 2006, 2009• World Travel Awards
o Asia’s Leading Meetings and Conference Centre, 2006 –2010
• TTG Travel AwardsBest Convention and Exhibition Centre 2007 2010o Bronze Winner – Overall Presentation of Annual Report 2009,
2010• Vision Awards
o Honors Award – Excellence in Development of Annual Report, 2009
o Best Convention and Exhibition Centre, 2007 – 2010• The Meetings and Incentive Travel Award
o Silver Award – Best Overseas Conference Centre, 2010• CEI Asia Industry Awards
o Best Convention and Exhibition Centre, Runner‐up, 2010o Best MICE Sales Team, Runner‐up, 2010
• Securities Investors Association of Singapore Investors’ Choice Awards
M T C A d (R U ) N I
o Best MICE Sales Team, Runner up, 2010• Patron of the Arts Awards
o Distinguished Patron of the Arts, 2008 ‐ 2010
o Most Transparent Company Award (Runner‐Up) ‐ New Issues Category, 2010
4FY2010 Results

2. BUSINESS OVERVIEW

BUSINESS SEGMENTS
ARA ASSET MANAGEMENT LIMITED
REITsPrivate Real Estate
FundsReal Estate
Management ServicesCorporate FinanceAdvisory Services
BusinessSegments
Revenue ‐Recurrent(Primary Basis)
Portfolio Management Fees(Committed Capital / Gross Property Value)
Base Fees(Gross Property Value)
Performance / V i bl F
Property Management Fees(Property Gross Revenue)
Convention & Exhibition S i F
Performance Fees(I b H dl )
Variable Fees(Net Property Income)
Acquisition / Divestment
Service Fees(Gross Revenue)
Advisory Fees( h V l )
Revenue ‐ Consultancy Fees( j V l )(IRR above Hurdle)
Return on Seed Capital
Fees(Gross Property Value)
(Purchase Value)One‐off(Primary Basis)
(Project Value)
6FY2010 Results

FUNDS & SERVICES
Diversified & complementary fund platforms & services
Listing Venue SGX‐ST & SEHK SGX‐ST SEHK Bursa SGX‐ST
Focus Suburban retail Prime office & Office & industrial/ Commercial properties Logistics properties
REITs
properties in Hong Kong
retail properties in Singapore
office properties in Hong Kong
in Malaysia in the Asia Pacific region
Property Value(1) HK$13,300m S$7,044m HK$5,529m RM1,009m S$744m
Private Real Estate Funds
ADF ARA Asia Dragon Fund
ARA Harmony Fund
Description Flagship strategic and opportunistic private real estate fund investing in
Singapore, Hong Kong, China, Malaysia and other emerging
economies in Asia
Single‐asset private real estate fund which owns the Suntec Singapore Int’l
Convention & Exhibition Centre
Strategic alliance with Australian specialist real estate investment manager, APN Property Group(2)
for private funds investing primarily in Australian real estate
Description Property managementi id
Operations, sales and marketing services provider & consultant for i hibi i i d f ili i
Fund Size US$1.1b (committed capital) S$288m (gross asset value) ‐
Real Estate Management Services
7
services provider convention, exhibition, meeting and event facilities
Notes: (1) Property values as of last publicly‐announced valuation(2) ARA currently holds a 14.1% interest in APN Property Group
FY2010 Results

REGIONAL PRESENCE
Established regional networkBeijing
• Established regional network spanning 11 cities in the Asia‐Pacific, including 6 cities in the
Beijing
Tianjin
Nanjing
Dalian
Shanghai
PRC MainlandGuangzhou
Hong Kong
Singapore
Kuala Lumpur
Malacca
8FY2010 Results Melbourne

MANAGEMENT TEAM
Experienced team with a proven track record
Group CEOJohn Lim
REITs Private Real Estate Funds
CORPORATE DIVISIONSBUSINESS UNITS
Finance & ComplianceCheryl Seow
Group Finance Director
Corporate OfficeNg Beng Tiong
Director
Corporate Business DevelopmentMoses SongDirector
Suntec REITYeo See Kiat
CEO
Fortune REITAnthony Ang
CEO
Private Funds Group / ADF INg Beng Tiong
CEO
ARA Harmony FundJustine Wingrove
CEO
Real Estate Management Services
China DeskMun Hon PhengCountry Head
Prosperity REITStephen Chu
CEO
Cache Logistics TrustDaniel Cerf
Australia DeskMoses Song
APM Property ManagementSusan Sim
Corporate Development & HRl
AmFIRST REITLim Yoon Peng
CEO
CEO Director
Group Risk Mgmt & Internal AuditTang Boon Kang
Manager
CEO
Suntec SingaporePieter Idenburg
CEO
9
Corporate Finance Advisory ServicesPauline LimManager
ARA FinancialLow Poh Choo
Director
Office AdministrationSerene YeoManager
FY2010 Results

ASSETS UNDER MANAGEMENT
S$16.9 billion (US$13.1 billion) as at 31 Dec 2010
11.7
12.9
16.9
12.0
14.0
16.0
18.0Real Estate Management Services Private Funds ‐ Capital
Private Real Estate Funds REITs ‐ Real Estate
3.5
5.46.3
9.6
4 0
6.0
8.0
10.0
( ) $
0.6
3.5
0.0
2.0
4.0
31 Dec 03 31 Dec 04 31 Dec 05 31 Dec 06 31 Dec 07 31 Dec 08 31 Dec 09 31 Dec 10
Notes:(1) Based on exchange rates as at 31 Dec 2010(2) Comprises gross property value of REITs managed by
Assets Under Management(1) (S$ billion) 31 Dec 2010 31 Dec 2009 Change
REITs – Real Estate(2) 11.4 8.4 3.0
Private Real Estate Funds – Real Estate 4.8 3.3 1.5
Private Real Estate Funds Capital 0 4 1 0 (0 6)
10
g ysubsidiaries & associated companies(3) Revenue base for real estate management services fee computation
Private Real Estate Funds – Capital 0.4 1.0 (0.6)
Real Estate Management Services(3) 0.3 0.3 ‐
Total 16.9 12.9 4.0FY2010 Results
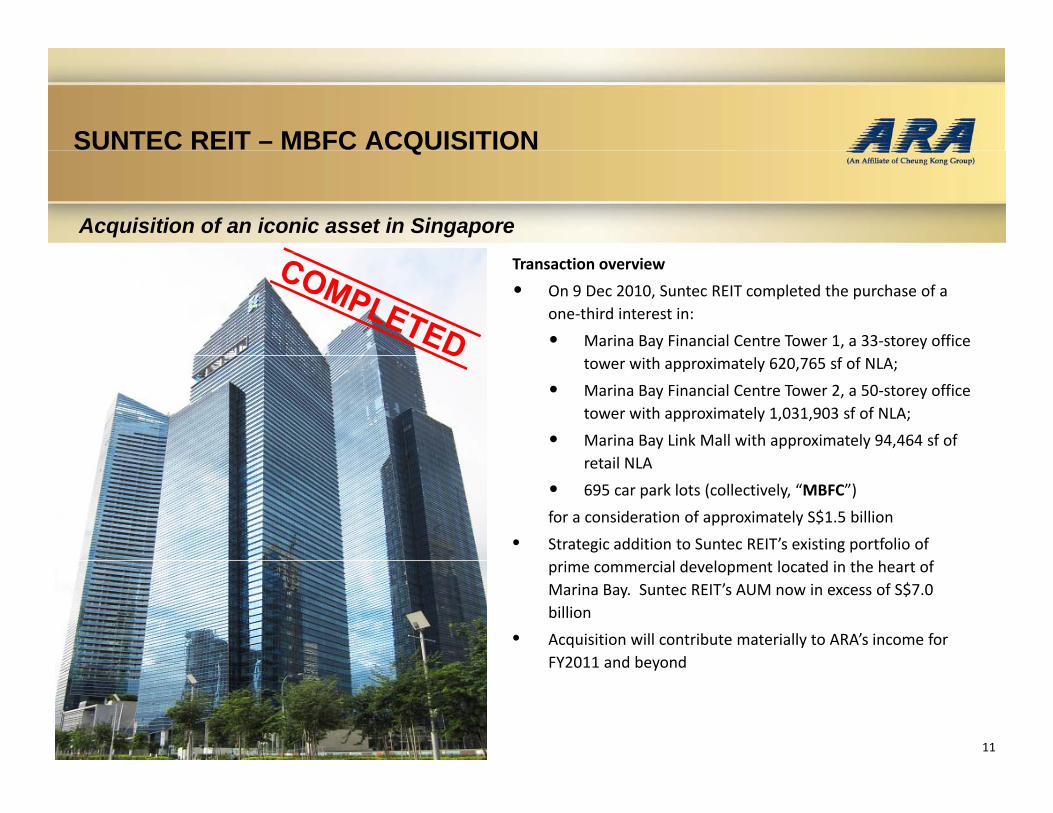
SUNTEC REIT – MBFC ACQUISITIONQ
Acquisition of an iconic asset in Singapore Transaction overview
• On 9 Dec 2010, Suntec REIT completed the purchase of a one‐third interest in:
• Marina Bay Financial Centre Tower 1, a 33‐storey office tower with approximately 620,765 sf of NLA;
• Marina Bay Financial Centre Tower 2, a 50‐storey office tower with approximately 1,031,903 sf of NLA;
• Marina Bay Link Mall with approximately 94,464 sf of il NLAretail NLA
• 695 car park lots (collectively, “MBFC”)
for a consideration of approximately S$1.5 billion
• Strategic addition to Suntec REIT’s existing portfolio of l d l l d h h fprime commercial development located in the heart of
Marina Bay. Suntec REIT’s AUM now in excess of S$7.0 billion
• Acquisition will contribute materially to ARA’s income for FY2011 and beyondFY2011 and beyond
11

3. FINANCIAL RESULTS

FINANCIAL HIGHLIGHTS
Revenue tops S$100m, record net profit
FY2010 FY2009 Change (%)
Revenue
M f (1) (S$’000) 84 630 67 102 26%Management fees(1) (S$’000) 84,630 67,102 26%
Acquisition and performance fees(2) (S$’000) 17,499 7,494 134%
Other income(3) (S$’000) 10 382 11 683 (11%)Other income (S$ 000) 10,382 11,683 (11%)
Total Revenue (S$’000) 112,511 86,279 30%
Net Profit (S$’000) 63,812 48,339 32%
EPS(4) (S cents) 9.13 6.92 32%
Net Margin (%) 57% 56% 1% pt
13
Notes:(1) Recurrent management fees from REITs, private real estate funds and real estate management services(2) Primarily REIT acquisition fees and private fund arrangement/performance fees(3) Comprises mainly distribution income from financial assets and gain on disposal/fair valuation of held‐for‐trading
securities received as part payment of REIT management fees(4) Based on 698,471,997 shares in issue following the 1‐for‐5 bonus issue on 10 May 2010FY2010 Results

REVENUE & NET PROFIT
Consistent track record of revenue and profit growth
Revenue – Historical Net Profit ‐ HistoricalS$m S$m
80
100
120Recurrent management fees
Acquisition & performance fees
Other income
112.5
86.348.3
63.8
50
60
70S$m
Net Profit
40
60
8070.0
62.1
31 3
34.036.7
20
30
40
0
20
FY2005 FY2006 FY2007 FY2008 FY2009 FY2010
31.327.6
13.4 13.5
0
10
20
FY2005 FY2006 FY2007 FY2008 FY2009 FY2010
14FY2010 Results
FY2005 FY2006 FY2007 FY2008 FY2009 FY2010 FY2005 FY2006 FY2007 FY2008 FY2009 FY2010

DIVIDEND HISTORY
Proposed final dividend of S$0.025 per share, S$0.048 per share for FY2010Subject to shareholder approval at AGM to be held on 28 April 2011
DPS (Period) DPS (FY)(S$) (S$)
0.022 0.022 0.023
0.025
0.023
0.0250.025
0.030(Proposed)
0.044
0.048
0.058
0.050
0.060 #
0.019
0.015
0.020 * 0.038
0.030
0.040
0 000
0.005
0.010
0 000
0.010
0.020
FY2010 Results 15
0.000
2H07 1H08 2H08 1H09 2H09 1H10 2H10
* ‐pro‐rated
0.000
FY07 FY08 FY09 FY10
# ‐ inclusive of proposed final dividend, adjusted for bonus issue in May 2010

BALANCE SHEET
Robust balance sheet$ $Group balance sheet as at 31 Dec 2010 S$’000 S$’000
Non‐current assets Non‐current liabilitiesPlant and equipment 1,498 Financial liabilities 387 Tenancy deposits 495 Deferred tax liabilities 142 Associates 1,060 ,Financial assets 125,658 Other receivables 8,000 Intangible asset 798
137,509 529 C t t C t li bilitiCurrent assets Current liabilitiesFinancial assets 15,299 Trade and other payables 20,200 Derivative assets 119 Financial liabilities 18,971 Trade and other receivables 26,372 Current tax payable 8,408 Cash and cash equivalents 42,327 q
84,117 47,579
Total liabilities 48,108
Sh h ld ’ i 173 518
16FY2010 Results
Shareholders’ equity 173,518
Total assets 221,626 Total liabilities & Shareholders’ equity 221,626

4. STRATEGY

STRATEGY
Poised for the next phase of growth
• Work with various partners to launch new REITs in new sectors and geographies• Existing REITs to continue to focus on asset enhancements and acquisitions
REITs
Private Real Estate Funds
• Place out remaining committed capital of ADF I in 1H2011• Launch ADF II by 1H2011
• Support REITs and private real estate funds and increase properties under management • Leverage on the Suntec brand to expand geographical reach of convention services
Real Estate Management Services
FY2010 Results 18
DISCLAIMERDISCLAIMER
These slides may contain forward‐looking statements that involve risks and uncertainties. Actual future performance, outcomes and resultsmay differ materially from those expressed in forward‐looking statements as a result of a number of uncertainties, risks and assumptions.Representative examples of these factors include but are not limited to general market and economic conditions, interest rate trends,competition from other real estate investors, changes in operating expenses including employee wages and benefits, changes in governmentpolicies, and the continued availability of financing in the amounts and terms necessary to support future business. You are cautioned not toplace undue reliance on the forward‐looking statements in these slides, which are based on the current view of management on futurep g , gevents. Information from external sources in these slides has not been independently verified by us nor have the external sources quotedconsented to the inclusion of the information.
ContactCh l S Vi t Y CFA
Gl b l H d
Cheryl SeowGroup Finance [email protected]
Vincent Yeo, CFAManager, Corporate [email protected]
Global Headquarters:6 Temasek BoulevardSuntec Tower Four, #16‐02Singapore 038986
Tel: (65) 6835 9232( )Fax: (65) 6835 9672
Website: www.ara‐asia.com