Embed Size (px)
Citation preview
Results for 9M15 11 November 2015
Disclaimer
This document contains forward-looking statements regarding intention, expectations or estimates of the Company or its management at the date of issue thereof, relating to various aspects, including the growth of various lines of business and the business overall, the market share, the results of the Company and other aspects of the activity and status thereof.
Analysts and investors should bear in mind that such estimates do not amount to any warranty as to the future behavior or results of the Company, and they shall bear all risks and uncertainties with regard to relevant aspects, and thus, the real future results and behavior of the Company might be substantially different from what is stated in the said predictions or estimates.
The statements in this statement should be taken into account by any persons or entities who may have to make decisions or prepare or disseminate opinions on securities issued by the Company and, in particular, by the analysts who handle this document. All are invited to consult the documentation and information published or registered by the Company before the National Securities Market Commission.
The financial information contained in this document has been prepared under International Financial Reporting Standards (IFRS). This financial information is unaudited and, therefore, is subject to potential future modifications.
This document is only provided for information purposes and does not constitute, nor may it be interpreted as, an offer to sell or exchange or acquire, or solicitation for offers to purchase or accept any kind of compromise.
Certain numerical figures included in this document have been rounded. Therefore, discrepancies in tables and graphs between totals and the sums of the amounts listed may occur due to such rounding.
Translation of a report originally issued in Spanish. In the event of a discrepancy, the Spanish-language version prevails.
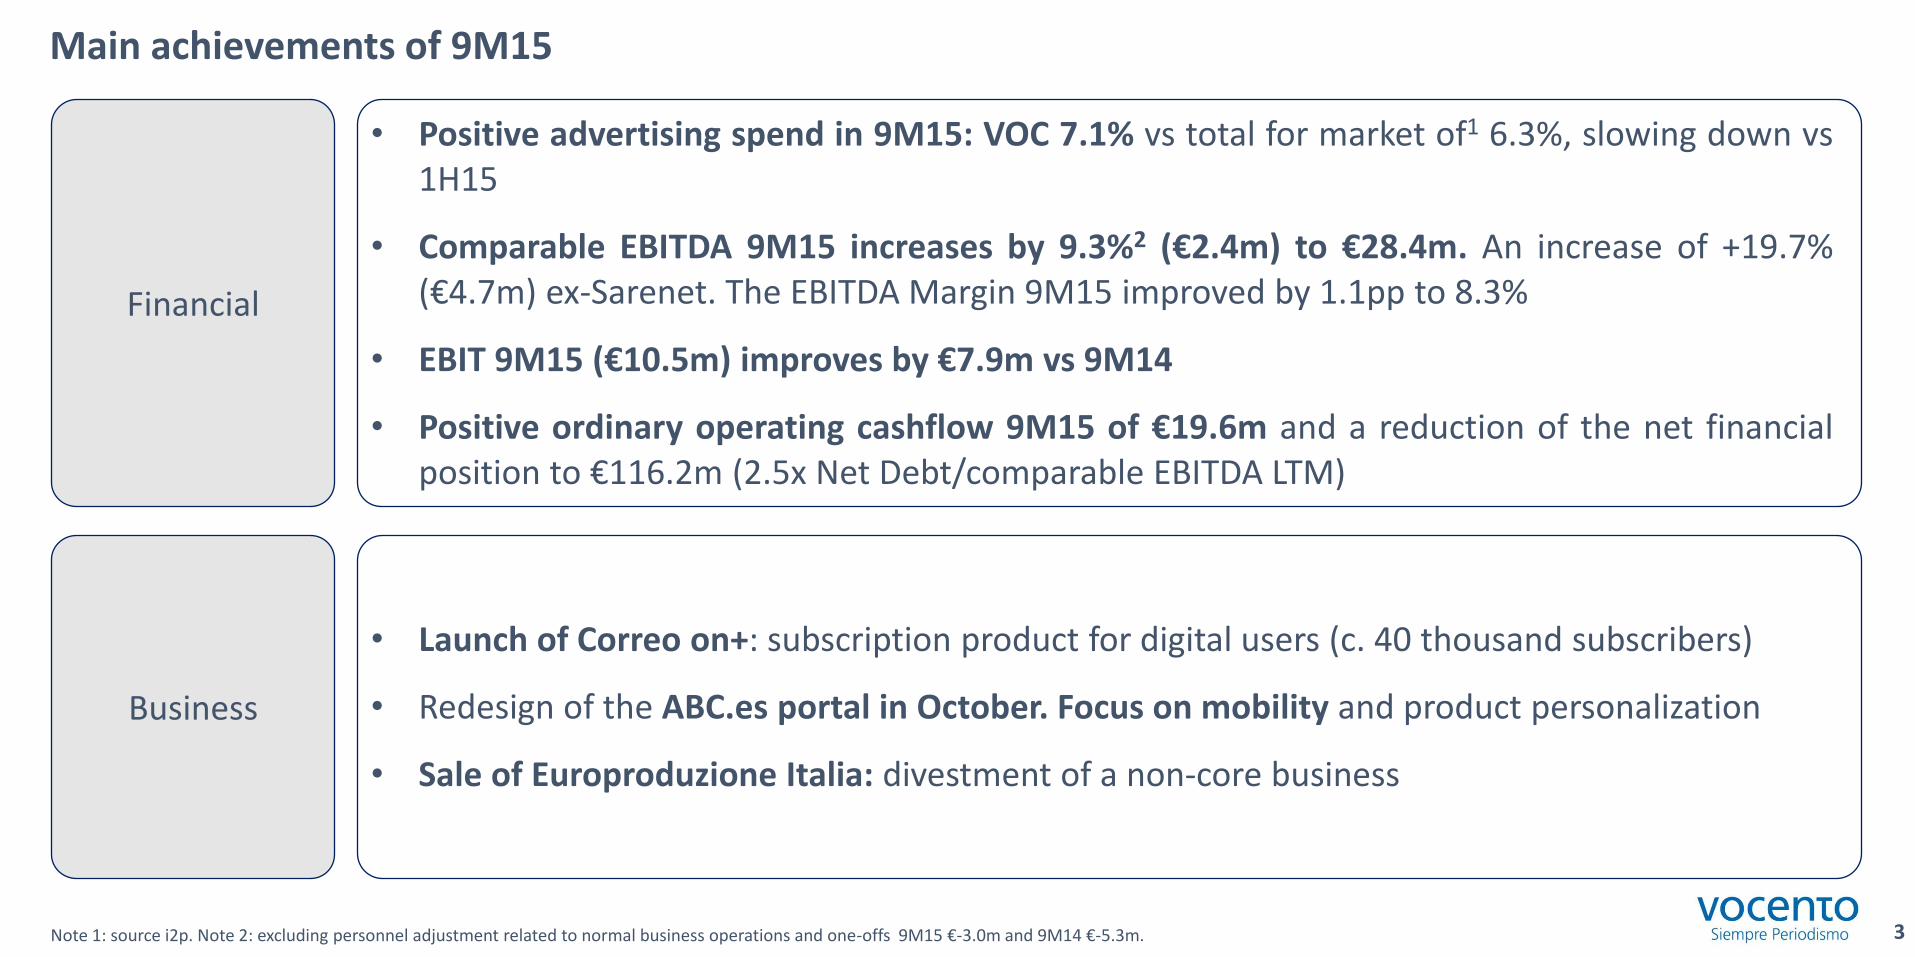
• Positive advertising spend in 9M15: VOC 7.1% vs total for market of1 6.3%, slowing down vs 1H15
• Comparable EBITDA 9M15 increases by 9.3%2 (€2.4m) to €28.4m. An increase of +19.7% (€4.7m) ex-Sarenet. The EBITDA Margin 9M15 improved by 1.1pp to 8.3%
• EBIT 9M15 (€10.5m) improves by €7.9m vs 9M14
• Positive ordinary operating cashflow 9M15 of €19.6m and a reduction of the net financial position to €116.2m (2.5x Net Debt/comparable EBITDA LTM)
Note 1: source i2p. Note 2: excluding personnel adjustment related to normal business operations and one-offs 9M15 €-3.0m and 9M14 €-5.3m. 3
Main achievements of 9M15
• Launch of Correo on+: subscription product for digital users (c. 40 thousand subscribers)
• Redesign of the ABC.es portal in October. Focus on mobility and product personalization
• Sale of Europroduzione Italia: divestment of a non-core business
Financial
Business
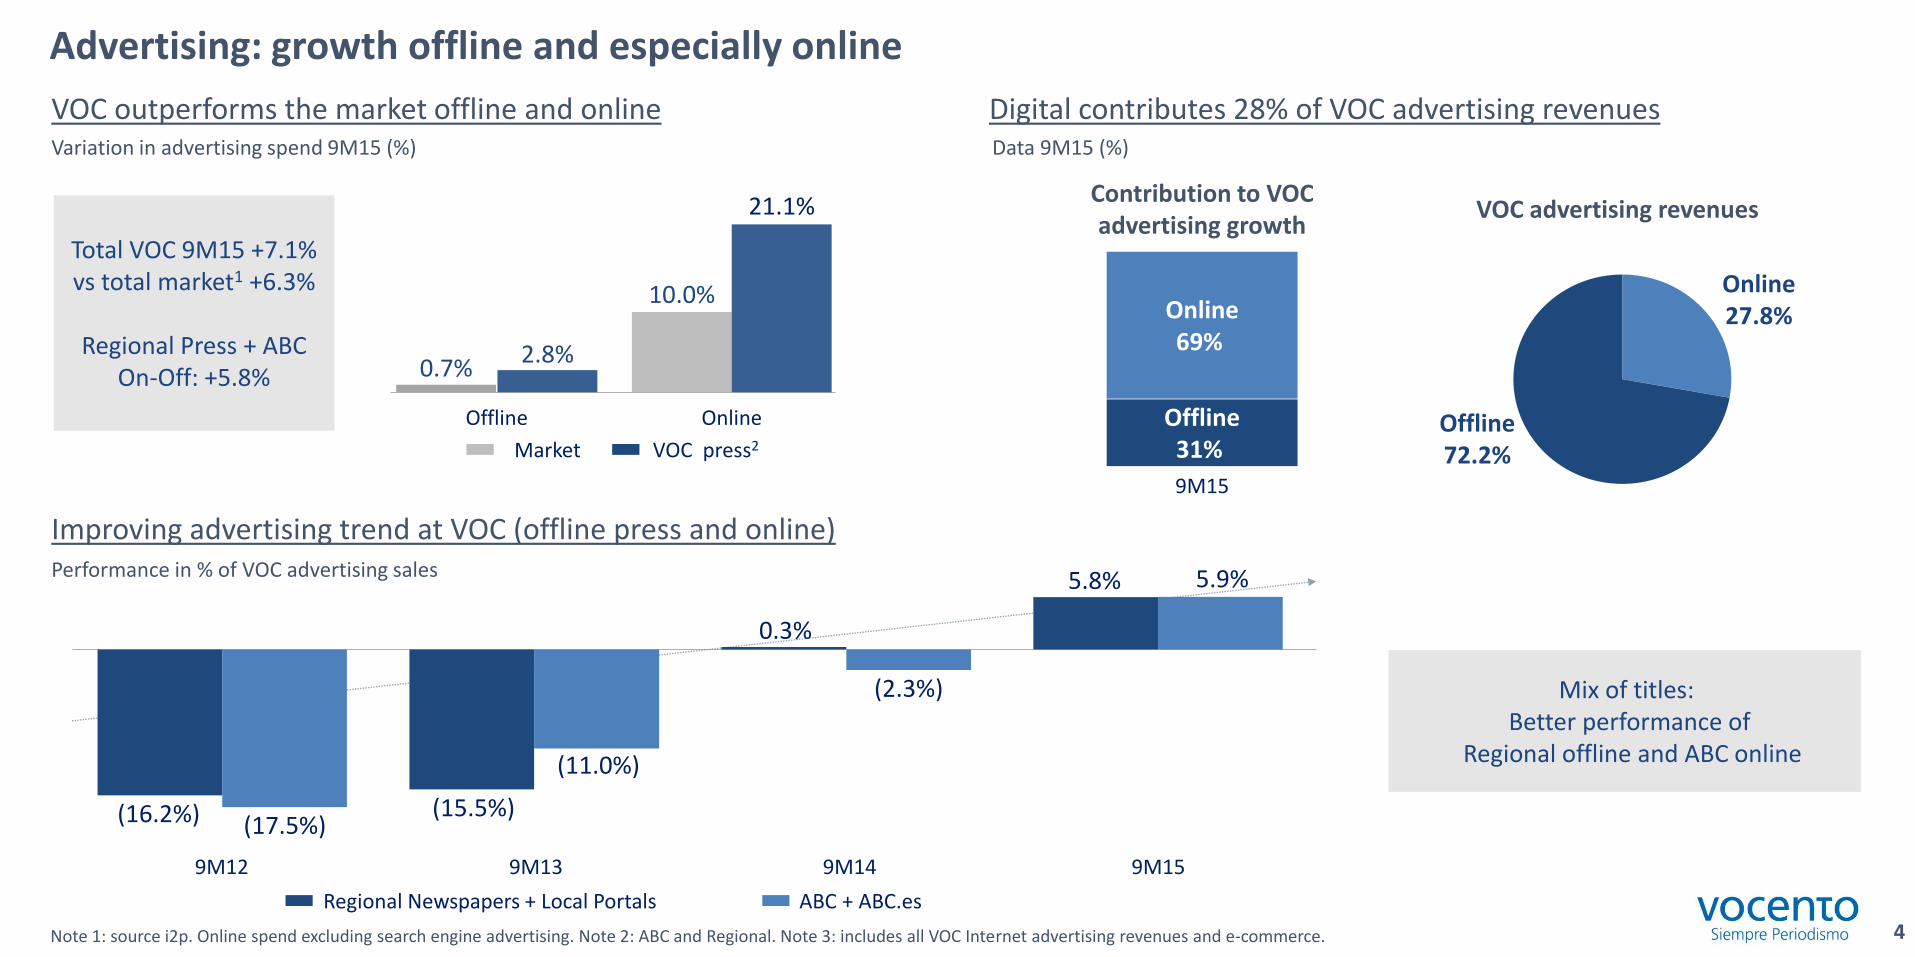
Advertising: growth offline and especially online
Note 1: source i2p. Online spend excluding search engine advertising. Note 2: ABC and Regional. Note 3: includes all VOC Internet advertising revenues and e-commerce.
VOC outperforms the market offline and online
Variation in advertising spend 9M15 (%)
Improving advertising trend at VOC (offline press and online) Performance in % of VOC advertising sales
4
Digital contributes 28% of VOC advertising revenues Data 9M15 (%)
VOC advertising revenues
ABC + ABC.es Regional Newspapers + Local Portals
5.8% 5.9%
(16.2%) (17.5%) (15.5%)
(11.0%)
0.3%
(2.3%)
9M15 9M14 9M13 9M12
Total VOC 9M15 +7.1% vs total market1 +6.3%
Regional Press + ABC
On-Off: +5.8%
VOC press2 Market
Offline
0.7% 2.8%
Online
10.0%
21.1%
Offline 72.2%
Online 27.8%
Offline 31%
Online 69%
9M15
Contribution to VOC advertising growth
Mix of titles: Better performance of
Regional offline and ABC online
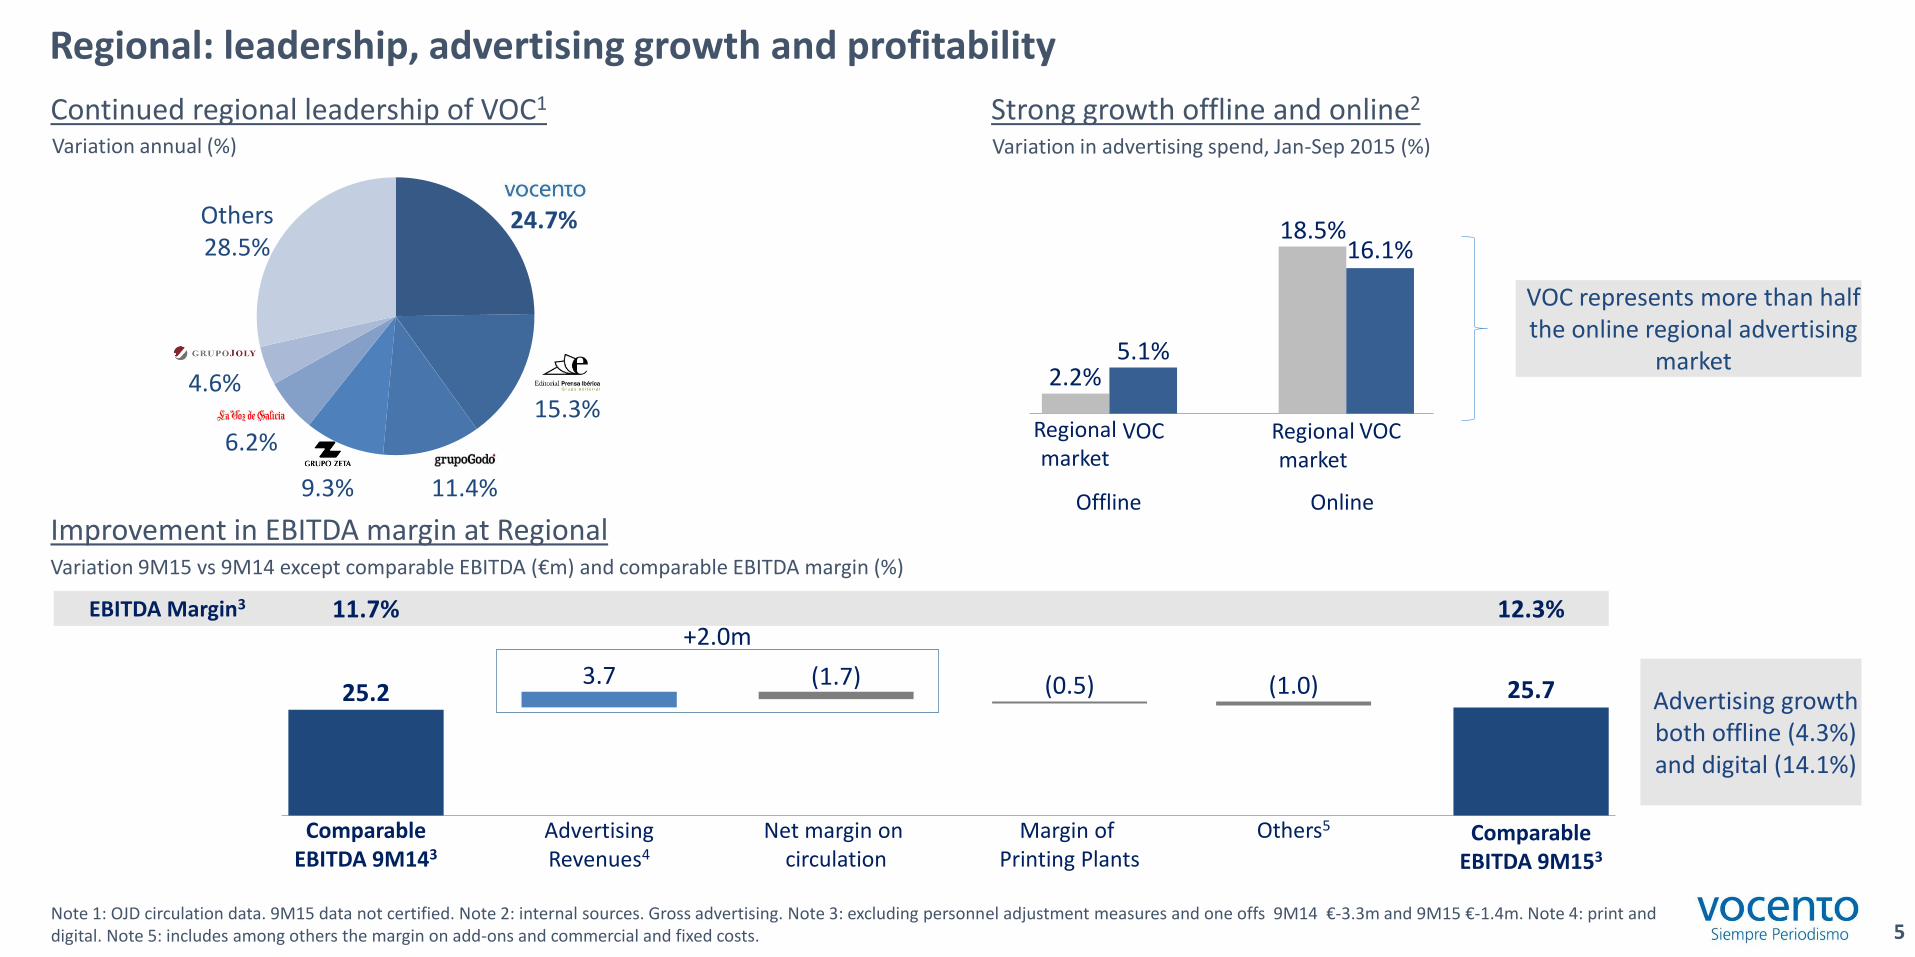
Regional: leadership, advertising growth and profitability
Note 1: OJD circulation data. 9M15 data not certified. Note 2: internal sources. Gross advertising. Note 3: excluding personnel adjustment measures and one offs 9M14 €-3.3m and 9M15 €-1.4m. Note 4: print and digital. Note 5: includes among others the margin on add-ons and commercial and fixed costs.
Improvement in EBITDA margin at Regional
Continued regional leadership of VOC1
Variation 9M15 vs 9M14 except comparable EBITDA (€m) and comparable EBITDA margin (%)
Strong growth offline and online2
Variation in advertising spend, Jan-Sep 2015 (%)
5
EBITDA Margin3
Margin of Printing Plants
Others5 Comparable EBITDA 9M153
VOC represents more than half the online regional advertising
market
Offline Online
Comparable EBITDA 9M143
25.2 (1.0)
Net margin on circulation
Advertising Revenues4
3.7 (1.7) (0.5) 25.7
12.3% 11.7%
Advertising growth both offline (4.3%) and digital (14.1%)
11.4%
6.2%
4.6%
Others 28.5%
24.7%
9.3%
15.3% Regional market
VOC
2.2% 5.1%
Regional market
VOC
18.5% 16.1%
+2.0m
Variation annual (%)
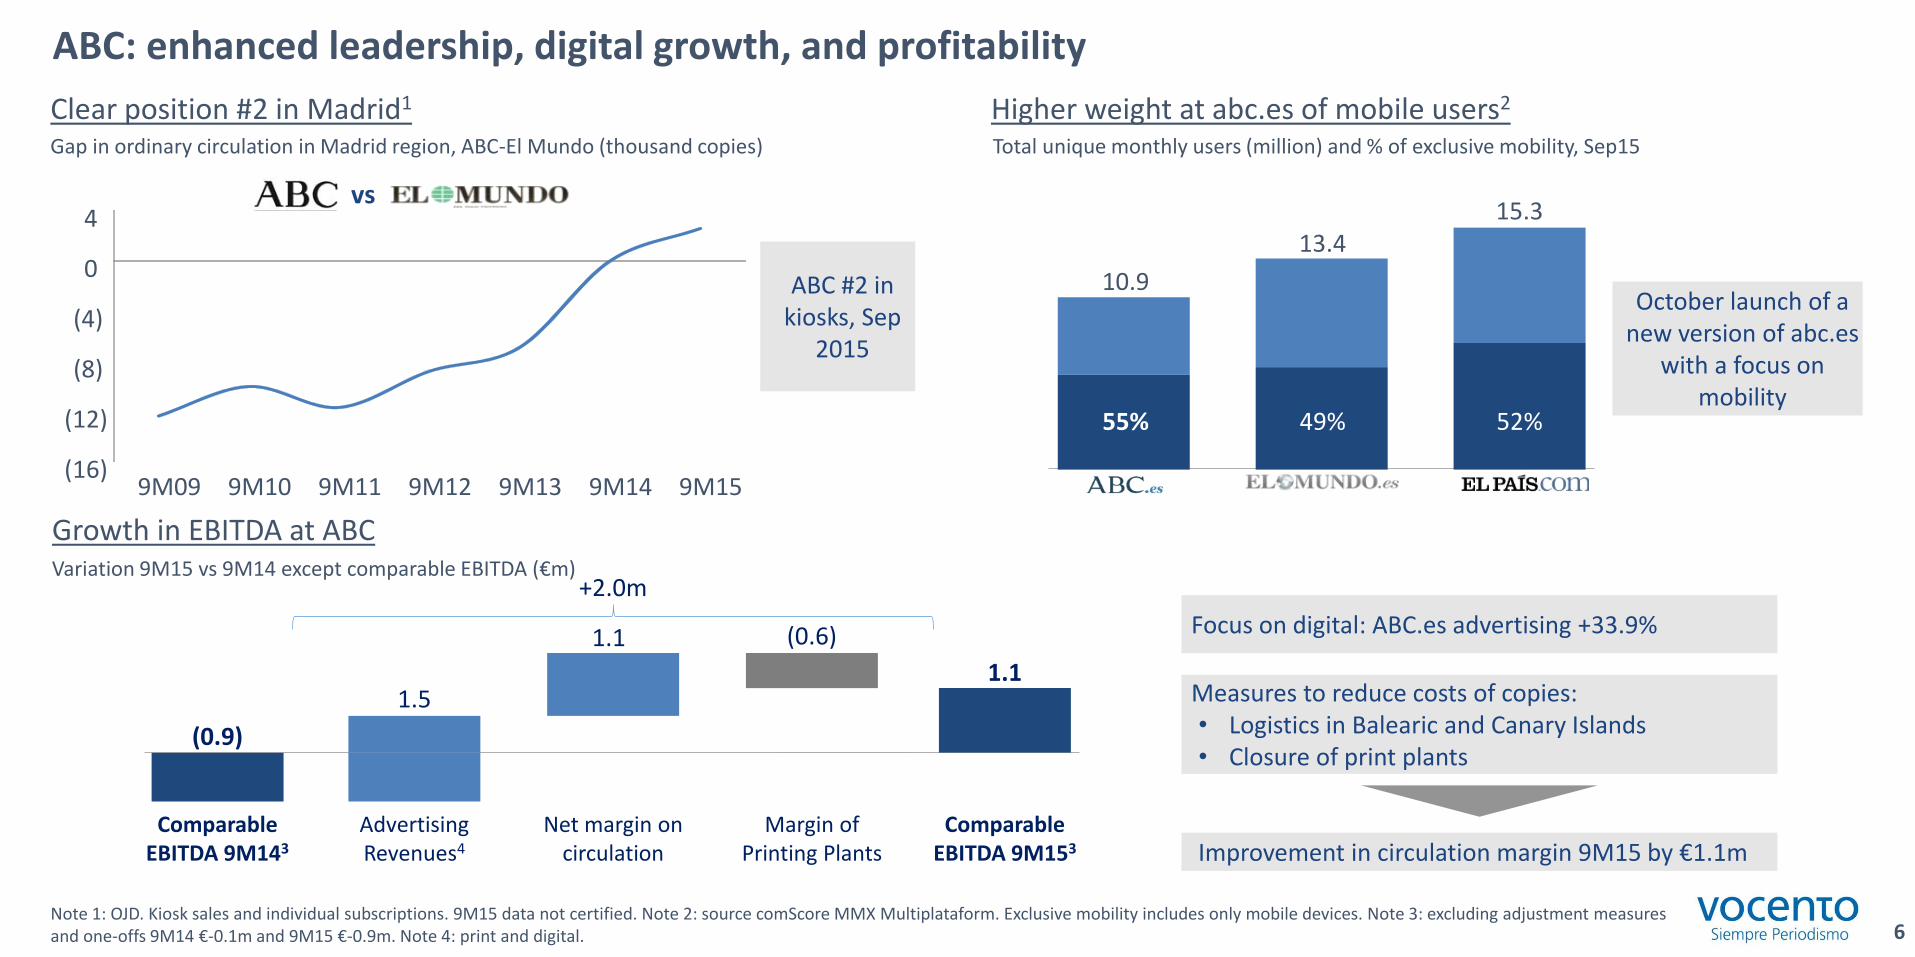
ABC: enhanced leadership, digital growth, and profitability
Higher weight at abc.es of mobile users2 Clear position #2 in Madrid1
Gap in ordinary circulation in Madrid region, ABC-El Mundo (thousand copies) Total unique monthly users (million) and % of exclusive mobility, Sep15
Note 1: OJD. Kiosk sales and individual subscriptions. 9M15 data not certified. Note 2: source comScore MMX Multiplataform. Exclusive mobility includes only mobile devices. Note 3: excluding adjustment measures and one-offs 9M14 €-0.1m and 9M15 €-0.9m. Note 4: print and digital.
Growth in EBITDA at ABC Variation 9M15 vs 9M14 except comparable EBITDA (€m)
6
Focus on digital: ABC.es advertising +33.9%
Measures to reduce costs of copies: • Logistics in Balearic and Canary Islands • Closure of print plants
Improvement in circulation margin 9M15 by €1.1m
October launch of a new version of abc.es
with a focus on mobility
vs
Comparable EBITDA 9M143
(0.9)
Comparable EBITDA 9M153
1.1
Advertising Revenues4
1.5
Margin of Printing Plants
(0.6)
Net margin on circulation
1.1
+2.0m
ABC #2 in kiosks, Sep
2015
(16)
(12)
(8)
(4)
0
4
9M09 9M10 9M11 9M12 9M13 9M14 9M15
47% 52% 45% 52% 55%
10.9
49%
13.4 15.3
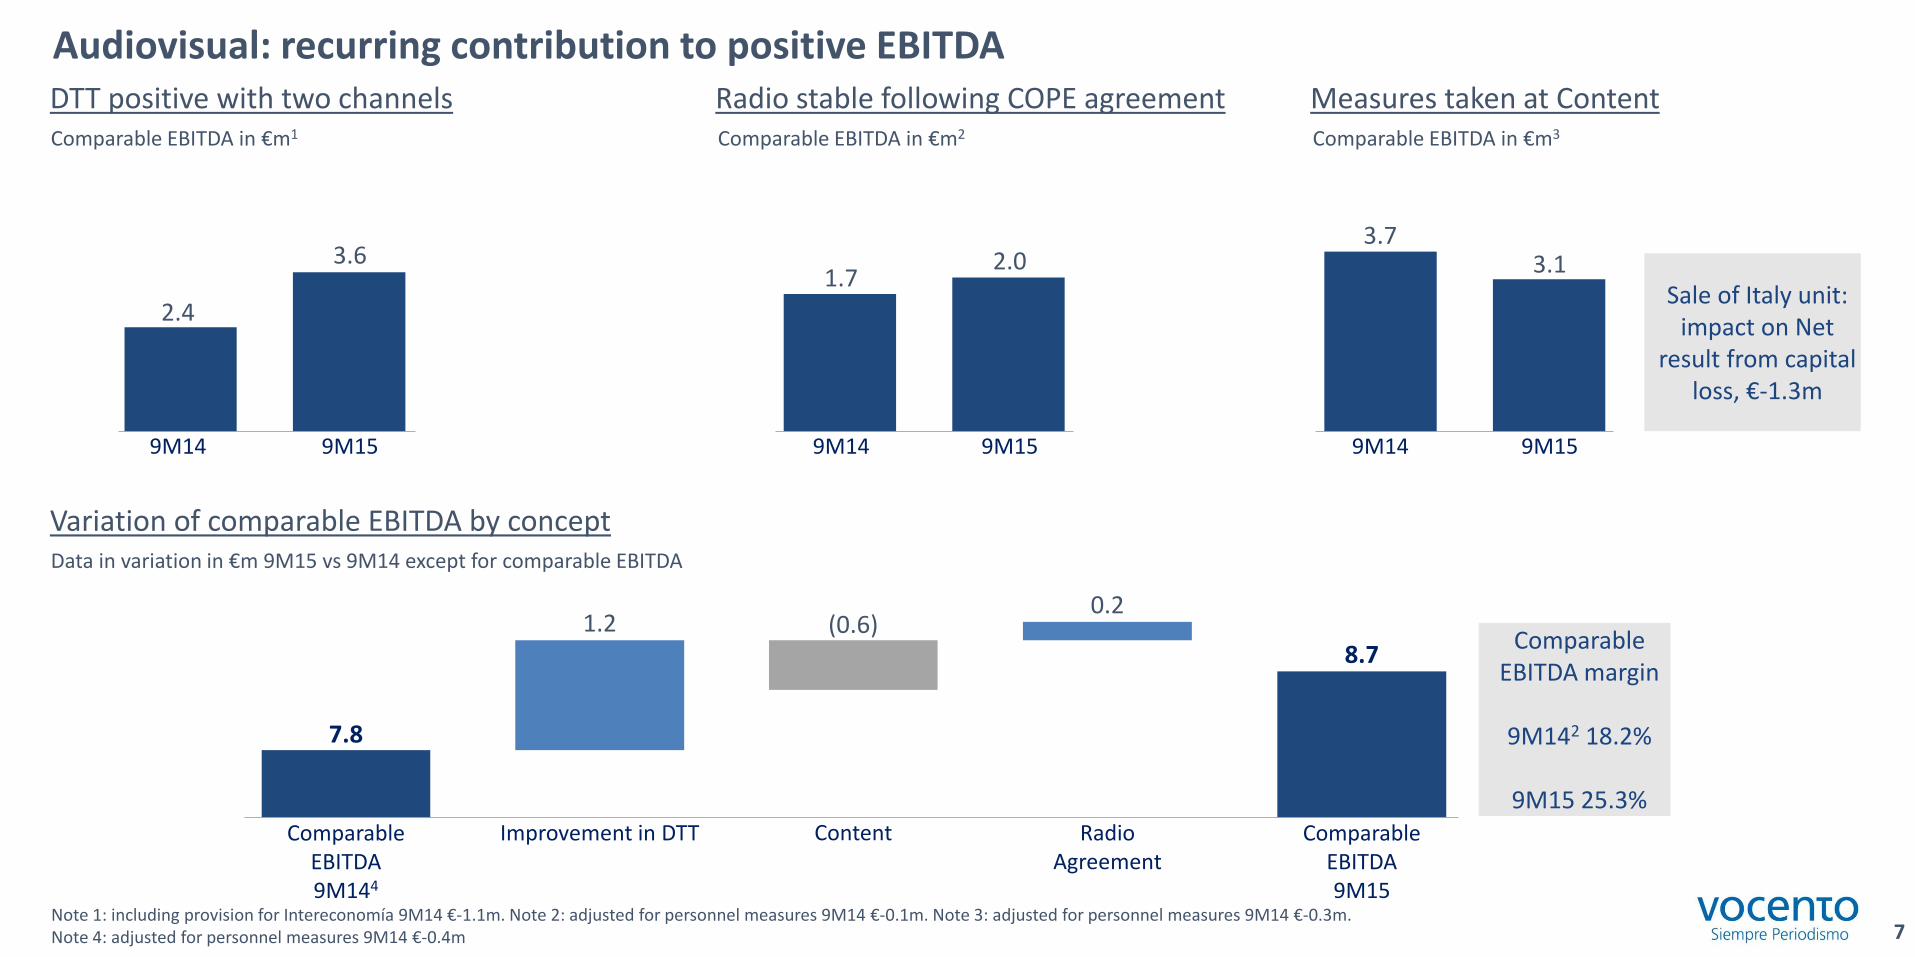
Audiovisual: recurring contribution to positive EBITDA
Note 1: including provision for Intereconomía 9M14 €-1.1m. Note 2: adjusted for personnel measures 9M14 €-0.1m. Note 3: adjusted for personnel measures 9M14 €-0.3m. Note 4: adjusted for personnel measures 9M14 €-0.4m
Data in variation in €m 9M15 vs 9M14 except for comparable EBITDA
Variation of comparable EBITDA by concept
DTT positive with two channels Radio stable following COPE agreement Measures taken at Content Comparable EBITDA in €m1 Comparable EBITDA in €m3
7
Sale of Italy unit: impact on Net
result from capital loss, €-1.3m
9M14 9M15
2.4
3.6
9M14 9M15
1.7 2.0
9M14 9M15
3.7 3.1
Comparable EBITDA in €m2
Comparable EBITDA margin
9M142 18.2%
9M15 25.3%
Comparable EBITDA 9M144
7.8
Improvement in DTT
1.2
Content
(0.6)
Radio Agreement
0.2
Comparable EBITDA 9M15
8.7
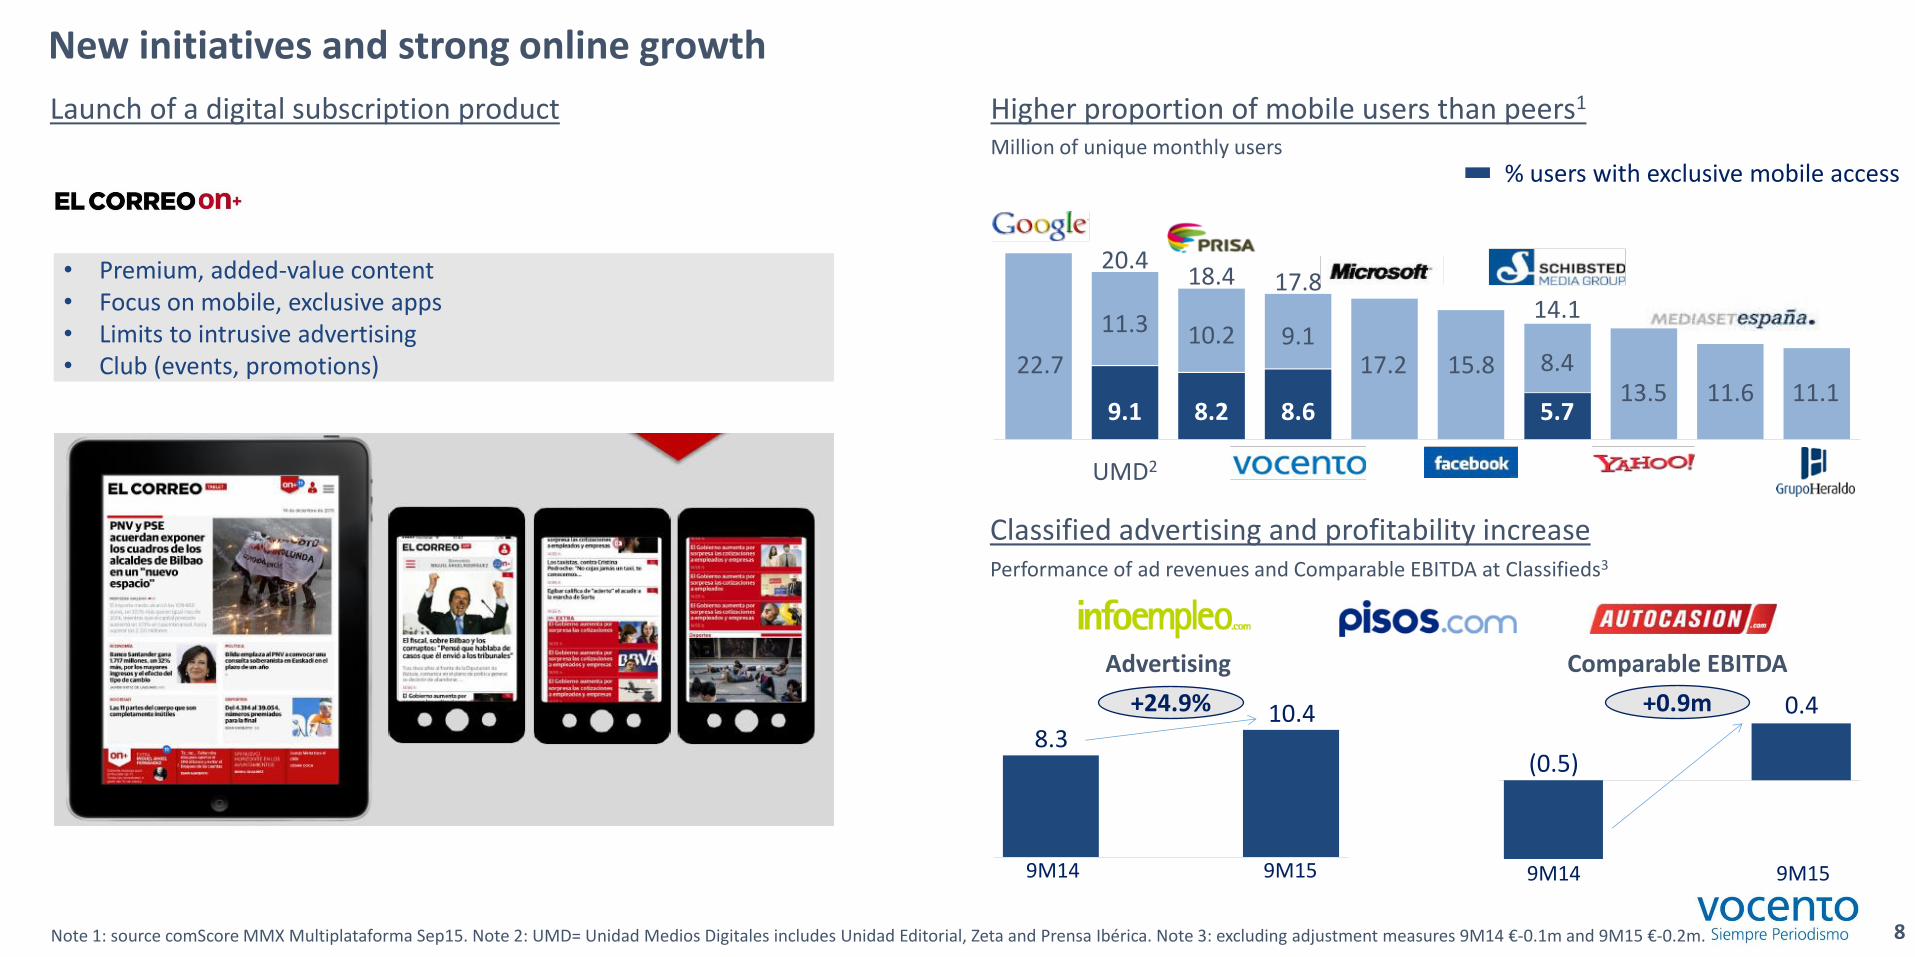
Higher proportion of mobile users than peers1
Million of unique monthly users
Note 1: source comScore MMX Multiplataforma Sep15. Note 2: UMD= Unidad Medios Digitales includes Unidad Editorial, Zeta and Prensa Ibérica. Note 3: excluding adjustment measures 9M14 €-0.1m and 9M15 €-0.2m.
Launch of a digital subscription product
Classified advertising and profitability increase Performance of ad revenues and Comparable EBITDA at Classifieds3
New initiatives and strong online growth
% users with exclusive mobile access
• Premium, added-value content • Focus on mobile, exclusive apps • Limits to intrusive advertising • Club (events, promotions)
+0.9m 0.4
9M15 9M14
(0.5)
Comparable EBITDA
+24.9%
9M14
8.3
9M15
10.4
Advertising
8
UMD2
9.1 8.2 8.6 5.7
22.7
11.3 10.2 9.1 17.2 15.8 8.4
13.5 11.6 11.1
20.4 18.4 17.8
14.1
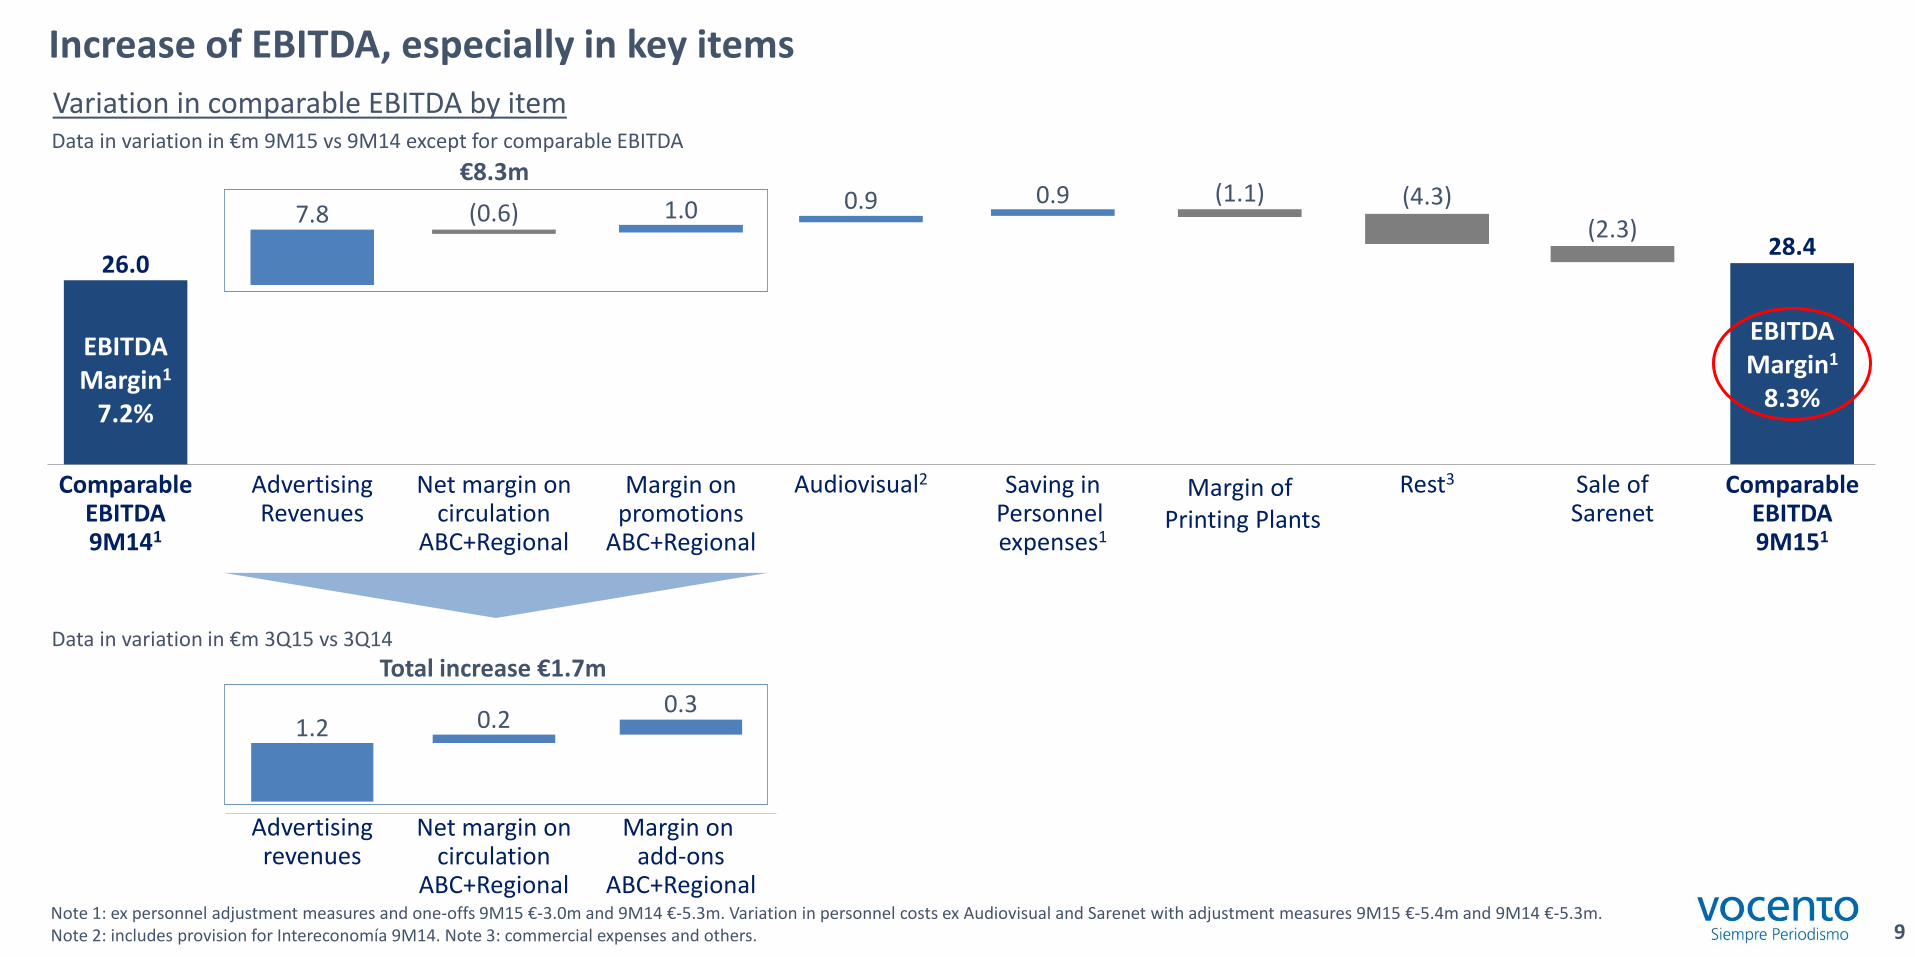
Note 1: ex personnel adjustment measures and one-offs 9M15 €-3.0m and 9M14 €-5.3m. Variation in personnel costs ex Audiovisual and Sarenet with adjustment measures 9M15 €-5.4m and 9M14 €-5.3m. Note 2: includes provision for Intereconomía 9M14. Note 3: commercial expenses and others.
Increase of EBITDA, especially in key items
Data in variation in €m 9M15 vs 9M14 except for comparable EBITDA
Variation in comparable EBITDA by item
Data in variation in €m 3Q15 vs 3Q14
Saving in Personnel expenses1
Audiovisual2 Sale of Sarenet
Margin of Printing Plants
Rest3 Comparable EBITDA
9M141
Comparable EBITDA 9M151
EBITDA Margin1
8.3%
EBITDA Margin1
7.2%
26.0
Net margin on circulation
ABC+Regional
Advertising Revenues
Margin on promotions
ABC+Regional
7.8 (0.6) 1.0 0.9 0.9 (1.1) (4.3) (2.3)
28.4
€8.3m
Advertising revenues
Margin on add-ons
ABC+Regional
Net margin on circulation
ABC+Regional
1.2 0.2 0.3
Total increase €1.7m
9
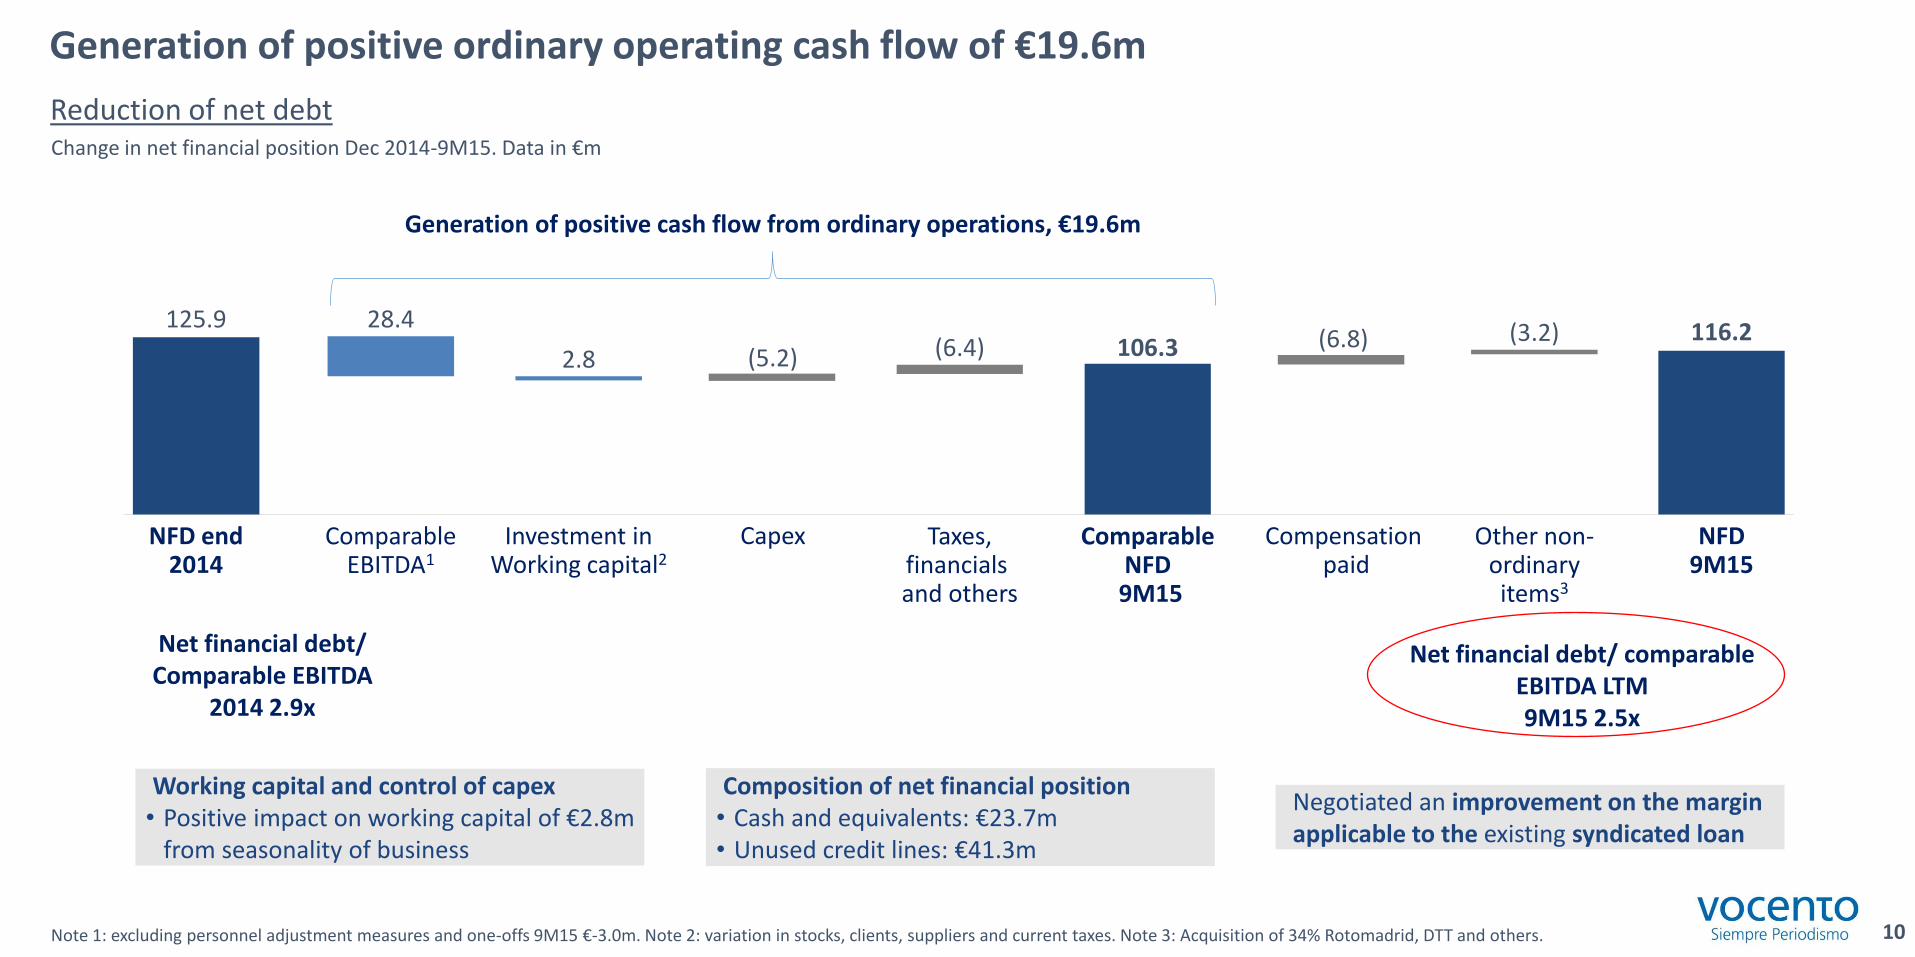
Generation of positive ordinary operating cash flow of €19.6m
Note 1: excluding personnel adjustment measures and one-offs 9M15 €-3.0m. Note 2: variation in stocks, clients, suppliers and current taxes. Note 3: Acquisition of 34% Rotomadrid, DTT and others.
Reduction of net debt Change in net financial position Dec 2014-9M15. Data in €m
10
Working capital and control of capex • Positive impact on working capital of €2.8m
from seasonality of business
Composition of net financial position • Cash and equivalents: €23.7m • Unused credit lines: €41.3m
Negotiated an improvement on the margin applicable to the existing syndicated loan
Net financial debt/ Comparable EBITDA
2014 2.9x
Net financial debt/ comparable EBITDA LTM 9M15 2.5x
Generation of positive cash flow from ordinary operations, €19.6m
Compensation paid
Other non- ordinary items3
NFD end 2014
125.9
Capex Taxes, financials and others
Comparable
EBITDA1
28.4
Investment in Working capital2
2.8 (5.2) (6.4)
Comparable NFD
9M15
106.3 (6.8) (3.2)
NFD 9M15
116.2
Financial appendix 9M15
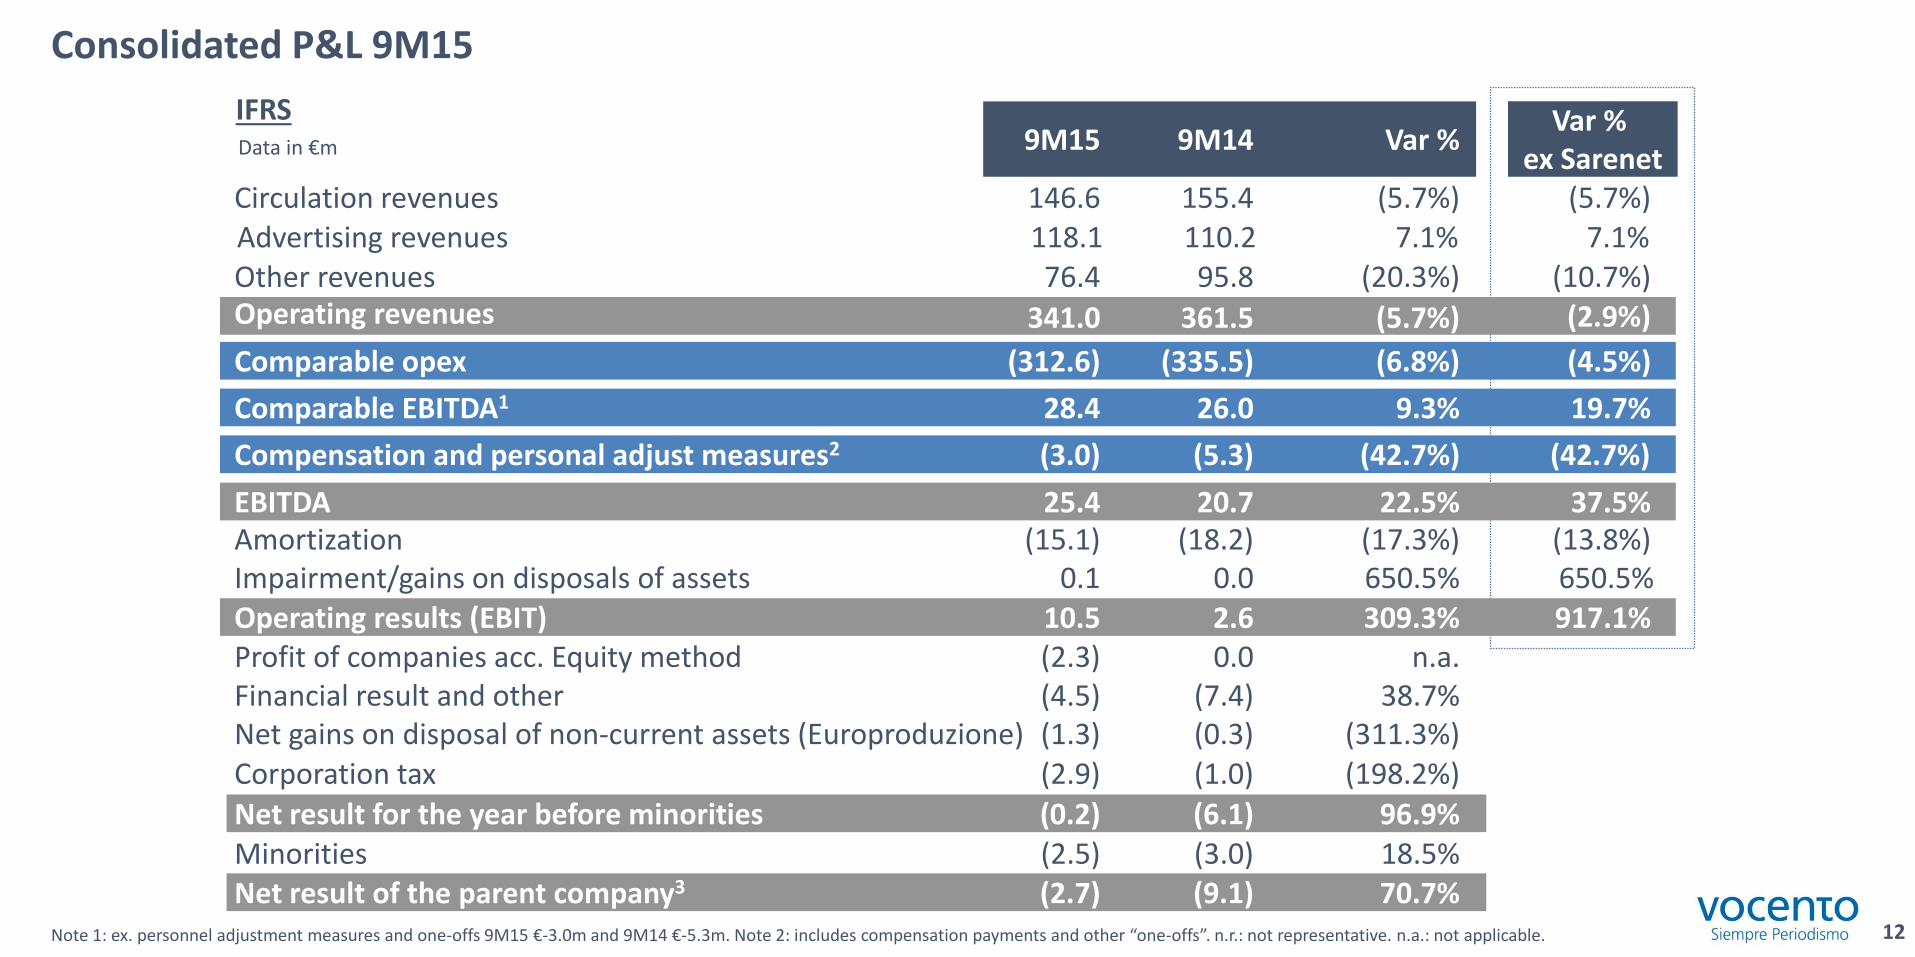
Consolidated P&L 9M15
Note 1: ex. personnel adjustment measures and one-offs 9M15 €-3.0m and 9M14 €-5.3m. Note 2: includes compensation payments and other “one-offs”. n.r.: not representative. n.a.: not applicable. 12
IFRS Data in €m
2.6 10.5
96.9%
70.7% 18.5%
n.a.
(198.2%)
38.7% (311.3%)
309.3%
(6.1) (0.2)
(9.1) (2.7) (3.0) (2.5)
(7.4) (4.5) 0.0 (2.3)
(1.0) (2.9) (0.3) (1.3)
917.1% Operating results (EBIT)
Net result for the year before minorities
Net result of the parent company3
Minorities
Financial result and other Profit of companies acc. Equity method
Corporation tax Net gains on disposal of non-current assets (Europroduzione)
9M15 9M14 Var %
361.5 341.0 (5.7%)
(18.2) (15.1) (17.3%)
155.4 146.6 (5.7%) 110.2 118.1 7.1% 95.8 76.4 (20.3%)
20.7 25.4 22.5%
0.0 0.1 650.5%
26.0 28.4 9.3%
(6.8%) (312.6) (335.5)
(3.0) (5.3) (42.7%)
Var % ex Sarenet
(5.7%) 7.1%
(10.7%) (2.9%)
(4.5%)
19.7%
(42.7%)
37.5% (13.8%) 650.5%
Circulation revenues Advertising revenues Other revenues Operating revenues
Amortization EBITDA
Impairment/gains on disposals of assets
Comparable EBITDA1
Comparable opex
Compensation and personal adjust measures2
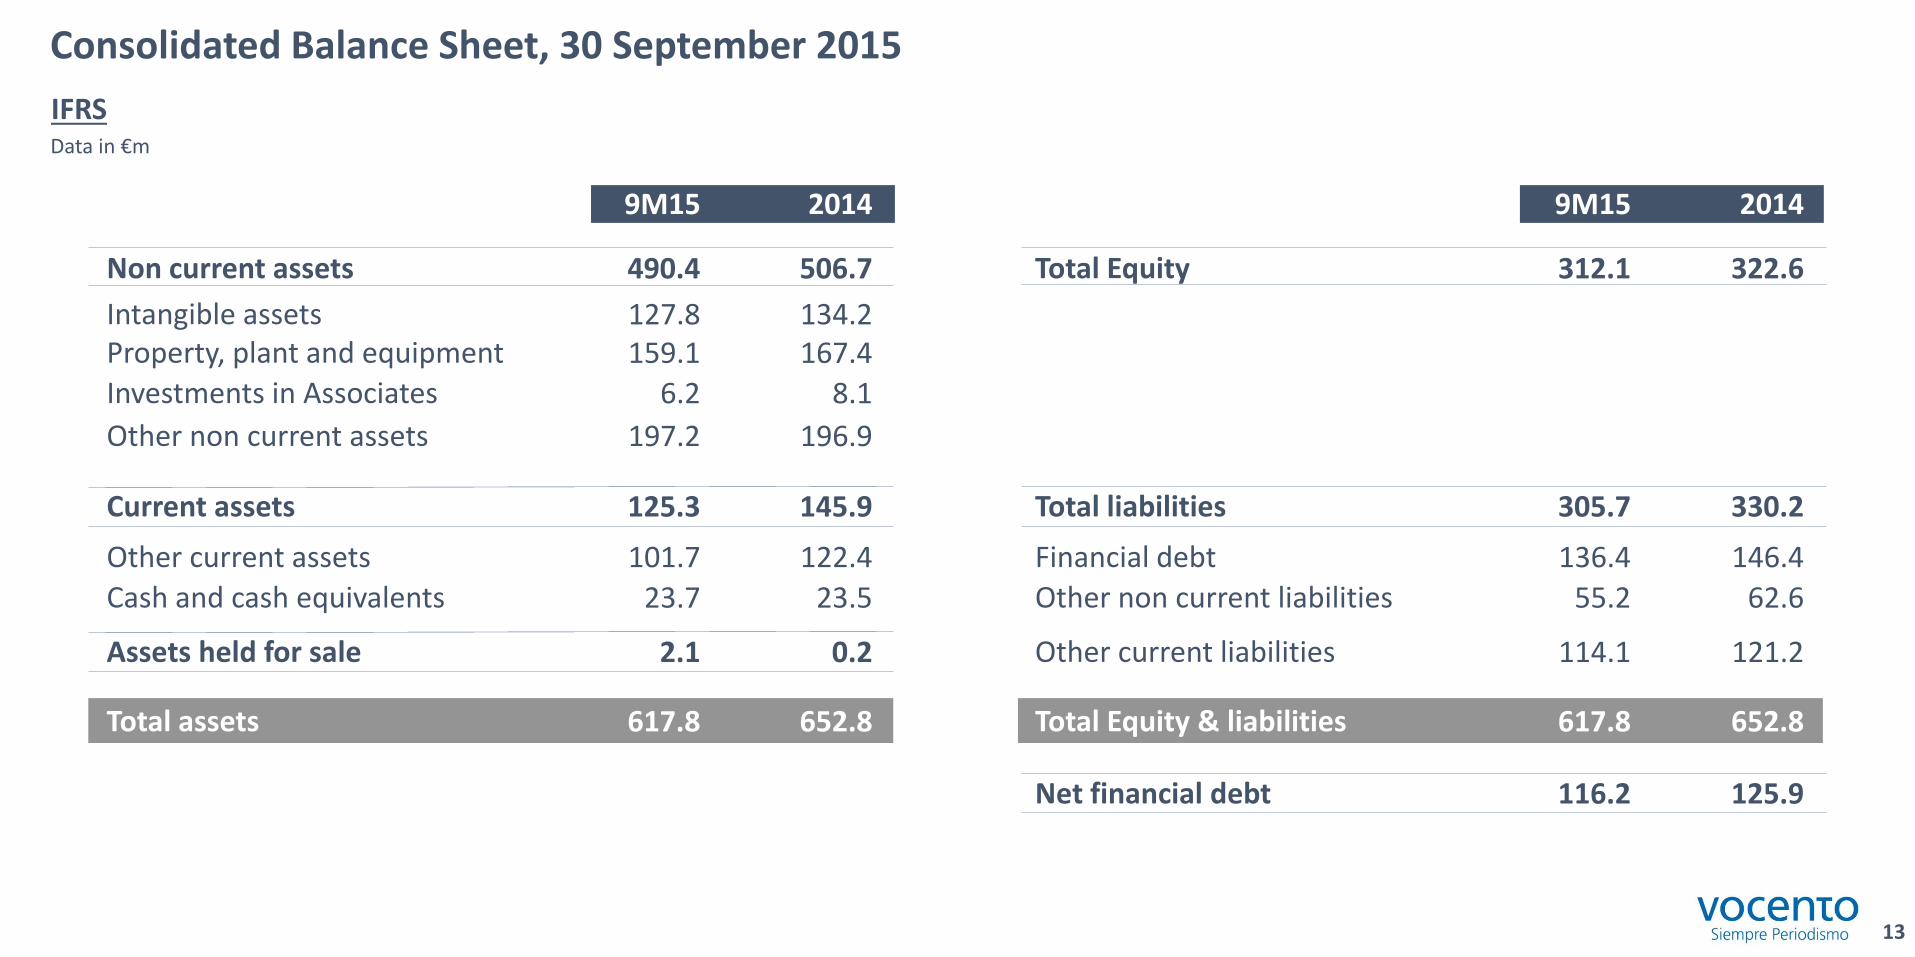
Consolidated Balance Sheet, 30 September 2015
IFRS Data in €m
13
116.2
312.1
136.4
55.2
114.1
617.8
305.7
9M15 2014
490.4
127.8 159.1
6.2
197.2
125.3
101.7
23.7
617.8
2.1
506.7
134.2 167.4
8.1
196.9
145.9
122.4
23.5
652.8
0.2
125.9
322.6
146.4
62.6
121.2
652.8
330.2
9M15 2014
Non current assets
Intangible assets Property, plant and equipment
Investments in Associates
Other non current assets
Current assets
Cash and cash equivalents
Other current assets
Assets held for sale
Total assets
Total Equity
Total liabilities
Financial debt
Total Equity & liabilities
Net financial debt
Other non current liabilities
Other current liabilities
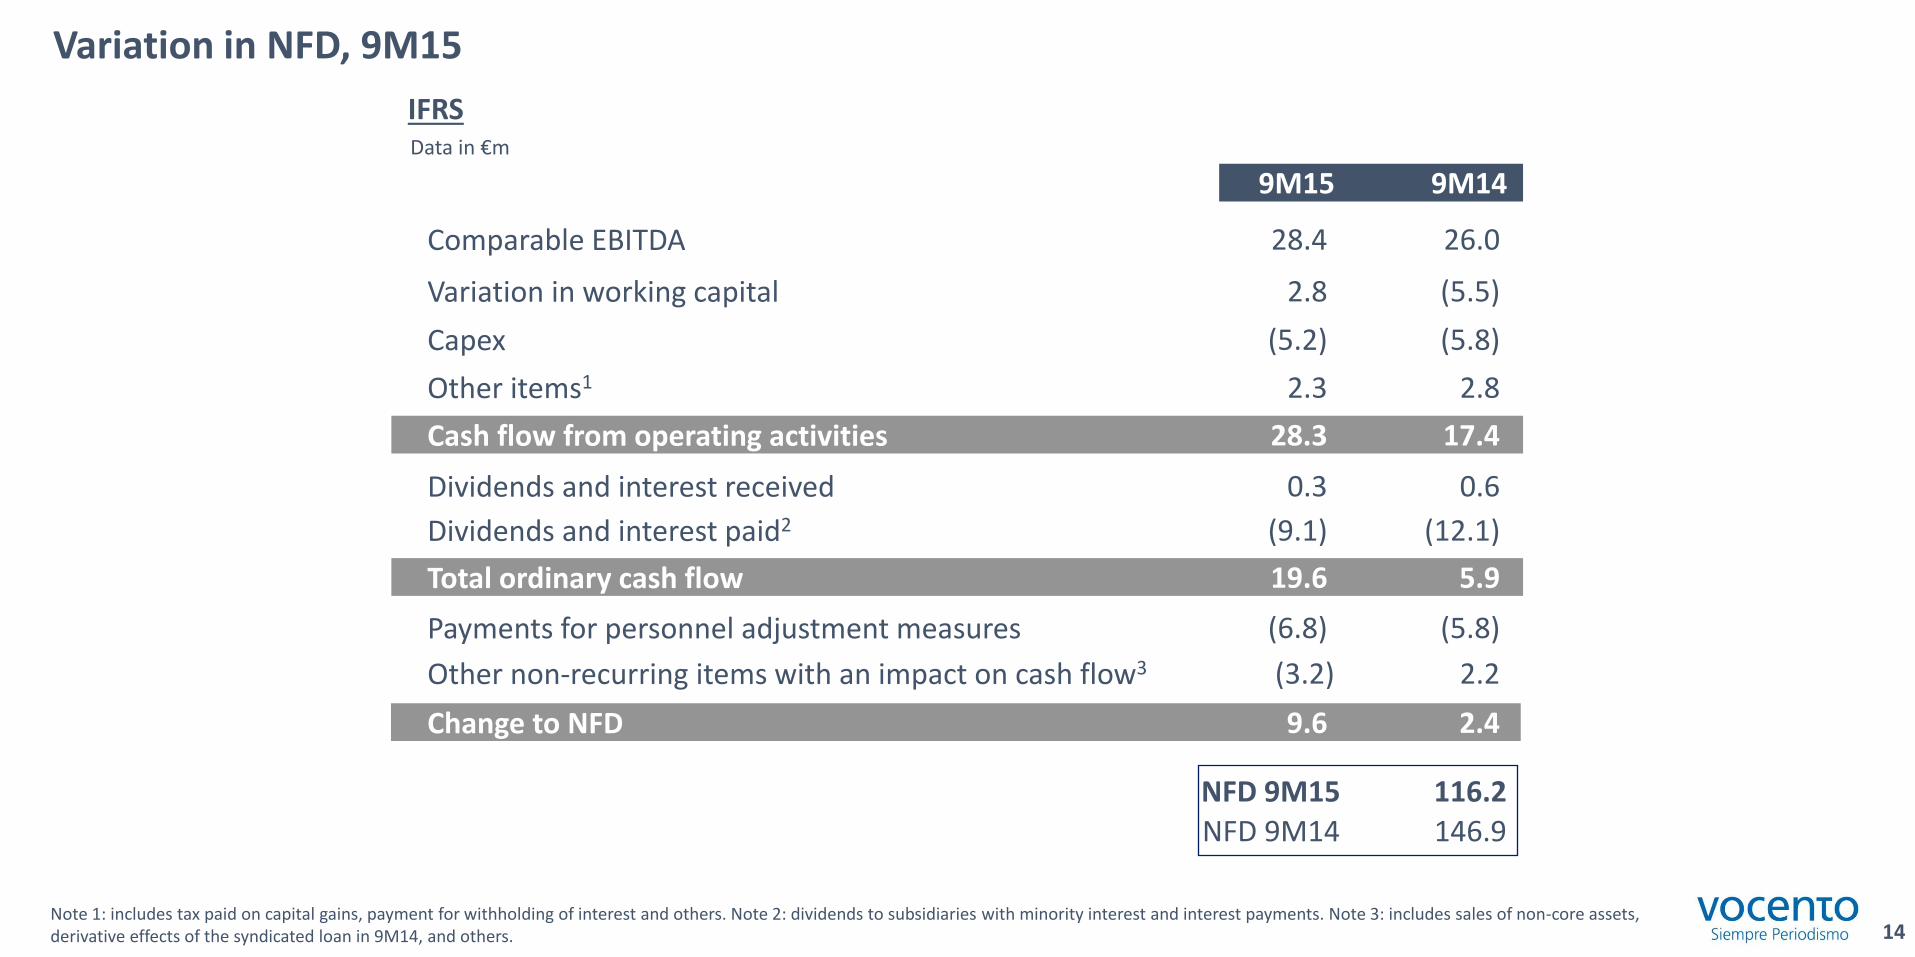
Variation in NFD, 9M15
Note 1: includes tax paid on capital gains, payment for withholding of interest and others. Note 2: dividends to subsidiaries with minority interest and interest payments. Note 3: includes sales of non-core assets, derivative effects of the syndicated loan in 9M14, and others. 14
IFRS Data in €m
9M15 9M14
NFD 9M15 NFD 9M14
116.2 146.9
28.4 26.0
2.8 (5.5)
(5.2) (5.8)
2.3 2.8
28.3 17.4
(9.1) (12.1)
19.6 5.9
(6.8) (5.8)
(3.2) 2.2
9.6 2.4
0.3 0.6
Comparable EBITDA
Variation in working capital
Capex
Other items1
Cash flow from operating activities
Dividends and interest paid2
Total ordinary cash flow
Other non-recurring items with an impact on cash flow3
Change to NFD
Payments for personnel adjustment measures
Dividends and interest received
9M15 9M14
25.2 22.7
3.1
14.7 8.7
(0.3) (0.3)
3.1
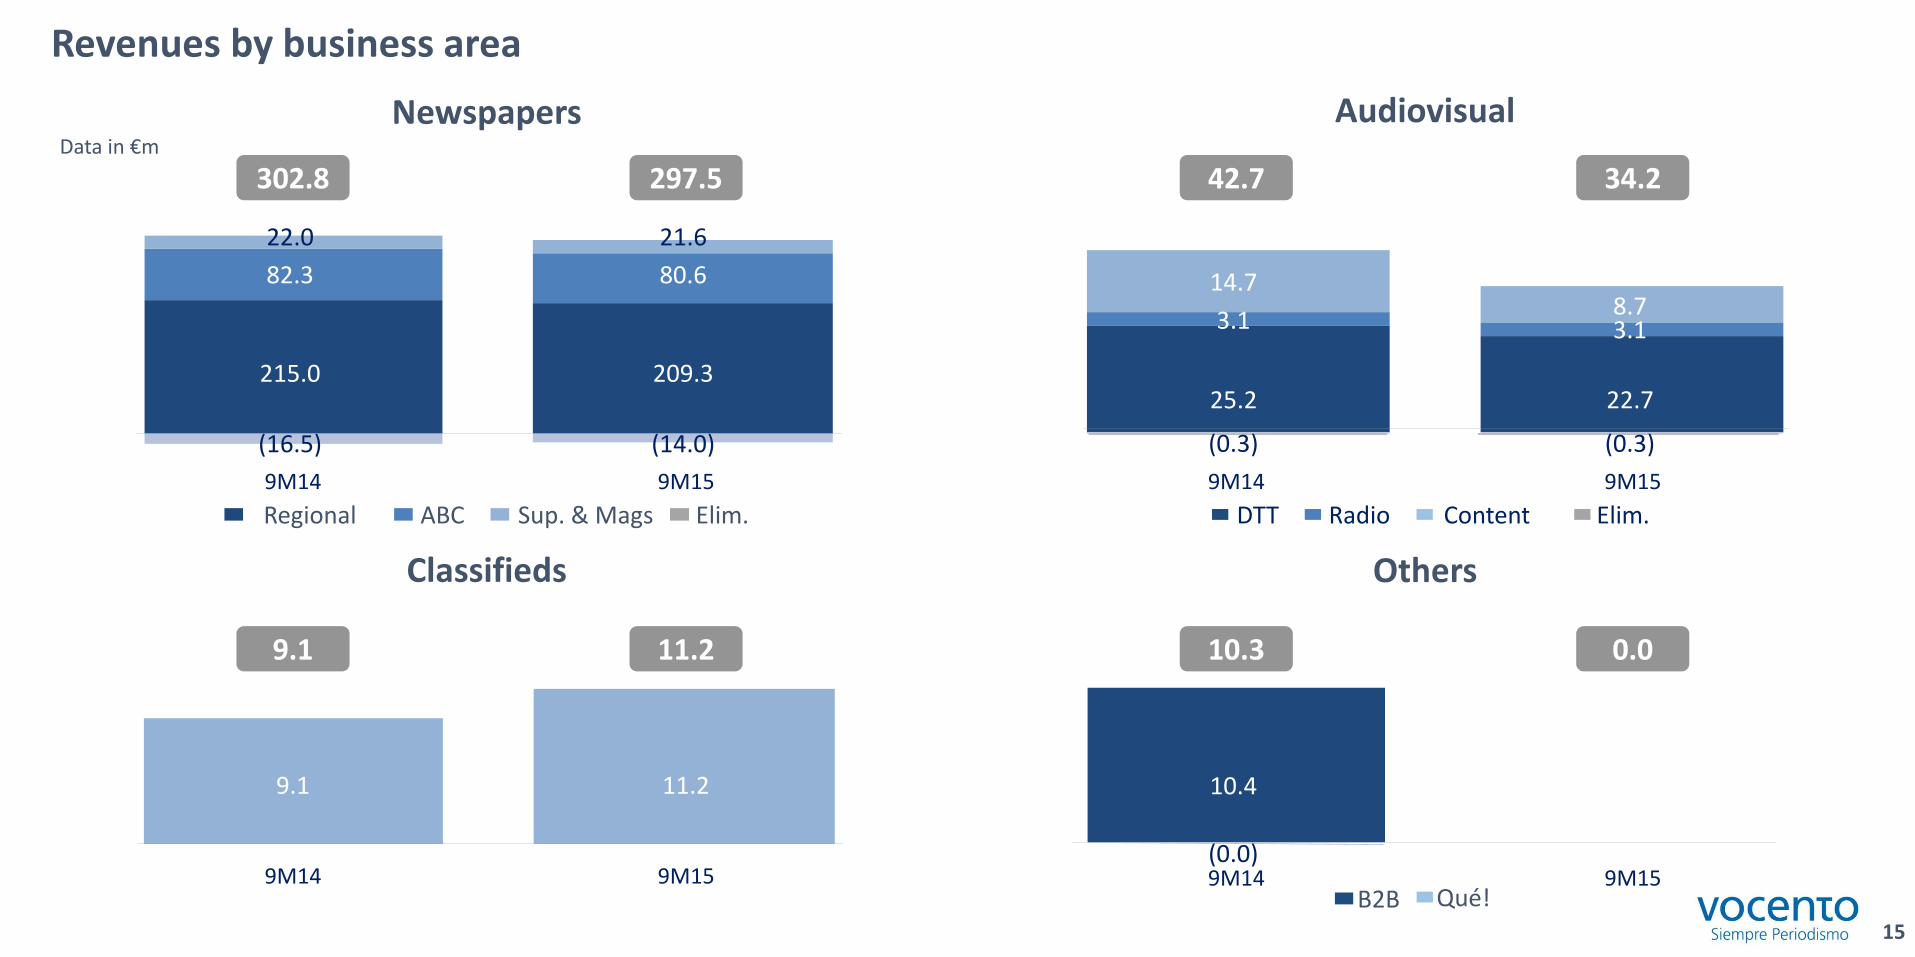
Revenues by business area
Elim. Regional Sup. & Mags ABC
Newspapers Data in €m
11.2 9.1
B2B
Audiovisual
Classifieds Others
9M15
297.5
9M14
302.8
9M15 9M14
42.7 34.2
10.3 0.0
Elim. Content DTT Radio
9M15 9M14
215.0 209.3
82.3 80.6
22.0 21.6
(16.5) (14.0)
10.4 9.1 11.2
Qué!
(0.0)
15
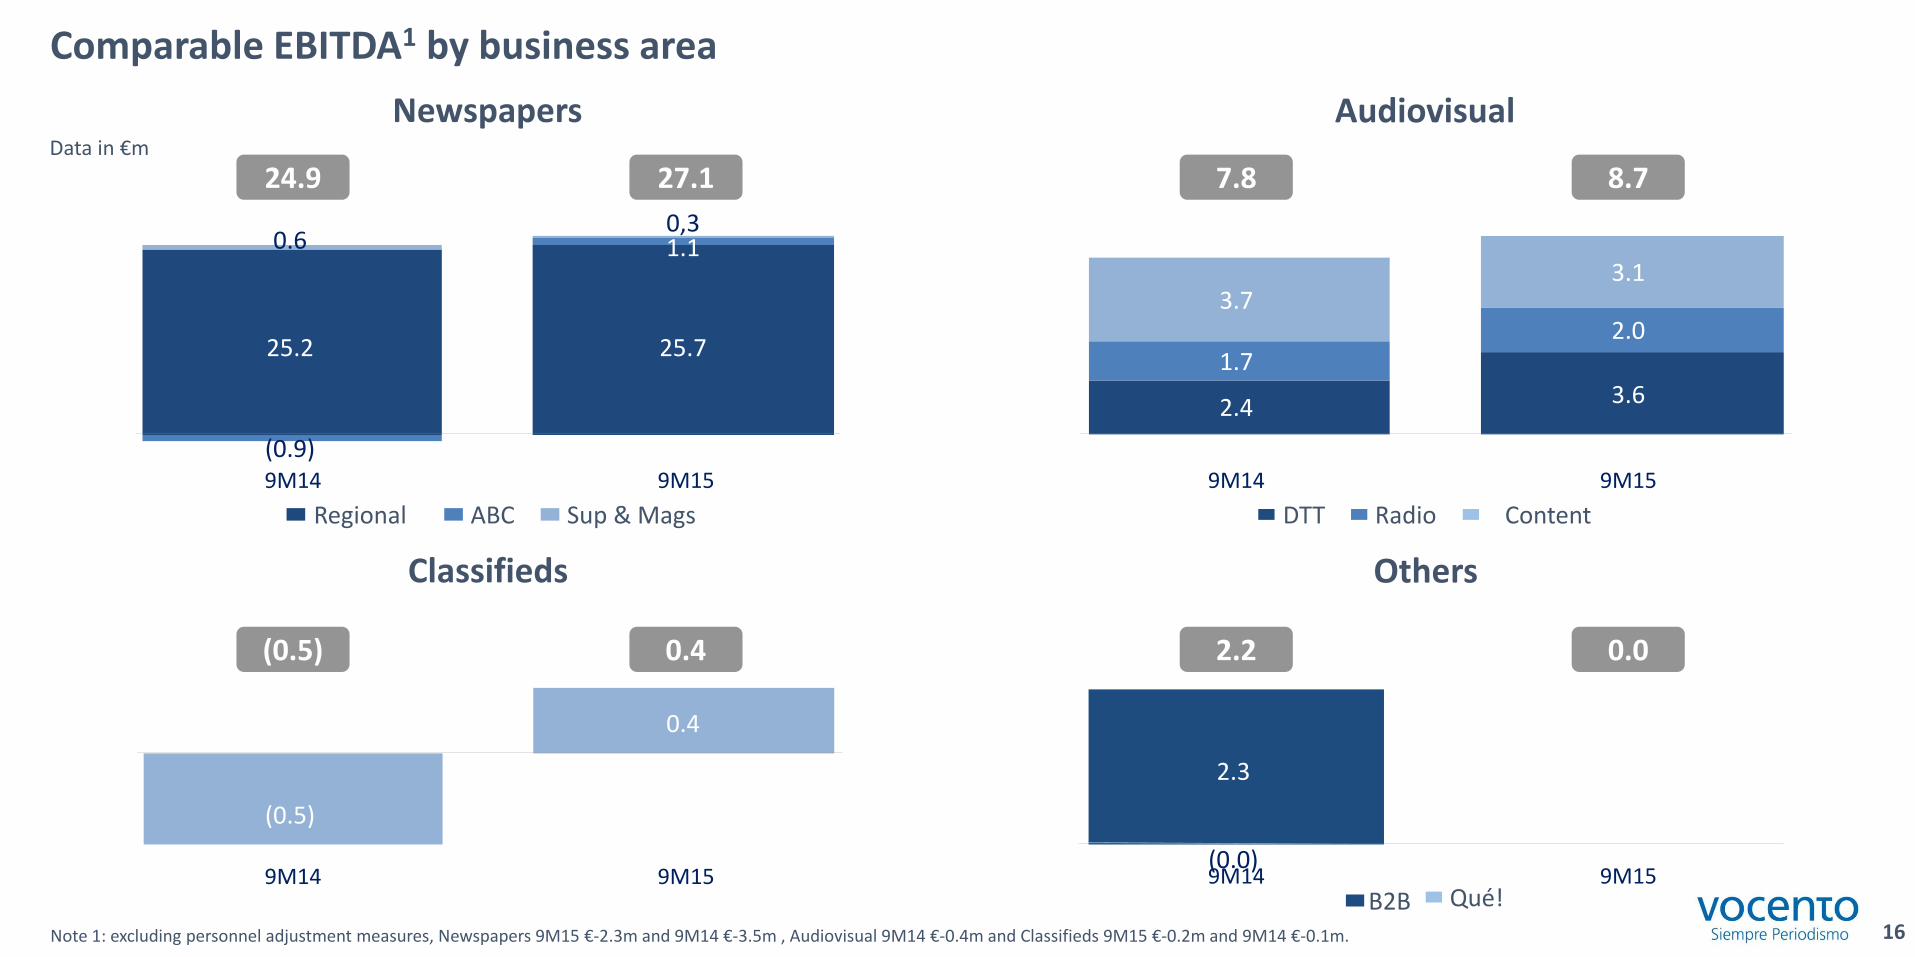
Comparable EBITDA1 by business area
27.1 24.9
Newspapers Data in €m
Audiovisual
7.8 8.7
0.4 (0.5) 2.2 0.0
Classifieds Others
Note 1: excluding personnel adjustment measures, Newspapers 9M15 €-2.3m and 9M14 €-3.5m , Audiovisual 9M14 €-0.4m and Classifieds 9M15 €-0.2m and 9M14 €-0.1m.
9M15 9M14
9M15 9M14 9M15 9M14
9M15 9M14
16
B2B
0,3
25.2 25.7
(0.9)
1.1 0.6
(0.5)
0.4
2.4 3.6 1.7
2.0 3.7
3.1
2.3
Regional Sup & Mags ABC Content DTT Radio
Qué!
(0.0)

Investor and Shareholder Relations C/ Pintor Losada. 7
48007 Bilbao (Bizkaia) Tel.: 902 404 073
e-mail: [email protected]