Embed Size (px)
Citation preview

0
Fiscal Year Ended March 2016
Briefing on Financial Results
April 28, 2016
Ricoh Leasing Company, Ltd.
1
1. Performance Overview(Fiscal Year Ended March 2016)
2
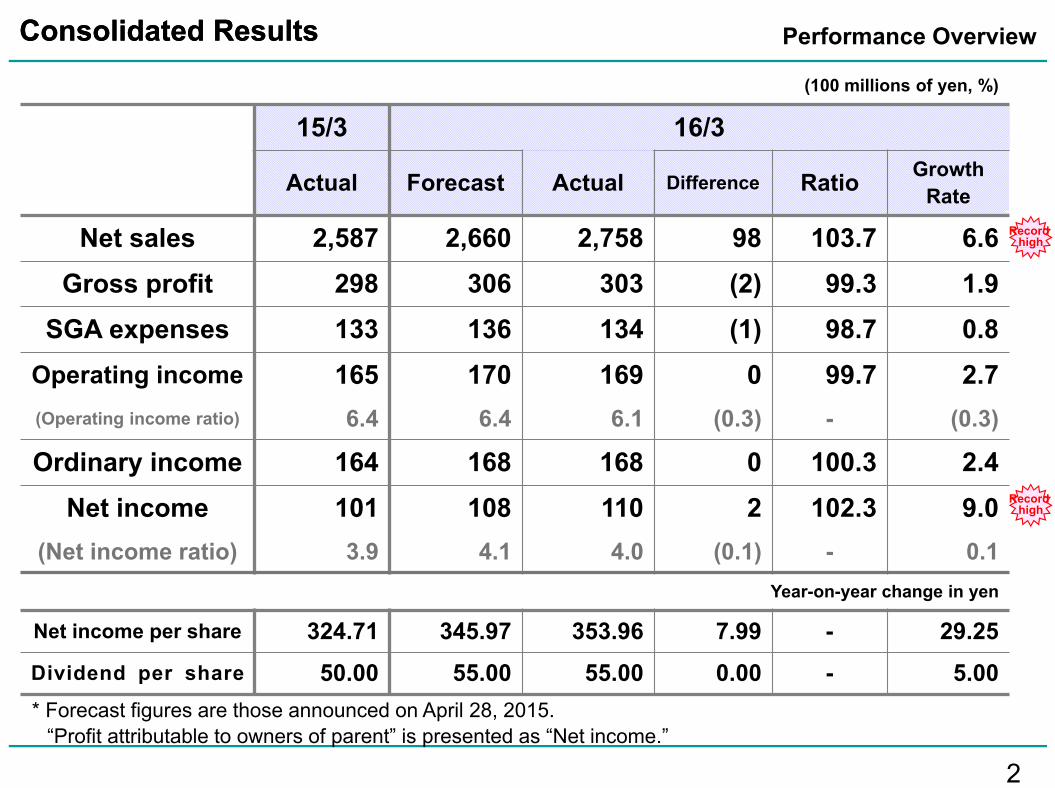
15/3 16/3
Actual Forecast Actual Difference Ratio Growth Rate
Net sales 2,587 2,660 2,758 98 103.7 6.6Gross profit 298 306 303 (2) 99.3 1.9
SGA expenses 133 136 134 (1) 98.7 0.8Operating income 165 170 169 0 99.7 2.7(Operating income ratio) 6.4 6.4 6.1 (0.3) - (0.3)
Ordinary income 164 168 168 0 100.3 2.4Net income 101 108 110 2 102.3 9.0
(Net income ratio) 3.9 4.1 4.0 (0.1) - 0.1Year-on-year change in yen
Net income per share 324.71 345.97 353.96 7.99 - 29.25Dividend per share 50.00 55.00 55.00 0.00 - 5.00
Consolidated ResultsConsolidated Results Performance Overview
(100 millions of yen, %)
* Forecast figures are those announced on April 28, 2015.
Record high
Record high
“Profit attributable to owners of parent” is presented as “Net income.”
3
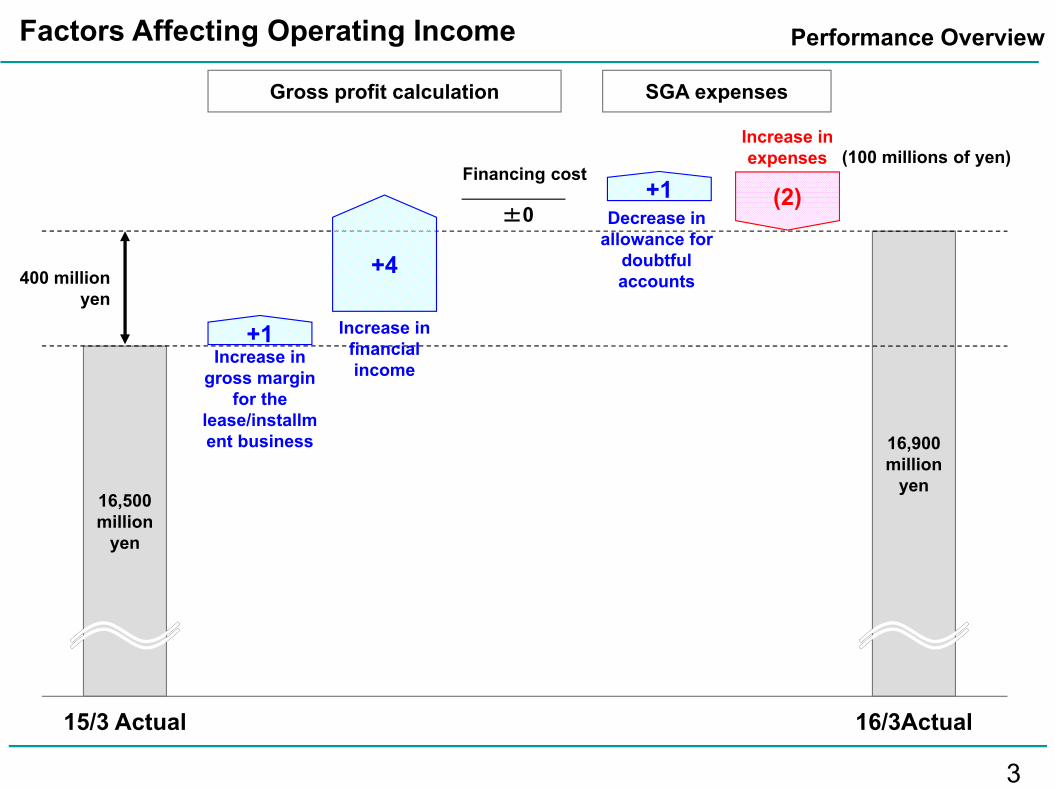
Factors Affecting Operating Income Performance Overview
16,500 million
yen
16/3Actual
16,900 million
yen
400 million yen
Gross profit calculation SGA expenses
Increase in gross margin
for the lease/installment business
Increase in expenses
15/3 Actual
Increase in financial income
+1
Decrease in allowance for
doubtful accounts
+4
(2)
(100 millions of yen)
+1Financing cost
±0
44
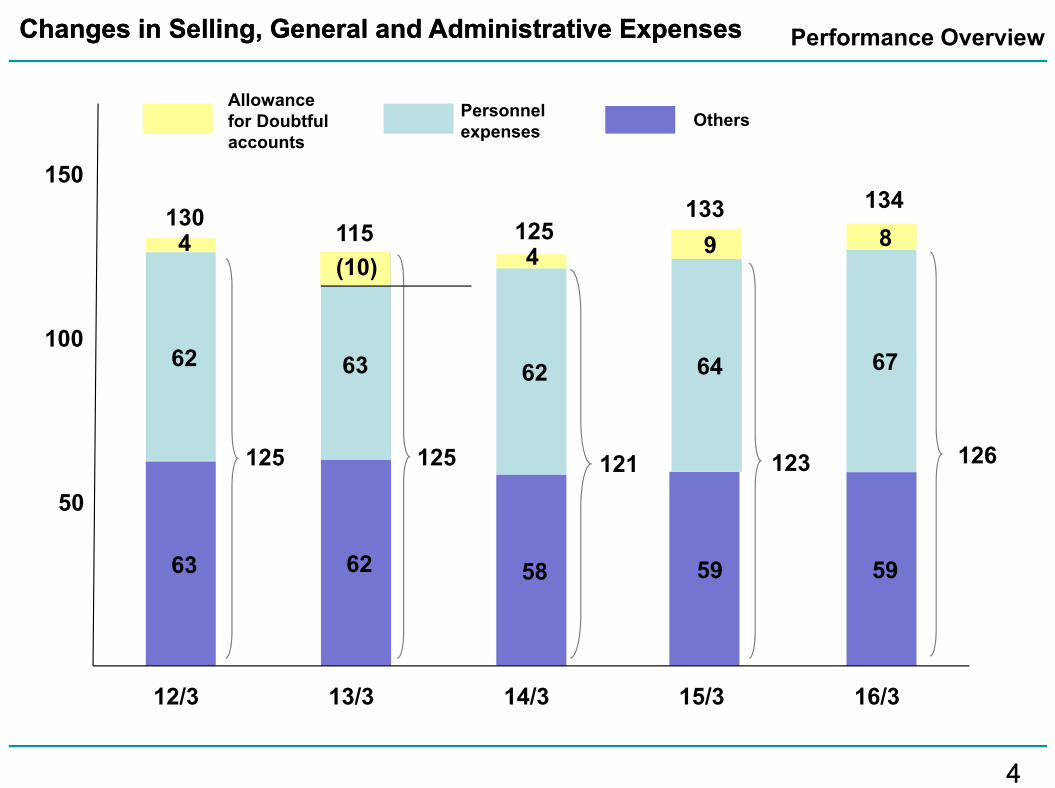
Changes in Selling, General and Administrative ExpensesChanges in Selling, General and Administrative Expenses Performance Overview
63 62 58 59 59
62 63 62 64 67
4 4 9 8
50
100
150
12/3 13/3 14/3 15/3 16/3
125 125 121 123
115
126
125133130
134
(10)
OthersPersonnel expenses
Allowance for Doubtful accounts

5
Transaction Volume by BusinessTransaction Volume by Business
(100 millions of yen, %)
*Transaction volumes are calculated on an inspection basis.
Performance Overview
15/3 16/3
Actual Growth Rate Actual Growth
Rate
Finance lease 2,621 (2.7) 2,663 1.6
Operating lease 124 19.5 127 1.7
Installment sales 485 18.5 547 12.8
Leasing/Installment sales business 3,231 0.7 3,337 3.3
Financial services business 259 4.6 264 1.7
Total transaction volume 3,491 1.0 3,601 3.2
Record high
Record high
Record high
6
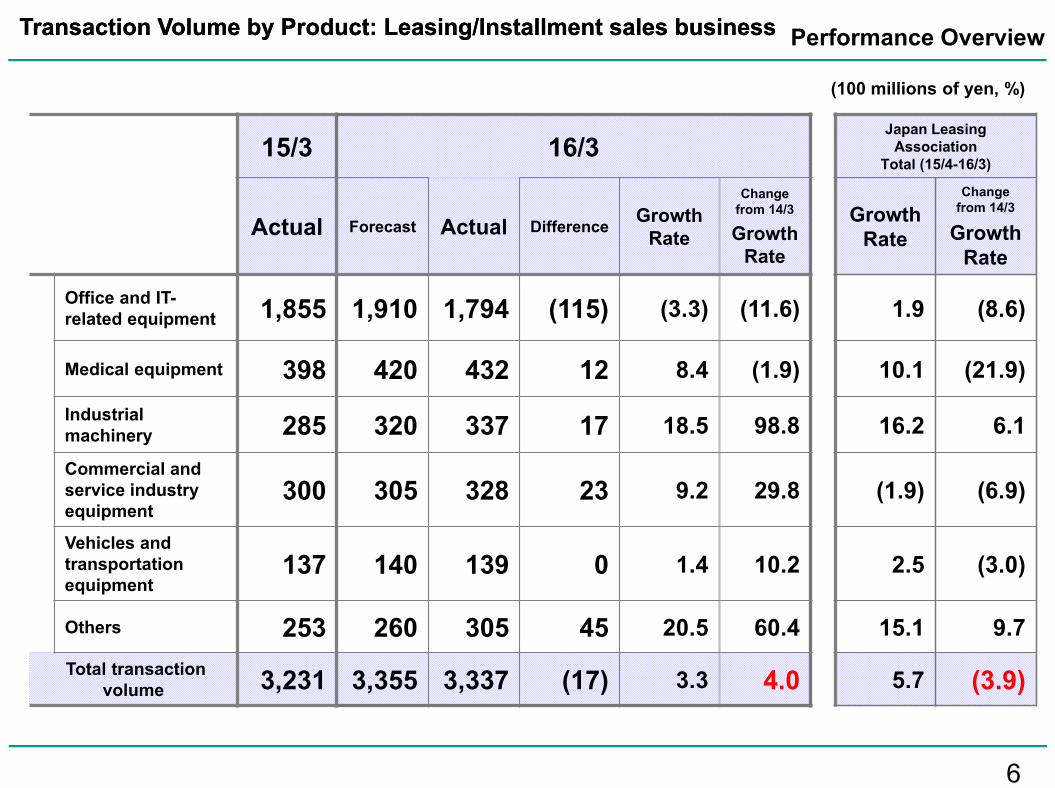
(100 millions of yen, %)
Transaction Volume by Product: Leasing/Installment sales businessTransaction Volume by Product: Leasing/Installment sales business Performance Overview
15/3 16/3Japan Leasing
AssociationTotal (15/4-16/3)
Actual Forecast Actual Difference Growth Rate
Change from 14/3
Growth Rate
Growth Rate
Change from 14/3
Growth Rate
Office and IT-related equipment 1,855 1,910 1,794 (115) (3.3) (11.6) 1.9 (8.6)
Medical equipment 398 420 432 12 8.4 (1.9) 10.1 (21.9)
Industrial machinery 285 320 337 17 18.5 98.8 16.2 6.1
Commercial and service industry equipment
300 305 328 23 9.2 29.8 (1.9) (6.9)
Vehicles and transportation equipment
137 140 139 0 1.4 10.2 2.5 (3.0)
Others 253 260 305 45 20.5 60.4 15.1 9.7Total transaction
volume 3,231 3,355 3,337 (17) 3.3 4.0 5.7 (3.9)

7
Operating Results by Segment (Lease/Installment business)Operating Results by Segment (Lease/Installment business) Performance Overview
(100 millions of yen)
Net sales (left bar) Segment income (right bar)
2,249 2,2772,388
2,673
155 154138 142
0
500
1,000
1,500
2,000
2,500
12/3 13/3 14/3 16/30
50
100
150
200
Record high
(100 millions of yen)
2,511
144
15/3
8
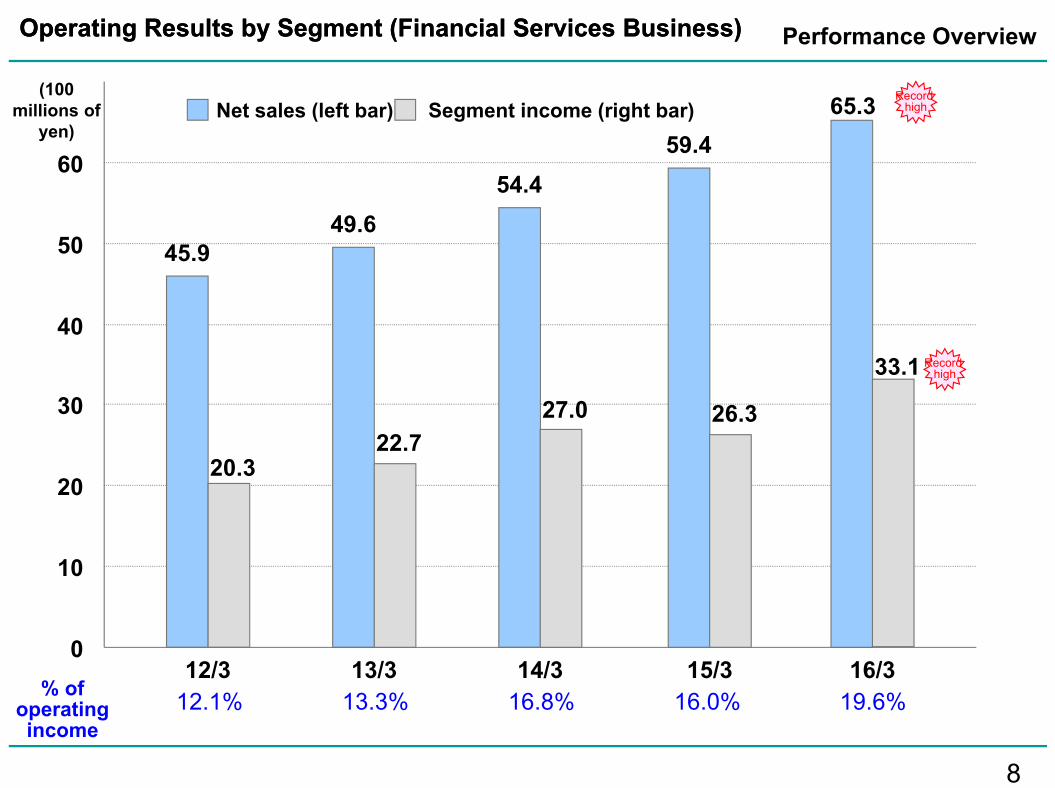
Operating Results by Segment (Financial Services Business)Operating Results by Segment (Financial Services Business) Performance Overview
(100 millions of
yen)
45.949.6
54.4
65.3
20.322.7
27.0
33.1
0
10
20
30
40
50
60
12/3 13/3 14/3 16/3
Record highNet sales (left bar) Segment income (right bar)
59.4
26.3
15/3
Record high
% of operating income
12.1% 13.3% 16.8% 16.0% 19.6%

9
Financial Services Business-Priority MeasuresFinancial Services Business-Priority Measures Performance Overview
Number of monthly transaction cases of collection agency services(Unit: 10,000)
92106
137
0
50
100
150
Medium-term management strategy
target (17/3)
13/3 14/3 15/3 16/3
(100 millions of yen)
90
198
326
0
100
200
300
400
13/3 14/3 15/3
Factoring services for nursing-care benefits - transaction volume
128
170
600
471
16/3Medium-term
management strategy target (17/3)
500
10
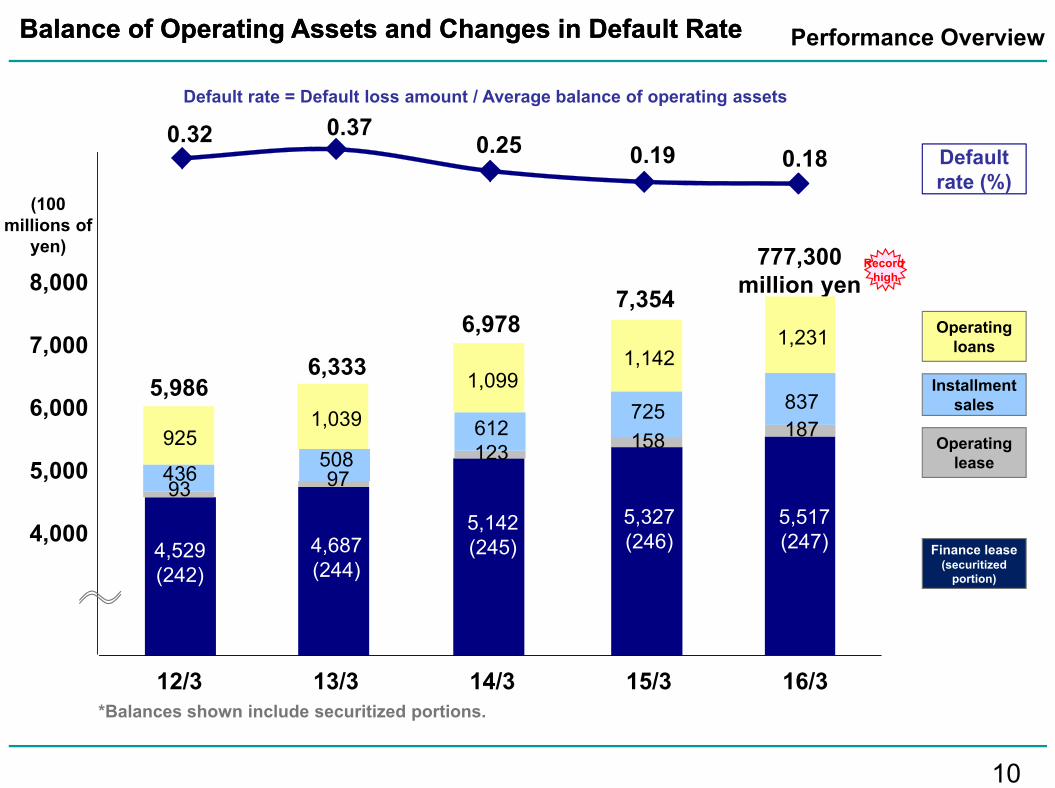
Balance of Operating Assets and Changes in Default RateBalance of Operating Assets and Changes in Default Rate
*Balances shown include securitized portions.
Performance Overview
Finance lease (securitized
portion)
Operating loans
Installment sales
Operating lease
Default rate (%)
Default rate = Default loss amount / Average balance of operating assets
Record high
(100 millions of
yen)
4,529(242)
4,687(244)
5,142(245)
5,327(246)
93 97123 158
436508
612725
9251,039
1,0991,142
4,000
5,000
6,000
7,000
8,000
12/3 13/3 14/3 15/3 16/3
5,9866,333
7,3546,978
777,300 million yen
0.32 0.370.25 0.19 0.18
5,517(247)
187837
1,231

1111
Total Procurement Amount and Capital CostTotal Procurement Amount and Capital Cost
[External ratings]S&P AR&I A+JCR AA-
Fixed charge coverage ratio (%)
Capital cost
Total amount procured
*Total amounts procured: Balances include debts paid through securitization.Capital costs shown are expenses included in the calculation of gross profit.
Performance Overview
(100 millions of yen)
0
1,000
2,000
3,000
4,000
5,000
6,000
7,000
12/3 13/3 14/3 15/3 16/3
5,988
5,1035,425
671,000 million yen
251920
6,337
15
Long-term
Short-term
55.6 57.9 56.961.1 62.0
1400 million yen

12
2. Financial Forecast(Fiscal Year Ending March 2017)
13
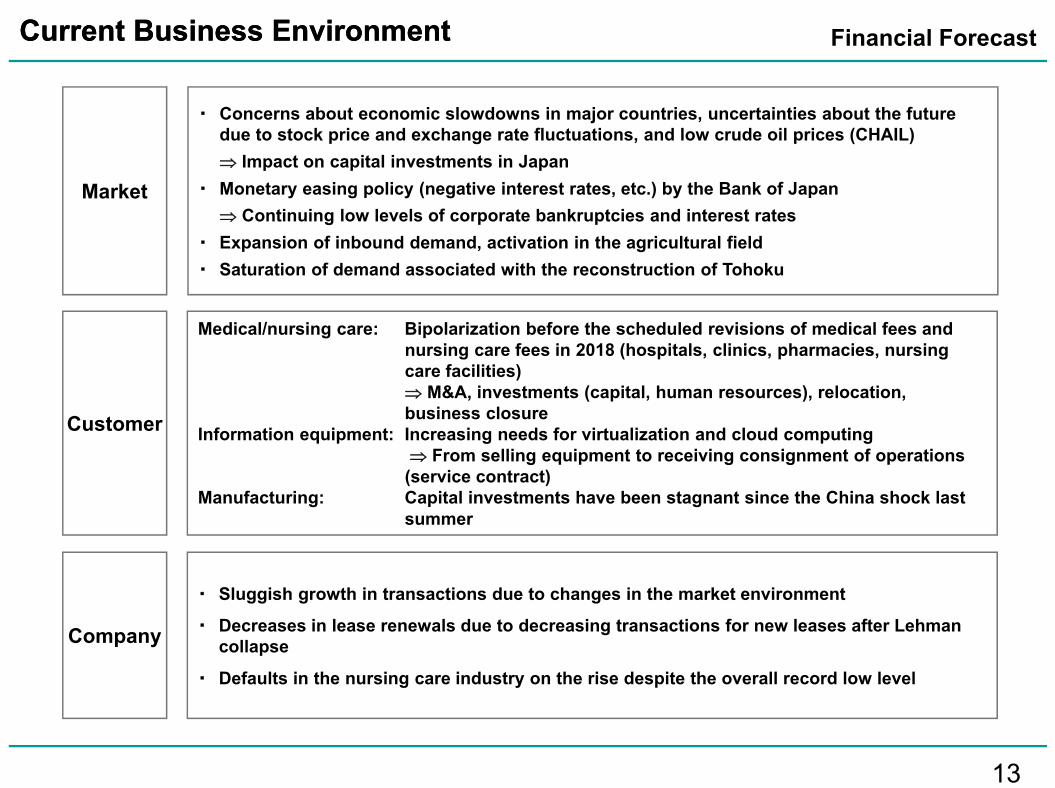
Current Business EnvironmentCurrent Business Environment Financial Forecast
・ Concerns about economic slowdowns in major countries, uncertainties about the future due to stock price and exchange rate fluctuations, and low crude oil prices (CHAIL) Impact on capital investments in Japan
・ Monetary easing policy (negative interest rates, etc.) by the Bank of Japan Continuing low levels of corporate bankruptcies and interest rates
・ Expansion of inbound demand, activation in the agricultural field・ Saturation of demand associated with the reconstruction of Tohoku
Market
Medical/nursing care: Bipolarization before the scheduled revisions of medical fees and nursing care fees in 2018 (hospitals, clinics, pharmacies, nursing care facilities) M&A, investments (capital, human resources), relocation, business closure
Information equipment: Increasing needs for virtualization and cloud computing From selling equipment to receiving consignment of operations
(service contract)Manufacturing: Capital investments have been stagnant since the China shock last
summer
Customer
Company
・ Sluggish growth in transactions due to changes in the market environment
・ Decreases in lease renewals due to decreasing transactions for new leases after Lehman collapse
・ Defaults in the nursing care industry on the rise despite the overall record low level
14
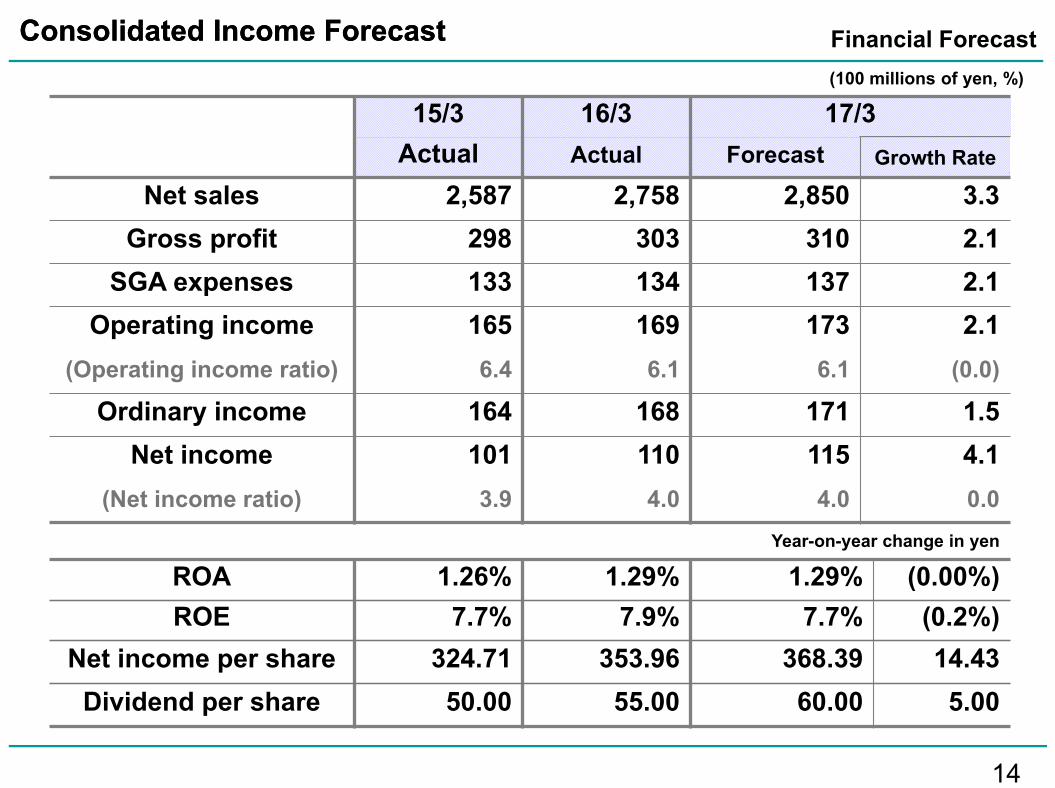
Consolidated Income ForecastConsolidated Income Forecast(100 millions of yen, %)
15/3 16/3 17/3Actual Actual Forecast Growth Rate
Net sales 2,587 2,758 2,850 3.3Gross profit 298 303 310 2.1
SGA expenses 133 134 137 2.1Operating income 165 169 173 2.1
(Operating income ratio) 6.4 6.1 6.1 (0.0)
Ordinary income 164 168 171 1.5Net income 101 110 115 4.1
(Net income ratio) 3.9 4.0 4.0 0.0Year-on-year change in yen
ROA 1.26% 1.29% 1.29% (0.00%)ROE 7.7% 7.9% 7.7% (0.2%)
Net income per share 324.71 353.96 368.39 14.43Dividend per share 50.00 55.00 60.00 5.00
Financial Forecast
15
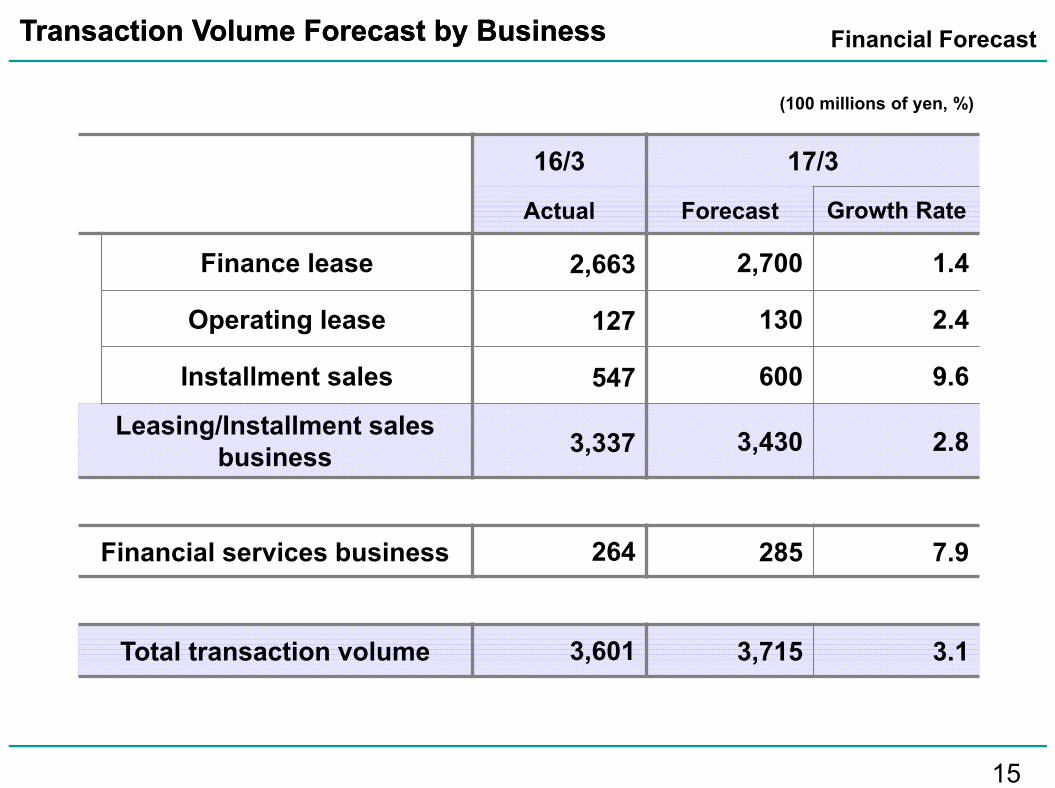
Transaction Volume Forecast by BusinessTransaction Volume Forecast by Business
(100 millions of yen, %)
16/3 17/3
Actual Forecast Growth Rate
Finance lease 2,663 2,700 1.4
Operating lease 127 130 2.4
Installment sales 547 600 9.6
Leasing/Installment sales business 3,337 3,430 2.8
Financial services business 264 285 7.9
Total transaction volume 3,601 3,715 3.1
Financial Forecast
16
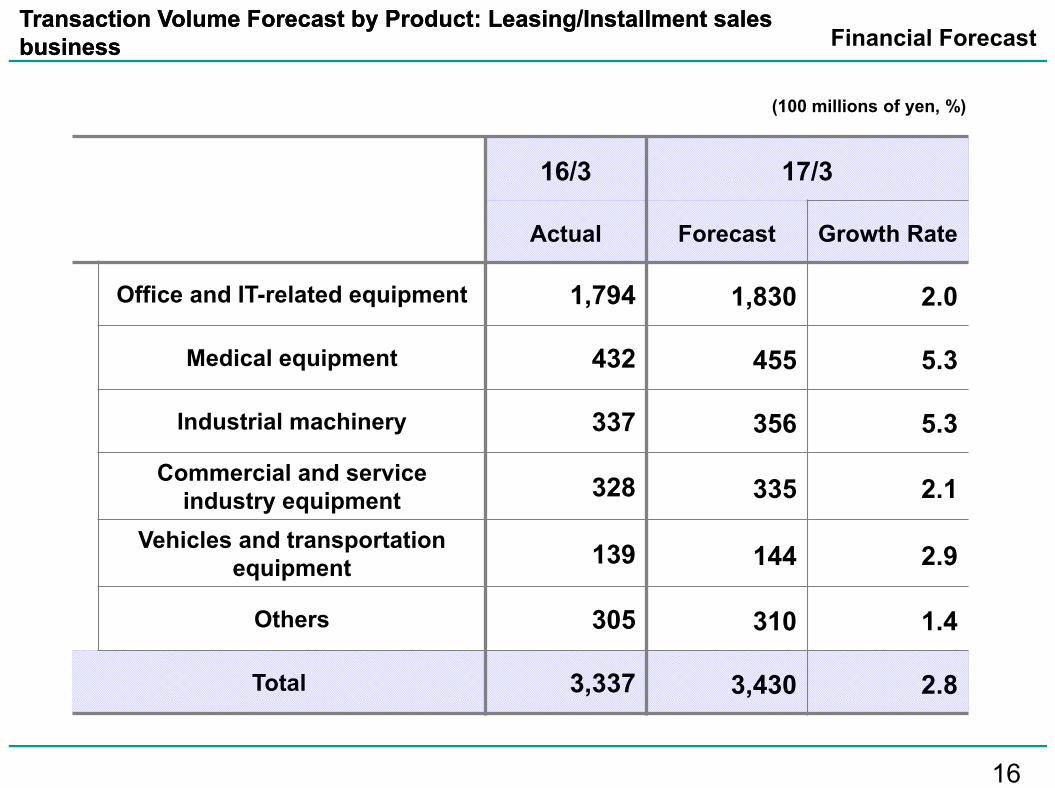
Transaction Volume Forecast by Product: Leasing/Installment sales businessTransaction Volume Forecast by Product: Leasing/Installment sales business
(100 millions of yen, %)
16/3 17/3
Actual Forecast Growth Rate
Office and IT-related equipment 1,794 1,830 2.0
Medical equipment 432 455 5.3
Industrial machinery 337 356 5.3
Commercial and service industry equipment 328 335 2.1
Vehicles and transportation equipment 139 144 2.9
Others 305 310 1.4
Total 3,337 3,430 2.8
Financial Forecast

Business Expansion Efficiency
Business Productivity
On Business
Customer (Increase customers)
New Business
Efficiency (Personnel efficiency)ALM (Asset Liability Management)Accident (Fewer accidents)
Sales support-related leasing know-howVendors: 6,000 companies/yearCustomers: About 400,000 companies Mainly small- and medium-sized companies
Industry’s top funding capabilitiesSmall-amount/large-volume contracts Risk diversificationNo. of processing items: About 1.2 million items/year
OCeaN
Stra
tegi
esS
treng
ths
Ricoh Group companies
Communication & Speed & Challenge
ES (Employee Satisfaction) CS (Customer Satisfaction)
CSRCor
pora
te
cultu
re
17
Management StrategyManagement Strategy Financial Forecast

18
Three ReformsThree Reforms Financial Forecast
Measures implemented in FY2015 Measures planned for implementation in FY2016
Bus
ines
s
To be the industry’s No. 1 in office and IT-related equipment, medical equipment, and nursing care businesses
・Collaboration among Ricoh Group companies (new businesses, process reforms)
・Lead manager/keyperson assignment (medical/nursing care)
・New development by making use of new scheme/human network
・Realization of OCeaN Strategy management・Promotion of measures to increase profits
Exploring new growth areas
・New productsCasa Direct, accounting outsourcing service, loan for condominium management associations
・Implementation of new business development office
・Provision of customer value based on new products and schemesLease of forklift with RL guardHome owner direct, etc.
Proc
ess
Continuing to implement cross-company business process reforms
・New establishment of structural reform promotion department→Reinforcement of systems and workforce→Formulation of structural reform scheme and
implementation of short-term measures
・Adoption of structural reform schemeWorking style reformsBusiness process/system reforms
Hum
an R
esou
rces Implementation of new personnel system “Be kind to people but strict in terms of work”
・New personnel system (challenge assessment, course change, promotion & demotion)
・Internal job posting system・Child care/nursing care support (child-rearing father
support/challenge vacation system, etc.)・Family Day
・Promotion of good health management“Good Health Declaration” (all employees personally)Ensuring proper management of persons subject to reexaminationEnhancement of industrial physician system, promoting transparency of health indicators
19
Final SummaryFinal Summary Financial Forecast
Platinum “Kurumin”
Health & Productivity Stock
Nadeshiko Brand

20Forward-looking statements including earnings forecasts contained in this document are based on certain assumptions deemed to be rational in light of the information available to the Company at the time of preparing the document, and are not intended to be guarantees of future performance.Actual results may differ significantly from plans and forecasts due to a variety of factors.
Reliability for
the FutureRicoh Leasing Company, Ltd.
Ricoh Leasing Company, Ltd.
21
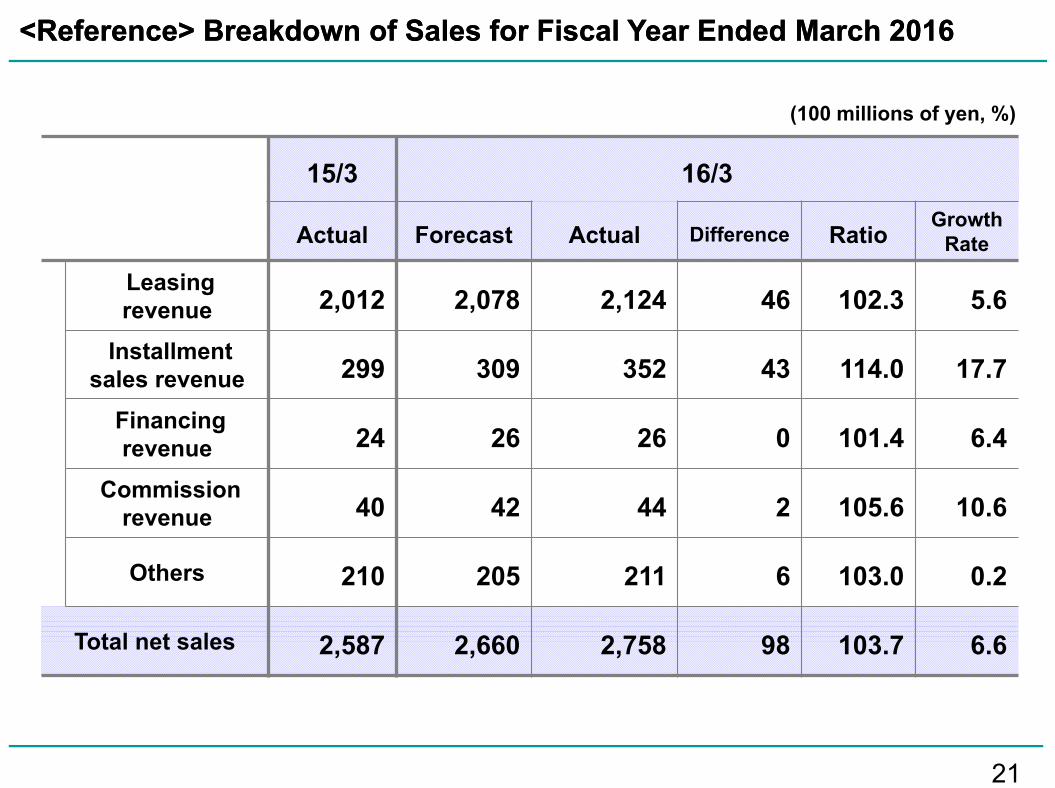
<Reference> Breakdown of Sales for Fiscal Year Ended March 2016<Reference> Breakdown of Sales for Fiscal Year Ended March 2016
(100 millions of yen, %)
15/3 16/3
Actual Forecast Actual Difference RatioGrowth
Rate
Leasing revenue 2,012 2,078 2,124 46 102.3 5.6
Installment sales revenue 299 309 352 43 114.0 17.7
Financing revenue 24 26 26 0 101.4 6.4
Commission revenue 40 42 44 2 105.6 10.6
Others 210 205 211 6 103.0 0.2
Total net sales 2,587 2,660 2,758 98 103.7 6.6

22
<Reference> Breakdown of Sales Forecast for Fiscal Year Ending March 2017<Reference> Breakdown of Sales Forecast for Fiscal Year Ending March 2017
(100 millions of yen, %)
16/3 17/3
Actual Forecast Growth Rate
Leasing revenue 2,124 2,190 3.1
Installment sales revenue 352 390 10.7
Financing revenue 26 27 2.4
Commission revenue 44 48 8.2
Others 211 195 (7.6)
Total net sales 2,758 2,850 3.3
23
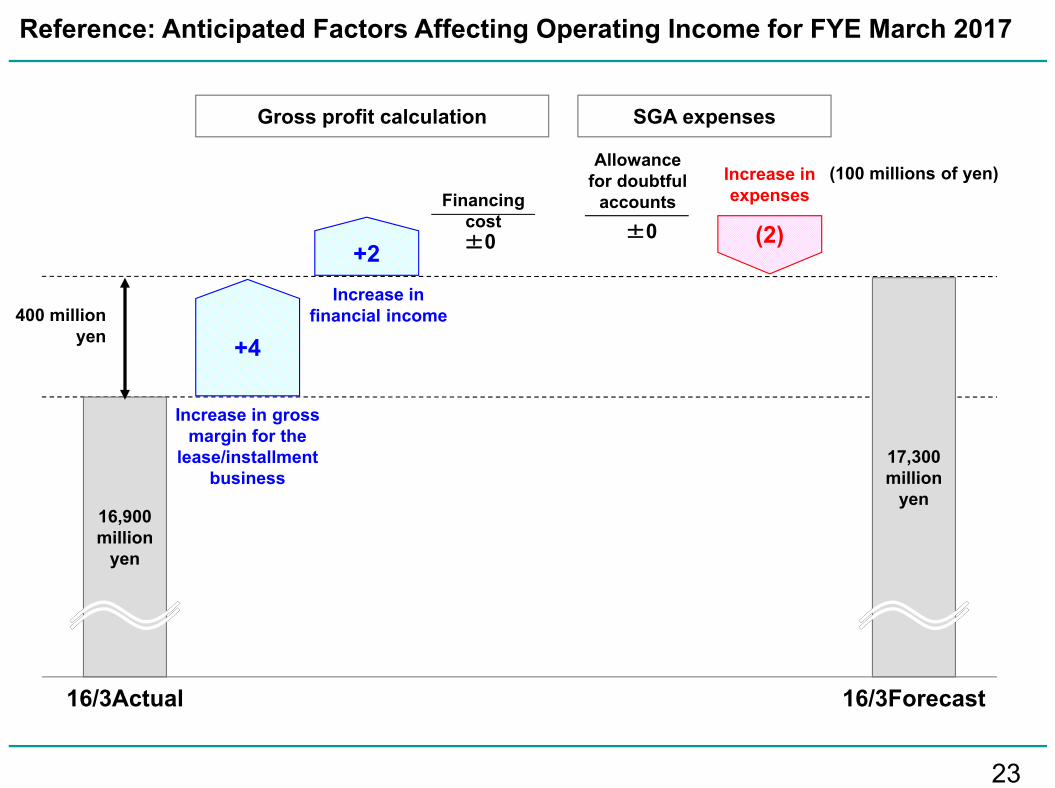
Reference: Anticipated Factors Affecting Operating Income for FYE March 2017
(100 millions of yen)
17,300 million
yen
16/3Forecast
16,900 million
yen
400 million yen
Gross profit calculation SGA expenses
Allowance for doubtful
accounts
16/3Actual
+2Increase in
financial income
Increase in gross margin for the
lease/installment business
Increase in expenses
(2)
+4
Financingcost±0 ±0


![Consolidated Financial Results for the Fiscal Year Ended ...Note: Comprehensive income Fiscal year ended March 31, 2019: ¥1,761 million [24.3%] Fiscal year ended March 31, 2018: ¥1,417](https://img.pdfslide.us/doc/110x75/5fe4d06806b4775830253106/consolidated-financial-results-for-the-fiscal-year-ended-note-comprehensive.jpg)