Embed Size (px)
Citation preview

Report No. CDOT-DTD-R-2001-6
Results and Recommendations of Forensic Investigation
of Three Full-Scale GRS Abutment and Piers in Denver,
Colorado
Naser Abu-Hejleh
Jorge G. Zornberg
William (Skip) Outcalt
Mike McMullen
June 2001
COLORADO DEPARTMENT OF TRANSPORTATION
RESEARCH BRANCH

i
The contents of this report reflect the views of the authors, who are
responsible for the facts and accuracy of the data presented herein. The
contents do not necessarily reflect the official views of the Colorado
Department of Transportation or the Federal Highway Administration. This
report does not constitute a standard, specification, or regulation.

ii
Technical Report Documentation Page 1. Report No. CDOT-DTD-R-2001-6
2. Government Accession No.
3. Recipient’s Catalog No. 5. Report Date June, 2001
4. Title and Subtitle Results and Recommendations of Forensic Investigation of Three Full-Scale GRS Abutment and Piers in Denver, Colorado
6. Performing Organization Code
7. Author(s) Naser Abu-Hejleh, Jorge G. Zornberg, William (Skip) Outcalt, and Mike McMullen
1. Performing Organization Report No. CDOT-DTD-R-2001-6
10. Work Unit No. (TRAIS)
9. Performing Organization Name and Address Colorado Department of Transportation 4201 E. Arkansas Ave Denver, Colorado 80222 11. Contract or Grant No.
13. Type of Report and Period Covered 1. Sponsoring Agency Name and Address
Colorado Department of Transportation 4201 E. Arkansas Ave Denver, Colorado 80222 14. Sponsoring Agency Code
15. Supplementary Note
16. Abstract In 1996, a full-scale geotextile -reinforced soil bridge abutment and two bridge piers with block facing were constructed in the Havana Maintenance Yard in Denver, Colorado. The abutment and outer GRS pier were load tested to demonstrate that GRS abutments and piers with block facing are viable alternatives to conventional bridge piers and abutments. Four to six months after the surcharge load was placed, excessive movements of the top several layers of the outer pier structure and severe cracking of the block facing were noticed. The toppling failure of the upper four block layers of the outer pier was deemed imminent and, consequently, the structures were dismantled. This report summarizes the measured in-situ conditions and characteristics of the structures materials (backfill, blocks, and geotextile fabric) after almost three years of being in place and identifies potentially relevant causes for the excessive deformation and cracking of the outer pier structure. Results of 27 out of 28 soil density tests indicate the backfill compaction level for The Havana GRS structures was below standard specifications (the average measured relative compaction was 88.3%). Also, relative compaction was variable (ranging 74% to 97%) and particularly low (88. 3%), especially close to the facing (average of 86.6%). Results of 128 wide-width tensile tests, conducted on geotextile sheets, indicated only a small loss of geotextile tensile strength (5.3%), which was attributed primarily to construction damage. Construction damage contributes to geosynthetic material deterioration and should be minimized. The block facing of the outer pier showed heavy external and internal damage in the middle zone. The facing experienced its largest movements in the upper four block layers, which decreased with the depth to become negligible in the bottom layers. The excessive deformations in the upper zone of the pier were evidence of a bearing capacity problem. Both the results of forensic investigation and simplified facing connection stability analysis indicate that layers 25 to 38 of the outer pier failed in meeting the serviceability block-to-block connection requirements. Potential reasons for the observed excessive deformation and cracking of the Havana outer pier are: high surcharge load applied to a limited surface area of a slender pier, low and variable backfill compaction level, low facing connection strength and reinforcement pullout resistance in the upper zone of the pier, weak blocks, and seasonal changes of temperature and moisture. Implementation GRS abutments and piers, constructed using closely spaced and high-strength geosynthetic reinforcements, well-compacted quality granular backfill, and strong blocks are viable alternatives to conventional bridge piers and abutments. Durability and creep of reinforcements were not identified as a problem for this system. Although design and construction of GRS abutment in highway projects have been successfully implemented by CDOT, research is still needed to develop rational design and construction guidelines for GRS piers. Design limitations and construction details for GRS piers are identified based on the findings from this study and recent published literature. 17. Key Words abutments, geotextiles, geosynthetics, walls, compaction, forensic, durability, connection, blocks
18. Distribution Statement
19. Security Classif. (of this report)
20. Security Classif. (of this page)
21. No. of Pages 84
22. Price

iii
CONVERSION TABLE U. S. Customary System to SI to U. S. Customary System
(multipliers are approximate) Multiply To Get Multiply by To Get (symbol) by (symbol)
LENGTH Inches (in) 25.4 millimeters (mm) mm 0.039 in Feet (ft) 0.305 meters (m) m 3.28 ft yards (yd) 10.914 meters (m) m 1.09 yd miles (mi) 1.61 kilometers (km) m 0.621 mi
AREA square inches (in2) 645.2 square millimeters (mm2) mm2 0.0016 in2 square feet (ft2) 0.093 square meters (m2) m2 10.764 ft2 square yards (yd2) 0.836 square meters (m2) m2 1.195 yd2 acres (ac) 0.405 hectares (ha) ha 2.47 ac square miles (mi2) 2.59 square kilometers (km2) km2 0.386 mi2
VOLUME fluid ounces (fl oz) 29.57 milliliters (ml) ml 0.034 fl oz gallons (gal) 3.785 liters (l) l 0.264 gal cubic feet (ft3) 0.028 cubic meters (m3) m3 35.71 ft3 cubic yards (yd3) 0.765 cubic meters (m3) m3 1.307 yd3
MASS ounces (oz) 28.35 grams (g) g 0.035 oz pounds (lb) 0.454 kilograms (kg) kg 2.202 lb short tons (T) 0.907 megagrams (Mg) Mg 1.103 T
TEMPERATURE (EXACT) Fahrenheit (°F) 5(F-32)/9 Celsius (° C) ° C 1.8C+32 ° F (F-32)/1.8
ILLUMINATION foot candles (fc) 10.76 lux (lx)lx 0.0929 fc foot-Lamberts (fl) 3.426 candela/m (cd/m) cd/m 0.2919 fl
FORCE AND PRESSURE OR STRESS poundforce (lbf) 4.45 newtons (N) N .225 lbf poundforce (psi) 6.89 kilopascals (kPa) kPa .0145 psi

iv
RESULTS AND RECOMMENDATIONS OF FORENSIC INVESTIGATION OF THREE FULL-SCALE GRS ABUTMENT AND PIERS
IN DENVER, COLORADO
by
Naser Abu-Hejleh Jorge G. Zornberg
William (Skip) Outcalt Mike McMullen
Report No. CDOT-DTD-R-2001-5
Prepared by Colorado Department of Transportation
Research Branch
Sponsored by the Colorado Department of Transportation
in Cooperation with the U.S. Department of Transportation Federal Highway Administration
June 2001
Colorado Department of Transportation Research Branch
4201 E. Arkansas Ave. Denver, CO 80222
(303) 757-9506

v
ACKNOWLEDGEMENTS
The authors wish to acknowledge valuable input and comments provided by the study panel
members, Rich Griffin, Dr. Trevor Wang, and Dr. Hsing Cheng Liu. Thanks are also extended to
Advanced Terra Testing, Inc. for performing the wide-width tensile tests on the geotextile
specimens, and to CDOT Maintenance crews for their significant role during dismantling of the
Havana Yard Structures.

vi
EXECUTIVE SUMMARY
In 1996, a full-scale geotextile reinforced soil (GRS) bridge abutment and two bridge piers
(center and outer) with block facing were constructed at the Havana Maintenance Yard in
Denver, Colorado (Photos 1 through 5 of Appendix A and Figure 1). A surcharge load of 2340
kN was applied to the abutment and outer pier (not to the center pier). The objective, as with the
Turner-Fairbank full-scale GRS pier, was to demonstrate that GRS abutments and piers with
block facing were viable alternatives to conventional bridge piers and abutments. The
performance of the GRS abutment and piers was good during load testing (November 1996 to
October 1997). However, sometime between March and May of 1997 (4 to 5 months after the
surcharge load was placed), excessive movements of the top several layers of the outer pier
structure and severe cracking of the block facing were noticed, as depicted in Photos 5 to 7 of
Appendix A. Toppling failure of the upper four block layers of the outer pier was deemed
imminent. Therefore, it was decided to remove the applied surcharge load, tear down the
structures, and perform a forensic investigation and facing connection stability analysis. This
report summarizes the in-situ conditions and characteristics of the materials (backfill soil, facing
blocks, and geotextile reinforcement) after almost three years of being in place and identifies
potentially relevant causes for the excessive deformation and cracking experienced by the outer
pier structure.
Results of 27 out of 28 soil density tests indicate the backfill compaction level for the Havana
Yard GRS Structures was below standard specifications (the average measured relative
compaction was 88.3%). Also, relative compaction was variable (ranging from 74% to 97%) and
particularly low (88.3% in average), especially close to the facing (86.6%), not meeting CDOT
requirements of 95% of the maximum dry unit weight measured in accordance with AASHTO T-
180 method. Results of 128 wide-width tensile tests, conducted on 1 pristine and 15 exhumed
geotextile sheets, indicated only a small loss of geotextile tensile strength (5.3%). This was
attributed primarily to construction damage. Negligible loss in tensile strength was attributed to
geotextile degradation and in-situ stresses. Creep of geosynthetic reinforcements was not
identified as a problem. The block facing of the outer pier experienced significant external and
internal damage in the middle zone, and experienced its largest movements in the upper four
block layers. Movements decreased with the depth to become negligible in the bottom layers.

vii
The excessive deformations in the upper zone of the pier were evidence of a bearing capacity
problem. Both the results of forensic investigation and facing connection stability analysis
indicate that layers 25 to 38 of the outer pier failed in meeting the serviceability block-to-block
connection requirements (i.e., relative displacement between block layers was larger than 4 mm).
Potential reasons for the excessive deformation and cracking of the Havana outer pier are: high
surcharge load applied to a limited surface area of a slender pier, low and variable backfill
compaction level, low facing connection strength and reinforcement pullout resistance in the
upper zone of the pier, weak blocks, and seasonal changes of temperature and moisture. The
comparatively low backfill compaction level led to increased lateral earth pressure loads and to
decreased strength and stiffness of the reinforced soil mass. The construction of the pier during
the cold season may have delayed the excessive movement and cracking of the pier facing. The
delay in the development of structure movements, which appeared several months after loading
during the 1997 spring season, was attributed to softening of the backfill that may have resulted
from low backfill compaction and soil wetting due to rain and ice melting.
Implementation Statement
GRS abutment and piers are viable alternatives to conventional methods used in bridge support.
Details for construction of GRS abutments and piers are available in several references (Elias
and Christopher, 1997; FHWA, 2000; and Abu-Hejleh et al., 2000 and 2001). Design and
construction of GRS abutments in highway projects have been successfully implemented and
monitoring results have shown excellent field performance. However, research is still needed to
develop rational design and construction guidelines for GRS piers and appropriate limitations
(e.g., base to height ratio). Consequently, future field implementation of GRS piers should still
be considered experimental and such structures should be carefully monitored. Limitations and
additional details for construction of GRS piers (and, if appropriate, other GRS structures)
learned from this study and from recently published literature (FHWA, 2000; Adams, 1997) are
furnished in this report. They are:
q The use of GRS piers is well-suited for remote locations, where specialized equipment or
concrete is unavailable or cannot be reached. The materials used to construct the pier are
commonly available. In emergency situations, a GRS pier can be constructed using small
viii
construction equipment and put into service within a few days. The use of GRS piers may be
beneficial for temporary bridge structures, and bike or pedestrian bridges. Also, GRS piers
should be considered for aesthetic purposes when a massive look is needed. Although there
are many benefits from this modern approach to bridge pier design, it should not be used in a
scour environment, when it would not prove economical, or when loads are excessive. CDOT
engineers believe that the use of GRS piers may not be economical for many typical highway
practices when compared to the use of concrete piers.
q Closely spaced (0.2 m to 0.3 m), high-strength geosynthetic reinforcements and well-
compacted quality granular backfill form a strong composite reinforced soil mass. Based on
the limited results of full-scale GRS piers and recommendations provided in the literature,
design surcharge pressures ranging from 100 to 150 kPa are recommended for comparatively
large and slender GRS piers (e.g., having base width/height ratio of 0.7 – the Turner-
Fairbank structure to 0.33 – the Havana Yard Structure). Under these surcharge pressures,
creep and durability of geosynthetic materials have not been a problem in monitored full-
scale structures. Construction damage of the geosynthetic is not considered a problem in
GRS piers because fill material can be spread by manual labor (an approximately 5%
reduction in tensile strength from damage was measured in this study). For construction of
GRS structures using heavy equipment, construction damage may contribute to reduction in
geosynthetic tensile strength and should be minimized.
q Requirements for compaction of coarse-grained backfill should be enforced and well
controlled in the field. To achieve proper backfill compaction at the optimal moisture content
within the limited area of the pier, numerous compaction passes with light equipment should
be performed. For GRS piers, a backfill soil with a friction angle of at least 40 degrees is
highly recommended. If feasible, a maximum size crushed stone of 19 mm should be used
for a minimum distance of 0.3 m behind the facing blocks in order to facilitate fill
compaction behind blocks, provide internal drainage, and prevent migration of fines to the
wall facing. Alternatively, wrapping of geotextile behind the face could be implemented for
erosion control purposes.

ix
q In the top 1.6 m of piers loaded with a high surcharge load, it is recommended to: 1) place
reinforcements with a wrapped-around procedure behind the facing, and 2) employ
mechanical connection between blocks and between blocks and reinforcements. Results of
this research and other studies suggest that the friction-based facing connection strength in
the lower zone of the pier is adequate.
q Consider measures and details to achieve a uniform distribution of surcharge load over the
entire pier surface area (e.g., use of flow fill in the top zone), or a trapezoidal distribution
where the highest pressure would occur at the center of the structure (e.g., plastic hinge joint
at the center of the concrete pad).
q Include measures to enhance the pullout resistance of reinforcements in the top layers near to
the sides of the pier (e.g., wrap reinforcements around heavy items, drive bars through
reinforcement into the backfill).
q Construction of the GRS structures during drier and warmer seasons is preferred. At least,
backfill temperature during construction should be maintained above freezing.
q Implement measures to prevent surface water run-off and ground water intrusion into the
reinforced soil mass.
q Use high quality, strong blocks meeting CDOT specifications.
x
TABLE OF CONTENTS
1.0 INTRODUCTION ...............................................................................................................1
1.1 Background ......................................................................................................................1
1.2 Problem Statement and Study Objectives........................................................................2
1.3 Content of the Report.......................................................................................................3
2.0 IN –SITU CONDITIONS AND CHARACTERISTICS OF THE BACKFILL
MATERIALS ..................................................................................................................................5
2.1 Backfill Material Characterization ..................................................................................5
2.2 General Observations .......................................................................................................5
2.3 In-situ Backfill Compaction Level ..................................................................................6
3.0 IN-SITU CONDITIONS AND DURABILITY OF BURIED GEOTEXTILES ................9
3.1 Overview..........................................................................................................................9
3.2 Specimen Retrieval and Preparation................................................................................9
3.3 Testing Procedure (Wide-Width Tensile Test, ASTM D 4595) ....................................10
3.4 Testing Results...............................................................................................................11
3.5 Discussion of the Results ...............................................................................................13
4.0 IN-SITU CONDITIONS AND CHARACTERSTICS OF THE BLOCK FACING........15
4.1 East Abutment Structure ................................................................................................15
4.2 Center Pier Structure......................................................................................................15
4.3 Outer Pier Structure .......................................................................................................16
4.3.1 External Conditions of the East Face of the Outer Pier Structure .............................16
4.3.2 Internal Conditions of the Facing of the Outer Pier Structure ...................................17
4.3.3 Summary of the Movement and Damage Results for the Outer Pier ........................17
5.0 STABILITY INVESTIGATION OF THE OUTER PIER STRUCTURE........................31
5.1 Influence of Backfill Compaction Level .......................................................................31
5.2 Serviceability Block-to-Block Connection Stability Analyses......................................31
5.2.1 Background ................................................................................................................31
5.2.2 Analysis Results and Discussion...............................................................................32
5.3 High Surcharge Load .....................................................................................................33
5.4 Influence of Seasonal Changes of Temperature and Moisture ......................................34
5.5 Comparison between the Turner-Fairbank and the Havana Yard Piers ........................34

xi
6.0 SUMMARY.......................................................................................................................39
6.1 Overview........................................................................................................................39
6.2 Fulfilling 1st Study Objective .........................................................................................39
6.2.1 Backfill ......................................................................................................................39
6.2.2 Geotextiles .................................................................................................................40
6.2.3 Block Facing ..............................................................................................................40
6.3 Fulfilling 2nd Study Objective........................................................................................41
7.0 RECOMMENDATIONS...................................................................................................45
REFERENCES ..............................................................................................................................48
APPENDIX A................................................................................................................................51
Photographs taken before and during dismantling of structures and during testing of geotextile
sheets.
xii
LIST OF FIGURES
Figure 1 Side and Top Views of the Havana Yard Large Scale GRS Structures (from Ketchart
and Wu, 1997) .........................................................................................................................4
Figure 2 Schematic Diagram of Specimen Sampling Plan for the Center Pier Geotextile Sheets
...............................................................................................................................................10
Figure 3 Typical Block from East Abutment Structure (133 to 182 N or 30 to 41 lb. in weight)
...............................................................................................................................................19
Figure 4 Block from Center Pier Structure (324 N or 73 lb. in weight) .......................................20
Figure 5 Block from Outer Pier Structure ( 258 N or 58 lb. in weight) ......................................21
Figure 6 Density of Cracking along the East Face of the Outer Pier ...........................................22
Figure 7 Density of Opened Joints along the East Face of the Outer Pier Indicating Movement
Parallel to the Facing .............................................................................................................23
Figure 8 Targeted and Current Vertical Profiles of the East Facing of the Outer Pier................24
Figure 9 Outward Displacement of the East Face of the Outer Pier Induced During and After
Construction...........................................................................................................................25
Figure 10 Measured and Maximum Recommended Relative Outward Displacements between
Block Layers ..........................................................................................................................26
Figure 11 Mapping Results for the Blocks’ Breaks in the Upper Zone of the Outer Pier (Note:
Marks indicate the broken sides, not location of the breaks) ................................................27
Figure 12 Mapping Results for the Blocks Breaks in the Middle Zone of the Outer Pier ..........28
Figure 13 Mapping Results for the Blocks Breaks in the Middle Zone of the Outer Pier ..........29
Figure 14 Effect of Relative Soil Density on the Soil Friction Angle, tan f, for Coarse-Grained
Soils (USBR, 1998) ...............................................................................................................36
LIST OF TABLES
Table 1 Measured Material Characteristics of the Havana Yard Structures Backfill.....................5
Table 2 Moisture, Density, and Compaction Level of the Havana Yard Structures’ Backfill
Results Measured during Dismantling Operations ..................................................................7
Table 3 Wide Width Tensile Test Results on Sheet W28 ............................................................12
Table 4 Results of Wide Width Tensile Strength Tests on Pristine and Exhumed Geotextile
Sheets .....................................................................................................................................12

xiii
Table 5 Results of Serviceability Block-to-Block Connection Stability Analyses .....................37

1
1.0 INTRODUCTION
1.1 Background
The technology of geosynthetic-reinforced soil (GRS) systems has been used extensively in
transportation systems to support the self-weight of the backfill soil, roadway structures, and
traffic loads. A comparatively new use of this technology is the use of GRS systems as an
integral structural component of bridge abutments and piers. Use of a reinforced soil system to
directly support both the bridge (e.g., using a shallow foundation) and the approaching roadway
structure has the potential of significantly reducing construction costs, decreasing construction
time and space, and smoothing the ride for vehicular traffic. From 1996 to 1999, two full-scale
GRS structures and two production GRS abutments were constructed to demonstrate that GRS
abutments and piers with block facings were viable alternatives to conventional bridge piers and
abutments and metallic reinforced piers and abutments.
A full-scale instrumented fabric-reinforced pier was constructed and load tested at the Turner-
Fairbank Highway Research Center in 1996. The pier was 5.4 m high and its base was 3.6 m x
4.8 m. The method of construction utilizes closely spaced high-strength geosynthetic
reinforcement and quality compacted road base. The pier sustained a vertical surcharge that was
equivalent to a pressure of 900 kPa. The Turner-Fairbank GRS pier showed excellent
performance at 200 kPa and a superficial problem of cracks in the facing system became notable
at pressures greater than 275 kPa. The results indicated this GRS pier was suitable for bridge
support and should be considered for use on an experimental field project (Adams, 1997;
FHWA, 2000).
To continue the Turner-Fairbank experiment, a geosynthetic-reinforced soil (GRS) abutment and
two GRS bridge piers (called center and outer piers) were constructed inside a 3.5-m deep pit in
the Havana Maintenance Yard in Denver, Colorado (see Photos 1 through 5 in Appendix A and
Figure 1). A complete description of the structures and measured performance were summarized
by Ketchart and Wu (1997). Side and top views showing the configuration of these structures are
shown in Figure 1. The structures were constructed with a roadbase backfill reinforced with
layers of a woven polypropylene geotextile. Dry-stacked hollow-core concrete blocks were used

2
as facing. The outer pier and the abutment structure, both 7.6 m in height, were load tested (the
center pier was not tested, see Photo 1 of Appendix A). The load was applied using concrete
barrier stacked in seven layers over three steel bridge girders (Figure 1). The load was
transmitted from the girders to the backfill through concrete pads placed on top of the structures
(Figure 1). A total load of 2340 kN (1170 kN on the pier and 1170 kN on the abutment) was
applied. The pier and abutment structures were instrumented to monitor the lateral and vertical
movements of the facing and deformation of the reinforcements. The performance of the loaded
large-scale abutment structure over a year was excellent. The measured immediate maximum
vertical displacement and lateral displacement (defined as elongation of the perimeter of the
abutment) were, respectively, 27.1 mm and 14.3 mm. The maximum vertical and lateral creep
displacements under a sustained load during 70 days were 18.3 mm and 14.3 mm, respectively.
Almost 70% of the creep displacement occurred in the first 15 days. The maximum strains in the
reinforcements were less than 1.0%, which was smaller than the reinforcement rupture strain of
18 %.
The excellent performance of the full-scale GRS abutment in the Havana Yard and the Turner-
Fairbank GRS pier cleared the way for Colorado engineers to select GRS walls to support the
bridge abutment shallow footings of the Founders/Meadows Structure (Abu-Hejleh et al. 2000,
and 2001) and Black Hawk Structure (FHWA, 2000).
1.2 Problem Statement and Study Objectives
Application of the surcharge load on the Havana Yard abutment and outer pier (Photo 1 of
Appendix A) was completed on 11/1/1996. Some time between March and May of 1997,
excessive movements of the top several layers of the outer pier structure and severe cracking of
the facing were noticed as depicted in Photos 5 to 7 of Appendix A. Toppling failure of the upper
four rows of the outer pier was felt to be imminent. Therefore, on October 30, 1997, the barriers
and girders were removed to preclude the collapse of the entire structure assembly. From
November 1997 to October 1999, all three unloaded structures (abutment, center and outer piers)
were not monitored but there were no signs of additional movements. In October of 1999, it was
decided to tear down the three structures and conduct forensic and stability investigations to
achieve two objectives:

3
1. Determine the in-situ conditions and characteristics of the materials (backfill, blocks,
and geotextile), after almost three years in place (from October 1996 to October 1999).
2. Determine potential causes of the excessive deformation and cracking of the outer pier
structure.
Dismantling of the three structures was conducted in stages, by hand, to enable careful
examination of the undisturbed in-situ condition and testing of backfill, geotextiles, and block
materials at different depths inside the three structures.
1.3 Content of the Report
The study recommendations and implementation statement were presented previously in the
executive summary. Chapter 2 presents and discusses the in-situ conditions and characteristics
of the backfill material including measured compaction levels at different locations (center and
edge) and depths inside the three structures. Results on the exhumed strength of geotextile sheets
from the center and outer GRS pier structures after being buried for three years are presented and
discussed in Chapter 3. Results of in-situ conditions and characteristics of block facing are
discussed in Chapter 4. The emphasis in Chapter 4 is on mapping the movement, external
cracking, and internal breaking of the east face of the outer pier. Probable causes for the
excessive movement of the outer pier structure, including results of simplified facing connection
stability analysis, are compiled in Chapter 5. A comprehensive summary of the study findings is
given in Chapter 6. Appendix A lists photos taken before and after dismantling the large-scale
structures and during testing of the geotextile sheets.

4
Figure 1 Side and Top Views of the Havana Yard Large Scale GRS Structures (from Ketchart and Wu, 1997)

5
2.0 IN –SITU CONDITIONS AND CHARACTERISTICS OF THE
BACKFILL MATERIALS
2.1 Backfill Material Characterization
The measured backfill gradation, liquid limit, and plasticity index for a backfill sample collected
from the outer pier structure are shown in Table 1. As shown in this table, the backfill soil used
in this project was a mixture of gravel (39.7%), sand (46.7%) and fine-grained soil (13.6%).
The backfill material was classified as A-1-A(0) according to AASHTO. The backfill meets the
material specifications of CDOT Class-1 backfill material (Table 1).
Table 1 Measured Material Characteristics of the Havana Yard Structures Backfill
Requirements for CDOT
Class-1 Backfill
Measured
Values
Gradation
50 mm, (% Passing) 100 100
Sieve # 4 ((% Passing) 30-100 60.3
Sieve # 50 (% Passing) 10-60 25.1
Sieve # 200 (% Passing) 5-20 13.6
2. Liquid Limit (%) <35 22.2
3. Plasticity Index (%) <6 6
2.2 General Observations
During dismantling operations, the fill in some of the layers was easily cut with a shovel, while
in other lifts a pick was needed to break the material up before it could be removed. The softer
layers could be identified visually. The softer layers were too dry during construction.
Considerable amounts of larger aggregates were visible on top of the layer. The well-compacted
layers had been constructed with more moisture – there were more fines on the top of the fill
layer. The blocks and the voids between and behind them were filled with uniform sized gravel
(approximately ¼” in size). Some of the gravel was obtained from the salt treated road-sand pile
at the maintenance yard. Some salt, which built up on the fabric at the back of the blocks, was
noticed. Deterioration of blocks may have increased with the presence of this salt.

6
After removal of the concrete pad from the top of the outer pier and during stage removal of the
upper three rows, it was noticed that the soil below the concrete pad settled more than the rest of
the pier area. The low and variable compaction over the pier area caused the uneven settlement
and most likely caused the non-uniform distribution of vertical surcharge load over the entire
surface area of the pier.
2.3 In-situ Backfill Compaction Level
For the backfill material employed in the Havana Yard Structures, the maximum backfill dry unit
weight and optimum moisture content were 21.1 kN/m3 and 6.4%, respectively as measured in
accordance with AASHTO T-180 Method A using 40% gravel. To have a satisfactory
performance for reinforced earth structures, CDOT construction specifications for Class-1
backfill material requires a compaction level exceeding 95% of the maximum dry unit weight
measured in accordance with AASHTO T-180 method. Twenty-eight field tests were conducted
during dismantling operations to measure the backfill moisture content, density and compaction
level at the center and edges for different depths inside the three structures (Table 2). Note that
the edge measurement was taken 1 foot from the facing.
It is clear from Table 2 that the backfill compaction requirements for all structures at all levels
and locations (except the center of row 35) were not met. Note also that the initial backfill
density before application of the surcharge load could even be less than the measured value after
the surcharge load had been applied. According to the CDOT crew who constructed the Havana
Yard Structures, the low compaction level was due to the lack of control of moisture and density
during construction. If the fill material was dry the construction crew added water randomly
during the compaction, but no moisture content tests or compaction density tests were done. The
lack of quality control also explains the variation of compaction level throughout the structure
depth (Table 2). The crew who constructed the structures indicated the fill was compacted using
small, walk behind, vibrating compactors. Also, compaction was likely to be less than desirable
due to the small surface area of the pier and the “fear-of-height factor” at the top layers. It is also
clear from Table 2 that the backfill close to the facing received less compactive effort than the
backfill at the center of the structure. Note that the backfill adjacent to the facing was even looser

7
than what was measured 1 foot from the facing. To keep from deforming the block facing, the
construction crew did not use the vibrating compactors less than about 1 foot from the back of
the blocks. The fill in that area was compacted by foot pressure.
Table 2 Moisture, Density, and Compaction Level of the Havana Yard Structures’ Backfill Results Measured during Dismantling Operations
Center of Structure Edge of the Structure Row
# Moisture
(%) Dry
Unit Wt. (kN/m3)
Relative Compaction
(%)
Moisture (%)
Dry Unit Wt. (kN/m3)
Relative Compaction
(%)
Outer Pier Structure 38 3.0 19.6 92.2 3.4 18.7 88.1 35 5.4 20.9 97.9 5.3 19.6 92.0 32 4.3 20.2 94.8 4.3 19.7 92.8 22 5.7 19.7 92.4 7.3 18.4 86.5 13 1.9 19.6 92.2 2.3 19.1 89.7 2 4.4 18.9 89.1 4.2 19.3 90.1
Center Pier Structure 39 5.1 19.5 91.9 5.3 18.6 87.7 30 2.2 18.7 88.4 3.3 18.8 88.7 20 3.3 16.4 77.1 3.0 15.7 74.1 2 3.5 19.9 93.4 3.2 18.9 88.9
East Abutment Structure 38 4.7 18.7 87.9 5.2 18.3 85.9 28 3.5 19.0 89.5 3.5 18.7 87.8 18 1.8 19.8 92.6 1.7 18.3 86.3 3 3.4 16.9 79.5 2.6 15.7 73.8

8

9
3.0 IN-SITU CONDITIONS AND DURABILITY OF BURIED
GEOTEXTILES
3.1 Overview
The reinforcement buried in the Havana Yard Structures for approximately three years was a
woven polypropylene geotextile designated as Amoco 2044 (Photos 11 and 13 of Appendix A).
The reinforcements were placed with the same orientation in all three structures. The geotextile
cross-machine (or fill) direction was along the short length of the structure (where geotextile was
subjected to relatively higher stresses), and machine direction (roll or warp direction) was along
the longer length of the structure (see Photo 2 and 1.1). The survivability and durability of the
exhumed geotextiles were evaluated by comparing the wide-width tensile strength of the
exhumed samples with the strength of a pristine geotextile sample. The loss of geotextile
strength of exhumed samples was attributed to stresses due to backfill weight and surcharge load,
aging over three years, and construction damage. One hundred twenty-eight wide-width tensile
tests were performed.
3.2 Specimen Retrieval and Preparation
Geotextile sheets were retrieved from the center pier (9 sheets) and outer pier (6 sheets)
structures during dismantling operations. On the layers where exhumed geotextile layers were
collected, the fill material was removed with extra caution to prevent damage to the geotextile.
The conditions of all retrieved geotextile sheets were excellent showing no signs of geotextile
distress (e.g., tears or cuts). To identify the location of the exhumed sheets, each exhumed layer
was marked with a letter (C= center pier, and W= outer pier), and a number indicating the row
number at which the geotextile sheet was placed. Note that row #1 refers to the bottom row. A
pristine geotextile sheet from the same lot of sheets used in the Havana Yard Structures was not
available. Therefore, a pristine (undamaged) geotextile sheet designated as Amoco 2044 was
obtained from the lab at the University of Colorado at Denver in November of 1999.
Each geotextile sheet was laid out as shown in the schematic diagram given in Figure 2. The
dimensions of each sheet changed with its location in the structure since the structures were
tapered from bottom to top (see Figure 1 for dimensions at top and bottom). Seven cross machine

10
direction (CMD) specimens and one machine direction (MD) specimen (# 8 in Figure 2) were
sampled from each sheet (see Figure 2). Approximate location of these specimens is shown in
Figure 2. Three center CMD specimens (1, 2, 3), and two CMD specimens (4, 5, 6, 7) on each
side were collected, spaced along each line approximately 1.5 to 2 meters apart (Figure 2). One
MD specimen was collected (#8) close to the corner edges (Figure 2). To ensure structural
integrity, specimens were taken by cutting each specimen 216 mm wide, and removing an equal
number of yarns from each side to obtain an 203 x 203 mm test specimens (Photo 14 in
Appendix A). Specimens were then placed in the standard atmosphere (50% relative humidity,
70o F laboratory temperature) for a period of 24 hours to insure temperature and moisture
equilibrium. One hundred twenty-eight specimens, (8 from each sheet), were prepared for the
wide-width tensile tests.
Figure 2 Schematic Diagram of Specimen Sampling Plan for the Center Pier Geotextile Sheets
3.3 Testing Procedure (Wide-Width Tensile Test, ASTM D 4595)
The distance of clamp separation was adjusted to approximately 203 mm (Photo 15). The top jaw
was supported by a free swivel, which allowed the jaw to rotate in the plane of the geotextile.
The 203 mm wide by 203 mm long specimens were then mounted centrally and positioned
adjacent to the inside edges of the upper and lower jaws. The specimens were placed in the grips
7 84
56
1 2 3
Cro
ss M
achi
ne D
irect
ion
Machine Direction

11
to test the middle 102 mm without regard to specimen damage. A small seating load was applied
to each specimen to remove any slack in the jaws and geotextile (Photo 15). The recorder was
then zeroed with the pre- load applied, and the tensile testing machine was then started at a
constant rate of 10.2 mm (10% strain rate) per minute. Tests were continued until rupture, at
which point the tensile machine was stopped and reset to the initial gage position (Photo 16).
3.4 Testing Results
Typical observed responses during testing of sheets W17 and C20 (8 specimens of each sheet)
are shown in Photo 17. It was noted that at a point of rupture, the majority of the specimens
tended to break violently on one side or the other, resulting in a single peak graph (see Photo 17).
In a few instances, rupture initiated near the center of the specimen and radiated outward,
resulting in a dual peak graph, and somewhat lower ultimate loads. Typical results in terms of the
ultimate strength and strain at break on the 8 specimens of sheet W28 are shown in Table 4 It is
clear from Photo 17 and Table 3 that the test results for the 7 CMD specimens were very close
with minor variations. The low standard deviation and coefficient of variation of the results of 7
CMD specimens (Table 3) was noticed for specimens of all tested geotextile sheets. Therefore,
the results of 7 CMD specimens for each sheet are presented in terms of the average ultimate
strength and strain at break as listed in Table 42. Note that the strength results for each structure
in Table 42 are listed in order starting from the sheets located in the top. The average geotextile
strength and strain at break for each structure (center and outer pier structures) obtained from all
sheets and specimens are also listed in Table 42.

12
Table 3 Wide Width Tensile Test Results on Sheet W28
Specimen # Ultimate Tensile Strength (kN/m) Strain at Break (%) Machine Direction (MD) Specimen
8 71.4 17.9 Cross Machine Direction (CMD) specimens
1 86.1 16.8 2 86.9 15.8 3 87.6 15.6 4 85.9 15.6 5 90.1 15.9 6 86.5 15.4 7 85.4 15.8
Average 86.9 15.8 Std. Dev. 1.6 0.45
Coefficient of Variation 1.8 % 2.84
Table 4 Results of Wide Width Tensile Strength Tests on Pristine and Exhumed Geotextile Sheets
Ultimate Tensile Strength (kN/m) and Strain at Break (%) 7 CMD specimens for each sheet 1 MD specimen for each sheet
Sheet Identification
Average Strength Average Strain Strength Strain Pristine Fresh Geotextile Sheet
88.2 17.8 75.9 19.7 Center Structure
C36 80.4 14.5 78.8 21.6 C35 86.4 15.9 79.2 19.4 C30 71.9 13.5 83.3 20.1 C25 76.9 15.1 78.7 19.4 C20 74 14.2 81.2 21.2 C15 86.7 16.4 72.3 18.3 C13 86.6 15.9 75.9 19.6 C10 83.6 16.1 71.3 18.3 C5 89.1 16.5 70.2 17.5
Average 81.7 15.3 76.8 19.5 Outer Pier Structure
W28 86.9 15.8 71.4 17.9 W23 89.2 16.9 72.7 21.9 W17 85.4 16 84.1 24.1 W13 87.5 16.6 70.3 18.3 W8 86.5 16.5 75.6 18.8 W5 81.3 14.5 76.4 18.2
Average 86.1 16.1 75.1 19.8
13
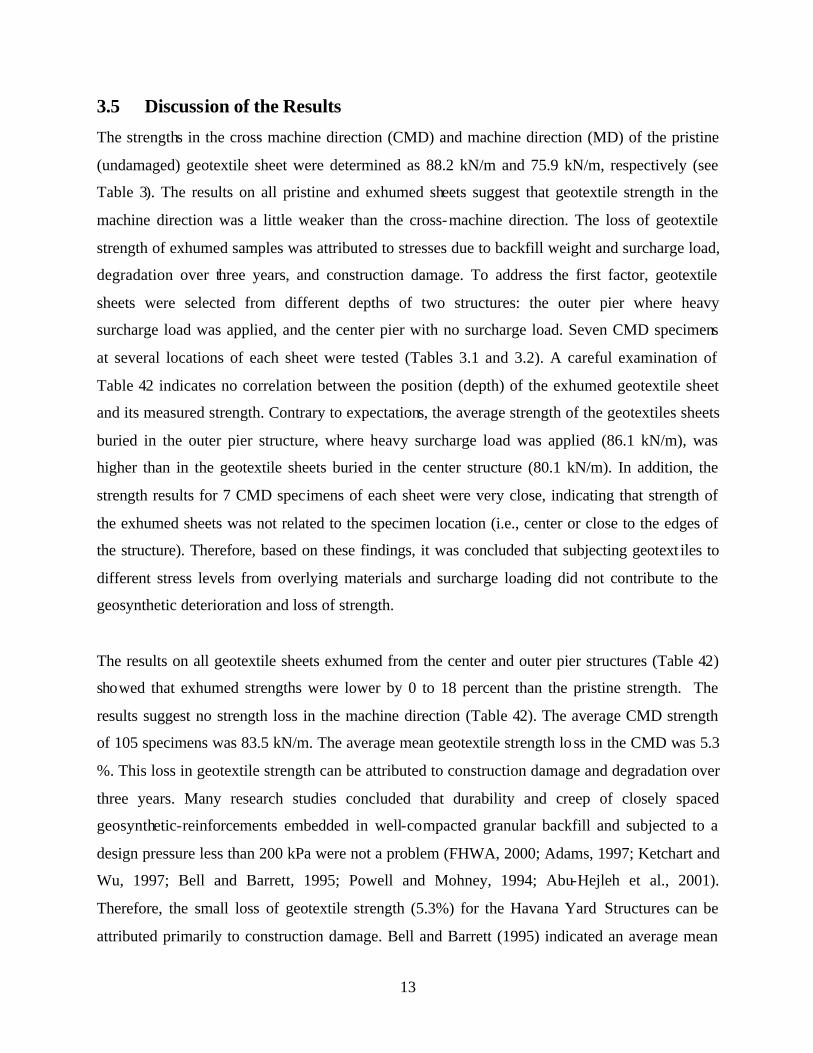
3.5 Discussion of the Results
The strengths in the cross machine direction (CMD) and machine direction (MD) of the pristine
(undamaged) geotextile sheet were determined as 88.2 kN/m and 75.9 kN/m, respectively (see
Table 3). The results on all pristine and exhumed sheets suggest that geotextile strength in the
machine direction was a little weaker than the cross-machine direction. The loss of geotextile
strength of exhumed samples was attributed to stresses due to backfill weight and surcharge load,
degradation over three years, and construction damage. To address the first factor, geotextile
sheets were selected from different depths of two structures: the outer pier where heavy
surcharge load was applied, and the center pier with no surcharge load. Seven CMD specimens
at several locations of each sheet were tested (Tables 3.1 and 3.2). A careful examination of
Table 42 indicates no correlation between the position (depth) of the exhumed geotextile sheet
and its measured strength. Contrary to expectations, the average strength of the geotextiles sheets
buried in the outer pier structure, where heavy surcharge load was applied (86.1 kN/m), was
higher than in the geotextile sheets buried in the center structure (80.1 kN/m). In addition, the
strength results for 7 CMD specimens of each sheet were very close, indicating that strength of
the exhumed sheets was not related to the specimen location (i.e., center or close to the edges of
the structure). Therefore, based on these findings, it was concluded that subjecting geotext iles to
different stress levels from overlying materials and surcharge loading did not contribute to the
geosynthetic deterioration and loss of strength.
The results on all geotextile sheets exhumed from the center and outer pier structures (Table 42)
showed that exhumed strengths were lower by 0 to 18 percent than the pristine strength. The
results suggest no strength loss in the machine direction (Table 42). The average CMD strength
of 105 specimens was 83.5 kN/m. The average mean geotextile strength loss in the CMD was 5.3
%. This loss in geotextile strength can be attributed to construction damage and degradation over
three years. Many research studies concluded that durability and creep of closely spaced
geosynthetic-reinforcements embedded in well-compacted granular backfill and subjected to a
design pressure less than 200 kPa were not a problem (FHWA, 2000; Adams, 1997; Ketchart and
Wu, 1997; Bell and Barrett, 1995; Powell and Mohney, 1994; Abu-Hejleh et al., 2001).
Therefore, the small loss of geotextile strength (5.3%) for the Havana Yard Structures can be
attributed primarily to construction damage. Bell and Barrett (1995) indicated an average mean

14
strength loss of 27 % for geotextiles buried in Glenwood Canyon GRS walls for up to 11 years.
They attributed most of the loss to construction damage. Bell and Barrett (1994) reported large
cuts and abraded areas in the exhumed geotextiles, which were not noticed in the geotextiles
retrieved from the Havana Yard Structures. When compared to the construction method
employed in Glenwood Canyon, the construction method employed in The Havana Yard
Structures was relatively gentle because the fill was spread by manual labor (due to the small
working size) and smaller compaction equipment was utilized. This all indicates that
construction methods and techniques have a great impact on the level of geosynthetic
degradation.

15
4.0 IN-SITU CONDITIONS AND CHARACTERSTICS OF THE BLOCK
FACING
4.1 East Abutment Structure
The blocks for the abutment structure (Figure 3, Photo 2 Appendix A) were supplied by several
manufacturers (Amoco Fabrics & Fibers, Best Block, Clalite, Retaining Wall Systems, and
Valley Block). The blocks were standard blocks (0.2m x 0.2m x 0.4m), made of lightweight
concrete in the basic two-cell shape (Figure 3). Their weights varied from 133 to 182 newtons
(30 to 41 pounds). There were few cracks visible in the external face before the dismantling
began (Photo 8). During dismantling, a fairly large percentage – as high as 50% – of the blocks
in some layers was internally broken. Most of the blocks on west face of the abutment (the side
where surcharge load on the abutment was applied, see Figure 1) were broken. Most of the
blocks on the north, east, and south faces of the abutment were unbroken. Many of the blocks
that were broken did not have visible cracks before dismantling of the structure. A block that had
a crack that ran completely from the top to the bottom and half way through the center web is
shown in Photo 12 (Appendix A). There did not seem to be any correlation between the layer
location (depth) and the percentage of broken blocks.
4.2 Center Pier Structure
The concrete blocks from the center pier (Figure 4, Photo 4) were the heaviest of the three
structures at 324 Newtons (72.7 pounds), supplied by one manufacturer and most likely made of
normal weight concrete. The blocks’ dimensions are shown in Figure 4. They had a raised lip
along the outside face. The blocks were laid with the lip up, forcing a small setback in the next
row. This setback resulted in a uniform positive batter at the face (Figure 1). The blocks of this
structure were the only ones that had any type of connection from one layer to the next other than
friction with the fabric. It was noticed that the top several rows of the center pier experienced
outward bowing (Photo 4 of Appendix A), possibly due to negligence in controlling the facing
alignment during construction. There were no visible cracks in the external face and no internal
broken blocks were found during dismantling of the center pier.

16
4.3 Outer Pier Structure
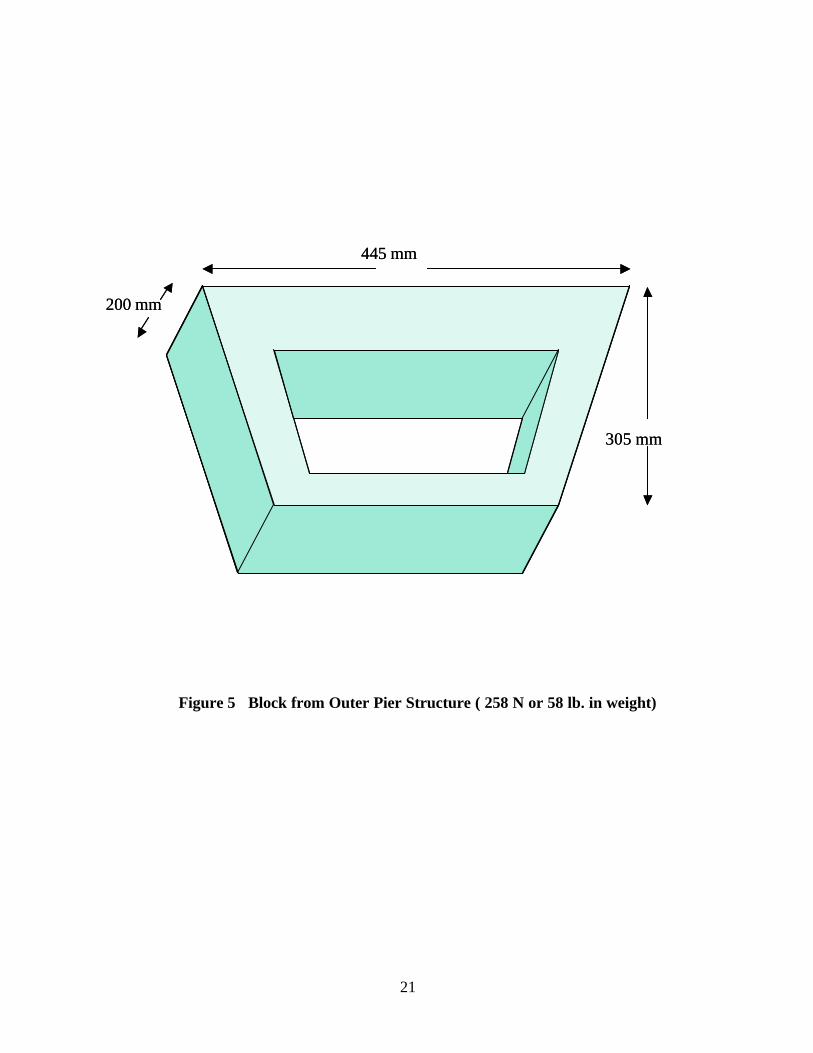
The outer pier was constructed of “D” shaped blocks – 203 mm high by 445 mm long and 305
mm wide (Figure 5). The outside faces of the blocks were 70 mm thick, the sides were 43 mm
thick, and the backs were 60 mm thick. The same manufacturer supplied the blocks and there
was no significant variation in the weight. The blocks used in the outer pier weighed 258
newtons (58 pounds). These blocks seemed to be denser than those used in the east abutment,
and were most likely made of normal weight concrete. Because of the tapered sides the blocks
can be placed in a curve easily. The ends of the outer pier were curved that way (Photo 10).
Since the blocks of the outer pier structure were severely cracked and the upper four rows
showed significant movements (see Photos 5, 6 and 7), the external and internal conditions of
blocks were thoroughly examined. The results of this examination are presented in the following
subsections.
4.3.1 External Conditions of the East Face of the Outer Pier Structure
The outer pier had 38 rows, numbered from 1 at the bottom to 38 at the top. Scaffolding was
placed next to the east face of the outer pier structure enabling complete examination of the 3 m
wide face. The numbers of fine cracks up to 1 mm in width and coarse cracks up to 5 mm in
width in each row are shown in Figure 6. Cracks were typically aligned with joints in the layers
above and below the cracked block (Photos 5, 6, and 7). When a block cracked, the crack would
often follow the joints between blocks and cause other blocks to crack. The middle zone,
between layer 11 and 34, was heavily cracked, the lower zone was cracked to a lesser degree,
and no cracking was noticed in the upper 4 layers. The vertical joints opened up as the blocks
moved in the direction perpendicular to the facing. The number of opened joints in each row is
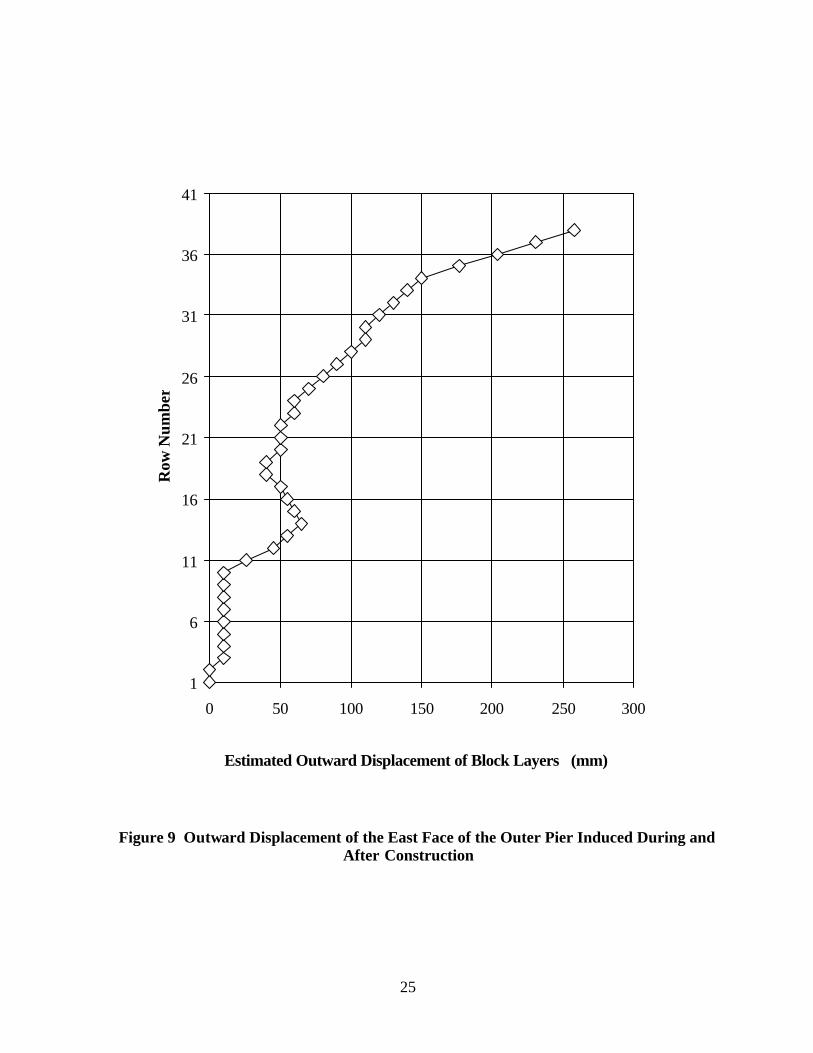
shown in Figure 7. The construction of the pier facing targeted a uniform positive batter of 5%
from the vertical line (see Figures 1 and 8). It was assumed that each constructed row was placed
with a setback of 10 mm (corresponding to a 5% positive batter) from the row below. The
current facing out-of-vertical alignment shown in Figure 8 was determined from measurements
of distances between the bottom edge of each row and the top edge of the row below. The
targeted batter and current out-of-vertical alignments were employed to estimate the outward
displacement of each block layer assuming that the leveling pad did not experience any outward

17
displacement (Figure 9). It is important to realize that the estimated facing outward
displacements given in Figure 9 include displacements incurred during construction of the pier,
application of the surcharge load, and the post-construction displacements. From the results in
Figure 9, the displacements of each block layer relative to the layer below (referred to as relative
displacement) were obtained (Figure 10). Figures 7, 9 and 10 indicate that most of the pier
movements occurred in the upper two thirds of the pier, mostly in the upper four layers, and that
the movement decreased with the depth from top of the pier.
4.3.2 Internal Conditions of the Facing of the Outer Pier Structure
No damage was noticed for the internal sides of the upper four block layers (rows 35 to 38), but
all other layers had broken blocks. In rows 33 and 34, the blocks were broken into several pieces.
As the dismantling progressed, it became apparent that many of the blocks that appeared from
the outside to be whole were also broken. Typical mapping results for the blocks’ breaks at
different levels in the pier structure are shown in Figures 11, 12, and 13. Note that the marks
indicate the broken sides, not exact location of the breaks. From layer 32 down to 30 all of the
blocks were broken (~ 27 blocks per layer). In rows 29 through 27 there were only five unbroken
blocks. On row 27, all blocks were broken, on row 26 there were two unbroken blocks, on row
25 there were 7 unbroken blocks, and on row 24 there were 5 unbroken blocks. For the entire
pier, more blocks on the straight sides of a given layer were broken than in the curves at the ends
of the layer (Figure 11 to 13). Most of the unbroken blocks were either on the curves or at the
end of the straight sides of the pier (see Figures 11 to 13). From rows 32 to 24, there were
almost no unbroken blocks in the straight part of the pier. It is also clear from the mapping
results that the lower layers had more unbroken blocks. The breaks in all of the blocks were
nearly vertical from the top to the bottom of the block; no intersection of one break with another
was observed. Most broken blocks had at least two breaks. Most blocks had only one break per
side and most breaks were near a corner, although multiple breaks in a side and breaks near the
centers of the faces were found. While many of the blocks were broken in several places, none
was shattered.
4.3.3 Summary of the Movement and Damage Results for the Outer Pier
Distinct responses were noticed for three zones of the outer pier (see Figures 6 to 13):

18
q Upper zone of block layers 35 to 38: No cracking to the external facing, or internal damage
to the blocks was noticed in this zone. The upper four layers experienced excessive relative
outward displacement between block layers and significant opening of vertical joints.
q Middle zone of block layers 11 to 34: This zone moved to a lesser degree than the upper
zone but was the most heavily damaged and cracked. The relative displacements of block
layers 25 through 34 were approximately 10 mm. On the average, smaller relative
displacements were noticed for layers 11 to 25 (movement decreased with depth).
q Lower zone of block layers 1 to 10: In this zone, the intensity of block damage (cracking
and breaks) diminished and the facing experienced negligible movement.

19
Figure 3 Typical Block from East Abutment Structure (133 to 182 N or 30 to 41 lb. in weight)
406 mm
203 mm
203 mm
406 mm
203 mm
203 mm

20
Figure 4 Block from Center Pier Structure (324 N or 73 lb. in weight)
445 mm
318 mm
200 mm
445 mm
318 mm
200 mm
21
Figure 5 Block from Outer Pier Structure ( 258 N or 58 lb. in weight)
445 mm
200 mm
305 mm
445 mm
200 mm
305 mm

22
Figure 6 Density of Cracking along the East Face of the Outer Pier
0 1 2 3 4 5 6
1
3
5
7
9
11
13
15
17
19
21
23
25
27
29
31
33
35
37
Row
Num
ber
Number of Cracks
Coarse CracksFine Cracks

23
Figure 7 Density of Opened Joints along the East Face of the Outer Pier Indicating Movement Parallel to the Facing
0 1 2 3 4 5 6 7 8
1
3
5
7
9
11
13
15
17
19
21
23
25
27
29
31
33
35
37
Row
Num
ber
Number of Coarse Joints

24
Figure 8 Targeted and Current Vertical Profiles of the East Facing of the Outer Pier
1
6
11
16
21
26
31
36
41
050100150200250300350400
Inward Distance from Toe (mm)
Row
Num
ber
Targeted Profile during Construction
Current Profile
25
Figure 9 Outward Displacement of the East Face of the Outer Pier Induced During and After Construction
1
6
11
16
21
26
31
36
41
0 50 100 150 200 250 300
Estimated Outward Displacement of Block Layers (mm)
Row
Num
ber

26
Figure 10 Measured and Maximum Recommended Relative Outward Displacements between Block Layers
1
6
11
16
21
26
31
36
41
0 5 10 15 20 25 30
Relative Displacement between Block Layers (mm)
Row
Num
ber
Measured
NCMA Servicibility Requirments

27
West Pier Row 28
NAll blocks on this row were brokenThe marks are not indications of locationsfor the breaks.
West Pier Row 23
Short piece used to fill
N
Figure 11 Mapping Results for the Blocks’ Breaks in the Upper Zone of the Outer Pier (Note: Marks indicate the broken sides, not location of the breaks)

28
West Pier Row 13
NWest Pier Row 18
Short piece used to fill
N
Figure 12 Mapping Results for the Blocks Breaks in the Middle Zone of the Outer Pier

29
West Pier Row 2
N
Short piece used to fill
West Pier Row 8N
Figure 13 Mapping Results for the Blocks Breaks in the Middle Zone of the Outer Pier

30

31
5.0 STABILITY INVESTIGATION OF THE OUTER PIER STRUCTURE
Causes for the excessive movements of the outer pier could be attributed to the combination of
several factors that will be discussed in this chapter.
5.1 Influence of Backfill Compaction Level
It was concluded in the FHWA study (FHWA 2000) that good backfill compaction is essential to
satisfactory performance of GRS structures. Figure 14 shows the relation between relative
density and the angle of internal friction (also expressed as tan φ) for compacted coarse-grained
soils (USBR, 1998). A soil with a friction angle of 40 degrees has almost four times the bearing
capacity of a soil with a friction angle of 32 degrees.
Chapter 2 concluded that the backfill compaction level for the Havana Yard GRS structures was
variable and low, especially close to the facing, not meeting CDOT requirements of 95% of
AASHTO T-180 method (see Table 2). The non-smooth pier deformation response from row 11
to row 14 (Figures 8 and 9) could be attributed to the variable and low applied backfill
compaction level. According to CDOT design specifications, a compaction level of 95% is
required to achieve a minimum backfill friction angle of 34 degrees. Hence, the friction angle for
the outer pier backfill is expected to be lower than 34 degrees, especially close to the facing. The
comparatively low backfill compaction level led to a low strength (i.e., bearing capacity) and
stiffness of the reinforced soil mass (Figure 14), lower reinforcement pull-out resistance, higher
lateral earth pressures and facing connection loads, and non-uniform distribution of surcharge
loads over the pier area, especially in the top zone. Therefore, the lower backfill compaction
level resulted in relatively more deformation to the pier.
5.2 Serviceability Block-to-Block Connection Stability Analyses
5.2.1 Background
There is no procedure developed for stability analysis of GRS pier structures. The stability
analysis of the facing connections employed here follow the analysis described for reinforced
soil walls supporting high surcharge loads (Elias and Christopher, 1997). Serviceability facing
connection criteria are employed in the design of segmental retaining walls to ensure that design

32
facing connection capacity is not developed at the expense of unacceptable wall movement. A
relative displacement between block layers below 2% of the height of the block (4 mm in our
case) is recommended by NCMA guidelines to insure that serviceability block-to-block
connection (or interface shear) capacity criterion is met (Bathurst and Simac, 1997). Results of
Figure 10 indicate this criterion was not met for the upper 14 block layers (rows 25 to 38). In the
Havana Yard outer pier structure, a fabric layer was placed between block layers and the hollow
concrete blocks were filled with uniform size gravel. This facing system developed its block-to-
block connection capacity by interface friction between blocks and reinforcements and between
gravel and reinforcements. That is, no interlock with shear key or other form of mechanical or
positive connection was used.
5.2.2 Analysis Results and Discussion
A surcharge load of 1170 kN was applied on the concrete pad placed on the top of the pier (3.05
m x 0.91 m, see Figure 1). The average vertical stress, σv, within the reinforced soil mass of the
outer pier structure was induced by gravity forces due to the backfill self weight and surcharge
concentrated loads. For a uniformly loaded rectangular area, an approximate estimate of the
increase in vertical stresses at different depths can be obtained by assuming the applied surcharge
loading to be distributed within a truncated pyramid with sides sloping at 2 vertical to 1
horizontal. The area of the truncated pyramid at any given depth (Area of Influence) should not
exceed the cross-sectional pier area at that depth. Note that the cross-sectional area of the pier
was not constant with depth and it was tapered from 8.4 m2 at the bottom to 5 m2 at the top (see
Figure 1). The connection load per 1 unit width (kN/m) at any depth z can calculated as
σv= γ z + 1170 / (Area of Influence) (1)
Connection Load = Ka σv S (2)
Where γ is the backfill unit weight (measured as 20.5 kN/m3), Ka is the active earth pressure
coefficient, and S is the vertical spacing (0.2m). Table 5 summarizes the results for the average
vertical stress, area of influence, and connection loads at different row levels. Employed in the
analysis was a backfill with an internal friction angle of 32 degrees, which is a conservative
estimated value, based on the discussion in the previous section.

33
The serviceability block to block connection capacity (Ts ) was estimated using the equation
suggested by Bathurst and Simac (1997) as:
Ts = a+ N* tan λ (3)
Where a is the minimum available block-to-block connection capacity (kN/m), λ is the
equivalent friction angle between blocks, and N is the normal load transmitted across the blocks.
Bathurst and Simac (1997) recommended a= 0.8 kN/m and λ= 37 degrees for a facing system
that seems similar to the one employed in the Havana Yard pier structure. N is taken as the self-
weight of overlying infilled blocks, thus neglecting the drag vertical forces transferred to the
blocks from the fabric and the soil. Results for the connection capacity and factor of safety
(connection load/connection capacity) at different rows are given in Table 5. Results of Table 5
indicate that the factor of safety was less than 1 between rows 25 and 38, suggesting the
serviceability block-to-block connection capacity was exceeded in that zone.
Both the results of forensic investigation (Figure 10) and facing connection stability analysis
(Table 5) indicated that layers 25 to 38 of the outer pier failed to meet the serviceability block-to-
block connection requirements (i.e., relative displacement between block layers larger than 4
mm). If higher soil friction angles of 36 and 40 degrees were employed in the analysis, the
connection capacity would still be exceeded for block layers above 27 and 29, respectively. This
indicates that serviceability connection capacity would have been exceeded in the upper zone of
the outer pier structure even if the backfill had been well compacted. Therefore, some form of
positive block-to-block mechanical connection was needed for a geosynthetic-reinforced soil
structure supporting a high surcharge load.
5.3 High Surcharge Load
A very large average contact bearing pressure (422 kPa) was induced directly below the concrete
pad (at the top of row 38, see Table 5). A sharp drop of vertical soil stresses occurred around the
concrete pad. Around the concrete pad, the vertical forces acting on the reinforced soil were
small; also, the area of that zone was very small, leading to small pullout resistance of the

34
geotextile layers. The vertical stresses on the blocks around the concrete pad were also very
small, making the friction-based block-to-block connection strength very small (see Table 5). For
all of the reasons described above, the generated high lateral earth load under the concrete pad
exceeded the in-service block-to-block connection capacity (maximum factor of safety less than
0.36 in Table 5), and possibly caused a soil bearing capacity problem, leading to excessive
displacement of blocks in the upper zone of the pier.
5.4 Influence of Seasonal Changes of Temperature and Moisture
Abu-Hejleh et al. (2001) and Buttry et al. (1996) discussed the influence of temperature and
seasonal changes on the performance of GRS walls. Abu-Hejleh et al. (2001) reported that
during construction of Phase II of the Founders/Meadows Structure during the cold season, the
front GRS wall responded with comparatively small deformations to the increasing level of
applied vertical soil stresses. During the following spring season, the front GRS wall responded
with comparatively large displacements to the increasing level of applied vertical soil stresses.
This behavior was attributed to softening of the backfill due to soil wetting caused by ice melting
and rain during the spring season in Colorado.
Field records for the Havana Yard Structures indicate that construction of most of the outer pier
structure and application of the surcharge load were performed during the cold season, at times
in freezing conditions (construction completed 11/1/96). The sudden excessive movement of the
pier structure was noticed some time between March and June of 1997 (during the thawing and
heavy rain season in Colorado). Thus, it may be speculated that construction of the outer pier
structure during the cold season and softening of the backfill during the 1997 spring may have
contributed to the excessive movement of the pier noticed in the spring season. The softening
occurred due to a lower backfill compaction level and soil wetting due to heavy rain and ice
melting.
5.5 Comparison between the Turner-Fairbank and the Havana Yard Piers
The Havana Yard pier was a relatively slender structure (1.82 m wide and 4.57 m long at the top,
and 2.45 m wide and 5.18 m long at the bottom, and 7.6 m high) with base width to height ratio
of 0.32. The Turner-Fairbank pier was 5.4 m in height with a base 3.6 m x 4.8 m for a width to

35
height ratio of 0.67. In the Turner-Fairbank pier, the load was applied uniformly over the entire
surface area but the load was applied to a limited surface area in the Havana Yard pier. For the
Turner-Fairbank pier, the backfill compaction was monitored very carefully to ensure a proper
moisture and uniform backfill compaction level exceeding construction requirements. The
measured average backfill unit weight was a very high value (22.8 kN/m3 or 145 Ib/ft3). This
was not the case with the Havana Yard pier backfill (see Chapter 2). The Havana Yard pier
backfill was poorly monitored and not uniformly compacted (19.5 kN/m3). It did not achieve the
required 95% compaction level. The average compaction was 91.5 %, and close to the edge of
the pier was only 89.9%. For all these reasons, the performance of the Turner-Fairbank pier was
much better in terms of load carrying capacity (loaded up to a pressure of 900 kPa), settlement of
the top of the pier, and long-term creep which was negligible for the Turner-Fairbank pier but
quite significant for the Havana Yard outer pier (FHWA, 2000). Furthermore, the Havana Yard
pier experienced excessive deformations and cracking. For the Turner-Fairbank pier, Adams
(1997) reported excellent pier performance at 200 kPa and a superficial problem of cracks in the
facing at pressures greater than 275 kPa.
Elias and Christopher (1997) recommended a design pressure of 200 kPa for reinforced soil
abutments directly supporting bridge loads. The GRS abutments for the Founders/Meadows
Structure (Abu-Hejleh et al., 2000) and Black Hawk Structure (FHWA, 2000) were constructed
and performed satisfactorily with a design pressure of 150 kPa. For the Turner-Fairbank large-
size pier, it was concluded that the performance of the pier at 200 kPa was very good with no
cracks occurring in the facing blocks. Therefore, based on the previous discussion, for future
construction of a massive pier like the Turner-Fairbank pier, a design pressure of 150 kPa can be
used. For future construction of slender piers like the Havana Yard outer pier, when properly
constructed as outlined in the Executive Summary, a design pressure of 100 kPa is
recommended.

36
Figure 14 Effect of Relative Soil Density on the Soil Friction Angle, tan f, for Coarse-Grained Soils (USBR, 1998)

37
Table 5 Results of Serviceability Block-to-Block Connection Stability Analyses
Top of Depth Influence Average Horizontal ConnectionRow # (z) m Area Vertical Active Load
(m2) Stress Stress (kN/m)(kPa) (kPa) Capacity Factor of
kN/m Safety38 0 2.78 421.5 129.437 0.2 3.61 328.4 100.8 23.0 1.8 0.0836 0.4 4.52 267.1 82.0 18.3 2.8 0.1535 0.6 5.30 233.2 71.6 15.4 3.8 0.2534 0.8 5.39 233.6 71.7 14.3 4.8 0.3433 1 5.48 234.2 71.9 14.4 5.9 0.4132 1.2 5.56 234.9 72.1 14.4 6.9 0.4831 1.4 5.65 235.7 72.4 14.4 7.9 0.5530 1.6 5.74 236.6 72.6 14.5 8.9 0.6129 1.8 5.83 237.6 72.9 14.6 9.9 0.6828 2 5.92 238.6 73.3 14.6 10.9 0.7527 2.2 6.01 239.8 73.6 14.7 11.9 0.8126 2.4 6.10 241.1 74.0 14.8 12.9 0.8825 2.6 6.19 242.4 74.4 14.8 13.9 0.9424 2.8 6.28 243.8 74.9 14.9 15.0 1.0023 3 6.37 245.3 75.3 15.0 16.0 1.0622 3.2 6.45 246.9 75.8 15.1 17.0 1.1221 3.4 6.54 248.5 76.3 15.2 18.0 1.1820 3.6 6.63 250.2 76.8 15.3 19.0 1.2419 3.8 6.72 252.0 77.4 15.4 20.0 1.3018 4 6.81 253.8 77.9 15.5 21.0 1.3517 4.2 6.90 255.7 78.5 15.6 22.0 1.4116 4.4 6.99 257.6 79.1 15.8 23.0 1.4615 4.6 7.08 259.6 79.7 15.9 24.1 1.5114 4.8 7.17 261.7 80.3 16.0 25.1 1.5713 5 7.26 263.8 81.0 16.1 26.1 1.6212 5.2 7.34 265.9 81.6 16.3 27.1 1.6711 5.4 7.43 268.1 82.3 16.4 28.1 1.7110 5.6 7.52 270.3 83.0 16.5 29.1 1.769 5.8 7.61 272.6 83.7 16.7 30.1 1.818 6 7.70 274.9 84.4 16.8 31.1 1.857 6.2 7.79 277.3 85.1 17.0 32.1 1.906 6.4 7.88 279.7 85.9 17.1 33.2 1.945 6.6 7.97 282.2 86.6 17.2 34.2 1.984 6.8 8.06 284.6 87.4 17.4 35.2 2.023 7 8.15 287.1 88.2 17.6 36.2 2.062 7.2 8.23 289.7 88.9 17.7 37.2 2.101 7.4 8.32 292.3 89.7 17.9 38.2 2.140 7.6 8.41 294.9 90.5 18.0 39.2 2.18
Serviceability Block to Block Connection Stability Analyses

38

39
6.0 SUMMARY
6.1 Overview
From 1996 to 1999, two full-scale GRS structures (Turner-Fairbank pier and Havana Yard piers
and abutment) and two production GRS abutments (Founders/Meadows and Black Hawk) were
constructed. The objective was to demonstrate that GRS abutments and piers with block facings
were viable alternatives to conventional bridge piers and abutments. A full-scale fabric
geotextile-reinforced soil bridge abutment and two GRS bridge piers (center and outer) with
block facing were constructed in the Havana Maintenance Yard (Photos 1 through 5 of Appendix
A and Figure 1). A surcharge load was applied to the abutment and outer pier (not the center
pier). The performance of the Havana Maintenance Yard abutment was good. Some time
between March and May of 1997 (4 to 5 months after the surcharge load was placed), excessive
and sudden movements of the top several layers of the outer pier structure and severe cracking of
the facing were noticed as depicted in Photo 5 to 7 of Appendix A. The toppling failure of the
upper four rows of the outer pier was deemed to be imminent. Therefore, it was decided to
remove the applied surcharge load, tear down the structures, and conduct forensic and stability
investigations. The objectives and findings of these investigations are given below.
6.2 Fulfilling 1st Study Objective
“Determine the in-situ conditions and characteristics of the structures materials after almost three
years in place.”
6.2.1 Backfill
The backfill material was a mixture of gravel (39.7%), sand (46.7%) and fine-grained soil
(13.6%) that meets material requirements for CDOT Class-1 backfill (Table 1). Twenty-eight
field tests were conducted to measure the backfill moisture content and density at the center and
edges at different depths inside the three structures (Table 2). The results of 27 tests suggest that
requirements for backfill compaction level (95%) were not met. The measured backfill
compaction level ranged from 74 % to 97.9 % with an average of 88.3 %. The backfill placed at
the edges (1 foot from the facing) received less compactive efforts (average of 86.6 %) than the
backfill at the center of the structure (89.9 %). In the upper three layers of the outer pier, the soil

40
below the concrete pad settled more than the rest of the pier area, possibly due to variable
applied compaction efforts and concentrated surcharge loads.
6.2.2 Geotextiles
The reinforcement buried in the Havana Yard Structures for three years was a woven
polypropylene geotextile designated as Amoco 2044 (Photo 11, 13 and 14 of Appendix A). All
collected geotextile sheets were in excellent condition, showing no obvious signs of geotextile
distress (e.g., tears or cuts). The survivability and durability of the exhumed geotextiles were
evaluated by comparing the measured wide-width tensile strength of the exhumed samples with
the strength of the fresh new geotextile samples. The findings were:
q The results of 128 wide-width tensile tests shown in Table 42 suggest that geotextile
exhumed strength were lower by 0 to 18%.
q Subjecting geotextiles to different stress levels from overlying materials and surcharge
loading did not contribute to the geosynthetic deterioration and loss of strength
q The low loss of geotextile strength measured in this study (up to 5.3 %) and results
reported in the literature indicated that the durability and creep of geotextile
reinforcements were not a problem.
q The small loss of geotextile strength was attributed primarily to construction damage.
q Construction method and technique has a great impact on the level of geosynthetic
deterioration and damage.
6.2.3 Block Facing
Different types of blocks were used in the construction of the three Havana Yard Structures
(Figures 3 to 5). There were few cracks visible in the external face of the abutment before the
dismantling began, but during dismantling, a fairly large percentage – as high as 50% – of the
blocks in some layers was broken. On most of the levels, most of the broken blocks were on the
side where the surcharge load was applied (Figure 1). There were no visible cracks in the
external face of the center pier (the pier that was not surcharge loaded) and no internally broken
blocks were found during the dismantling operations. The facing of the outer pier (see Photo 5
and 6) was severely damaged, as was observed in the cracking of the external face (Figure 6) and

41
broken internal sides of the blocks (Figures 11 to 13). The facing of the outer pier experienced
excessive movements, especially the upper four layers. This movement decreased with the depth
from the top of the pier (Figures 7 to 10). Additional descriptions of the movement and damage
of the pier and possible causes for this response are provided in the next section.
6.3 Fulfilling 2nd Study Objective
“Determine potential causes for the excessive deformations and cracking of the Havana Yard
outer pier structure.”
A geotextile layer was placed between block layers and the hollow concrete blocks were infilled
with uniform size gravel. This facing system derived its block-to-block connection capacity
through interface friction between blocks and reinforcements and between gravel and
reinforcements (there was no interlock with shear key or other form of mechanical connection).
Both the results of forensic investigation (Figure 10) and facing connections stability analyses
(Table 5) indicated that layers 25 to 38 of the outer pier failed to meet the serviceability block-to-
block connection requirements (i.e., relative displacement between block layers was larger than 4
mm). The pier response and causes for this response are summarized below for three zones of the
pier (See Figures 6 to 13 and Table 5).
q Upper zone of block layers (35 to 38): In this zone, no damage was noticed to the
external and internal sides of the blocks. Large relative displacement between block
layers of 27 mm, and significant vertical joint openings were noticed. Very large average
contact bearing pressure (422 kPa) was induced directly below the concrete pad (at top
of row 38, see Table 5). A sharp drop of vertical soil stresses occurred around the
concrete pad. The area around the concrete pad was small so the vertical forces acting on
the reinforced soil were small resulting in low reinforcement pullout resistance. Also,
around the concrete pad the vertical stresses on the blocks were very small, making the
friction-based block-to-block connection strength very small (see Table 5). For reasons
described above, the generated high lateral earth load under the concrete pad exceeded in-
service block/block connection capacity (maximum factor of safety less than 0.36 in
Table 5), and caused a soil bearing capacity problem, leading to excessive displacement

42
of blocks in this zone. The almost free (unrestrained) excessive relative displacement
between block layers (due to low connection strength) resulted in no damage to the
blocks.
q Middle zone of block layers 11 to 34: This zone moved to a lesser degree than the upper
zone but was heavily damaged (cracked and broken blocks). The relative displacement of
layers 25 through 34 was approximately 10 mm. On the average, smaller relative
displacements occurred for layers 11 to 25 (i.e., block outward displacements decreased
with depth, Figure 9). Typically, cracks on the external face were aligned with the joints
in the layers above and below the cracked blocks (Photo 5 to 7 of Appendix A). Many of
the blocks that appeared from the outside to be whole were broken on the interior sides.
In this zone, the friction-based connection strength between blocks was high because of
the higher normal loads from overlying blocks, and possibly from vertical loads
transferred to the blocks by drag forces from the reinforced soil mass. The higher
connection strength and placement of blocks in a running bond configuration restricted
the free expansion of the pier in this zone, causing severe damage to blocks. The
restraining caused the development of axial transverse tension forces in the blocks,
leading to vertical cracks in the blocks around the vertical joints. It seems that the facing
connection strength in this zone was stronger than the tensile strength of blocks. The
vertical loads transferred to the blocks by drag forces from the reinforced soil mass could
have contributed to the significant breaking of the interior sides of the blocks.
q Lower zone of block layers 1 to 10: In this zone, the intensity of block damage
diminished and the relative displacements between block layers were negligible (almost
zero). It was possible that the friction resistance between the bottom leveling pad and the
lower zone of the pier reduced the earth pressures supported by the facing in the lower
zone of the pier. The lower earth pressure on the facing and very high connection strength
between blocks (due to high vertical stresses acting on blocks) minimized block
movements and damage in this zone.

43
The comparatively low backfill compaction level led to a low strength (i.e., bearing capacity)
and stiffness of the reinforced soil mass (Figure 14), low reinforcement pullout resistance, higher
lateral earth pressures and facing connection loads, and non-uniform distribution of surcharge
loads over the pier area especially in the top zone. Therefore, the lower backfill compaction level
resulted in relatively more deformation to the pier.
The construc tion of the outer pier structure during the cold season and softening of the backfill
during the 1997 spring season could possibly have contributed to the movement of the pier in the
spring season. The softening occurred due to lower backfill compaction level and soil wetting
due to heavy rain and ice melting.
In summary, the reasons for the excessive deformation and cracking of the Havana Yard outer
pier are: high surcharge load applied uniformly to a limited surface area of a slender pier, low
backfill compaction level, weak facing connection strength and pullout resistance in the upper
zone of the pier, weak blocks, and seasonal changes.

44

45
7.0 RECOMMENDATIONS
GRS abutment and piers are viable alternatives to conventional methods used in bridge support.
Details for construction of GRS abutments and piers are available in several references (Elias
and Christopher, 1997; FHWA, 2000; and Abu-Hejleh et al., 2000 and 2001). Design and
construction of GRS abutments in highway projects have been successfully implemented and
monitoring results have shown excellent field performance. However, research is still needed to
develop rational design and construction guidelines for GRS piers and appropriate limitations
(e.g., base to height ratio). Consequently, future field implementation of GRS piers should still
be considered experimental and such structures should be carefully monitored. Limitations and
additional details for construction of GRS piers (and, if appropriate, other GRS structures)
learned from this study and from recently published literature (FHWA, 2000; Adams, 1997) are
furnished in this report. They are:
q The use of GRS piers is well-suited for remote locations, where specialized equipment or
concrete is unavailable or cannot be reached. The materials used to construct the pier are
commonly available. In emergency situations, a GRS pier can be constructed using small
construction equipment and put into service within a few days. The use of GRS piers may be
beneficial for temporary bridge structures, and bike or pedestrian bridges. Also, GRS piers
should be considered for aesthetic purposes when a massive look is needed. Although there
are many benefits from this modern approach to bridge pier design, it should not be used in a
scour environment, when it would not prove economical, or when loads are excessive. CDOT
engineers believe that the use of GRS piers may not be economical for many typical highway
practices when compared to the use of concrete piers.
q Closely spaced (0.2 m to 0.3 m), high-strength geosynthetic reinforcements and well-
compacted quality granular backfill form a strong composite reinforced soil mass. Based on
the limited results of full-scale GRS piers and recommendations provided in the literature,
design surcharge pressures ranging from 100 to 150 kPa are recommended for comparatively
large and slender GRS piers (e.g., having base width/height ratio of 0.7 – the Turner-
Fairbank structure to 0.33 – the Havana Yard Structure). Under these surcharge pressures,
creep and durability of geosynthetic materials have not been a problem in monitored full-

46
scale structures. Construction damage of the geosynthetic is not considered a problem in
GRS piers because fill material can be spread by manual labor (an approximately 5%
reduction in tensile strength from damage was measured in this study). For construction of
GRS structures using heavy equipment, construction damage may contribute to reduction in
geosynthetic tensile strength and should be minimized.
q Requirements for compaction of coarse-grained backfill should be enforced and well
controlled in the field. To achieve proper backfill compaction at the optimal moisture content
within the limited area of the pier, numerous compaction passes with light equipment should
be performed. For GRS piers, a backfill soil with a friction angle of at least 40 degrees is
highly recommended. If feasible, a maximum size crushed stone of 19 mm should be used
for a minimum distance of 0.3 m behind the facing blocks in order to facilitate fill
compaction behind blocks, provide internal drainage, and prevent migration of fines to the
wall facing. Alternatively, wrapping of geotextile behind the face could be implemented for
erosion control purposes.
q In the top 1.6 m of piers loaded with a high surcharge load, it is recommended to: 1) place
reinforcements with a wrapped-around procedure behind the facing, and 2) employ
mechanical connection between blocks and between blocks and reinforcements. Results of
this research and other studies suggest that the friction-based facing connection strength in
the lower zone of the pier is adequate.
q Consider measures and details to achieve a uniform distribution of surcharge load over the
entire pier surface area (e.g., use of flow fill in the top zone), or a trapezoidal distribution
where the highest pressure would occur at the center of the structure (e.g., plastic hinge joint
at the center of the concrete pad).
q Include measures to enhance the pullout resistance of reinforcements in the top layers near to
the sides of the pier (e.g., wrap reinforcements around heavy items, drive bars through
reinforcement into the backfill).

47
q Construction of the GRS structures during drier and warmer seasons is preferred. At least,
backfill temperature during construction should be maintained above freezing.
q Implement measures to prevent surface water run-off and ground water intrusion into the
reinforced soil mass.
q Use high quality, strong blocks meeting CDOT specifications.

48
REFERENCES
1. Abu-Hejleh, N., Outcalt, S., Wang, T., and Zornberg, J.G. (2000).“Performance of
Geosynthetic-Reinforced Structures supporting the Founders/Meadows Bridge and
Approaching Roadway Structure. Report 1: Design, Materials, Construction,
Instrumentation, and Preliminary Results.” Report No. CDOT-DTD-R-00-5, Colorado
Department of Transportation, Denver, Colorado.
2. Abu-Hejleh, N., Wang, T., and Zornberg, J.G. (2000).“Performance of Geosynthetic-
Reinforced Walls Supporting Bridge and Approaching Roadway Structures.”
ASCE/Geotechnical Special Publication No. 103, Advances in Transportation and
Geoenvironmental Systems Using Geosynthetics, Zornberg, J.G. and Christopher, B.R.
(Eds.), pp. 218-243.
3. Abu-Hejleh, N., Zornberg, J.G., and Wang, T. (2001). “Monitored Displacements of a
Unique Geosynthetic-Reinforced Walls Supporting Bridge and Approaching Roadway
Structures.” Presented at the 2001 TRB annual meeting.
4. Adams, M. (1997). “Performance of a prestrained geosynthetic reinforced soil bridge
pier.” Int. Symp. On Mechanically Stabilized Backfill, T.H. Wu, editor, A. A. Balkema,
Denver, USA, 35-53.
5. Bathurst, R.J., and Simac, M.R. (1997). “Design and Performance of the Facing Column
for Geosynthetic Reinforced Segmental Retaining Walls.” Int. Symp. On Mechanically
Stabilized Backfill, T.H. Wu, editor, A. A. Balkema, Denver, USA, 193-208.
6. Bell, J.R., and Barrett, R. (1995). “Survivability and Durability of Geotextiles Burried in
Glenwood Canyon Wall.” Transportation Research Record 1474, TRB, National
Research Council, Washington, D.C., pp. 55-63.

49
7. Buttry, K., McCullough, E., and Wetzel, R. (1996). “Temperature and Related Behavior
in Segmental Retaining Wall System.” Transportation Research Record # 1524, pp. 19-
23.
8. Elias, V. and Christopher, B.R. (1997). “Mechanically Stabilized Earth Walls and
Reinforced Soil Slopes, Design and Construction Guidelines.” FHWA Demo Project 82-
1, Washington DC, 367 p.
9. FHWA (2000). “GRS Bridge Piers and Abutments.” FHWA-RD-00-038. Sponsored by
Turner-Fairbank Highway Research Center.
10. U.S. Department of the Interior, Bureau of Reclamation (1998). “Earth Manual, Part I.”
Third Edition, Earth Sciences and Research Laboratory, Geotechnical Research,
Technical Service Center, Denver, Colorado.
11. Ketchart, K. and Wu, J.T.H. (1997). “Loading Tests of GRS Bridge Pier and Abutment in
Denver, Colorado.” Report No. CDOT-DTD-97-10, Colorado Department of
Transportation, Denver, Colorado.
12. Powell, B., and Mohney, J. (1994). “Durability of Geotextiles Used in Reinforcement of
Walls and Road Subgrade.” In Transportation Research Record 1439, TRB, National
Research Council, Washington, D.C., pp. 20-24.

50

51
APPENDIX A

APPENDIX A
Photographs taken before and during dismantling of structures and during testing
of geotextile sheets.

A-1
Photo 1. Demonstration Fabric Reinforced Structures at the Havana Maintenance
Yard.

A-2
Photo 2. Upper Portion of the Abutment Structure.

A-3
Photo 3. Lower Portion of the Abutment Structure. Note the negative batter. This
was done only on the east side of the abutment and only below the ground level.

A-4
Photo 4. The Center Pier Structure. Note the outward bow of the top several rows
of blocks.

A-5
Photo 5. The Outer Pier Structure.

A-6
Photo 6. Excessive Movements of the Top Rows of Blocks on the Outer Pier.
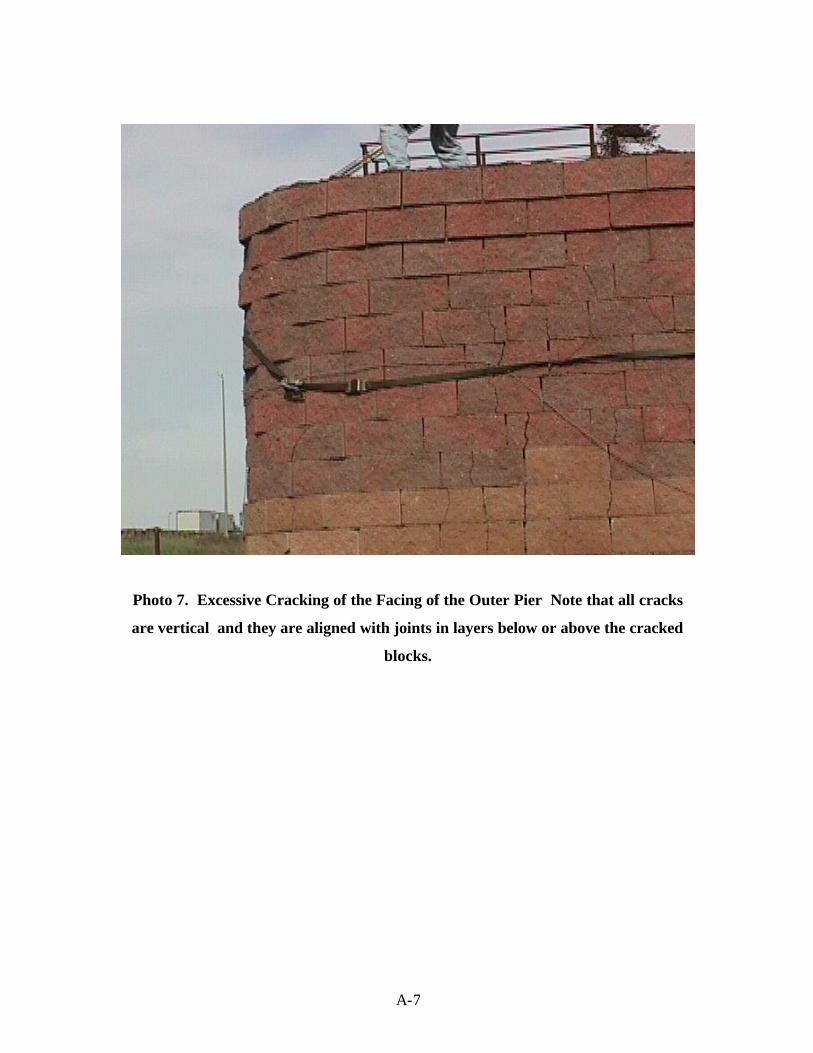
A-7
Photo 7. Excessive Cracking of the Facing of the Outer Pier Note that all cracks
are vertical and they are aligned with joints in layers below or above the cracked
blocks.

A-8
Photo 8. Cracks in the Lower Part of the Abutment.

A-9
Photo 9. Dismantling Operation of the Havana Mainetance Structures.
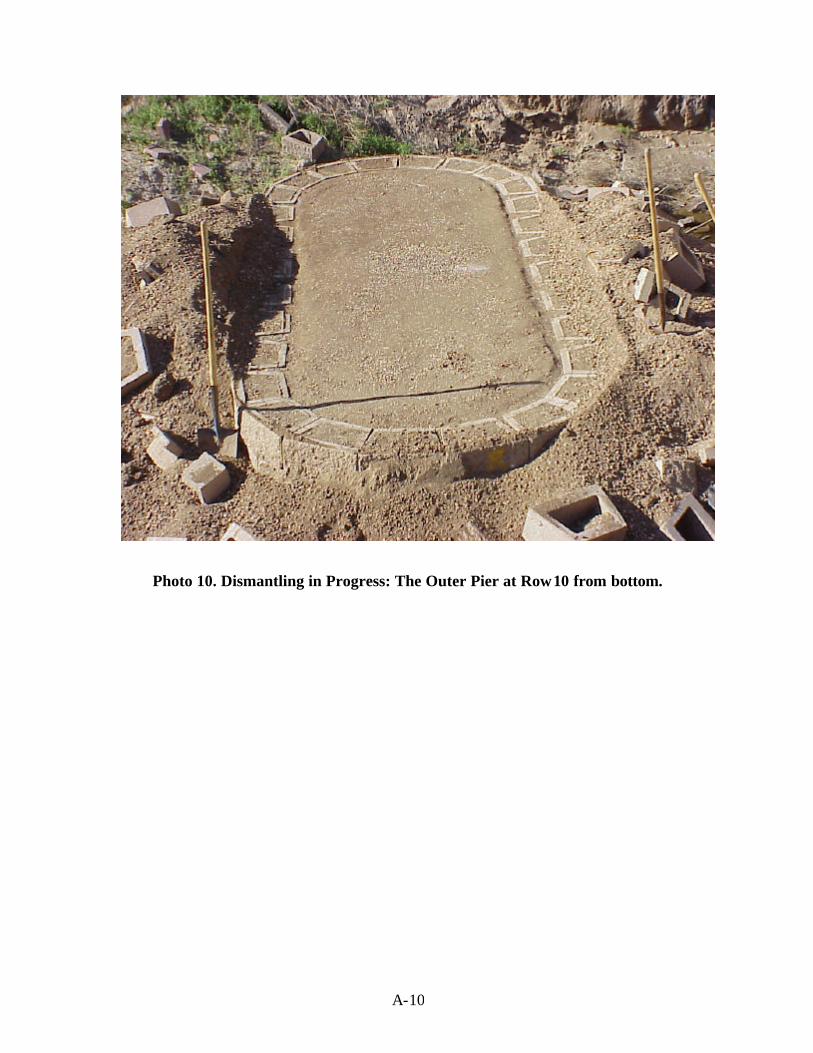
A-10
Photo 10. Dismantling in Progress: The Outer Pier at Row 10 from bottom.

A-11
Photo 11. Geotextile Sheet During Dismantling of the Inner Pier. No damage to any
of the fabric sheets was observed in any of the structures even at locations where the
fill had settled considerably.

A-12
Photo 12. A Vertical Crack in a Block from the Abutment Structure.

A-13
Photo 13. Retrieved Geotextile Sheets and Whole Blocks from the Structures.

A-14
Photo 14. Fabric Speciemns Ready for the Wide-Width Tensile Test (ASTM D
4595).

A-15
Photo 15. Mounting Fabric Specimen in The Wide-Width Tensile Test to Remove
any Slack.

A-16
Photo 16. A Fabric Specimen at the Failure Condition.

A-17
Photo 17. Wide-Width Tensile Test Results on Geotextile Sheets W17 and C20
(8 specimens of each sheet).