Embed Size (px)
Citation preview
Edelweiss Research is also available on www.edelresearch.com, Bloomberg EDEL <GO>, Thomson First Call, Reuters and Factset.
Edelweiss Securities Limited
ICICI Bank reported steady core operating profit for Q4FY17 (grew >11% QoQ), after 4 quarters of flattish growth. Slippages, though elevated (INR113bn), largely comprised 1 cement account (of INR54bn) excluding which slippages were within the guided range (>70% from watch-list). Slippages outside the watch-list also showed stabilising trend. With large part of recognition done, recovery/resolution would be critical going ahead, which has been lower than our expectation. Core performance was aided by better NIMs (benefitting from impressive average CASA ratio of >46% and higher collection from NPLs). Further, retail asset impressed tracking ~19% growth while retail fees improved clocking >15% YoY growth. With significant benefits likely to flow from formalisation of financial savings, subsidiaries could also see strong business tailwinds. Maintain ‘BUY’.
FY17, the year of recognition, resolution key Slippages were high at INR113bn, largely flowing from corporate/SME (>85% from
earlier watch-list, restructured book) segments, while retail slippages (INR4.4bn) were
on track. However, higher write-offs (INR54bn versus past 6 quarters’ run rate of
INR20bn) restricted GNPLs to INR425bn (up <12% QoQ). FY17 was the year of
recognition as reflected in potential stress (viz., restructured book, 5:25, SDR,
watchlist) which reduced from >INR500bn in FY16 to <INR260bn in FY17.
Consequently, qualitatively the bank expects FY18 slippages to be significantly lower
than FY17. On the other hand, given that provision coverage remains low (<55%), and
with the bank utilising entire contingency buffer of INR36bn and floating provision of
INR15bn during the year, the buffer to absorb additional provisions is limited which will
keep credit cost high. The key would be resolution/recovery, which has till date been
low. Hence, any positive development here could potentailly provide earnings upside.
Outlook and valuations: Strong franchise; maintain ‘BUY’ We believe these are challenging times as manifested in temporary lull in earnings.
However, one must not ignore ICICI Bank’s franchise strength, which will enable it to
deliver healthy normalised returns post the turbulent phase. We maintain ‘BUY/SO’
given: a) >30% of current price reflects stable value of subsidiaries (which could
significantly benefit from formalisation of financial savings); b) stable RoA/RoE
(2%/16%, despite higher credit cost); and c) strengthening franchise. The stock is
trading at 1.2x FY19E P/ABV. Our SoTP target price is pegged at INR362.
RESULT UPDATE
ICICI BANK Larger part of recognition behind; resolutions key
COMPANYNAME
COMPANYNAME
EDELWEISS 4D RATINGS
Absolute Rating BUY
Rating Relative to Sector Outperform
Risk Rating Relative to Sector Low
Sector Relative to Market Overweight
MARKET DATA (R: ICBK.BO, B: ICICIBC IN)
CMP : INR 273
Target Price : INR 362
52-week range (INR) : 298 / 213
Share in issue (mn) : 5,825.4
M cap (INR bn/USD mn) : 1,589 / 25,248
Avg. Daily Vol.BSE/NSE(‘000) : 17,873.0
SHARE HOLDING PATTERN (%)
Current Q3FY17 Q2FY17
Promoters *
- - -
MF's, FI's & BK’s 31.1 29.0 27.6
FII's 35.0 37.2 37.9
Others 33.8 33.9 34.5
* Promoters pledged shares (% of share in issue)
: NIL
PRICE PERFORMANCE (%)
Stock Nifty EW Banks and
Financial Services Index
1 month (4.9) 0.8 2.7
3 months (3.1) 6.5 9.1
12 months 23.4 20.2 35.3
Nilesh Parikh +91 22 4063 5470
Kunal Shah +91 22 4040 7579
Prakhar Agarwal +91 22 6620 3076
India Equity Research| Banking and Financial Services
May 3, 2017
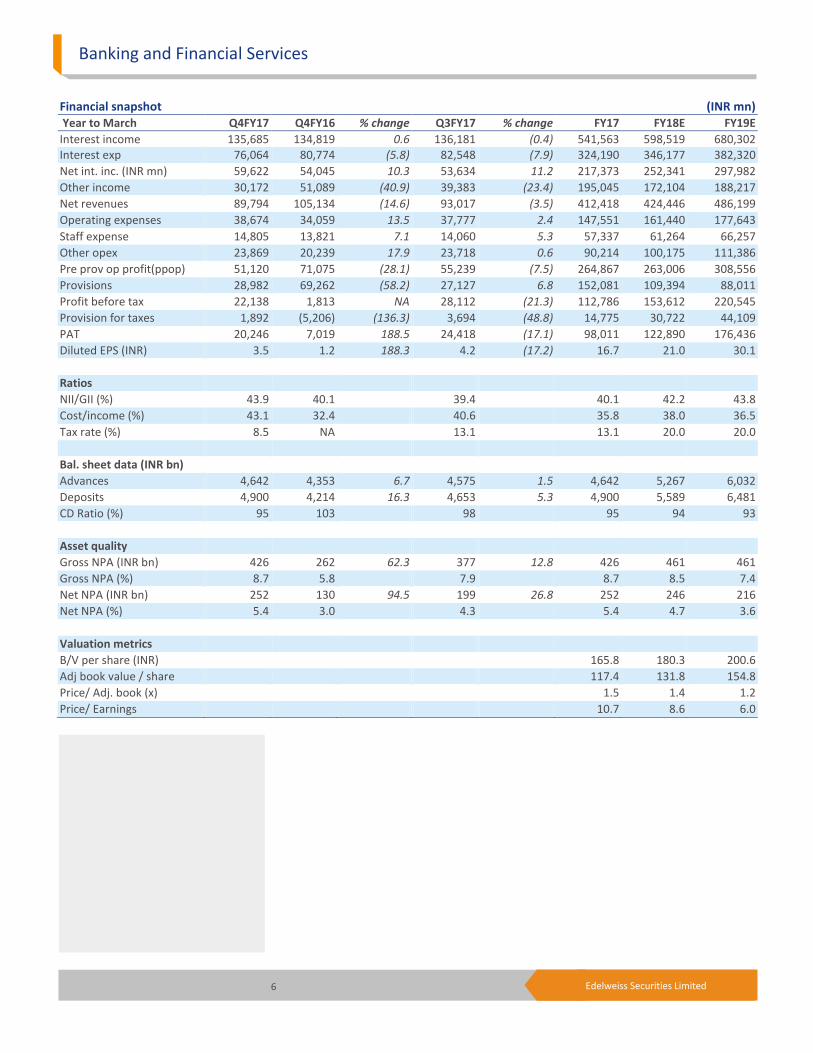
Financials (INR mn)
Year to March Q4FY17 Q4FY16 Growth % Q3FY17 Growth % FY17 FY18E FY19E
Net revenue 89,794 105,134 (14.6) 93,017 (3.5) 412,418 424,446 486,199
Net profit 20,246 7,019 188.5 24,418 (17.1) 98,011 122,890 176,436
Dil. EPS (INR) 3.5 1.2 188.3 4.2 (17.2) 16.7 21.0 30.1
Adj. BV (INR) 117.4 131.8 154.8
Price/ Adj book (x) 1.5 1.4 1.2
Price/ Earnings (x) 10.7 8.6 6.0
Banking and Financial Services
2 Edelweiss Securities Limited
Retail drives loan growth
Advances came in at INR4.6tn, up ~7% YoY, driven by above-average loan growth in
domestic loan book (up ~14% YoY), whereas international book continued to decline (down
~20% YoY in INR terms and ~18% YoY in USD terms). Maintaining the trend, within domestic
loan book, retail advances continued to grow at healthy ~19% YoY, taking proportion of
retail advances to ~52% (<40% in FY13). Within overall retail book, home loans jumped
~17% YoY, while both personal loans and credit cards clocked >36% YoY growth each, taking
proportion of unsecured book within retail to ~9.0% from ~6.6% as at FY15. Meanwhile,
focus remained on selective lending to higher-rated corporates, with the domestic
corporate book rising ~6% YoY. Going forward, management is targeting domestic loan
growth of 15-16%, driven by 18-20% growth in the retail portfolio and 15-20% growth in the
SME book, with domestic corporate book expected to grow in the 5-7% range. The bank’s
overseas book is likely to be stable in USD terms going ahead.
NIMs benefit from strong franchise & higher collection from NPLs
Margins witnessed sharp improvement during the quarter, with global NIMs rising >40bps
QoQ to 3.57%. Both domestic and and overseas NIMs witnessed expansion during the
quarter, coming in at 3.96% (up >40bps QoQ) and 1.01% (up >15bps QoQ), respectively.
While the rise in margins was partly attributable to interest collection from non-performing
assets, sharp decline in funding costs (down >20bps QoQ to 5.15%) supported the expansion
in NIMs. The bank’s deposit franchise continues to shine, with CASA ratio crossing the 50%
mark (50.4% versus 45.8% in FY16) and average CASA ratio touching ~46.5% (versus 40.5%
in Q4FY16). On strong liability franchise, management is targeting NIMs of >3% for FY18.
Core fee income improves, sustenance key
For the second consequtive quarter, core fee income logged above 10% growth to
INR24.5bn (up ~10.5% YoY, as against average run-rate of ~6% in past 6 quarters). Growth
was granular in nature and driven by the retail segment, with retail fees witnessing >15%
YoY growth on strong traction in third-party distribution, forex and credit card fees. Going
forward, management expects this trend to sustain, with retail fees continuing to be the key
growth driver.
Other highlights
With respect to divergence with the RBI directive: there was divergence in few accounts
totaling INR51bn (84% was already in drilldown list and 7% was in restructured
portfolio), which required provision of INR10.7bn (INR7bn post tax) to be made by the
bank. Currently, there is no divergence with RBI as all of the accounts have been
classified and provided for as per RBI directive.
The bank is also implementing changes in management outside SDR for loans of
INR51bn (included in the drilldown list) which may potentially provide some resolution.
Sale to ARCs during the quarter comprised INR0.23bn of NPLs and INR5.83bn in SMA-II
accounts.
Slippage of INR53.78bn was due to one account in cement sector was included in the
drill down exposure. The M&A transaction has been has been announced in respect of
this company. The transaction has received most of the requisite approved from CCI,
creditors, shareholders etc and is awaiting last-mile approvals for transfer of 18 mines
across 4 states which might take maximum 2 quarters to conclude. The Bank has
ICICI Bank
3 Edelweiss Securities Limited
classified the account as NPLs and expects part of the loan (~50% which is attached to
that cement asset) to be upgraded on conclusion of the transaction.
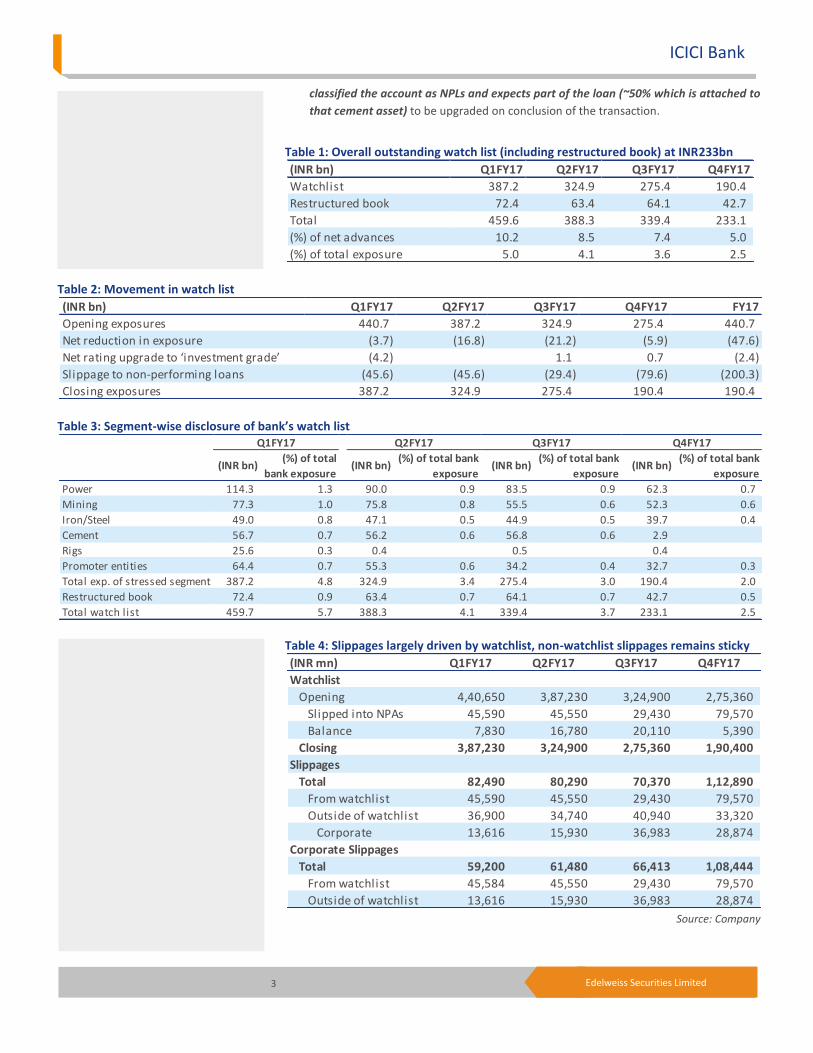
Table 1: Overall outstanding watch list (including restructured book) at INR233bn
Table 2: Movement in watch list
Table 3: Segment-wise disclosure of bank’s watch list
Table 4: Slippages largely driven by watchlist, non-watchlist slippages remains sticky
Source: Company
(INR bn) Q1FY17 Q2FY17 Q3FY17 Q4FY17
Watchlist 387.2 324.9 275.4 190.4
Restructured book 72.4 63.4 64.1 42.7
Total 459.6 388.3 339.4 233.1
(%) of net advances 10.2 8.5 7.4 5.0
(%) of total exposure 5.0 4.1 3.6 2.5
(INR bn) Q1FY17 Q2FY17 Q3FY17 Q4FY17 FY17
Opening exposures 440.7 387.2 324.9 275.4 440.7
Net reduction in exposure (3.7) (16.8) (21.2) (5.9) (47.6)
Net rating upgrade to ‘investment grade’ (4.2) 1.1 0.7 (2.4)
Slippage to non-performing loans (45.6) (45.6) (29.4) (79.6) (200.3)
Closing exposures 387.2 324.9 275.4 190.4 190.4
(INR bn)(%) of total
bank exposure(INR bn)
(%) of total bank
exposure(INR bn)
(%) of total bank
exposure(INR bn)
(%) of total bank
exposure
Power 114.3 1.3 90.0 0.9 83.5 0.9 62.3 0.7
Mining 77.3 1.0 75.8 0.8 55.5 0.6 52.3 0.6
Iron/Steel 49.0 0.8 47.1 0.5 44.9 0.5 39.7 0.4
Cement 56.7 0.7 56.2 0.6 56.8 0.6 2.9
Rigs 25.6 0.3 0.4 0.5 0.4
Promoter entities 64.4 0.7 55.3 0.6 34.2 0.4 32.7 0.3
Total exp. of stressed segment 387.2 4.8 324.9 3.4 275.4 3.0 190.4 2.0
Restructured book 72.4 0.9 63.4 0.7 64.1 0.7 42.7 0.5
Total watch list 459.7 5.7 388.3 4.1 339.4 3.7 233.1 2.5
Q4FY17Q3FY17Q2FY17Q1FY17
(INR mn) Q1FY17 Q2FY17 Q3FY17 Q4FY17
Watchlist
Opening 4,40,650 3,87,230 3,24,900 2,75,360
Slipped into NPAs 45,590 45,550 29,430 79,570
Balance 7,830 16,780 20,110 5,390
Closing 3,87,230 3,24,900 2,75,360 1,90,400
Slippages
Total 82,490 80,290 70,370 1,12,890
From watchlist 45,590 45,550 29,430 79,570
Outside of watchlist 36,900 34,740 40,940 33,320
Corporate 13,616 15,930 36,983 28,874
Corporate Slippages
Total 59,200 61,480 66,413 1,08,444
From watchlist 45,584 45,550 29,430 79,570
Outside of watchlist 13,616 15,930 36,983 28,874
Banking and Financial Services
4 Edelweiss Securities Limited
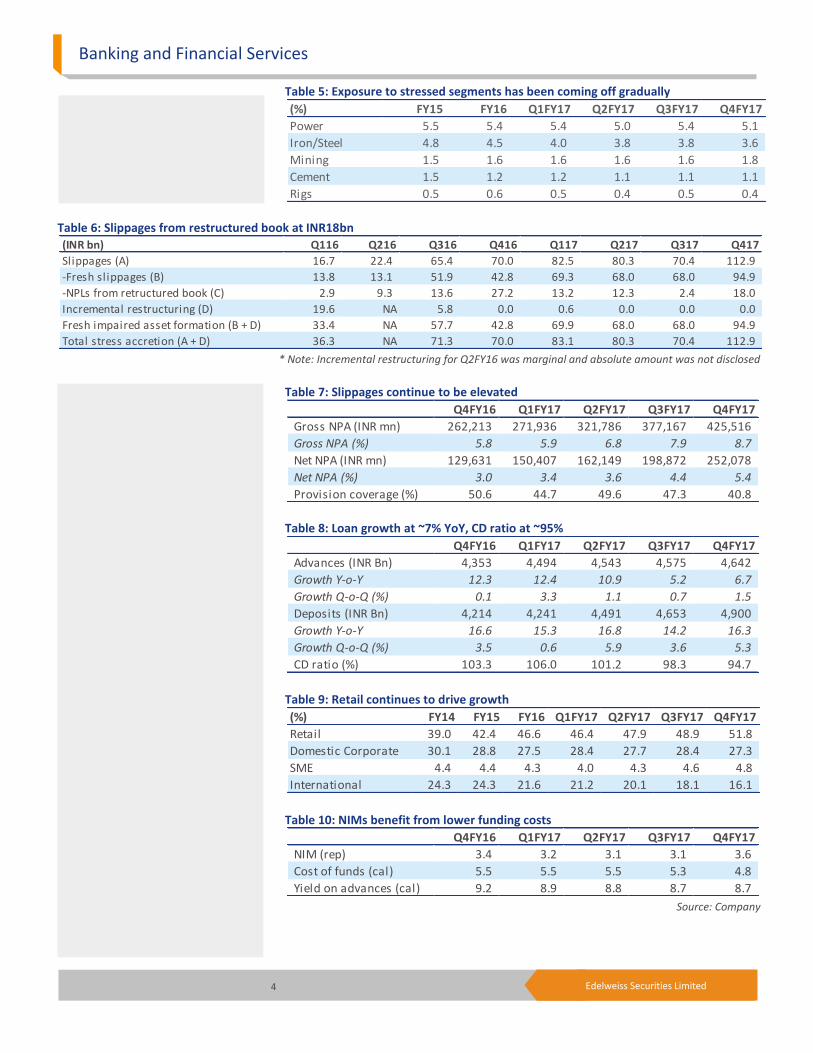
Table 5: Exposure to stressed segments has been coming off gradually
Table 6: Slippages from restructured book at INR18bn
* Note: Incremental restructuring for Q2FY16 was marginal and absolute amount was not disclosed
Table 7: Slippages continue to be elevated
Table 8: Loan growth at ~7% YoY, CD ratio at ~95%
Table 9: Retail continues to drive growth
Table 10: NIMs benefit from lower funding costs
Source: Company
(%) FY15 FY16 Q1FY17 Q2FY17 Q3FY17 Q4FY17
Power 5.5 5.4 5.4 5.0 5.4 5.1
Iron/Steel 4.8 4.5 4.0 3.8 3.8 3.6
Mining 1.5 1.6 1.6 1.6 1.6 1.8
Cement 1.5 1.2 1.2 1.1 1.1 1.1
Rigs 0.5 0.6 0.5 0.4 0.5 0.4
(INR bn) Q116 Q216 Q316 Q416 Q117 Q217 Q317 Q417
Slippages (A) 16.7 22.4 65.4 70.0 82.5 80.3 70.4 112.9
-Fresh slippages (B) 13.8 13.1 51.9 42.8 69.3 68.0 68.0 94.9
-NPLs from retructured book (C) 2.9 9.3 13.6 27.2 13.2 12.3 2.4 18.0
Incremental restructuring (D) 19.6 NA 5.8 0.0 0.6 0.0 0.0 0.0
Fresh impaired asset formation (B + D) 33.4 NA 57.7 42.8 69.9 68.0 68.0 94.9
Total stress accretion (A + D) 36.3 NA 71.3 70.0 83.1 80.3 70.4 112.9
Q4FY16 Q1FY17 Q2FY17 Q3FY17 Q4FY17
Gross NPA (INR mn) 262,213 271,936 321,786 377,167 425,516
Gross NPA (%) 5.8 5.9 6.8 7.9 8.7
Net NPA (INR mn) 129,631 150,407 162,149 198,872 252,078
Net NPA (%) 3.0 3.4 3.6 4.4 5.4
Provision coverage (%) 50.6 44.7 49.6 47.3 40.8
Q4FY16 Q1FY17 Q2FY17 Q3FY17 Q4FY17
Advances (INR Bn) 4,353 4,494 4,543 4,575 4,642
Growth Y-o-Y 12.3 12.4 10.9 5.2 6.7
Growth Q-o-Q (%) 0.1 3.3 1.1 0.7 1.5
Deposits (INR Bn) 4,214 4,241 4,491 4,653 4,900
Growth Y-o-Y 16.6 15.3 16.8 14.2 16.3
Growth Q-o-Q (%) 3.5 0.6 5.9 3.6 5.3
CD ratio (%) 103.3 106.0 101.2 98.3 94.7
(%) FY14 FY15 FY16 Q1FY17 Q2FY17 Q3FY17 Q4FY17
Retail 39.0 42.4 46.6 46.4 47.9 48.9 51.8
Domestic Corporate 30.1 28.8 27.5 28.4 27.7 28.4 27.3
SME 4.4 4.4 4.3 4.0 4.3 4.6 4.8
International 24.3 24.3 21.6 21.2 20.1 18.1 16.1
Q4FY16 Q1FY17 Q2FY17 Q3FY17 Q4FY17
NIM (rep) 3.4 3.2 3.1 3.1 3.6
Cost of funds (cal) 5.5 5.5 5.5 5.3 4.8
Yield on advances (cal) 9.2 8.9 8.8 8.7 8.7
ICICI Bank
5 Edelweiss Securities Limited
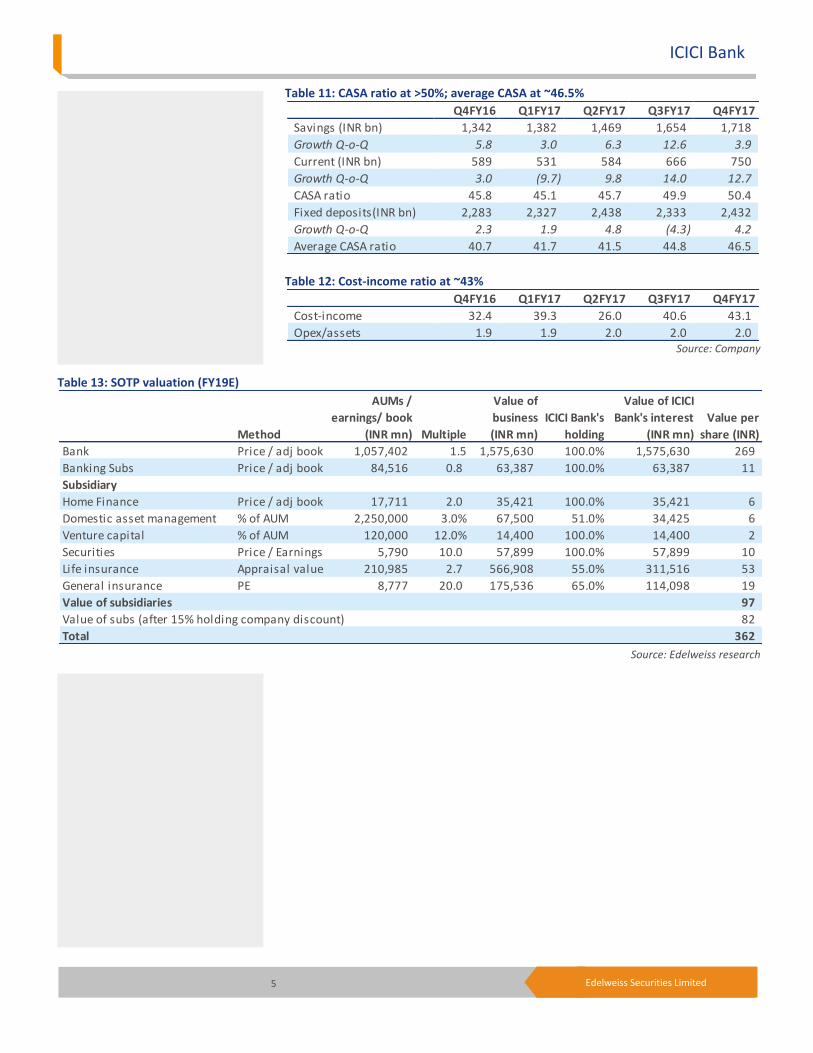
Table 11: CASA ratio at >50%; average CASA at ~46.5%
Table 12: Cost-income ratio at ~43%
Source: Company
Table 13: SOTP valuation (FY19E)
Source: Edelweiss research
Q4FY16 Q1FY17 Q2FY17 Q3FY17 Q4FY17
Savings (INR bn) 1,342 1,382 1,469 1,654 1,718
Growth Q-o-Q 5.8 3.0 6.3 12.6 3.9
Current (INR bn) 589 531 584 666 750
Growth Q-o-Q 3.0 (9.7) 9.8 14.0 12.7
CASA ratio 45.8 45.1 45.7 49.9 50.4
Fixed deposits(INR bn) 2,283 2,327 2,438 2,333 2,432
Growth Q-o-Q 2.3 1.9 4.8 (4.3) 4.2
Average CASA ratio 40.7 41.7 41.5 44.8 46.5
Q4FY16 Q1FY17 Q2FY17 Q3FY17 Q4FY17
Cost-income 32.4 39.3 26.0 40.6 43.1
Opex/assets 1.9 1.9 2.0 2.0 2.0
Method
AUMs /
earnings/ book
(INR mn) Multiple
Value of
business
(INR mn)
ICICI Bank's
holding
Value of ICICI
Bank's interest
(INR mn)
Value per
share (INR)
Bank Price / adj book 1,057,402 1.5 1,575,630 100.0% 1,575,630 269
Banking Subs Price / adj book 84,516 0.8 63,387 100.0% 63,387 11
Subsidiary
Home Finance Price / adj book 17,711 2.0 35,421 100.0% 35,421 6
Domestic asset management % of AUM 2,250,000 3.0% 67,500 51.0% 34,425 6
Venture capital % of AUM 120,000 12.0% 14,400 100.0% 14,400 2
Securities Price / Earnings 5,790 10.0 57,899 100.0% 57,899 10
Life insurance Appraisal value 210,985 2.7 566,908 55.0% 311,516 53
General insurance PE 8,777 20.0 175,536 65.0% 114,098 19
Value of subsidiaries 97
Value of subs (after 15% holding company discount) 82
Total 362
Banking and Financial Services
6 Edelweiss Securities Limited
Financial snapshot (INR mn) Year to March Q4FY17 Q4FY16 % change Q3FY17 % change FY17 FY18E FY19E
Interest income 135,685 134,819 0.6 136,181 (0.4) 541,563 598,519 680,302 Interest exp 76,064 80,774 (5.8) 82,548 (7.9) 324,190 346,177 382,320
Net int. inc. (INR mn) 59,622 54,045 10.3 53,634 11.2 217,373 252,341 297,982
Other income 30,172 51,089 (40.9) 39,383 (23.4) 195,045 172,104 188,217
Net revenues 89,794 105,134 (14.6) 93,017 (3.5) 412,418 424,446 486,199
Operating expenses 38,674 34,059 13.5 37,777 2.4 147,551 161,440 177,643
Staff expense 14,805 13,821 7.1 14,060 5.3 57,337 61,264 66,257
Other opex 23,869 20,239 17.9 23,718 0.6 90,214 100,175 111,386
Pre prov op profit(ppop) 51,120 71,075 (28.1) 55,239 (7.5) 264,867 263,006 308,556
Provisions 28,982 69,262 (58.2) 27,127 6.8 152,081 109,394 88,011
Profit before tax 22,138 1,813 NA 28,112 (21.3) 112,786 153,612 220,545
Provision for taxes 1,892 (5,206) (136.3) 3,694 (48.8) 14,775 30,722 44,109
PAT 20,246 7,019 188.5 24,418 (17.1) 98,011 122,890 176,436
Diluted EPS (INR) 3.5 1.2 188.3 4.2 (17.2) 16.7 21.0 30.1
Ratios
NII/GII (%) 43.9 40.1 39.4 40.1 42.2 43.8
Cost/income (%) 43.1 32.4 40.6 35.8 38.0 36.5
Tax rate (%) 8.5 NA 13.1 13.1 20.0 20.0
Bal. sheet data (INR bn)
Advances 4,642 4,353 6.7 4,575 1.5 4,642 5,267 6,032
Deposits 4,900 4,214 16.3 4,653 5.3 4,900 5,589 6,481
CD Ratio (%) 95 103 98 95 94 93
Asset quality
Gross NPA (INR bn) 426 262 62.3 377 12.8 426 461 461
Gross NPA (%) 8.7 5.8 7.9 8.7 8.5 7.4
Net NPA (INR bn) 252 130 94.5 199 26.8 252 246 216
Net NPA (%) 5.4 3.0 4.3 5.4 4.7 3.6
Valuation metrics
B/V per share (INR) 165.8 180.3 200.6
Adj book value / share 117.4 131.8 154.8
Price/ Adj. book (x) 1.5 1.4 1.2
Price/ Earnings 10.7 8.6 6.0
ICICI Bank
7 Edelweiss Securities Limited
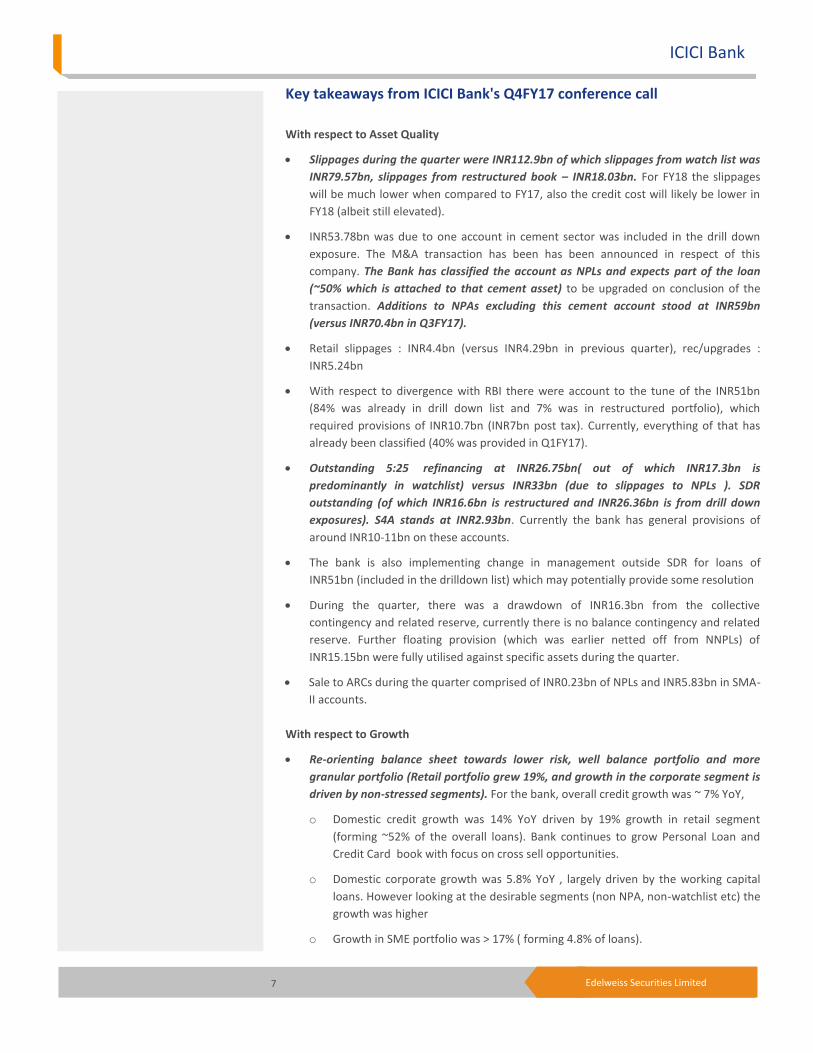
Key takeaways from ICICI Bank's Q4FY17 conference call
With respect to Asset Quality
Slippages during the quarter were INR112.9bn of which slippages from watch list was
INR79.57bn, slippages from restructured book – INR18.03bn. For FY18 the slippages
will be much lower when compared to FY17, also the credit cost will likely be lower in
FY18 (albeit still elevated).
INR53.78bn was due to one account in cement sector was included in the drill down
exposure. The M&A transaction has been has been announced in respect of this
company. The Bank has classified the account as NPLs and expects part of the loan
(~50% which is attached to that cement asset) to be upgraded on conclusion of the
transaction. Additions to NPAs excluding this cement account stood at INR59bn
(versus INR70.4bn in Q3FY17).
Retail slippages : INR4.4bn (versus INR4.29bn in previous quarter), rec/upgrades :
INR5.24bn
With respect to divergence with RBI there were account to the tune of the INR51bn
(84% was already in drill down list and 7% was in restructured portfolio), which
required provisions of INR10.7bn (INR7bn post tax). Currently, everything of that has
already been classified (40% was provided in Q1FY17).
Outstanding 5:25 refinancing at INR26.75bn( out of which INR17.3bn is
predominantly in watchlist) versus INR33bn (due to slippages to NPLs ). SDR
outstanding (of which INR16.6bn is restructured and INR26.36bn is from drill down
exposures). S4A stands at INR2.93bn. Currently the bank has general provisions of
around INR10-11bn on these accounts.
The bank is also implementing change in management outside SDR for loans of
INR51bn (included in the drilldown list) which may potentially provide some resolution
During the quarter, there was a drawdown of INR16.3bn from the collective
contingency and related reserve, currently there is no balance contingency and related
reserve. Further floating provision (which was earlier netted off from NNPLs) of
INR15.15bn were fully utilised against specific assets during the quarter.
Sale to ARCs during the quarter comprised of INR0.23bn of NPLs and INR5.83bn in SMA-
II accounts.
With respect to Growth
Re-orienting balance sheet towards lower risk, well balance portfolio and more
granular portfolio (Retail portfolio grew 19%, and growth in the corporate segment is
driven by non-stressed segments). For the bank, overall credit growth was ~ 7% YoY,
o Domestic credit growth was 14% YoY driven by 19% growth in retail segment
(forming ~52% of the overall loans). Bank continues to grow Personal Loan and
Credit Card book with focus on cross sell opportunities.
o Domestic corporate growth was 5.8% YoY , largely driven by the working capital
loans. However looking at the desirable segments (non NPA, non-watchlist etc) the
growth was higher
o Growth in SME portfolio was > 17% ( forming 4.8% of loans).
Banking and Financial Services
8 Edelweiss Securities Limited
o International book registered-de-growth of 20% YoY ( on ruppee basis) and 18%
(on USD basis) following .
Going in FY18, bank expects domestic loan growth of 15-16% driven by 18-20% retail
segment growth. The growth in domestic corporate growth will likely be in 5-7%
range with SME growth of 15-20%. The overseas book will likely be stable in USD
terms
Domestic NIMs at 3.96% , International NIMs at 1.01% (0.83% in Q2FY17) . The NIMs
during the quarter was supported by a) collections from loans that were non-
performing and b) interest on income tax refund, which was further supported by lower
funding cost given string traction in average CASA balances. Management aims to
maintain >3% for full year FY18.
Growth in fee income was better mid-teen growth. Fee income driven by retail
segment fees (up > 25% YoY) largely driven by a) third party distribution fees b) better
forex fees and c) better credit card fees etc. The growth seen in fee income was more
granular with no major one-time component. The management aims to maintains the
traction seen during the quarter
The CASA ratio was 50.4% (versus 49.9% at Q3FY17). The average CASA ratio was 46.5%
in Q4FY17 ( versus ~45% in previous quarter)
No of mobile banking transtaction doubled, value increased by 168%
ICICI Bank
9 Edelweiss Securities Limited
Key takeaways from ICICI Bank's Q3FY17 conference call
With respect to Asset Quality
Slippages during the quarter were INR70.37bn of which slippages from watch list was
INR29.43bn, slippages from restructured book – INR2.39bn ,and devolvement of non-
fund based NPLs– INR17.99bn. NPA additions will likely continue to be elevated over
next couple of quarters.
No particular pattern in the slippages outside of watch-list and restructured book.
These are more specific cases not relating to any particular sector etc.
Retail slippages : INR4.29bn (normal slippages), rec/upgrades : INR4.34bn
Outstanding 5:25 refinancing at INR33bn ( out of which INR24bn is predominantly in
watchlist). SDR outstanding INR34bn (of which INR28bn is mix of restructured , NPL
and drill down exposures). There are till now no cases under S4A. During the quarter
new 5:25 additions was ~INR6bn and new SDR implementation during the quarter was
~INR5bn.
During the quarter, there was a drawdown of INR5.3bn from the collective contingency
and related reserve. Outstanding floating provisions stands at ~INR15.15bn.
There was sale to ARCs of INR0.87bn, net investment in security receipts are
INR28.11bn.
Non-fund based exposure to restructured asset is closer to ~INR20bn
Bank utilised RBI dispensation during the quarter, however the quantum was lower at
INR1bn in overall scheme of things.
With respect to Growth
Re-orienting balance sheet towards lower risk, well balance portfolio and more
granular portfolio (Retail portfolio grew 18%, and growth in the corporate segment is
driven by non-stressed segments which grew in mid teen).
For the bank, overall credit growth was ~ 5% YoY, following redemption of USD870mn
of FCNR linked loans which matured in overseas book in Q3FY17.
o Domestic credit growth was 12% YoY driven by 18% growth in retail segment
(~18% of the overall loans). Bank continues to grow Personal Loan and Credit
Card book with focus on cross sell opportunities.
o Domestic corporate growth was 4% YoY , largely driven by the working capital
loans. However looking at the desirable segments (non NPA, non-watchlist etc) the
growth was in mid-teens
o Growth in SME portfolio was 6.6% ( forming 4.6% of loans).- growth muted due to
higher repayments during the quarter.
o International book registered-de-growth of 16% YoY ( on ruppee basis) and 18%
(on USD basis) following . redemption of USD870 mn of FCNR linked loans which
matured in overseas book in Q3FY17.
Domestic NIMs at 3.51% , International NIMs at 0.83% (1.685% in Q2FY17, impacted by
higher interest income reversal during the quarter) . Lower funding cost has helped
Banking and Financial Services
10 Edelweiss Securities Limited
bank more than offset the impact of lower lending rates (following lower rates and
higher interest income reversal) .
Growth in fee income was better > 10% YoY ( lower single digit runrate over H1FY17).
Fee income driven by retail segment fees (up > 18% YoY) largely driven by a) third
party distribution fees b) better forex fees and c) better credit card fees etc. The
growth seen in fee income was more granular with no major one-time component. The
management aims to maintains the traction seen during the quarter
The CASA momentum got a leg up from demonetisation (average CASA growth of >
29% taking average CASA ratio to ~45%). During the quarter there was redemption of
USD1.75bn FCNR-B deposits.
Bank envisage to continue to make the investment to strengthen the franchise.
Other highlights
INR4.46bn is the dividend from subsidiary during the quarter.
Employee addition during the 9mFY17 at 6803 taking total employee base at 80899.
PCR (incl. technical write-off and floating provisions) – 57.1%
Of the domestic book – 20% is linked to MCLR. Of the overall domestic book 76% is
floating rate linked book.
Bank has not been accruing income on SDR cases for the past few quarters , so there
are no one off impact due to this in this particular quarter.
Within the home loan portfolio, around 17% is the LAP proportion
Within the home finance business there was a mid-sized real estate exposure which
slipped into NPLs, thus the GNPls rise.
For Life insurance business New business Margins (NBMs) for 9mFY17 was 9.4% ,
versus 8% in FY16 and 5.7% in FY15 (this was largely due to rise in proportion of non-
par products from 1.6% as at FY15 to 2.7% as at FY16 and 3.9% as at 9mFY17).
ICICI Bank
11 Edelweiss Securities Limited
Company Description
Incorporated in 1994, ICICI Bank is India’s second largest bank and the largest among private
banks with total assets of about ~INR7.7tn as of Q4FY17. The bank’s focus is on retail
lending with retail financing representing ~52% of total loans and advances while
International and corporate can be the new growth drivers when environment improves.
The bank holds near market leadership in almost all its businesses including mortgages, auto
loans, commercial vehicle loans, life insurance, general insurance, and asset management.
Its subsidiaries ICICI venture funds, Pru ICICI AMC, ICICI Securities, ICICI Prudential, and ICICI
Lombard are amongst the leading companies in their respective fields.
Investment Theme
We believe these are challenging times as manifested in temporary lull in earnings.
However, one must not ignore ICICI Bank’s franchise strength, which will enable it to deliver
healthy normalised returns post the turbulent phase. We maintain ‘BUY/SO’ given: a) >30%
of current price reflects stable value of subsidiaries (which could significantly benefit from
formalisation of financial savings); b) stable RoA/RoE (2%/16%, despite higher credit cost);
and c) strengthening franchise. The stock is trading at 1.2x FY19E P/ABV. Our SoTP target
price is pegged at INR362.
Key Risks
With banks getting aggressive on retail side maintaining retail traction may turn out to
be a challenge.
Deterioration of macro environment can result in higher restructuring and slow down
business growth.
12 Edelweiss Securities Limited
Banking and Financial Services
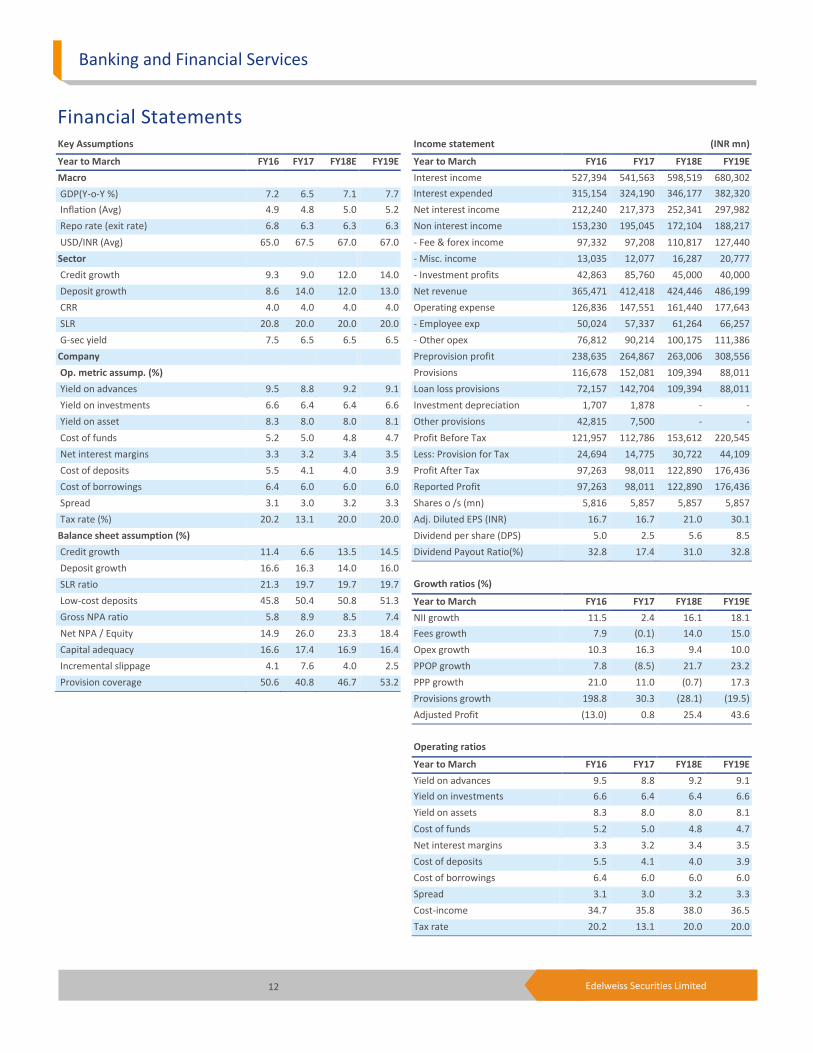
Financial Statements
Income statement (INR mn)
Year to March FY16 FY17 FY18E FY19E
Interest income 527,394 541,563 598,519 680,302
Interest expended 315,154 324,190 346,177 382,320
Net interest income 212,240 217,373 252,341 297,982
Non interest income 153,230 195,045 172,104 188,217
- Fee & forex income 97,332 97,208 110,817 127,440
- Misc. income 13,035 12,077 16,287 20,777
- Investment profits 42,863 85,760 45,000 40,000
Net revenue 365,471 412,418 424,446 486,199
Operating expense 126,836 147,551 161,440 177,643
- Employee exp 50,024 57,337 61,264 66,257
- Other opex 76,812 90,214 100,175 111,386
Preprovision profit 238,635 264,867 263,006 308,556
Provisions 116,678 152,081 109,394 88,011
Loan loss provisions 72,157 142,704 109,394 88,011
Investment depreciation 1,707 1,878 - -
Other provisions 42,815 7,500 - -
Profit Before Tax 121,957 112,786 153,612 220,545
Less: Provision for Tax 24,694 14,775 30,722 44,109
Profit After Tax 97,263 98,011 122,890 176,436
Reported Profit 97,263 98,011 122,890 176,436
Shares o /s (mn) 5,816 5,857 5,857 5,857
Adj. Diluted EPS (INR) 16.7 16.7 21.0 30.1
Dividend per share (DPS) 5.0 2.5 5.6 8.5
Dividend Payout Ratio(%) 32.8 17.4 31.0 32.8
Growth ratios (%)
Year to March FY16 FY17 FY18E FY19E
NII growth 11.5 2.4 16.1 18.1
Fees growth 7.9 (0.1) 14.0 15.0
Opex growth 10.3 16.3 9.4 10.0
PPOP growth 7.8 (8.5) 21.7 23.2
PPP growth 21.0 11.0 (0.7) 17.3
Provisions growth 198.8 30.3 (28.1) (19.5)
Adjusted Profit (13.0) 0.8 25.4 43.6
Operating ratios
Year to March FY16 FY17 FY18E FY19E
Yield on advances 9.5 8.8 9.2 9.1
Yield on investments 6.6 6.4 6.4 6.6
Yield on assets 8.3 8.0 8.0 8.1
Cost of funds 5.2 5.0 4.8 4.7
Net interest margins 3.3 3.2 3.4 3.5
Cost of deposits 5.5 4.1 4.0 3.9
Cost of borrowings 6.4 6.0 6.0 6.0
Spread 3.1 3.0 3.2 3.3
Cost-income 34.7 35.8 38.0 36.5
Tax rate 20.2 13.1 20.0 20.0
Key Assumptions
Year to March FY16 FY17 FY18E FY19E
Macro
GDP(Y-o-Y %) 7.2 6.5 7.1 7.7
Inflation (Avg) 4.9 4.8 5.0 5.2
Repo rate (exit rate) 6.8 6.3 6.3 6.3
USD/INR (Avg) 65.0 67.5 67.0 67.0
Sector
Credit growth 9.3 9.0 12.0 14.0
Deposit growth 8.6 14.0 12.0 13.0
CRR 4.0 4.0 4.0 4.0
SLR 20.8 20.0 20.0 20.0
G-sec yield 7.5 6.5 6.5 6.5
Company
Op. metric assump. (%)
Yield on advances 9.5 8.8 9.2 9.1
Yield on investments 6.6 6.4 6.4 6.6
Yield on asset 8.3 8.0 8.0 8.1
Cost of funds 5.2 5.0 4.8 4.7
Net interest margins 3.3 3.2 3.4 3.5
Cost of deposits 5.5 4.1 4.0 3.9
Cost of borrowings 6.4 6.0 6.0 6.0
Spread 3.1 3.0 3.2 3.3
Tax rate (%) 20.2 13.1 20.0 20.0
Balance sheet assumption (%)
Credit growth 11.4 6.6 13.5 14.5
Deposit growth 16.6 16.3 14.0 16.0
SLR ratio 21.3 19.7 19.7 19.7
Low-cost deposits 45.8 50.4 50.8 51.3
Gross NPA ratio 5.8 8.9 8.5 7.4
Net NPA / Equity 14.9 26.0 23.3 18.4
Capital adequacy 16.6 17.4 16.9 16.4
Incremental slippage 4.1 7.6 4.0 2.5
Provision coverage 50.6 40.8 46.7 53.2
13 Edelweiss Securities Limited
ICICI Bank
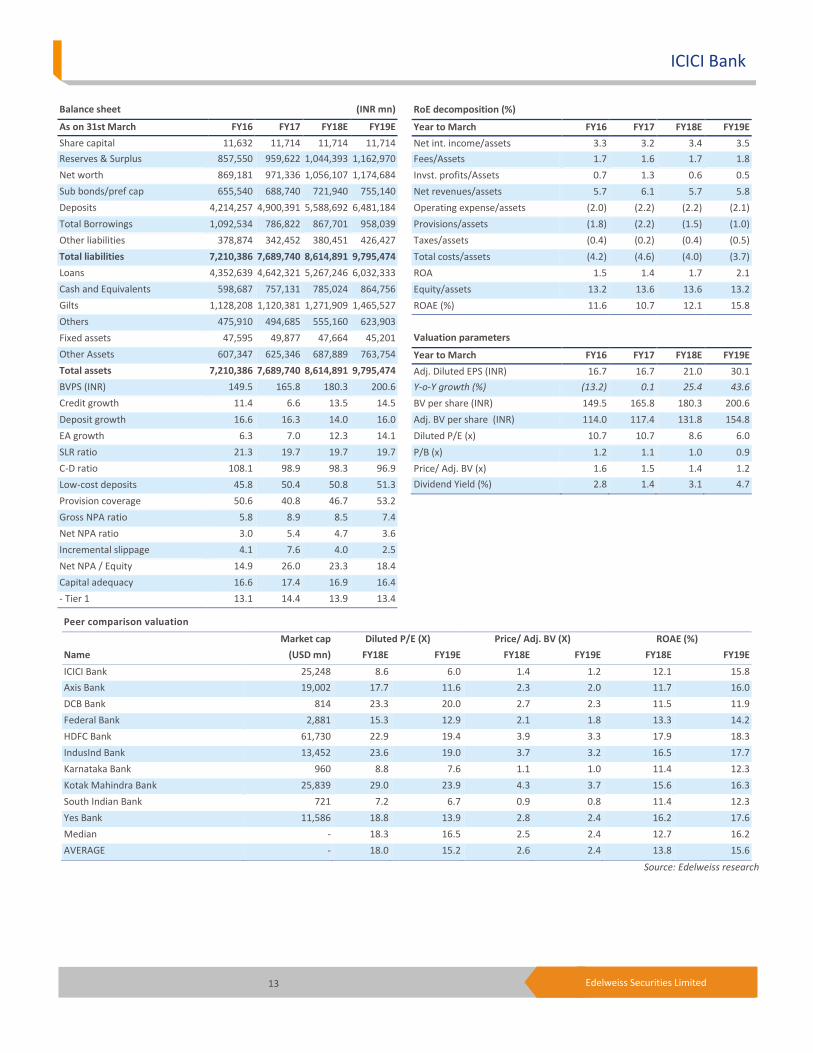
Peer comparison valuation
Market cap Diluted P/E (X) Price/ Adj. BV (X) ROAE (%)
Name (USD mn) FY18E FY19E FY18E FY19E FY18E FY19E
ICICI Bank 25,248 8.6 6.0 1.4 1.2 12.1 15.8
Axis Bank 19,002 17.7 11.6 2.3 2.0 11.7 16.0
DCB Bank 814 23.3 20.0 2.7 2.3 11.5 11.9
Federal Bank 2,881 15.3 12.9 2.1 1.8 13.3 14.2
HDFC Bank 61,730 22.9 19.4 3.9 3.3 17.9 18.3
IndusInd Bank 13,452 23.6 19.0 3.7 3.2 16.5 17.7
Karnataka Bank 960 8.8 7.6 1.1 1.0 11.4 12.3
Kotak Mahindra Bank 25,839 29.0 23.9 4.3 3.7 15.6 16.3
South Indian Bank 721 7.2 6.7 0.9 0.8 11.4 12.3
Yes Bank 11,586 18.8 13.9 2.8 2.4 16.2 17.6
Median - 18.3 16.5 2.5 2.4 12.7 16.2
AVERAGE - 18.0 15.2 2.6 2.4 13.8 15.6
Source: Edelweiss research
RoE decomposition (%)
Year to March FY16 FY17 FY18E FY19E
Net int. income/assets 3.3 3.2 3.4 3.5
Fees/Assets 1.7 1.6 1.7 1.8
Invst. profits/Assets 0.7 1.3 0.6 0.5
Net revenues/assets 5.7 6.1 5.7 5.8
Operating expense/assets (2.0) (2.2) (2.2) (2.1)
Provisions/assets (1.8) (2.2) (1.5) (1.0)
Taxes/assets (0.4) (0.2) (0.4) (0.5)
Total costs/assets (4.2) (4.6) (4.0) (3.7)
ROA 1.5 1.4 1.7 2.1
Equity/assets 13.2 13.6 13.6 13.2
ROAE (%) 11.6 10.7 12.1 15.8
Valuation parameters
Year to March FY16 FY17 FY18E FY19E
Adj. Diluted EPS (INR) 16.7 16.7 21.0 30.1
Y-o-Y growth (%) (13.2) 0.1 25.4 43.6
BV per share (INR) 149.5 165.8 180.3 200.6
Adj. BV per share (INR) 114.0 117.4 131.8 154.8
Diluted P/E (x) 10.7 10.7 8.6 6.0
P/B (x) 1.2 1.1 1.0 0.9
Price/ Adj. BV (x) 1.6 1.5 1.4 1.2
Dividend Yield (%) 2.8 1.4 3.1 4.7
Balance sheet (INR mn)
As on 31st March FY16 FY17 FY18E FY19E
Share capital 11,632 11,714 11,714 11,714
Reserves & Surplus 857,550 959,622 1,044,393 1,162,970
Net worth 869,181 971,336 1,056,107 1,174,684
Sub bonds/pref cap 655,540 688,740 721,940 755,140
Deposits 4,214,257 4,900,391 5,588,692 6,481,184
Total Borrowings 1,092,534 786,822 867,701 958,039
Other liabilities 378,874 342,452 380,451 426,427
Total liabilities 7,210,386 7,689,740 8,614,891 9,795,474
Loans 4,352,639 4,642,321 5,267,246 6,032,333
Cash and Equivalents 598,687 757,131 785,024 864,756
Gilts 1,128,208 1,120,381 1,271,909 1,465,527
Others 475,910 494,685 555,160 623,903
Fixed assets 47,595 49,877 47,664 45,201
Other Assets 607,347 625,346 687,889 763,754
Total assets 7,210,386 7,689,740 8,614,891 9,795,474
BVPS (INR) 149.5 165.8 180.3 200.6
Credit growth 11.4 6.6 13.5 14.5
Deposit growth 16.6 16.3 14.0 16.0
EA growth 6.3 7.0 12.3 14.1
SLR ratio 21.3 19.7 19.7 19.7
C-D ratio 108.1 98.9 98.3 96.9
Low-cost deposits 45.8 50.4 50.8 51.3
Provision coverage 50.6 40.8 46.7 53.2
Gross NPA ratio 5.8 8.9 8.5 7.4
Net NPA ratio 3.0 5.4 4.7 3.6
Incremental slippage 4.1 7.6 4.0 2.5
Net NPA / Equity 14.9 26.0 23.3 18.4
Capital adequacy 16.6 17.4 16.9 16.4
- Tier 1 13.1 14.4 13.9 13.4
14 Edelweiss Securities Limited
Banking and Financial Services
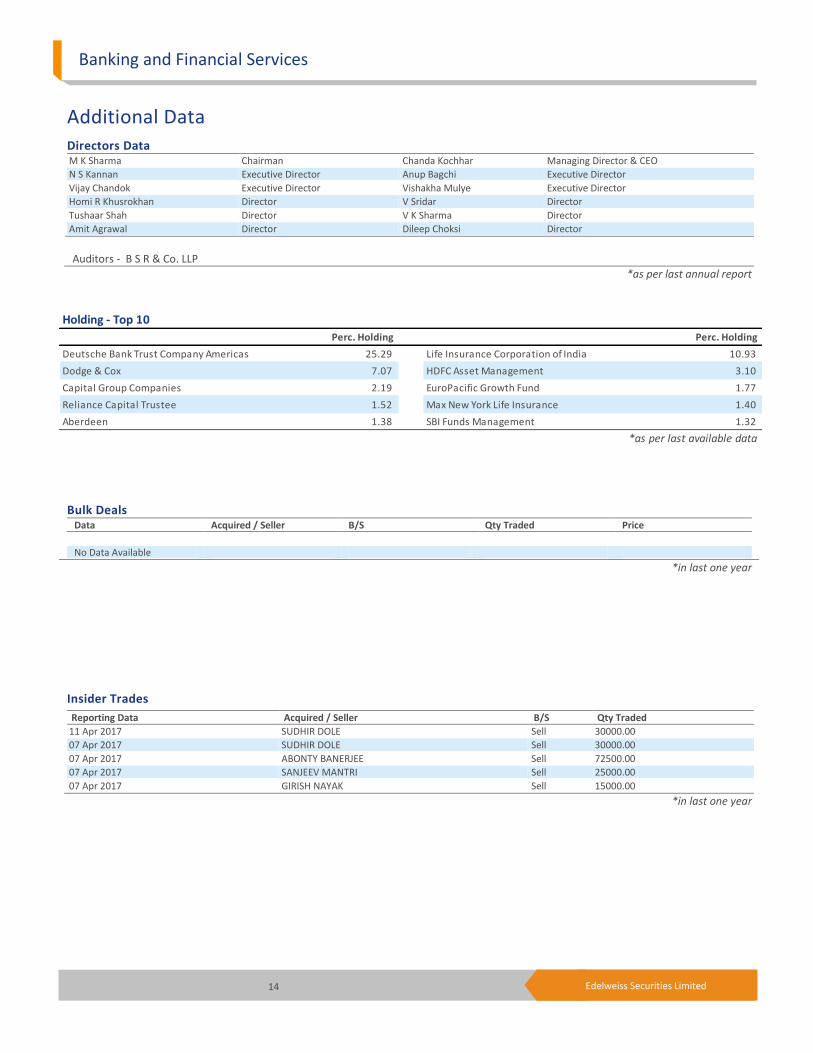
Holding - Top 10
Perc. Holding Perc. Holding
Deutsche Bank Trust Company Americas 25.29 Life Insurance Corporation of India 10.93
Dodge & Cox 7.07 HDFC Asset Management 3.10
Capital Group Companies 2.19 EuroPacific Growth Fund 1.77
Reliance Capital Trustee 1.52 Max New York Life Insurance 1.40
Aberdeen 1.38 SBI Funds Management 1.32
*as per last available data
Insider Trades
Reporting Data Acquired / Seller B/S Qty Traded
11 Apr 2017 SUDHIR DOLE Sell 30000.00
07 Apr 2017 SUDHIR DOLE Sell 30000.00
07 Apr 2017 ABONTY BANERJEE Sell 72500.00
07 Apr 2017 SANJEEV MANTRI Sell 25000.00
07 Apr 2017 GIRISH NAYAK Sell 15000.00
*in last one year
Bulk Deals Data Acquired / Seller B/S Qty Traded Price
No Data Available
*in last one year
Additional Data
Directors Data M K Sharma Chairman Chanda Kochhar Managing Director & CEO
N S Kannan Executive Director Anup Bagchi Executive Director
Vijay Chandok Executive Director Vishakha Mulye Executive Director
Homi R Khusrokhan Director V Sridar Director
Tushaar Shah Director V K Sharma Director
Amit Agrawal Director Dileep Choksi Director
Auditors - B S R & Co. LLP
*as per last annual report
15 Edelweiss Securities Limited
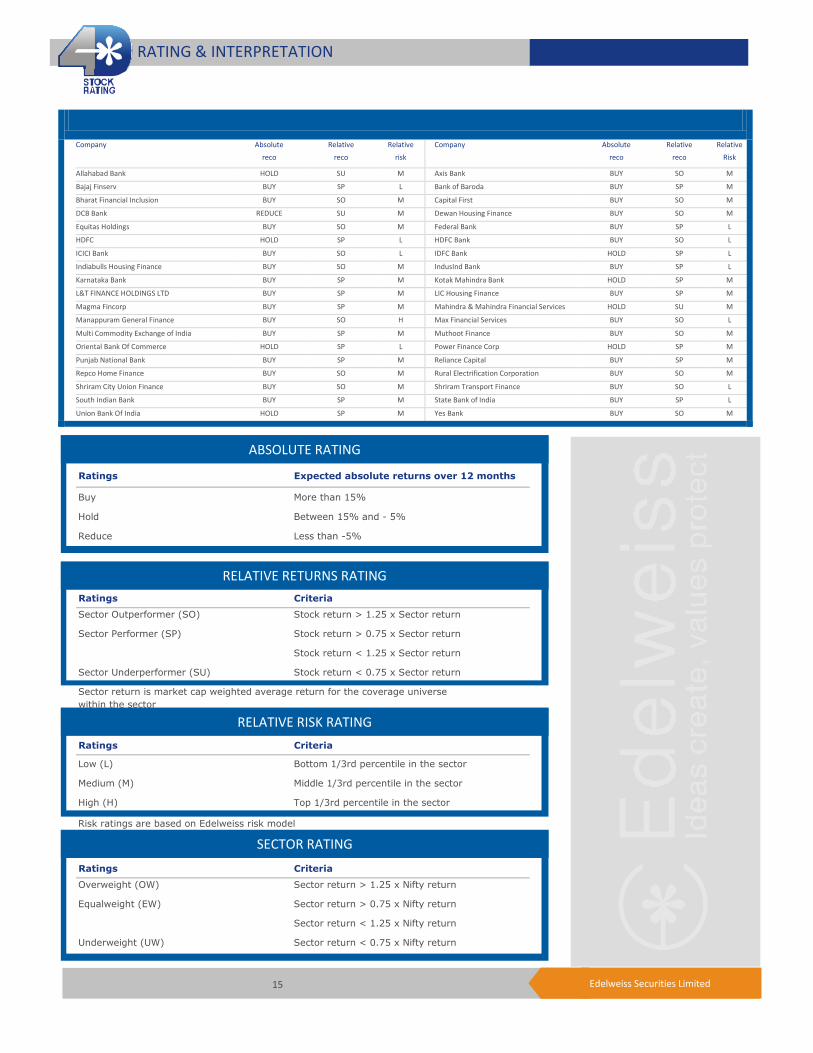
Company Absolute
reco
Relative
reco
Relative
risk
Company Absolute
reco
Relative
reco
Relative
Risk
Allahabad Bank HOLD SU M Axis Bank BUY SO M
Bajaj Finserv BUY SP L Bank of Baroda BUY SP M
Bharat Financial Inclusion BUY SO M Capital First BUY SO M
DCB Bank REDUCE SU M Dewan Housing Finance BUY SO M
Equitas Holdings BUY SO M Federal Bank BUY SP L
HDFC HOLD SP L HDFC Bank BUY SO L
ICICI Bank BUY SO L IDFC Bank HOLD SP L
Indiabulls Housing Finance BUY SO M IndusInd Bank BUY SP L
Karnataka Bank BUY SP M Kotak Mahindra Bank HOLD SP M
L&T FINANCE HOLDINGS LTD BUY SP M LIC Housing Finance BUY SP M
Magma Fincorp BUY SP M Mahindra & Mahindra Financial Services HOLD SU M
Manappuram General Finance BUY SO H Max Financial Services BUY SO L
Multi Commodity Exchange of India BUY SP M Muthoot Finance BUY SO M
Oriental Bank Of Commerce HOLD SP L Power Finance Corp HOLD SP M
Punjab National Bank BUY SP M Reliance Capital BUY SP M
Repco Home Finance BUY SO M Rural Electrification Corporation BUY SO M
Shriram City Union Finance BUY SO M Shriram Transport Finance BUY SO L
South Indian Bank BUY SP M State Bank of India BUY SP L
Union Bank Of India HOLD SP M Yes Bank BUY SO M
RATING & INTERPRETATION
ABSOLUTE RATING
Ratings Expected absolute returns over 12 months
Buy More than 15%
Hold Between 15% and - 5%
Reduce Less than -5%
RELATIVE RETURNS RATING
Ratings Criteria
Sector Outperformer (SO) Stock return > 1.25 x Sector return
Sector Performer (SP) Stock return > 0.75 x Sector return
Stock return < 1.25 x Sector return
Sector Underperformer (SU) Stock return < 0.75 x Sector return
Sector return is market cap weighted average return for the coverage universe
within the sector
RELATIVE RISK RATING
Ratings Criteria
Low (L) Bottom 1/3rd percentile in the sector
Medium (M) Middle 1/3rd percentile in the sector
High (H) Top 1/3rd percentile in the sector
Risk ratings are based on Edelweiss risk model
SECTOR RATING
Ratings Criteria
Overweight (OW) Sector return > 1.25 x Nifty return
Equalweight (EW) Sector return > 0.75 x Nifty return
Sector return < 1.25 x Nifty return
Underweight (UW) Sector return < 0.75 x Nifty return
16 Edelweiss Securities Limited
Banking and Financial Services
Edelweiss Securities Limited, Edelweiss House, off C.S.T. Road, Kalina, Mumbai – 400 098.
Board: (91-22) 4009 4400, Email: [email protected]
Aditya Narain
Head of Research
Coverage group(s) of stocks by primary analyst(s): Banking and Financial Services
Allahabad Bank, Axis Bank, Bharat Financial Inclusion, Bajaj Finserv, Bank of Baroda, Capital First, DCB Bank, Dewan Housing Finance, Federal Bank, HDFC, HDFC Bank, ICICI Bank, IDFC Bank, Indiabulls Housing Finance, IndusInd Bank, Karnataka Bank, Kotak Mahindra Bank, LIC Housing Finance, L&T FINANCE HOLDINGS LTD, Max Financial Services, Multi Commodity Exchange of India, Manappuram General Finance, Magma Fincorp, Mahindra & Mahindra Financial Services, Muthoot Finance, Oriental Bank Of Commerce, Punjab National Bank, Power Finance Corp, Reliance Capital, Rural Electrification Corporation, Repco Home Finance, State Bank of India, Shriram City Union Finance, Shriram Transport Finance, South Indian Bank, Union Bank Of India, Yes Bank
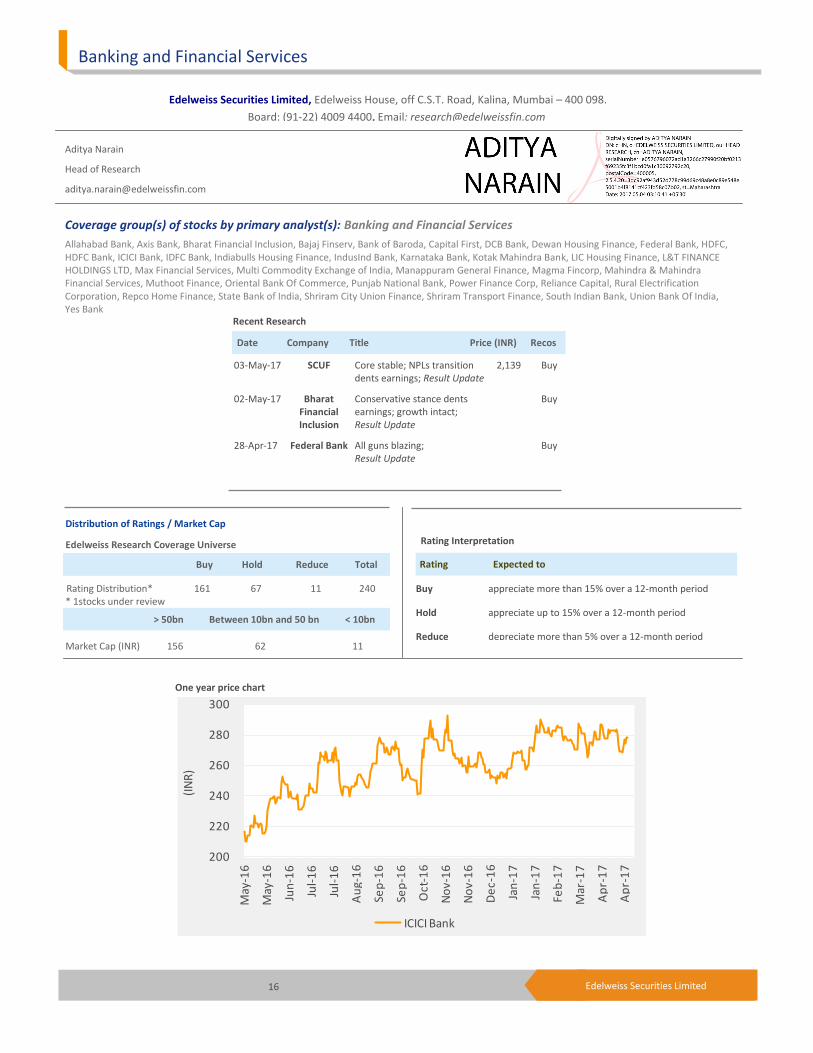
Distribution of Ratings / Market Cap
Edelweiss Research Coverage Universe
Rating Distribution* 161 67 11 240 * 1stocks under review
Market Cap (INR) 156 62 11
Date Company Title Price (INR) Recos
Recent Research
03-May-17 SCUF Core stable; NPLs transition dents earnings; Result Update
2,139 Buy
02-May-17 Bharat Financial Inclusion
Conservative stance dents earnings; growth intact; Result Update
Buy
28-Apr-17 Federal Bank All guns blazing; Result Update
Buy
> 50bn Between 10bn and 50 bn < 10bn
Buy Hold Reduce Total
Rating Interpretation
Buy appreciate more than 15% over a 12-month period
Hold appreciate up to 15% over a 12-month period
Reduce depreciate more than 5% over a 12-month period
Rating Expected to
-
149
297
446
594
743
Jan
-14
Feb
-14
Mar
-14
Ap
r-1
4
May
-14
Jun
-14
Jul-
14
Au
g-1
4
Sep
-14
Oct
-14
No
v-1
4
De
c-1
4
(IN
R)
One year price chart
200
220
240
260
280
300
May
-16
May
-16
Jun
-16
Jul-
16
Jul-
16
Au
g-1
6
Sep
-16
Sep
-16
Oct
-16
No
v-1
6
No
v-1
6
De
c-1
6
Jan
-17
Jan
-17
Feb
-17
Mar
-17
Ap
r-1
7
Ap
r-1
7
(IN
R)
ICICI Bank
17 Edelweiss Securities Limited
ICICI Bank
DISCLAIMER
Edelweiss Securities Limited (“ESL” or “Research Entity”) is regulated by the Securities and Exchange Board of India (“SEBI”) and is licensed to carry on the business of broking, depository services and related activities. The business of ESL and its Associates (list available on www.edelweissfin.com) are organized around five broad business groups – Credit including Housing and SME Finance, Commodities, Financial Markets, Asset Management and Life Insurance.
This Report has been prepared by Edelweiss Securities Limited in the capacity of a Research Analyst having SEBI Registration No.INH200000121 and distributed as per SEBI (Research Analysts) Regulations 2014. This report does not constitute an offer or solicitation for the purchase or sale of any financial instrument or as an official confirmation of any transaction. Securities as defined in clause (h) of section 2 of the Securities Contracts (Regulation) Act, 1956 includes Financial Instruments and Currency Derivatives. The information contained herein is from publicly available data or other sources believed to be reliable. This report is provided for assistance only and is not intended to be and must not alone be taken as the basis for an investment decision. The user assumes the entire risk of any use made of this information. Each recipient of this report should make such investigation as it deems necessary to arrive at an independent evaluation of an investment in Securities referred to in this document (including the merits and risks involved), and should consult his own advisors to determine the merits and risks of such investment. The investment discussed or views expressed may not be suitable for all investors.
This information is strictly confidential and is being furnished to you solely for your information. This information should not be reproduced or redistributed or passed on directly or indirectly in any form to any other person or published, copied, in whole or in part, for any purpose. This report is not directed or intended for distribution to, or use by, any person or entity who is a citizen or resident of or located in any locality, state, country or other jurisdiction, where such distribution, publication, availability or use would be contrary to law, regulation or which would subject ESL and associates / group companies to any registration or licensing requirements within such jurisdiction. The distribution of this report in certain jurisdictions may be restricted by law, and persons in whose possession this report comes, should observe, any such restrictions. The information given in this report is as of the date of this report and there can be no assurance that future results or events will be consistent with this information. This information is subject to change without any prior notice. ESL reserves the right to make modifications and alterations to this statement as may be required from time to time. ESL or any of its associates / group companies shall not be in any way responsible for any loss or damage that may arise to any person from any inadvertent error in the information contained in this report. ESL is committed to providing independent and transparent recommendation to its clients. Neither ESL nor any of its associates, group companies, directors, employees, agents or representatives shall be liable for any damages whether direct, indirect, special or consequential including loss of revenue or lost profits that may arise from or in connection with the use of the information. Our proprietary trading and investment businesses may make investment decisions that are inconsistent with the recommendations expressed herein. Past performance is not necessarily a guide to future performance .The disclosures of interest statements incorporated in this report are provided solely to enhance the transparency and should not be treated as endorsement of the views expressed in the report. The information provided in these reports remains, unless otherwise stated, the copyright of ESL. All layout, design, original artwork, concepts and other Intellectual Properties, remains the property and copyright of ESL and may not be used in any form or for any purpose whatsoever by any party without the express written permission of the copyright holders.
ESL shall not be liable for any delay or any other interruption which may occur in presenting the data due to any reason including network (Internet) reasons or snags in the system, break down of the system or any other equipment, server breakdown, maintenance shutdown, breakdown of communication services or inability of the ESL to present the data. In no event shall ESL be liable for any damages, including without limitation direct or indirect, special, incidental, or consequential damages, losses or expenses arising in connection with the data presented by the ESL through this report.
We offer our research services to clients as well as our prospects. Though this report is disseminated to all the customers simultaneously, not all customers may receive this report at the same time. We will not treat recipients as customers by virtue of their receiving this report.
ESL and its associates, officer, directors, and employees, research analyst (including relatives) worldwide may: (a) from time to time, have long or short positions in, and buy or sell the Securities, mentioned herein or (b) be engaged in any other transaction involving such Securities and earn brokerage or other compensation or act as a market maker in the financial instruments of the subject company/company(ies) discussed herein or act as advisor or lender/borrower to such company(ies) or have other potential/material conflict of interest with respect to any recommendation and related information and opinions at the time of publication of research report or at the time of public appearance. ESL may have proprietary long/short position in the above mentioned scrip(s) and therefore should be considered as interested. The views provided herein are general in nature and do not consider risk appetite or investment objective of any particular investor; readers are requested to take independent professional advice before investing. This should not be construed as invitation or solicitation to do business with ESL.
18 Edelweiss Securities Limited
Banking and Financial Services
ESL or its associates may have received compensation from the subject company in the past 12 months. ESL or its associates may have managed or co-managed public offering of securities for the subject company in the past 12 months. ESL or its associates may have received compensation for investment banking or merchant banking or brokerage services from the subject company in the past 12 months. ESL or its associates may have received any compensation for products or services other than investment banking or merchant banking or brokerage services from the subject company in the past 12 months. ESL or its associates have not received any compensation or other benefits from the Subject Company or third party in connection with the research report. Research analyst or his/her relative or ESL’s associates may have financial interest in the subject company. ESL and/or its Group Companies, their Directors, affiliates and/or employees may have interests/ positions, financial or otherwise in the Securities/Currencies and other investment products mentioned in this report. ESL, its associates, research analyst and his/her relative may have other potential/material conflict of interest with respect to any recommendation and related information and opinions at the time of publication of research report or at the time of public appearance.
Participants in foreign exchange transactions may incur risks arising from several factors, including the following: ( i) exchange rates can be volatile and are subject to large fluctuations; ( ii) the value of currencies may be affected by numerous market factors, including world and national economic, political and regulatory events, events in equity and debt markets and changes in interest rates; and (iii) currencies may be subject to devaluation or government imposed exchange controls which could affect the value of the currency. Investors in securities such as ADRs and Currency Derivatives, whose values are affected by the currency of an underlying security, effectively assume currency risk.
Research analyst has served as an officer, director or employee of subject Company: No
ESL has financial interest in the subject companies: No
ESL’s Associates may have actual / beneficial ownership of 1% or more securities of the subject company at the end of the month immediately preceding the date of publication of research report.
Research analyst or his/her relative has actual/beneficial ownership of 1% or more securities of the subject company at the end of the month immediately preceding the date of publication of research report: No
ESL has actual/beneficial ownership of 1% or more securities of the subject company at the end of the month immediately preceding the date of publication of research report: No
Subject company may have been client during twelve months preceding the date of distribution of the research report.
There were no instances of non-compliance by ESL on any matter related to the capital markets, resulting in significant and material disciplinary action during the last three years except that ESL had submitted an offer of settlement with Securities and Exchange commission, USA (SEC) and the same has been accepted by SEC without admitting or denying the findings in relation to their charges of non registration as a broker dealer.
A graph of daily closing prices of the securities is also available at www.nseindia.com
Analyst Certification:
The analyst for this report certifies that all of the views expressed in this report accurately reflect his or her personal views about the subject company or companies and its or their securities, and no part of his or her compensation was, is or will be, directly or indirectly related to specific recommendations or views expressed in this report.
Additional Disclaimers
Disclaimer for U.S. Persons
This research report is a product of Edelweiss Securities Limited, which is the employer of the research analyst(s) who has prepared the research report. The research analyst(s) preparing the research report is/are resident outside the United States (U.S.) and are not associated persons of any U.S. regulated broker-dealer and therefore the analyst(s) is/are not subject to supervision by a U.S. broker-dealer, and is/are not required to satisfy the regulatory licensing requirements of FINRA or required to otherwise comply with U.S. rules or regulations regarding, among other things, communications with a subject company, public appearances and trading securities held by a research analyst account.
This report is intended for distribution by Edelweiss Securities Limited only to "Major Institutional Investors" as defined by Rule 15a-6(b)(4) of the U.S. Securities and Exchange Act, 1934 (the Exchange Act) and interpretations thereof by U.S. Securities and Exchange Commission (SEC) in reliance on Rule 15a 6(a)(2). If the recipient of this report is not a Major Institutional Investor as specified above, then it should not act upon this report and return the same to the sender. Further, this report may not be copied, duplicated and/or transmitted onward to any U.S. person, which is not the Major Institutional Investor.
19 Edelweiss Securities Limited
ICICI Bank
Access the entire repository of Edelweiss Research on www.edelresearch.com
In reliance on the exemption from registration provided by Rule 15a-6 of the Exchange Act and interpretations thereof by the SEC in order to conduct certain business with Major Institutional Investors, Edelweiss Securities Limited has entered into an agreement with a U.S. registered broker-dealer, Edelweiss Financial Services Inc. ("EFSI"). Transactions in securities discussed in this research report should be effected through Edelweiss Financial Services Inc. Disclaimer for U.K. Persons
The contents of this research report have not been approved by an authorised person within the meaning of the Financial Services and Markets Act 2000 ("FSMA"). In the United Kingdom, this research report is being distributed only to and is directed only at (a) persons who have professional experience in matters relating to investments falling within Article 19(5) of the FSMA (Financial Promotion) Order 2005 (the “Order”); (b) persons falling within Article 49(2)(a) to (d) of the Order (including high net worth companies and unincorporated associations); and (c) any other persons to whom it may otherwise lawfully be communicated (all such persons together being referred to as “relevant persons”). This research report must not be acted on or relied on by persons who are not relevant persons. Any investment or investment activity to which this research report relates is available only to relevant persons and will be engaged in only with relevant persons. Any person who is not a relevant person should not act or rely on this research report or any of its contents. This research report must not be distributed, published, reproduced or disclosed (in whole or in part) by recipients to any other person. Disclaimer for Canadian Persons
This research report is a product of Edelweiss Securities Limited ("ESL"), which is the employer of the research analysts who have prepared the research report. The research analysts preparing the research report are resident outside the Canada and are not associated persons of any Canadian registered adviser and/or dealer and, therefore, the analysts are not subject to supervision by a Canadian registered adviser and/or dealer, and are not required to satisfy the regulatory licensing requirements of the Ontario Securities Commission, other Canadian provincial securities regulators, the Investment Industry Regulatory Organization of Canada and are not required to otherwise comply with Canadian rules or regulations regarding, among other things, the research analysts' business or relationship with a subject company or trading of securities by a research analyst. This report is intended for distribution by ESL only to "Permitted Clients" (as defined in National Instrument 31-103 ("NI 31-103")) who are resident in the Province of Ontario, Canada (an "Ontario Permitted Client"). If the recipient of this report is not an Ontario Permitted Client, as specified above, then the recipient should not act upon this report and should return the report to the sender. Further, this report may not be copied, duplicated and/or transmitted onward to any Canadian person. ESL is relying on an exemption from the adviser and/or dealer registration requirements under NI 31-103 available to certain international advisers and/or dealers. Please be advised that (i) ESL is not registered in the Province of Ontario to trade in securities nor is it registered in the Province of Ontario to provide advice with respect to securities; (ii) ESL's head office or principal place of business is located in India; (iii) all or substantially all of ESL's assets may be situated outside of Canada; (iv) there may be difficulty enforcing legal rights against ESL because of the above; and (v) the name and address of the ESL's agent for service of process in the Province of Ontario is: Bamac Services Inc., 181 Bay Street, Suite 2100, Toronto, Ontario M5J 2T3 Canada. Disclaimer for Singapore Persons
In Singapore, this report is being distributed by Edelweiss Investment Advisors Private Limited ("EIAPL") (Co. Reg. No. 201016306H) which is a holder of a capital markets services license and an exempt financial adviser in Singapore and (ii) solely to persons who qualify as "institutional investors" or "accredited investors" as defined in section 4A(1) of the Securities and Futures Act, Chapter 289 of Singapore ("the SFA"). Pursuant to regulations 33, 34, 35 and 36 of the Financial Advisers Regulations ("FAR"), sections 25, 27 and 36 of the Financial Advisers Act, Chapter 110 of Singapore shall not apply to EIAPL when providing any financial advisory services to an accredited investor (as defined in regulation 36 of the FAR. Persons in Singapore should contact EIAPL in respect of any matter arising from, or in connection with this publication/communication. This report is not suitable for private investors.
Copyright 2009 Edelweiss Research (Edelweiss Securities Ltd). All rights reserved