Embed Size (px)
Citation preview
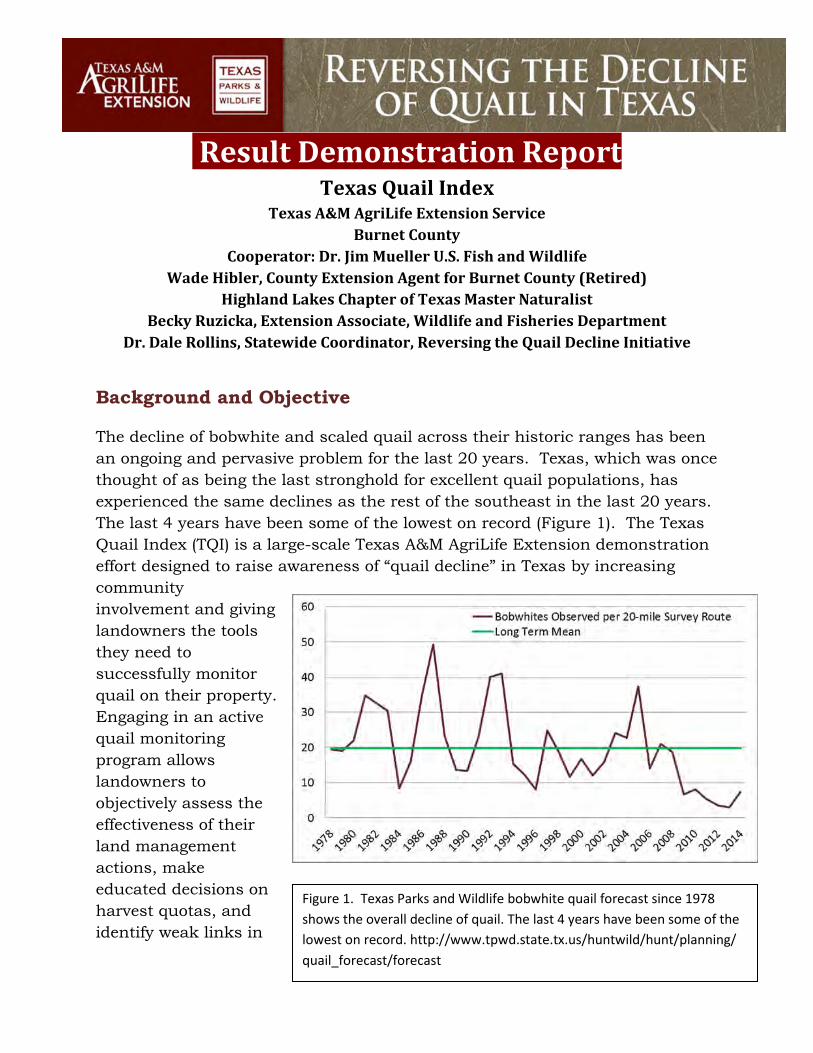
Figure 1. Texas Parks and Wildlife bobwhite quail forecast since 1978 shows the overall decline of quail. The last 4 years have been some of the lowest on record. http://www.tpwd.state.tx.us/huntwild/hunt/planning/ quail_forecast/forecast
Result Demonstration Report Texas Quail Index
Texas A&M AgriLife Extension Service Burnet County
Cooperator: Dr. Jim Mueller U.S. Fish and Wildlife Wade Hibler, County Extension Agent for Burnet County (Retired)
Highland Lakes Chapter of Texas Master Naturalist Becky Ruzicka, Extension Associate, Wildlife and Fisheries Department
Dr. Dale Rollins, Statewide Coordinator, Reversing the Quail Decline Initiative
Background and Objective
The decline of bobwhite and scaled quail across their historic ranges has been an ongoing and pervasive problem for the last 20 years. Texas, which was once thought of as being the last stronghold for excellent quail populations, has experienced the same declines as the rest of the southeast in the last 20 years. The last 4 years have been some of the lowest on record (Figure 1). The Texas Quail Index (TQI) is a large-scale Texas A&M AgriLife Extension demonstration effort designed to raise awareness of “quail decline” in Texas by increasing community involvement and giving landowners the tools they need to successfully monitor quail on their property. Engaging in an active quail monitoring program allows landowners to objectively assess the effectiveness of their land management actions, make educated decisions on harvest quotas, and identify weak links in
Page 2 of 12
Figure 2. Active TQI participating counties shaded in black. There are 36 total statewide representing the Rolling Plains, High Plains, Edwards Plateau, South Texas Plains, Trans Pecos, and Gulf Coast Prairies ecoregions.
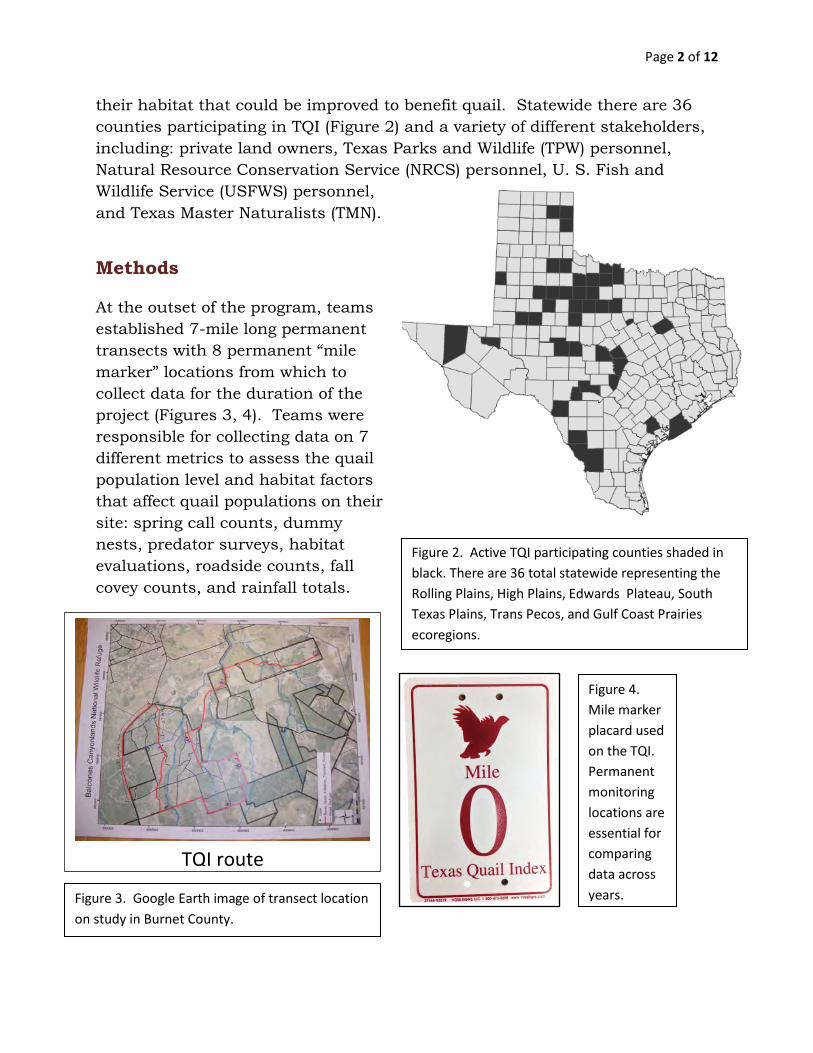
Figure 3. Google Earth image of transect location on study in Burnet County.
Figure 4. Mile marker placard used on the TQI. Permanent monitoring locations are essential for comparing data across years.
their habitat that could be improved to benefit quail. Statewide there are 36 counties participating in TQI (Figure 2) and a variety of different stakeholders, including: private land owners, Texas Parks and Wildlife (TPW) personnel, Natural Resource Conservation Service (NRCS) personnel, U. S. Fish and Wildlife Service (USFWS) personnel, and Texas Master Naturalists (TMN).
Methods
At the outset of the program, teams established 7-mile long permanent transects with 8 permanent “mile marker” locations from which to collect data for the duration of the project (Figures 3, 4). Teams were responsible for collecting data on 7 different metrics to assess the quail population level and habitat factors that affect quail populations on their site: spring call counts, dummy nests, predator surveys, habitat evaluations, roadside counts, fall covey counts, and rainfall totals.
TQI route
Page 3 of 12
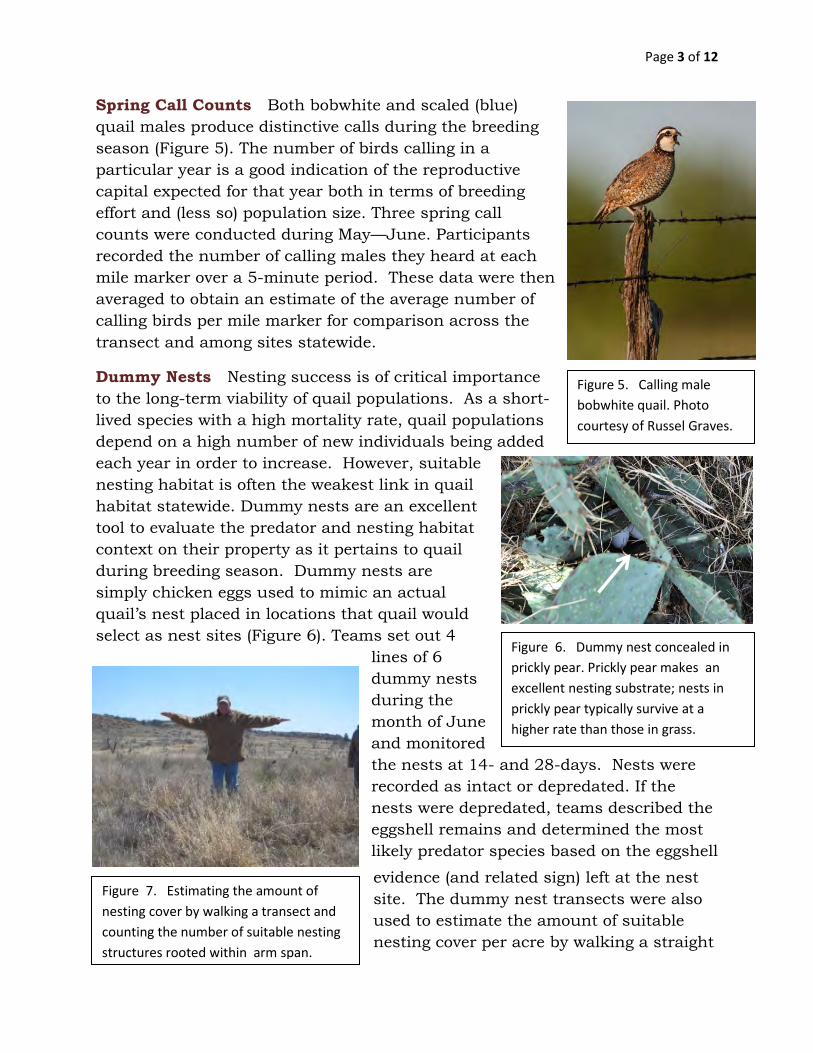
Spring Call Counts Both bobwhite and scaled (blue) quail males produce distinctive calls during the breeding season (Figure 5). The number of birds calling in a particular year is a good indication of the reproductive capital expected for that year both in terms of breeding effort and (less so) population size. Three spring call counts were conducted during May—June. Participants recorded the number of calling males they heard at each mile marker over a 5-minute period. These data were then averaged to obtain an estimate of the average number of calling birds per mile marker for comparison across the transect and among sites statewide.
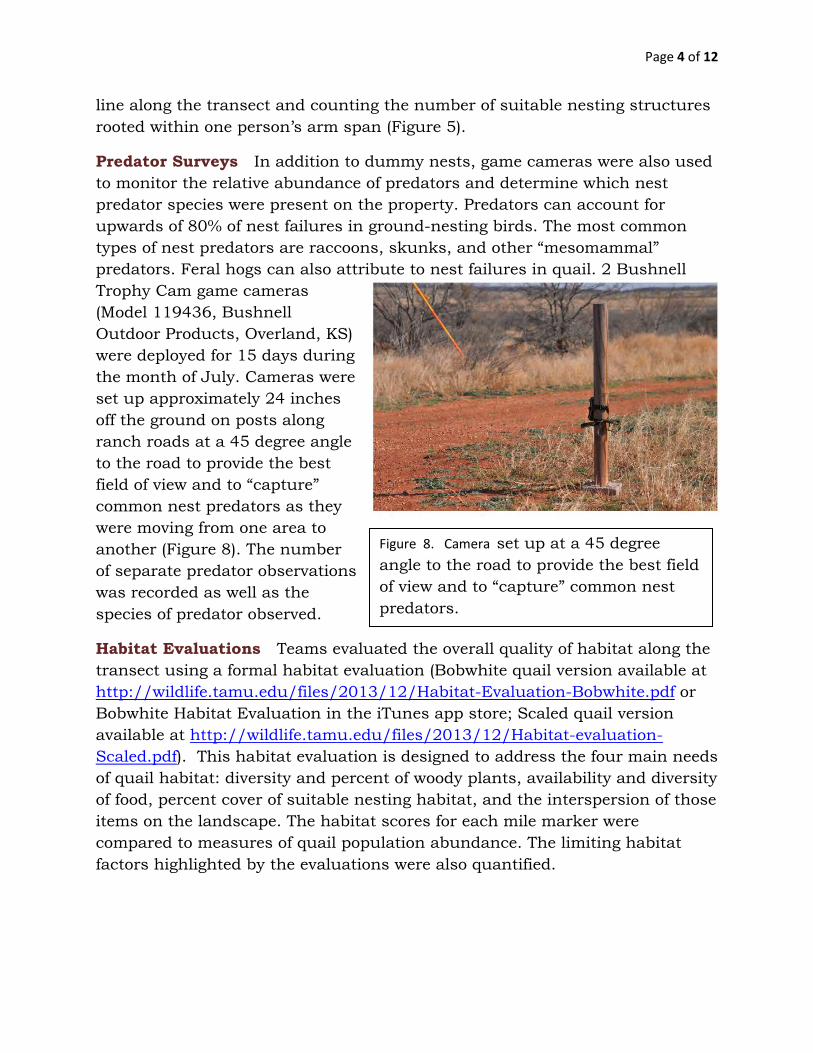
Dummy Nests Nesting success is of critical importance to the long-term viability of quail populations. As a short-lived species with a high mortality rate, quail populations depend on a high number of new individuals being added each year in order to increase. However, suitable nesting habitat is often the weakest link in quail habitat statewide. Dummy nests are an excellent tool to evaluate the predator and nesting habitat context on their property as it pertains to quail during breeding season. Dummy nests are simply chicken eggs used to mimic an actual quail’s nest placed in locations that quail would select as nest sites (Figure 6). Teams set out 4
lines of 6 dummy nests during the month of June and monitored the nests at 14- and 28-days. Nests were recorded as intact or depredated. If the nests were depredated, teams described the eggshell remains and determined the most likely predator species based on the eggshell
evidence (and related sign) left at the nest site. The dummy nest transects were also used to estimate the amount of suitable nesting cover per acre by walking a straight
Figure 5. Calling male bobwhite quail. Photo courtesy of Russel Graves.
Figure 6. Dummy nest concealed in prickly pear. Prickly pear makes an excellent nesting substrate; nests in prickly pear typically survive at a higher rate than those in grass.
Figure 7. Estimating the amount of nesting cover by walking a transect and counting the number of suitable nesting structures rooted within arm span.
Page 4 of 12
line along the transect and counting the number of suitable nesting structures rooted within one person’s arm span (Figure 5).
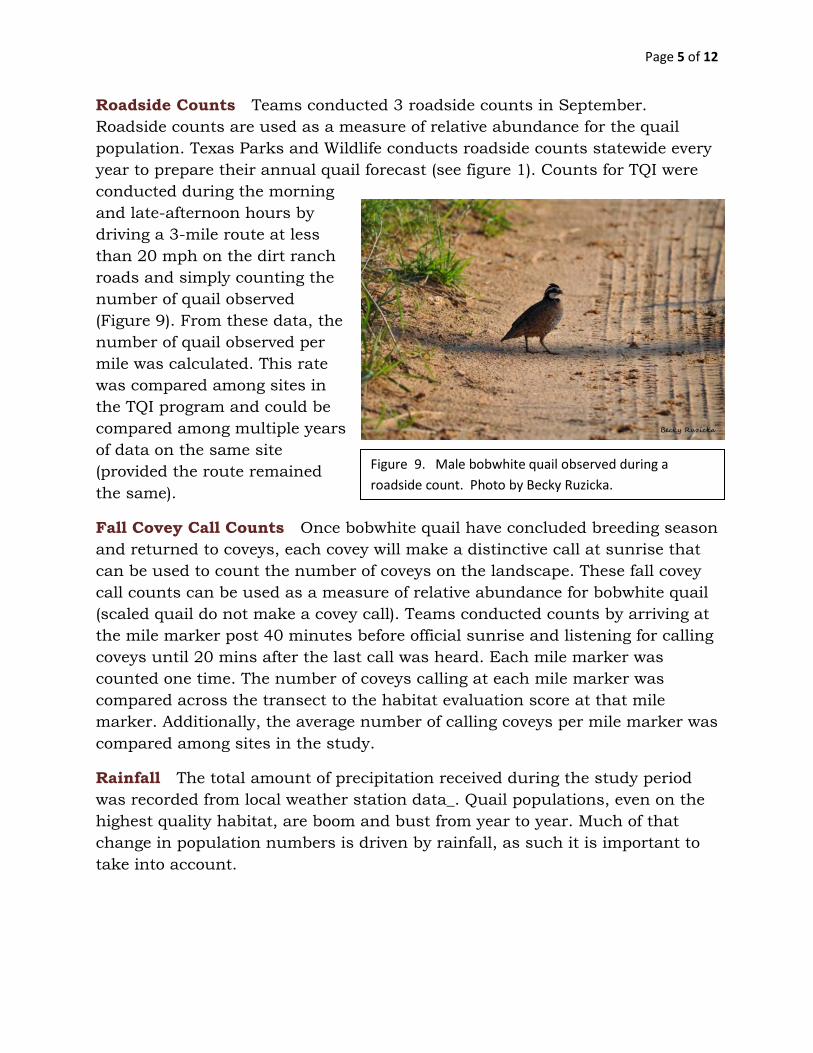
Predator Surveys In addition to dummy nests, game cameras were also used to monitor the relative abundance of predators and determine which nest predator species were present on the property. Predators can account for upwards of 80% of nest failures in ground-nesting birds. The most common types of nest predators are raccoons, skunks, and other “mesomammal” predators. Feral hogs can also attribute to nest failures in quail. 2 Bushnell Trophy Cam game cameras (Model 119436, Bushnell Outdoor Products, Overland, KS) were deployed for 15 days during the month of July. Cameras were set up approximately 24 inches off the ground on posts along ranch roads at a 45 degree angle to the road to provide the best field of view and to “capture” common nest predators as they were moving from one area to another (Figure 8). The number of separate predator observations was recorded as well as the species of predator observed.
Habitat Evaluations Teams evaluated the overall quality of habitat along the transect using a formal habitat evaluation (Bobwhite quail version available at http://wildlife.tamu.edu/files/2013/12/Habitat-Evaluation-Bobwhite.pdf or Bobwhite Habitat Evaluation in the iTunes app store; Scaled quail version available at http://wildlife.tamu.edu/files/2013/12/Habitat-evaluation-Scaled.pdf). This habitat evaluation is designed to address the four main needs of quail habitat: diversity and percent of woody plants, availability and diversity of food, percent cover of suitable nesting habitat, and the interspersion of those items on the landscape. The habitat scores for each mile marker were compared to measures of quail population abundance. The limiting habitat factors highlighted by the evaluations were also quantified.
Figure 8. Camera set up at a 45 degree angle to the road to provide the best field of view and to “capture” common nest predators.
Page 5 of 12
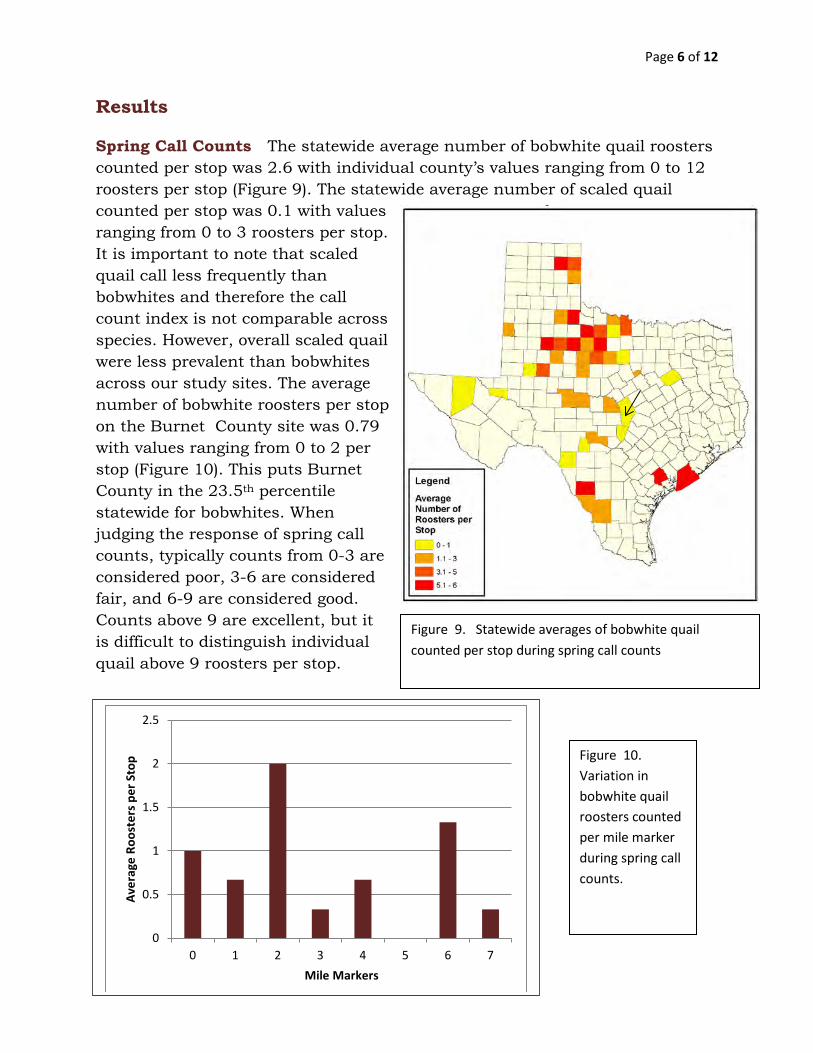
Roadside Counts Teams conducted 3 roadside counts in September. Roadside counts are used as a measure of relative abundance for the quail population. Texas Parks and Wildlife conducts roadside counts statewide every year to prepare their annual quail forecast (see figure 1). Counts for TQI were conducted during the morning and late-afternoon hours by driving a 3-mile route at less than 20 mph on the dirt ranch roads and simply counting the number of quail observed (Figure 9). From these data, the number of quail observed per mile was calculated. This rate was compared among sites in the TQI program and could be compared among multiple years of data on the same site (provided the route remained the same). Fall Covey Call Counts Once bobwhite quail have concluded breeding season and returned to coveys, each covey will make a distinctive call at sunrise that can be used to count the number of coveys on the landscape. These fall covey call counts can be used as a measure of relative abundance for bobwhite quail (scaled quail do not make a covey call). Teams conducted counts by arriving at the mile marker post 40 minutes before official sunrise and listening for calling coveys until 20 mins after the last call was heard. Each mile marker was counted one time. The number of coveys calling at each mile marker was compared across the transect to the habitat evaluation score at that mile marker. Additionally, the average number of calling coveys per mile marker was compared among sites in the study.
Rainfall The total amount of precipitation received during the study period was recorded from local weather station data_. Quail populations, even on the highest quality habitat, are boom and bust from year to year. Much of that change in population numbers is driven by rainfall, as such it is important to take into account.
Figure 9. Male bobwhite quail observed during a roadside count. Photo by Becky Ruzicka.
Page 6 of 12
Results
Spring Call Counts The statewide average number of bobwhite quail roosters counted per stop was 2.6 with individual county’s values ranging from 0 to 12 roosters per stop (Figure 9). The statewide average number of scaled quail counted per stop was 0.1 with values ranging from 0 to 3 roosters per stop. It is important to note that scaled quail call less frequently than bobwhites and therefore the call count index is not comparable across species. However, overall scaled quail were less prevalent than bobwhites across our study sites. The average number of bobwhite roosters per stop on the Burnet County site was 0.79 with values ranging from 0 to 2 per stop (Figure 10). This puts Burnet County in the 23.5th percentile statewide for bobwhites. When judging the response of spring call counts, typically counts from 0-3 are considered poor, 3-6 are considered fair, and 6-9 are considered good. Counts above 9 are excellent, but it is difficult to distinguish individual quail above 9 roosters per stop.
Figure 9. Statewide averages of bobwhite quail counted per stop during spring call counts
Figure 10. Variation in bobwhite quail roosters counted per mile marker during spring call counts.
0
0.5
1
1.5
2
2.5
0 1 2 3 4 5 6 7
Aver
age
Roos
ters
per
Sto
p
Mile Markers
Page 7 of 12
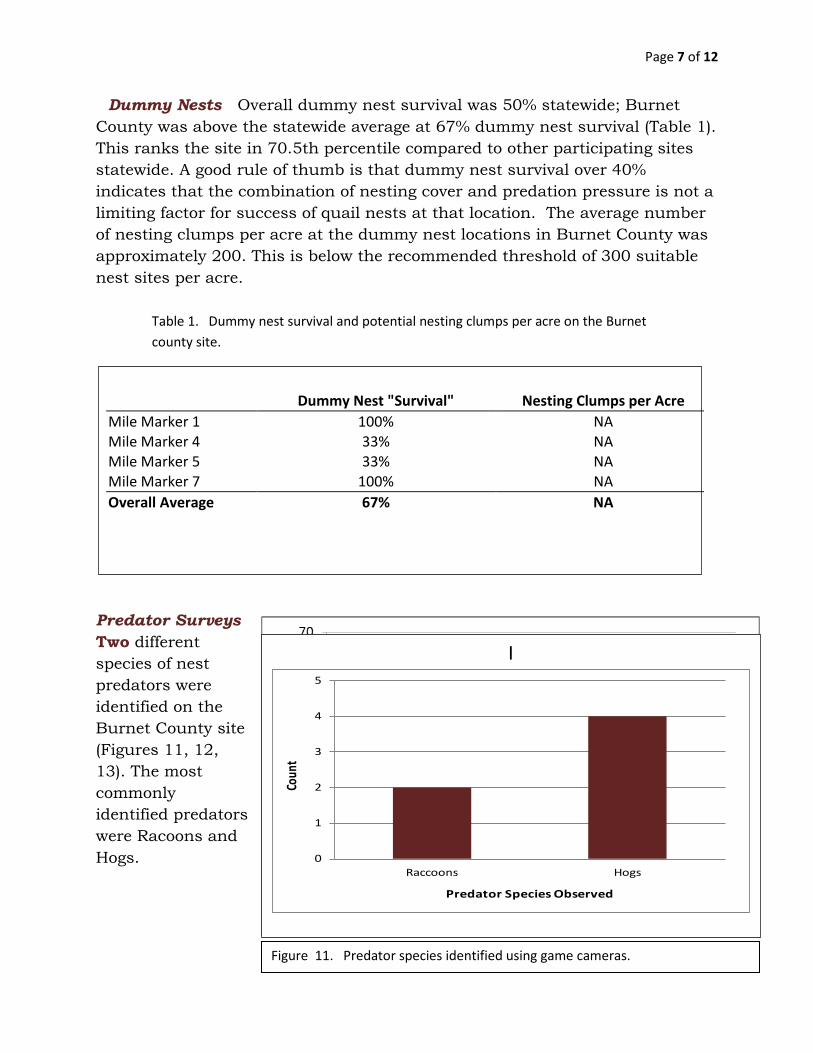
Dummy Nests Overall dummy nest survival was 50% statewide; Burnet County was above the statewide average at 67% dummy nest survival (Table 1). This ranks the site in 70.5th percentile compared to other participating sites statewide. A good rule of thumb is that dummy nest survival over 40% indicates that the combination of nesting cover and predation pressure is not a limiting factor for success of quail nests at that location. The average number of nesting clumps per acre at the dummy nest locations in Burnet County was approximately 200. This is below the recommended threshold of 300 suitable nest sites per acre.
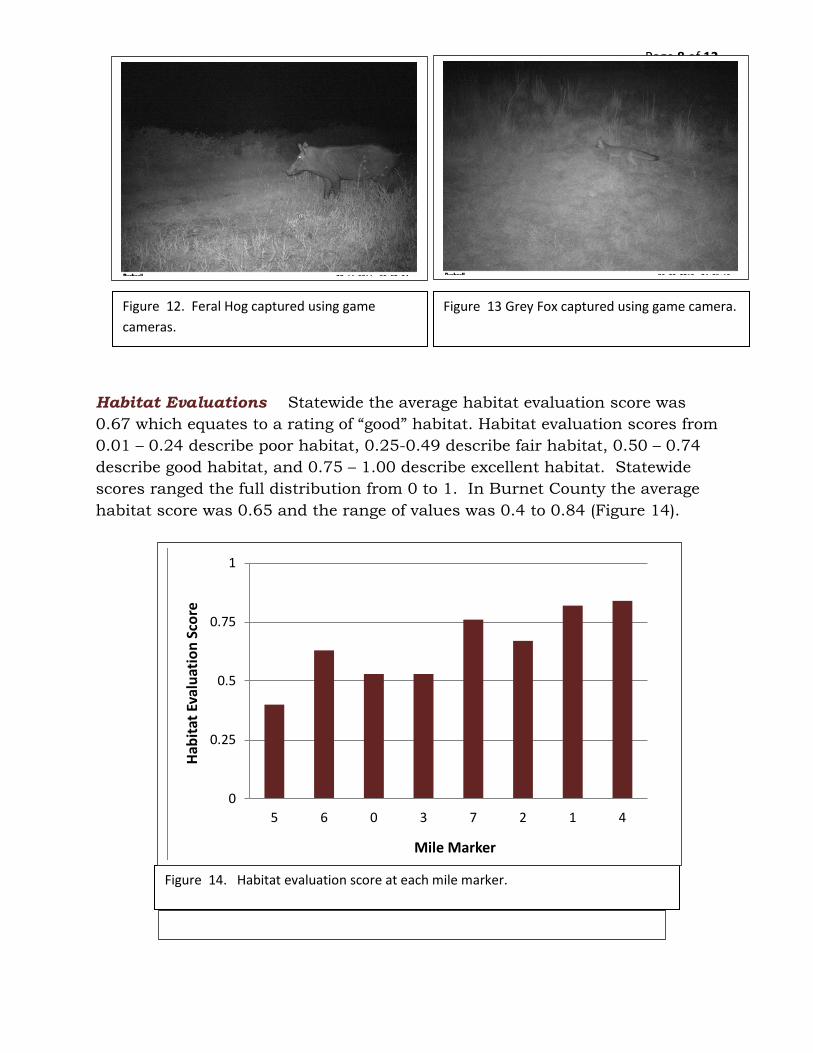
Predator Surveys Two different species of nest predators were identified on the Burnet County site (Figures 11, 12, 13). The most commonly identified predators were Racoons and Hogs.
Dummy Nest "Survival" Nesting Clumps per Acre
Mile Marker 1 100% NA Mile Marker 4 33% NA Mile Marker 5 33% NA Mile Marker 7 100% NA Overall Average 67% NA
Table 1. Dummy nest survival and potential nesting clumps per acre on the Burnet county site.
Figure 11. Predator species identified using game cameras.
I
0
1
2
3
4
5
Raccoons Hogs
Coun
t
Predator Species Observed
Page 8 of 12
Figure 13 Grey Fox captured using game camera. Figure 12. Feral Hog captured using game cameras.
Figure 14. Habitat evaluation score at each mile marker.
Habitat Evaluations Statewide the average habitat evaluation score was 0.67 which equates to a rating of “good” habitat. Habitat evaluation scores from 0.01 – 0.24 describe poor habitat, 0.25-0.49 describe fair habitat, 0.50 – 0.74 describe good habitat, and 0.75 – 1.00 describe excellent habitat. Statewide scores ranged the full distribution from 0 to 1. In Burnet County the average habitat score was 0.65 and the range of values was 0.4 to 0.84 (Figure 14).
0
0.25
0.5
0.75
1
5 6 0 3 7 2 1 4
Habi
tat E
valu
atio
n Sc
ore
Mile Marker
Page 9 of 12
Figure 15. Habitat evaluation score at each mile marker.
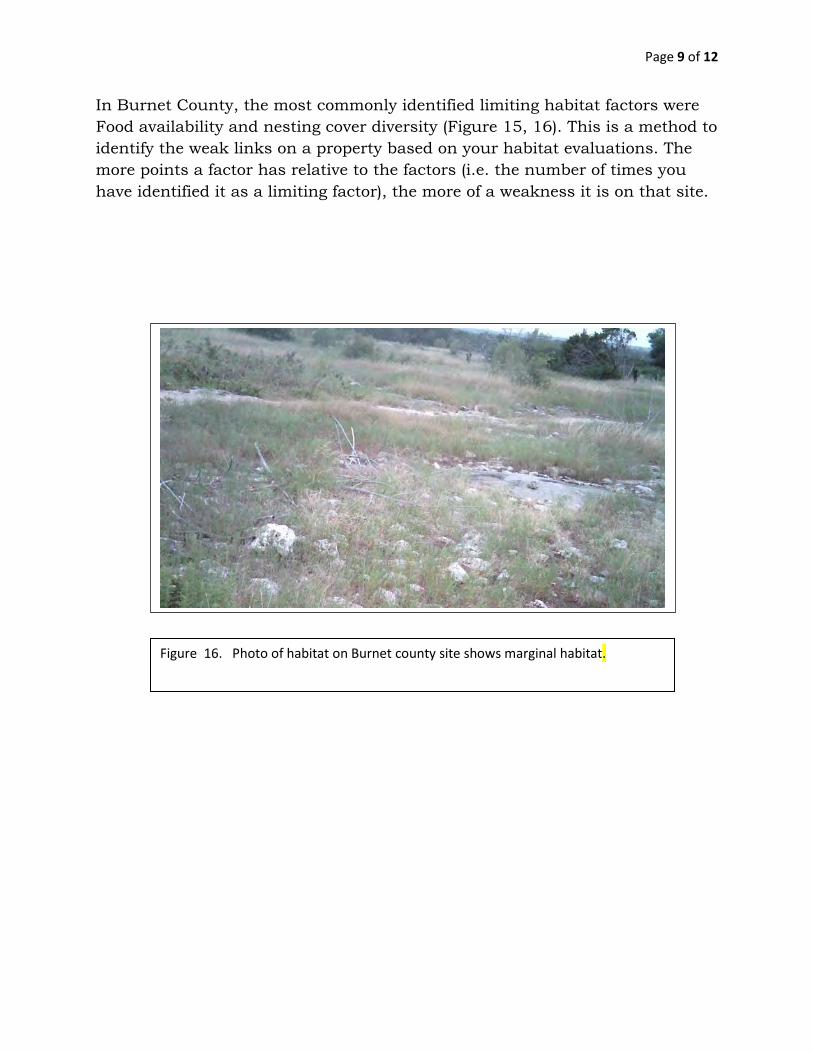
Figure 16. Photo of habitat on Burnet county site shows marginal habitat.
In Burnet County, the most commonly identified limiting habitat factors were Food availability and nesting cover diversity (Figure 15, 16). This is a method to identify the weak links on a property based on your habitat evaluations. The more points a factor has relative to the factors (i.e. the number of times you have identified it as a limiting factor), the more of a weakness it is on that site.
Page 10 of 12
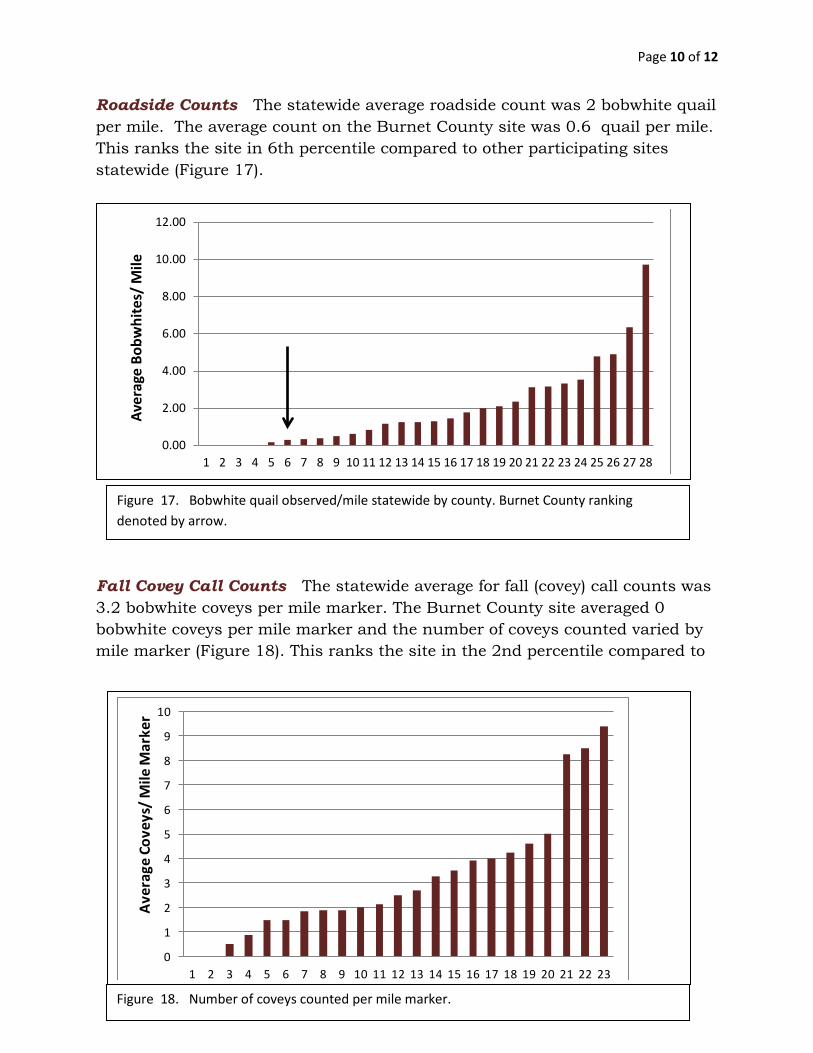
Figure 17. Bobwhite quail observed/mile statewide by county. Burnet County ranking denoted by arrow.
Figure 18. Number of coveys counted per mile marker.
Roadside Counts The statewide average roadside count was 2 bobwhite quail per mile. The average count on the Burnet County site was 0.6 quail per mile. This ranks the site in 6th percentile compared to other participating sites statewide (Figure 17).
Fall Covey Call Counts The statewide average for fall (covey) call counts was 3.2 bobwhite coveys per mile marker. The Burnet County site averaged 0 bobwhite coveys per mile marker and the number of coveys counted varied by mile marker (Figure 18). This ranks the site in the 2nd percentile compared to
0.00
2.00
4.00
6.00
8.00
10.00
12.00
1 2 3 4 5 6 7 8 9 10 11 12 13 14 15 16 17 18 19 20 21 22 23 24 25 26 27 28
Aver
age
Bobw
hite
s/ M
ile
0
1
2
3
4
5
6
7
8
9
10
1 2 3 4 5 6 7 8 9 10 11 12 13 14 15 16 17 18 19 20 21 22 23
Aver
age
Cove
ys/ M
ile M
arke
r
Page 11 of 12
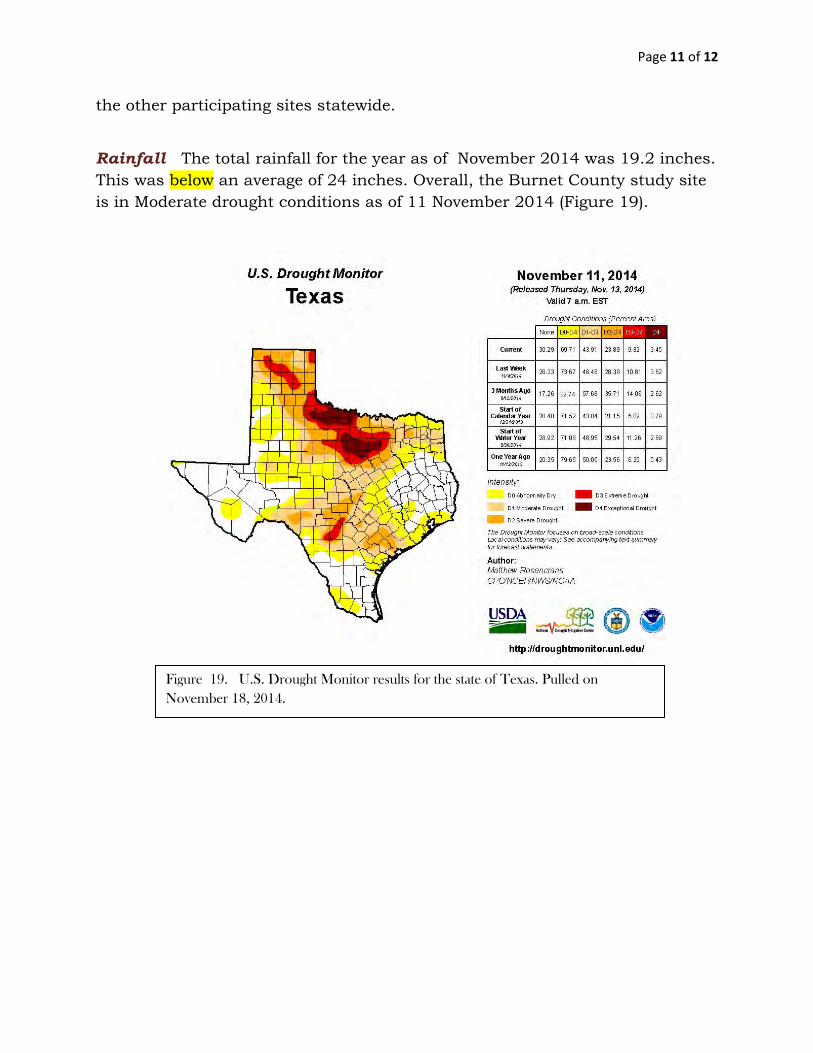
Figure 19. U.S. Drought Monitor results for the state of Texas. Pulled on November 18, 2014.
the other participating sites statewide.
Rainfall The total rainfall for the year as of November 2014 was 19.2 inches. This was below an average of 24 inches. Overall, the Burnet County study site is in Moderate drought conditions as of 11 November 2014 (Figure 19).
Page 12 of 12
Trade names of commercial products used in this report is included only for better understanding and clarity. Reference to commercial products or trade names is made with the understanding that no discrimination is intended and no endorsement by Texas AgriLife Extension Service and the Texas A&M University System is implied. Readers should realize that results from
one experiment do not represent conclusive evidence that the same response would occur where conditions vary.
Discussion and Conclusions
The Balcones Wildlife Refuge has been deferred from grazing for over 7 years now. With the heavy growth of woody and grass species is can resemble a jungle in some areas. Dense growth coupled with lack of good food sources has had a limiting factor on covey development. There are quail on the refuge, but their numbers are limited due to habitat problem, food producing plants and nest predators.
With the use of prescribed burns by the refuge the density of the habitat can be corrected. There has been some discussion of grazing parts of the refuge also.
It will be these habitat corrections that will make a better condition for the quail on Balcones Wildlife Refuge.
Acknowledgments The Highland Lakes Chapter of Texas Master Naturalist is commended for their diligent work on this project. Their volunteer efforts are vital for the ongoing success of this multi-year research endeavor. Special appreciation is expressed to the team of George Brugnoli, Billy Hutson, Melissa Duckworth, Alice Rheaume, and Jerry Stacy.