Embed Size (px)
Citation preview

Restriction of influenza infection by cyclin D3
1
Cell cycle independent role of Cyclin D3 in host restriction of Influenza virus infection Ying Fan1,2, Chris Ka-Pun Mok1, Michael Chi Wai Chan3, Yang Zhang1,4, Béatrice Nal1,5,
François Kien1,6, Roberto Bruzzone1,7 and Sumana Sanyal1
1HKU-Pasteur Research Pole and Centre of Influenza Research, School of Public Health, LKS Faculty of Medicine, The University of Hong Kong, Hong Kong SAR, China; 2MRC
Protein Phosphorylation and Ubiquitylation Unit, University of Dundee; 3Centre of Influenza Research, School of Public Health, LKS Faculty of Medicine, The University of Hong Kong,
Hong Kong SAR, China; 4Harbin Institute of Technology, Shenzhen Graduate School, Shenzhen, Guangdong, China, 518055; 5Division of Biosciences, College of Health and Life Sciences, Brunel University London, UB8 3PH, United Kingdom; 6Ksilink, French-German Advanced Translational Center, Strasbourg 67000, France; 7Department of Cell Biology and
Infection, Institut Pasteur, Paris Cedex 75015, France
Running title: Restriction of influenza infection by cyclin D3 To whom correspondence should be addressed: Prof. Roberto Bruzzone, HKU-Pasteur Research Pole and Centre of Influenza Research, School of Public Health, LKS Faculty of Medicine, The University of Hong Kong, Hong Kong, Telephone: (852) 28315522; Fax (852) 28725782; E-mail: [email protected]; Dr. Sumana Sanyal, HKU-Pasteur Research Pole and Centre of Influenza Research, School of Public Health, LKS Faculty of Medicine, The University of Hong Kong, Hong Kong, Telephone: (852) 28315524; Fax (852) 28725782; E-mail: [email protected]
Keywords: cyclin D3; M2; restriction factor; cell cycle arrest; influenza ABSTRACT
To identify new host factors that modulate the replication of influenza A virus, we performed a yeast two-hybrid screen using the cytoplasmic tail of matrix protein 2 from the highly pathogenic H5N1 strain. The screen revealed a high-score interaction with cyclin D3, a key regulator of cell cycle early G1 phase. M2–cyclin D3 interaction was validated through GST pull-down and recapitulated in influenza A/WSN/33-infected cells. Knockdown of Ccnd3 by small interfering RNA significantly enhanced virus progeny titers in cell culture supernatants. Interestingly, the increase in virus production was due to cyclin D3 deficiency per se, and not merely
a consequence of cell cycle deregulation. A combined knockdown of Ccnd3 and Rb1, which rescued cell cycle progression into the S phase, failed to normalize virus production. Infection by IAV triggered redistribution of cyclin D3 from the nucleus to the cytoplasm followed by its proteasomal degradation. When over-expressed in HEK 293T cells cyclin D3 impaired binding of M2 with M1, which is essential for proper assembly of progeny virions, lending further support to its role as a putative restriction factor. Our study describes the identification and characterization of cyclin D3 as a novel interactor of influenza A virus M2 protein. We hypothesize that competitive inhibition

Restriction of influenza infection by cyclin D3
2
of M1–M2 interaction by cyclin D3 impairs infectious virion formation and results in attenuated virus production. In addition, we provide mechanistic insights into the dynamic interplay of influenza virus with the host cell cycle machinery during infection. INTRODUCTION
The threat of influenza infection is felt globally as the disease leads to an estimated 3 to 5 million cases of severe illness, and about 250,000 to 500,000 deaths each year (1). Although the strategy of antagonizing influenza infection through vaccination has been partially successful, the necessity for effective antiviral agents is underscored by the toxic side effects of currently available drugs and the emergence of drug-resistant variants (2-4). Influenza viruses, like any other viruses, are obligate intracellular pathogens that exploit the host cellular machinery to replicate. The identification of cellular mechanisms required for virus life cycle not only sheds light on its trafficking characteristics but also provides strategies for interfering with host factors as an alternative approach to inhibit viral infection.
Elucidating host-pathogen interactions as an unbiased approach to gain insights into disease pathogenesis has received ample attention. Various functional assay systems have been used for screening host factors involved in the influenza virus replication cycle thus far. From RNA interference (RNAi)-based genome-wide screening strategies in Drosophila (5) and mammalian systems (6-9) to other approaches including proteomics (10,11), yeast two-hybrid (Y2H) analyses (7,12), as well as microarrays (7,13-15), extensive information has been acquired. Multiple cellular networks have been implicated in influenza virus
replication either through direct protein-protein interactions (10,16) or signaling pathways (17). Although these strategies unveiled hundreds of genes important for the virus life cycle, their functional relevance and molecular mechanisms are still poorly understood. Amongst others, effort has been invested to dissect how the cellular interactors of viral ribonucleoprotein (vRNP) complexes regulate the replication and transcription of influenza virus (18). Host interactors of the non-structural protein 1 (NS1), a multifunctional protein modulating several aspects of the virus replication cycle with a major role in inhibiting interferon mediated immune response, have also been extensively studied (16). However, little attention has been drawn to identify cellular factors associated with the viral matrix protein 2 (M2).
We reasoned that the integral membrane proteins of the viral envelope would interact with cellular factors at various stages: endosomal fusion and release of the genetic material during entry, transport from endoplasmic reticulum (ER) to the plasma membrane and during assembly and budding of nascent virions. M2 is a minor protein of the viral envelope that forms a homotetramer in its native state (19,20). Interestingly, M2 possesses the longest C-terminal tail among the three viral envelope proteins, namely hemagglutinin (HA), neuraminidase (NA), and M2. It is an ion channel that was initially discovered as the target of the anti-viral drug amantadine and facilitates diffusion of protons to the interior of the endosomally entrapped virus (21). Low pH induces a conformational change in HA and subsequently triggers fusion with the endosomal membrane during virus entry (22). M2 is a 97-residue single-pass membrane protein that displays

Restriction of influenza infection by cyclin D3
3
considerable pleiotropism. It determines the filamentous morphology of some viral strains through binding to cholesterol (23-25). The cytoplasmic tail (CT) of M2 interacts with M1 at the site of virus budding for efficient packaging of virus particles (26,27). Rossman et al reported a role of M2-CT in mediating cholesterol-dependent alteration in membrane curvature at the neck of budding virions, leading to host ESCRT pathway-independent membrane scission (28).
Altogether, these studies provide evidence that influenza M2, especially the CT domain, plays a critical role in multiple steps of the virus life cycle. Hence, the identification of cellular interactors of M2 would provide mechanistic insights into influenza pathogenesis and possibilities for development of novel strategies to interfere with multiple steps of the infection process. By using M2-CT as bait, we screened a human placenta cDNA library to identify host proteins that either facilitate or restrict viral infection. Cyclin D3, a key regulator of cell cycle G0/G1 phase progression, was uncovered as a novel host factor interacting with M2-CT. The physical interaction between M2 and cyclin D3 was confirmed in virus-infected cells. IAV infection resulted in host cell cycle arrest in the G0/G1 phase, which was accompanied by cyclin D3 relocalization and degradation. Using a combination of small interfering RNA (siRNA) mediated genetic analyses we further showed that cyclin D3 restricts IAV production, independent of its role in cell cycle. The restriction of cyclin D3 on IAV life cycle did not impair viral protein synthesis, but interfered with M1–M2 binding, which may result in defective assembly and release of progeny virions. The role of cyclin D3 in the context of
influenza infection has not been described previously. More interestingly, our results suggest a novel function of cyclin D3 that is beyond its classical function in cell cycle regulation. RESULT Identification of cyclin D3 as M2-CT binding protein
The IAV M2 ion channel protein is a multifunctional protein with a highly conserved sequence among influenza A virus isolates that approaches 95% identity in some regions (29,30). Among the three viral envelope proteins, M2 possesses the longest CT with a high probability of interactions with the cellular machinery at various steps of the virus life cycle. These include fusion, intracellular trafficking through the secretory pathway (31), as well as virus assembly and budding at the plasma membrane (24,32). It is of considerable interest to identify intracellular interactors of M2-CT, not only to elucidate cellular components that are exploited by influenza but also to understand host defenses involved in restricting virus life cycle. To this end, a random-primed cDNA library from human placenta was screened by Y2H using the IAV M2-CT as bait (Figure 1A). The screening revealed human cyclin D3 (GenBank accession no. NM_001760.2) as one of the most prominent interactors of M2-CT as summarized in Table 1. Sequence alignment of the positive clones pointed to amino acid residues 138 to 251 as the minimal interacting domain for M2-CT (Figure 1B). The M2-binding domain on cyclin D3 is largely outside of its cyclin box, which is responsible for binding to and activation of cyclin dependent kinases (33,34) and also the region in which the greatest homology occurs among the D-type cyclins (35). This finding, together with the

Restriction of influenza infection by cyclin D3
4
absence of other cyclins among positive clones, suggests a certain degree of specificity of the interaction, which was tested in the next series of experiments.
Cyclin D forms a complex with and functions as a regulatory subunit of cyclin dependent kinase (CDK) 4 and 6, whose activity is required in the cell cycle early G1 phase (36). There are three early G1 phase D-type cyclins (D1, D2 and D3), which are functionally related with tissue-specific expression profiles (37-43). Our results from Y2H screening indicate that only cyclin D3 but not the other two D-type cyclins interact with M2-CT. We first checked the specificity of this interaction in human A549 lung epithelial cells. GST–M2-CT fusion protein was purified and incubated with wild-type cell lysate to pull-down endogenous D-type cyclins. Cyclin D3 bound specifically to GST–M2-CT and not to either GST or beads (Figure 1C). Altogether, these results confirm that cyclin D3 binds to the IAV M2-CT.
To examine the intracellular association of M2-CT with cyclin D3 during the IAV life cycle, co-immunoprecipitation experiments were performed from virus-infected cells. HEK 293T cells were transiently transfected with a plasmid encoding flag-tagged cyclin D3 (cyclin D3-Flag) and infected with influenza A/WSN/33 virus. Cell lysates were immunoprecipitated with anti-flag antibody and immunoblotted with anti-M2 antibody. As shown in Figure 1D (lane 1), M2 was found to co-purify with cyclin D3, demonstrating their physical interaction during virus infection, either directly or through a common interactor. No interaction was observed in control samples, where cells were either mock transfected and immunoprecipitated with anti-flag antibody
(Figure 1D, lane 2) or transfected with cyclin D3-flag and immunoprecipitated with isotype control antibody (Figure 1D, lane 3). These data validate cyclin D3 as a bona fide interactor of influenza M2, corroborating our results from the Y2H screening.
The specificity of interaction between cyclin D3 and M2 was tested using a panel of exogenously expressed cyclins (cyclin D1, D2, D3, and E1). Although, M2 appears to interact with other cyclins to some degree when they are over-expressed, we consistently found that it has the strongest interaction with cyclin D3 (Figure 1E). IAV infection induces cyclin D3 relocalization and targets it for proteasomal degradation
To understand the functional relevance of cyclin D3-M2 interaction in virus infected cells, we tested their subcellular distribution through immunofluorescence imaging. To achieve unbiased analysis, A549 cells were infected with influenza A/WSN/33 virus at an MOI of 0.5 to have a mixed population of infected and uninfected cells in the same sample. Cells were fixed at 24 h post-infection (p.i.) and stained for cyclin D3 and M2 proteins. In uninfected cells, cyclin D3 resides both in the nucleus and cytoplasm with only the nuclear CDK4/6-cyclin D3 complex displaying retinoblastoma (Rb)-directed kinase activity (44). Interestingly, upon virus infection, a much weaker cyclin D3 signal was observed in the nuclei of infected cells compared to control cells, as revealed by M2 staining. These results suggest that cyclin D3 is redistributed from the nucleus to the cytosol as a response to infection (Figure 2A, upper panels). The effect of M2 protein on cyclin D3 relocalization was recapitulated in analogous experiments using A549 cells expressing M2 protein alone (Figure 2A,

Restriction of influenza infection by cyclin D3
5
lower panels), which resulted in the apparent reduction of cyclin D3 from the nucleus, similar to the phenotype induced by viral infection.
To address the reduction of cyclin D3 from the nucleus upon virus infection, we fractionated both control and infected cells into cytosol and nuclear material to measure cyclin D3 levels. Cytoplasm- and nuclear-enriched extracts were prepared from A/WSN/33-infected (MOI of 2 to achieve a more homogeneous infection of the cell culture) and uninfected A549 cells. Lamin B1 and GAPDH were used as markers to verify clear separation of nuclear and cytoplasmic fractions. Total intracellular level of cyclin D3 in virus-infected cells decreased to ~60% of that observed in mock-infected cells (Figure 2B; Figure 2C, upper panel). Densitometric analysis indicates that 10% of total cyclin D3 was found in the nucleus of uninfected cells. This is very likely an underestimation since cyclin D3, being soluble, would leak from the nuclear into the cytoplasmic fraction during the experimental procedures. The percentage of nuclear-cyclin D3 dropped to less than 4% at 8 h p.i. (Figure 2C, lower panel), indicating translocation of cyclin D3 from nucleus to cytoplasm in virus-infected cells. This significant (>60%) reduction of nuclear-cyclin D3 detected through biochemical measurement confirmed our immunofluorescence data on its subcellular relocalization.
We further verified colocalization of cyclin D3 with that of M2 through infection of A/WSN/33 in cyclin D3-expressing cells. Since at 24 h p.i. most of cyclin D3 is degraded, we selected an earlier time point and treated mock and virus-infected cells with MG-132 to increase the signal strength of cyclin D3. Indeed, at 15 h post infection, we could capture colocalization of influenza
M2 and cyclin D3 along the secretory pathway (Figure 2D). Most of cyclin D3 appeared in the cytosolic fraction under these conditions. Interaction of cyclin D3
with M2, combined with its enrichment in
the cytosol upon M2 expression strongly favors that this association must occur in the cytosol, either directly or as a complex presumably en route to assembly and release of intact progeny virions.
The induction of D-type cyclins is growth factor dependent, and both mRNAs and proteins exhibit moderate oscillations in continuously proliferating cell populations (37,38,45-48). Given the decrease in total intracellular cyclin D3 levels observed in virus-infected cells, we next addressed whether influenza virus modulates cyclin D3 protein levels in addition to altering its subcellular localization. The expression profiles of cyclin D3 and another cell cycle G1 phase regulator, cyclin E, were measured through immunoblotting. Cyclin D3 was dramatically downregulated by IAV infection to almost undetectable levels compared to uninfected cells at 24 h p.i. (Figure 3A, upper panel). A time-course analysis revealed that the steady-state levels of cyclin D3 started declining at 6 h p.i., and decreased by approximately 50% at 9 h p.i. (Figure 3A, lower panel). Cyclin E, which is activated at the late stage of cell cycle G1 phase to facilitate G1/S transition, displayed only a moderate reduction under identical conditions (Figure 3A), contrary to the finding by He et al where cyclin E was vastly downregulated by IAV infection (49). However, no quantitative analysis was provided in their study, preventing us from comparing the reduction level. It is worth noting that cyclin E exists as multiple proteins ranging in size from Mr35,000-50,000 in tumor cell lines as

Restriction of influenza infection by cyclin D3
6
illustrated by others (see also Figure 3, panel A) (50,51). However, only one band size of cyclin E was shown in their study, although the same cell type was used. The differential regulation of cyclin D3 and cyclin E indicates that IAV infection specifically deregulates components in the early G1 phase (G0/G1 phase) of the cell cycle machinery.
To further investigate the mechanism of virus induced cyclin D3 downregulation, we determined the involvement of the proteasomal degradation pathway in this process. Cells were infected with A/WSN/33 virus in the absence or presence of proteasome inhibitors, MG-101 or MG-132, and tested for cyclin D3 levels. MG-101, also known as calpain inhibitor I, inhibits both proteasome and calpain activities (52). Calpain is a calcium-dependent protease that produces limited proteolysis of its substrates. Resulting fragments are further degraded by other proteolytic pathways including proteasome (52). Calpain has been reported to regulate cyclin D1 at the posttranscriptional level (53). MG-132 is a proteasome inhibitor that prevents degradation of ubiquitin-conjugated proteins (54). Uninfected cells were treated with the same drugs to control for the baseline oscillation of cyclin D3 levels. Proteasome inhibition did not affect cyclin D3 abundance in uninfected cells; however, blocking proteasome activity led to a significant stabilization of cyclin D3 in virus-infected cells. MG-101 and MG-132 treatments blocked cyclin D3 degradation by ~50% and ~60% respectively, compared to vehicle control (DMSO) treated group, as measured by densitometric analysis of immunoblots (Figure 3B). Thus, an obvious rescue of cyclin D3 was observed after one round of infection (9 h p.i.) through the use
of proteasome inhibitors. The regulation of other cell cycle moderators and were also investigated. Although viral infection also resulted in cyclin D1, cyclin dependent kinase 4 (CDK4), and CDK6 downregulation on protein level (Figure 4A). The level of down regulation is not as robust as that of cyclin D3, and their protein levels could not be rescued by protease and calpain inbihitor when compared to cyclin D3 (Figure 4B). These suggest that IAV posts a cyclin D3 specific effect during infection.
Our data indicate that IAV infection results in reduced cyclin D3 levels in the nucleus of virus-infected cells. This phenotype is triggered by translocation of nuclear-cyclin D3 into the cytoplasm, where IAV facilitates proteasomal degradation of cytoplasmic-cyclin D3. Influenza A/WSN/33 virus infection arrests cell cycle in G1 phase
The principal role of the D-type cyclins is to act as growth factor sensors, converting environmental signals into fuel for the cell cycle engine. The interaction between cyclin D3 and M2-CT during viral life cycle implies a potential regulation of host cell cycle by IAV. This is supported by our observation that cyclin D3 is actively removed from the nucleus and degraded by the proteasome in virus-infected cells. To address whether the cell cycle is compromised, a quantitative profiling of cell cycle kinetics was performed on virus-infected A549 cells. Using an asynchronously growing cell population, we found that virus infected cells accumulated at the G1 phase when compared to uninfected group (data not shown). To reduce variability owing to a mixed population of cells in differential phases of the cell cycle, we first synchronized them

Restriction of influenza infection by cyclin D3
7
prior to infection in G1 using lovastatin, a fungal metabolite shown to affect cell cycle distribution in a reversible manner (55). Cells were released from the lovastatin block and stimulated with mevalonate at the time of infection to trigger progression into later cell cycle stages. BrdU incorporation and DNA content staining showed that virus infection brought about a cell cycle arrest at 9 h p.i. (Figure 5A). The overlay of cell cycle patterns of virus-infected and uninfected cells indicates that infection decreased the peaks representing cells in the S and G2/M phases (Figure 5B). The percentages of cells in G1 phase exhibited a progressive, time-dependent drop from 83.0 ± 2.1% to 80.1 ± 0.9%, and subsequently 45.7 ± 2.8% (at 0, 9, and 24 h p.i. respectively; means ± SD of three experiments) in the mock-infected samples. This reduction reflects progression of cells through the G1 phase, followed by entry into the later stages of the cell cycle. In contrast, cells infected by A/WSN/33 virus remained in G1 with percentage of cells in G1 phase hovering above 80% at all time points (Figure 5C). Our results demonstrate that IAV infection impairs progression of cell cycle through the G1/S intersection.
To further prove that IAV infection induced cell cycle arrest in the G1 phase, we took a separate approach. Cells were pre-accumulated in the G2/M phase by treating with RO-3306, a CDK1 inhibitor (56). At 0 h p.i., both A/WSN/33-infected and control samples had comparable percentages of cells in all phases of the cell cycle (Figure 5D). Similar to the result obtained with lovastatin, cell cycle pattern of virus-infected cells showed lower peaks for both S and G2/M phases when compared to uninfected cells (Figure 5E). Upon recovery of cells from drug restriction, both uninfected and infected cells resumed
division and initiated a new round of cell cycle, displaying increased percentage of cells representing G0/G1 phase at 9 h p.i.; only uninfected cells, however, progressed further into the S phase. The percentage of cells in G0/G1 phase dropped from around 85% to 65% in control sample, whereas it remained constant in IAV-infected cells (Figure 5F). Collectively, these results indicate that IAV infection perturbs normal cell cycle progression in human cell lines and installs a block at the G0/G1 phase.
D-type cyclins activate CDK4/6, which initiate phosphorylation of Rb at multiple sites. Hyperphosphorylated Rb (ppRb) releases transcription factor E2F, and leads to the activation and transcription of cell cycle progression responsive genes (38,57,58). To test whether IAV induced cell cycle arrest was imposed by Rb, the phosphorylation status of Rb was monitored. Phosphorylation on serine-780 (ppRb S780) is specifically catalyzed by cyclin D-CDK4/6 complex, but not cyclin E-CDK2 (59). Not surprisingly, IAV infection progressively resulted in diminished levels of ppRb S780 as a function of time (Figure 6A). Furthermore, serine-807/811 phosphorylation on Rb (ppRb S807/811), which affects the S phase of cell cycle displayed a similar trend (60) (Figure 6A), an observation consistent with the virus-induced block at the G0/G1 phase. In line with the downregulation of ppRb proteins, accumulation of hypo-phosphorylated Rb (pRb) was observed (Figure 6A).
Inhibition of cell cycle can also occur through induction of cyclin-dependent kinase inhibitors (CKIs). P21WAF1/CIP1 is a ‘universal’ CKI that inhibits both cyclin and CDK subunits to install a p53-dependent G1 phase arrest (61). Interestingly, upon infection p21WAF1/CIP1 was downregulated

Restriction of influenza infection by cyclin D3
8
through proteasomal degradation, indicating that IAV induced G0/G1 arrest was not mediated through the p53/p21WAF1/CIP1 pathway (Figure 6A and 6B). Expression levels of p16 from the INK4 family of CKI, which specifically inhibits the catalytic subunits of CDK4 and CDK6, were also measured. No increase in p16INK4A was observed even after prolonged infection time (data not shown).
From the results described above, we conclude that IAV infection downregulates cyclin D3 levels, which in turn inhibits CDK4/6 activation and ultimately results in reduced Rb phosphorylation. Consequently, pRb sequesters the transcription factor E2F, which prevents cell cycle entry into the S phase (58). Cyclin D3 negatively modulates influenza virus infection
To establish a functional relevance for cyclin D3 in IAV pathogenesis, we studied the effect of Ccnd3 knockdown on virus replication. To avoid off-target effects imposed by the use of siRNA pools, we used an individual siRNA duplex from published literature (CCND3 #1) for generating a knockdown (62). SiRNA CCND3 #1 effectively reduced endogenous cyclin D3 expression levels by over 90% at 72 h post transfection, compared to a nonspecific control siRNA (NT) (Figure 7A). Control (NT siRNA-treated) and cyclin D3-deficient cells were infected with A/WSN/33 at an MOI of 0.01 to allow multiple rounds of infection. Viral titers obtained from cyclin D3-deficient cells were at least 10-fold greater than that from control cells (Figure 7B, left panel). Since cyclin D3–M2 interaction was identified using avian M2-CT, we measured the effect of Ccnd3 knockdown on the replication of highly pathogenic H5N1 avian influenza
virus and observed a more than 10-fold higher progeny virus production in cyclin D3-deficient cells when compared to control group at 24 h p.i. (Figure 7B, right panel). The difference in production of H5N1 virus was less significant at 48 h p.i. (~2.5-fold), most likely due to the cytopathic effect of H5N1 virus in a limited cell culture system.
To differentiate whether the increased progeny virus titer was intrinsic to the absence of cyclin D3 protein or a consequence of cell cycle arrest induced by cyclin D3 silencing, we next used combinations of siRNAs targeting various steps in the cell cycle to modulate its progression. Concomitant knockdown of Ccnd3 and Rb1 rescued cells from the G0/G1 phase block imposed by cyclin D3-deficiency, allowing us to measure the effect of cyclin D3 alone on virus replication. In addition, we included a Ccne1 knockdown, which induced cell cycle arrest at the G1/S interface without affecting cyclin D3 levels. To gain further confidence in the specificity of the cyclin D3 siRNA, we included a second siRNA duplex specific for cyclin D3 (CCND3 #2). Both individual siRNAs and siRNA-combinations resulted in significant reduction of the desired gene expressions (Figure 7C). In control siRNA treated cell population, around 55% percent cells were found in G0/G1 phase of the cell cycle. As expected, knockdown of Ccnd3 alone arrested cell cycle progression in A549 cells with ~65% (CCND3 #1) or ~70% (CCDN3 #2) cells in G0/G1 phase when compared to cells treated with NT siRNA. A concomitant Ccnd3/Rb1 knockdown rescued cell cycle progression into the S phase. Knockdown of Ccne1 expression in A549 cells induced a more robust cell cycle G0/G1 phase accumulation than Ccnd3 knockdown with ~80% cells in G0/G1 phase (Figure 7D). For all siRNA-mediated

Restriction of influenza infection by cyclin D3
9
knockdowns, cells were subjected to infection with A/WSN/33 virus at an MOI of 0.01 at 72 h post transfection for progeny virus production. Ccnd3 knockdown with the two individual siRNA duplexes increased progeny virus titers by approximately one log. Despite the rescue in cell cycle progression, a double knockdown of Ccnd3/Rb1 did not normalize virus production when compared to NT siRNA treated cells. A 5-fold difference in viral titers persisted between control cells compared to those that harbored a double knockdown in Ccnd3/Rb1. Virus titers from cells with Ccne1 knockdown were comparable to that from Ccnd3/Rb1 double knockdown (Figure 7E, left panel).
To study whether the inhibitory role of cyclin D3 on viral replication is also applicable to the other IAV strains, two clinical isolates were tested. At both 24 and 48 h p.i., equivalent or higher virus titers for influenza A/HK/1/68 (H3N2) and A/HK/54/98 (H1N1) viruses confirmed our results with A/WSN/33 (Figure 7E, middle and right panels).
To examine the distribution of D-type cyclins in the context of natural infection, we determined their expression in the human airway, in particular, human bronchial epithelial cells (HBEC) and pneumocytes. Although cyclin D3 mRNA was expressed at lower levels compared to the other two D-type in both cell types (Figure 8A), comparable protein amounts of cyclin D3 were detected in A549, HBEC, and pneumocytes (Figure 8B). Cyclin D2 expression could be detected in the two primary cells but not in A549 (Figure 8B). Collectively, cyclin D3 is expressed in tissues along the natural infection route of IAV. To validate its functional relevance in these cells, we performed a knock-down of cyclin D3 in HBECs to study its effect on
influenza virus production. As observed with A549 cells, cyclin D3-deficiency in HBEC resulted in ~10-fold increase in viral titers, supporting our conclusions from experiments performed in actively dividing cells (Figure 8C, 8D).
Cyclin D3 inhibits M2 and M1 interaction, but not viral protein synthesis
To understand the mode of cyclin D3-imposed restriction of IAV production, we first measured whether viral protein synthesis was affected by cyclin D3. To separate the effect of cyclin D3-deficiency from cell cycle arrest, we used the Ccnd3/Rb1 double knockdown. Multiple time points were selected to measure viral protein synthesis within a single cycle of infection. Knockdown cells did not display enhanced viral protein synthesis compared to control cells (Figure 9), suggesting that the effect of cyclin D3 on IAV infection probably occurred at a later step post viral protein translation.
The biogenesis of viral particles involves proper packaging and assembly of viral proteins and RNA to form intact virions at discrete budding sites. M2 is a multifunctional protein: its cytosolic tail interacts with M1, promoting the recruitment of viral internal proteins and vRNA to the plasma membrane for efficient virus assembly (27). We postulated that binding of cyclin D3 to M2-CT might affect M1–M2 interaction, resulting in attenuated virus release due to either i) production of defective virus particles due to improper packaging or ii) incomplete assembly of virions and hence generation of fewer particles. To test this hypothesis, HEK 293T cells were co-transfected with cyclin D3, M1, and M2. Cells expressing M1 and M2 without exogenous cyclin D3 were used as

Restriction of influenza infection by cyclin D3
10
control. For both conditions, M1–M2 binding was detected through co-immunoprecipitation followed by immunoblotting (Figure 10A, left panel, lane 1). Upon over-expression of cyclin D3, the level of M1 that co-precipitated with M2 was significantly lower than the amount obtained in the absence of cyclin D3 (Figure 10A, left panel, lane 2). Densitometric analysis revealed that a reduction of approximately 70% in binding of M1 to M2 was observed when cyclin D3 was over-expressed (Figure 10A, right panel). An isotype control antibody used in parallel did not bind to M1 (Figure 10A, left panel, lane 3). Our results demonstrate that: i) cyclin D3 does not affect viral protein synthesis during IAV life cycle and ii) interaction between M1 and M2 is significantly attenuated in the presence of cyclin D3. We propose that through competition with M1 for M2 binding, cyclin D3 restricts IAV production either through reduced or defective progeny virion formation.
To test this hypothesis, cyclin D3-deficient cells and control cells were infected with A/WSN/33 to measure plasma membrane expression of viral M2 protein within one cycle of infection. As illustrated in figure 6C, more M2 was detected at the plasma membrane in cyclin D3-deficient cells. This suggests that without the blockage imposed by cyclin D3, greater amount of M2 could reach the cell surface and/or at a faster pace, thus facilitating the recruitment of viral internal components to the plasma membrane for assembly and budding. This trend could be observed at both time intervals as summarized in figure 10B. In addition, we could validate these results using confocal imaging. Overexpression of cyclin D3 resulted in both M1 and M2 being predominantly
confined to the early secretory network compared to control cells with endogenous cyclin D3 levels, where a significant fraction of M2 appeared at the plasma membrane (Figure 10C). Interestingly, although absence of cyclin E1 (a weak interactor of M2), facilitates IAV progeny virus production, this effect occurs through a different mechanism as M2 surface expression remained unaffected in cells depleted of cyclin E1 (data not shown).
DISCUSSION
The search for the interactome of M2 protein of IAV in host cells has been limited so far. Host proteins that M2 has been shown to exploit include Na+/K+-ATPase, heat shock protein 40 (Hsp40), and p58IPK
(IPK, inhibitor of protein kinase) (63-67). In addition, the amphipathic helix located within the M2-CT binds to cholesterol and alters the local membrane curvature at the budding zone while providing a scaffold for M1 polymerization and filament elongation (68). Withdrawal of cholesterol or disruption of the M2 amphipathic helix inhibits viral filament formation (25). We previously identified annexin A6 as a novel interactor with the M2-CT, which impairs budding and release of IAV at late stages of the virus life cycle (69). More recently, M2 was found to interact with the ATG8/LC3 family of ubiquitin-related proteins residing on the autophagosomal membranes (70,71). A highly conserved LC3-interacting region (LIR) in M2 promoted binding and relocalization of LC3 to the plasma membrane. This mechanism allowed subversion of autophagy and facilitated inter-organism viral transmission by enhancing the stability of progeny virions.
In the present study, we identified cyclin D3 as a novel interactor of IAV-M2 and systematically studied its role in the context

Restriction of influenza infection by cyclin D3
11
of IAV infection. Being a key regulator of cell cycle progression, Ccnd3 knockdown by default leads to cell cycle G0/G1 phase arrest, providing a favorable environment for IAV replication. Our results indiciate that cyclin D3 functions beyond its role in cell cycle in the context of influenza infection. The absence of cyclin D3 in combination with accumulation of cell cycle in G1 phase appear to have an additive effect on IAV progeny virus production indicating that cyclin D3-deficiency specifically facilitates influenza virus production independently of the cell cycle. Instead, co-immunoprecipitation with M2 suggests that cyclin D3 impairs nascent virus production at a late stage of the virus life cycle by interfering with M1-M2 binding (Figure 11). Our results illustrate yet another mechanism that IAV has evolved to counteract host defenses: cyclin D3 is redistributed from the nucleus to the cytoplasm, where it is targeted for proteasomal degradation. Indeed, mislocalization and subsequent downregulation of restriction factors is one of the recurring mechanisms viruses have adopted to overcome host defenses (72). The presence of M2 traps cyclin D3 in the cytoplasm through two possible mechanisms: i) M2 interacts with newly synthesized cyclin D3 and prevents it from translocating into the nucleus, or ii) cyclin D3 is retained by M2 in the cytoplasm after its nuclear export. A detailed mechanism of how cyclin D3 is targeted to the proteasome complex and which E3-ligase ubiquitylates it will be pursued in future investigations. Downregulation of cyclin D3 transcript was previously observed in H5N1 infected cells but its implication had not been addressed (73). Our study has expanded the repertoire of IAV-M2 host interactors, and proposes a novel function of cyclin D3 in the life cycle
of IAV. Manipulation of the cell cycle machinery
has been adopted by many viruses as a common strategy. For instance, HIV-1 accessory protein Vpr is reported to induce arrest in G2 by activating protein phosphatase 2A (PP2A), which acts on mitosis inhibitors Wee1 kinase and Cdc25 phosphatase (74). Similar to our findings, some other viral proteins have been found to bind members of the cyclin family. Persistent infection with borna disease virus (BDV) results in reduced G2 to M progression(75). Likewise, the nucleoprotein of SARS-CoV inhibits the activity of CDK4 by binding to cyclin D, which blocks S phase progression (76). Viral proteins associate with particular cell cycle components, thereby deregulating the host cell cycle clock to alter the environment for more efficient replication. It remains to be determined whether M2-cyclin D3 interaction inhibits the kinase activity of CDK4/6 after IAV infection. A cell cycle arrest in G0/G1 by IAV infection was first reported by He et al, although this phenomenon was not investigated in mechanistic terms (49). The non-structural protein 1 (NS1) of IAV was later discovered to interact with and inhibit the activity of the Ras homolog gene family member A (RhoA), providing some molecular insights into the mechanism of IAV-induced cell cycle perturbation (77). The present study quantitatively demonstrated that IAV infection imposes a specific G0/G1 arrest, and established cyclin D3 mislocalization and degradation following its interaction with M2 as the underlying molecular correlate.
Co-evolution and adaptation of virus-host interactions is best described as a zero-sum biological arms race. However, owing to high mutation rates, viruses such

Restriction of influenza infection by cyclin D3
12
as influenza are well equipped to rapidly evolve strategies to evade host restriction factors. Consequently, in case of IAV infection, the effect of cyclin D3 is successfully antagonized by M2, which redirects cyclin D3 from the nucleus to the cytosol followed by proteasomal degradation, thereby granting an advantage to virus production.
Our study provides important insights into the mechanism through which cyclin D3 restricts IAV infection. We demonstrated that the increase in progeny virus production upon Ccnd3 knockdown was not a result of enhanced viral protein synthesis in host cells. Instead, the inhibitory effect of cyclin D3 on IAV infection is due to its interaction with viral M2 protein, as measured by competitive co-immunoprecipitation assays. We hypothesize that cyclin D3-M2 interaction either masks the domain on M2 mediating
binding to M1, or has a higher affinity than that between M1-M2. Another possibility is that cyclin D3-M2 interaction sequesters the amount of available M2. Consequently, limited-M1–M2 binding during the budding process of IAV infection results in less progeny virions being efficiently packaged and released from host cells. Several host factors have been identified that interfere with the late stage of viral life cycle, among which tetherin (also known as BST-2) is the best characterized. In addition, interferon-stimulated gene (ISG) products are a group of newly emerging host restriction factors that can control viral, bacterial, and parasite infection as exemplified by viperin and ISG15 to name a few (78-81). The current study includes cyclin D3 in the family of IAV budding inhibitors, and provides insights into the dynamic interplay between cyclin D3 and M2 during IAV infection.
EXPERIMENTAL PROCEDURE Yeast two-hybrid screening
Influenza A virus M2-CT (A/Goose/Guangdong/1/96; GeneBank access no. 81975894) was used as bait to screen for interactors from a random-primed human placenta cDNA library, which contains 10 million independent fragments. The cloning of bait and Y2H screening were performed by Hybrigenics (Paris, France). Briefly, M2-CT was fused with the LexA binding domain by subcloning it into the pB27 vector. The L40ΔGAL4 yeast strain was then transformed with pM2-CT bait plasmid and mated with Y187 yeast strain transformed by the prey library (82). Clone selection was performed on leucine, tryptophan, and histidine drop-out medium, and 273 positive diploids were picked. Identified prey fragments were then subjected to PCR and sequencing. After
going through filtration and being divided into contigs, sequences were compared to the most updated Genbank database by using BLASTN to decode interactions. All interactions were assigned with computative confidence scores to assess interaction reliability (83). Cells and viruses
Human alveolar basal epithelial (A549), human embryonic kidney (HEK 293T), and Madin-Darby canine kidney (MDCK) cells were purchased from ATCC. Human bronchial epithelial cells (HBEC) and primary pneumocytes were kindly donated by Dr. Michael Chi Wai Chan from School of Public Health, the University of Hong Kong. Dulbecco’s modified Eagle’s medium (DMEM) (Invitrogen) supplemented with 10% fetal bovine serum (FBS), 100U/ml penicillin and 100μg/ml

Restriction of influenza infection by cyclin D3
13
streptomycin (Invitrogen) was used to culture and maintain all cell types used.
Influenza A virus strains A/WSN/33 (H1N1), A/HK/1/68 (H3N2), A/HK/54/98 (H1N1), and A/Vietnam/1203/2003 (H5N1) were propagated in MDCK cells supplemented with 0.3% bovine serum albumin (BSA) (Sigma-Aldrich) in the presence of 1 μg/ml tosylsulfonyl phenylalanyl chloromethyl ketone (TPCK)-treated trypsin (Thermo Scientific), and stored as virus stocks at -80ºC until further use. Viral titers were obtained by plaque assay on MDCK cells. Briefly, serial 10-fold dilutions of virus stocks were adsorbed onto a confluent monolayer of MDCK cells for 1 h at 37 ºC. Next, viral inoculums were removed and cells were washed twice with phosphate-buffered saline (PBS), pH 7.4. Cells were then covered with 1% semisolid agar in DMEM complemented with 0.3% BSA and 1 μg/ml TPCK-treated trypsin. Three days after incubating the plates in an upside down manner, plaques were visualized by staining with crystal violet (84). Plasmids and antibodies
Plasmid pCMV6-Flag-CCND3 was generated by subcloning the CCND3 open reading frame (ORF) (Homo sapiens, GenBank accession NM_001760.4) from plasmid pCMV6-CCND3-GFP (Origene Technologies) into the pCMV6-Entry vector at the Mlul and Sgfl restriction sites. Plasmid pCAGGS-M2-Flag, pCAGGS-M1-HA and rabbit anti-M1 pAb were kindly donated by Prof Adolfo García-Sastre (Icahn School of Medicine at Mount Sinai).
The following primary antibodies were used in this study: mouse anti-cyclin D3 monoclonal antibody (mAb) (clone DCS22) was purchased from Cell Signaling
Technology; mouse anti-cyclin E mAb (clone HE12), mouse anti-influenza A M2 mAb (clone 14C2), mouse anti-influenza A M1 mAb (clone GA2B), rabbit anti-p21 polyclonal antibody (pAb) were purchased from Santa Cruz Biotechnology; mouse anti-influenza A M2 mAb (clone 14C2) was purchased from Thermo Scientific; mouse anti-flag mAb (clone M2) and mouse anti-c-myc mAb (clone 9E10) were purchased from Sigma-Aldrich; mouse anti-human hypophosphorylated retinoblastoma (pRb) mAb (clone G99-549), mouse anti-Rb (ppRb S780) mAb (clone J146-35), mouse anti-Rb (ppRb S807/S811) mRb (clone J112-906) were purchased from BD Biosciences; rabbit anti-cyclin D3 mAb (clone EP463E), mouse anti-influenza A nucleoprotein mAb (clone AA5H), mouse anti-lamin B1 mAb (clone ZL-5), mouse anti-GAPDH mAb (clone 6C5) were purchased from Abcam; Texas Red-conjugated goat anti-rabbit IgG (H+L) (pAb), FITC-conjugated goat anti-mouse IgG (H+L) (pAb) were purchased from Life Technologies. GST pull-down
A DNA fragment encoding the M2 gene of influenza virus A/WSN/33 strain was cloned into the pGEX4T-1 vector and expressed in Escherichia coli strain BL21. The resulting GST fusion protein was purified with glutathione-Sepharose beads (GE Healthcare) and added to A549 cell lysates. The empty vector expressing GST alone was used as negative control. After overnight incubation, beads were collected by centrifugation and washed five times to remove nonspecific binding. Bound proteins were resolved by sodium dodecyl sulfate-polyacrylamide gel electrophoresis (SDS-PAGE) and immunoblotting with indicated antibodies.

Restriction of influenza infection by cyclin D3
14
Co-immunoprecipitation
HEK 293T cells were transfected with pCMV6-Flag-c-Myc-CCND3 plasmid in a 10 cm dish. At 48 h post transfection, cells were infected with influenza A/WSN/33 strain at a multiplicity of infection (MOI) of 2 for 6 h before being lysed in buffer containing 50 mM Tris (pH7.4), 150 mM sodium chloride, 1% Triton X-100, 0.5% sodium deoxycholate, 1 mM EDTA, and protease inhibitors (Roche). Cell extracts were cleared by centrifugation and supernatant was incubated with anti-flag or isotype control antibody overnight at 4ºC. Protein G Sepharose beads (GE Healthcare) were then used to recover the immune complexes from whole cell lysates. Immunoprecipitated samples were washed five times with lysis buffer before being resolved by SDS-PAGE and detection by Western blotting. Interaction specificity study was performed in HEK 293T cells trasfected with plasmid encoding either one of c-Myc-tagged cyclin D1, D2, D3, or E1 and targeted to similar treatment as described above for co-immunoprecipitation experiments.
For competitive binding assays, HEK
293T cells were co-transfected with pCAGGS-M1-HA and pCAGGS-M2-Flag plasmids, or with pCAGGS-M1-HA, pCAGGS-M2-Flag along with pCMV6-Flag-cMyc-CCND3 plasmids in 10 cm dishes. Bulk cell lysates were prepared as described above at 48 h post transfection. Cleared cell extracts were incubated with anti-M2 (Santa Cruz) or isotype control antibody overnight at 4ºC, followed by recovery of the immune complexes from whole cell lysates using protein G Sepharose beads. Immunoprecipitated samples were washed six times with lysis
buffer before being resolved by SDS-PAGE and detection by Western blotting. Synchronization of cells
Lovastatin was used to synchronize cells in G1 phase. Briefly, culture medium was removed 24 h after the initial plating of A549 cells and replaced with fresh complete medium containing 40 μM lovastatin (Sigma-Aldrich). Cells were incubated in lovastatin for 22 h to achieve cell cycle G0/G1 phase synchronization prior to other experimental procedure. At time 0 hour, cells were allowed to re-enter cell cycle progression by replacing the medium with fresh complete medium supplemented with 4 mM mevalonolactone (Sigma-Aldrich). The synchronization of cells at the G2/M transition by RO-3306 was as follows: at 24 h following plating A549 cells, medium was replaced with fresh complete medium containing 4 μM RO-3306 (Calbiochem) and incubated for 18 h. Cells were then washed for three times with PBS and cultured in fresh complete medium to promote cell cycle progression. Cell cycle analysis
Cell cycle profiles were analyzed by bromodeoxyuridine (BrdU) incorporation and DNA content staining. Briefly, pre-synchronized A549 cells were infected at an MOI of 2 with influenza A/WSN/33 strain or mock infected. Immediately prior to collection, cells were incubated in 10 μM BrdU (Invitrogen) for one hour and fixed overnight in 70% ethanol at -20ºC. BrdU-pulsed cells were rescued from ethanol and denatured by 2 M hydrochloric acid with 0.5% Triton X-100 for 30 min at room temperature, followed by neutralization with 100 mM borate buffer (pH 8.5). BrdU labeling was revealed with Alexa Fluor 647 conjugated BrdU mouse

Restriction of influenza infection by cyclin D3
15
mAb (clone MoBU-1; Invitrogen). Total DNA content was measured by 7-amino-actinomycin D (7-AAD; BD PharMingen) staining. Cells were then immediately analyzed on a BD LSR II flow cytometer (BD Immunocytometry Systems). Approximately 30,000 cells were acquired for each sample and data were analyzed using FlowJo software (Treestar). Protein analysis and proteasome inhibition assay
A549 cells were infected with A/WSN/33 virus at an MOI of 2 or mock infected. At various time points after infection, cells were washed twice with ice-cold PBS and lysed in buffer containing 50 mM Tris (pH7.4), 150 mM sodium chloride, 1% Triton X-100, 0.5% sodium deoxycholate, 1 mM EDTA, and protease inhibitors. After end-to-end rotation at 4ºC for 1 h to facilitate lysis, cell lysates were cleared by centrifugation at 20817 g/min for 30 min at 4ºC. Whole cell lysates were further boiled at 95ºC for 10 min in 1X sample loading dye and 50mM DTT before being subjected to SDS-PAGE.
To block ubiquitin mediated protein degradation, A/WSN/33 virus-infected (MOI of 2) or mock-infected A549 cells were incubated in fresh medium containing either 40 μM MG-101 (Sigma-Aldrich) or 5 μM MG-132 (Sigma-Aldrich) at the start of infection. DMSO (Sigma-Aldrich) containing medium was used as vehicle control in this experiment. Whole cell lysates were collected 9 h after infection as described above. Subcellular fractionation
For cell fractionation, A549 cells were infected at an MOI of 2 with influenza A/WSN/33 virus. At 8 h post-infection (p.i.), cells were washed twice with ice-cold PBS
and lysed on dish with ice-cold buffer containing 25 mM Tris (pH7.4), 5 mM magnesium chloride, 150 mM sodium chloride, and 0.1% Triton X-100. Permeabilized cells were collected with a rubber policeman, and transferred into Eppendorf tubes. After a very brief incubation, supernatant (cytoplasm-enriched) and pellet (nuclear-enriched) fractions were separated upon centrifugation at 20817 g/min for 30 sec at 4ºC. The nuclear fraction was then solubilized in buffer containing 25 mM Tris (pH 7.4), 5 mM magnesium chloride, 150 mM sodium chloride, and 1% SDS. DNA shredder was used to process the nuclear fractions to shear the genomic DNA for easier SDS-PAGE gel loading of the samples. Sample loading dye and DTT at final concentration 1X and 50mM respectively was added into the lysate before boiling at 95ºC for 10 min.
Colocalization assays To capture subcellular colocalization between influenza M2 and cyclin D3, A549 cells were transfected with a wild-type cyclin D3 plasmid (pCMV6-CCND3-cherry). 24 hours post transfection, cells were either mock or virus-infected with A/WSN/33 at a MOI 2. Cells were maintained in medium supplemented with 5µM MG132 for the duration of infection. 15 hours post-infection cells were collected for immunofluorescence assay. To determine effect of cyclin D3 on co-localization between influenza M1 and M2, A549 cells were transfected with either an empty vector or cyclin D3 (pCMV6-Flag-CCND3). 24 hours post transfection, cells were infected with influenza A/WSN/33 at a MOI 2. 10 hours post-infection, cells were collected for staining and confocal imaging of influenza

Restriction of influenza infection by cyclin D3
16
M1 and M2. Immunofluorescence assay
A549 cells were plated onto glass coverslips one day prior to transfection or infection. Cells were washed with PBS and fixed in 4% paraformaldehyde (PFA) for 15 min at the end of the experiments. Coverslips were incubated in 50 mM ammonium chloride for 10 min to quench the auto fluorescence of PFA before being permeabilized in PBS containing 0.1% Triton X-100 for 10 min. Cyclin D3 was stained with rabbit anti-cyclin D3 mAb (EP463E), followed by incubation with FITC-conjugated goat anti-rabbit IgG. The viral M2 protein was visualized by labeling with mouse anti-M2 mAb (14C2), followed by staining with Texas Red-conjugated goat anti-mouse IgG. The viral M1 protein was visualized by labeling with rabbit anti-M1 pAb, followed by FITC-conjugated goat anti-rabbit IgG. After washing with PBS, coverslips were incubated with DAPI for nucleus staining and mounted in mowiol on glass slides. Images were acquired with a Zeiss LSM 700 confocal fluorescence microscope at the Faculty Imaging Core Facility of the University of Hong Kong. RNA interference and virus infection
All gene-specific siRNAs were purchased from Dharmacon (Dharmacon Research). Individual siRNA against the 5’-AAGGAUCUUUGUGGCCAAGGA-3’ sequence (62) or 5’-UGCGGAAGAUGCUGGCUUA-3’ (D-003212-08) sequence of human cyclin D3 transcript and the non-targeting siRNA (D-001210) were used. SiRNAs for human cyclin E1 transcript (M-003213), human Rb1 transcript (M-003296) were provided as an siGENOME SMARTpool containing a mixture of four siRNAs targeting different
sites of a single gene. A549 cells were transfected with siRNAs (final concentration of 100 mM for each gene) by using DharmaFECT 1 Transfection Reagent according to the manufacturer's protocol. Cells were sub-cultured 48 h post-transfection to avoid potential cell cycle arrest induced by over confluence.
To study the effect of gene knockdown on influenza progeny virus production, siRNA-treated A549 cells or HBECs were infected with influenza viruses 24 h after seeding at an MOI of 0.01 in DMEM containing 0.3% BSA (Sigma-Aldrich), in the presence of 0.1 μg/ml TPCK-treated trypsin (Thermo Scientific). Supernatants were collected at 24 and 48 h p.i. and the progeny virus titers were obtained by plaque assay as described above. Separate wells without infection were used to determine the knockdown efficiency by Western blotting.
The effect of siRNA treatment on influenza viral protein expression was investigated in cells prepared as described above. Cells were infected with A/WSN/33 virus at an MOI of 2 and supplied with fresh cell culture medium containing 10% FBS and 100U/ml penicillin and 100μg/ml streptomycin after removing the virus inoculums. Whole cell lysates were prepared from individual wells at 3, 6, 9, and 12 h p.i. for Western blotting analysis.
Cyclin D3-specific siRNA-treated and control A549 cells were infected at an MOI of 1 with A/WSN/33 virus to study the effect of cyclin D3 reduction on M2 plasma membrane expression. In order to synchronize viral entry, cells were incubated with virus at 4ºC for one hour, and replaced with pre-warmed fresh cell culture medium. Virus-infected cells were collected and fixed at 6 and 8 h p.i. for surface M2 expression detection using anti-M2 mAb (Thermo Scientific) followed by FITC-conjugated

Restriction of influenza infection by cyclin D3
17
secondary antibody without permeabilization. Cells were then immediately analyzed on a BD LSR II flow cytometer (BD Immunocytometry Systems). Approximately 30,000 cells were acquired for each sample and data were analyzed using FlowJo software (Treestar). Absolute quantitative RT-PCR
Gene expression patterns were determined by two step RT-PCR reactions. Briefly, total RNA was isolated from around 1X10⁵ HBEC and pneumocytes using RNeasy plus kit in combination with QIAshredder (Qiagen). Complementary DNA (cDNA) was then generated from the total RNA using SuperScript III First-Strand Synthesis System (Invitrogen) according to the manufacture’s recommendation. The cDNA product was used undiluted for HBEC or twenty-fold diluted for pneumocytes. Serial dilutions of plasmids of cyclin D1, D2, D3, and E1 with known gene copy numbers were used to generate standard curves for absolute quantification of the desired gene expression. The real-time PCR reactions were performed in 25 μl reactions containing fluorigenic Taqman probe at a final concentration of 400 nM together with 800 nM of each primer, and 12.5 μl 2X Probe Master (Roche). The assays were performed on the LightCycler 480 II (Roche) with thermal cycling conditions of 10 min at 95 ºC followed by 40 cycles of 95 ºC for 10 s, 60 ºC for 1 min, and 72 ºC for 1 s. Each sample was quantified in triplicate for each
experiment. Primers and probes were: 5′-CTGTCCTACTACCGCCTCACA-3′ (forward), 5′-GCCTTGGGGTCCATGTTCT-3′ (reverse), and 5′-(FAM)CCAGAGTGATCAAGTGTGACCCAGACTGCC(TAMRA)-3′ (Taqman probe) for cyclin D1 (85); 5′-GGGAACTGGTGGTGCTGG-3′ (forward), 5′-TGGGTACATGGCAAACTTAAAGTC-3′ (reverse), and 5′-(FAM) AAGCTGTCTCTGATCCGCAAGCATGC(TAMRA)-3′ (Taqman probe) for cyclin D2 (85); 5′-TCCGGGGATGAGCTCACAGA-3′ (forward), 5′-GGCTCTCCCTGAGTGCAGCTT-3′ (reverse), and 5′-(FAM)TGGCAGGGATCACTGGCACTGAAGTGGACT(TAMRA)-3′ (Taqman probe) for cyclin D3 (85); 5’-GAAGATGATGACCGGGTTTAC-3’ (forward), 5’-GAGCCTCTGGATGGTGCAA-3’ (reverse), and 5’-(FAM)CAAACTCAACGTGCAAGCCTCGGAT(TAMRA)-3’ (Taqman probe) for cyclin E1 (86). Statistical analysis
Results are shown as mean ± standard deviation (SD) of the indicated number of experiments. Statistical difference between groups was determined by the unpaired Student’s t-test or two-way ANOVA, with a 0.05 significance level.
ACKNOWLEDGEMENTS
We are grateful to Prof. Peter Sicinski (Dana Farber Cancer Institute) for helpful discussions. We thank Prof. Adolfo García-Sastre and Dr Randy Albrecht (Icahn School of Medicine at Mount Sinai), and Dr. Monique Gannage (University of Geneva) for providing reagents. We thank Dr. Siwanon Jirawatnotai (Dana Farber Cancer Institute & Mahidol

Restriction of influenza infection by cyclin D3
18
University) and Dr. Lijun Liu (Dana Farber Cancer Institute) for critical insights and suggestions. Many thanks to Dr. Jing Guo and to the Core Imaging Facility and Electron Microscopy Unit of the LKS Faculty of Medicine of the University of Hong Kong for help with the confocal microscope. This work was supported by the Research Fund for the Control of Infectious Diseases (Grant RFCID 11101332) and the Area of Excellence Scheme of the University Grants Committee (Grant AoE/M-12/06) and partially supported by grants from the Research Grants Council of the Hong Kong Special Administrative Region, China (Project No. T11-705/14N & 17113915). The authors declare that they have no conflicts of interest with the contents of this article.
AUTHOR CONTRIBUTIONS FY designed, performed, and analyzed the experiments. CM performed the H5N1 experiment in Figure 7. MC prepared the HBEC and pneumocyte samples. YZ and FK provided technical assistance and contributed to the preparation of the figures. BN designed and supervised part of the experiments. RB and SS assisted FY analyzed the data and wrote the manuscript with input from all the other authors. REFERENCES 1. World Health Organization. Influenza (seasonal) Fact Sheet.
http://www.who.int/mediacentre/factsheets/fs211/en/ (accessed Feb 08, 2017). 2. Stoof, J. C., Booij, J., Drukarch, B., and Wolters, E. C. (1992) The anti-parkinsonian drug
amantadine inhibits the N-methyl-D-aspartic acid-evoked release of acetylcholine from rat neostriatum in a non-competitive way. European journal of pharmacology 213, 439-443
3. Wallensten, A., Oliver, I., Lewis, D., and Harrison, S. (2009) Compliance and side effects of prophylactic oseltamivir treatment in a school in South West England. Euro Surveill 14, 19285
4. Hayden, F. G., and Hay, A. J. (1992) Emergence and transmission of influenza A viruses resistant to amantadine and rimantadine. Current Topics in Microbiology and Immunology 176, 119-130
5. Hao, L., Sakurai, A., Watanabe, T., Sorensen, E., Nidom, C. A., Newton, M. A., Ahlquist, P., and Kawaoka, Y. (2008) Drosophila RNAi screen identifies host genes important for influenza virus replication. Nature 454, 890-893
6. Brass, A. L., Huang, I. C., Benita, Y., John, S. P., Krishnan, M. N., Feeley, E. M., Ryan, B. J., Weyer, J. L., van der Weyden, L., Fikrig, E., Adams, D. J., Xavier, R. J., Farzan, M., and Elledge, S. J. (2009) The IFITM proteins mediate cellular resistance to influenza A H1N1 virus, West Nile virus, and dengue virus. Cell 139, 1243-1254
7. Shapira, S. D., Gat-Viks, I., Shum, B. O., Dricot, A., de Grace, M. M., Wu, L., Gupta, P. B., Hao, T., Silver, S. J., Root, D. E., Hill, D. E., Regev, A., and Hacohen, N. (2009) A physical and regulatory map of host-influenza interactions reveals pathways in H1N1 infection. Cell 139, 1255-1267
8. Konig, R., Stertz, S., Zhou, Y., Inoue, A., Hoffmann, H. H., Bhattacharyya, S., Alamares, J. G., Tscherne, D. M., Ortigoza, M. B., Liang, Y. H., Gao, Q. S., Andrews, S. E., Bandyopadhyay, S., De Jesus, P., Tu, B. P., Pache, L., Shih, C., Orth, A., Bonamy, G., Miraglia, L., Ideker, T., Garcia-Sastre, A., Young, J. A. T., Palese, P., Shaw, M. L., and Chanda, S. K. (2010) Human host factors

Restriction of influenza infection by cyclin D3
19
required for influenza virus replication. Nature 463, 813-817 9. Karlas, A., Machuy, N., Shin, Y., Pleissner, K. P., Artarini, A., Heuer, D., Becker, D., Khalil, H.,
Ogilvie, L. A., Hess, S., Maurer, A. P., Muller, E., Wolff, T., Rudel, T., and Meyer, T. F. (2010) Genome-wide RNAi screen identifies human host factors crucial for influenza virus replication. Nature 463, 818-U132
10. Mayer, D., Molawi, K., Martinez-Sobrido, L., Ghanem, A., Thomas, S., Baginsky, S., Grossmann, J., Garcia-Sastre, A., and Schwemmle, M. (2007) Identification of cellular interaction partners of the influenza virus ribonucleoprotein complex and polymerase complex using proteomic-based approaches. Journal of Proteome Research 6, 672-682
11. Dove, B. K., Surtees, R., Bean, T. J., Munday, D., Wise, H. M., Digard, P., Carroll, M. W., Ajuh, P., Barr, J. N., and Hiscox, J. A. (2012) A quantitative proteomic analysis of lung epithelial (A549) cells infected with 2009 pandemic influenza A virus using stable isotope labelling with amino acids in cell culture. Proteomics 12, 1431-1436
12. Huarte, M., Sanz-Ezquerro, J. J., Roncal, F., Ortin, J., and Nieto, A. (2001) PA subunit from influenza virus polymerase complex interacts with a cellular protein with homology to a family of transcriptional activators. J Virol 75, 8597-8604
13. Shoemaker, J. E., Fukuyama, S., Eisfeld, A. J., Muramoto, Y., Watanabe, S., Watanabe, T., Matsuoka, Y., Kitano, H., and Kawaoka, Y. (2012) Integrated network analysis reveals a novel role for the cell cycle in 2009 pandemic influenza virus-induced inflammation in macaque lungs. BMC systems biology 6, 117
14. Loveday, E. K., Svinti, V., Diederich, S., Pasick, J., and Jean, F. (2012) Temporal- and strain-specific host microRNA molecular signatures associated with swine-origin H1N1 and avian-origin H7N7 influenza A virus infection. J Virol 86, 6109-6122
15. Parnell, G., McLean, A., Booth, D., Huang, S., Nalos, M., and Tang, B. (2011) Aberrant cell cycle and apoptotic changes characterise severe influenza A infection--a meta-analysis of genomic signatures in circulating leukocytes. PLoS One 6, e17186
16. Hale, B. G., Randall, R. E., Ortin, J., and Jackson, D. (2008) The multifunctional NS1 protein of influenza A viruses. Journal of General Virology 89, 2359-2376
17. Ludwig, S. (2009) Targeting cell signalling pathways to fight the flu: towards a paradigm change in anti-influenza therapy. J Antimicrob Chemother 64, 1-4
18. Jorba, N., Juarez, S., Torreira, E., Gastaminza, P., Zamarreno, N., Albar, J. P., and Ortin, J. (2008) Analysis of the interaction of influenza virus polymerase complex with human cell factors. Proteomics 8, 2077-2088
19. Zebedee, S. L., and Lamb, R. A. (1988) Influenza A virus M2 protein: monoclonal antibody restriction of virus growth and detection of M2 in virions. J Virol 62, 2762-2772
20. Holsinger, L. J., and Lamb, R. A. (1991) Influenza virus M2 integral membrane protein is a homotetramer stabilized by formation of disulfide bonds. Virology 183, 32-43
21. Pinto, L. H., Holsinger, L. J., and Lamb, R. A. (1992) Influenza virus M2 protein has ion channel activity. Cell 69, 517-528
22. Helenius, A. (1992) Unpacking the incoming influenza virus. Cell 69, 577-578 23. Roberts, P. C., Lamb, R. A., and Compans, R. W. (1998) The M1 and M2 proteins of influenza A
virus are important determinants in filamentous particle formation. Virology 240, 127-137 24. Iwatsuki-Horimoto, K., Horimoto, T., Noda, T., Kiso, M., Maeda, J., Watanabe, S., Muramoto, Y.,
Fujii, K., and Kawaoka, Y. (2006) The cytoplasmic tail of the influenza A virus M2 protein plays

Restriction of influenza infection by cyclin D3
20
a role in viral assembly. J Virol 80, 5233-5240 25. Rossman, J. S., Jing, X., Leser, G. P., Balannik, V., Pinto, L. H., and Lamb, R. A. (2010) Influenza
virus m2 ion channel protein is necessary for filamentous virion formation. J Virol 84, 5078-5088
26. McCown, M. F., and Pekosz, A. (2006) Distinct domains of the influenza a virus M2 protein cytoplasmic tail mediate binding to the M1 protein and facilitate infectious virus production. J Virol 80, 8178-8189
27. Chen, B. J., Leser, G. P., Jackson, D., and Lamb, R. A. (2008) The Influenza Virus M2 Protein Cytoplasmic Tail Interacts with the M1 Protein and Influences Virus Assembly at the Site of Virus Budding. Journal of Virology 82, 10059-10070
28. Rossman, J. S., Jing, X., Leser, G. P., and Lamb, R. A. (2010) Influenza virus M2 protein mediates ESCRT-independent membrane scission. Cell 142, 902-913
29. Thomas, J. M., Stevens, M. P., Percy, N., and Barclay, W. S. (1998) Phosphorylation of the M2 protein of influenza A virus is not essential for virus viability. Virology 252, 54-64
30. Le, L., and Leluk, J. (2011) Study on phylogenetic relationships, variability, and correlated mutations in M2 proteins of influenza virus A. PLoS One 6, e22970
31. Henkel, J. R., and Weisz, O. A. (1998) Influenza virus M2 protein slows traffic along the secretory pathway. pH perturbation of acidified compartments affects early Golgi transport steps. J Biol Chem 273, 6518-6524
32. Rossman, J. S., and Lamb, R. A. (2011) Influenza virus assembly and budding. Virology 411, 229-236
33. Nugent, J. H., Alfa, C. E., Young, T., and Hyams, J. S. (1991) Conserved structural motifs in cyclins identified by sequence analysis. J Cell Sci 99 ( Pt 3), 669-674
34. Kobayashi, H., Stewart, E., Poon, R., Adamczewski, J. P., Gannon, J., and Hunt, T. (1992) Identification of the domains in cyclin A required for binding to, and activation of, p34cdc2 and p32cdk2 protein kinase subunits. Mol Biol Cell 3, 1279-1294
35. Musgrove, E. A., Caldon, C. E., Barraclough, J., Stone, A., and Sutherland, R. L. (2011) Cyclin D as a therapeutic target in cancer. Nat Rev Cancer 11, 558-572
36. Lees, E. (1995) Cyclin dependent kinase regulation. Curr Opin Cell Biol 7, 773-780 37. Sherr, C. J. (1994) G1 phase progression: cycling on cue. Cell 79, 551-555 38. Sherr, C. J. (1996) Cancer cell cycles. Science 274, 1672-1677 39. Inaba, T., Matsushime, H., Valentine, M., Roussel, M. F., Sherr, C. J., and Look, A. T. (1992)
Genomic organization, chromosomal localization, and independent expression of human cyclin D genes. Genomics 13, 565-574
40. Pokrovskaja, K., Ehlin-Henriksson, B., Bartkova, J., Bartek, J., Scuderi, R., Szekely, L., Wiman, K. G., and Klein, G. (1996) Phenotype-related differences in the expression of D-type cyclins in human B cell-derived lines. Cell Growth Differ 7, 1723-1732
41. Bartkova, J., Lukas, J., Strauss, M., and Bartek, J. (1994) Cell cycle-related variation and tissue-restricted expression of human cyclin D1 protein. J. Pathol. 172, 237-245
42. Lukas, J., Bartkova, J., Welcker, M., Petersen, O. W., Peters, G., Strauss, M., and Bartek, J. (1995) Cyclin D2 is a moderately oscillating nucleoprotein required for G1 phase progression in specific cell types. Oncogene 10, 2125-2134
43. Palmero, I., Holder, A., Sinclair, A. J., Dickson, C., and Peters, G. (1993) Cyclins D1 and D2 are differentially expressed in human B-lymphoid cell lines. Oncogene 8, 1049-1054

Restriction of influenza infection by cyclin D3
21
44. Mahony, D., Parry, D. A., and Lees, E. (1998) Active cdk6 complexes are predominantly nuclear and represent only a minority of the cdk6 in T cells. Oncogene 16, 603-611
45. Ajchenbaum, F., Ando, K., DeCaprio, J. A., and Griffin, J. D. (1993) Independent regulation of human D-type cyclin gene expression during G1 phase in primary human T lymphocytes. J Biol Chem 268, 4113-4119
46. Sherr, C. J. (1993) Mammalian G1 cyclins. Cell 73, 1059-1065 47. Sorrell, D. A., Combettes, B., Chaubet-Gigot, N., Gigot, C., and Murray, J. A. H. (1999) Distinct
cyclin D genes show mitotic accumulation or constant levels of transcripts in tobacco bright yellow-2 cells. Plant Physiology 119, 343-351
48. Matsushime, H., Roussel, M. F., Ashmun, R. A., and Sherr, C. J. (1991) Colony-stimulating factor 1 regulates novel cyclins during the G1 phase of the cell cycle. Cell 65, 701-713
49. He, Y. A., Xu, K., Keiner, B., Zhou, J. F., Czudai, V., Li, T. X., Chen, Z., Liu, J. H., Klenk, H. D., Shu, Y. L., and Sun, B. (2010) Influenza A Virus Replication Induces Cell Cycle Arrest in G(0)/G(1) Phase. Journal of Virology 84, 12832-12840
50. Keyomarsi, K., and Pardee, A. B. (1993) Redundant cyclin overexpression and gene amplification in breast cancer cells. Proc Natl Acad Sci U S A 90, 1112-1116
51. Keyomarsi, K., O'Leary, N., Molnar, G., Lees, E., Fingert, H. J., and Pardee, A. B. (1994) Cyclin E, a potential prognostic marker for breast cancer. Cancer Res 54, 380-385
52. Goll, D. E., Thompson, V. F., Li, H., Wei, W., and Cong, J. (2003) The calpain system. Physiol Rev 83, 731-801
53. Choi, Y. H., Lee, S. J., Nguyen, P., Jang, J. S., Lee, J., Wu, M. L., Takano, E., Maki, M., Henkart, P. A., and Trepel, J. B. (1997) Regulation of cyclin D1 by calpain protease. J Biol Chem 272, 28479-28484
54. Crawford, L. J., Walker, B., Ovaa, H., Chauhan, D., Anderson, K. C., Morris, T. C., and Irvine, A. E. (2006) Comparative selectivity and specificity of the proteasome inhibitors BzLLLCOCHO, PS-341, and MG-132. Cancer Res 66, 6379-6386
55. Martinez-Botas, J., Ferruelo, A. J., Suarez, Y., Fernandez, C., Gomez-Coronado, D., and Lasuncion, M. A. (2001) Dose-dependent effects of lovastatin on cell cycle progression. Distinct requirement of cholesterol and non-sterol mevalonate derivatives. Biochim Biophys Acta 1532, 185-194
56. Vassilev, L. T., Tovar, C., Chen, S., Knezevic, D., Zhao, X., Sun, H., Heimbrook, D. C., and Chen, L. (2006) Selective small-molecule inhibitor reveals critical mitotic functions of human CDK1. Proc Natl Acad Sci U S A 103, 10660-10665
57. Ewen, M. E., Sluss, H. K., Sherr, C. J., Matsushime, H., Kato, J., and Livingston, D. M. (1993) Functional interactions of the retinoblastoma protein with mammalian D-type cyclins. Cell 73, 487-497
58. Weinberg, R. A. (1995) The retinoblastoma protein and cell cycle control. Cell 81, 323-330 59. Kitagawa, M., Higashi, H., Jung, H. K., Suzuki-Takahashi, I., Ikeda, M., Tamai, K., Kato, J.,
Segawa, K., Yoshida, E., Nishimura, S., and Taya, Y. (1996) The consensus motif for phosphorylation by cyclin D1-Cdk4 is different from that for phosphorylation by cyclin A/E-Cdk2. EMBO J 15, 7060-7069
60. Welch, P. J., and Wang, J. Y. (1993) A C-terminal protein-binding domain in the retinoblastoma protein regulates nuclear c-Abl tyrosine kinase in the cell cycle. Cell 75, 779-790
61. Sherr, C. J., and Roberts, J. M. (1995) Inhibitors of mammalian G1 cyclin-dependent kinases.

Restriction of influenza infection by cyclin D3
22
Genes Dev 9, 1149-1163 62. Sicinska, E., Aifantis, I., Le Cam, L., Swat, W., Borowski, C., Yu, Q., Ferrando, A. A., Levin, S. D.,
Geng, Y., von Boehmer, H., and Sicinski, P. (2003) Requirement for cyclin D3 in lymphocyte development and T cell leukemias. Cancer Cell 4, 451-461
63. Mi, S., Li, Y., Yan, J., and Gao, G. F. (2010) Na(+)/K (+)-ATPase beta1 subunit interacts with M2 proteins of influenza A and B viruses and affects the virus replication. Science China. Life sciences 53, 1098-1105
64. Xie, Z. J., Wang, Y. H., Liu, G. Q., Zolotarjova, N., Periyasamy, S. M., and Askari, A. (1996) Similarities and differences between the properties of native and recombinant Na+/K+-ATPases. Archives of biochemistry and biophysics 330, 153-162
65. Meurs, E., Chong, K., Galabru, J., Thomas, N. S., Kerr, I. M., Williams, B. R., and Hovanessian, A. G. (1990) Molecular cloning and characterization of the human double-stranded RNA-activated protein kinase induced by interferon. Cell 62, 379-390
66. Garcia, M. A., Meurs, E. F., and Esteban, M. (2007) The dsRNA protein kinase PKR: virus and cell control. Biochimie 89, 799-811
67. Guan, Z., Liu, D., Mi, S., Zhang, J., Ye, Q., Wang, M., Gao, G. F., and Yan, J. (2010) Interaction of Hsp40 with influenza virus M2 protein: implications for PKR signaling pathway. Protein Cell 1, 944-955
68. Schroeder, C., Heider, H., Moncke-Buchner, E., and Lin, T. I. (2005) The influenza virus ion channel and maturation cofactor M2 is a cholesterol-binding protein. European Biophysics Journal with Biophysics Letters 34, 52-66
69. Ma, H., Kien, F., Maniere, M., Zhang, Y., Lagarde, N., Tse, K. S., Poon, L. L., and Nal, B. (2011) Human annexin A6 interacts with influenza A virus M2 protein and negatively modulates infection. J Virol
70. Beale, R., Wise, H., Stuart, A., Ravenhill, B. J., Digard, P., and Randow, F. (2014) A LC3-Interacting Motif in the Influenza A Virus M2 Protein Is Required to Subvert Autophagy and Maintain Virion Stability. Cell Host & Microbe 15, 239-247
71. Tanida, I., Ueno, T., and Kominami, E. (2008) LC3 and Autophagy. Methods Mol Biol 445, 77-88
72. Hrecka, K., Hao, C., Gierszewska, M., Swanson, S. K., Kesik-Brodacka, M., Srivastava, S., Florens, L., Washburn, M. P., and Skowronski, J. (2011) Vpx relieves inhibition of HIV-1 infection of macrophages mediated by the SAMHD1 protein. Nature 474, 658-661
73. Balasubramaniam, V. R., Hassan, S. S., Omar, A. R., Mohamed, M., Noor, S. M., Mohamed, R., and Othman, I. (2011) Cellular transcripts regulated during infections with Highly Pathogenic H5N1 Avian Influenza virus in 3 host systems. Virol J 8, 196
74. Elder, R. T., Yu, M., Chen, M., Zhu, X., Yanagida, M., and Zhao, Y. (2001) HIV-1 Vpr induces cell cycle G2 arrest in fission yeast (Schizosaccharomyces pombe) through a pathway involving regulatory and catalytic subunits of PP2A and acting on both Wee1 and Cdc25. Virology 287, 359-370
75. Planz, O., Pleschka, S., Oesterle, K., Berberich-Siebelt, F., Ehrhardt, C., Stitz, L., and Ludwig, S. (2003) Borna disease virus nucleoprotein interacts with the CDC2-cyclin B1 complex. J Virol 77, 11186-11192
76. Surjit, M., Liu, B. P., Chow, V. T. K., and Lal, S. K. (2006) The nucleocapsid protein of severe acute respiratory syndrome-coronavirus inhibits the activity of cyclin-cyclin-dependent kinase

Restriction of influenza infection by cyclin D3
23
complex and blocks S phase progression in mammalian cells. Journal of Biological Chemistry 281, 10669-10681
77. Jiang, W., Wang, Q., Chen, S., Gao, S., Song, L., Liu, P., and Huang, W. (2013) Influenza A virus NS1 induces G0/G1 cell cycle arrest by inhibiting the expression and activity of RhoA protein. J Virol
78. Schneider, W. M., Chevillotte, M. D., and Rice, C. M. (2014) Interferon-Stimulated Genes: A Complex Web of Host Defenses. Annual Review of Immunology, Vol 32 32, 513-545
79. Fitzgerald, K. A. (2011) The Interferon Inducible Gene: Viperin. Journal of Interferon and Cytokine Research 31, 131-135
80. Wang, X. Y., Hinson, E. R., and Cresswell, P. (2007) The interferon-inducible protein viperin inhibits influenza virus release by perturbing lipid rafts. Cell Host & Microbe 2, 96-105
81. Nasr, N., Maddocks, S., Turville, S. G., Harman, A. N., Woolger, N., Helbig, K. J., Wilkinson, J., Bye, C. R., Wright, T. K., Rambukwelle, D., Donaghy, H., Beard, M. R., and Cunningham, A. L. (2012) HIV-1 infection of human macrophages directly induces viperin which inhibits viral production. Blood 120, 778-788
82. FromontRacine, M., Rain, J. C., and Legrain, P. (1997) Toward a functional analysis of the yeast genome through exhaustive two-hybrid screens. Nature Genetics 16, 277-282
83. Formstecher, E., Aresta, S., Collura, V., Hamburger, A., Meil, A., Trehin, A., Reverdy, C., Betin, V., Maire, S., Brun, C., Jacq, B., Arpin, M., Bellaiche, Y., Bellusci, S., Benaroch, P., Bornens, M., Chanet, R., Chavrier, P., Delattre, O., Doye, V., Fehon, R., Faye, G., Galli, T., Girault, J. A., Goud, B., de Gunzburg, J., Johannes, L., Junier, M. P., Mirouse, V., Mukherjee, A., Papadopoulo, D., Perez, F., Plessis, A., Rosse, C., Saule, S., Stoppa-Lyonnet, D., Vincent, A., White, M., Legrain, P., Wojcik, J., Camonis, J., and Daviet, L. (2005) Protein interaction mapping: a Drosophila case study. Genome research 15, 376-384
84. Tobita, K., Sugiura, A., Enomote, C., and Furuyama, M. (1975) Plaque assay and primary isolation of influenza A viruses in an established line of canine kidney cells (MDCK) in the presence of trypsin. Med Microbiol Immunol 162, 9-14
85. Faussillon, M., Monnier, L., Junien, C., and Jeanpierre, C. (2005) Frequent overexpression of cyclin D2/cyclin-dependent kinase 4 in Wilms' tumor. Cancer Letters 221, 67-75
86. Eward, K. L., Van Ert, M. N., Thornton, M., and Helmstetter, C. E. (2004) Cyclin mRNA stability does not vary during the cell cycle. Cell Cycle 3, 1057-1061

Restriction of influenza infection by cyclin D3
24
Table 1 Yeast two-hybrid screen identifies/predicts cyclin D3–M2-CT interaction Characteristic Value or description Bait M2 cytoplasmic tail (aa 44-97) Library Random-primed human placenta cDNA No. of interactions tested 63.89 million Prey cyclin D3 No. of positive clones 42 Confidence score* A Minimal interacting domain aa 138-251 *Predicted biological score (from A to E – highest to lowest), a statistical confidence score assigned to each interaction by Hybrigenics.

Restriction of influenza infection by cyclin D3
25
FIGURE LEGENDS Figure 1 Identification of cyclin D3 as a specific cellular interactor of M2 influenza protein. (A) Schematic representation of structural motifs in the M2 protein with the enlarged sequence of the cytoplasmic tail (CT) used as the bait for the yeast two-hybrid screen. ED, ectodomain; TM, transmembrane domain. (B) Schematic representation of cyclin D3. The retinoblastoma (Rb)-binding LXCXE motif, the proline (P), glutamic acid (E), serine (S), and threonine (T)-rich PEST domain which has been postulated to be involved in the rapid degradation of unstable proteins, and the M2-minimal interacting domain are shown. Numbers indicate amino acid positions. (C) GST pull-down assay using whole cell lysates from A549 cells. Samples were incubated with either naked beads, GST control (GST) or GST fused to the cytoplasmic tail of A/WSN/33 virus M2 protein (GST–M2-CT), and analyzed by immunoblotting with anti-cyclin D3 antibodies after pull-down. Results are representative of three and two independent experiments for cyclin D3 and cyclin D1 pull-down, respectively. Dotted lines indicate sliced lanes from the same gel. GST protein input was revealed by Coomassie Blue staining. (D) Co-immunoprecipitation of M2 with cyclin D3. HEK 293T cells infected with A/WSN/33 virus at an MOI of 2 were lysed at 6 h after infection and subjected to immunoprecipitation (IP) with anti-flag or isotype control antibodies. Cell lysates or pellets following IP were analyzed by immunoblotting (IB) using indicated antibodies. Transfection and infection conditions are shown on top of the blots. Results are representative of three independent experiments. (E) HEK 293T cells were transfected with plasmids encoding myc-tagged cyclins 48 h prior to infection with A/WSN/33 virus at an MOI of 2. Cells were lysed at 6 h after infection and subjected to immunoprecipitation (IP) with anti-myc or isotype control antibodies. Cell lysates or pellets following IP were analyzed by immunoblotting (IB) using indicated antibodies. Transfection and infection conditions are shown on top of the blots. M2 was found to interact with all cyclins tested, albeit, to different intensities. Results are representative of three independent experiments. Quantitation of M2 pull-down levels was performed by densitometric analysis of immunoblots. M2 level was normalized to the respective immunoprecipitated myc-tagged protein level in each condition. The degree of association of M2 to cyclin D1 was around 50% to that of cyclin D3 when same amount of cyclins were immunoprecipitated. Weak binding of M2 to cyclin D2 and cyclin E1, which plays a role in the cell cycle clock one step later than D-type cyclins and is required for cell cycle G1/S transition in association with cyclin-dependent kinase 2 (CDK2), was also observed in our experiments. Bar graph represents mean ± SD of three independent experiments. **P<0.005, ***P<0.0001 by the one-way ANOVA. Figure 2 Influenza A virus infection drives cyclin D3 re-distribution from nucleus to cytoplasm. (A) Cyclin D3 subcellular distribution is altered upon M2 expression. A549 cells were infected with A/WSN/33 virus at an MOI of 0.5 or transfected with a plasmid expressing M2 protein. At 24 h after infection or transfection cells were fixed for immunofluoresence staining. The subcellular localization of cyclin D3 (red) and M2 (green) was visualized through immunostaining with specific antibodies and analyzed by confocal microscopy. Yellow arrow heads point to nuclei of uninfected or non-transfected cells. White arrows

Restriction of influenza infection by cyclin D3
26
indicate virus infected or M2-expressing cells. Bar = 20 µm. (B) Cyclin D3 translocates from nucleus to cytoplasm after viral infection. (Left panel) Cytoplasmic (C) and nuclear (N) fractions of virus-infected (MOI of 2) or uninfected cells were prepared from A549 cells 8 h after infection. Lysates were resolved by SDS-PAGE and immunoblotted with anti-cyclin D3. Levels of lamin B1 and GAPDH were used as controls to verify clean separation of nuclear and cytoplasmic fractions, respectively. Results are representative of three independent experiments. (C) Quantitation of cyclin D3 levels was performed by densitometric analysis of immunoblots. Data are presented as percentage of cyclin D3 remaining in the nucleus as a fraction of total. Both mock- and virus-infection groups were normalized to total cyclin D3 levels in uninfected cells. Bar graph represents mean ± SD of three independent experiments. **P<0.005 by the unpaired Student’s t-test. (D) Colocalization of cyclin D3 and M2 in virus-infected cells. A549 cells expressing cyclin D3 were infected with A/WSN/33 virus at an MOI of 2 in the presence of MG-132 to block protein degradation through proteasome and fixed at 15 h post infection. The subcellular localization of cyclin D3 (red) and M2 (green) was visualized through immunostaining with specific antibodies and analyzed by confocal microscopy. Bar = 20 µm. Figure 3 Influenza A virus (IAV) infection down regulates protein levels of cyclin D3 through proteasome-mediated degradation. (A) IAV infection reduces protein level of cyclin D3 but not cyclin E. A549 cells were infected with A/WSN/33 virus at an MOI of 2. (Upper panel) Cells were lysed at specified time points, subjected to SDS-PAGE and visualized by Western blotting. Results are representative of three independent experiments. (Lower panel) Densitometric quantitation of cyclin D3 and cyclin E normalized to GAPDH. Line graphs represent mean ± SD from three independent experiments. *P<0.05, **P<0.01, ***P<0.001 vs mock at each time point by the two-way ANOVA. (B) Cyclin D3 is targeted for proteolysis after viral infection. (Upper panel) A549 cells, either mock- or virus-infected, were treated with proteasome inhibitors MG-101 or MG-132 at the initiation of viral infection. Whole cell lysates were extracted at 9 h after infection for detection of cyclin D3 protein levels. (Lower panel) Densitometric analysis of immunoblots for cyclin D3 levels (normalized to GAPDH). Results are representative of three independent experiments. Bar graph presents mean ± SD from three independent experiments. *P<0.05 by the unpaired Student’s t-test. Figure 4 Influenza A virus (IAV) specifically targets cyclin D3 for proteasomal degradation. (A) IAV infection reduces protein level of cyclin D1, CDK4, and CDK6. A549 cells were infected with A/WSN/33 virus at an MOI of 2. Cells were lysed at specified time points, subjected to SDS-PAGE and visualized by Western blotting. Results are representative of three independent experiments. Line graphs represent mean ± SD of bands intensity obtained through densitometic quantitation from three independent experiments. **P<0.01, ***P<0.001 vs mock at each time point by the two-way ANOVA. (B) Cyclin D3 is specifically targeted for proteolysis after viral infection. Virus-infected (MOI of 2) A549 cells were treated with proteasome inhibitors MG-101 or MG-132 at the initiation of viral infection. Whole cell lysates were extracted at 24 h p.i. for detection of the protein levels of cell cycle regulators. Results are representative of three independent experiments. Bar graph presents mean ± SD of band intensity obtained through densitometric analysis from three independent

Restriction of influenza infection by cyclin D3
27
experiments (normalized to GAPDH). *P<0.05, **P<0.005, ***P<0.001 by the unpaired Student’s t-test. Figure 5 Influenza A virus infection (IAV) leads to cell cycle arrest in G0/G1. (A) IAV infection altered the cell cycle progression of A549 cells pre-synchronized in G1 phase. A549 cells were treated with lovastatin 22 h prior to infection with A/WSN/33 virus to synchronize them in G0/G1 phase. Cells were released from drug treatment at the start of infection (MOI=2), which lasted for the indicated time points, and incubated with 10 µM BrdU for cell cycle analysis 1 h before harvesting. (B) Cell cycle pattern of mock- and virus-infected cell populations at 24 h after infection that were pre-synchronized in G0/G1 phase with lovastatin. Results are representative of three independent experiments. (C) Percentage of cells in G0/G1 phase after lovastatin treatment in mock- or virus-infected cells. Line graph illustrates mean ± SD of three independent experiments. ***P<0.001 vs mock at each time point by the two-way ANOVA. (D) IAV infection arrested cells in G0/G1 phase in A549 population pre-synchronized in G2/M phase. Cyclin dependent kinase 1 (CDK1) inhibitor RO-3306 was used to accumulate A549 cells in G2/M for 18 h. Immediately after drug removal, cells were infected with A/WSN/33 virus (MOI=2) and treated as above for cell cycle analysis following BrdU incorporation. (E) Cell cycle pattern of mock- and virus-infected cell populations that were pre-synchronized in G2/M phase with RO-3306. Results are representative of three independent experiments. (F) Percentage of cells in G0/G1 phase after RO-3306 treatment in mock- or virus infected cells. Line graph illustrates mean ± SD of three independent experiments. ***P<0.001 vs mock at each time point by the two-way ANOVA. Flow cytometry data were obtained with a BD LSRII flow cytometer. Scattergrams are representative of three independent experiments. In panel A and D, scattergrams show DNA content staining versus BrdU incorporation of each individual cell for cell cycle status determination. Boxed and circled areas define cell populations in each phase of the cell cycle indicated on graph. Figure 6 IAV infection inhibits hyper-phosphorylation of Rb and down-regulates cyclin-dependent kinase (CDK) inhibitor p21WAF1/CIP1. (A) A549 cells were infected with A/WSN/33 virus at an MOI of 2. At indicated time points, whole cell lysates were prepared from both infected and uninfected cells to determine the phosphorylation status of Rb and levels of CDK inhibitor p21WAF1/CIP1. Results are representative of three independent experiments. (Right panel) Densitometric analyses of Rb and p21WAF1/CIP1 levels were performed on immunoblots (normalized to GAPDH). Line graphs represent mean ± SD of three independent experiments. *P<0.05, **P<0.001 vs mock at each time point by the two-way ANOVA. (B) P21WAF1/CIP1 is targeted for proteolysis after viral infection. (Left panel) A549 cells, either mock- or virus-infected, were treated with proteasome inhibitors MG-101 or MG-132 at the initiation of viral infection. Whole cell lysates were extracted at 9 h after infection for detection of p21WAF1/CIP1 protein levels. (Right panel) Densitometric analysis of immunoblots for p21WAF1/CIP1 levels in cells treated with different inhibitors (normalized to GAPDH). Results are representative of three independent experiments. Bar graph presents mean ± SD from three independent experiments. **P<0.005, ***P<0.0005 by the unpaired Student’s t-test.

Restriction of influenza infection by cyclin D3
28
Figure 7 Cyclin D3 negatively modulates influenza virus infection. (A) Analysis of siRNA-mediated gene knockdown efficiency. Whole cell lysates were prepared from A549 cells 72 h after designated siRNA treatment. Western blotting was used to determine the expression levels of cyclin D3 and cyclin D1. Results are representative of three independent experiments. (B) Ccnd3 knockdown in A549 cells facilitate both low pathogenic and highly pathogenic IAV infection. Nontargeting (NT) or cyclin D3 (CCND3 #1 & CCND3 #2) siRNA treated cells were infected with viruses at an MOI of 0.01 for multi-cycle infection. Progeny virus titers in cell culture supernatants were determined through plaque assay. Bar graphs depict mean ± SD of three independent experiments. *P<0.05, **P<0.01, ***P<0.0001 vs control (NT) siRNA at each time point by the unpaired Student’s t-test. (C) Analysis of siRNA-mediated gene knockdown efficiency. Lysates were prepared from A549 cells treated with indicated siRNAs 72 h post transfection. The expression levels of retinoblastoma (Rb), cyclin E, cyclin D3, cyclin D1, and GAPDH proteins were determined by Western blotting. Results are representative of three independent experiments. (D) Cell cycle pattern of siRNA treated cells. A549 cells were fixed in 70% ethanol 72 h post siRNA treatment. The cell cycle pattern of each group was quantitated through BrdU incorporation and 7-AAD DNA content staining. Data were obtained with a BD LSRII flow cytometer and presented as the percentage of total cells in each phase. Bar graph represents mean ± SD of three independent experiments. **P<0.001, ***P<0.0001 vs NT siRNA by the unpaired Student’s t-test. (E) Cyclin D3 depletion in A549 cells increases progeny virus titer in supernatant. A549 cells treated with the indicated siRNAs were infected with influenza A/WSN/33 (H1N1) virus, A/HK/1/68 (H3N2), or A/HK/54/98 (H1N1) virus at an MOI of 0.01. Cell culture supernatants were collected at 24 and 48 h after infection and virus titers were determined by plaque assay on MDCK cells. Bar graphs represent mean ± SD of three independent experiments. *P<0.05, **P<0.01, ***P<0.0005 vs NT siRNA by the unpaired Student’s t-test. Figure 8 Cyclin D3 is expressed along human airway. (A) Total RNA extracted from human bronchial epithelial cells (HBEC) and pneumocytes was reverse transcribed into cDNA for Taqman probe-based q-PCR gene expression analysis. Shown is a graphical representation of the mean absolute copy number of cyclin D1, D2, D3, and E1 in HBEC and pneumocyte. (B) Whole cell lysates of A549, HBEC, and pneumocyte were extracted to determine the protein levels of designated cyclins through Western blotting (Upper panel). Densitometric analysis of immunoblots for cyclin D1, D2, and D3 in different cell types were shown at lower panel (normalized to GAPDH). (C) Analysis of siRNA-mediated gene knockdown efficiency in HBEC. Whole cell lysates were prepared from HBECs cells 72 h after designated siRNA treatment. Western blotting was used to determine the expression levels of cyclin D3. (D) Ccnd3 knockdown in HBEC facilitates IAV progeny virus production. Nontargeting (NT) or cyclin D3 (CCND3 #2) siRNA treated cells were infected with viruses at an MOI of 0.01 for multi-cycle infection. Progeny virus titers in cell culture supernatants were determined through plaque assay. Bar graphs depict mean ± SD of three independent experiments. *P<0.05, **P<0.01, ***P<0.0001 vs control (NT) siRNA at each time point by the unpaired

Restriction of influenza infection by cyclin D3
29
Student’s t-test. Figure 9 Cyclin D3 deficiency does not affect viral protein synthesis. (Upper panel) A549 cells with knockdown of indicated genes were infected with A/WSN/33 virus at an MOI of 2 to determine their effect on viral protein synthesis. Whole cell lysates were collected at 3, 6, 9, and 12 h after infection to monitor protein levels. Lysates were resolved by SDS-PAGE and levels of viral nucleoprotein, M1, and M2 were determined through Western blotting. Results are representative of three independent experiments. (Lower panel) Densitometric analyses of immunoblots for each protein at 12h post-infection (normalized to GAPDH). Results are shown as mean ± SD of three independent experiments. Figure 10 Cyclin D3 competes with M1 for M2 binding. (A) Cyclin D3 impairs interaction between viral M2 and M1 proteins. (Left panel) HEK 293T cells were co-transfected with M1-HA and M2-Flag (Lane 1), or with M1-HA, M2-Flag along with cyclin D3-Flag (Lanes 2 & 3), as indicated on top of each blot. At 48 h post transfection, cell lysates were collected and subjected to immunoprecipitation using anti-M2 (Lane 1 & 2) or isotype control (Lane 3) antibodies. Precipitates were analyzed through Western blotting to detect M1, M2 and cyclin D3 proteins. (Right panel) Densitometric analyses of immunoblots to quantitate the amount of viral M1 protein co-immunoprecipitating with M2 with or without the expression of cyclin D3 (normalized to immunoprecipitated M2 amount). Results are shown as mean ± SD of three independent experiments. **P<0.005 by the unpaired Student’s t-test. (B) Cyclin D3 hinders M2 cell surface expression. (Left panel) Control and cyclin D3-deficient cells were infected with A/WSN/33 and plasma membrane expression of viral M2 protein was detected by flow cytometry at 6 and 8 h after infection. Histograms are representative of three independent experiments. Gating indicates cell populations that are positive or negative for plasma membrane expression of M2 protein. (Right panel) Statistical analysis of percentage of cells that were positive for surface expression of M2. Results are shown as mean ± SD of three independent experiments. **P<0.005 ***P<0.0001 by the unpaired Student’s t-test. (C) Overexpression of cyclin D3 sequestered viral M1 and M2 protein to secretory network. A549 cells were overexpressed with cyclin D3 protein 24 h prior to infection with A/WSN/33 virus at an MOI of 2. Cells were fixed at 10 h p.i. and immunostained with specific antibodies to reveal the subcellular localization of M1 (red) and M2 (green). Bar = 20 µm. Figure 11 Working model of cyclin D3 function in the context of influenza virus budding. In normal cells cyclin D3 displays nuclear-localization, which is essential for cell-cycle regulation. During influenza A virus infection, cyclin D3 interacts with viral M2 protein. The cyclin D3-M2 interaction impairs binding of M2 to M1, which is required for virus assembly and budding at the plasma membrane. In the absence of cyclin D3, more infectious progeny virus particles are released into the supernatant of virus-infected cells. Influenza virus, however, antagonizes cyclin D3 inhibition by: i) redistributing cyclin D3 between nucleus and cytoplasm, which contributes to cell cycle G0/G1 arrest, thus facilitating virus replication; ii)

Restriction of influenza infection by cyclin D3
30
targeting cyclin D3 is to the proteasomal degradation pathway in the cytoplasm to remove its interference with M1-M2 binding.

Restriction of influenza infection by cyclin D3
31

Restriction of influenza infection by cyclin D3
32

Restriction of influenza infection by cyclin D3
33
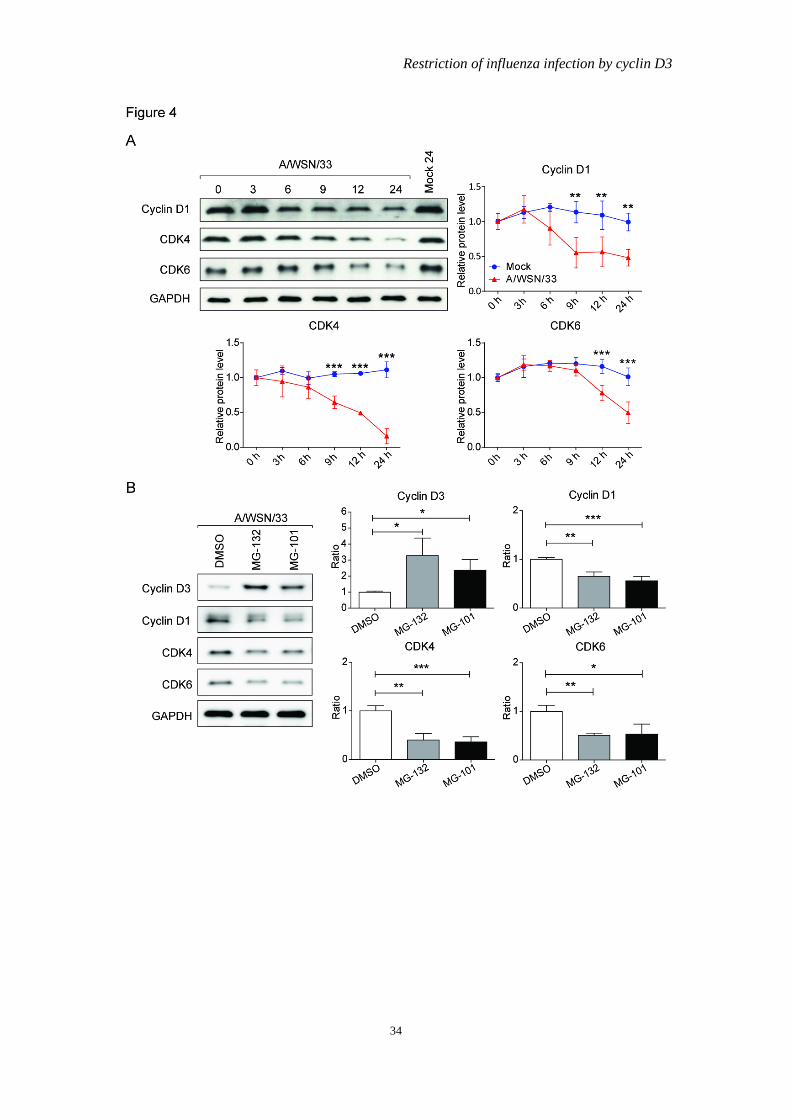
Restriction of influenza infection by cyclin D3
34

Restriction of influenza infection by cyclin D3
35

Restriction of influenza infection by cyclin D3
36

Restriction of influenza infection by cyclin D3
37

Restriction of influenza infection by cyclin D3
38

Restriction of influenza infection by cyclin D3
39

Restriction of influenza infection by cyclin D3
40

Restriction of influenza infection by cyclin D3
41