Embed Size (px)
Citation preview
University of Nebraska - LincolnDigitalCommons@University of Nebraska - LincolnCivil Engineering Theses, Dissertations, andStudent Research Civil Engineering
5-2019
RESTRICTED CROSSING U-TURNS ATRURAL INTERSECTIONSTimothy AdamsUniversity of Nebraska - Lincoln, [email protected]
Follow this and additional works at: https://digitalcommons.unl.edu/civilengdiss
Part of the Civil Engineering Commons, Other Civil and Environmental Engineering Commons,and the Transportation Engineering Commons
This Article is brought to you for free and open access by the Civil Engineering at DigitalCommons@University of Nebraska - Lincoln. It has beenaccepted for inclusion in Civil Engineering Theses, Dissertations, and Student Research by an authorized administrator ofDigitalCommons@University of Nebraska - Lincoln.
Adams, Timothy, "RESTRICTED CROSSING U-TURNS AT RURAL INTERSECTIONS" (2019). Civil Engineering Theses,Dissertations, and Student Research. 134.https://digitalcommons.unl.edu/civilengdiss/134

RESTRICTED CROSSING U-TURNS AT RURAL INTERSECTIONS
by
Timothy Adams
A THESIS
Presented to the Faculty of
The Graduate College at the University of Nebraska
In Partial Fulfillment of the Requirements
For the Degree of Master of Science
Major: Civil Engineering
Under the Supervision of Professor Aemal Khattak
Lincoln, Nebraska
May, 2019

RESTRICTED CROSSING U-TURNS AT RURAL INTERSECTIONS
Timothy Adams, M.S.
University of Nebraska, 2019
Advisor: Aemal Khattak
This study examines the potential for replacing the standard intersection design at two-way
stop control (TWSC) and all-way stop control (AWSC) intersections along rural highways with a
roundabout or a restricted crossing u-turn (RCUT) facility. The geometry of the RCUT design
prohibits left and through movements from the side road, and provides a u-turn location
downstream from the main crossing. This type of facility has been implemented for rural highways
extensively in other states and has the potential to serve as a cost-effective solution to improve
roadway safety within Nebraska.
Comparative analysis is conducted for three site locations (Humphrey, Madison, and
Dakota City, Nebraska) with either TWSC or AWSC existing geometry, analyzing the anticipated
impacts of mitigation with a roundabout or an RCUT design. The costs and benefit analysis from
implementing the various intersection geometries includes monetized delay costs, monetized crash
costs, and anticipated construction costs.
Alongside the cost benefit analysis, a decision matrix seeks to assess specifically whether
an RCUT intersection would be appropriate, and the five factors for consideration identified
include (1) the safety concerns at the location, (2) the overall levels of traffic demand, (3) the
balance between major and minor movement traffic demand, (4) the presence of obstructions along
the main roadway that would impact u-turn bay placement, and (5) the available space in the
median for the u-turn bay.
The primary takeaway from the research is that both a roundabout and an RCUT design
can be relied upon to lead to significant safety improvements for unsignalized intersections on
rural highways, and that the decision of which one to use should factor in the potential increase in
delays to the minor approach at the RCUT design if a high demand volume is anticipated (such
as Dakota City), or the consideration of whether it is permissible to interrupt the flow of the major
arterial through movement with a roundabout versus leaving it free-flowing with the RCUT.

vi
TABLE OF CONTENTS
Chapter 1 Introduction .................................................................................................................. 10
1.1 Background and Motivation ................................................................................................ 10
1.2 Research Questions and Contribution ................................................................................. 11
1.3 Methodology ....................................................................................................................... 12
1.4 Document Layout ................................................................................................................ 13
Chapter 2 Literature Review ......................................................................................................... 14
2.1 Restricted Crossing U-turn Intersection (RCUT)................................................................ 14
2.1.1 History of RCUT Implementation ................................................................................ 15
2.1.2 Variation in Geometric Design of RCUTs ................................................................... 15
2.2 Operational Impacts ............................................................................................................ 19
2.2.1 Overview of Operational Impacts for RCUT designs .................................................. 19
2.2.2 Travel Time Impacts of RCUTs ................................................................................... 20
2.2.3 Secondary Considerations for Operations at RCUTs ................................................... 23
2.3 Safety Impacts ..................................................................................................................... 24
2.3.1 Safety Analysis of Conflict Type ................................................................................. 24
2.3.2 RCUT Crash Severity ................................................................................................... 25
2.4 Secondary Impacts .............................................................................................................. 28
2.4.1 Pedestrian and Bicycle Accommodations .................................................................... 28
2.4.2 Signing Guidance ......................................................................................................... 30
2.4.3 User Perception............................................................................................................. 31
2.5 Economic Analysis .............................................................................................................. 32
Chapter 3 Methodology ................................................................................................................ 34
Proposed Restricted Crossing U-turn Geometric Design .................................................... 34
3.2 Case Study Location Selection Methodology ..................................................................... 36
3.3 Traffic Data Collection Methodology ................................................................................. 37
3.4 Operational Analysis Methodology .................................................................................... 38
3.4.1 HCM Analysis .............................................................................................................. 39
3.4.2 Microsimulation Operational Analysis ......................................................................... 44
3.5 Safety Benefits of Alternative Geometries.......................................................................... 46
3.6 Economic Analysis .............................................................................................................. 48
3.6.1 Delay Cost .................................................................................................................... 49
3.6.2 Safety Assessment and Associated Costs ..................................................................... 49
3.6.3 Construction Cost Estimating ....................................................................................... 52

vii
Chapter 4 Case Study Locations ................................................................................................... 54
US-81 and NE-91 near Humphrey, NE ............................................................................... 56
4.2 US-81 and NE-32 near Madison, NE .................................................................................. 59
4.3 US-75 and NE-35 near Dakota City, NE ............................................................................ 61
Chapter 5 Traffic Operations Analysis ......................................................................................... 64
Operational Analysis Geometric Design ............................................................................. 64
5.2 Operational analysis of US-81 and NE-91 near Humphrey, NE ......................................... 67
5.2.1 Two-way Stop Controlled ............................................................................................ 67
5.2.2 All-way Stop Controlled ............................................................................................... 68
5.2.3 Roundabout ................................................................................................................... 69
5.2.4 RCUT............................................................................................................................ 70
5.3 Operational Analysis of US-81 and NE-32 near Madison, NE........................................... 71
5.3.1 Two-way Stop Controlled ............................................................................................ 71
5.3.2 All-way Stop Controlled ............................................................................................... 72
5.3.3 Roundabout ................................................................................................................... 73
5.3.4 RCUT............................................................................................................................ 73
5.4 Operational Analysis of US-75 and NE-35 near Dakota City, NE ..................................... 74
5.4.1 Two-way Stop Controlled ............................................................................................ 74
5.4.2 All-way Stop Controlled ............................................................................................... 75
5.4.3 Roundabout ................................................................................................................... 76
5.4.4 RCUT............................................................................................................................ 76
5.5 Summary Results of Operational Analysis ......................................................................... 77
5.6 Validation of RCUT Results ............................................................................................... 79
Chapter 6 Cost-Benefit Analysis and Decision Matrix................................................................. 82
Monetized Traffic Delay ..................................................................................................... 82
6.2 Monetized Safety Benefits .................................................................................................. 84
6.3 Cost-benefit comparison of final results ............................................................................. 85
6.4 Decision Matrix ................................................................................................................... 87
Chapter 7 Limitations of the Study ............................................................................................... 91
Chapter 8 Conclusions and Recommendations ............................................................................. 93
8.1 Findings Organized by Chapter .......................................................................................... 93
8.2 Recommendations for Future Work .................................................................................... 99
References ................................................................................................................................... 101
Acknowledgements ..................................................................................................................... 104

viii
LIST OF FIGURES
Figure 2-1 Typical yield-controlled RCUT intersection with merges [1] ................................... 15
Figure 2-2 Major Road Sideswipe and Rear-end Crash Rates [4] ............................................... 17
Figure 2-3 Relationship between traffic demand and probability of two lane-changes .............. 23
Figure 2-4 Annual crash frequency, before and after RCUT implementation [14] ..................... 26
Figure 2-5 Unsignalized RCUT and comparison site collisions before construction [21] .......... 28
Figure 2-6 Pedestrian Movements in a RCUT intersection [1] ................................................... 29
Figure 2-7 Intersection in San Antonio on US 281 [22] .............................................................. 30
Figure 2-8 Stop-controlled RCUT intersection signing guidance from NCDOT [1] .................. 31
Figure 3-1 Federal Highway Administration diagram of a stop-controlled RCUT. [1] .............. 35
Figure 3-2 AASHTO-recommended minimum median widths for U-turn crossovers [1] ......... 36
Figure 3-3 Setup of Miovision Scout cameras ............................................................................. 38
Figure 3-4 LOS Criteria for Each O-D within Alternative Intersections (HCM) ....................... 41
Figure 3-5 Relationship between average vehicle delay and LOS. [31] ...................................... 42
Figure 3-6 VISSUM model's area of influence (not to scale) ...................................................... 45
Figure 4-1 Chosen study site locations [43]................................................................................. 56
Figure 4-2 Intersection of US-81 and NE-91 near Humphrey, NE [22] ...................................... 57
Figure 4-3 Intersection of US-81 and NE-32 near Madison, NE [22] ......................................... 59
Figure 4-4 Intersection of US-75 and NE-35 near Dakota City, NE [22] ................................... 62
Figure 5-1 Roundabout junction of highways 539 & 544 southwest of Lynden, WA [22]......... 65
Figure 5-2 Basic stop controlled setup of RCUT used for analysis [1] ....................................... 66
Figure 5-3 Average delay comparison for RCUT at US-81 and NE-91 near Humphrey, NE ..... 80
Figure 5-4 Average delay comparison for RCUT at US-81 and NE-32 near Madison, NE ........ 80
Figure 5-5 Average delay comparison for RCUT at US-75 and NE-35 near Dakota City, NE .. 80
Figure 6-1 Decision matrix for consideration of RCUT geometry .............................................. 90

ix
LIST OF TABLES
Table 2-1 SSAM Results of 1 u-turn lane and 2 u-turn lanes [12]............................................... 24
Table 2-2 RCUT intersection conversion safety effectiveness [8] .............................................. 25
Table 2-3 Observed crashes by severity before and after RCUT treatment [20] ......................... 27
Table 3-1 Person-injury unit cost by severity [40] ....................................................................... 51
Table 3-2 KABCO description comparison to NDOT [14], [32] ................................................ 51
Table 3-3 Crash Severity Impact factors from RCUT and roundabout implementation. ............ 52
Table 3-4 Construction cost estimates for recent RCUT facilities. .............................................. 53
Table 4-1 List of junctions considered for analysis and pertinent site characteristics. ................ 54
Table 4-2 Roadway geometrics and traffic data for US-81 and NE-91 ....................................... 58
Table 4-3 Roadway geometrics and traffic data for US-81 and NE-32 ....................................... 60
Table 4-4 Roadway geometrics and traffic data for US-75 and NE-32 ....................................... 63
Table 5-1 U-turn locations for RCUT geometric design at each locations (feet) ........................ 67
Table 5-2 TWSC operational analysis of US-81 and NE-91 ....................................................... 68
Table 5-3 AWSC operational analysis of US-81 and NE-91 ....................................................... 69
Table 5-4 Roundabout operational analysis of US-81 and NE-91 ............................................... 70
Table 5-5 RCUT operational analysis of US-81 and NE-91 ........................................................ 70
Table 5-6 TWSC operational analysis of US-81 and NE-32 ....................................................... 71
Table 5-7 AWSC operational analysis of US-81 and NE-32 ....................................................... 72
Table 5-8 Roundabout operational analysis of US-81 and NE-32 ............................................... 73
Table 5-9 RCUT operational analysis of US-81 and NE-32 ........................................................ 73
Table 5-10 TWSC operational analysis of US-75 and NE-35 ..................................................... 74
Table 5-11 AWSC operational analysis of US-75 and NE-35 ..................................................... 75
Table 5-12 Roundabout operational analysis of US-75 and NE-35 ............................................. 76
Table 5-13 RCUT operational analysis of US-75 and NE-35 ...................................................... 76
Table 5-14 Summary of operational analysis results: aggregate intersection delay .................... 77
Table 5-15 Summary of operational analysis results: aggregate intersection delay .................... 78
Table 6-1 Monetized delay costs at case study locations ............................................................. 83
Table 6-2 Monetized crash costs of each intersection design ...................................................... 84
Table 6-3 Cost-benefit analysis of design alternatives................................................................. 86

10
Introduction
1.1 Background and Motivation
Median-divided rural highways have intersections with minor roads that are two-way stop
controlled throughout the less populated areas of Nebraska. These crossings of a high-speed road
with a low-volume crossing street pose severe safety concerns, as drivers pulling out sometimes
misjudge the time available for their maneuver, leading to the most severe types of crashes.
Three example locations that meet the criteria described above were chosen from around the
state of Nebraska for analysis in this report, including the intersection of US Highway 75 (US-75)
and Nebraska Highway 35 (NE-35) just to the west of Dakota City, the intersection of US Highway
81 (US-81) with Nebraska Highway 91 (NE-91) to the east of Humphrey, and the intersection on
US Highway 81 (US-81) with Nebraska Highway 32 (NE-32) east of Madison.
The intersection of US- 75 and NE-35 near Dakota City, is currently an all-way stop-control
(AWSC) intersection has a high crash-rate history including angle, rear-end, and left-turn leaving
crashes. Many solutions have been proposed for this site by the state, including the installation of
a roundabout. The intersection of US-81 with NE-91 to the east of Humphrey, is currently a two-
way stop-controlled (TWSC) intersection experiencing high crash rates, with a frequency that is
nearly four times that of the state average. This intersection has just recently been pushed forward
to receive immediate design changes with the intent to be converted to a restricted crossing u-turn.
Finally, the intersection of US-81 and NE-32 east of Madison is currently TWSC, has had a history
of crash occurrences and has been identified as a concern by NDOT for remediation. This site is
unique in that it has geometry restrictions with its narrow median width.
In all of the cases above, demand volumes are too low to meet volume criteria for signalization.
The state is actively pursuing methods to improve safety, such as providing displaced right-turn
11
lanes, or signalizing these locations in hopes that signal control may help with the crash patterns
observed. In some cases, grade separation is being proposed, a solution that will correct the
existing crash patterns, but will cost roughly 12 million dollars per treatment. This report sets out
to document safe and cost-effective at-grade crossing alternatives, such as the restricted crossing
u-turn design, to improve safety on our road network while limiting expenditures.
1.2 Research Questions and Contribution
This study examines the potential for replacing the standard intersection design at TWSC and
AWSC intersections along rural highways with a roundabout or a restricted crossing u-turn
(RCUT) facility. The geometry of the RCUT design prohibits left- and through-movements from
the side road, and provides a u-turn location downstream from the main crossing. This type of
facility has been implemented for rural highways extensively in both Maryland and North
Carolina, as well as in limited cases in many other states such as Minnesota and Missouri, and has
the potential to serve as a cost effective solution to resolve safety issues within Nebraska.
This research will aid the Nebraska Department of Transportation (NDOT) in providing
guidance on a safe, efficient, and field-tested solution to cost-effectively mitigate current safety
concerns and future conditions at two- and four-way stop controlled intersections of rural highways
and minor roads. As an alternative to providing grade-separation as a safety treatment, the RCUT
design is expected to save up to ten million dollars per treatment location. However, these designs
require a sizable median to implement, and this research is necessary to determine both the best
practices for which geometry to implement in a variety of conditions, but also what the potential
cost impacts could be depending on the existing configuration of the roadway.

12
Recognizing that the RCUT design is not the only potential at-grade alternative,
comparative analysis is performed between TWSC, AWSC, roundabout, and RCUT designs. Cost
effectiveness will include the incorporation of monetized delay experienced by drivers, monetized
safety costs associated with predicted crash frequency and severity, and direct costs associated
with construction of this type of facility.
1.3 Methodology
This research study analyzes predicted safety and economic impacts from the conversion of
traditional two-way stop controlled (TWSC) and all-way stop controlled (AWSC) intersections on
rural highways to safer intersection alternatives such as roundabouts and restricted crossing u-turn
(RCUT) designs. The primary inputs for the study are the existing geometric conditions, the crash
history, and the observed peak-hour traffic at each of the sites selected for study. The output of the
study is the economic analysis of the intersections with both existing and proposed conditions,
using multiple service measures such as average delay per vehicle, and reduction of crash severity
and frequency. Of primary concern is an examination of construction cost, including a return-on-
investment analysis of the implementation of intersection improvements such as roundabouts or
restricted crossing U-turns (RCUT), as this economic analysis will have the greatest impact on the
formation of a decision matrix for future use by the Nebraska Department of Transportation
(NDOT).
Site selection is conducted in conjunction with NDOT, with geometric data collected from
a combination of photogrammetry and site observations, and traffic data collected using MioVision
Scout cameras on site. Operational analysis is conducted using the Highway Capacity Manual
methodology, with validation of results provided by microsimulation.

13
1.4 Document Layout
This thesis is divided into eight chapters. Chapter 1 is the introduction, providing an overview of
the purpose for this research, as well as the methods by which it is investigated. Chapter 2 reviews
the available literature related to the topic, exploring the current state of the practice as well as
identifying key areas for further investigation relating to this research. Chapter 3, the methodology,
provides details about site selection, data collection, operational analysis, safety assessment, and
economic analysis. Chapter 4 reviews the case study sites selected for analysis as well as the
process by which those locations were chosen. Chapter 5 explains the operation analysis portion
of the project, assessing vehicle delay and travel time for four at-grade, unsignalized intersection
designs at each case study location. Chapter 6 discusses cost analysis and return on investment of
each of the design alternatives, and presents a decision matrix providing guidance on when to
select the RCUT design versus other design alternatives. Chapter 7 discusses the limitations of the
work performed during the course of the research. Finally, Chapter 8 provides a summary of the
findings from the research, identifying both conclusions and recommendations for further research
with this area.

14
Literature Review
Restricted Crossing U-turn (RCUT) intersections, also known as J-turns and Superstreets, are an
alternative intersection design solution recently being adopted by many state departments of
transportation to improve safety while maintaining throughput on rural highways. The concept for
the RCUT design was first proposed in the mid-1980s by Richard Kramer. [1] Maryland and North
Carolina were among the first to widely adopt the RCUT intersection design, and it has been
implemented in ten different states at the time of this report’s publication.
This report provides a literature review of the state of research concerning RCUT design. The
main focus of the literature review is on the operational and safety benefits of the design, as well
as geometric design alternatives, and site constraint considerations for implementation. Traffic
characteristics, bicycle/pedestrian considerations, and user perception are also investigated as
secondary considerations.
1.1 Restricted Crossing U-turn Intersection (RCUT)
The Restricted Crossing U-turn concept was first published in the 1980s. Some advantages of the
RCUT design over conventional intersections include a reduction in delay for major street traffic,
and a reduction in conflict points, leading to increased safety. RCUT intersections can be divided
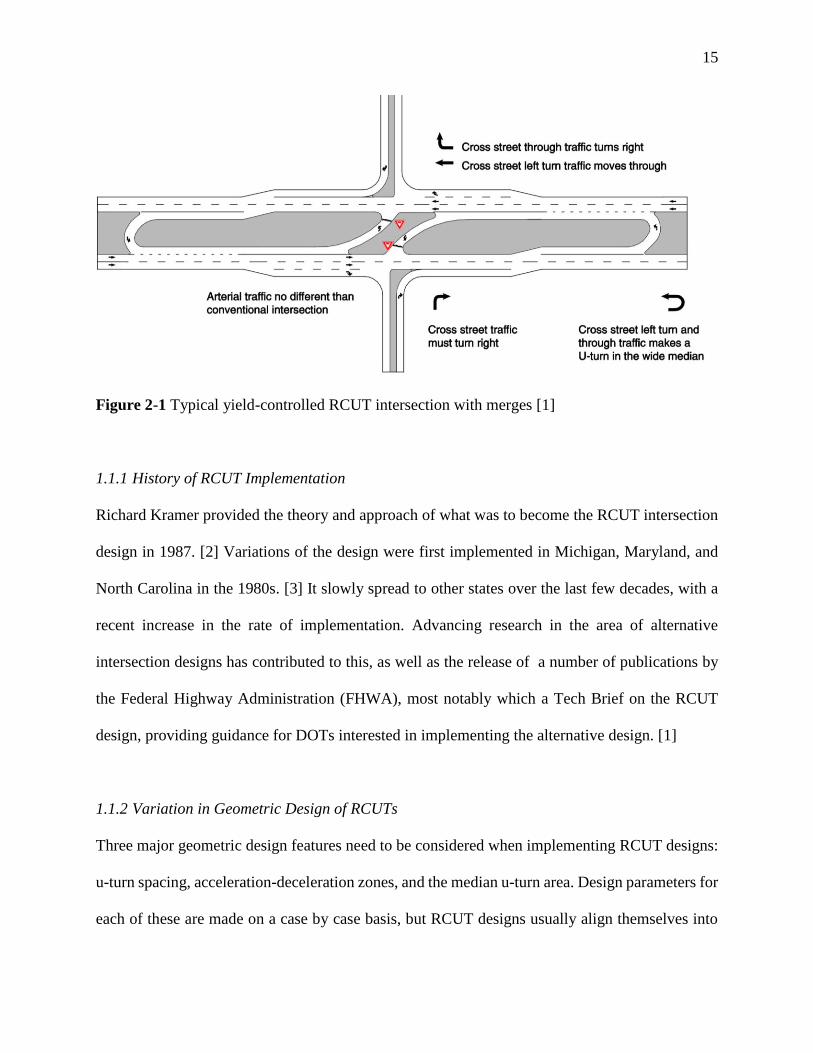
into three different types: signalized, stop-controlled, and merge/yield-controlled [1], though the
majority of implementations and research to date has been with unsignalized RCUT intersections.
RCUT intersections throughout this report are assumed to be unsignalized, unless otherwise stated.
15
Figure 2-1 Typical yield-controlled RCUT intersection with merges [1]
1.1.1 History of RCUT Implementation
Richard Kramer provided the theory and approach of what was to become the RCUT intersection
design in 1987. [2] Variations of the design were first implemented in Michigan, Maryland, and
North Carolina in the 1980s. [3] It slowly spread to other states over the last few decades, with a
recent increase in the rate of implementation. Advancing research in the area of alternative
intersection designs has contributed to this, as well as the release of a number of publications by
the Federal Highway Administration (FHWA), most notably which a Tech Brief on the RCUT
design, providing guidance for DOTs interested in implementing the alternative design. [1]
1.1.2 Variation in Geometric Design of RCUTs
Three major geometric design features need to be considered when implementing RCUT designs:
u-turn spacing, acceleration-deceleration zones, and the median u-turn area. Design parameters for
each of these are made on a case by case basis, but RCUT designs usually align themselves into
16
two categories, urban or rural. Although this report exclusively investigates rural intersections,
urban RCUT designs are also discussed due to their prevalence.
Unlike rural RCUT intersections, which are almost exclusively unsignalized, urban RCUTs
are often signalized, requiring the design of signal-timing patterns, and the movement of
pedestrians through the intersection. Due to increased site constraints, urban RCUT designs are
often more compact, with shorter turn bays, and smaller offsets between the main intersection and
the u-turn location. The u-turn offset is often only a few hundred feet in urban areas, as opposed
to a typical range of 1,000 to 2,000 feet in a rural setting. In addition, the lack of medians in cities
often cause urban RCUT junctions to use pavement bump-outs called “loons,” (because the shape
of the paved area is similar to the head of the bird), beyond the limits of the opposing travel way,
to accommodate the turning radius of larger vehicles.
Although FHWA has provided general guidance on best practices for implementing these
designs, specific geometric layout of these intersections has been left largely to the state DOTs to
design. [1]
1.1.2.1 U-turn Spacing
Determination of the optimal distance between the main intersection and the downstream u-turn
at an RCUT intersection is an ongoing topic of discussion and debate within the literature. Claros
et al. used a crash analysis based approach to determine optimal spacing, finding that crash
frequency decreased as the u-turn spacing increased. [4] Twelve RCUT facilities were studied and
separated into three categories for u-turn spacing: under 1,000 feet, 1,000 to 1,500 feet, and over
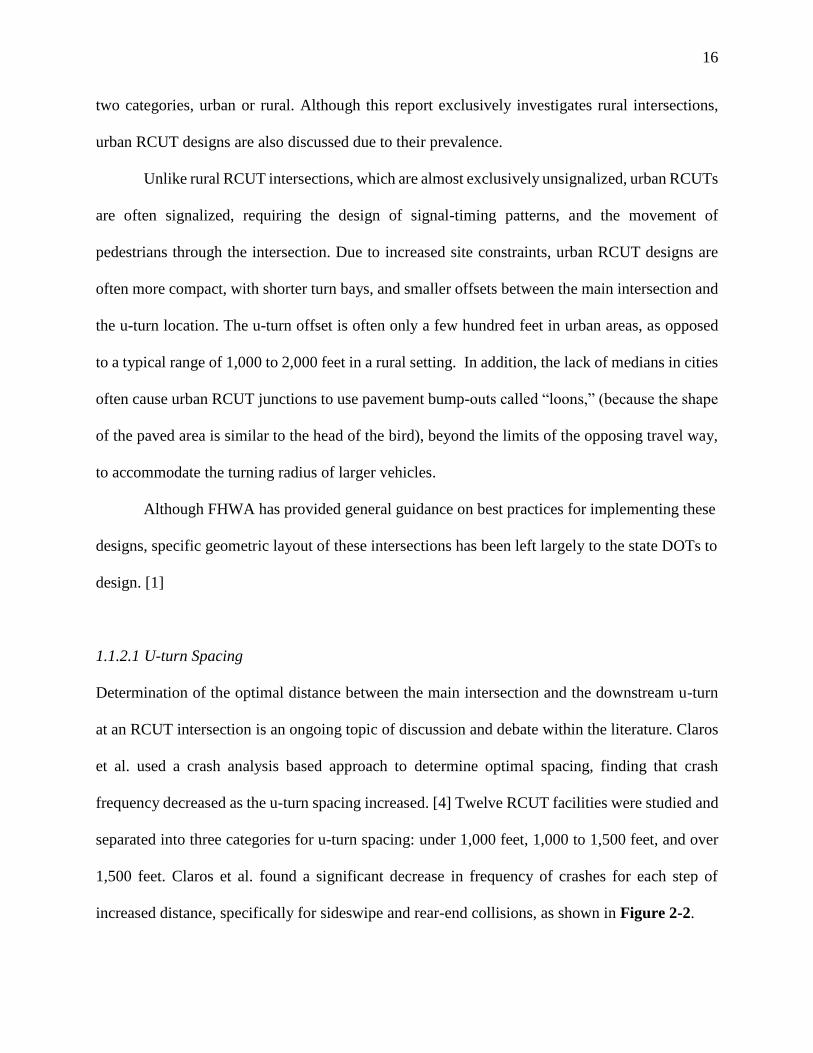
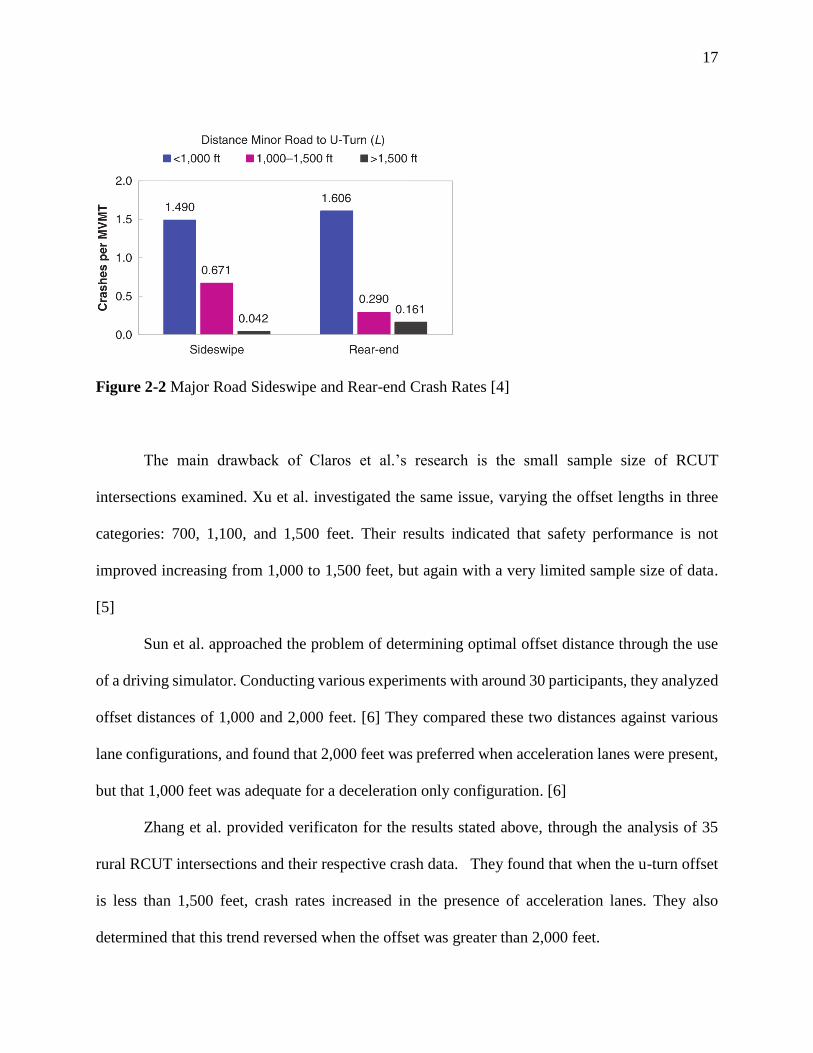
1,500 feet. Claros et al. found a significant decrease in frequency of crashes for each step of
increased distance, specifically for sideswipe and rear-end collisions, as shown in Figure 2-2.
17
Figure 2-2 Major Road Sideswipe and Rear-end Crash Rates [4]
The main drawback of Claros et al.’s research is the small sample size of RCUT
intersections examined. Xu et al. investigated the same issue, varying the offset lengths in three
categories: 700, 1,100, and 1,500 feet. Their results indicated that safety performance is not
improved increasing from 1,000 to 1,500 feet, but again with a very limited sample size of data.
[5]
Sun et al. approached the problem of determining optimal offset distance through the use
of a driving simulator. Conducting various experiments with around 30 participants, they analyzed
offset distances of 1,000 and 2,000 feet. [6] They compared these two distances against various
lane configurations, and found that 2,000 feet was preferred when acceleration lanes were present,
but that 1,000 feet was adequate for a deceleration only configuration. [6]
Zhang et al. provided verificaton for the results stated above, through the analysis of 35
rural RCUT intersections and their respective crash data. They found that when the u-turn offset
is less than 1,500 feet, crash rates increased in the presence of acceleration lanes. They also
determined that this trend reversed when the offset was greater than 2,000 feet.

18
Urban RCUTs have seen much less research on u-turn spacing compared with rural
locations. This is due in part to the geometric restrictions that exist in an urban setting. Within a
rural setting the u-turn can be placed thousands of feet down the road without complicating other
traffic movements. Urban environments are much more compact, and the u-turn is often just a few
hundred feet downstream. The close location of the urban RCUT u-turn bay is largely due to the
signalized control of the movements, as the minor approach weaving movement is not occurring
at the same time as a high-speed major approach through movement, as it does in a rural setting
where the major movements are unimpeded.
1.1.2.2 Acceleration-Deceleration Lanes
Along with the examination of optimal u-turn spacing, Claros et al. determined if the presence of
acceleration lanes made a significant difference in safety. Based analysis of crash histories, they
found that without the presence of acceleration lanes after the minor road there was a 33% increase
in crashes, and a 393% increase if an acceleration lane was not present after the u-turn. [4] They
also used the FHWA’s surrogate safety assessment model (SSAM) to analyze their simulation
models and confirmed that the presence of acceleration lanes leads to a net decrease in conflicts,
regardless of the u-turn offset length. [4]
Sun et al. analyzed the presence of deceleration and acceleration lanes with a driving
simulator. The found that having both acceleration and deceleration lanes decreased critical safety
events by 66.3%, compared with a deceleration-only lane configuration. [6] However, this research
also had a low number of scenarios tested, and a more thorough evaluation was recommended for
the future.
19
1.1.2.3 Median U-turn Considerations
Based on A Policy on Geometric Design of Highways and Streets by AASHTO, typically referred
to as “the Green Book,” [7], Hochstein et al. developed a table using the Green Book’s median u-
turn design criteria that shows the minimum median width for different design vehicles. They
found that the school bus is often the design vehicle used for design of rural highways, requiring
a minimum median width of 63 feet. [8] In contrast, the typical median for rural highways in
Nebraska is 40 feet, so a loon would be necessary to accommodate this design criteria.
1.2 Operational Impacts
In addition to site geometry, operational impacts of the intersection need to be considered,
encompassing travel time, delay, travel time reliability, movement prioritization, and multi-modal
considerations. The operational impacts of an RCUT design are dependent on the existing travel
demand flowrates, and lane configurations of the intersection should be tailored to turn-movement
demands at each site for proper analysis.
1.2.1 Overview of Operational Impacts for RCUT designs
The u-turn offset is the geometric feature that has the largest effect on the overall delay experienced
by motorists as they travel through the intersection. The u-turn offset is dictated by site restrictions
and safety needs. [5] Engineers create the offset as short as possible without compromising safety
in order to keep travel time to a minimum. It should be noted that additional travel time due to
rerouting when traveling through an RCUT only applies to minor-street through and left-turning
movements.
20
Haley et al. found in their simulation study that RCUTs had a lower travel time standard
deviation compared with an equivalent conventional intersection, meaning that although travel
times may have increased, they were more consistent. [9] Their study also revealed that RCUTs
led to an overall reduction in travel time, for some volume scenarios, relative to specific other
intersection designs such as the all-way stop controlled intersection (AWSC). The nature of the
RCUT intersection prioritizes the major approach movements over the left and through movements
at the minor approach. The major road’s traffic will flow unimpeded for the most part compared
with a conventional AWSC intersection. From a safety perspective there is an adjustment of traffic
conflict zones. Instead of one concentrated area at the main intersection, the points of conflict are
spread out, allowing motorists to focus on fewer movements at a time to maintain safety. In
addition to the spreading of conflict points, there is an overall reduction in number of them, which
provides the theory behind the safety results that have been observed at these intersections when
implemented. [10]
The RCUT design is now established enough that researchers have begun to examine multi-
modal considerations. Holzem et al. conducted an in-depth study of pedestrian and bicyclist
accommodations at RCUT intersections, examining multiple crossing patterns for pedestrians and
bikes to optimize the average travel time and number of stops. [11] Although this is a primary
concern for urban RCUT implementations, pedestrian and bicycle concerns are largely not
applicable for rural highway locations.
1.2.2 Travel Time Impacts of RCUTs
Holzem et al. found that the travel time at the RCUT intersection was reduced compared with the
AWSC intersection. [11] In respect to individual turn movements, the minor approach’s left and

21
through movements have an increased delay, but the major street’s through and left movements
experience a decrease in delay, with unimpeded through movements resulting in the aggregate
increase in performance in terms of average delay per vehicle.
Kim et al. also found a travel time savings, with a delay reduction of 28% to 31% for an
RCUT design compared with a conventional AWSC intersection, as well as 12% to 23% higher
throughput, or maximum capacity. [12]
1.2.2.1 Travel Time
Travel time at an RCUT intersection is of concern since the minor road has redirected through and
left-turn movements, while the major road through movements are unimpeded. It has been shown
that travel time decreased overall for RCUT intersections compared with their corresponding
conventional signalized intersection, depending on the volume scenarios examined. [13]
Using an empirical evaluation, Edara et al. found that for some traffic demand conditions
that the average wait time at unsignalized RCUTs was half, at 5 seconds, compared to a two-way
stop controlled intersection, at 11 seconds. [14] This wait time reduction comes from the minor
road approach at a location that provided acceleration lanes. In situations without acceleration
lanes the wait time to make a right turn movement would most likely increase because of the need
to find a gap in traffic.
Edara et al. did consider average gap acceptance values of vehicles downstream from the
intersection merging from the acceleration lane into the right lane of traffic, and from the right
lane into the left lane. It was found that these merging maneuvers took 8.3 s and 11.6 s, respectively
[14]. This difference is most likely due to the higher speeds of vehicles in the through lanes. Even
though wait times were reduced, the average travel time for vehicles was 1 minute higher for

22
RCUTs compared with two-way stop controlled intersections, [14] due to vehicles having to travel
downstream to the u-turn before being able to turn around to access their desired direction of travel.
An FHWA report conducted by Bared et al. used traffic simulation software to compare
the operational performance of RCUTs to conventional signalized intersections. They used five
RCUT designs and modeled them against three different traffic scenarios. In the cases when the
minor street traffic was less than 20% of the total flow, RCUTs had an increased throughput
(maximum capacity) of up to 30% and a reduction network travel time by up to 40%. [15]
1.2.2.2 Level of Service
The state of North Carolina has a Level of Service (LOS) program that can be used to determine
the range of AADT volumes for various intersections, including RCUTs. [13] However, this
program only takes into consideration the major road LOS and excludes the minor road traffic,
introducing a bias into their design selection process that other state DOTs may object to.
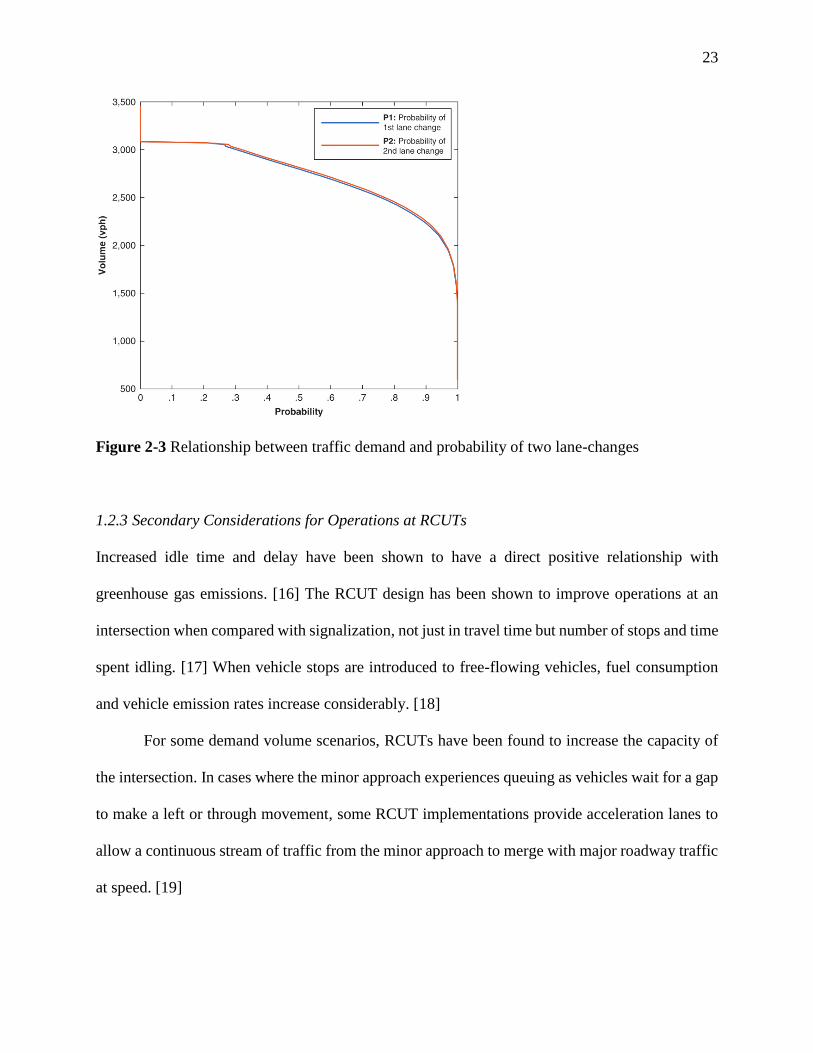
Xu et al. used their linear regression method to find a volume threshold at which the
effectiveness of an unsignalized RCUT starts to fail based on the probability of changing lanes
from the minor road to the u-turn queue bay downstream, as shown below in Figure 2-3. This
model was based on a u-turn offset of 1,500 feet. The threshold seems to be located somewhere
between 2,500 and 3,000 vph.
23
Figure 2-3 Relationship between traffic demand and probability of two lane-changes
1.2.3 Secondary Considerations for Operations at RCUTs
Increased idle time and delay have been shown to have a direct positive relationship with
greenhouse gas emissions. [16] The RCUT design has been shown to improve operations at an
intersection when compared with signalization, not just in travel time but number of stops and time
spent idling. [17] When vehicle stops are introduced to free-flowing vehicles, fuel consumption
and vehicle emission rates increase considerably. [18]
For some demand volume scenarios, RCUTs have been found to increase the capacity of
the intersection. In cases where the minor approach experiences queuing as vehicles wait for a gap
to make a left or through movement, some RCUT implementations provide acceleration lanes to
allow a continuous stream of traffic from the minor approach to merge with major roadway traffic
at speed. [19]
24
1.3 Safety Impacts
By reducing and separating the number of conflict points at the intersection, the RCUT design
leads to significant safety benefits, as is well documented in the literature.
1.3.1 Safety Analysis of Conflict Type
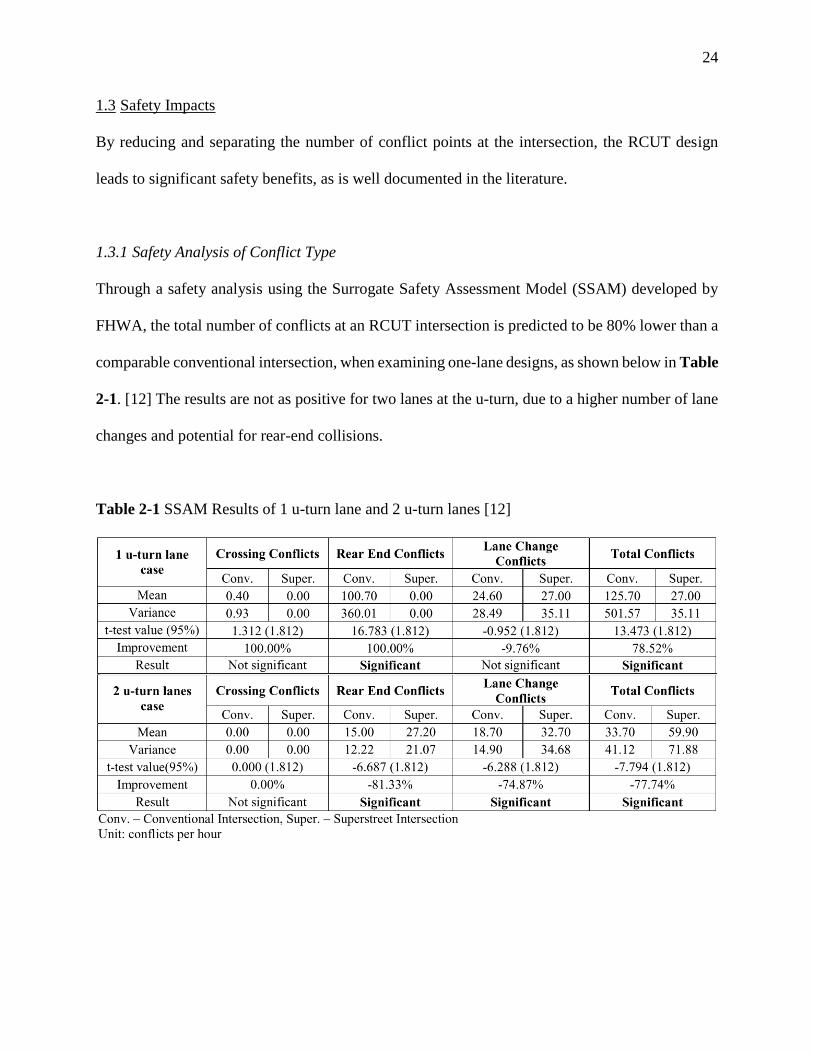
Through a safety analysis using the Surrogate Safety Assessment Model (SSAM) developed by
FHWA, the total number of conflicts at an RCUT intersection is predicted to be 80% lower than a
comparable conventional intersection, when examining one-lane designs, as shown below in Table
2-1. [12] The results are not as positive for two lanes at the u-turn, due to a higher number of lane
changes and potential for rear-end collisions.
Table 2-1 SSAM Results of 1 u-turn lane and 2 u-turn lanes [12]
25
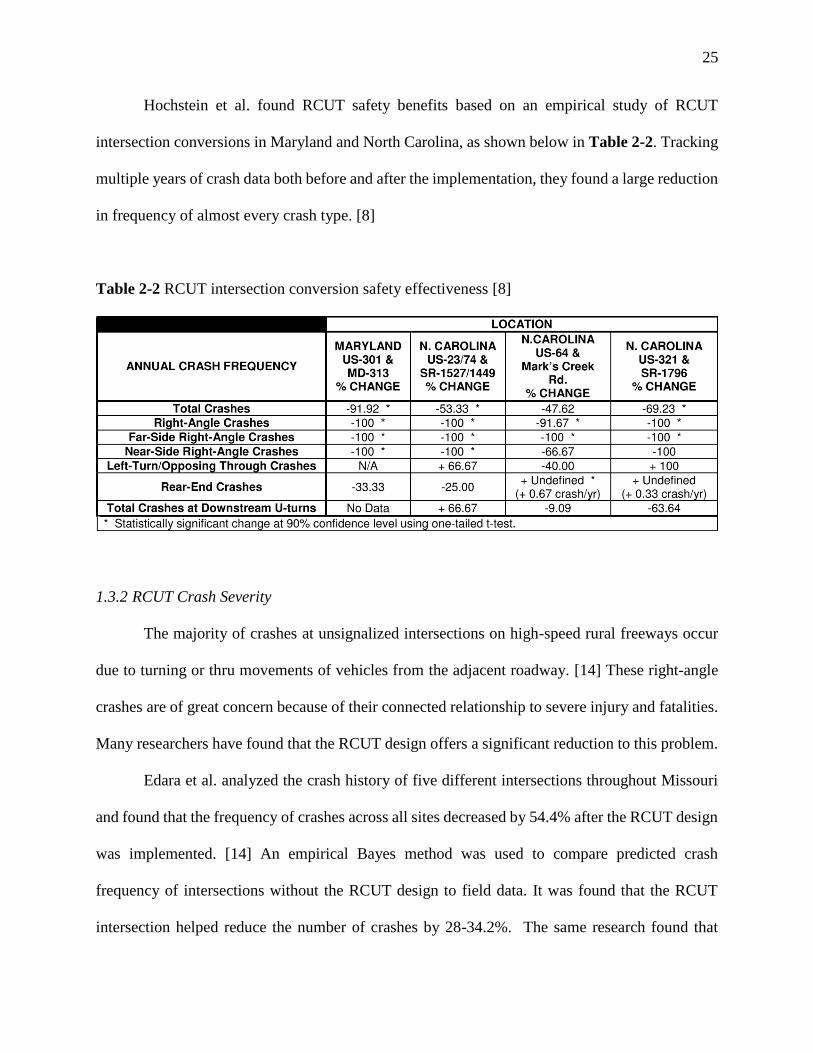
Hochstein et al. found RCUT safety benefits based on an empirical study of RCUT
intersection conversions in Maryland and North Carolina, as shown below in Table 2-2. Tracking
multiple years of crash data both before and after the implementation, they found a large reduction
in frequency of almost every crash type. [8]
Table 2-2 RCUT intersection conversion safety effectiveness [8]
1.3.2 RCUT Crash Severity
The majority of crashes at unsignalized intersections on high-speed rural freeways occur
due to turning or thru movements of vehicles from the adjacent roadway. [14] These right-angle
crashes are of great concern because of their connected relationship to severe injury and fatalities.
Many researchers have found that the RCUT design offers a significant reduction to this problem.
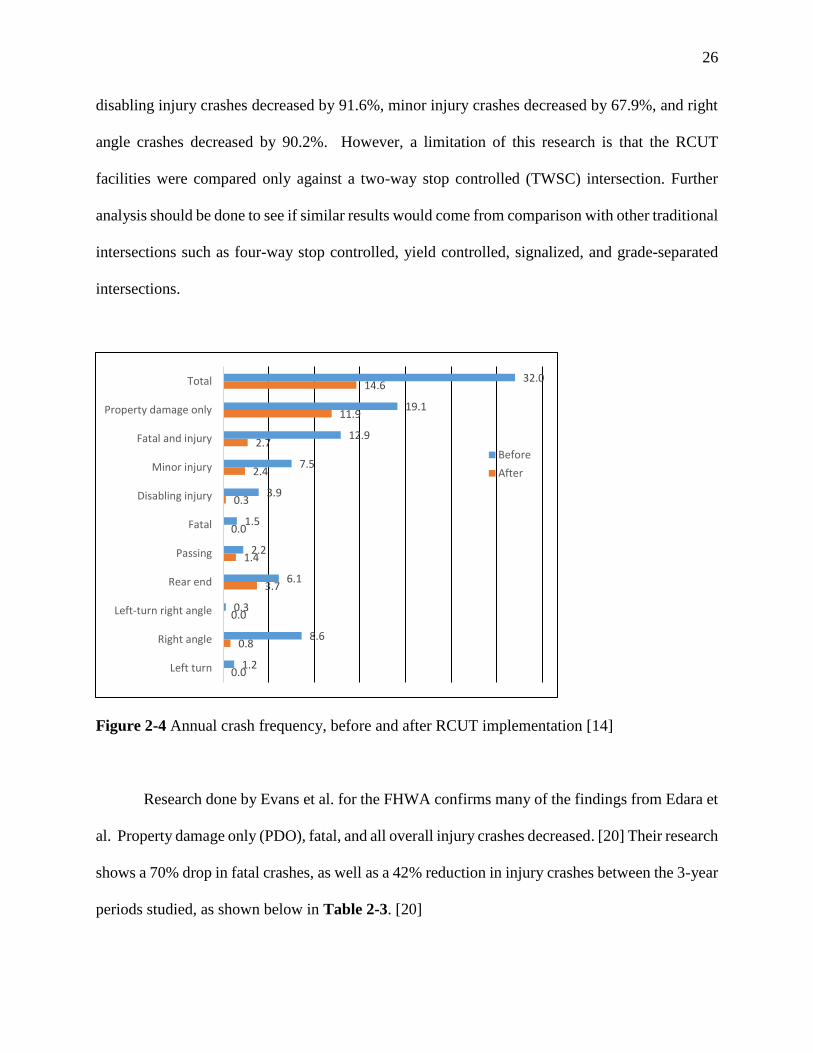
Edara et al. analyzed the crash history of five different intersections throughout Missouri
and found that the frequency of crashes across all sites decreased by 54.4% after the RCUT design
was implemented. [14] An empirical Bayes method was used to compare predicted crash
frequency of intersections without the RCUT design to field data. It was found that the RCUT
intersection helped reduce the number of crashes by 28-34.2%. The same research found that
26
disabling injury crashes decreased by 91.6%, minor injury crashes decreased by 67.9%, and right
angle crashes decreased by 90.2%. However, a limitation of this research is that the RCUT
facilities were compared only against a two-way stop controlled (TWSC) intersection. Further
analysis should be done to see if similar results would come from comparison with other traditional
intersections such as four-way stop controlled, yield controlled, signalized, and grade-separated
intersections.
Figure 2-4 Annual crash frequency, before and after RCUT implementation [14]
Research done by Evans et al. for the FHWA confirms many of the findings from Edara et
al. Property damage only (PDO), fatal, and all overall injury crashes decreased. [20] Their research
shows a 70% drop in fatal crashes, as well as a 42% reduction in injury crashes between the 3-year
periods studied, as shown below in Table 2-3. [20]
0.0
0.8
0.0
3.7
1.4
0.0
0.3
2.4
2.7
11.9
14.6
1.2
8.6
0.3
6.1
2.2
1.5
3.9
7.5
12.9
19.1
32.0
Left turn
Right angle
Left-turn right angle
Rear end
Passing
Fatal
Disabling injury
Minor injury
Fatal and injury
Property damage only
Total
Before
After

27
Table 2-3 Observed crashes by severity before and after RCUT treatment [20]
Ott et al. investigated the safety effects of unsignalized RCUT intersections in North
Carolina. They looked at 13 unsignalized intersections and used a traffic flow adjustment,
comparison group, and Empirical Bayes analysis. [21] In Ott et al.’s research they used the
Highway Safety Manual (HSM) collision prediction model and calculated a calibrated factor that
showed the intersections studied had a higher rate of collisions than the HSM’s assumed values.
Their findings support those of Edara et al.’s, and show a significant reduction in both crash
frequency and severity.

28
Figure 2-5 Unsignalized RCUT and comparison site collisions before construction [21]
1.4 Secondary Impacts
Other secondary considerations when analyzing RCUT implementation, are likely to include
multimodal accommodations, traffic controls, and overall user perception.
1.4.1 Pedestrian and Bicycle Accommodations
The RCUT’s design provides unique challenges for accommodating pedestrian and bicycle traffic.
The RCUT intersection has a sizable geometric footprint that can make crossings difficult. The
federal highway administration only discusses signalized RCUTs when providing
accommodations for pedestrian and bicycle traffic. [1] This is due to the lack of demand by
multimodal traffic rural locations which are likely to have unsignalized RCUT implementation.
Discussion in the literature of pedestrian and bicycle accommodations for RCUTs is assumed to
be under signalized conditions.
29
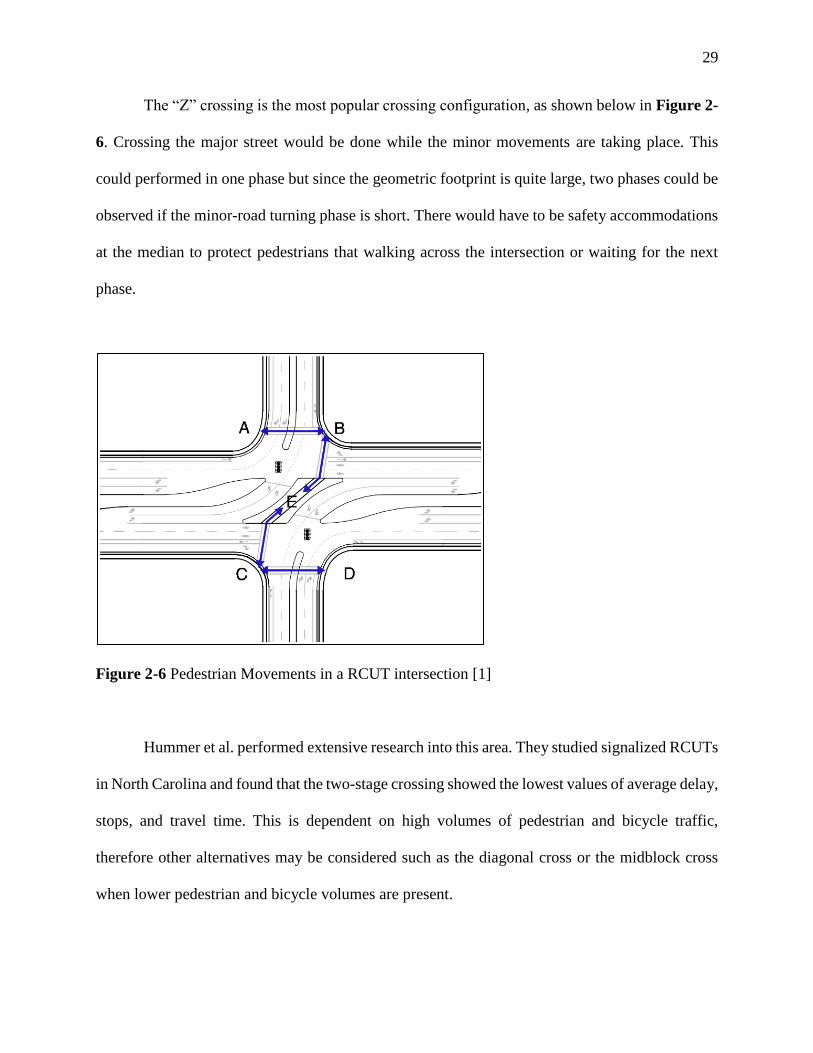
The “Z” crossing is the most popular crossing configuration, as shown below in Figure 2-
6. Crossing the major street would be done while the minor movements are taking place. This
could performed in one phase but since the geometric footprint is quite large, two phases could be
observed if the minor-road turning phase is short. There would have to be safety accommodations
at the median to protect pedestrians that walking across the intersection or waiting for the next
phase.
Figure 2-6 Pedestrian Movements in a RCUT intersection [1]
Hummer et al. performed extensive research into this area. They studied signalized RCUTs
in North Carolina and found that the two-stage crossing showed the lowest values of average delay,
stops, and travel time. This is dependent on high volumes of pedestrian and bicycle traffic,
therefore other alternatives may be considered such as the diagonal cross or the midblock cross
when lower pedestrian and bicycle volumes are present.
30
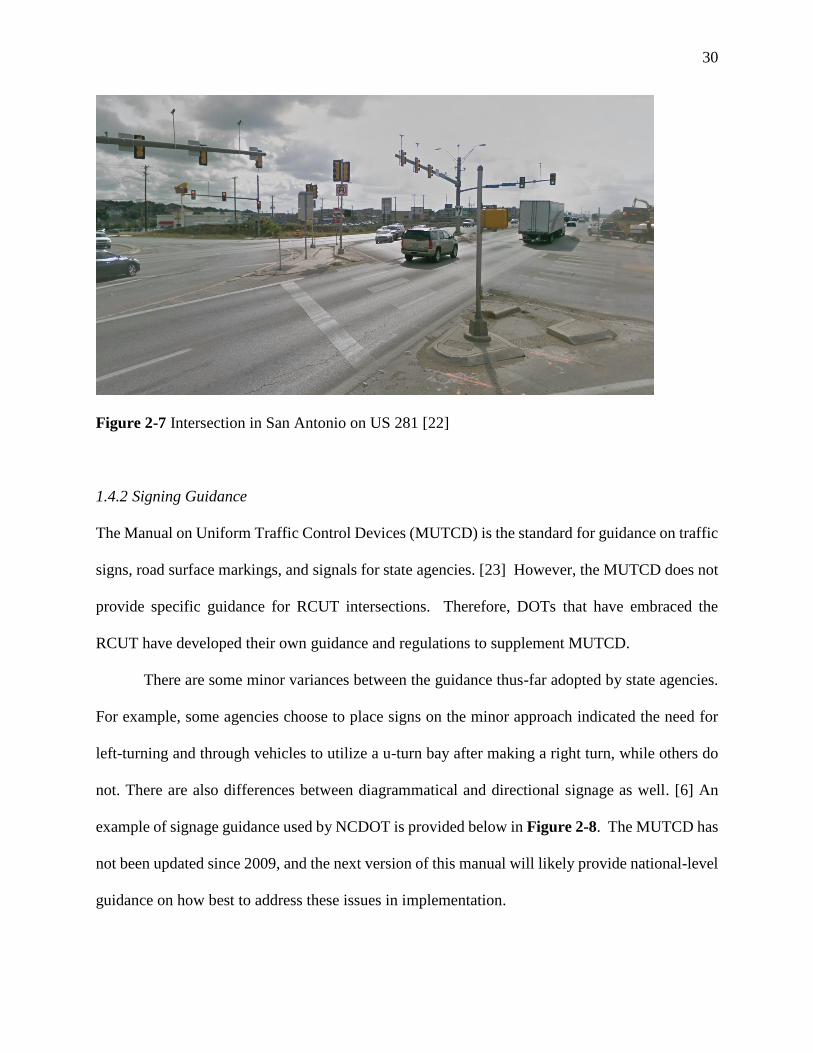
Figure 2-7 Intersection in San Antonio on US 281 [22]
1.4.2 Signing Guidance
The Manual on Uniform Traffic Control Devices (MUTCD) is the standard for guidance on traffic
signs, road surface markings, and signals for state agencies. [23] However, the MUTCD does not
provide specific guidance for RCUT intersections. Therefore, DOTs that have embraced the
RCUT have developed their own guidance and regulations to supplement MUTCD.
There are some minor variances between the guidance thus-far adopted by state agencies.
For example, some agencies choose to place signs on the minor approach indicated the need for
left-turning and through vehicles to utilize a u-turn bay after making a right turn, while others do
not. There are also differences between diagrammatical and directional signage as well. [6] An
example of signage guidance used by NCDOT is provided below in Figure 2-8. The MUTCD has
not been updated since 2009, and the next version of this manual will likely provide national-level
guidance on how best to address these issues in implementation.

31
Figure 2-8 Stop-controlled RCUT intersection signing guidance from NCDOT [1]
Some research has been conducted specifically in the area of signage best-practices at
RCUT facilities. Sun et al. performed a driving simulator experiment to see whether drivers prefer
to drive using diagrammatical- or directional-style signage. [6] They found little difference, with
37% of the drivers surveyed preferring diagrammatic and 47% preferring directional, with the
remaining participants indifferent.
1.4.3 User Perception
Ott et al. studied resident, commuter, and business perceptions of RCUT installations, using
surveys of the stakeholders in the area. [24] Most residents living near the RCUTs agreed that it
32
increased safety and saw its benefits. Commuters using the intersection perceived the RCUT to be
more challenging to navigate, but felt strongly about savings in travel time and queue lengths.
Business owners on the other hand felt it created confusion for their customers, and were concerned
that it would negatively impact business. [24]
A driving simulator study done by Sun et al. investigated user’s perception of the
intersection as well, but had more experienced participants, with 77% having driven through
RCUTs in the past. The majority of participants perceived RCUTs to be easy to navigate, had an
appreciation for the safety benefits they provided, and felt safer driving through the RCUT instead
of the equivalent two-way stop controlled intersection. [6] The study also surveyed drivers on their
opinion of RCUT geometry variances, finding that they preferred having both acceleration and
deceleration lanes present as well as longer u-turn offsets, with 83% of respondents preferring the
2,000 foot offset versus only 1,000. [6]
1.5 Economic Analysis
Several economic analyses have been done examining the conversion of TWSC intersections to
various other geometries. Bonneson et al. first analyzed the conversion of a TWSC to either a
signalized intersection or a grade-separated interchange (GSI). [25] They found that the GSI had
a better return on investment than installing a signal, particularly when the minor road demand is
less than half of the major, which is the case for the majority of high-speed rural intersections in
Nebraska. Zhao et al. assessed the safety and economic factors of converting a TWSC on rural
high-speed locations to roundabouts, and found that the average conversion of these locations with
higher-than-normal crash histories resulted in a cost benefit of between $1.0 and $1.6 million
annually, based on reduced crash severity and frequency. [26]

33
Morello et al. did a preliminary economic analysis on RCUTs for safety mitigation on rural
highways, estimating construction costs based an example RCUT project from the FHWA
Information Guide on Restricted Crossing U-turns. [1], [27] They found in most cases that safety
and operational benefits of the RCUT provide the best return on investment within a few years,
even compared against maintaining the existing TWSC geometry.

34
Methodology
This research study analyzes predicted safety and economic impacts from the conversion of
traditional two-way stop controlled (TWSC) and all-way stop controlled (AWSC) intersections on
rural highways to safer intersection alternatives such as roundabouts and restricted crossing u-turn
(RCUT) designs. The primary inputs for the study are the existing geometric conditions, the crash
history, and the observed peak-hour traffic at each of the sites selected for study. The output of the
study is the economic analysis of the intersections with both existing and proposed conditions,
using multiple service measures including average delay per vehicle, reduction of crash severity
and frequency, and a number of secondary output measures such as idle time. Of primary concern
is an examination of construction cost, including a return-on-investment analysis of the
implementation of intersection improvements such as roundabouts or restricted crossing U-turns
(RCUT), as this economic analysis will have the greatest impact on the formation of a decision
matrix for future use by the Nebraska Department of Transportation (NDOT).
Proposed Restricted Crossing U-turn Geometric Design
The proposed RCUT analyzed is stop controlled on all movements but the major route through
and right-turns. The north and south U-turns are located 1,300 feet and 1,600 feet respectively
from the main intersection. Deceleration lanes are included for both the U-turn approach and the
right turning vehicles from the major-roads. All other geometric features are standard RCUT
design as laid out in the FHWA RCUT informational manual [1]. Figure 3-1 shows a typical
layout implemented as a VISSIM model.
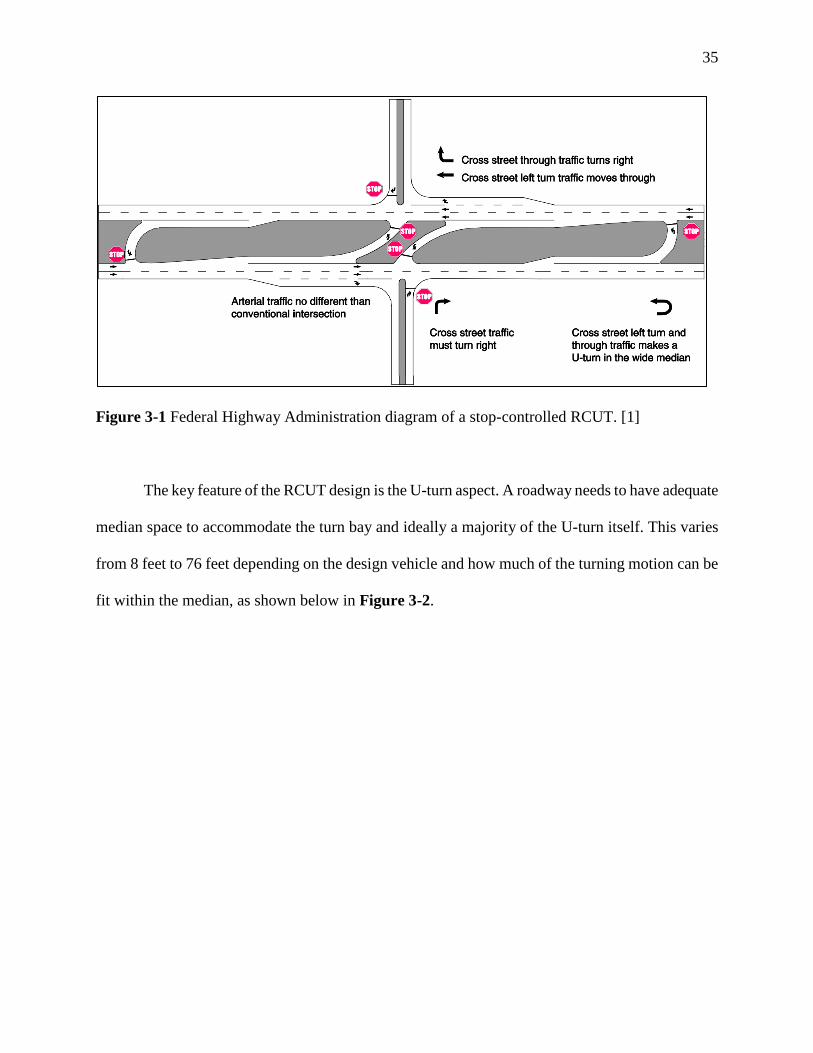
35
Figure 3-1 Federal Highway Administration diagram of a stop-controlled RCUT. [1]
The key feature of the RCUT design is the U-turn aspect. A roadway needs to have adequate
median space to accommodate the turn bay and ideally a majority of the U-turn itself. This varies
from 8 feet to 76 feet depending on the design vehicle and how much of the turning motion can be
fit within the median, as shown below in Figure 3-2.

36
Figure 3-2 AASHTO-recommended minimum median widths for U-turn crossovers [1]
When the U-turn maneuver cannot be completed within the median, extra roadway surface
needs to be installed on the shoulder of the major road where the U-turn is being completed. These
geometric features are known as loons. They allow for locations restricted by geometry to
accommodate a RCUT design. At locations without an existing median, a realignment of the
highway, with corresponding additional cost would be incurred.
1.2 Case Study Location Selection Methodology
The case study locations selected were chosen in consultation with the staff at the Nebraska
Department of Transportation (NDOT). Key characteristics of potential sites include those that are

37
currently experiencing safety issues, as well as a variety of existing roadway conditions to assess
potential cost impacts of exiting median widths.
Both the RCUT and roundabout designs improve safety by restricting movement of left-
turning vehicles, reducing and separating vehicle conflict points at an intersection. The best
locations for introducing RCUT intersections into Nebraska would therefore be experiencing
higher than acceptable crash histories, specifically with a significant number of crashes involving
left-turning vehicles. However, a major concern of NDOT is the efficient allocation of limited
resources, so cost considerations must also be a major factor in choosing potential locations for
these intersection improvements. The sites selected therefore, were chosen to exhibit a variety of
existing geometric designs, specifically with varying existing median widths, so that the potential
cost of roadway realignment could be factored into remediation decisions.
1.3 Traffic Data Collection Methodology
To collect the necessary traffic data for this study, four Miovision Scout cameras were placed at
each intersection study location. An example of the equipment setup is shown below in Figure 3-
3. All data was collected during the month of April for all locations. This was done to ensure that
that school-related traffic would be measured. Data collection was conducted between Tuesday
and Thursday, under normal weather conditions. This meant that visibility was clear and no
precipitation.

38
Figure 3-3 Setup of Miovision Scout cameras
The collected video data was uploaded for processing to Miovision, which analyzes the
video data and provides traffic volume measurements as turn-movement counts for each fifteen-
minute period for the duration of the video recording.
1.4 Operational Analysis Methodology
Operational analysis of the case study locations focuses primarily on the standard metrics
established by the Highway Capacity Manual, using the average delay of vehicles at the
intersection during the peak hour of demand. [28] This measure serves as an indicator for the
overall performance of the intersection, communicating its success or failure related to congestion.
Secondary analysis includes the investigation of the average delay of specific turn-movements;
identifying root causes of intersection underperformance. Specific to the use of alternative

39
intersections as a mitigation strategy, some turn-movement groups become more important than
others, due to restrictions and redirection of turn-movements.
The data was analyzed using two separate software applications: Vistro and VISSIM.
Vistro is a traffic modeling software based on the Highway Capacity Manual (HCM) [29]
methodology, which utilizes macroscopic flow parameters to analyze traffic performance. VISSIM
is a micro-simulation traffic modeling software, modeling the flow of each car through a road
network [30]. The results from both applications are compared later in this report, showing the
strengths and shortfalls of the methodology of each.
1.4.1 HCM Analysis
To establish a baseline for the analysis of case study sites, the existing network performance is
analyzed in Vistro. Vistro allows for easy adaptation of the different geometries present at the
study locations, so many more alternative designs can be modeled in a short period of time, relative
to conducting microsimulation analysis. Vistro is limited, however, in its ability to evaluate
alternative intersections, as it only includes HCM analysis included in the 2010 edition of the
HCM. Hand calculations were performed to obtain RCUT HCM results, based on the 2016 edition
of the manual.
Traffic volumes, heavy vehicle percentatges, and peak-hour factors were all gathered from field
data collection and inputted into Vistro. This information is supplmented with geometric
characteristics such as median width, lane width, and merge and turn lane pocket lengths. Other
key parameters such as free-flow speed are also accounted for. Vistro then incorporates default
values for HCM parameters not observed or calibrated in the field.
40
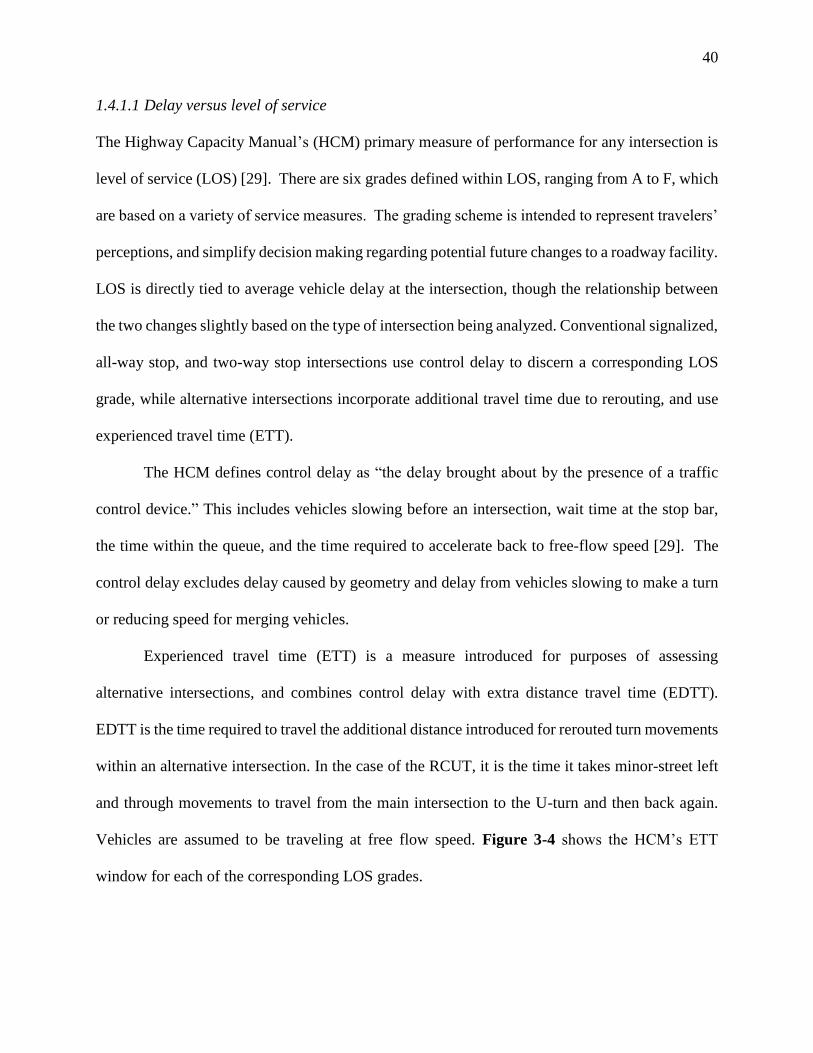
1.4.1.1 Delay versus level of service
The Highway Capacity Manual’s (HCM) primary measure of performance for any intersection is
level of service (LOS) [29]. There are six grades defined within LOS, ranging from A to F, which
are based on a variety of service measures. The grading scheme is intended to represent travelers’
perceptions, and simplify decision making regarding potential future changes to a roadway facility.
LOS is directly tied to average vehicle delay at the intersection, though the relationship between
the two changes slightly based on the type of intersection being analyzed. Conventional signalized,
all-way stop, and two-way stop intersections use control delay to discern a corresponding LOS
grade, while alternative intersections incorporate additional travel time due to rerouting, and use
experienced travel time (ETT).
The HCM defines control delay as “the delay brought about by the presence of a traffic
control device.” This includes vehicles slowing before an intersection, wait time at the stop bar,
the time within the queue, and the time required to accelerate back to free-flow speed [29]. The
control delay excludes delay caused by geometry and delay from vehicles slowing to make a turn
or reducing speed for merging vehicles.
Experienced travel time (ETT) is a measure introduced for purposes of assessing
alternative intersections, and combines control delay with extra distance travel time (EDTT).
EDTT is the time required to travel the additional distance introduced for rerouted turn movements
within an alternative intersection. In the case of the RCUT, it is the time it takes minor-street left
and through movements to travel from the main intersection to the U-turn and then back again.
Vehicles are assumed to be traveling at free flow speed. Figure 3-4 shows the HCM’s ETT
window for each of the corresponding LOS grades.
41
Figure 3-4 LOS Criteria for Each O-D within Alternative Intersections (HCM)
1.4.1.2 Two-way Stop Controlled Intersection LOS
The delay for two-way stop controlled intersections is measured in two different ways in this study.
The first uses the Highway Capacity Manual (HCM), the standard in the transportation industry
for traffic studies. The HCM uses assumptions from empirical data gathered from previous studies,
but is somewhat inflexible to different types of driver behavior across the country. Also, it does
not account for through or right turn delay, instead assuming that there is nominal delay if vehicles
are not stopped by a traffic control device. Sources of delay experienced in the field but not
included in the HCM methodology include impacts of the environment, friction from side street
traffic, lane changing behavior, and high vehicle volumes. This being said, the HCM provides an
industry standard operations estimation based on well researched and calibrated traffic parameters.
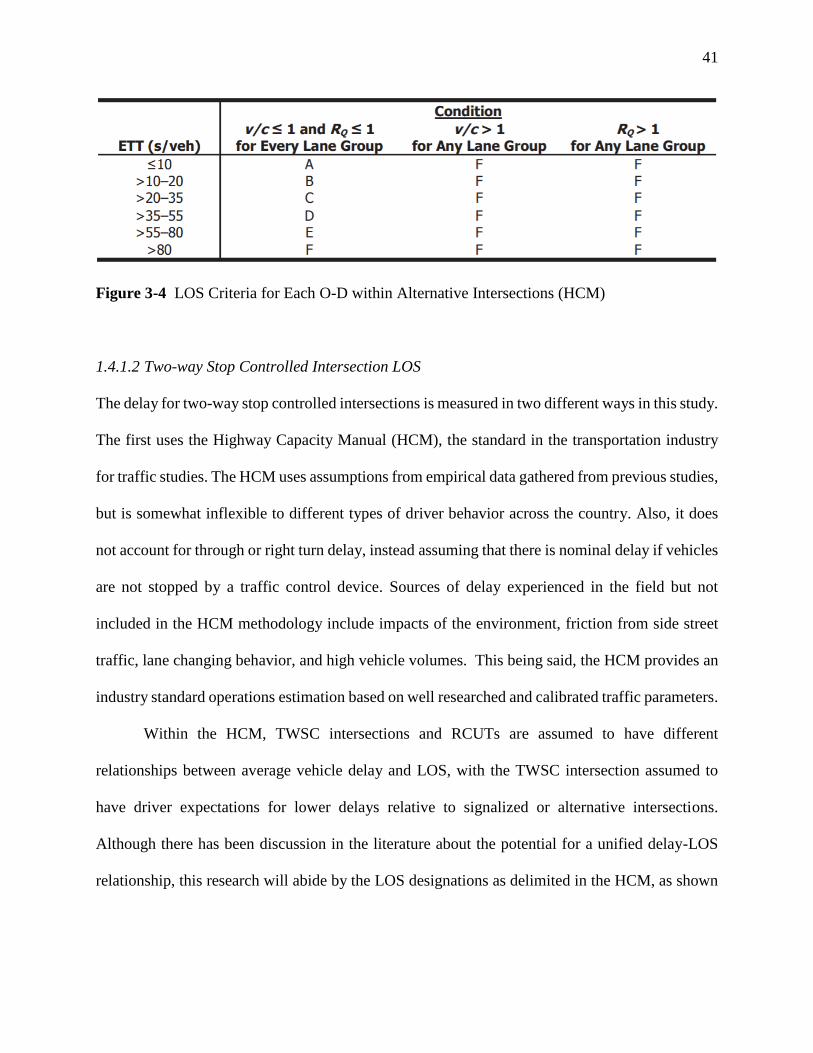
Within the HCM, TWSC intersections and RCUTs are assumed to have different
relationships between average vehicle delay and LOS, with the TWSC intersection assumed to
have driver expectations for lower delays relative to signalized or alternative intersections.
Although there has been discussion in the literature about the potential for a unified delay-LOS
relationship, this research will abide by the LOS designations as delimited in the HCM, as shown
42
below in Figure 3-5, with signalized interchange denoting intersection designs including RCUTs.
[31]
Figure 3-5 Relationship between average vehicle delay and LOS. [31]
1.4.1.3 Restricted Crossing U-Turn LOS
The HCM added methodology to analyze RCUTs in the 6th edition, in 2016. Because there is not
yet a significant amount of literature examining the robustness of this new methodology for
evaluating RCUT intersections, this report attempts to validate the RCUT analysis results from the
HCM using microsimulation results from VISSIM traffic simulation software. Calculating a
robust and reliable average delay per vehicle is important for a cost benefit analysis.
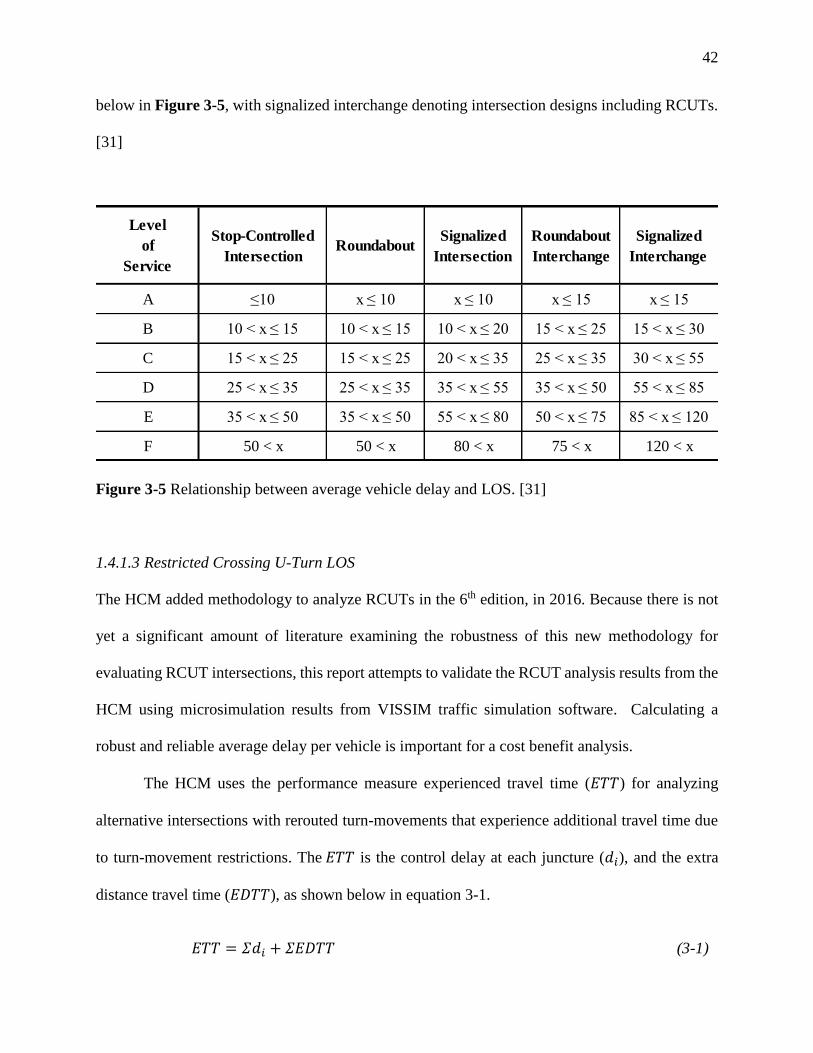
The HCM uses the performance measure experienced travel time (𝐸𝑇𝑇) for analyzing
alternative intersections with rerouted turn-movements that experience additional travel time due
to turn-movement restrictions. The 𝐸𝑇𝑇 is the control delay at each juncture (𝑑𝑖), and the extra
distance travel time (𝐸𝐷𝑇𝑇), as shown below in equation 3-1.
𝐸𝑇𝑇 = 𝛴𝑑𝑖 + 𝛴𝐸𝐷𝑇𝑇 (3-1)
Level
of
Service
Stop-Controlled
IntersectionRoundabout
Signalized
Intersection
Roundabout
Interchange
Signalized
Interchange
A ≤10 x ≤ 10 x ≤ 10 x ≤ 15 x ≤ 15
B 10 < x ≤ 15 10 < x ≤ 15 10 < x ≤ 20 15 < x ≤ 25 15 < x ≤ 30
C 15 < x ≤ 25 15 < x ≤ 25 20 < x ≤ 35 25 < x ≤ 35 30 < x ≤ 55
D 25 < x ≤ 35 25 < x ≤ 35 35 < x ≤ 55 35 < x ≤ 50 55 < x ≤ 85
E 35 < x ≤ 50 35 < x ≤ 50 55 < x ≤ 80 50 < x ≤ 75 85 < x ≤ 120
F 50 < x 50 < x 80 < x 75 < x 120 < x

43
Within the analysis of an RCUT intersection at the crossing of a minor roadway with the
high-speed rural highway, the standard HCM analysis is used for all of the major-road movements
as well as the minor-road right turn movements, since these are not impacted by the geometric
restrictions. For the minor-road through and left turn movements, an additional geometric delay
must be calculated at both downstream U-turn locations. This can be done using the following
equation 3-2, as provided in the HCM.
𝑐𝑝,𝑥 = 𝑣𝑐,𝑥𝑒−(𝑣𝑐,𝑥𝑡𝑐,𝑥)/3,600
1−𝑒−(𝑣𝑐,𝑥𝑡𝑓,𝑥)/3,600
(3-2)
Where 𝑐𝑝,𝑥 is the potential capacity of movement 𝑥 (veh/h), 𝑣𝑐,𝑥 is the conflicting flow
rate for movement 𝑥 (veh/h), 𝑡𝑐,𝑥 is the critical headway for minor movement 𝑥 (s), and 𝑡𝑓,𝑥 is the
follow-up headway for minor movement 𝑥 (s). After defining the capacity for the U-turn
movement, this quantity can be used to calculate the control delay, 𝑑, as shown in equation 3-3.
𝑑 =3,600
𝑐𝑚,𝑥+ 900𝑇 [
𝑣𝑥
𝑐𝑚,𝑥− 1 + √(
𝑣𝑥
𝑐𝑚,𝑥− 1)
2
+(
3,600
𝑐𝑚,𝑥)(
𝑣𝑥𝑐𝑚,𝑥
)
450𝑇] + 5 (3-3)
Where 𝑐𝑚,𝑥 is the capacity of movement 𝑥 (veh/h) and is 𝑐𝑝,𝑥 from the previous equation.
T is the analysis time period and has a value of 0.25 h for a 15-min period. 𝑣𝑥 is the flowrate for
movement 𝑥 in veh/h.
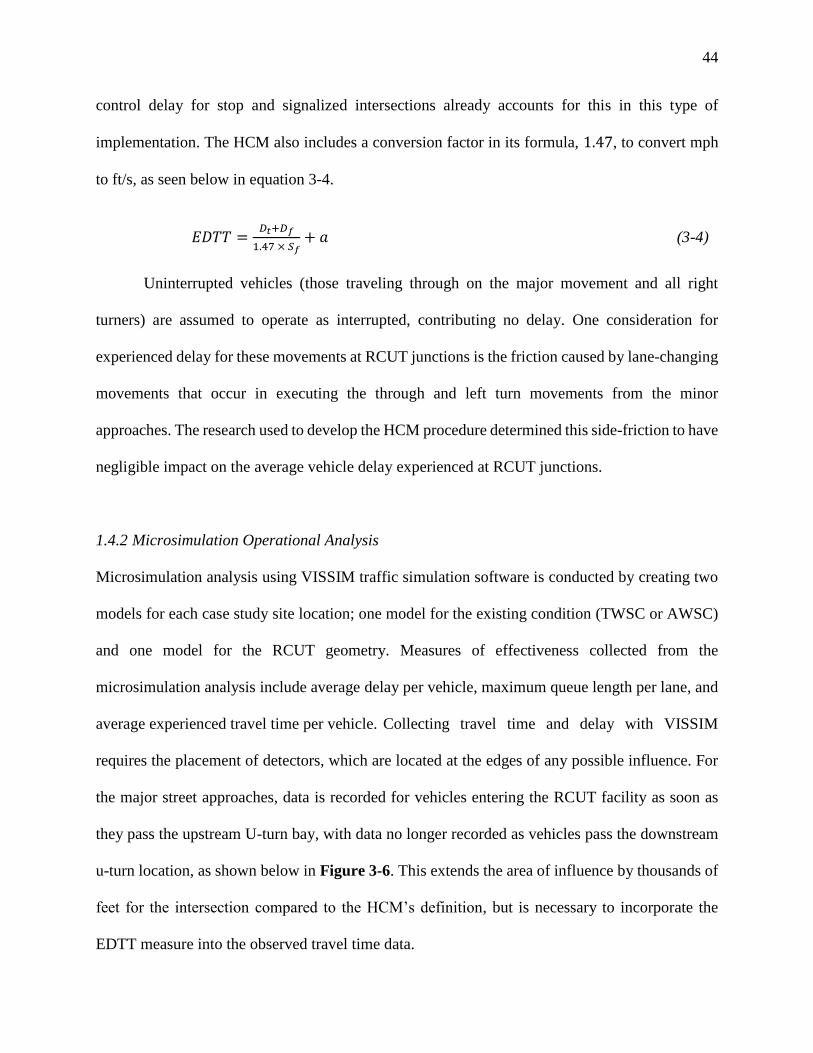
Referring back to equation 3-1, the last component to define is the 𝐸𝐷𝑇𝑇. For an RCUT,
the 𝐸𝐷𝑇𝑇 is simply calculated as the distance from the main junction to the U-turn crossover (𝐷𝑡),
and the distance from the U-turn crossover back to the main junction (𝐷𝑓), divided by the major-
street free-flow speed. The delay associated with the deceleration into a turn and the acceleration
from the turn (𝑎), is considered to be negligible, and only relevant for RCUTs with merges. The
44
control delay for stop and signalized intersections already accounts for this in this type of
implementation. The HCM also includes a conversion factor in its formula, 1.47, to convert mph
to ft/s, as seen below in equation 3-4.
𝐸𝐷𝑇𝑇 =𝐷𝑡+𝐷𝑓
1.47 × 𝑆𝑓+ 𝑎 (3-4)
Uninterrupted vehicles (those traveling through on the major movement and all right
turners) are assumed to operate as interrupted, contributing no delay. One consideration for
experienced delay for these movements at RCUT junctions is the friction caused by lane-changing
movements that occur in executing the through and left turn movements from the minor
approaches. The research used to develop the HCM procedure determined this side-friction to have
negligible impact on the average vehicle delay experienced at RCUT junctions.
1.4.2 Microsimulation Operational Analysis
Microsimulation analysis using VISSIM traffic simulation software is conducted by creating two
models for each case study site location; one model for the existing condition (TWSC or AWSC)
and one model for the RCUT geometry. Measures of effectiveness collected from the
microsimulation analysis include average delay per vehicle, maximum queue length per lane, and
average experienced travel time per vehicle. Collecting travel time and delay with VISSIM
requires the placement of detectors, which are located at the edges of any possible influence. For
the major street approaches, data is recorded for vehicles entering the RCUT facility as soon as
they pass the upstream U-turn bay, with data no longer recorded as vehicles pass the downstream
u-turn location, as shown below in Figure 3-6. This extends the area of influence by thousands of
feet for the intersection compared to the HCM’s definition, but is necessary to incorporate the
EDTT measure into the observed travel time data.

45
Figure 3-6 VISSUM model's area of influence (not to scale)
Microsimulation models, such as VISSUM, calculate the experienced delay for a vehicle
as the cumulative difference between the expected velocity and the experienced velocity as it
traverses a network. In the case of alternative intersections, the vehicle may encounter additional
travel distance without incurring additional control delay, so long as the desired velocity is met
along the stretch. In the case of RCUT intersections, the vehicle may encounter additional travel
distance without additional control delay, as long as the desired velocity is met along the stretch.
The HCM only accounts for the travel time it takes to pass through and return to the original
intersection. One proposed solution is to tie the travel time metric back to the delay metric by
defining a base condition independent of geometry, with each origin-destination point equidistant
from the centroid of the intersection, and a base travel time based on the posted speed limit at the
site. [31]
The models created take an approach in-between these two and ensures that the area of
influence was captured but no more. This means that each detector was placed immediately after
Minor Street
Major Street
Entry to Area of Influence
Exit to Area of Influence
46
the U-turns on the major streets. The minor streets were a little different and they were calculated
by measuring the max queue and placing the detector just beyond the measured distance. This
ensures that no delay is left unmeasured.
Each simulation was run for 25 minutes, with data collected on all vehicles scheduled to
enter the network between 5 and 20 minutes. The initial five minutes allows traffic on the network
to load from zero vehicles up to steady-state conditions, and the last five minutes allows for
vehicles which have just entered the network to complete their travel before metrics are taken on
them. Each volume scenario simulation was run with ten different random seeds, for a total of 150
minutes worth of data to generate robust aggregate results.
The VISSUM model was calibrated for the existing conditions scenarios using the HCM’s
TWSC methodology. The TWSC methodology within the HCM has been extensively validated
and is widely considered to be a reliable methodology. The simulation values calibrated for the
TWSC scenario are then implemented in the RCUT scenarios to ensure an unbiased comparative
analysis between the two.
The primary variable used for calibration was the vehicle headway. Typical vehicle
headways within the HCM methodology assume 4.2 seconds; which is implemented at each
turning or merging conflict point to ensure that the simulated vehicles waited for the proper gap in
traffic. The speed distribution and passing characteristics were adjusted to match observed field
conditions.
1.5 Safety Benefits of Alternative Geometries
Crash Modification Factors (CMFs) are the measure the safety effectiveness of an intersection
treatment primarily used by the Highway Safety Manual [32], and have become an industry
standard for predictive safety analysis. Safety performance of RCUTs have been evaluated
47
extensively. RCUTs have less conflict points than a conventional intersection, which does not
necessarily mean that they are safer, but is a good indicator of safety improvements [17]. Ott et al.
did a thorough study, including an empirical Bayes statistical analysis, to show that there was a
significant reduction in vehicle collisions with implementation of an RCUT intersection [21]. They
recommended using a crash modification factor of 46% when converting a typical unsignalized
arterial intersection into an RCUT [21]. Edara et al. performed an empirical evaluation of RCUTs
on high-speed rural highways, analyzing before and after crash rates of traditional TWSC
intersections converted into RCUTs [14]. They found that RCUTs reduced property damage only
(PDO) crashes by 38%, minor injuries by 68%, disabling injuries by 92%, and fatal crashes were
totally mitigated with the RCUT design.
Roundabouts have commonly been accepted as an alternative to traditional intersections
for quite some time [33], but their use on high-speed rural TWSC intersections is a more recent
development. Isebrands et al. determined the efficacy of roundabouts implemented to improve the
safety of high-speed rural TWSC intersections by analyzing the before and after crash rates of
traditional TWSC intersections converted into roundabouts. Their study showed statistically
significant reduction in crash rates after the conversion from a conventional intersection design
[34]. There was no difference found for PDO crashes, but non-incapacitating injuries decreased
by 83%, incapacitating injuries decreased by 89%, and as with RCUT fatal injuries were decreased
by 100%.
The CMF values are also validated by other studies that have found RCUTs and
roundabouts to be much safer than TWSC intersections. Claros et al. performed a crash review of
12 RCUT sites across Missouri and found that RCUTs decreased the crash occurrence for the five
major crash types studied [4]. Zhang et al. also performed an empirical analysis of crashes before
48
and after RCUTs were implemented [35], finding the average reduction for fatal, injury, and PDO
crashes was 74%, 57%, and 9% respectively.
1.6 Economic Analysis
Quantifying the costs and benefits of building an RCUT or roundabout can be broken down into
three major categories: reduction in vehicle crash severity and rate, reduction in average delay per
vehicle, and the costs associated with completing construction. Each of these factors is important
to assess as agencies work to properly estimate potential cost savings and evaluate which solution
to pursue. With delay measures being calculated as described in section 3.4 of this report, safety
and cost assessment methodologies must yet be defined. Historical crash data was provided for the
case study locations by NDOT, with a literature review conducted to assess appropriate crash
modification factors (CMF) for analysis with the proposed mitigation geometries. Construction
cost data for RCUT facilities was requested from numerous State Department of Transportation
organizations, and was ultimately provided by the North Carolina DOT, which has done extensive
work in RCUT implementation.
Additional considerations, such as idling time and fuel consumption may play a role in
some transportation infrastructure projects, but are expected to have nominal impact on the overall
assessment conducted herein. For example, Rakha et al. found that fuel consumption impacts due
to vehicle stops is insignificant within the overall vehicle use costs at a rural high-speed junction
facility [18]. The difference between continuing at a mainline speed of 55 mph and that of coming
to a complete stop then accelerating back to 55 mph is .0475 gallons per stop. This translates to
just under $0.14 per vehicle per stop [18]. This figure becomes mute when contrasted with the
scale of costs involved in accident reduction, time lost to vehicle delay, and construction costs.
49
1.6.1 Delay Cost
Since the delay measure is the key parameter in calculating lost productive time, it is important to
ensure that correct results are found. The Bureau of Labor Statistics releases average hourly
earnings of all employees on private, non-farm payrolls. For the month of June 2018 the average
hourly earnings were $26.98 an hour [36]. Taking this value as a substitute for the average value
of time for delay experienced at the intersection, an annual value can be extrapolated from a typical
peak hour delay to the delay experienced annually. Data suggests that the demand volume during
the peak hour makes up approximately 15% [37] of the daily volume for this rural intersection.
Although it may be an overly conservative assumption, the authors have taken the calculated total
delay experienced during the peak hour (multiplying the average delay by the total demand),
1.6.2 Safety Assessment and Associated Costs
The Nebraska Department of Roads (NDOT) uses the KABCO Injury Classification Scale to
assess crash data. The literature on crash reduction for alternative intersections uses crash
classification schemes that are similar to KABCO, but do not exactly have one-to-one equivalents
within each category, such as that used by Edara et al. [14] and Isebrands et al. [34]. The National
Highway Transportation Safety Administration (NHTSA) serves as a primary source for
estimating economic costs related to crashes, but uses yet another classification scheme.
Engineering judgment was used to convert the various accident severity categories so that
information can be compared between publications to achieve a uniform result.
The “KABCO” scale was developed by the National Safety Council and is frequently used
by agencies to categorize crashes [38]. Each letter stands for a different class: K = Fatal, A =

50
Disabling Injury, B = Visible Injury, C = Possible Injury, O = No Injury. There is also the
additional property damage only (PDO) classification when no injury occurred but there is still an
economic impact present.
An alternative injury crash based system is the Maximum Abbreviated Injury Scale
(MAIS). The Association for the Advancement of Automotive Medicine developed the scale [39].
The injuries have six different levels: 1 = Minor, 2 = Moderate, 3 = Serious, 4 = Severe, 5 =
Critical, and 6 = Fatal. Each of the severity levels had a corresponding value of statistical life
(VSL), used to monetize the cost of a crash. As of 2010, the Federal Highway Association assessed
the VSL, or the cost of a MAIS 6, at just under $1.4 million [40], accounting for the immediate
economic person-injury unit costs.
NDOT, as with most state transportation agencies, utilizes the KABCO system. The
NHTSA developed a KABCO to MAIS conversion estimate to translate economic costs for crashes
in the different classification schemes, as shown below in Table 3-1. The cost estimates take into
count multiple components besides immediate damage costs (insurance costs, legal costs, medical
costs, lost quality of life, etc.).

51
Table 3-1 Person-injury unit cost by severity [40]
The KABCO and MAIS person-injury costs were adapted to the NDOT classification, as
well as both Edara et al. and Isebrands et al., to examine equivalent crash costs for all alternative
designs. The analogous crash types are shown below, in Table 3-2. Overall, the cost of Type C
injuries is taken to be negligible.
Table 3-2 KABCO description comparison to NDOT [14], [32]
Implementing either a roundabout or an RCUT will have a net safety effect for the original
TWSC intersection, with CMFs previously discussed and summarized below in Table 3-3.
Crash Severity Economic Comprehensive
Fatal (K) 1,542,000.00$ 10,082,000.00$
Disabling (A) 90,000.00$ 1,103,000.00$
Visible (B) 26,000.00$ 304,000.00$
Possible (C) 21,400.00$ 141,000.00$
No Injury (O) 11,400.00$ 46,600.00$
PDO* 4,200.00$ 4,200.00$
*PDO is measured as per-vehicle
KABCO
ConversionNDOT Injury Scale Description Edara et al. Isebrands et al.
K Killed Fatal Fatal
ACannot leave scene without assistance (broken bones,
severe cuts, prolonged unconsciousness)Disabling Injury Incapacitating, serious
B Visible but not disabling (minor cuts, swelling, etc.) Minor Injury Non-incapacitating, evident
C Possible but not visible (complaints of pain, etc.) * *
*(The average crash reduction rate was used for type C incidents)

52
Table 3-3 Crash Severity Impact factors from RCUT and roundabout implementation.
As each intersection location will be susceptible to different types of crashes, the 10-year
crash history will be used to determine site-specific existing crash rates. The costs as defined in
Table 3-1 are then applied to the existing crash rates to arrive at a monetized annual safety cost for
the existing geometric design. The reductions in crash rates for each severity as defined in Table
3-2 are then applied to the observed crash rate history at each site, arriving at a weighted score for
total monetized annual safety cost associated with the roundabout and RCUT designs.
1.6.3 Construction Cost Estimating
With a general lack of data in the literature regarding construction costs for RCUT mitigation,
previous analysis has used an average value listed in the FHWA Information Guide on RCUTs.
[1], [27] To supplement this generic value, the researchers reached out to multiple State DOT
agencies requesting information on costs experienced in constructing RCUT facilities in practice.
Unfortunately, most agencies either did not maintain this information in a way that could be readily
shared, or they charged excessive fees to submit the information request. The most useful
information was provided by the North Carolina DOT, which provided a list of their RCUT
estimated project costs, as shown below in Table 3-4.
As noted, the cost value is the estimation and not the completion cost. In calculating an
average price for RCUT construction, one modification needed was that two of the projects listed
Crash Severity RCUT Roundabout
Fatal (K) 100% 100%
Disabling (A) 92% 89%
Visible (B) 68% 83%
Possible (C) 76% 82%
PDO 38% 0%

53
changed more than one junction into an RCUT facility, so these costs were converted to a per-
junction rate for inclusion with the average. The average estimated construction cost for an RCUT
facility is found to be approximately $860,000, after adjusting construction costs for inflation.
Table 3-4 Construction cost estimates for recent RCUT facilities.
Due to the roundabout’s popularity in use and research, reliable data on average
construction costs are easily accessible. The Federal Highway Administration (FHWA) in a 2000
report estimates the average cost at being around $250,000 [41]. This number was reaffirmed by a
2010 FHWA report conducted in Maryland looking at both rural and urban roundabouts [42].
Adjusting for inflation, the estimated construction cost is $365,000.
Location# of RCUTs
in Project
Year
Completed
Total Cost Estimate
of Each J-turn
NC 24 at Hubert Blvd/Waterfront 1 2014 1,001,700$
US 17 and Dawson Cabin Road 1 2011 486,080$
NC 87 at H. M. Cagle Dr 1 2011 1,310,400$
US 74 at Old Pageland-Monroe Road 1 In Progress 1,186,000$
US 17 at Kellum Loop Road and Halltown Road 2 2018 398,750$
NC 55 Bypass at Avent Ferry Road 1 2016 1,291,500$
US 17 and Thomasboro Rd/Pea Landing Rd 1 In Progress 998,000$
US 64 at Brown's Crossroads 1 2017 636,540$
NC 24/27 and Newt Road 1 In Progress 675,000$
US 264 near Neck Road 1 In Progress 1,435,000$
US 401 at North Parker Church Rd and Pittman
Grove Church Rd2 In Progress 835,000$
US 17 and Hickman Rd/SW Middleton Avenue 1 In Progress 1,760,000$
Avg. Cost: 858,140$

54
Case Study Locations
Nine locations are analyzed as potential candidates for case study analysis, as shown below in
Table 4-1. All are located in eastern Nebraska and have experienced a higher-than-average crash
rate in recent years. Each junction considered includes a four-lane expressway (major road)
crossing with a lower-volume two-lane highway (minor road). In deciding which sites to select,
the three primary factors considered are the crash history at the site, the traffic characteristics it
typically exhibits, and the existing geometry such as median width and upstream and downstream
obstructions that would impact locating the u-turn bay.
Table 4-1 List of junctions considered for analysis and pertinent site characteristics.
Geometric variety is important because implementation of an RCUT facility can be limited
based on the existing median widths and availability of appropriate locations for a U-turn bay.
Narrow medians may require a loon to be built, which would affect right-of-way. Downstream
obstructions, such as bridges, can interfere with the location of U-turn placement. U-turn offset
Major
Highway
Minor
RoadNear City Median Width
Entering Left
Turn DistanceSight Distance
Prevalent Crash
Type
NE-2 S-66A Palmyra 40' typ. 92’ Obstructed Unknown
US-20 NE-110 South Sioux City 40' typ. 85’ Unobstructed Unknown
US-75 NE-35 Dakota City 40' typ. 84’ Unobstructed Entering Left Turn
US-77 S-55G Sprague 40' typ. 96’ Obstructed Unknown
US-81 NE-13 Hadar 40' typ. 100’ Unobstructed Rear End
US-81 NE-32 Madison40' typ. (north)
20' typ. (south)95’ Obstructed Angle
US-81 NE-64 Columbus40' typ. (north)
0' typ. (south)58’ Unobstructed Entering Left Turn
US-81 NE-91 Humphrey 40' typ. 55’ Unobstructed Angle
US-81 S-71B Platte Center 40' typ. 105’ Obstructed Unknown
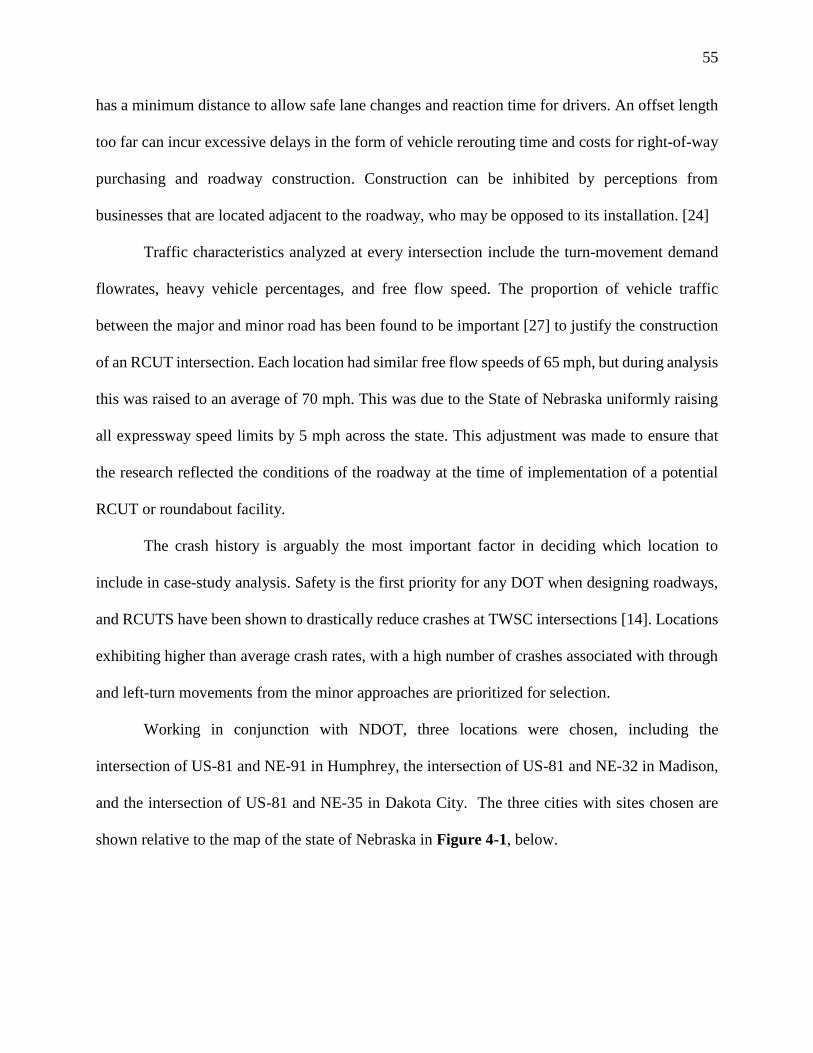
55
has a minimum distance to allow safe lane changes and reaction time for drivers. An offset length
too far can incur excessive delays in the form of vehicle rerouting time and costs for right-of-way
purchasing and roadway construction. Construction can be inhibited by perceptions from
businesses that are located adjacent to the roadway, who may be opposed to its installation. [24]
Traffic characteristics analyzed at every intersection include the turn-movement demand
flowrates, heavy vehicle percentages, and free flow speed. The proportion of vehicle traffic
between the major and minor road has been found to be important [27] to justify the construction
of an RCUT intersection. Each location had similar free flow speeds of 65 mph, but during analysis
this was raised to an average of 70 mph. This was due to the State of Nebraska uniformly raising
all expressway speed limits by 5 mph across the state. This adjustment was made to ensure that
the research reflected the conditions of the roadway at the time of implementation of a potential
RCUT or roundabout facility.
The crash history is arguably the most important factor in deciding which location to
include in case-study analysis. Safety is the first priority for any DOT when designing roadways,
and RCUTS have been shown to drastically reduce crashes at TWSC intersections [14]. Locations
exhibiting higher than average crash rates, with a high number of crashes associated with through
and left-turn movements from the minor approaches are prioritized for selection.
Working in conjunction with NDOT, three locations were chosen, including the
intersection of US-81 and NE-91 in Humphrey, the intersection of US-81 and NE-32 in Madison,
and the intersection of US-81 and NE-35 in Dakota City. The three cities with sites chosen are
shown relative to the map of the state of Nebraska in Figure 4-1, below.
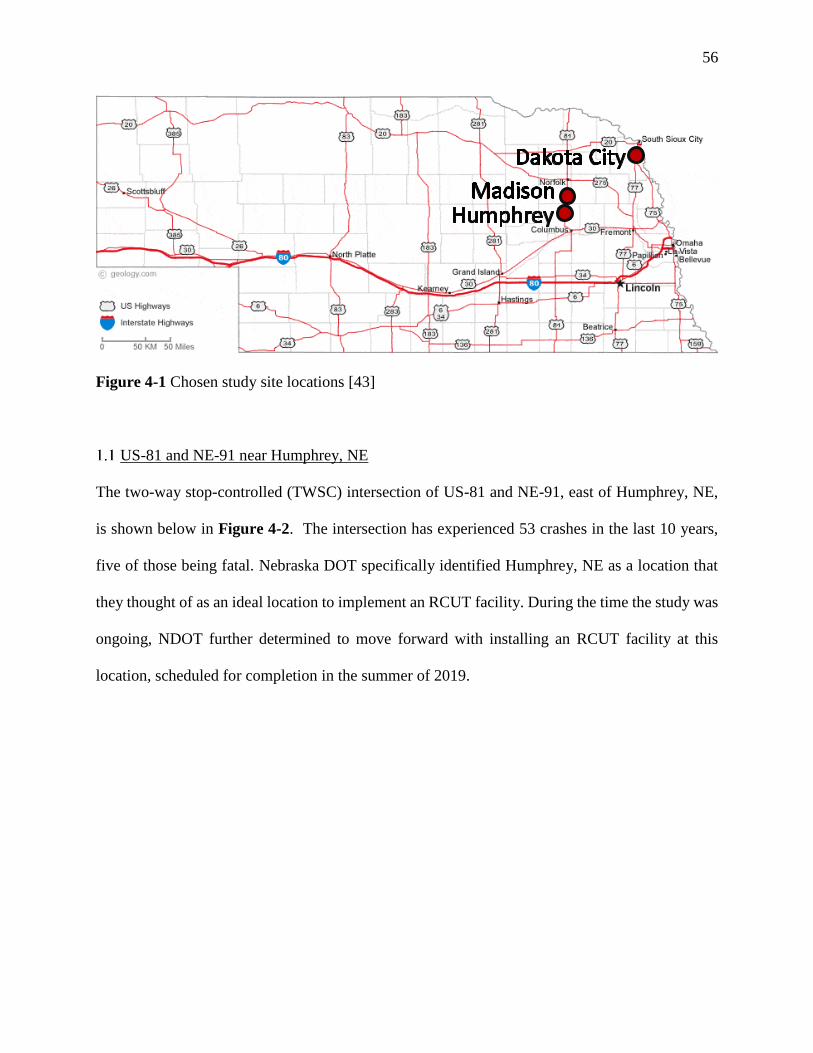
56
Figure 4-1 Chosen study site locations [43]
US-81 and NE-91 near Humphrey, NE
The two-way stop-controlled (TWSC) intersection of US-81 and NE-91, east of Humphrey, NE,
is shown below in Figure 4-2. The intersection has experienced 53 crashes in the last 10 years,
five of those being fatal. Nebraska DOT specifically identified Humphrey, NE as a location that
they thought of as an ideal location to implement an RCUT facility. During the time the study was
ongoing, NDOT further determined to move forward with installing an RCUT facility at this
location, scheduled for completion in the summer of 2019.
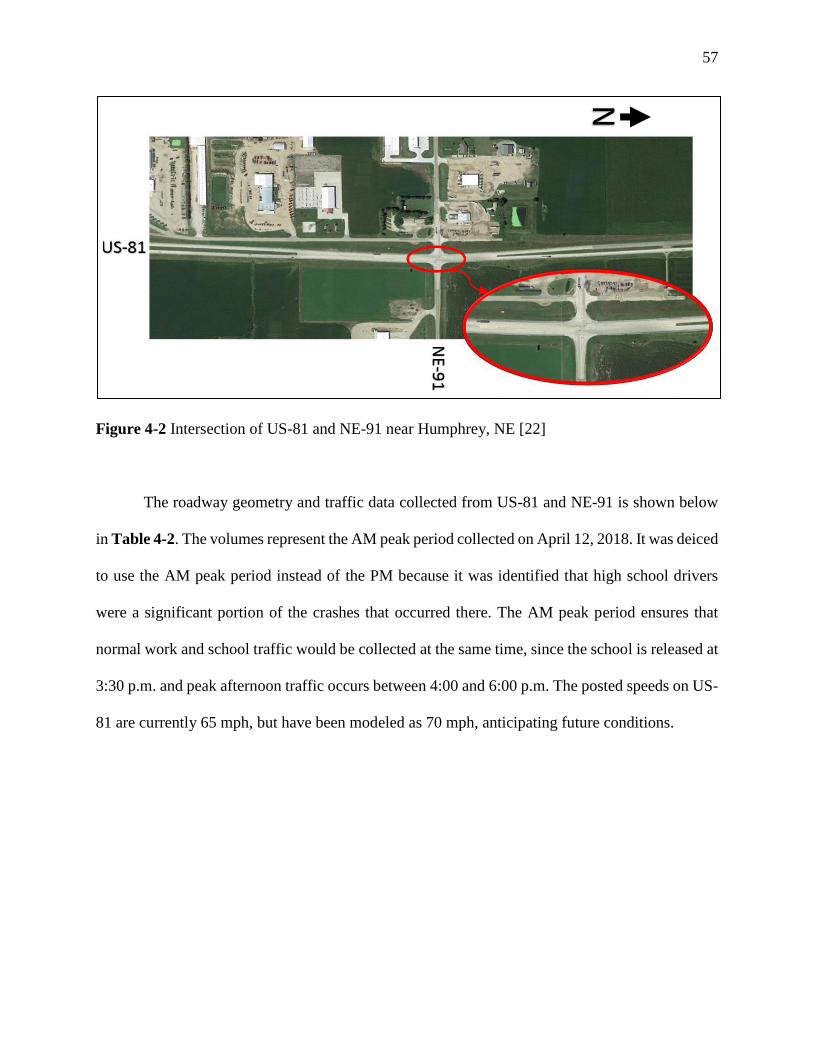
57
Figure 4-2 Intersection of US-81 and NE-91 near Humphrey, NE [22]
The roadway geometry and traffic data collected from US-81 and NE-91 is shown below
in Table 4-2. The volumes represent the AM peak period collected on April 12, 2018. It was deiced
to use the AM peak period instead of the PM because it was identified that high school drivers
were a significant portion of the crashes that occurred there. The AM peak period ensures that
normal work and school traffic would be collected at the same time, since the school is released at
3:30 p.m. and peak afternoon traffic occurs between 4:00 and 6:00 p.m. The posted speeds on US-
81 are currently 65 mph, but have been modeled as 70 mph, anticipating future conditions.
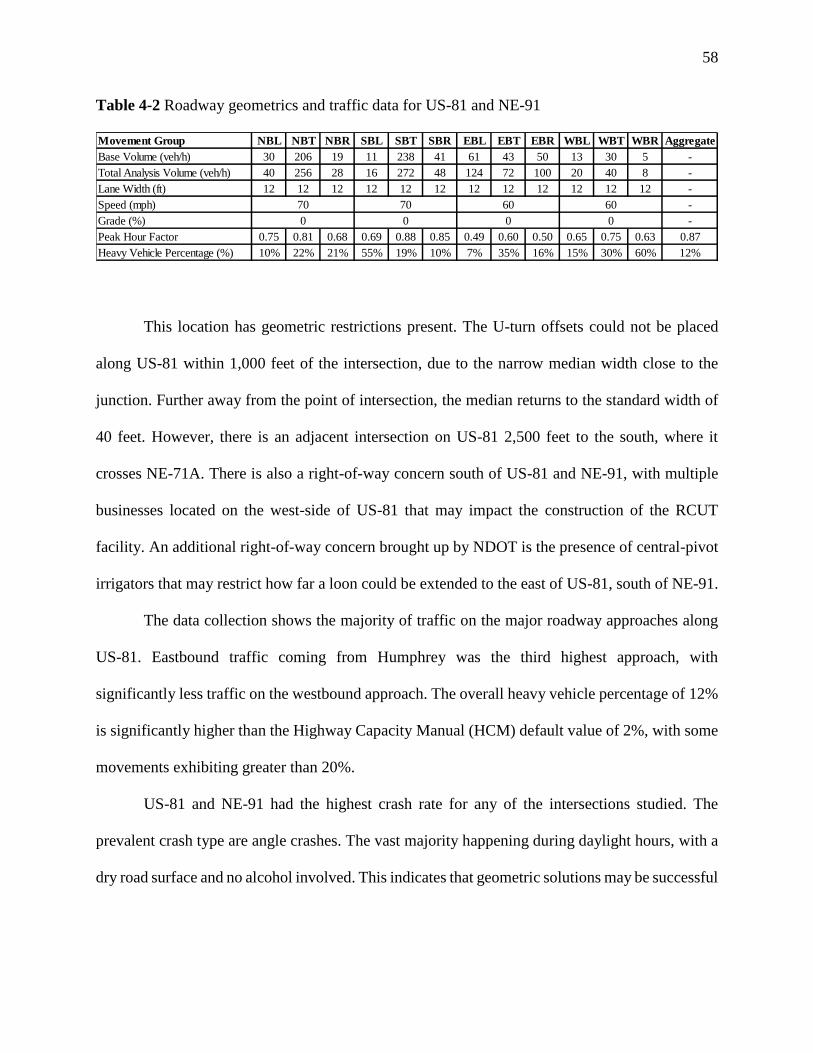
58
Table 4-2 Roadway geometrics and traffic data for US-81 and NE-91
This location has geometric restrictions present. The U-turn offsets could not be placed
along US-81 within 1,000 feet of the intersection, due to the narrow median width close to the
junction. Further away from the point of intersection, the median returns to the standard width of
40 feet. However, there is an adjacent intersection on US-81 2,500 feet to the south, where it
crosses NE-71A. There is also a right-of-way concern south of US-81 and NE-91, with multiple
businesses located on the west-side of US-81 that may impact the construction of the RCUT
facility. An additional right-of-way concern brought up by NDOT is the presence of central-pivot
irrigators that may restrict how far a loon could be extended to the east of US-81, south of NE-91.
The data collection shows the majority of traffic on the major roadway approaches along
US-81. Eastbound traffic coming from Humphrey was the third highest approach, with
significantly less traffic on the westbound approach. The overall heavy vehicle percentage of 12%
is significantly higher than the Highway Capacity Manual (HCM) default value of 2%, with some
movements exhibiting greater than 20%.
US-81 and NE-91 had the highest crash rate for any of the intersections studied. The
prevalent crash type are angle crashes. The vast majority happening during daylight hours, with a
dry road surface and no alcohol involved. This indicates that geometric solutions may be successful
Movement Group NBL NBT NBR SBL SBT SBR EBL EBT EBR WBL WBT WBR Aggregate
Base Volume (veh/h) 30 206 19 11 238 41 61 43 50 13 30 5 -
Total Analysis Volume (veh/h) 40 256 28 16 272 48 124 72 100 20 40 8 -
Lane Width (ft) 12 12 12 12 12 12 12 12 12 12 12 12 -
Speed (mph) -
Grade (%) -
Peak Hour Factor 0.75 0.81 0.68 0.69 0.88 0.85 0.49 0.60 0.50 0.65 0.75 0.63 0.87
Heavy Vehicle Percentage (%) 10% 22% 21% 55% 19% 10% 7% 35% 16% 15% 30% 60% 12%
0 0 0 0
70 70 60 60

59
at improving safety at this site. The detailed crash history table is not included in this report for
privacy reasons.
1.2 US-81 and NE-32 near Madison, NE
The two-way stop-controlled (TWSC) intersection of US-81 and NE-32, near Madison, NE, is
shown below in Figure 4-3. The intersection has a higher-than-average crash rate and is
geometrically unique in this study, as it has a narrow concrete median to the south, providing an
example case study location that would incur higher construction costs when remediating the
safety concerns with an RCUT design. Additionally, locating multiple RCUT facilities along US-
81 follows best practices from other State DOTs such as in North Carolina, where RCUTs are
recommended in series along a corridor to help decrease problems that arise from driver
expectation if they encounter alternative or unusual intersection designs in an isolated situation.
[44]
Figure 4-3 Intersection of US-81 and NE-32 near Madison, NE [22]

60
The roadway geometry and traffic data collected from US-81 and NE-32 is shown below
in Table 4-3. The volumes represent the AM peak period collected on April 12, 2018, assessing
AM rather than PM to incorporate school-related traffic. The posted speeds on US-81 are currently
65 mph, but have been modeled as 70 mph, anticipating future conditions.
Table 4-3 Roadway geometrics and traffic data for US-81 and NE-32
The median width is the biggest design challenge for future implementation of the RCUT
intersection, being limited to 16 feet at the south leg. The north leg is a 40-foot median, the typical
design width for this type of highway in Nebraska. The Green Book suggests at least 12 feet of
separation between opposing movements in a rural setting [8]. This means that at least 20 feet is
required to provide a turn bay for the U-turn at the south leg of the intersection. Using this
guidance, the roadway would require realignment to implement an RCUT at the Madison location,
leading to very high construction costs.
Another geometric consideration is the relatively close adjacent obstructions, with an
intersection 2,000 feet to the south, and a bridge 1,500 feet to the north. Although the southern u-
turn location will easily fit within the 2,000 ft limit, the northern bridge obstruction will cause the
u-turn location on that side to either be closer than desired or farther away than is optimal. The
Movement Group NBL NBT NBR SBL SBT SBR EBL EBT EBR WBL WBT WBR Aggregate
Base Volume (veh/h) 12 382 5 9 215 62 82 19 18 5 10 9 -
Total Analysis Volume (veh/h) 16 440 12 16 248 68 109 28 21 16 16 12 -
Lane Width (ft) 12 12 12 12 12 12 12 12 12 12 12 12 -
Speed (mph) -
Grade (%) -
Peak Hour Factor 0.75 0.87 0.42 0.56 0.87 0.91 0.75 0.68 0.85 0.31 0.63 0.75 0.91
Heavy Vehicle Percentage (%) 0% 15% 20% 11% 19% 3% 1% 5% 6% 40% 10% 22% 10%
0 0 0 0
70 70 60 60

61
closer option can lead to complications with weaving maneuvers from the minor road through and
left-turning vehicles, with the further option leading to excessive additional travel time or these
rerouted vehicles. The right-of-way in both directions is largely clear of obstructions.
The data collection shows the majority of traffic on the major roadway approaches along
US-81. Eastbound traffic coming from Madison was the third highest approach, with significantly
less traffic on the westbound approach. The overall heavy vehicle percentage of 10% is
significantly higher than the Highway Capacity Manual (HCM) default value of 2%, with some
movements exhibiting greater than 20%.
Of the three locations chosen, Madison has experienced the fewest crashes during the
period for which data was available. It has similar traffic characteristics and intersection geometry
as Humphrey, and exhibits a prevalent crash type of angle as well. Nine of the twenty-two crashes
at Madison occurred during either dark or poor weather conditions, and the only fatality involved
alcohol. This suggests that Madison’s crash patterns might not be as directly benefitted as at other
locations, but significant benefits would still be anticipated from the construction of an RCUT
facility.
1.3 US-75 and NE-35 near Dakota City, NE
The all-way stop-controlled (AWSC) intersection of US-75 and NE-35, near Dakota City, NE, is
shown below in Figure 4-4. The intersection has a higher-than-average crash rate and has been
discussed in the recent past by NDOT and the local municipalities as an intersection in need of
improvements. This site is located in close proximity of Sioux City, NE, a few miles to the north.
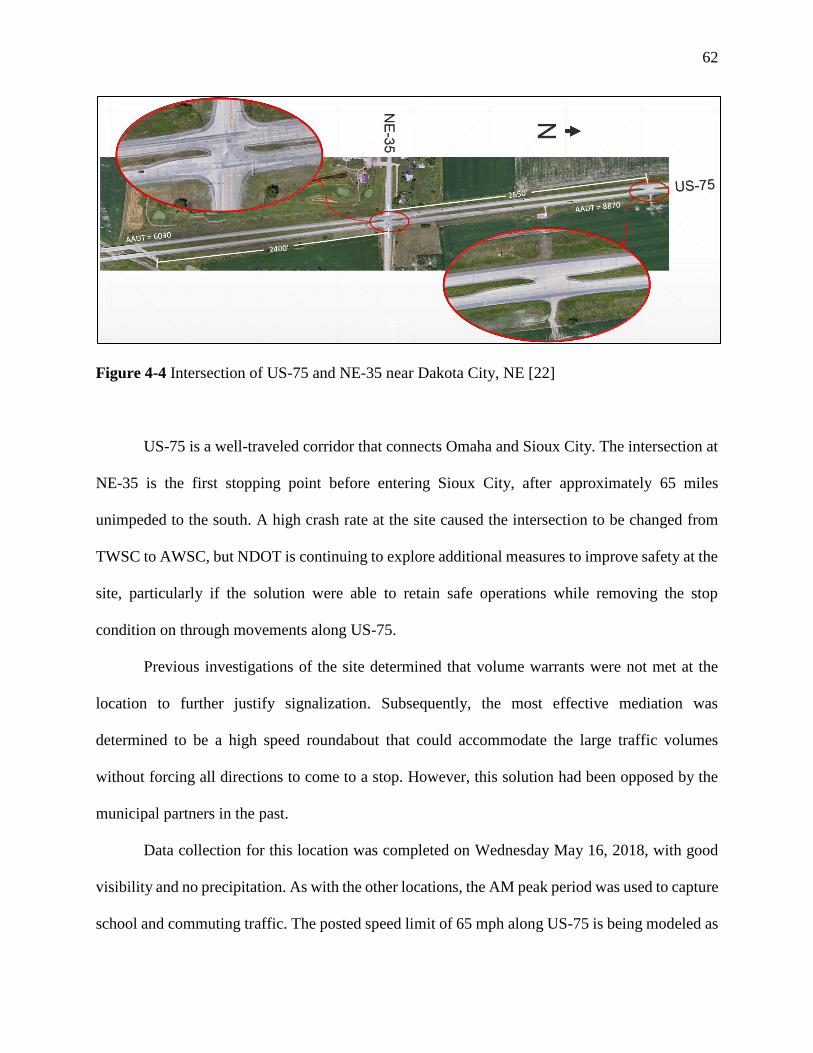
62
Figure 4-4 Intersection of US-75 and NE-35 near Dakota City, NE [22]
US-75 is a well-traveled corridor that connects Omaha and Sioux City. The intersection at
NE-35 is the first stopping point before entering Sioux City, after approximately 65 miles
unimpeded to the south. A high crash rate at the site caused the intersection to be changed from
TWSC to AWSC, but NDOT is continuing to explore additional measures to improve safety at the
site, particularly if the solution were able to retain safe operations while removing the stop
condition on through movements along US-75.
Previous investigations of the site determined that volume warrants were not met at the
location to further justify signalization. Subsequently, the most effective mediation was
determined to be a high speed roundabout that could accommodate the large traffic volumes
without forcing all directions to come to a stop. However, this solution had been opposed by the
municipal partners in the past.
Data collection for this location was completed on Wednesday May 16, 2018, with good
visibility and no precipitation. As with the other locations, the AM peak period was used to capture
school and commuting traffic. The posted speed limit of 65 mph along US-75 is being modeled as

63
70 mph to accommodate anticipated future operations. The roadway geometry and traffic data
collected from US-75 and NE-35 is shown below in Table 4-4.
Table 4-4 Roadway geometrics and traffic data for US-75 and NE-32
This study location is ideal to implement an RCUT design, in terms of the existing
geometric considerations, and lack of site constraints. The median to the north is the typical 40
feet and to the south it widens to 50 feet. There are no obstruction to the north or south that pose a
concern for the u-turn offset location. There is a bridge directly to the south, but this is 2,400 feet
away, giving plenty of room to place a u-turn. There is little in the way of right-of-way interaction.
The data collection shows the majority of traffic on the major roadway approaches along
US-75. The next-highest traffic movements come from eastbound left and westbound right traffic,
going to work in Sioux City. The overall heavy vehicle percentage of 7% is higher than the
Highway Capacity Manual (HCM) default value of 2%, with some movements exhibiting greater
than 10%.
Crashes at this intersection are quite prevalent. There have been 35 accidents at his
intersection in the last 10 years, leading to 27 injuries. The prevailing crash type is entering left
turns, suggesting the RCUT design as a good choice to mitigate the safety concerns, while
maintaining throughput on US-75.
Movement Group NBL NBT NBR SBL SBT SBR EBL EBT EBR WBL WBT WBR Aggregate
Base Volume (veh/h) 14 340 24 105 255 92 104 21 4 16 31 100 -
Total Analysis Volume (veh/h) 20 408 32 112 304 112 124 40 8 24 48 116 -
Lane Width (ft) 12 12 12 12 12 12 12 12 12 12 12 12 -
Speed (mph) -
Grade (%) -
Peak Hour Factor 0.70 0.83 0.75 0.94 0.84 0.82 0.84 0.53 0.50 0.67 0.65 0.86 0.95
Heavy Vehicle Percentage (%) 0% 8% 4% 2% 13% 17% 14% 5% 0% 0% 0% 1% 7%
70 70 60 60
0 0 0 0

64
Traffic Operations Analysis
Each location is analyzed with its existing geometric condition and three different alternative
geometries. The four intersection types investigated are the two-way stop controlled (TWSC), all-
way stop controlled (AWSC), roundabout, and restricted crossing U-turn (RCUT). Vistro, using
HCM methodology, analyzed each intersection type with the exception of the RCUT, as the HCM
methodology for RCUT analysis had not yet been implemented in Vistro at the time of this study.
Manual calculations of RCUT performance ware done using the methodology published in the 6th
edition of the HCM, as outlined in the methodology chapter of this report.
Due to a lack of extensive validation of the HCM’s RCUT analysis in the literature, the
RCUT geometry is additionally modeled using VISSIM microsimulation software, a proven and
widely accepted tool within the traffic engineering profession. Calibration of the VISSIM model
is done using a TWSC control geometry, comparing the simulated delay results against the
equivalent results of HCM’s methodology.
A comparative analysis is provided at the end of this chapter to summarize the findings from
each of the individual case study sites. However, NDOT has stated that the continual flow of rural
highways (such as US-81) is of high priority, investing heavily in building beltways the circumvent
cities to reduce stops on the rural highway system. As such, the conversion of any of the case study
locations to an AWSC intersection should be considered a last option.
Operational Analysis Geometric Design
The authors endeavored to lay out the geometric configurations of the intersections based on
engineering judgement, past precedent from the literature, and recommendations from NDOT to
obtain optimum results. Operational analysis is generally independent of the geometric

65
configuration chosen for most of the intersection designs analyzed, with the exception of locating
the median u-turn location on the RCUT junctions.
For both the TWSC and AWSC intersection geometries, the minor approaches in both
cases are two-lane highways utilizing a single lane to serve all movements at the intersection
without auxiliary turn lanes. The major approaches have a dedicated left turn lane, a through lane,
and a shared right-turn/through lane.
The roundabout geometry modeled is based on existing roundabout facilities where a 4-
lane highway meets with a 2-lane highway. One key example used is the intersection of highways
544 & 539 southwest of Lynden, WA, as shown below in Figure 5-1. Lane-use modifications to
the existing geometry is limited to the elimination of the dedicated left turn lane on the major
approaches. The two remaining lanes on the major approaches are modeled as a through-left and
a through-right, respectively.
Figure 5-1 Roundabout junction of highways 539 & 544 southwest of Lynden, WA [22]

66
The RCUT intersection provides the most variety and required design decisions in its
layout, due to the site-specific constraints upstream and downstream on the major approaches that
impact the placement of the median u-turn locations. All other lane movements for the RCUT
designs were modeled the same as the existing lane configurations, including number and length
of auxiliary lanes, as shown below in Figure 5-2.
Figure 5-2 Basic stop controlled setup of RCUT used for analysis [1]
The locations of the u-turn bays for each case study site location are indicated below, in
Table 5-1. Each offset is located between 1,000 and 2,500 feet, with specific locations tied to site
constraints at each junction.

67
Table 5-1 U-turn locations for RCUT geometric design at each locations (feet)
1.2 Operational analysis of US-81 and NE-91 near Humphrey, NE
The intersection of US-81 and NE-91 is currently TWSC, but is scheduled for conversion to an
RCUT junction by the summer of 2019. In addition to the existing condition analysis of the TWSC
geometry, three other designs were modeled, including all-way stop-controlled, roundabout, and
restricted crossing u-turn (RCUT).
1.2.1 Two-way Stop Controlled
Under TWSC analysis, free movements are modeled as experiencing zero delay. However, best
practices, as recommended by the HCM, is to ignore the intersection level of service taking the
weighted average of vehicle delays, and instead grade the intersection based on each individual
approach. This leads to inequalities when conducting comparative analysis between the various
design options. The results for HCM analysis of the TWSC condition is provided below, in Table
5-2. The authors have chosen to include the aggregate intersection delay, but not the intersection
LOS, in keeping with the recommendation of the HCM.
US81-NE91 US81-NE32 US75-NE35
Offset 1350 2400 1150
Length 300 250 200
Offset 1650 1350 1100
Length 275 200 200
Northern
Southern
U-turn
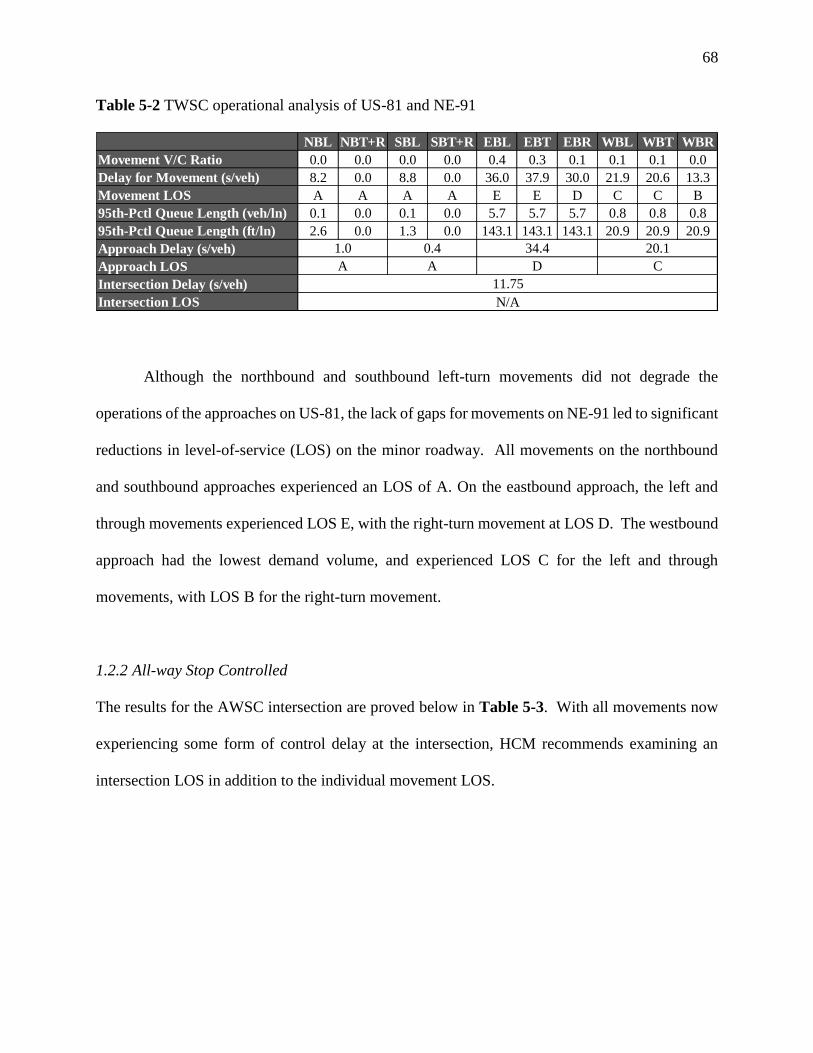
68
Table 5-2 TWSC operational analysis of US-81 and NE-91
Although the northbound and southbound left-turn movements did not degrade the
operations of the approaches on US-81, the lack of gaps for movements on NE-91 led to significant
reductions in level-of-service (LOS) on the minor roadway. All movements on the northbound
and southbound approaches experienced an LOS of A. On the eastbound approach, the left and
through movements experienced LOS E, with the right-turn movement at LOS D. The westbound
approach had the lowest demand volume, and experienced LOS C for the left and through
movements, with LOS B for the right-turn movement.
1.2.2 All-way Stop Controlled
The results for the AWSC intersection are proved below in Table 5-3. With all movements now
experiencing some form of control delay at the intersection, HCM recommends examining an
intersection LOS in addition to the individual movement LOS.
NBL NBT+R SBL SBT+R EBL EBT EBR WBL WBT WBR
Movement V/C Ratio 0.0 0.0 0.0 0.0 0.4 0.3 0.1 0.1 0.1 0.0
Delay for Movement (s/veh) 8.2 0.0 8.8 0.0 36.0 37.9 30.0 21.9 20.6 13.3
Movement LOS A A A A E E D C C B
95th-Pctl Queue Length (veh/ln) 0.1 0.0 0.1 0.0 5.7 5.7 5.7 0.8 0.8 0.8
95th-Pctl Queue Length (ft/ln) 2.6 0.0 1.3 0.0 143.1 143.1 143.1 20.9 20.9 20.9
Approach Delay (s/veh)
Approach LOS
Intersection Delay (s/veh)
Intersection LOS
1.0 0.4 34.4 20.1
N/A
CDAA
11.75
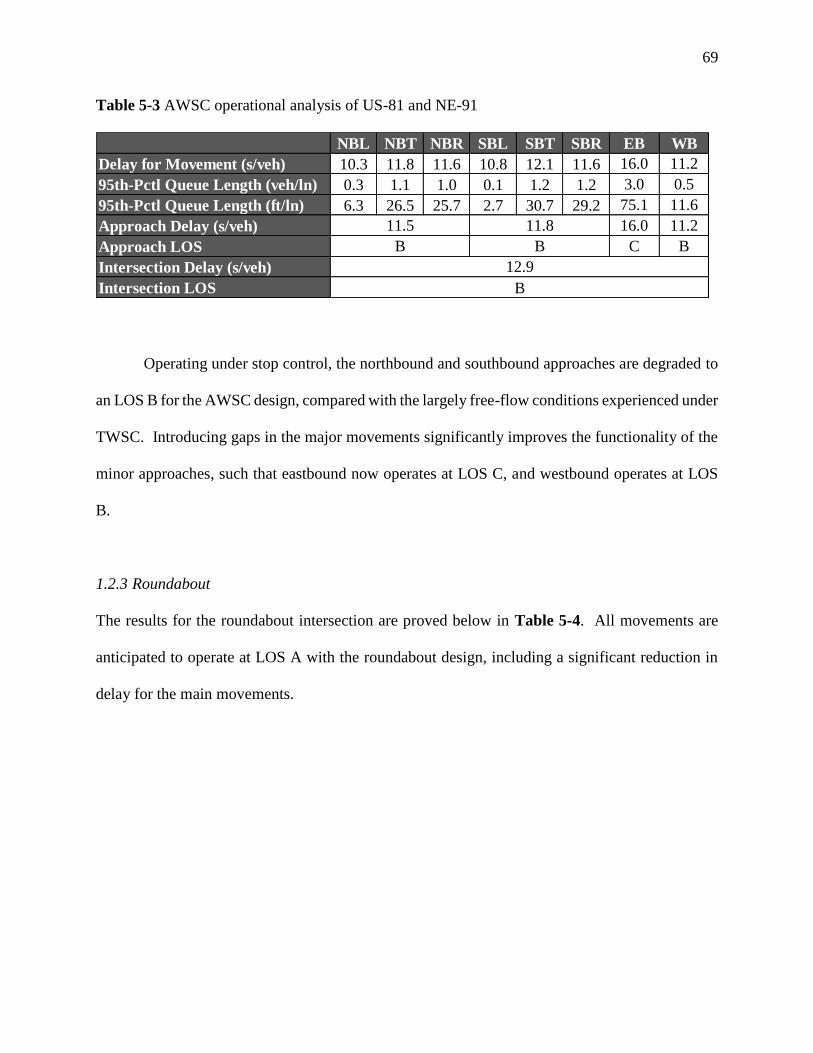
69
Table 5-3 AWSC operational analysis of US-81 and NE-91
Operating under stop control, the northbound and southbound approaches are degraded to
an LOS B for the AWSC design, compared with the largely free-flow conditions experienced under
TWSC. Introducing gaps in the major movements significantly improves the functionality of the
minor approaches, such that eastbound now operates at LOS C, and westbound operates at LOS
B.
1.2.3 Roundabout
The results for the roundabout intersection are proved below in Table 5-4. All movements are
anticipated to operate at LOS A with the roundabout design, including a significant reduction in
delay for the main movements.
NBL NBT NBR SBL SBT SBR WB
Delay for Movement (s/veh) 10.3 11.8 11.6 10.8 12.1 11.6
95th-Pctl Queue Length (veh/ln) 0.3 1.1 1.0 0.1 1.2 1.2
95th-Pctl Queue Length (ft/ln) 6.3 26.5 25.7 2.7 30.7 29.2
Approach Delay (s/veh)
Approach LOS
Intersection Delay (s/veh)
Intersection LOS
EB
12.9
B
16.0 11.2
11.6
0.53.0
75.1
11.5 11.8 16.0 11.2
B B C B

70
Table 5-4 Roundabout operational analysis of US-81 and NE-91
1.2.4 RCUT
The operational results for the RCUT junction are proved below in Table 5-5. The additional
travel time on the minor approach left and through movements significantly degrades the
operations of the intersection, representing the primary detriment of this design that offsets its
significant safety benefits.
Table 5-5 RCUT operational analysis of US-81 and NE-91
All movements on the major approaches along US-81 operate at LOS A, with the through
and right-turn movements unimpeded. The eastbound and westbound approaches on NE-91
experience significant additional travel time caused by the additional distance traveled for through
and left-turning vehicles to utilize the u-turns, with the u-turn bay to the south being located further
NBL+T NBT+R SBL+T SBT+R EB WB
Average Lane Delay (s/veh) 5.39 5.7 4.73 4.79 8.79 6.65
Lane LOS A A A A A A
95th-Pctl Queue Length (veh/ln) 0.58 0.68 0.52 0.59 1.68 0.35
95th-Pctl Queue Length (ft/ln) 14.45 16.96 13.06 14.65 41.99 8.65
Approach Delay (s/veh) 8.79 6.65
Approach LOS A A
Intersection Delay (s/veh)
Intersection LOS
6.30
A
5.56 4.76
A A
NBL NBT+R SBL SBT+R EBL EBT EBR WBL WBT WBR
ETT for Movement (s/veh) 8.2 0.0 8.8 0.0 78.7 80.7 30.0 57.6 56.3 13.3
Movement LOS A A A A E F C E E B
Approach ETT (s/veh)
Approach LOS
Intersection ETT (s/veh)
Intersection LOS
11.7
B
1.0 0.4 62.7 51.6
A A E D

71
downstream than the one to the north, causing the worst travel times for the eastbound approach.
Eastbound through traffic experiencing LOS F, while eastbound left and westbound through and
left all experience LOS E. There is some delay due to queuing on the eastbound and westbound
approaches as vehicles wait for gaps in the US-81 traffic, as the right-turn movements on eastbound
and westbound experience LOS C and LOS B, respectively.
1.3 Operational Analysis of US-81 and NE-32 near Madison, NE
The intersection of US-81 and NE-32 is currently TWSC. In addition to the existing condition
analysis of the TWSC geometry, three other designs were modeled, including all-way stop-
controlled, roundabout, and restricted crossing u-turn (RCUT).
1.3.1 Two-way Stop Controlled
The results for HCM analysis of the TWSC condition is provided below, in Table 5-6. The authors
have chosen to include the aggregate intersection delay, but not the intersection LOS, in keeping
with the recommendations of the HCM for TWSC intersections.
Table 5-6 TWSC operational analysis of US-81 and NE-32
NBL NBT+R SBL SBT+R EBL EBT EBR WBL WBT WBR
Movement V/C Ratio 0.0 0.0 0.0 0.0 0.3 0.1 0.0 0.1 0.1 0.0
Delay for Movement (s/veh) 7.9 0.0 8.5 0.0 21.1 23.3 15.6 20.8 19.5 11.8
Movement LOS A A A A C C C C C B
95th-Pctl Queue Length (veh/ln) 0.0 0.0 0.1 0.0 2.0 2.0 2.0 0.5 0.5 0.5
95th-Pctl Queue Length (ft/ln) 1.0 0.0 1.2 0.0 48.9 48.9 48.9 11.6 11.6 11.6
Approach Delay (s/veh)
Approach LOS
Intersection Delay (s/veh)
Intersection LOS
4.3
N/A
0.3 0.4 20.7 17.8
A A C C

72
Although the northbound and southbound left-turn movements did not degrade the
operations of the approaches on US-81, the lack of gaps for movements on NE-32 led to significant
reductions in level-of-service (LOS) on the minor roadway. All movements on the northbound
and southbound approaches experienced an LOS of A. All minor movements experienced LOS C,
with the exception of the westbound right-turn movement at LOS B.
1.3.2 All-way Stop Controlled
The results for the AWSC intersection are proved below in Table 5-7. With all movements now
experiencing some form of control delay at the intersection, HCM recommends examining an
intersection LOS in addition to the individual movement LOS.
Table 5-7 AWSC operational analysis of US-81 and NE-32
Operating under stop control, the northbound and southbound approaches are degraded to
an LOS B, compared with the largely free-flow conditions experienced under TWSC. Introducing
gaps in the major movements significantly improves the functionality of the minor approaches,
such that eastbound and westbound now operate at LOS B.
NBL NBT NBR SBL SBT SBR
Delay for Movement (s/veh) 9.0 12.0 11.9 9.4 11.0 10.4
95th-Pctl Queue Length (veh/ln) 0.1 1.7 1.7 0.1 1.1 1.0
95th-Pctl Queue Length (ft/ln) 2.1 42.4 42.0 2.2 27.0 24.9
Approach Delay (s/veh)
Approach LOS
Intersection Delay (s/veh)
Intersection LOS
EB WB
B
B B B B
11.4
28.5 6.8
11.8 10.6 11.8 10.5
11.8 10.5
1.1 0.3

73
1.3.3 Roundabout
The results for the roundabout intersection are proved below in Table 5-8. All movements are
anticipated to operate at LOS A with the roundabout design, including a significant reduction in
delay for the main movements.
Table 5-8 Roundabout operational analysis of US-81 and NE-32
1.3.4 RCUT
The operational results for the RCUT junction are proved below in Table 5-9. The additional
travel time on the minor approach left and through movements significantly degrades the
operations of the intersection, representing the primary detriment of this design that offsets its
significant safety benefits.
Table 5-9 RCUT operational analysis of US-81 and NE-32
NBL+T NBT+R SBL+T SBT+R EB WB
Average Lane Delay (s/veh) 5.2 5.5 4.4 4.4 5.3 6.8
Lane LOS A A A A A A
95th-Pctl Queue Length (veh/ln) 0.8 0.9 0.5 0.5 0.6 0.2
95th-Pctl Queue Length (ft/ln) 19.1 22.4 11.9 13.2 14.8 5.9
Approach Delay (s/veh) 5.3 6.8
Approach LOS A A
Intersection Delay (s/veh)
Intersection LOS
A A
5.1
A
5.4 4.4
NBL NBT+R SBL SBT+R EBL EBT EBR WBL WBT WBR
ETT for Movement (s/veh) 7.9 0.0 8.5 0.0 56.9 59.1 15.6 76.1 74.8 11.8
Movement LOS A A A A E E B E E B
Approach ETT (s/veh)
Approach LOS
Intersection ETT (s/veh)
Intersection LOS
0.3 0.4 53.8 58.1
A A E D
4.3
A
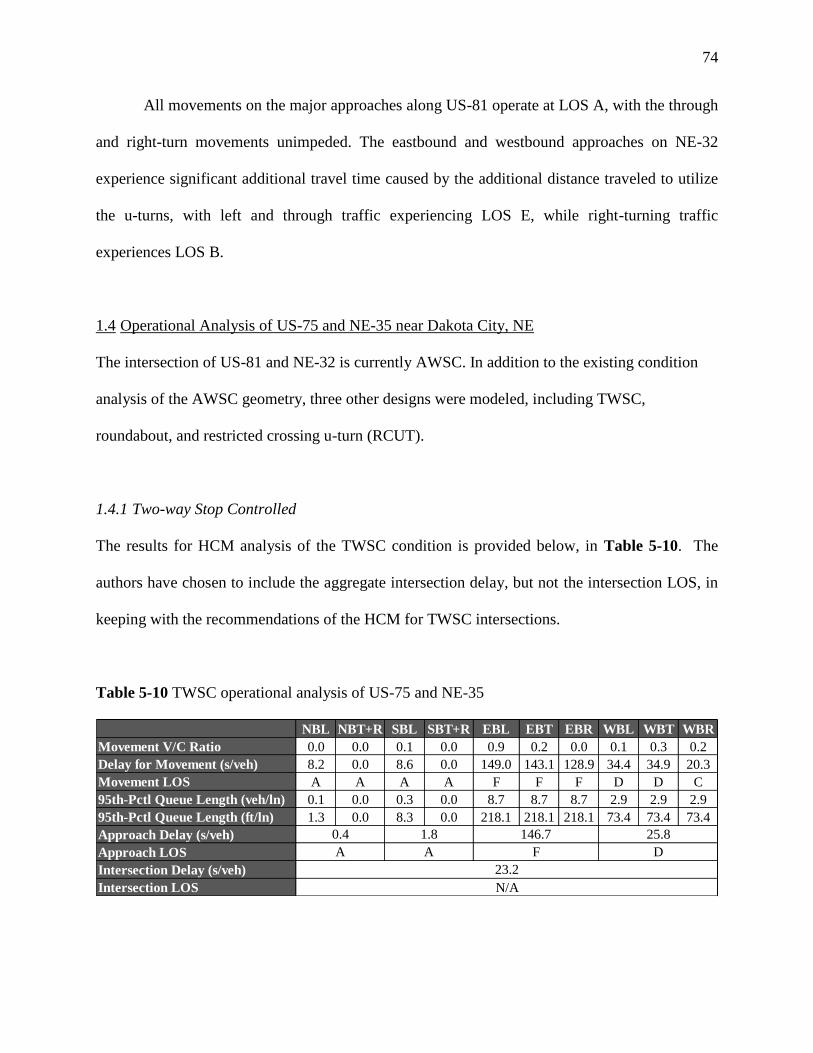
74
All movements on the major approaches along US-81 operate at LOS A, with the through
and right-turn movements unimpeded. The eastbound and westbound approaches on NE-32
experience significant additional travel time caused by the additional distance traveled to utilize
the u-turns, with left and through traffic experiencing LOS E, while right-turning traffic
experiences LOS B.
1.4 Operational Analysis of US-75 and NE-35 near Dakota City, NE
The intersection of US-81 and NE-32 is currently AWSC. In addition to the existing condition
analysis of the AWSC geometry, three other designs were modeled, including TWSC,
roundabout, and restricted crossing u-turn (RCUT).
1.4.1 Two-way Stop Controlled
The results for HCM analysis of the TWSC condition is provided below, in Table 5-10. The
authors have chosen to include the aggregate intersection delay, but not the intersection LOS, in
keeping with the recommendations of the HCM for TWSC intersections.
Table 5-10 TWSC operational analysis of US-75 and NE-35
NBL NBT+R SBL SBT+R EBL EBT EBR WBL WBT WBR
Movement V/C Ratio 0.0 0.0 0.1 0.0 0.9 0.2 0.0 0.1 0.3 0.2
Delay for Movement (s/veh) 8.2 0.0 8.6 0.0 149.0 143.1 128.9 34.4 34.9 20.3
Movement LOS A A A A F F F D D C
95th-Pctl Queue Length (veh/ln) 0.1 0.0 0.3 0.0 8.7 8.7 8.7 2.9 2.9 2.9
95th-Pctl Queue Length (ft/ln) 1.3 0.0 8.3 0.0 218.1 218.1 218.1 73.4 73.4 73.4
Approach Delay (s/veh)
Approach LOS
Intersection Delay (s/veh)
Intersection LOS N/A
A A F D
23.2
0.4 1.8 146.7 25.8

75
With higher through volumes on US-75 compared to the other two case study locations, a
greater impact is seen due to the lack of gaps for movements on NE-35, leading to significant
reductions in level-of-service (LOS) on the minor roadway. All movements on the northbound
and southbound approaches experienced an LOS of A. All minor movements on the eastbound
approach experienced LOS F. The through and right-turn movements on the westbound approach
experienced LOS D, with the westbound right-turn movement experiencing LOS C.
1.4.2 All-way Stop Controlled
The results for the AWSC intersection are proved below in Table 5-11. With all movements now
experiencing some form of control delay at the intersection, HCM recommends examining an
intersection LOS in addition to the individual movement LOS.
Table 5-11 AWSC operational analysis of US-75 and NE-35
Operating under stop control, the northbound and southbound approaches are degraded to
an LOS B, compared with the largely free-flow conditions experienced under TWSC. Introducing
gaps in the major movements significantly improves the functionality of the minor approaches,
such that eastbound and westbound now operate at LOS B.
NBL NBT NBR SBL SBT SBR
Delay for Movement (s/veh) 10.2 14.3 14.0 11.9 13.9 12.9
95th-Pctl Queue Length (veh/ln) 0.1 2.0 2.0 0.8 1.9 1.7
95th-Pctl Queue Length (ft/ln) 3.1 50.9 49.6 21.1 46.6 42.9
Approach Delay (s/veh)
Approach LOS
Intersection Delay (s/veh)
Intersection LOS B
EB WB
B B B B
13.5
38.7 38.8
14.0 13.1 14.2 13.2
1.6 1.6
14.2 13.2

76
1.4.3 Roundabout
The results for the roundabout intersection are proved below in Table 5-12. All movements are
anticipated to operate at LOS A with the roundabout design, including a significant reduction in
delay for the main movements.
Table 5-12 Roundabout operational analysis of US-75 and NE-35
1.4.4 RCUT
The operational results for the RCUT junction are proved below in Table 5-13. The additional
travel time on the minor approach left and through movements significantly degrades the
operations of the intersection, representing the primary detriment of this design that offsets its
significant safety benefits.
Table 5-13 RCUT operational analysis of US-75 and NE-35
NBL+T NBT+R SBL+T SBT+R EB WB
Average Lane Delay (s/veh) 5.6 5.9 4.8 5.4 7.3 7.8
Lane LOS A A A A A A
95th-Pctl Queue Length (veh/ln) 0.8 1.0 0.8 1.0 0.9 1.0
95th-Pctl Queue Length (ft/ln) 20.3 23.7 19.5 24.0 21.9 25.1
Approach Delay (s/veh) 7.3 7.8
Approach LOS A A
Intersection Delay (s/veh)
Intersection LOS
A A
6.0
A
5.8 5.1
NBL NBT+R SBL SBT+R EBL EBT EBR WBL WBT WBR
ETT for Movement (s/veh) 8.2 0.0 8.6 0.0 180.0 174.1 128.9 66.2 66.6 20.3
Movement LOS A A A A F F F E E C
Approach ETT (s/veh)
Approach LOS
Intersection ETT (s/veh)
Intersection LOS
0.4
23.2
C
1.8 176.2 38.0
A A F D

77
All movements on the major approaches along US-75 operate at LOS A, with the through
and right-turn movements unimpeded. The eastbound and westbound approaches on NE-35
experience significant additional travel time caused by the additional distance traveled for through
and left-turning vehicles to utilize the u-turns. All eastbound movements experience LOS F, while
westbound through and left experience LOS E, and westbound right-turning traffic experiences
LOS C.
1.5 Summary Results of Operational Analysis
Each location is analyzed with its existing geometric condition and three different alternative
geometries. The four intersection types investigated are the two-way stop controlled (TWSC), all-
way stop controlled (AWSC), roundabout, and restricted crossing U-turn (RCUT). The aggregate
intersection average delay per vehicle for each location/design is shown below in Table 5-14.
Table 5-14 Summary of operational analysis results: aggregate intersection delay
Based on the aggregate intersection delay results, all intersections would operate at an
overall level-of-service of C or better, regardless of which one of the four unsignalized geometric
designs was implemented at the site. Although some intersection designs consistently perform
better than others, such as the roundabout, the cost associated with intersection reconstruction is
not justified based on overall intersection operational benefits. Having established that the
TWSC AWSC Roundabout RCUT
11.8 12.9 6.3 11.7
4.3 11.4 5.1 4.3
23.2 13.5 6.0 23.2
Aggregate Intersection Average Delay per Vehilce (seconds)
US-81 and NE-91 near Humphry, NE
US-81 and NE-32 near Madison, NE
US-75 and NE-35 near Dakota City, NE
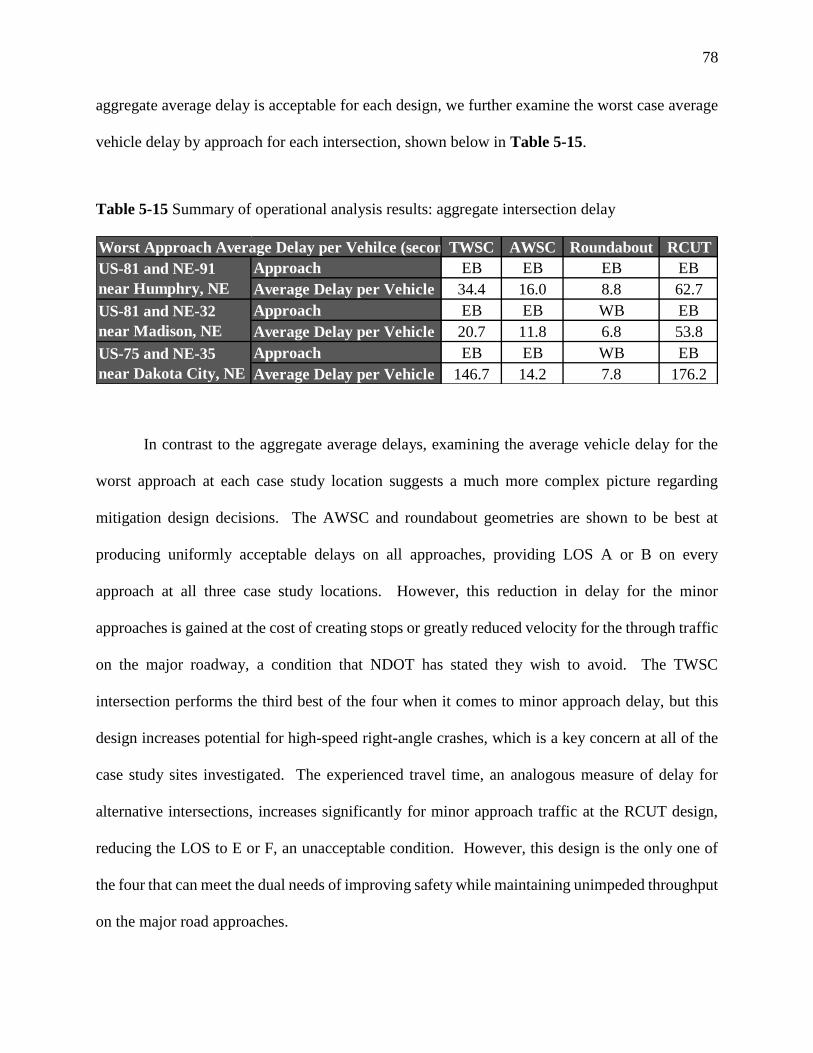
78
aggregate average delay is acceptable for each design, we further examine the worst case average
vehicle delay by approach for each intersection, shown below in Table 5-15.
Table 5-15 Summary of operational analysis results: aggregate intersection delay
In contrast to the aggregate average delays, examining the average vehicle delay for the
worst approach at each case study location suggests a much more complex picture regarding
mitigation design decisions. The AWSC and roundabout geometries are shown to be best at
producing uniformly acceptable delays on all approaches, providing LOS A or B on every
approach at all three case study locations. However, this reduction in delay for the minor
approaches is gained at the cost of creating stops or greatly reduced velocity for the through traffic
on the major roadway, a condition that NDOT has stated they wish to avoid. The TWSC
intersection performs the third best of the four when it comes to minor approach delay, but this
design increases potential for high-speed right-angle crashes, which is a key concern at all of the
case study sites investigated. The experienced travel time, an analogous measure of delay for
alternative intersections, increases significantly for minor approach traffic at the RCUT design,
reducing the LOS to E or F, an unacceptable condition. However, this design is the only one of
the four that can meet the dual needs of improving safety while maintaining unimpeded throughput
on the major road approaches.
TWSC AWSC Roundabout RCUT
Approach EB EB EB EB
Average Delay per Vehicle 34.4 16.0 8.8 62.7
Approach EB EB WB EB
Average Delay per Vehicle 20.7 11.8 6.8 53.8
Approach EB EB WB EB
Average Delay per Vehicle 146.7 14.2 7.8 176.2
US-75 and NE-35
near Dakota City, NE
US-81 and NE-32
near Madison, NE
US-81 and NE-91
near Humphry, NE
Worst Approach Average Delay per Vehilce (seconds)
79
1.6 Validation of RCUT Results
Due to the relatively recent inclusion of a Highway Capacity Manual (HCM) methodology for
vehicle delay at a restricted crossing u-turn (RCUT) facility, this research includes validation of
the RCUT results using VISSIM traffic microsimulation analysis.
Calibration of the microsimulation model is done using the HCM methodology for TWSC
intersection vehicle delay. Vehicle speed distributions, gap acceptance, and follow-up headway
are modified based on engineering judgement such that the aggregate delay measures for a
simulated TWSC intersection are roughly matching the expected results as predicted by the HCM
methodology. The case study location at the intersection of US-81 and NE-91 near Humphrey,
NE was modeled as TWSC in VISSIM in order to calibrate the parameters listed. Having
calibrated the behavior of vehicles to generate consistent results, these calibrated values (speed
distribution, gap acceptance, and follow-up headway) are then applied to the simulated RCUT
intersection geometries to attempt to validate the HCM methodology results for the case study
sites.
Histograms of the average delay per vehicle results for RCUT designs at each case study
site location are provided comparing the HCM and VISSIM results. The average delay per vehicle
for US-81 and NE-91 near Humphrey, NE is shown below in Figure 5-3. The average delay per
vehicle for US-81 and NE-32 near Madison, NE is shown below in Figure 5-4. The average delay
per vehicle for US-75 and NE-35 near Dakota City, NE is shown below in Figure 5-5.

80
Figure 5-3 Average delay comparison for RCUT at US-81 and NE-91 near Humphrey, NE
Figure 5-4 Average delay comparison for RCUT at US-81 and NE-32 near Madison, NE
Figure 5-5 Average delay comparison for RCUT at US-75 and NE-35 near Dakota City, NE
81
The HCM analysis for the case study location at US-81 and NE-91 near Humphrey predicts
very similar average experienced travel times (ETT) as those predicted by VISSIM
microsimulation. Discrepancies between the two appear for the minor approach left and through
movements, where oversaturated conditions occur and the models are very susceptible to varying
results based on queue buildup during the time of analysis. The comparison of results between
HCM and microsimulation for the intersection of US-81 and NE-32 near Madison are very similar
to the results from the case study site location near Humphrey.
At the case study location of US-75 and NE-35 near Dakota City, the ETT predicted by the
HCM methodology for the eastbound approach is significantly higher than the VISSIM
microsimulation. As with the other two locations this is occurring in oversaturated conditions
where demand is in excess of capacity, queues continue to grow over time, and the average delay
is dependent upon the length of the analysis period being calculated.
The findings herein suggest that both HCM and microsimulation measures of experienced
travel time for restricted crossing u-turns are in agreement for undersaturated conditions. It is the
authors’ belief that as traffic demands increase toward capacity that site-specific driver behaviors
will have a great impact on the actual travel time experienced in the field, and that the driver
behaviors themselves will be impacted by the levels of congestion at the site. That is to say, the
gap acceptance and follow-up headway of drivers in congested driving conditions are likely to be
smaller than those of drivers experiencing no delay; however, at this time neither microsimulation
nor the HCM methodology is able to take this interactive behavior into account.
82
Cost-Benefit Analysis and Decision Matrix
The cost-benefit analysis of the design alternatives at each location includes the monetized value
of delay, the monetized value of crash reduction rates, and the estimated construction costs for the
mitigation. As the capital construction costs for unsignalized intersections is essentially a one-time
expense, and the monetized delay and safety values see annual returns, the measure of
effectiveness for the costs will be presented as estimated return on investment in terms of years to
recuperate the initial construction costs.
Monetized Traffic Delay
Calculating the cost of delay involved estimating the worth of an individual’s time. The Bureau of
Labor Statistics reports that the average hourly wage for a worker in Nebraska was $21.89/hr for
May of 2017 [45]. This rate is used to calculate the cost of delay experienced during the peak hours
analyzed. The peak hour is then taken equal to 15% of the average daily traffic [37]. Conversions
from delay to monetized traffic delay are displayed below, in Table 6-1.
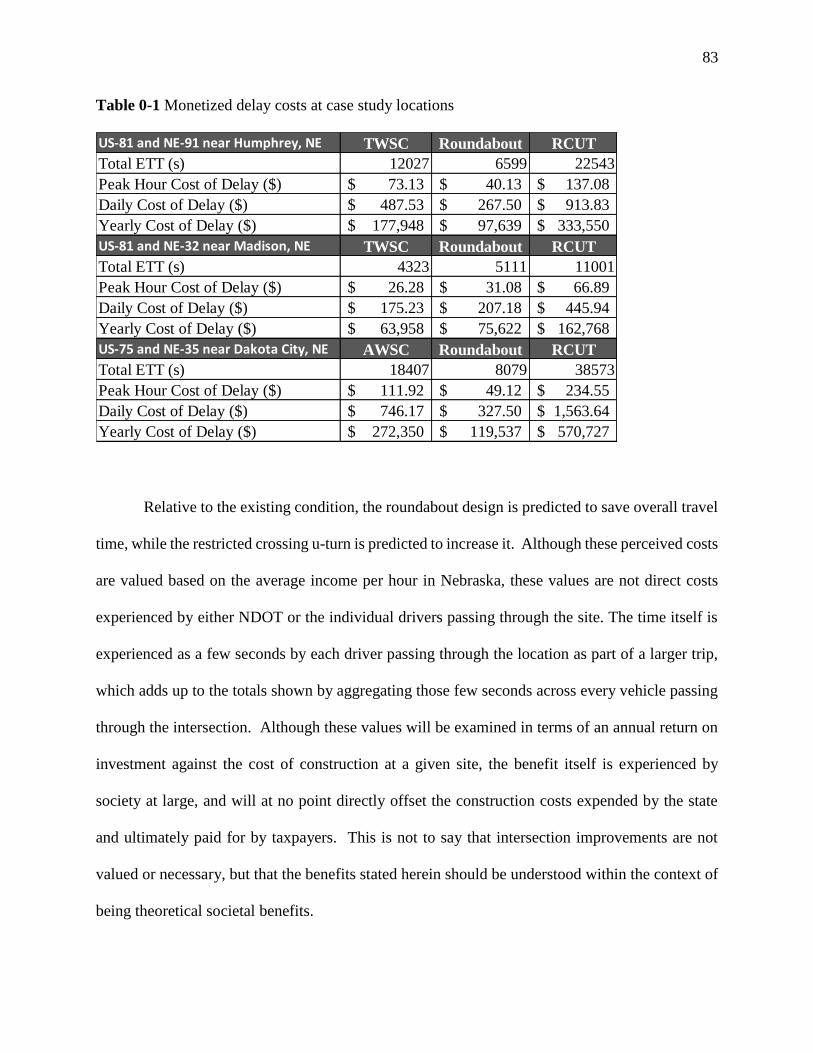
83
Table 0-1 Monetized delay costs at case study locations
Relative to the existing condition, the roundabout design is predicted to save overall travel
time, while the restricted crossing u-turn is predicted to increase it. Although these perceived costs
are valued based on the average income per hour in Nebraska, these values are not direct costs
experienced by either NDOT or the individual drivers passing through the site. The time itself is
experienced as a few seconds by each driver passing through the location as part of a larger trip,
which adds up to the totals shown by aggregating those few seconds across every vehicle passing
through the intersection. Although these values will be examined in terms of an annual return on
investment against the cost of construction at a given site, the benefit itself is experienced by
society at large, and will at no point directly offset the construction costs expended by the state
and ultimately paid for by taxpayers. This is not to say that intersection improvements are not
valued or necessary, but that the benefits stated herein should be understood within the context of
being theoretical societal benefits.
US-81 and NE-91 near Humphrey, NE TWSC Roundabout RCUT
Total ETT (s) 12027 6599 22543
Peak Hour Cost of Delay ($) 73.13$ 40.13$ 137.08$
Daily Cost of Delay ($) 487.53$ 267.50$ 913.83$
Yearly Cost of Delay ($) 177,948$ 97,639$ 333,550$
US-81 and NE-32 near Madison, NE TWSC Roundabout RCUT
Total ETT (s) 4323 5111 11001
Peak Hour Cost of Delay ($) 26.28$ 31.08$ 66.89$
Daily Cost of Delay ($) 175.23$ 207.18$ 445.94$
Yearly Cost of Delay ($) 63,958$ 75,622$ 162,768$
US-75 and NE-35 near Dakota City, NE AWSC Roundabout RCUT
Total ETT (s) 18407 8079 38573
Peak Hour Cost of Delay ($) 111.92$ 49.12$ 234.55$
Daily Cost of Delay ($) 746.17$ 327.50$ 1,563.64$
Yearly Cost of Delay ($) 272,350$ 119,537$ 570,727$
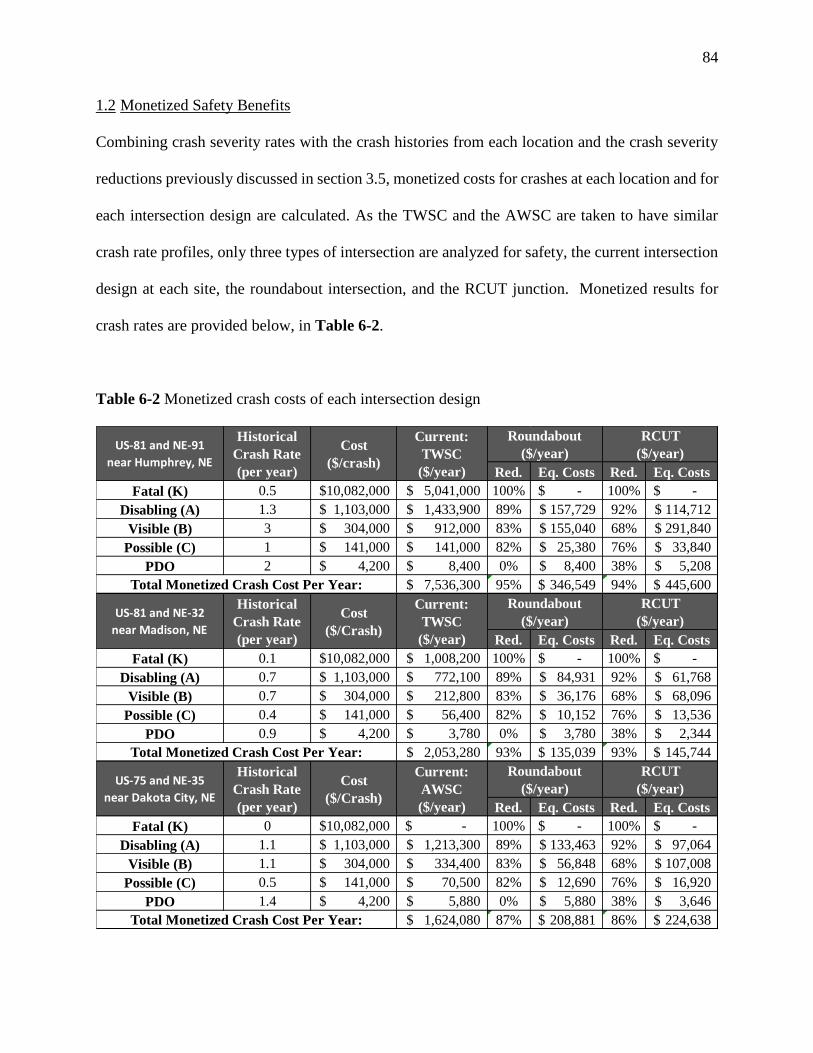
84
1.2 Monetized Safety Benefits
Combining crash severity rates with the crash histories from each location and the crash severity
reductions previously discussed in section 3.5, monetized costs for crashes at each location and for
each intersection design are calculated. As the TWSC and the AWSC are taken to have similar
crash rate profiles, only three types of intersection are analyzed for safety, the current intersection
design at each site, the roundabout intersection, and the RCUT junction. Monetized results for
crash rates are provided below, in Table 6-2.
Table 6-2 Monetized crash costs of each intersection design
Red. Eq. Costs Red. Eq. Costs
Fatal (K) 0.5 10,082,000$ 5,041,000$ 100% -$ 100% -$
Disabling (A) 1.3 1,103,000$ 1,433,900$ 89% 157,729$ 92% 114,712$
Visible (B) 3 304,000$ 912,000$ 83% 155,040$ 68% 291,840$
Possible (C) 1 141,000$ 141,000$ 82% 25,380$ 76% 33,840$
PDO 2 4,200$ 8,400$ 0% 8,400$ 38% 5,208$
7,536,300$ 95% 346,549$ 94% 445,600$
Red. Eq. Costs Red. Eq. Costs
Fatal (K) 0.1 10,082,000$ 1,008,200$ 100% -$ 100% -$
Disabling (A) 0.7 1,103,000$ 772,100$ 89% 84,931$ 92% 61,768$
Visible (B) 0.7 304,000$ 212,800$ 83% 36,176$ 68% 68,096$
Possible (C) 0.4 141,000$ 56,400$ 82% 10,152$ 76% 13,536$
PDO 0.9 4,200$ 3,780$ 0% 3,780$ 38% 2,344$
2,053,280$ 93% 135,039$ 93% 145,744$
Red. Eq. Costs Red. Eq. Costs
Fatal (K) 0 10,082,000$ -$ 100% -$ 100% -$
Disabling (A) 1.1 1,103,000$ 1,213,300$ 89% 133,463$ 92% 97,064$
Visible (B) 1.1 304,000$ 334,400$ 83% 56,848$ 68% 107,008$
Possible (C) 0.5 141,000$ 70,500$ 82% 12,690$ 76% 16,920$
PDO 1.4 4,200$ 5,880$ 0% 5,880$ 38% 3,646$
1,624,080$ 87% 208,881$ 86% 224,638$ Total Monetized Crash Cost Per Year:
Total Monetized Crash Cost Per Year:
Total Monetized Crash Cost Per Year:
Roundabout
($/year)
RCUT
($/year)US-75 and NE-35
near Dakota City, NE
Historical
Crash Rate
(per year)
Cost
($/Crash)
Current:
AWSC
($/year)
Roundabout
($/year)
RCUT
($/year)US-81 and NE-32
near Madison, NE
Historical
Crash Rate
(per year)
Cost
($/Crash)
Current:
TWSC
($/year)
Historical
Crash Rate
(per year)
Cost
($/crash)
US-81 and NE-91
near Humphrey, NE
Current:
TWSC
($/year)
RCUT
($/year)
Roundabout
($/year)

85
Both the roundabout and the restricted-crossing u-turn (RCUT) designs provide significant
improvements to safety over the existing two-way stop-controlled (TWSC) or all-way stop-
controlled (AWSC) intersection designs. The benefits of the roundabout range from an 87%
reduction in monetized crash costs up to a 95% reduction, with similar findings for the RCUT
design, though the RCUT is currently predicted to have about 10% higher crash-related costs per
year than an equivalent roundabout design. One trend that can be implied from the few sample
sources studied is that the greatest benefits of constructing these safer designs are seen for
intersections currently experiencing the highest crash rates and crash severities, since both the
roundabout and RCUT designs are able to completely remove the threat of fatal crashes.
As with the monetized delay results, the monetized safety results represent costs to society
at large, and not direct costs to NDOT or the taxpayers, in terms of offsetting the construction costs
incurred for building a mitigated intersection geometry at a given site. However, knowing the
society costs potentially saved by choosing to construct these alternative intersection designs can
help to provide guidance for prioritization of the funding available to NDOT for improving the
safety of the surface roadway network.
1.3 Cost-benefit comparison of final results
Assessing return on investment of the various mitigation strategies can be achieved by combining
the monetized delay results from Table 6-1, with the monetized safety results from Table 6-2, and
the average construction costs for a roundabout ($365,000) and a restricted crossing u-turn junction
($860,000) as previously discussed in section 3.5 of this report. The results of these computations
are provided below, in Table 6-3.
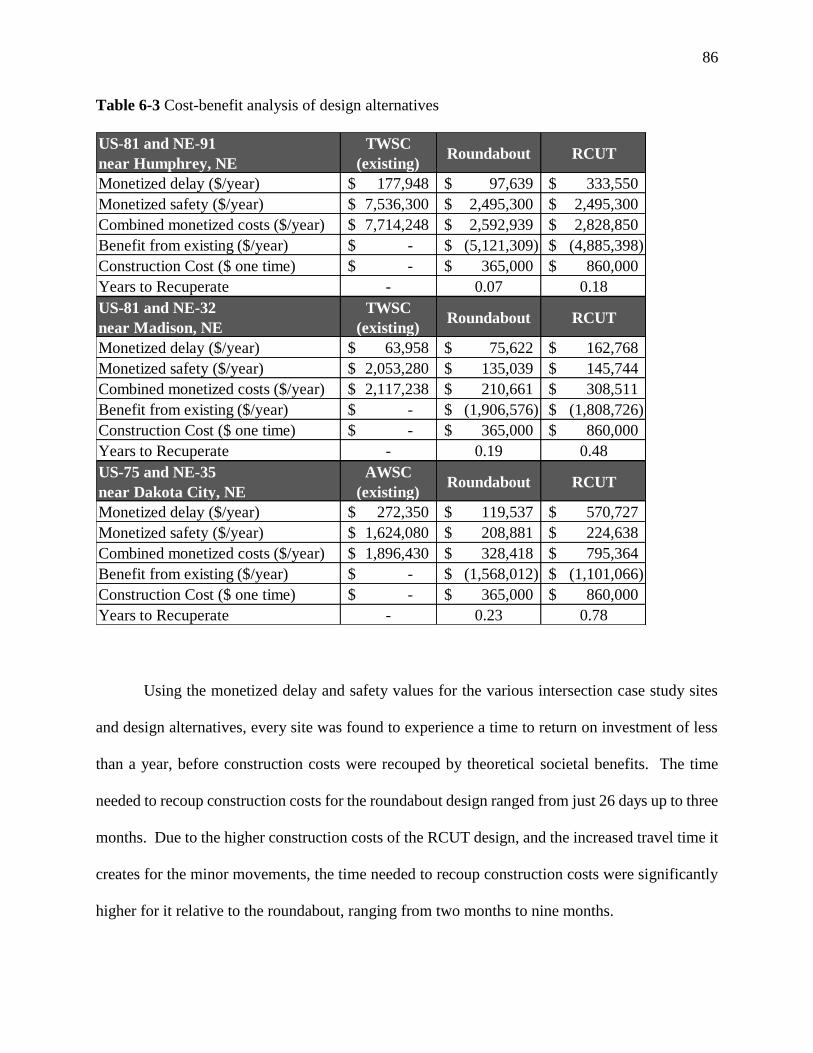
86
Table 6-3 Cost-benefit analysis of design alternatives
Using the monetized delay and safety values for the various intersection case study sites
and design alternatives, every site was found to experience a time to return on investment of less
than a year, before construction costs were recouped by theoretical societal benefits. The time
needed to recoup construction costs for the roundabout design ranged from just 26 days up to three
months. Due to the higher construction costs of the RCUT design, and the increased travel time it
creates for the minor movements, the time needed to recoup construction costs were significantly
higher for it relative to the roundabout, ranging from two months to nine months.
US-81 and NE-91
near Humphrey, NE
TWSC
(existing)Roundabout RCUT
Monetized delay ($/year) 177,948$ 97,639$ 333,550$
Monetized safety ($/year) 7,536,300$ 2,495,300$ 2,495,300$
Combined monetized costs ($/year) 7,714,248$ 2,592,939$ 2,828,850$
Benefit from existing ($/year) -$ (5,121,309)$ (4,885,398)$
Construction Cost ($ one time) -$ 365,000$ 860,000$
Years to Recuperate - 0.07 0.18
US-81 and NE-32
near Madison, NE
TWSC
(existing)Roundabout RCUT
Monetized delay ($/year) 63,958$ 75,622$ 162,768$
Monetized safety ($/year) 2,053,280$ 135,039$ 145,744$
Combined monetized costs ($/year) 2,117,238$ 210,661$ 308,511$
Benefit from existing ($/year) -$ (1,906,576)$ (1,808,726)$
Construction Cost ($ one time) -$ 365,000$ 860,000$
Years to Recuperate - 0.19 0.48
US-75 and NE-35
near Dakota City, NE
AWSC
(existing)Roundabout RCUT
Monetized delay ($/year) 272,350$ 119,537$ 570,727$
Monetized safety ($/year) 1,624,080$ 208,881$ 224,638$
Combined monetized costs ($/year) 1,896,430$ 328,418$ 795,364$
Benefit from existing ($/year) -$ (1,568,012)$ (1,101,066)$
Construction Cost ($ one time) -$ 365,000$ 860,000$
Years to Recuperate - 0.23 0.78
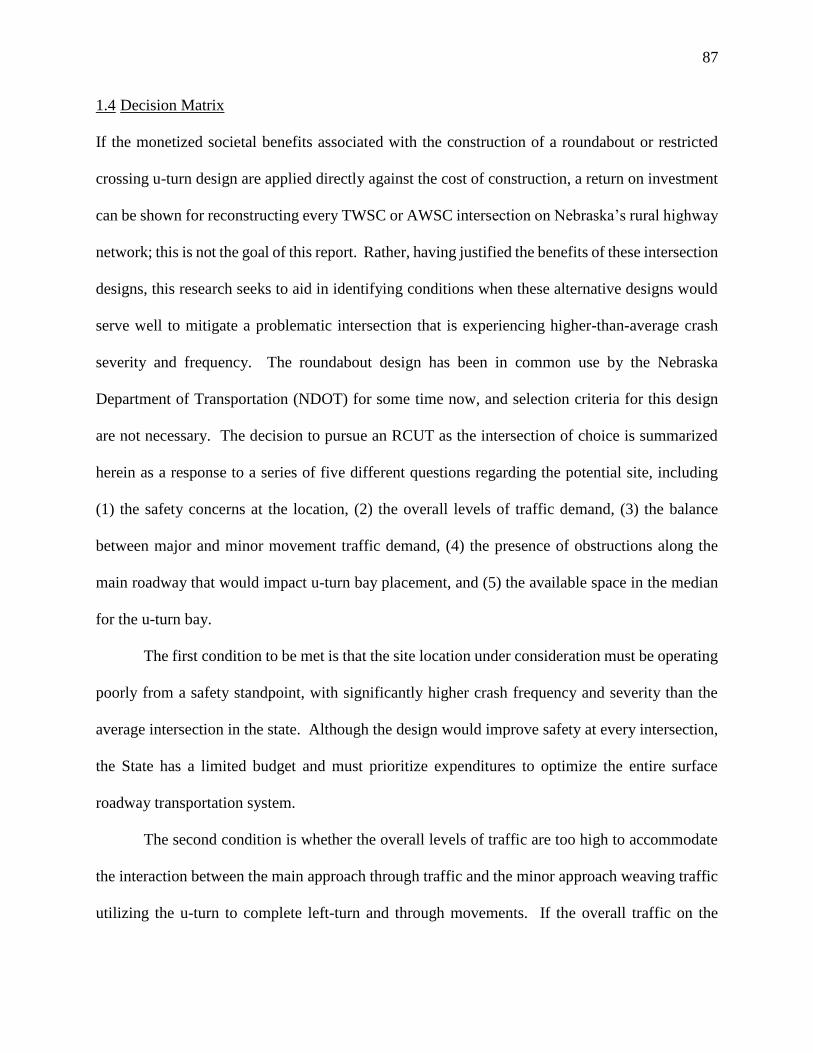
87
1.4 Decision Matrix
If the monetized societal benefits associated with the construction of a roundabout or restricted
crossing u-turn design are applied directly against the cost of construction, a return on investment
can be shown for reconstructing every TWSC or AWSC intersection on Nebraska’s rural highway
network; this is not the goal of this report. Rather, having justified the benefits of these intersection
designs, this research seeks to aid in identifying conditions when these alternative designs would
serve well to mitigate a problematic intersection that is experiencing higher-than-average crash
severity and frequency. The roundabout design has been in common use by the Nebraska
Department of Transportation (NDOT) for some time now, and selection criteria for this design
are not necessary. The decision to pursue an RCUT as the intersection of choice is summarized
herein as a response to a series of five different questions regarding the potential site, including
(1) the safety concerns at the location, (2) the overall levels of traffic demand, (3) the balance
between major and minor movement traffic demand, (4) the presence of obstructions along the
main roadway that would impact u-turn bay placement, and (5) the available space in the median
for the u-turn bay.
The first condition to be met is that the site location under consideration must be operating
poorly from a safety standpoint, with significantly higher crash frequency and severity than the
average intersection in the state. Although the design would improve safety at every intersection,
the State has a limited budget and must prioritize expenditures to optimize the entire surface
roadway transportation system.
The second condition is whether the overall levels of traffic are too high to accommodate
the interaction between the main approach through traffic and the minor approach weaving traffic
utilizing the u-turn to complete left-turn and through movements. If the overall traffic on the
88
roadway is above around 50,000 AADT, the performance of the unsignalized RCUT design
significantly deteriorates, as does that of the roundabout design, and signalized or grade separated
solutions should likely be pursued at the site.
The third consideration is the balance of traffic between the major approaches and the
minor approach. With very high experienced extra travel time impacting minor approach left and
through movements, the average delay per vehicle and subsequently the LOS of intersection, is
largely governed by the ratio of free-moving through traffic on the main road to redirected traffic
from the side road. If the AADT of the minor approach is greater than about 80% of the AADT
of the major approach, the delay experienced by the minor movements will reduce the overall level
of service for the junction below acceptable levels. If overall AADT levels are low, but the
volumes are nearly balanced between the major approach and the minor approach, then a
roundabout or another unsignalized solution should be pursued.
The fourth consideration is the nature of obstructions downstream of the main
intersection along the major roadway. The u-turn bays should be located between 1,000 feet and
2,000 feet downstream of the main intersection. If the location is too close minor approach
cannot safety execute weaving maneuvers in the presence of high-speed through traffic on the
major roadway, and if it located too far away the additional travel time imposed on the minor
movements reduces the aggregate level of service for the intersection. The u-turn bay needs
approximately 500 feet of unimpeded space with no driveways, cross streets, or major
obstructions such as trees or small buildings. If an appropriate stretch of 500 feet cannot be
located or created between 1,000 and 2,000 feet from the intersection, an alternative unsignalized
design should be considered.

89
The fifth consideration is the nature of the median available along the major roadway
approaches. The design-vehicle turning radius requires a necessary offset between the far lane of
the opposing lanes, and the edge of the u-turn bay constructed into the existing median of the site.
If the existing median is less than 40 feet in width, the minor approach left-turn and through
movements will be unable to safely execute the u-turn within the paved limits of the roadway. In
some cases when the existing median is smaller than 40 feet, it is possible to construct a “loon” of
pavement into the right-of-way beyond the limits of the traveled way on the opposing lanes,
allowing trucks and other large vehicles to execute the u-turn movement. If there are obstructions
beyond the travelled way, or if there is a limited width of right-of-way available, it may not be
possible to construct the loon. If neither the 40 foot median width nor the “loon” is available at
the existing site, the RCUT design might still be an appropriate choice, but additional construction
costs should be anticipated due to the realignment of the highway in the vicinity of the junction to
allow for the required spacing.
Assuming each of the five conditions as described above have been met, the RCUT
geometry represents the safest at-grade intersection design that will allow for unimpeded through-
movements along rural highways, and is anticipated to be a widely applied solution for
unsignalized rural highway intersections in Nebraska and nationwide. A graphical representation
of the considerations as outlined above is provided below, as a decision matrix in Figure 6-1.
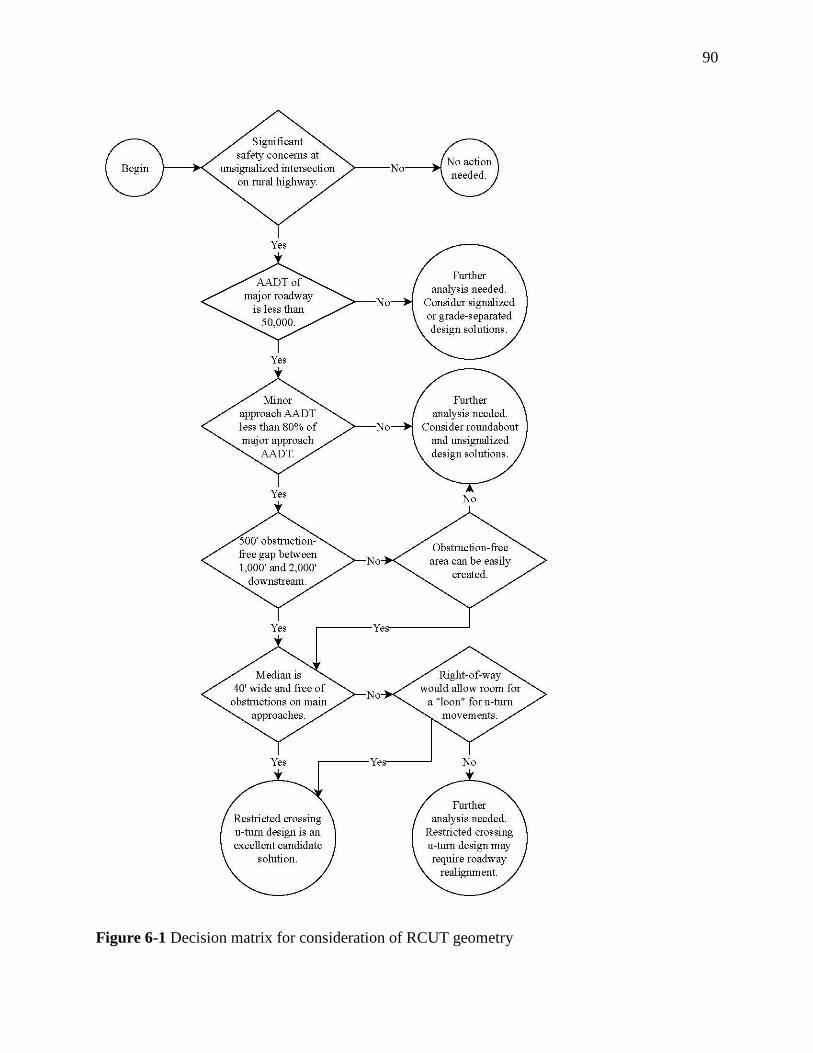
90
Figure 6-1 Decision matrix for consideration of RCUT geometry
91
Limitations of the Study
All research projects are limited both in time and budget, which unfortunately results in limitations
on the methodology and findings as well. Some of the key limitations identified by the researchers
regarding the current report include (1) the weighting of monetized societal costs for delay and
crash measures, (2) the limited number of sites and traffic demand volumes investigated, and (3)
a decision tool or other methodology for selecting the placement of the u-turn bays, and (4) the
inclusion of a grade separated interchange as one of the design alternatives.
The results of the cost-benefit analysis conducted herein relied heavily on comparing
monetized societal costs for traffic delay and crashes, against the direct costs to reconstruct the
intersection with an alternate geometry. By taking these two different types of value as equivalent
to each other, the theoretical result is a justification to reconstruct every unsignalized intersection
in Nebraska. The greatest potential improvement for a more nuanced examination of the benefits
of reconstructing intersections would be a meaningful way to weight the value of societal costs, to
better identify where the tipping point lies between reconstructing an intersection and retaining the
existing geometry.
The case studies conducted utilized field-observed traffic demand volumes to predict
comparisons of travel delay between intersection designs. A useful additional effort would have
been to grow/shrink these volumes and conduct additional analysis for higher and lower levels of
AADT. This analysis could then predict, more generally, at what levels of AADT the RCUT
design can be expected to fail, relative to other geometries. A large challenge with this type of
analysis is that any geometric design can be made to function properly with the addition of extra
turn lanes. The ultimate, more nuanced approach, would be to assess the cost of construction for
the least number of necessary turn lanes (the geometry as presented in the analysis of this report),

92
and examine the cost increases due to additional lanes as traffic levels increase. This would then
provide a way for NDOT to quickly assess site appropriateness for the RCUT design based on
costs increasing with higher AADT.
The location of the u-turn bays is currently a topic of debate in the literature. Moving the
bays too close to the main intersection creates safety problems with minor approach vehicles
making relatively low-speed weaving maneuvers through high-speed major approach through
traffic. Moving the bays too far away from the main intersection creates significant increases in
experienced travel time, reducing the level of service (LOS) of the intersection. The researchers
would have liked to systematically move the location of the u-turn bay and simulate the delay
results, in order to quantify the monetized delay costs associated with the placement of the u-turn
bay, but were unable to do so with the current scope. Each potential site for intersection
reconstruction will have site specific limitations that impact the placement of u-turn bays, and it
would be beneficial to NDOT to have a decision tool or method to compare the costs required to
relocate site obstructions against the costs imparted by moving the u-turn location further down.
The ultimate resolution of an at-grade rural highway intersection experiencing high
frequency and severity of crashes is reconstructing the site as a grade-separated interchange. This
solution is an order of magnitude more costly than reconstruction using one of the alternative
intersection designs, but is still chosen as a preferred solution to maintain unimpeded through
movements on the highway. A better understanding on the safety benefits of grade-separation and
the construction costs associated with this facility would have provided a more complete review
of the options being considered by NDOT when planning intersection reconstruction projects.
93
Conclusions and Recommendations
The main finding of this research report is that both the roundabout and restricted crossing u-turn
(RCUT) intersection designs improve safety at two-way stop controlled (TWSC) and all-way stop
controlled (AWSC) rural highway intersections to such a degree that they are always justified,
given that societal costs associated with crashes are taken equal to the cost for intersection
reconstruction. The roundabout has the greatest safety performance, as well as the greatest
operational performance (lowest vehicle travel times) of all the unsignalized at-grade intersection
designs assessed, and should be the design of choice whenever it is permissible to reduce the speed
of the main approach through traffic. For cases when it is not acceptable to impede the main
approach through traffic, the RCUT design provides excellent safety improvement without
significant operational performance degradation of the intersection. Intersection reconstruction of
existing TWSC and AWSC intersections should be conducted based on recent crash history, both
severity and frequency, with selection between the roundabout and RCUT design determined
based on the classification of the roadway location and whether through traffic on major
approaches may be impeded.
1.1 Findings Organized by Chapter
Although the main finding of this report, as stated above, is that both roundabouts and restricted
crossing u-turn junctions are effective mitigation tools to address safety concerns at TWSC
intersections on rural highways, this report includes many other pertinent findings that are spread
throughout the chapters, organized by topic.
The literature review conducted in Chapter 2 included some essential findings that may impact
the decision making process when selecting an appropriate safety mitigation strategy. There was

94
an initial concern with driver expectancy, which prevented this design from being widely adopted
throughout the country. However, a sufficient number of installations have now been completed
in states like North Carolina, Maryland, and Minnesota, and safety data from a broad range of
these installations has confirmed that the theoretical safety benefits anticipated with the design
have been realized in field applications. The RCUT design is frequently implemented as either
signalized or unsignalized, with urban applications having signalization and short offsets to u-turn
bays (of only a hundred feet), while rural applications of the design use stop-control and have
much longer offsets of 1,000 to 2,000 feet due to the conflict between high-speed major street
through traffic, and lower-speed weaving maneuvers being performed by traffic from the minor
approach. The Federal Highway Administration (FHWA) has provided general guidance on the
geometric layout of these designs, but more specific design guidance has been developed by each
state agency based on their own internal experience with implementing the design locally; it is
anticipated that normalization of the design will occur with upcoming releases of the Manual on
Uniform Traffic Control Delay (MUTCD) and A Policy on Geometric Design of Highways and
Streets (Green Book). There is some disagreement in the literature regarding the operational
impacts of this intersection, particularly for the unsignalized design, as the minor movements
experience significant increases in experienced travel time while the unimpeded through
movements on the main approaches are not included in the weighted average of the operational
analysis. Generally speaking, the RCUT design increases travel times for minor roadway traffic,
while reducing or maintaining low or no delays for major roadway traffic. The safety benefit of
the RCUT design is the primary reason for its recent embrace by a number of state agencies
throughout the country, with a significant reduction in vehicle conflict points, and field-observed
crash reduction rates, particularly for the most severe crash types. Two-way stop controlled

95
(TWSC) intersections on rural highways are prone to experiencing fatal right-angle accidents as
minor street traffic enters high-speed through lanes, a type of crash that the RCUT design is
intended to prevent. There is some difficulty to accommodate high volumes of bicycle and
pedestrian movements with the RCUT design, but this becomes a consideration of lower priority
when considering rural highway applications.
The methodology of the research conducted, as described in Chapter 3, may have a significant
impact on the way in which the findings of this report are interpreted. Comparative analysis was
conducted for three site locations with either TWSC or all-way stop control (AWSC) existing
geometry, analyzing the anticipated impacts of mitigation with a roundabout or an RCUT design.
In designing the simulated intersection geometry, some concerns were raised about the potential
cost impacts of implementing RCUT junctions on Nebraska’s rural highway system. The typical
median width for rural highways in Nebraska is 40’ from edge of travelway to edge of travelway,
which would leave approximately 28’ remaining if a left-turn bay were added to an existing
median. However, the recommended minimum median width to accommodate the turning radius
of a WB-40 design vehicle would instead be 51’ in the absence of a loon, and 41’ if a loon were
to be constructed. This initial analysis suggests that every potential RCUT location in the state
will require some realignment of roadway to achieve the necessary separation, with significant
full-depth roadway reconstruction increasing the cost of the project. Regarding the operational
analysis of the design, the conversion of delay to level-of-service (LOS) was examined, and
concerns were raised regarding the comparative analysis between different intersection
geometries, with the potential for one intersection to perform better in terms of average delay,
while an alternate design might perform better in terms of level-of-service, due to the way that
signalized intersections are allowed more delay than unsignalized ones at the same operational

96
level. Finally, from a methodology perspective, delay and crash rates were converted to equivalent
societal costs, but return-on-investment analysis takes these societal cost values as equal to
construction costs, with the mismatch between the two measures not resolved at this time.
The case study site locations selected in Chapter 4 were chosen from a list of candidate sites
provided by the Nebraska Department of Transportation. Each of these sites met the criteria of
being an unsignalized TWSC or AWSC junction between a four-lane rural highway and a minor
road arterial, and most of the sites identified have higher than average observed crash rates over
the previous five years. Initial implementation of RCUT designs in other states has been done in
series along one arterial, to acclimatize local drivers to the new geometry, and it was appealing to
examine multiple sites along US-81, such as the chosen sites in Madison and Humphrey, as this
highway exhibits the appropriate combination of demand volumes that is well suited to an
unsignalized RCUT application.
The operational analysis conducted in Chapter 5 confirmed that the purpose of implementing
an alternative design such as a roundabout or an RCUT is for the safety benefits, and not primarily
to increase throughput or decrease delay. Assessing TWSC, AWSC, roundabout, and RCUT
geometries at US-81 in both Humphrey and Madison, all four geometries are predicted to have
average delays of fewer than 15 seconds per vehicle during the peak hour, well below acceptable
thresholds. The intersection of US-75 and Nebraska-35 in Dakota City experiences significantly
more demand volume than the other two sites, and while it is appropriate to keep this site
unsignalized, the TWSC and RCUT designs exhibit much higher average delays closer to 25
seconds per vehicle, with some movements in failure for both designs. The take-away from the
operational analysis is that while the roundabout and RCUT designs do no harm for low demand-
volume conditions, at higher volumes the traffic experiences significant delay, and the TWSC and

97
roundabout options operate better as volumes climb toward the need for signalization. There was
some concern by the researchers in the reliability of the relatively untested RCUT methodology,
which has not yet been implemented widely in standard software packages like Synchro and HCS,
but validation through calibrated microsimulation models showed that the predicted experienced
travel times from the HCM method are at least in line with the predictions from microsimulation.
The costs and benefit analyses from implementing the various intersection geometries were
assessed in Chapter 6, which included monetized delay costs, monetized crash costs, and
anticipated construction costs. Comparing the TWSC and AWSC intersections against the
roundabout, the anticipated delay is sometimes less and sometimes more for the roundabout, but
the relative costs for delay over the course of the year are minimal, in the range of $100 to $200
thousand per year. The experienced travel time at the RCUT intersection is anticipated to be
around twice that of the existing TWSC and AWSC intersections, but again in a relatively low
range of $200 to $600 thousand per year. In contrast, the monetized crash costs for the existing
geometries ranged from the low of $1.6 million for the relatively safe AWSC site in Dakota City,
to the higher $2 million for the TWSC site near Madison, all the way up to $7.5 million per year
for the location in Humphrey, which has experienced a high crash rate in recent years. Mitigating
these locations with either a roundabout or an RCUT intersection is anticipated to reduce the
monetized safety costs by an order of magnitude, in the range of $200 to $250 thousand at Dakota
City, $135 to $145 thousand at Madison, and $350 to $450 thousand per year at Humphrey.
Combining the safety and operations data, the combined benefit per year of constructing an RCUT
junction compared with the existing condition is around $1.1 million for Dakota City, $1.8 million
for Madison, and $4.8 million per year for Humphrey. The roundabout exhibits less delay and has
slightly better safety performance than the RCUT, and the anticipated benefits for it are around a
98
10% improvement over the RCUT. If these monetized delay and safety costs are assumed to be
equivalent weight to the construction costs expended to implement the design, both a roundabout
and an RCUT design would provide a positive return on investment after less than one year, with
an anticipated lifetime of 20 to 30 years before reconstruction may become necessary. In the most
extreme case of a roundabout intersection being constructed at Humphrey, the return on investment
was calculated at just 0.07 years, or 25 days.
However, despite the potential benefit of reconstructing every unsignalized rural highway
intersection to achieve the anticipated safety benefits associated with these designs, there is limited
budget for construction in any given year, and an increasing need to spend that limited budget to
maintain the aging surface roadway infrastructure, rather than taking on new projects such as
roundabout and RCUT reconstruction. State agencies thus need some methodology to triage which
intersections to examine for potential mitigation, and the decision matrix provided at the end of
Chapter 6 is intended to assist with this process. The decision matrix seeks to assess specifically
whether an RCUT intersection would be appropriate; the five factors for consideration identified
include: (1) the safety concerns at the location, (2) the overall levels of traffic demand, (3) the
balance between major and minor movement traffic demand, (4) the presence of obstructions along
the main roadway that would impact u-turn bay placement, and (5) the available space in the
median for the u-turn bay. The results of the decision tree lead to multiple potential options,
varying from the RCUT being an excellent candidate solution, to no action (mitigation) needed at
the site. Other solutions from the decision tree lead to a suggestion to examine grade-separated
design solutions, a suggestion to examine roundabouts or other unsignalized designs, or a
recommendation for further analysis of the cost for realigning the road to implement the RCUT at
a specific site. The primary takeaway from the research is that both a roundabout and an RCUT
99
design can be relied upon to lead to significant safety improvements for unsignalized intersections
on rural highways, and that the decision of which one to use should factor in the potential increase
in delay to the minor approach at the RCUT design if a high demand volume is anticipated (such
as Dakota City), or the consideration of whether it is permissible to interrupt the flow of the major
arterial through movement with a roundabout versus leaving it free-flowing with the RCUT.
The final chapter of content in this report, Chapter 7, examines some of the limitations of the
research conducted. The major concern that the researchers have regarding the findings of this
report is the concept of monetized delay and safety being equal to direct construction costs. While
each site will have many constraints to work with and work around, particularly for placement of
downstream u-turn bays and realignment of roadways for the RCUT design, it is the justification
of whether or not to pursue this solution that is at the heart of this research report, and the weighting
of societal costs versus direct costs is unfortunately an ethical question that is beyond the scope of
this research to resolve.
1.2 Recommendations for Future Work
Having fully-established the potential benefits from the restricted crossing u-turn intersection
regarding the mitigation of safety issues at unsignalized rural highway intersections, further work
needs to be done to expand the recommended practice for use of this design within the state of
Nebraska.
Between the time of the start of this research and the completion of the report, the Nebraska
Department of Transportation conducted design, and will be pursuing construction of the first rural
highway RCUT intersection in the state. Codifying the design decisions made during the process
of that work will lead to a consistent set of design decisions regarding rural highway RCUT
100
facilities in the state. Key takeaways will be the range of downstream offset that is appropriate for
the u-turn bay location, the preferred use of acceleration and/or deceleration lanes for minor street
through and left-turning traffic utilizing the u-turn location, and the desired median widths of the
reconstructed roadway at the location of the u-turn maneuvers.
Although this report includes a great deal of background information about RCUT
intersections in general, the focus has largely been on rural highway applications, and there is a
great deal more work to be done to understand potential urban implementation of this design in
the major cities within the state, such as Omaha, Lincoln, and Grand Island. Because the Nebraska
DOT holds primary responsibility only for the surface roadway network beyond the limits of
metropolitan areas, future funding and direction on urban RCUT facilities in the state will likely
need to be led by city administrators. Based on the broad implementation of both signalized and
unsignalized RCUT facilities in other jurisdictions, it is likely that these design will become a
standard option at some point in the near future throughout Nebraska and the great plains states,
with much work to be completed between now and then.

101
References
[1] J. E. Hummer, B. Ray, A. Daleiden, P. Jenior, and J. Knudsen, “Restricted Crossing U-
turn Informational Guide,” 2014.
[2] R. P. Kramer, “New Combinations of Old Techniques to Rejuvenate Jammed Suburban
Arterials,” 1987.
[3] N. Daubenberger, “Technical Memorandum,” 2017.
[4] B. Claros, Z. Zhu, P. Edara, and C. Sun, “Design Guidance for J-Turns on Rural High-
Speed Expressways,” Transp. Res. Rec. J. Transp. Res. Board, no. 2618, pp. 69–77, 2017.
[5] L. Xu, X. Yang, and G.-L. Chang, “Computing the Minimal U-Turn Offset for an
Unsignalized Superstreet,” Transp. Res. Rec. J. Transp. Res. Board, no. 2618, pp. 48–57,
2017.
[6] C. Sun, Z. Qing, P. Edara, B. Balakrishnan, and J. Hopfenblatt, “Driving Simulator Study
of J-Turn Acceleration–Deceleration Lane and U-Turn Spacing Configurations,” Transp.
Res. Rec. J. Transp. Res. Board, no. 2638, pp. 26–34, 2017.
[7] A Policy on Geometric Design of Highways and Streets, 6th ed. American Association of
State Highway and Transportation Officials, 2011.
[8] J. L. Hochstein, T. Maze, T. Welch, H. Preston, and R. Storm, “The J-Turn Intersection:
Design Guidance and Safety Experience,” 2008.
[9] R. L. Haley and J. E. Hummer, “Operational Effects of Signalized Superstreets in North
Carolina,” 2010.
[10] J. J. Lu, F. Pirinccioglu, and J. C. Pernia, “Safety Evaluation of Right-Turns Followed by
U-Turns at Signalized Intersection (Six or More Lanes) as an Alternative to Direct Left
Turns: Conflict Data Analysis,” 2005.
[11] A. M. Holzem, J. E. Hummer, S. W. O’Brien, B. J. Schroeder, and K. Salamati,
“PEDESTRIAN AND BICYCLIST ACCOMMODATIONS AND CROSSINGS ON
SUPERSTREETS 1 2,” 2015.
[12] T. Kim, P. Edara, and J. Bared, “Operational and Safety Performance of a Non-Traditional
Intersection Design: The Superstreet,” 2007.
[13] J. E. Hummer, R. L. Haley, S. E. Ott, R. S. Foyle, and C. M. Cunningham, “Superstreet
Benefits and Capacities,” 2010.
[14] P. Edara, S. Breslow, C. Sun, and B. Claros, “Empirical Evaluation of J-Turn Intersection
Performance Analysis of Conflict Measures and Crashes,” Oper. Eff. Geom. access
Manag., vol. 2486, pp. 11–18, 2015.
[15] J. Bared, “Restricted Crossing U-Turn Intersection.” FHWA, U.S. Department of
Transportation, 2009.
[16] L. Blincoe, T. R. Miller, E. Zaloshnja, and E. Summary, “The Economic and Societal
Impact of Motor Vehicle Crashes, 2010 (Revised),” 2015.

102
[17] J. E. Hummer, “Unconventional Left-Turn Alternatives for Urban and Suburban
Arterials—Part One,” ITE, vol. 68, pp. 26–29, 1998.
[18] H. Rakha, M. Asce, and Y. Ding, “Impact of Stops on Vehicle Fuel Consumption and
Emissions.”
[19] W. Zhang, N. Kronprasert, and J. Bared, “Restricted Crossing U-Turn Intersection Design
for Improving Safety and Mobility at High-Speed,” no. October 2013, 2015.
[20] M. R. Evans, “Field Evaluation of a Restricted Crossing U-Turn Intersection,” 2012.
[21] S. E. Ott, R. L. Haley, J. E. Hummer, R. S. Foyle, and C. M. Cunningham, “Safety effects
of unsignalized superstreets in North Carolina,” Accid. Anal. Prev., vol. 45, pp. 572–579,
2011.
[22] Google Maps, “No Title,” 2018. .
[23] Manual on Uniform Traffic Control Devices for Streets and Highways, 2009th ed. U.S.
Department of Transportation - Federal Highway Administration, 2009.
[24] S. E. Ott, R. L. Fiedler, J. E. Hummer, R. S. Foyle, and C. M. Cunningham, “Resident,
Commuter, and Business Perceptions of New Superstreets,” 2015.
[25] J. Bonneson, P. McCoy, and D. Eitel, “Interchange Versus At-Grade Intersection On
Rural Expressways,” Transp. Res. Rec., vol. 1395, pp. 39–47, 1992.
[26] S. Zhao, A. J. Khattak, and E. C. Thompson, “Safety and Economic Assessment of
Converting Two-Way Stop-Controlled Intersections to Roundabouts on High Speed Rural
Highways Transportation Research Forum,” Source J. Transp. Res. Forum, vol. 54, no. 1,
pp. 131–144, 2015.
[27] V. Morello and J. Sangster, “Evaluation of the Restricted Crossing U-turn Design as an
Alternative to Grade Seperated Interchanges on Rural Highways,” Transp. Res. Board
97th Annu. Meet., vol. 18-05639, 2018.
[28] “Transportation Research Board, ‘Highway Capacity Manual, 6th Edition,’ Washington,
D.C., 2016.”
[29] Highway Capacity Manual, 5th ed. Washington, D.C.: National Research Council -
Transportation Research Board, 2010.
[30] “PTV Vissim 8: User Manual.” PTV AG, Karlsruhe, Germany, pp. 1–933, 2015.
[31] J. Sangster and H. Rakha, “New Perspectives on Delay and Level of Service at
Intersections and Interchanges,” in Transportation Research Board, 95th Annual Meeting
of the, 2016, p. 15.
[32] H. Isebrands and S. Hallmark, “Statistical Analysis and Development of Crash Prediction
Model for Roundabouts on High-Speed Rural Roadways,” Transp. Res. Rec. Jounral
Transp. Res. Board, vol. 2312, pp. 3–13, 2012.
[33] B. W. Robinson et al., “Roundabouts: An informational guide,” 2000.
[34] H. Isebrands, “Crash Analysis of Roundabouts at High-Speed Rural Intersections,”
103
Transp. Res. Rec. Jounral Transp. Res. Board, vol. 2096, no. 01, pp. 1–7, 2009.
[35] W. Zhang and N. Kronprasert, “ABCs of Designing RCUTs,” Public Roads, 2014.
[36] “AAA Gas Prices,” 2018. .
[37] K. Schurr, K. C. Movva, and L. Zhang, “Improved Method of Using Traffic Estimates to
Evaluate intersection Improvements,” 2008.
[38] Federal Highway Administration, “Highway Safety Improvement Program Manual -
Safety | Federal Highway Administration,” 2011. .
[39] C. Burch, L. Cook, and P. Dischinger, “A Comparison of KABCO and AIS Injury
Severity Metrics Using CODES Linked Data,” Traffic Inj. Prev., vol. 15, no. 6, pp. 627–
630, 2014.
[40] T. Harmon, G. Bahar, and F. Gross, “FHWA Safety Program Crash Costs for Highway
Safety Analysis.”
[41] B. W. Robinson, L. Rodegerdts, and W. Scarborough, “Roundabouts : An Informational
Guide,” McLean, Virginia, 2000.
[42] Federal Highway Administration, “Roundabouts - The Maryland Experience,” 2010.
[43] “Map of Nebraska.” .
[44] W. E. Hughes, R. Jagannathan, D. Sengupta, and J. E. Hummer, “Alternative Intersections
/ Interchanges: Informational Report ( AIIR ),” 2010.
[45] “Nebraska - May 2017 OES State Occupational Employment and Wage Estimates.” .

104
Acknowledgements
The Author would like to recognize the following people:
Dr. John Sangster. For his contribution, guidance, and editorial effort to this master’s thesis.
Above this though, almost four years ago showing an undergraduate student the captivating field
of traffic engineering. As well as offering the same student the opportunity to pursue a master’s
degree, and become involved in the greater community of transportation professionals.
Mr. Gabriel Bruguier and the entire Roads Rail and Racecars group. For their constant
support and friendship. As well as Mr. Gabe giving me a passion for bicycling and through RRRC
introducing me to . . .
Ms. Madalyn Somer. This adventure would not have been nearly as rewarding or worth the
effort without having met you along the way. The University of Nebraska (hopefully) will
recognize me with a Master’s Degree in May, but the greater honor it is giving me is the woman I
am thrilled to call my wife in July. I love you.