Embed Size (px)
Citation preview
Responses of Terrestrial Ecosystems’ Net PrimaryProductivity to Future Regional Climate Change in ChinaDongsheng Zhao, Shaohong Wu*, Yunhe Yin
Institute of Geographical Sciences and Natural Resources Research, Chinese Academy of Sciences, Anwai, Beijing, China
Abstract
The impact of regional climate change on net primary productivity (NPP) is an important aspect in the study of ecosystems’response to global climate change. China’s ecosystems are very sensitive to climate change owing to the influence of theEast Asian monsoon. The Lund–Potsdam–Jena Dynamic Global Vegetation Model for China (LPJ-CN), a global dynamicalvegetation model developed for China’s terrestrial ecosystems, was applied in this study to simulate the NPP changesaffected by future climate change. As the LPJ-CN model is based on natural vegetation, the simulation in this study did notconsider the influence of anthropogenic activities. Results suggest that future climate change would have adverse effectson natural ecosystems, with NPP tending to decrease in eastern China, particularly in the temperate and warm temperateregions. NPP would increase in western China, with a concentration in the Tibetan Plateau and the northwest arid regions.The increasing trend in NPP in western China and the decreasing trend in eastern China would be further enhanced by thewarming climate. The spatial distribution of NPP, which declines from the southeast coast to the northwest inland, wouldhave minimal variation under scenarios of climate change.
Citation: Zhao D, Wu S, Yin Y (2013) Responses of Terrestrial Ecosystems’ Net Primary Productivity to Future Regional Climate Change in China. PLoS ONE 8(4):e60849. doi:10.1371/journal.pone.0060849
Editor: Ben Bond-Lamberty, DOE Pacific Northwest National Laboratory, United States of America
Received January 11, 2013; Accepted March 3, 2013; Published April 11, 2013
Copyright: � 2013 Zhao et al. This is an open-access article distributed under the terms of the Creative Commons Attribution License, which permitsunrestricted use, distribution, and reproduction in any medium, provided the original author and source are credited.
Funding: This study was supported by the National Scientific Technical Supporting Programs during the 12th Five-year Plan of China (2012BAC19B04,2012BAC19B10). The funders had no role in study design, data collection and analysis, decision to publish, or preparation of the manuscript.
Competing Interests: The authors have declared that no competing interests exist.
* E-mail: [email protected]
Introduction
The impact of climate change on ecosystems is an important
topic that has elicited substantial interest across the world [1].
Analysis of recorded temperature in the past century shows a
global surface average temperature rise of approximately 0.74uC.
Based on the mean temperature recorded from 1980 to 1999, the
global surface average temperature is projected to increase by
about 1.1uC to 6.4uC by 2100 [2]. China’s climate, dominated by
the East Asian monsoon, is extremely sensitive to global change
[3]. Following projections from numerous general circulation
models (GCMs), China would experience obvious climate changes
in the future, including increase in average temperature, frequent
occurrences of extreme climatic events, spatial and temporal
heterogeneity in enhancing precipitation, and enlargement of its
arid [4]. These changes in the climate can induce substantial
variations in the composition, structure, and function of terrestrial
ecosystems, thus inducing changes in ecosystem services, which are
closely associated with the living environment of human beings
and socioeconomic sustainability.
The impact of climate change on the ecosystem is poorly
quantified because long-term in situ measurements are very sparse,
and remote sensing techniques are only partially effective [2,5].
Recent studies on the interaction between terrestrial ecosystems
and climate change have primarily focused on enhancing the
simulation of ecosystem models. Considering that ecosystem
models can simulate not only the interaction among ecological
processes but also the feedback between climate and ecosystems,
these models are of paramount importance in understanding
energy balance as well as the water and carbon cycles in an
ecosystem [6–9]. Net primary productivity (NPP) is the rate at
which carbohydrates accumulate in a plant’s tissues [10,11]. NPP
is not only an important index to describe an ecosystem’s structure
and function but also a key element in describing carbon
sequestration in an ecosystem during climate change [12].
Many models, including equilibrium biogeography and biogeo-
chemical models, have been used in previous studies to simulate
the impact of climate change on NPP in China. For example, Ni
et al. employed an equilibrium biogeography model called
BIOME3 to simulate changes in NPP under climate change
scenarios [13]. The researchers found that NPP would increase in
China from 2070 to 2099. Results from a process-based
biogeochemical model (InTEC) indicated that the average forest
NPP might be reduced from 2091 to 2100 under climate change,
thereby inhibiting the CO2 fertilizing effect in plants [14]. Ji et al.
found that the NPP of terrestrial ecosystems in China would
decrease from 1991 to 2100 based on simulations by an
atmospheric–vegetation interaction model (AVIM2) [15]. These
discrepancies in NPP trends can be partially attributed to
ecosystem models because most of them disregard the role of
vegetation dynamics in the carbon cycle during climate change.
Dynamic vegetation models, including vegetation dynamics and
biogeochemical processes, have supplied us with an effective
approach to project transient responses of the ecosystem to rapid
climate change [16,17]. Previous studies were almost entirely
based on climate scenarios generated by GCMs with a resolution
of 200 km to 300 km, which is too coarse for studies at regional or
national scales. Regional climate models (RCMs) may be a better
alternative in overcoming these shortcomings considering that
PLOS ONE | www.plosone.org 1 April 2013 | Volume 8 | Issue 4 | e60849
these models provide greater spatial detail through dynamic
downscaling of the GCM output [18].
Climate changes in China have significant regional differences;
thus, the responses of terrestrial ecosystems to climate change vary
in different regions. This study simulated the NPP of ecosystems in
China under regional climate change scenarios (A2, B2, and A1B)
based on a modified Lund–Potsdam–Jena Dynamic Global
Vegetation Model (LPJ-DGVM). The temporal and spatial
changes in the NPP of ecosystems in different regions were
examined according to eco-regions. The purpose of the study was
to elucidate the impacts of climate change on ecosystems at a
regional scale and provide scientific basis for local adaptation and
mitigating strategies.
Methods and Data
1. MethodsLPJ-DGVM [19] is an integrated dynamic biogeography–
biogeochemistry model developed based on an earlier equilibrium
model, BIOME3. LPJ-DGVM is constructed in a modular
framework, which combines process-based representations of
terrestrial vegetation dynamics and land–atmosphere carbon and
water exchanges. LPJ-DGVM explicitly considers key ecosystem
processes such as vegetation growth, mortality, carbon allocation,
and resource competition. Vegetation structure and composition
are described by ten plant functional types (PFTs) (Table 1), which
are distinguished according to their phenology, physiology,
physiognomy, disturbance response attributes, and bioclimatic
constraints. Gross primary production is computed based on a
coupled photosynthesis–water balance scheme established through
canopy conductance. Net primary production is calculated by
subtracting autotrophic respiration. The sequestrated carbon is
stored in seven PFT-associated pools representing leaves, sap-
wood, heartwood, fine roots, fast and slow decomposition in the
aboveground litter pool, and a below-ground litter pool. The
decomposition rates of soil and litter organic carbon depend on
soil temperature and moisture. Model input includes monthly
mean air temperature, total precipitation, number of wet days and
percentage of full sunshine, annual CO2 concentration, and soil
texture class. The full description of LPJ-DGVM was provided by
Sitch et al. [19]; thus, only a short overview is provided in this
paper. The LPJ-DGVM model is a typical dynamic vegetation
model that has been widely utilized to study terrestrial ecosystem
dynamics and interactions between climate change and ecosystems
at global, regional, and site scales [8,9,16,17,20]. The version
employed in the present study includes improved hydrology by
Gerten et al. [20].
In our previous study [21], LPJ-DGVM was carefully modified
by adding shrub and cold grass PFTs, which were parameterized
based on various inventory and observational data, with respect to
the characteristics of ecosystems in China. The results of the
simulations by the modified LPJ-DGVM for China (LPJ-CN) were
validated with data sets obtained from the sites [21]. The
simulated NPP results from LPJ-CN matched the observed data
(R2 = 0.64, P,0.01), which was better compared with the original
LPJ-DGVM data (R2 = 0.10) employed by Ni [22]. Therefore,
LPJ-CN is assumed to be appropriate for simulating NPP in
China.
Considering that the East Asian monsoon caused by differences
in the heat-absorbing capacity of the continent and the ocean
dominates the climate in China, climatic types vary from tropical
in the south to cold temperate in the north and from humid in the
east to dry in the west. Diverse climates and complex topography
result in high biodiversity in China. The macro-spatial distribution
of ecosystems forms different eco-regions with unique character-
istics. Ecosystem responses to climate change in different eco-
regions vary. According to the ecosystem regionalization scheme
of China by Zheng et al. [23], China can be divided into eight
eco-regions, namely, cold temperate humid region (I), temperate
humid/sub-humid region (II), north semi-arid region (III), warm
temperate humid/sub-humid region (IV), subtropical humid
region (V), tropical humid region (VI), northwest arid region
(VII), and Tibetan Plateau region (VIII). The impact of climate
change on NPP was discussed in this paper according to the eco-
region scheme.
According to the impact degree of future climate change on
NPP, the change would be slight if the absolute change in NPP
compared with the baseline term is ,20%; the change would be
moderate at 20% to 40%, the change would be severe at 40% to
60%, and the change would be extremely severe at over 60%. The
slopes of linear regressions, obtained using the least squares
method, were utilized to assess variation trends in the time series.
Positive slopes indicate increasing trends, whereas negative slopes
indicate decreasing trends. The significance levels of the trends
were assessed by the non-parametric Mann-Kendall test.
2. Data2.1 Climatic data. The data on climate scenarios utilized in
this study were provided by the climate change research group of
the Institute of Environment and Sustainable Development in
Agriculture, Chinese Academy of Agricultural Sciences. Based on
the greenhouse gas emission scenarios of the IPCC Special Report
on Emission Scenarios (SRES) [24], the group produced high-
resolution (0.5u60.5u) climate data scenarios for late 21st century
China through the Providing Regional Climate for Impacts
Studies (PRECIS) system [25]. PRECIS was validated by applying
reanalysis data derived from the European Centre for Medium-
Range Weather Forecasts (ECMWF) as lateral boundary condi-
tions; PRECIS was found to simulate terrestrial climate change in
China effectively [26]. Projected climatic data, including three
SRES emission scenarios (A2, B2, and A1B), for the period 1961
to 2100 were employed in the present study.
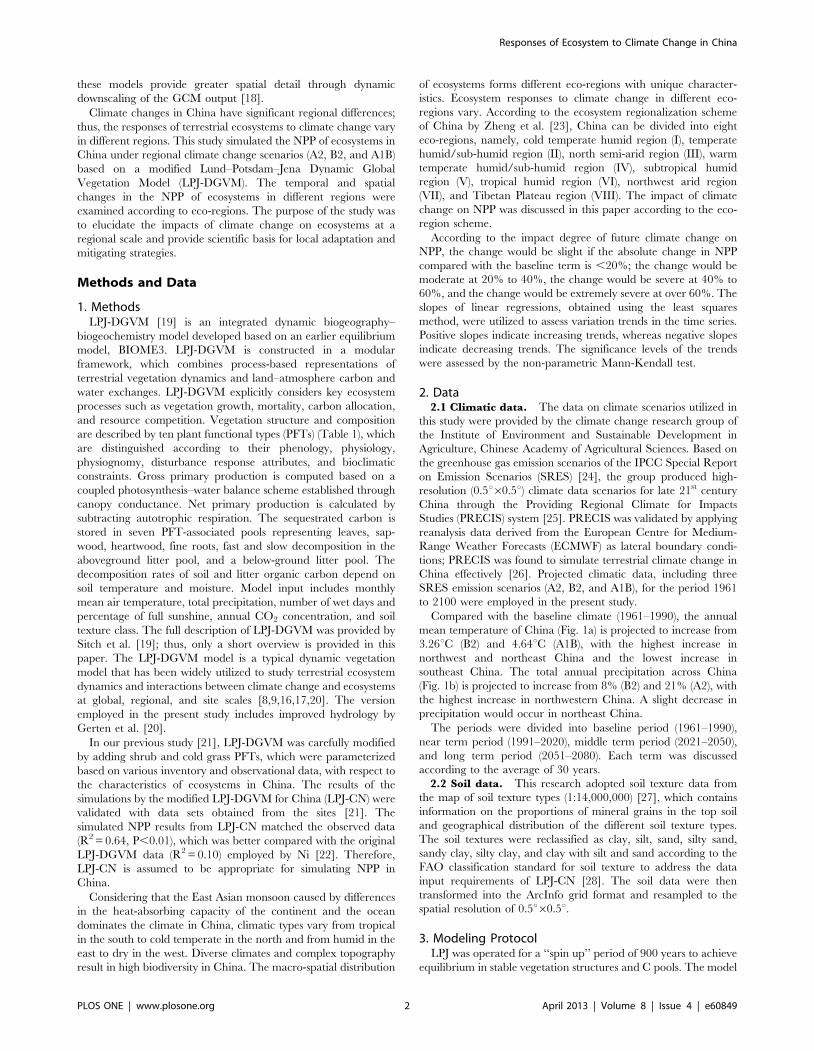
Compared with the baseline climate (1961–1990), the annual
mean temperature of China (Fig. 1a) is projected to increase from
3.26uC (B2) and 4.64uC (A1B), with the highest increase in
northwest and northeast China and the lowest increase in
southeast China. The total annual precipitation across China
(Fig. 1b) is projected to increase from 8% (B2) and 21% (A2), with
the highest increase in northwestern China. A slight decrease in
precipitation would occur in northeast China.
The periods were divided into baseline period (1961–1990),
near term period (1991–2020), middle term period (2021–2050),
and long term period (2051–2080). Each term was discussed
according to the average of 30 years.
2.2 Soil data. This research adopted soil texture data from
the map of soil texture types (1:14,000,000) [27], which contains
information on the proportions of mineral grains in the top soil
and geographical distribution of the different soil texture types.
The soil textures were reclassified as clay, silt, sand, silty sand,
sandy clay, silty clay, and clay with silt and sand according to the
FAO classification standard for soil texture to address the data
input requirements of LPJ-CN [28]. The soil data were then
transformed into the ArcInfo grid format and resampled to the
spatial resolution of 0.5u60.5u.
3. Modeling ProtocolLPJ was operated for a ‘‘spin up’’ period of 900 years to achieve
equilibrium in stable vegetation structures and C pools. The model
Responses of Ecosystem to Climate Change in China
PLOS ONE | www.plosone.org 2 April 2013 | Volume 8 | Issue 4 | e60849
was thereafter subjected to transient climate. Observed atmo-
spheric CO2 concentration was applied to the ecosystem model
simulation for the period of 1961 to 1990. In the projected
simulation, the atmospheric CO2 concentration would remain at
the value of 1990. The scheme was designed to eliminate the
fertilizing effects of atmospheric CO2 concentration on the
ecosystem.
Results
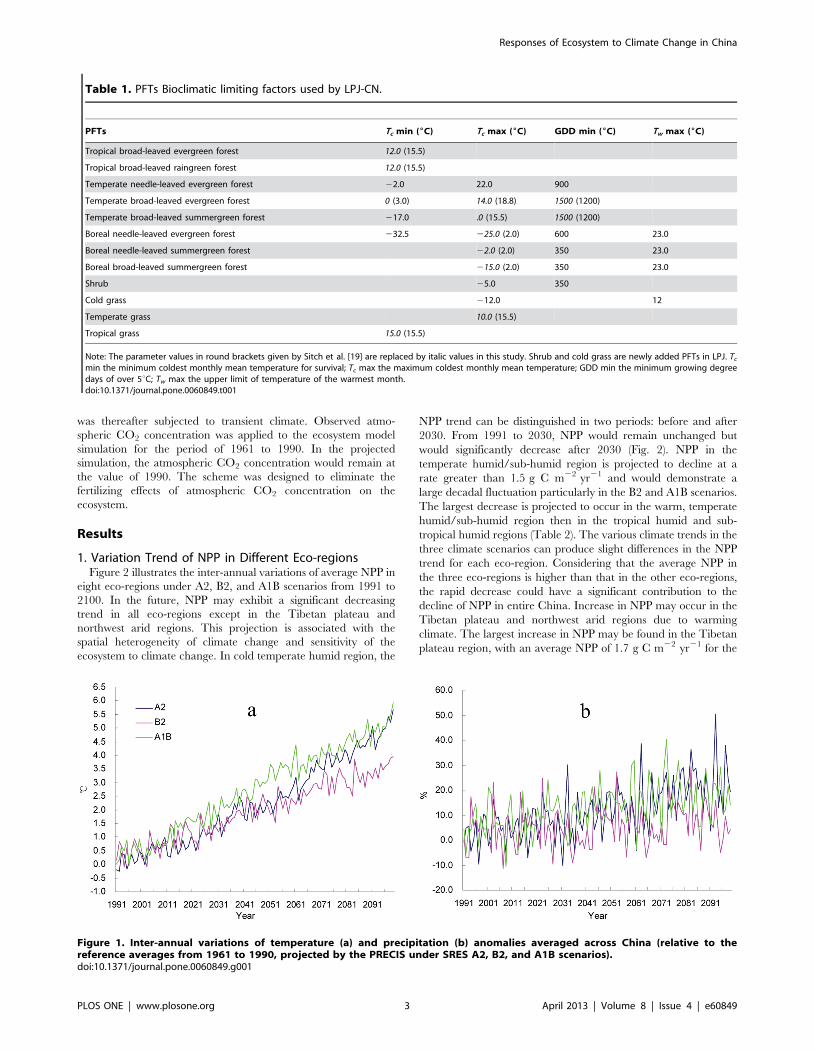
1. Variation Trend of NPP in Different Eco-regionsFigure 2 illustrates the inter-annual variations of average NPP in
eight eco-regions under A2, B2, and A1B scenarios from 1991 to
2100. In the future, NPP may exhibit a significant decreasing
trend in all eco-regions except in the Tibetan plateau and
northwest arid regions. This projection is associated with the
spatial heterogeneity of climate change and sensitivity of the
ecosystem to climate change. In cold temperate humid region, the
NPP trend can be distinguished in two periods: before and after
2030. From 1991 to 2030, NPP would remain unchanged but
would significantly decrease after 2030 (Fig. 2). NPP in the
temperate humid/sub-humid region is projected to decline at a
rate greater than 1.5 g C m22 yr21 and would demonstrate a
large decadal fluctuation particularly in the B2 and A1B scenarios.
The largest decrease is projected to occur in the warm, temperate
humid/sub-humid region then in the tropical humid and sub-
tropical humid regions (Table 2). The various climate trends in the
three climate scenarios can produce slight differences in the NPP
trend for each eco-region. Considering that the average NPP in
the three eco-regions is higher than that in the other eco-regions,
the rapid decrease could have a significant contribution to the
decline of NPP in entire China. Increase in NPP may occur in the
Tibetan plateau and northwest arid regions due to warming
climate. The largest increase in NPP may be found in the Tibetan
plateau region, with an average NPP of 1.7 g C m22 yr21 for the
Table 1. PFTs Bioclimatic limiting factors used by LPJ-CN.
PFTs Tc min (6C) Tc max (6C) GDD min (6C) Tw max (6C)
Tropical broad-leaved evergreen forest 12.0 (15.5)
Tropical broad-leaved raingreen forest 12.0 (15.5)
Temperate needle-leaved evergreen forest 22.0 22.0 900
Temperate broad-leaved evergreen forest 0 (3.0) 14.0 (18.8) 1500 (1200)
Temperate broad-leaved summergreen forest 217.0 .0 (15.5) 1500 (1200)
Boreal needle-leaved evergreen forest 232.5 225.0 (2.0) 600 23.0
Boreal needle-leaved summergreen forest 22.0 (2.0) 350 23.0
Boreal broad-leaved summergreen forest 215.0 (2.0) 350 23.0
Shrub 25.0 350
Cold grass 212.0 12
Temperate grass 10.0 (15.5)
Tropical grass 15.0 (15.5)
Note: The parameter values in round brackets given by Sitch et al. [19] are replaced by italic values in this study. Shrub and cold grass are newly added PFTs in LPJ. Tc
min the minimum coldest monthly mean temperature for survival; Tc max the maximum coldest monthly mean temperature; GDD min the minimum growing degreedays of over 5uC; Tw max the upper limit of temperature of the warmest month.doi:10.1371/journal.pone.0060849.t001
Figure 1. Inter-annual variations of temperature (a) and precipitation (b) anomalies averaged across China (relative to thereference averages from 1961 to 1990, projected by the PRECIS under SRES A2, B2, and A1B scenarios).doi:10.1371/journal.pone.0060849.g001
Responses of Ecosystem to Climate Change in China
PLOS ONE | www.plosone.org 3 April 2013 | Volume 8 | Issue 4 | e60849
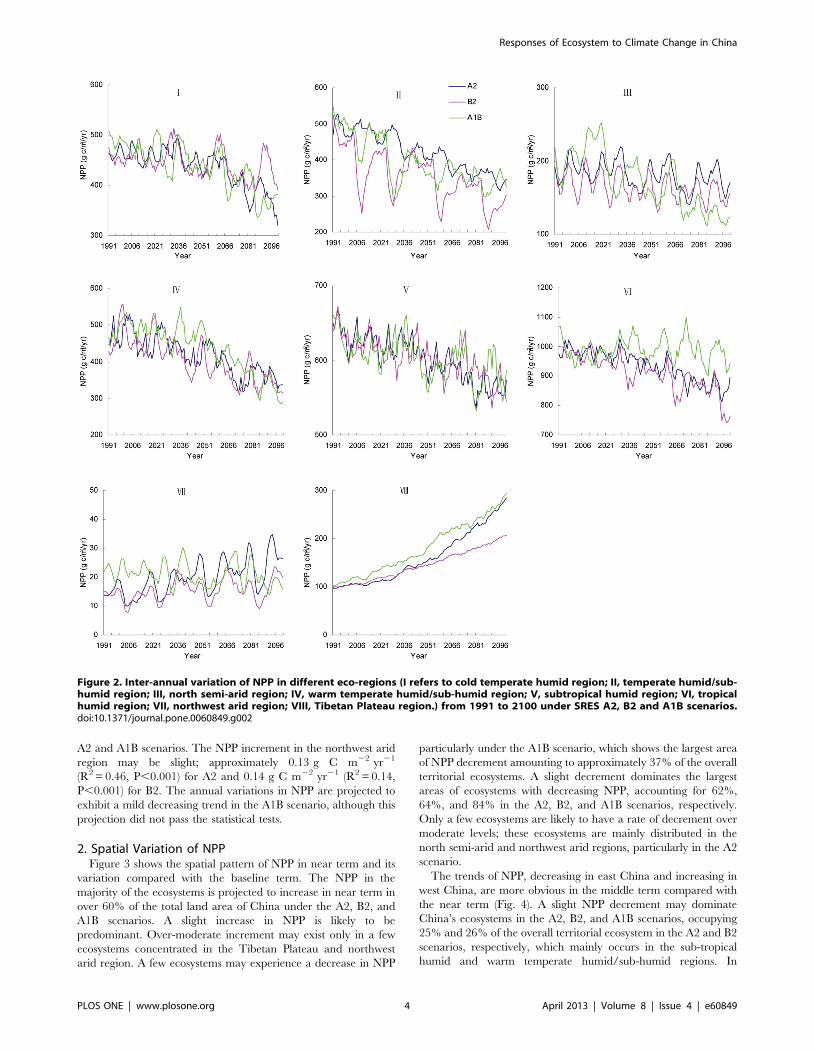
A2 and A1B scenarios. The NPP increment in the northwest arid
region may be slight; approximately 0.13 g C m22 yr21
(R2 = 0.46, P,0.001) for A2 and 0.14 g C m22 yr21 (R2 = 0.14,
P,0.001) for B2. The annual variations in NPP are projected to
exhibit a mild decreasing trend in the A1B scenario, although this
projection did not pass the statistical tests.
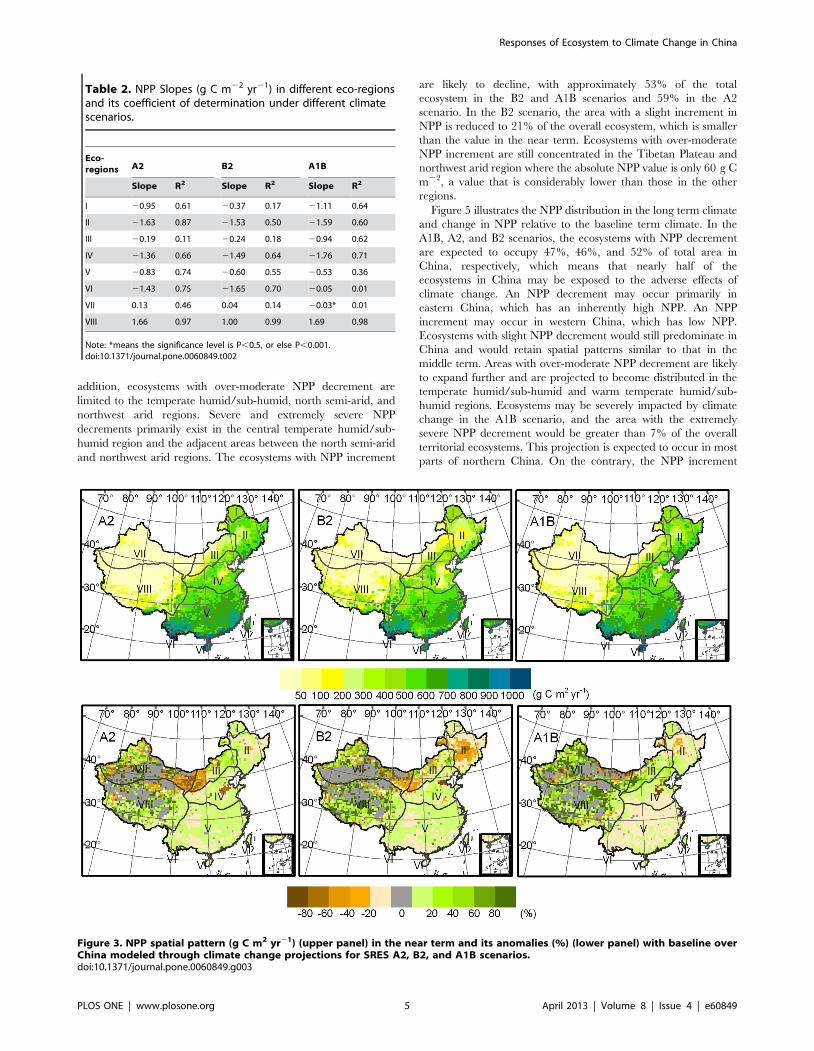
2. Spatial Variation of NPPFigure 3 shows the spatial pattern of NPP in near term and its
variation compared with the baseline term. The NPP in the
majority of the ecosystems is projected to increase in near term in
over 60% of the total land area of China under the A2, B2, and
A1B scenarios. A slight increase in NPP is likely to be
predominant. Over-moderate increment may exist only in a few
ecosystems concentrated in the Tibetan Plateau and northwest
arid region. A few ecosystems may experience a decrease in NPP
particularly under the A1B scenario, which shows the largest area
of NPP decrement amounting to approximately 37% of the overall
territorial ecosystems. A slight decrement dominates the largest
areas of ecosystems with decreasing NPP, accounting for 62%,
64%, and 84% in the A2, B2, and A1B scenarios, respectively.
Only a few ecosystems are likely to have a rate of decrement over
moderate levels; these ecosystems are mainly distributed in the
north semi-arid and northwest arid regions, particularly in the A2
scenario.
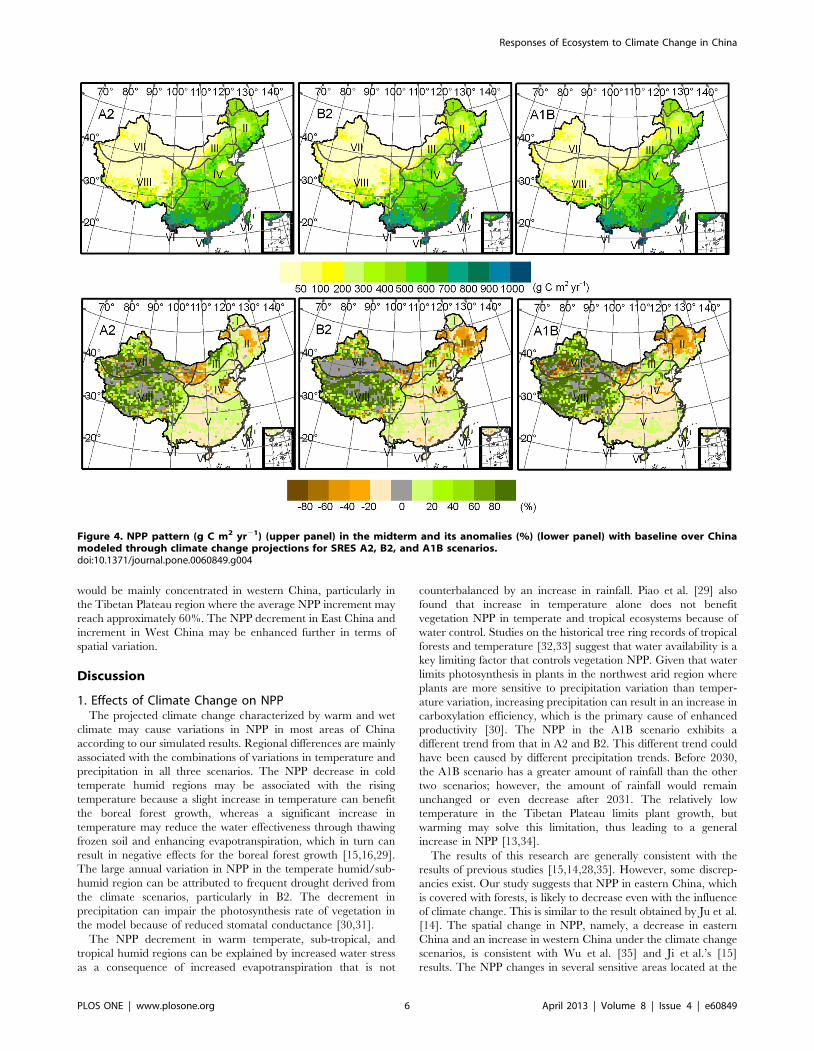
The trends of NPP, decreasing in east China and increasing in
west China, are more obvious in the middle term compared with
the near term (Fig. 4). A slight NPP decrement may dominate
China’s ecosystems in the A2, B2, and A1B scenarios, occupying
25% and 26% of the overall territorial ecosystem in the A2 and B2
scenarios, respectively, which mainly occurs in the sub-tropical
humid and warm temperate humid/sub-humid regions. In
Figure 2. Inter-annual variation of NPP in different eco-regions (I refers to cold temperate humid region; II, temperate humid/sub-humid region; III, north semi-arid region; IV, warm temperate humid/sub-humid region; V, subtropical humid region; VI, tropicalhumid region; VII, northwest arid region; VIII, Tibetan Plateau region.) from 1991 to 2100 under SRES A2, B2 and A1B scenarios.doi:10.1371/journal.pone.0060849.g002
Responses of Ecosystem to Climate Change in China
PLOS ONE | www.plosone.org 4 April 2013 | Volume 8 | Issue 4 | e60849
addition, ecosystems with over-moderate NPP decrement are
limited to the temperate humid/sub-humid, north semi-arid, and
northwest arid regions. Severe and extremely severe NPP
decrements primarily exist in the central temperate humid/sub-
humid region and the adjacent areas between the north semi-arid
and northwest arid regions. The ecosystems with NPP increment
are likely to decline, with approximately 53% of the total
ecosystem in the B2 and A1B scenarios and 59% in the A2
scenario. In the B2 scenario, the area with a slight increment in
NPP is reduced to 21% of the overall ecosystem, which is smaller
than the value in the near term. Ecosystems with over-moderate
NPP increment are still concentrated in the Tibetan Plateau and
northwest arid region where the absolute NPP value is only 60 g C
m22, a value that is considerably lower than those in the other
regions.
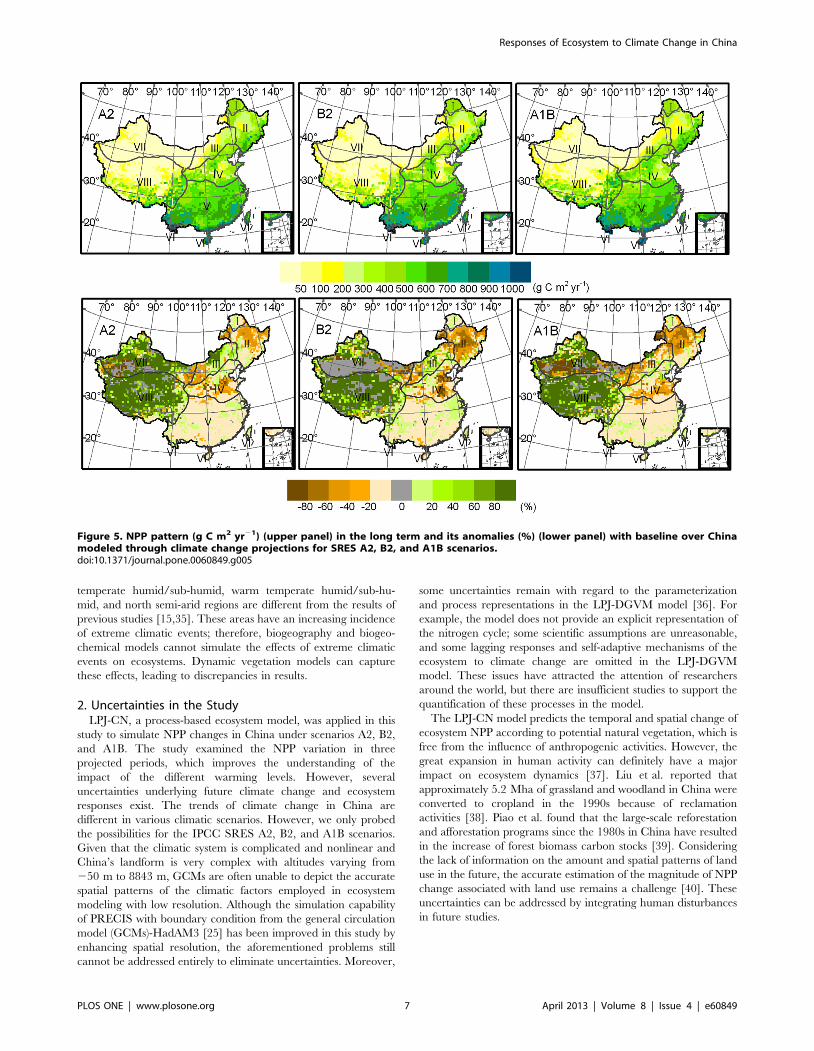
Figure 5 illustrates the NPP distribution in the long term climate
and change in NPP relative to the baseline term climate. In the
A1B, A2, and B2 scenarios, the ecosystems with NPP decrement
are expected to occupy 47%, 46%, and 52% of total area in
China, respectively, which means that nearly half of the
ecosystems in China may be exposed to the adverse effects of
climate change. An NPP decrement may occur primarily in
eastern China, which has an inherently high NPP. An NPP
increment may occur in western China, which has low NPP.
Ecosystems with slight NPP decrement would still predominate in
China and would retain spatial patterns similar to that in the
middle term. Areas with over-moderate NPP decrement are likely
to expand further and are projected to become distributed in the
temperate humid/sub-humid and warm temperate humid/sub-
humid regions. Ecosystems may be severely impacted by climate
change in the A1B scenario, and the area with the extremely
severe NPP decrement would be greater than 7% of the overall
territorial ecosystems. This projection is expected to occur in most
parts of northern China. On the contrary, the NPP increment
Table 2. NPP Slopes (g C m22 yr21) in different eco-regionsand its coefficient of determination under different climatescenarios.
Eco-regions A2 B2 A1B
Slope R2 Slope R2 Slope R2
I 20.95 0.61 20.37 0.17 21.11 0.64
II 21.63 0.87 21.53 0.50 21.59 0.60
III 20.19 0.11 20.24 0.18 20.94 0.62
IV 21.36 0.66 21.49 0.64 21.76 0.71
V 20.83 0.74 20.60 0.55 20.53 0.36
VI 21.43 0.75 21.65 0.70 20.05 0.01
VII 0.13 0.46 0.04 0.14 20.03* 0.01
VIII 1.66 0.97 1.00 0.99 1.69 0.98
Note: *means the significance level is P,0.5, or else P,0.001.doi:10.1371/journal.pone.0060849.t002
Figure 3. NPP spatial pattern (g C m2 yr21) (upper panel) in the near term and its anomalies (%) (lower panel) with baseline overChina modeled through climate change projections for SRES A2, B2, and A1B scenarios.doi:10.1371/journal.pone.0060849.g003
Responses of Ecosystem to Climate Change in China
PLOS ONE | www.plosone.org 5 April 2013 | Volume 8 | Issue 4 | e60849
would be mainly concentrated in western China, particularly in
the Tibetan Plateau region where the average NPP increment may
reach approximately 60%. The NPP decrement in East China and
increment in West China may be enhanced further in terms of
spatial variation.
Discussion
1. Effects of Climate Change on NPPThe projected climate change characterized by warm and wet
climate may cause variations in NPP in most areas of China
according to our simulated results. Regional differences are mainly
associated with the combinations of variations in temperature and
precipitation in all three scenarios. The NPP decrease in cold
temperate humid regions may be associated with the rising
temperature because a slight increase in temperature can benefit
the boreal forest growth, whereas a significant increase in
temperature may reduce the water effectiveness through thawing
frozen soil and enhancing evapotranspiration, which in turn can
result in negative effects for the boreal forest growth [15,16,29].
The large annual variation in NPP in the temperate humid/sub-
humid region can be attributed to frequent drought derived from
the climate scenarios, particularly in B2. The decrement in
precipitation can impair the photosynthesis rate of vegetation in
the model because of reduced stomatal conductance [30,31].
The NPP decrement in warm temperate, sub-tropical, and
tropical humid regions can be explained by increased water stress
as a consequence of increased evapotranspiration that is not
counterbalanced by an increase in rainfall. Piao et al. [29] also
found that increase in temperature alone does not benefit
vegetation NPP in temperate and tropical ecosystems because of
water control. Studies on the historical tree ring records of tropical
forests and temperature [32,33] suggest that water availability is a
key limiting factor that controls vegetation NPP. Given that water
limits photosynthesis in plants in the northwest arid region where
plants are more sensitive to precipitation variation than temper-
ature variation, increasing precipitation can result in an increase in
carboxylation efficiency, which is the primary cause of enhanced
productivity [30]. The NPP in the A1B scenario exhibits a
different trend from that in A2 and B2. This different trend could
have been caused by different precipitation trends. Before 2030,
the A1B scenario has a greater amount of rainfall than the other
two scenarios; however, the amount of rainfall would remain
unchanged or even decrease after 2031. The relatively low
temperature in the Tibetan Plateau limits plant growth, but
warming may solve this limitation, thus leading to a general
increase in NPP [13,34].
The results of this research are generally consistent with the
results of previous studies [15,14,28,35]. However, some discrep-
ancies exist. Our study suggests that NPP in eastern China, which
is covered with forests, is likely to decrease even with the influence
of climate change. This is similar to the result obtained by Ju et al.
[14]. The spatial change in NPP, namely, a decrease in eastern
China and an increase in western China under the climate change
scenarios, is consistent with Wu et al. [35] and Ji et al.’s [15]
results. The NPP changes in several sensitive areas located at the
Figure 4. NPP pattern (g C m2 yr21) (upper panel) in the midterm and its anomalies (%) (lower panel) with baseline over Chinamodeled through climate change projections for SRES A2, B2, and A1B scenarios.doi:10.1371/journal.pone.0060849.g004
Responses of Ecosystem to Climate Change in China
PLOS ONE | www.plosone.org 6 April 2013 | Volume 8 | Issue 4 | e60849
temperate humid/sub-humid, warm temperate humid/sub-hu-
mid, and north semi-arid regions are different from the results of
previous studies [15,35]. These areas have an increasing incidence
of extreme climatic events; therefore, biogeography and biogeo-
chemical models cannot simulate the effects of extreme climatic
events on ecosystems. Dynamic vegetation models can capture
these effects, leading to discrepancies in results.
2. Uncertainties in the StudyLPJ-CN, a process-based ecosystem model, was applied in this
study to simulate NPP changes in China under scenarios A2, B2,
and A1B. The study examined the NPP variation in three
projected periods, which improves the understanding of the
impact of the different warming levels. However, several
uncertainties underlying future climate change and ecosystem
responses exist. The trends of climate change in China are
different in various climatic scenarios. However, we only probed
the possibilities for the IPCC SRES A2, B2, and A1B scenarios.
Given that the climatic system is complicated and nonlinear and
China’s landform is very complex with altitudes varying from
250 m to 8843 m, GCMs are often unable to depict the accurate
spatial patterns of the climatic factors employed in ecosystem
modeling with low resolution. Although the simulation capability
of PRECIS with boundary condition from the general circulation
model (GCMs)-HadAM3 [25] has been improved in this study by
enhancing spatial resolution, the aforementioned problems still
cannot be addressed entirely to eliminate uncertainties. Moreover,
some uncertainties remain with regard to the parameterization
and process representations in the LPJ-DGVM model [36]. For
example, the model does not provide an explicit representation of
the nitrogen cycle; some scientific assumptions are unreasonable,
and some lagging responses and self-adaptive mechanisms of the
ecosystem to climate change are omitted in the LPJ-DGVM
model. These issues have attracted the attention of researchers
around the world, but there are insufficient studies to support the
quantification of these processes in the model.
The LPJ-CN model predicts the temporal and spatial change of
ecosystem NPP according to potential natural vegetation, which is
free from the influence of anthropogenic activities. However, the
great expansion in human activity can definitely have a major
impact on ecosystem dynamics [37]. Liu et al. reported that
approximately 5.2 Mha of grassland and woodland in China were
converted to cropland in the 1990s because of reclamation
activities [38]. Piao et al. found that the large-scale reforestation
and afforestation programs since the 1980s in China have resulted
in the increase of forest biomass carbon stocks [39]. Considering
the lack of information on the amount and spatial patterns of land
use in the future, the accurate estimation of the magnitude of NPP
change associated with land use remains a challenge [40]. These
uncertainties can be addressed by integrating human disturbances
in future studies.
Figure 5. NPP pattern (g C m2 yr21) (upper panel) in the long term and its anomalies (%) (lower panel) with baseline over Chinamodeled through climate change projections for SRES A2, B2, and A1B scenarios.doi:10.1371/journal.pone.0060849.g005
Responses of Ecosystem to Climate Change in China
PLOS ONE | www.plosone.org 7 April 2013 | Volume 8 | Issue 4 | e60849
ConclusionsWe utilized a dynamic vegetation model, LPJ-CN, to simulate
the temporal and spatial responses of ecosystem NPP to climate
change in 21st century China under A2, B2, and A1B scenarios.
Our results indicate that rising temperature and slightly changing
precipitation would lead to a serious impact on the natural
ecosystem’s NPP in general. The near-term, mid-term, and long-
term impact of climate change may become worse gradually. In
the near term, the impact of climate change on the ecosystem may
be minimal; more than half of the ecosystems may benefit from the
change. However, an adverse impact may occur in the middle
term. In the long term, more than half of ecosystems may be
exposed to adverse effects. NPP enhancement may appear mainly
in the Tibetan Plateau and northwest arid region. The other eco-
regions may be dominated by NPP increase. Although NPP may
increase by a relatively high percentage in the Tibetan Plateau and
northwest arid region, it cannot generate a significant influence on
the overall NPP distribution in China because of its low initial
productivity level. Therefore, the spatial distribution of NPP,
which decreases from the southeast coast to the northwest inland,
would not be altered under the climate change scenarios. The
response of China’s terrestrial ecosystems to climate change will
contribute to our understanding of the vulnerability and adapt-
ability of ecosystems to climate change in a regional scale. The
result obtained in this study can provide a basis for environmental
policy making.
Acknowledgments
We thank Prof. Yinlong Xu from Institute of Environment and Sustainable
Development in Agriculture, Chinese Academy of Agriculture Sciences, for
providing climate scenarios data.
Author Contributions
Conceived and designed the experiments: SW. Performed the experiments:
DZ. Analyzed the data: DZ. Wrote the paper: DZ YY.
References
1. Heimann M, Reichstein M (2008) Terrestrial ecosystem carbon dynamics and
climate feedbacks. Nature 451, 289–292.
2. IPCC (2007) Summary for Policymakers. In: Climate Change 2007: Impacts,
Adaptation and Vulnerability. Contribution of Working Group II to the Fourth
Assessment Report of the Intergovernmental Panel on Climate Change, M.L.
Parry, O.F. Canziani, J.P. Palutikof, P.J. Van der Linden and C.E. Hanson,
editors, Cambridge, Cambridge University Press.
3. Ding YH, Johnny CLC (2005) The East Asian summer monsoon: an overview.
Meteorol Atmos Phys 89, 117–142.
4. Taskforce on China’s National Assessment Report on Climate Change (2007)
China’s National Assessment Report on Climate Change. Science Press: Beijing.
5. Valentini R, Matteucci G, Dolman AJ, Schulze ED, Rebmann C, et al. (2000)
Respiration as the main determinant of carbon balance in European forests.
Nature 404: 861–865.
6. Tian H, Melillo JM, Kicklighter DW, Pan S, Liu J, et al. (2003) Regional carbon
dynamics in monsoon Asia and its implications for the global carbon cycle.
Global Planet Change 37: 201–207.
7. Koca D, Smith B, Sykes MT (2006) Modeling regional climate change effects on
potential natural ecosystems in Sweden. Climatic Change 78: 381–401.
8. Morales P, Hick T, Rowell DP, Smith B, Sykes MT (2007) Changes in European
ecosystem productivity and carbon balance driven by regional climate model
output. Global Change Biol 13: 108–122.
9. Doherty RM, Sitch S, Smith B, Lewis SL, Thornton PK (2010) Implication of
future climate and atmospheric CO2 content for regional biogeochemistry,
biogeography and ecosystem services across East Africa, Global Change Biol 16:
617–640.
10. Odum EP (1959) Fundamentals of ecology. Philadelphia: W.B. Saunders Co.
11. Lieth H, Whittaker RH (1975) Primary Productivity of the biosphere. New York:
Springer-Verlag Press.
12. Nemani RR, Keeling CD, Hashimoto H (2003) Climate-driven increases in
global terrestrial net primary production from 1982–1999. Science 300: 1560–
1563.
13. Ni J (2000) A simulation of biomes on the Tibetan Plateau and their responses to
global climate change. Mt Res Dev 20: 80–89.
14. Ju WM, Chen JM, Harvey D, Wang S (2007) Future carbon balance of China’s
forests under climate change and increasing CO2. J Environ Manage 85: 538–
562.
15. Ji JJ, Huang M, Li KR (2009) Prediction of carbon exchanges between China
terrestrial ecosystem and atmosphere in 21st century. Sci China Ser D 51(6):
885–898.
16. Cramer W, Bondeau A, Woodward FI, Prentice IC, Betts RA, et al. (2001)
Global response of terrestrial ecosystem structure and function to CO2 and
climate change: Results from six dynamic global vegetation models. Global
Change Biol 7: 357–373.
17. Bachelet D, Neilson RP, Hickler T, Drapek RJ, Lenihan JM, et al. (2003)
Simulating past and future dynamics of natural ecosystems in the United States.
Global Biogeochem Cy 17(2), 1045, doi:10.1029/2001GB001508.
18. McGregor JL (1997) Regional climate modeling. Meteorol Atmos Phys 63: 105–
117.
19. Sitch S, Smith B, Prentice IC. Arneth A, Bondeau A, et al. (2003) Evaluation of
ecosystem dynamics, plant geography and terrestrial carbon cycling in the LPJ
dynamic global vegetation model. Global Vegetation Model. Global Change
Biol 9: 161–185.
20. Gerten D, Schaphoff S, Haberlandt U, Lucht W, Sitch S (2004) Terrestrialvegetation and water balance-Hydrological evaluation of a dynamic global
vegetation model. J Hydrol 286: 249–270.21. Zhao DS, Wu SH, Yin YH (2011) Variation trends of natural vegetation net
primary productivity in China under climate change scenario. Chinese J Appl
Ecol 22(4): 897–904.22. Ni J (2003) Net primary productivity in forests of China: scaling-up of national
inventory data and comparison with model predictions. Forest Eco Manag 176:485–495.
23. Zheng D (1996) The system of physico-geographical regions of the Qinghai-
Xizang (Tibet) Plateau. Sci China Ser D 39: 410–417.24. Nakicenovic etal (2000) Special Report on Emissions Scenarios (SRES).
Cambridge: Cambridge University Press.25. Jones R, Noguer M, Hassell D, Hudson D, Wilson S, et al. (2004) Generating
high resolution climate change scenarios using PRECIS. Met Office HadleyCentre, Exeter UK.
26. Xu YL, Jones R (2004) Validating PRECIS with ECMWF reanalysis data over
China. Chinese J Agrometeorol 25(1): 5–9.27. Zhang SH, Peng GB, Huang M (2004) The feature extraction and data fusion of
regional soil textures based on GIS techniques. Clim Environ Res 6: 65–79.28. Ni J, Sykes MT, Prentice IC, Cramer W (2001) Modeling the vegetation of
China using the process-based equilibrium terrestrial biosphere model BIOME3.
Global Ecol Biogeogr 9: 463–479.29. Piao SL, Ciais P, Friedlingstein P, de Noblet-Duconudre N, Cadule P, et al.
(2009) Spatiotemporal patterns of terrestrial carbon cycle during the 20th
century. Global Biogeochem Cy 23, GB4026, doi:10.1029/2008GB003339.
30. Hou YY, Liu QH, Yan H, Tian GL (2007) Variation trend of China terrestrial
vegetation net primary productivity and its responses to climate factors in 1982–2000. Chinese J Appl Ecol 18(7): 1546–1553.
31. Yang YH, Fang JY, Ma WH, Guo DL, Mohammat A (2010) Large-scale patternof biomass partitioning across China’s grassland. Global Ecol Biogeogr 19: 268–
277.32. Clark DA, Piper SC, Keeling DC, Clark DB (2003) Tropical rain forest tree
growth and atmospheric carbon dynamics linked to interannual temperature
variation during 1984–2000. Pro Natl Acad Sci U S A 100: 5852–5857.33. Liang EY, Shao XM, Kong ZC, Lin JX (2003) The extreme drought in the
1920s and its effect on tree growth deduced from tree ring analysis: A case studyin north China. Ann Forest Sci 60: 145–152.
34. Zhao DS, Wu SH, Yin YH, Yin ZY (2011) Vegetation distribution on Tibetan
Plateau under climate change scenario. Reg Environ Change 11: 905–915.35. Wu SH, Yin YH, Zhao DS, Huang M, Shao XM, et al. (2010) Impact of future
climate change on terrestrial ecosystems in China. Int J Climatol 30: 866–873.36. Zaehle S, Sitch S, Smith B, Hatterman F (2005) Effects of parameter
uncertainties on the modeling of terrestrial biosphere dynamics. GlobalBiogeochem Cy 19, GB3020, doi:10.1029/2004GB002395.
37. Bondeau A, Smith PC, Zaehle S, Schaphoff S, Lucht W, et al. (2007) Modelling
the role of agriculture for the 20th century global terrestrial carbon balance.Global Change Biol 13: 679–706.
38. Liu JY, Liu ML, Tian HQ, Zhuang DF, Zhang ZX, et al. (2005) Spatial andtemporal patterns of China’s cropland during 1990–2000: An analysis based on
Landsat TM data. Remote Sens Environ 98: 442–456.
39. Piao SL, Fang JY, Ciais P, Peylin P, Huang Y, et al. (2009) The Carbon balanceof terrestrial ecosystems in China. Nature 458: 1009–1013.
40. Houghton RA (2007) Balancing the global carbon budget. Ann Rev Earth Pl Sc35: 313–347.
Responses of Ecosystem to Climate Change in China
PLOS ONE | www.plosone.org 8 April 2013 | Volume 8 | Issue 4 | e60849