Embed Size (px)
Citation preview

Responding to Loss of Farmland:
The Role of Social Capital
TRAN Quang Tuyen(Lecturer, University of Economics and Business, Vietnam National University)
Steven LIMSenior Lecturer, Economics Department, University of Waikato, New Zealand
Visiting Professor, School of Economics, Senshu University
Michael P. CAMERON(Senior Lecturer, Economics Department, University of Waikato, New Zealand)
The Senshu Social Capital Review No.4 (2013)
)(

25
IntroductionVietnam has a total area of around 33 million hectares and a population of 86 million. With lessthan 0.3 hectares of land per capita, Vietnam has one of the lowest land endowments per personin the world (WB, 2011b). Nevertheless, the combination of fertile land, favourable weatherconditions and abundant labour enables the country to maintain national food security and stillexport a number of crucial agricultural products such as rice, rubber, cashew, coffee and pepper.As a result, in Vietnam's rural areas which have three-quarters of the total population and mostof the poor, agricultural production is the main livelihood for more than half of the totalworkforce (WB, 2011b).
The conversion of agricultural land to non-agricultural uses is a common way to providethe space for urbanization and industrialization and is, therefore, an almost unavoidable tendencyin economic development and population growth (Tan, Beckmann, Van Den Berg, & Qu, 2009).In Vietnam over the past two decades, escalated industrialization and urbanization haveencroached on a huge area of agricultural land. Despite this, there are no accurate statistical dataon the total area of land, especially the area of farmland, that has been acquired by the Statesince the early 1990s (V. S. Nguyen, 2009a). Le (2007) calculated that, from 1990 to 2003,697,417 hectares of land were taken for the construction of industrial zones, urban areas andinfrastructure and other national use purposes. In period 2000-2007, about half a million hectaresof farmland were converted for nonfarm use, accounting for 5 percent of the country's farmland(VietNamNet/TN, 2009).
Vietnamese rural labourers are mainly unskilled and low skilled and their single valuable
Responding to Loss of Farmland: The Role of Social Capital
TRAN Quang Tuyen†
Steven LIM*
Michael P. CAMERON)
† Lecturer, University of Economics and Business, Vietnam National University* Senior Lecturer, Economics Department, University of Waikato, New Zealand; Visiting Professor, Schoolof Economics, Senshu University ) Senior Lecturer, Economics Department, University of Waikato, New Zealand
The Senshu Social Capital Review No.4 (2013)
26
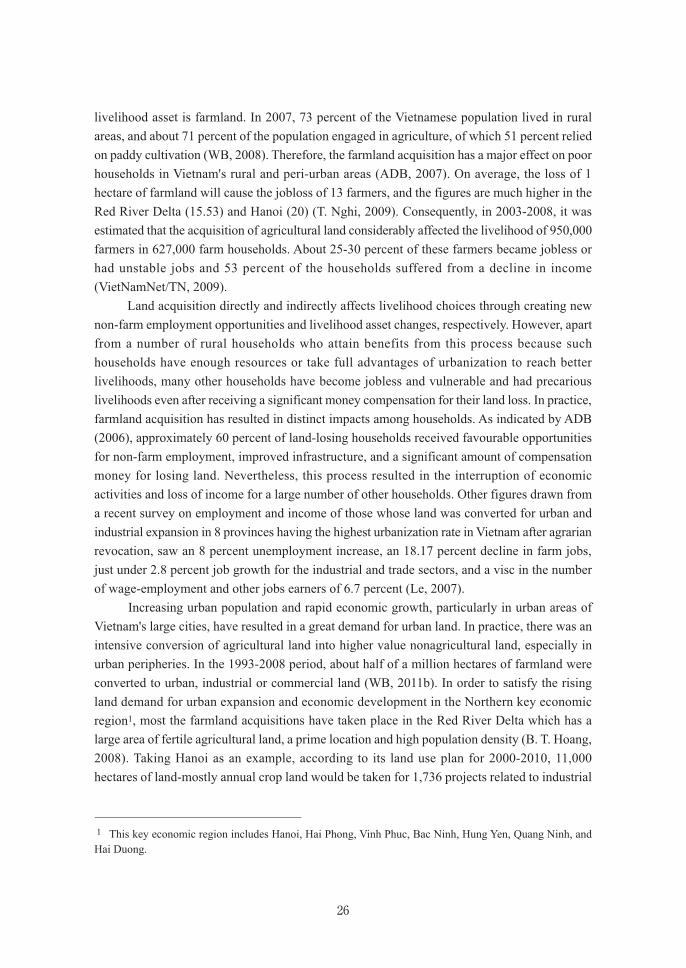
livelihood asset is farmland. In 2007, 73 percent of the Vietnamese population lived in ruralareas, and about 71 percent of the population engaged in agriculture, of which 51 percent reliedon paddy cultivation (WB, 2008). Therefore, the farmland acquisition has a major effect on poorhouseholds in Vietnam's rural and peri-urban areas (ADB, 2007). On average, the loss of 1hectare of farmland will cause the jobloss of 13 farmers, and the figures are much higher in theRed River Delta (15.53) and Hanoi (20) (T. Nghi, 2009). Consequently, in 2003-2008, it wasestimated that the acquisition of agricultural land considerably affected the livelihood of 950,000farmers in 627,000 farm households. About 25-30 percent of these farmers became jobless orhad unstable jobs and 53 percent of the households suffered from a decline in income(VietNamNet/TN, 2009).
Land acquisition directly and indirectly affects livelihood choices through creating newnon-farm employment opportunities and livelihood asset changes, respectively. However, apartfrom a number of rural households who attain benefits from this process because suchhouseholds have enough resources or take full advantages of urbanization to reach betterlivelihoods, many other households have become jobless and vulnerable and had precariouslivelihoods even after receiving a significant money compensation for their land loss. In practice,farmland acquisition has resulted in distinct impacts among households. As indicated by ADB(2006), approximately 60 percent of land-losing households received favourable opportunitiesfor non-farm employment, improved infrastructure, and a significant amount of compensationmoney for losing land. Nevertheless, this process resulted in the interruption of economicactivities and loss of income for a large number of other households. Other figures drawn froma recent survey on employment and income of those whose land was converted for urban andindustrial expansion in 8 provinces having the highest urbanization rate in Vietnam after agrarianrevocation, saw an 8 percent unemployment increase, an 18.17 percent decline in farm jobs,just under 2.8 percent job growth for the industrial and trade sectors, and a visc in the numberof wage-employment and other jobs earners of 6.7 percent (Le, 2007).
Increasing urban population and rapid economic growth, particularly in urban areas ofVietnam's large cities, have resulted in a great demand for urban land. In practice, there was anintensive conversion of agricultural land into higher value nonagricultural land, especially inurban peripheries. In the 1993-2008 period, about half of a million hectares of farmland wereconverted to urban, industrial or commercial land (WB, 2011b). In order to satisfy the risingland demand for urban expansion and economic development in the Northern key economicregion1, most the farmland acquisitions have taken place in the Red River Delta which has alarge area of fertile agricultural land, a prime location and high population density (B. T. Hoang,2008). Taking Hanoi as an example, according to its land use plan for 2000-2010, 11,000hectares of land-mostly annual crop land would be taken for 1,736 projects related to industrial
1 This key economic region includes Hanoi, Hai Phong, Vinh Phuc, Bac Ninh, Hung Yen, Quang Ninh, andHai Duong.

27
The Senshu Social Capital Review No.4 (2013)
and urban development. (V. S. Nguyen, 2009a). Consequently, the encroachment of farmlandat such a large scale has raised special concerns about rural household livelihoods. This farmlandconversion would cause the loss of agricultural jobs of 150,000 farmers (V. S. Nguyen, 2009a).Moreover, thousands of households have been anxious about a new plan of massive farmlandacquisition for the expansion of Hanoi to both banks of the Red River by 2020. This plan willinduce about 12,000 households to relocate and nearly 6,700 farms to be removed (Hoang,2009).
In the setting of accelerating conversion of farmland for urbanization and industrializationin the urban fringes of large cities, a number of studies in Vietnam have addressed the questionof how farmland loss has affected rural household livelihoods. The studies have mostly usedeither qualitative or descriptive statistics methods (Do, 2006; Le, 2007; T. D. Nguyen, Vu, &Lebailly, 2011; V. S. Nguyen, 2009b). In general, almost all of these studies indicate that whilethe loss of agricultural land causes the loss of traditional agricultural livelihoods and threatensfood security, it can also bring about a wide range of new opportunities for households todiversify their livelihoods and sources of well-being.
Similar impacts of farmland loss are not confined to just Vietnam. Negative have beenfound elsewhere, for example in China (J. Chen, 2007; Deng, Huang, Rozelle, & Uchida, 2006;Xie, Mei, Guangjin, & Xuerong, 2005) and in India (Fazal, 2000, 2001). Nevertheless, otherstudies show positive impacts of farmland loss on rural livelihoods in China (W. Chen, 1998;Gale Johnson, 2002; Parish, Zhe, & Li, 1995) and Bangladesh (Toufique & Turton, 2002). Inthis literature for Vietnam and other countries, although much has been discussed about themixed impacts of farmland loss on rural household livelihoods, no econometric evidence ofthese impacts has been provided thus far. Our study, therefore, is an early attempt to apply aneconometric approach to answer two key research questions: how has farmland loss affectedhouseholds' livelihood strategies in Vietnam, and what is the role of social capital in assistinghouseholds to cope with the farmland loss? Our study focuses on Hanoi’s peri-urban areas,which have been experiencing a massive farmland conversion for urbanization andindustrialization in recent years.
Compulsory land acquisitionFollowing periods of slow economic growth, decrease in food production, and the risk of famineas a consequence of having pursued a collective agriculture system, Vietnam has made a numberof reforms since 1986 to change itself from a centrally planned to a marketed oriented economy.The reform (Đổi Mới) not only dissolved collective farms but also granted land use rights tofarm households (Kirk & Nguyen, 2009). The first Land Law of 1987 recognized the land userights of households and individuals. Since the second Land Law was promulgated in 1993farmers' long-term and stable use of agricultural land has been secured (T. T. Nguyen, 2012).By 1999, more than 10 million households had been granted land use certificates of agriculturalland, accounting for 87 percent of agricultural households and 78 percent of agricultural land inVietnam (ANZDEC Limited, 2000).

28
Similar to the second Land Law of 1993, the third Land Law of 2003 (the current LandLaw of Vietnam) continues to confirm that land is not privately owned because it is the collectiveproperty of the entire people, which is representatively owned and administrated by the Stateand the land use rights are to be granted to individuals, households, enterprises and otherorganizations. Such rights include the rights to exchange, transfer, inherit, lease, mortgage landand use land as a capital contribution (National Assembly of Vietnam, 2003). It should be notedthat land acquisition is the only way to take land for projects in Vietnam (Thien Thu & Perera,2011). Prior to the Land Law of 2003, the compulsory acquisition of land by the State is theonly way to take land for projects. However, the Land Law of 2003 proposed a new way forland acquisition, which is the voluntary land conversion based on a voluntary agreement betweenproject investors and land users (WB, 2011a)2.
Compulsory land acquisition is applied to cases in which land acquisition projects areserved for national or public projects, for projects with 100 percent contributed by foreign funds(including foreign direct investment and Official Development Assistance), for theimplementation of projects with special economic investment such as building infrastructurefor industrial and services zones, hi-tech parks, urban and residential areas and projects in thehighest investment fund group (WB, 2011a). Voluntary land conversion is to be used in casesof land acquisition for investment projects of domestic investors that are not subject tocompulsory land conversion; or where the compulsory acquisition of land can be carried outbut the investors volunteer to acquire land for their projects through a mutual agreement betweenthe investors and land users (WB, 2011a).
According to the current Land Law, for land-users whose land is compulsorily acquired,a general principle is to provide adequate assistance for them and thereby they can find newjobs, recover their livelihoods and be compensated for income loss. In practice, the greatestproblem is the lack of opportunities for farmers to transfer job and recover livelihoods. This isbecause farmers might not meet necessary qualifications for non-agricultural jobs, while thelocal government and the investor may not be active in searching for a practical solution to thisissue (WB, 2011a). According to the Decree 17/2006/ND-CP by The Government of Vietnam,in the acquisition of agricultural land from farmers, farmers must be compensated with othertypes of cultivable land, and cash compensation is the last option. In the case of having no morecultivable land for compensation, the provincial authority can compensate farmers with a plotof land for doing services, which provide farm households with conditions to change theirlivelihoods. If cash compensation is the only choice, the provincial government must havespecific planned solutions for job assistance to farmers (General Department of Taxation, 2006).In some localities, the provincial authority has compensated farmers who lose more than 30percent of their farmland with a plot of commercial land close to industrial zones or residential
2 Land conversion means a process through which land (farmland, urban or residential land, etc) is acquiredcompulsorily or voluntarily from land users (households, individuals or organizations) for projects.

29
The Senshu Social Capital Review No.4 (2013)
land in urban areas. This compensation with "land for land" has been successfully implementedin some localities, while others do not believe in the appropriateness of this policy because moreagricultural land needs to be converted to nonagricultural land (WB, 2011a).
When land is acquired compulsorily for a project, farmers will receive direct compensationfrom investors (compensation for the loss of land, crops and assets attached to the area ofacquired land, and job transfer, etc). Besides, some additional assistance is also provided by thecity/provincial government such as job transition training courses, agricultural extension andnew job introduction services (Q. V. Nguyen, Nguyen, Nguyen, Pham, & Nguyen, 2005).Subject to Decree 197/2004/ND-CP dated on 03/12/2004, compensation for land-losing peoplewill be based on land area, and land category (residential, nonagricultural, agricultural land)being used by the land users. As indicated in this Decree, the land prices applied to thecompensation will be decided by the Province's People Committee at the time of making thedecision on land acquisition (The Government of Vietnam, 2004). In fact, however, there existsa large gap between the compensation level defined by the government guidelines and thatdetermined by market principles (Han & Vu, 2008). Such compensation is unsatisfactory tomany farmers because the compensation price is often much lower than the real value of land,leading to a boom in complaints about land acquisition in Vietnam (Thien Thu & Perera, 2011).This topic, however, is beyond the scope of this study.
In this paper, the term "land loss" also means farmland loss, and households whosefarmland was lost partly or totally by the State's the farmland acquisition are called land-losinghouseholds. Households whose farmland was not taken by this policy are called householdswithout land loss or non-land-losing households.
Background of the case study areaOur research was conducted in Hoai Duc, a peri-urban district of Hanoi (see Figures A1 and 2and 3 in the Appendix). Before 1 August 2008, Hoai Duc was a district of Ha Tay Province, aneigbouring province of Hanoi Capital, which was merged into Hanoi on 1 August, 2008. Thedistrict occupies 8,247 hectares of land, of which agricultural land accounts for 4,272 hectaresand 91 percent of this area is used by households and individuals (Hoai Duc District People'sCommittee, 2010a). There are 20 administrative units in the district, including 19 communesand 1 town. Hoai Duc has around 50,400 households with a population of 193,600 people. Inthe whole district, the employment in the agricultural sector dropped by around 23 percent overthe past decade. Nevertheless, a significant proportion of employment has remained inagriculture, accounting for around 40 percent of the total employment in 2009. Thecorresponding figures for industrial and services sectors are 33 and 27 percent respectively(Statistics Department of Hoai Duc District, 2010). Prior to 1 August 2008, Hoai Duc used tobe the richest district in Ha Tay Province (MONRE, 2007). In 2009, Hoai Duc GDP per capitareached 15 million VND per year (Hoai Duc District People's Committee, 2010b), which is lessthan half of Hanoi’s average (32 million VND per year) (Vietnam Government Web Portal,

30
2010)3.Among the districts of Hanoi, Hoai Duc has the biggest number of land-acquisition
projects and has been experiencing a massive conversion of farmland for nonfarm uses (HuuHoa, 2011). Hoai Duc is located on the northwest side of Hanoi, 19 km from the CentralBusiness District (WB, 2011c). The district has an extremely favourable geographical position,surrounded by various important roads namely Thang Long highway (the country’s biggest andmost modern highway), National Way 32, and is in close proximity to industrial zones, newurban areas and Bao Son Paradise Park (the biggest entertainment and tourism complex in NorthVietnam). Consequently, a huge area of agricultural land in the district has been taken for theabove projects in recent years. In the period 2006-2010, around 1,560 hectares of farmland wereacquired for 85 projects (LH, 2010).
According to Decision 289/2006-QĐ-UBNH issued by Ha Tay Province People'sCommittee, apart from the compensation for the area of lost land due to the State's landacquisition, households would receive other payments. These include support for relocation,job generation, support for those whose lost land adjacent to Hanoi City, and other support (HaTay Province People's Committee, 2006). In general, the compensation for 1 Sào (360 m2) ofagricultural land in Ha Tay was about 45,700,000 VND in 2008 (Truong Giang, 2008) 4. Inaddition, households receive payments for the existing property attached to land and for expensesinvested in the area of lost land (Ha Tay Province People's Committee, 2008a).
Also, Ha Tay Province People’s Committee issued the Decision 1098/2007/QĐ-UB andDecision 371/2008/QĐ-UB, which states that a plot of commercial land or "land for services"would be granted to households with more than 30 percent of agricultural land recovered. Eachhousehold receives an area of “land for services” equivalent to 10 percent of the area of farmlandthat is taken for each project (Hop Nhan, 2008). Thanks to this compensation with "land forland", land-losing households would have not only an extremely valuable asset 5 but also apotential source of livelihood, particularly for elderly land-losing farmers. This is because "landfor services" can be used as business premises for non-farm activities such as opening a shop,a workshop, or for renting, etc.
Data collectionWe adapted from GSO (2006), De Silva, et al (2006), and Doan (2011) a household questionnaireto gather a set of quantitative data on livelihood assets (human, social, financial, physical and
3 1 USD equals about 19,000 VND in 2009.4 1 USD equaled about 18,000 VND in 2008.5 The prices of "land for services" in some communes of Hoai Duc District were offered from 17,000,000 to35,000,000 VND per m2 in 2011, depending on the location of the commercial land plot (Minh Tuan, 2011)(1USD equaled about 20,000 VND in 2011). Note that farmers have already received the certificates whichconfirm that "land for services" will be granted to them but they have not received "land for service" in fact.However, these certificates have been widely purchased (Thuy Duong, 2011).

31
The Senshu Social Capital Review No.4 (2013)
natural capitals), economic activities (time allocation data), and livelihood outcomes (incomeand consumption expenditure). The target sample size was set at 480 households from 6communes, consisting of 80 households (40 with land loss and 40 without land loss) from eachcommune. Therefore, 600 households were selected, including 120 reserves. A disproportionatestratified sampling method was used with two steps as follows: First, 12 communes withfarmland acquisition were partitioned into 3 groups based on their employment structure. Thefirst group included purely agricultural communes; the second one was characterized bycommunes with a combination of both agricultural and non-agricultural production, while thethird one represented purely non-agricultural communes. From each group, two communes wererandomly chosen (using STATA software). Second, from each commune, 100 households (50with land loss and 50 without land loss) including 20 reserves (10 with land loss and 10 withoutland loss) were randomly selected using Circular Systematic Sampling (Groves, Fowler, Couper,Lepkowski, & Singer, 2009).
Sixteen sociology students of Vietnam National University were carefully selected andtrained to become potential members of a fieldwork team. These students were very competentand experienced in fieldwork in Vietnam’s rural areas. After the training courses, 12 out of 16trainees were officially employed, forming a fieldwork team of 10 interviewers and 2 surveysupervisors. Two training courses (one week before and one week after the pilot survey) wereheld to provide trainees with a thorough understanding of the survey context and purposes,contents of all questions in the questionnaire, requirements and expectations of interviewers. Inaddition, the training courses provided trainees with further necessary skills for the survey andincluded practice, using the questionnaire, in interviewing actual households. A pilot test wasconducted, including a test of questionnaire design, fieldwork and data entry plans. It involvedinterviewing 30 households from six communes (five households from each commune). Foreach interviewer, at least one of their pilot interviews was performed in the presence of a surveysupervisor. Based on the results from the pilot test, some final edits were made to thequestionnaire. Useful and valuable experiences on interview practice or techniques that wereperformed well during the pilot interviews were imparted to all other interviewers. Three surveysupervisors were employed to check for mistakes and to maximize the accuracy and quality ofsurvey data and data entry (data entry was checked and any mistakes were corrected on the sameday of the interview by one of three supervisors).
The survey was carried out from the beginning of April to the end of June 2010, and thedata were collected by means of face-to-face interviewers with the head of a household in thepresence of other household members. In fact, 477 households were successfully interviewed,among which 237 households lost their farmland at different levels. Some lost little, some lostpartly, and others lost mostly or entirely. Their farmland was compulsorily acquired by the Statefor a number of projects relating to the enlargement and improvement of Thang Long highway,the construction of industrial clusters, new urban areas and other non-farm use purposes (HaTay Province People's Committee, 2008b). Due to some delays in the implementation of thefarmland acquisition, among 237 land-losing households, 124 households had farmland acquired

32
in the first half of 2008 and 113 households had farmland acquired in early 2009.
AnalysisTo identify the distinct livelihood strategies that households pursued before and after the lossof farmland, cluster analysis techniques were used to group households into distinct livelihoodcategories using SPSS software (version 17). Using labour time allocation, the survey foundsix livelihood groups:
1 . Mainly farm production (cultivation and husbandry) 2 . Unprotected wage work (working for households or individuals)3 . Nonfarm self-employment outside the village4 . Diversified livelihoods (farm production, wage work and nonfarm self-employment in the
village)5 . Nonfarm self-employment in the village 6 . Protected wage work (working for the state sector, enterprises and other organisations).
Inspection of the data reveals that farmland loss impacted significantly on the choice oflivelihood based on farm production. The number of farming households approximately halvedafter the government’s land acquisition programme. However, farmland loss was associatedwith higher urbanization, a process which also brought households opportunities for nonfarmjobs.
Thus, our first question is: what is the transmission mechanism by which an infrastructureshock (that involves land loss by farmers) alters livelihood choices in the affected area? To helpanswer this question we turn to Figure 1, below, which offers a conceptual framework foranalysing livelihood strategies:
Figure 1: From a public good to livelihood strategies and outcomes

33
The Senshu Social Capital Review No.4 (2013)
The figure focuses on household assets/capitals as the key link between the infrastructureshock (the building of a highway via farmland acquisition) and changes in people’s livelihoodstrategies and outcomes. The transmission mechanism relates to the way in which householdassets change and interact, leading to livelihood ‘doors’ that may open or close. For example,we see from the figure that the construction of the highway, a public good, has a direct impacton farmland – consequently, farm jobs may be lost. A household’s natural assets, such as land,may diminish. In the process the household might receive compensation, which increases itsfinancial assets. But it is also possible for the household’s financial assets to fall, as access tocredit decreases with the loss of land as a loan security. If financial assets fall overall, this canhave adverse implications for the household’s ability to increase its human capital. Livelihoodstrategies and outcomes (relating to income and expenditure) may be compromised.
On the other hand, the public good spurs local economic growth, whereby diversenon-farming livelihood opportunities emerge. As more people avail themselves of the newincome-earning opportunities, households’ social capital increases. Social capital (in particularthe financial and other resources that a household may receive from people within thehousehold’s network) can substitute for formal credit. Thus, alternative paths emerge for ahousehold to expand its livelihood options and, in particular, to improve its livelihood outcomes.
This brings us to our second question: What is the actual pattern of asset or capitallinkages that exists in the communities studied? Our correlation analysis in Table 2 (Appendix)indicates that the actual correlations between assets is quite low except for human capital andsocial capital (measured by the average and median schooling years of labourers and the numberof groups that households have at least one member belonging to, respectively). The correlationbetween human capital and social capital is 0.48, reflecting the fact that households with highereducation levels have more chance to participate in groups or organisations such as trade unions,alumni associations, youth unions, and so on. The social and human capital links could be anencouraging result, since social capital is also related to local economic growth. The linkbetween human capital and physical capital (measured by the log of value of productive assets)is statistically significant, but the coefficient is quite small (0.4).
As an aside, we also note that location plays an important role in predicting the choice oflivelihood strategy. Households that live near factories or town have better chance to work inthe formal sector (such as for the state or in factories). In addition, households living incommunes with traditional wage employment were likely to engage in wage work. Humancapital is of much importance to choose a livelihood based on wage employment, while it doesnot appear important in choosing other livelihood strategies.
Our last question, then, is: which of the capitals are the most important for helpingland-losing households to improve their livelihood outcomes, especially in terms of income andexpenditure? For the answer we turn to econometric analysis. We undertake two sets of empiricaltests, where income and expenditure are separately regressed against a number of explanatoryvariables. The variables include the timing of farmland loss and measures of assets or capitals.The results are given in Table 1:

34
Table 1: Livelihood outcome regressions - household income and expenditure
Note: 0 means not statistically significant. + and - mean the coefficients are statistically at 10 %or lower , with their signs are positive and negative, respectively.
Explanatory variablesIncome
( IV regression)Consumption expenditure
(IV regression)
Effects EffectsLivelihood strategy Yes YesInformal wage work +0.25 +0.33Formal wage work +0.50 +0.44Nonfarm self-employment +0.40 +0.41Farmland acquisition No YesLand loss 2009 0 +0.13Land loss 2008 0 0Human capital Yes YesHousehold size -0.16 -0.05Dependency ratio -0.17 -0.22Number of male working members +0.05 +0Gender of household head +0 +0.07Age of household head +0 +0Average schooling years of working members +0.03 +0.01Social capital Yes YesNumber of group memberships +0.023 +0.019Natural capital Yes YesOwned farmland per adult +0.035 +0.027Size of residential land +0 +0.0016Physical capital Yes YesValue of productive assets per working member in Ln +0.011 +0.10Financial capital Yes YesAccess to formal credit +0.12 +0.06Access to informal credit -0 0Commune dummies ( included) Yes Yes
Number of observations 451 451Prob > F 0.0000 0.0000Centered R2 0.5318 0.4460Uncentered R2 0.9978 0.9989
35
The Senshu Social Capital Review No.4 (2013)
The statistical results indicate that social capital is important. An additional group membershipis associated with income rises of 2.3% and expenditure rises of 1.9%. Members can generateindirect and direct economic benefits from their groups. For example, the social capital fromgroup members can make households more profitable, such as through better access to credit,inputs, and information for production. It can also contribute to a better network of customersand suppliers, thus increasing value added and sales.
In sum, household wellbeing, especially if proxied by income or expenditure, issignificantly affected by livelihood strategy. Our data from Vietnam show that nonfarm strategiesoffer higher incomes than a farm strategy. (And for nonfarm strategies themselves the incomeranking is formal wage work, followed by nonfarm self-employment, and lastly informal wagework). Livelihood strategy is the most important factor determining livelihood outcome. Thatis, household welfare can be improved by changing livelihood strategies. In turn, livelihoodstrategies can be changed by changing social capital.
ConclusionThis study provides early econometric evidence of the impact of land loss on households'livelihood strategies and outcomes. The findings of this case study of Hanoi's peri-urban areascan be seen as valuable to other localities of Vietnam as well as developing countries which aresimilar in socio-economic characteristics. In this regard our study contributes new perspectivesconcerning the relationships between farmland, social capital and rural households' livelihoods,given the context of farmland shrinking in Vietnam and other developing countries.

36
Appendix
Figure 2: Map of Hanoi, Vietnam (Thuy, 2011b)

37
The Senshu Social Capital Review No.4 (2013)
Figure 3: Administrative Map of Hoai Duc District, Hanoi (Thuy, 2011a)

38
Farm
size
in
squa
re
met
ers
Farm
size
pe
r cap
ita
Aver
age
scho
olin
g ye
ars o
f la
bour
ers
Med
ian
ofsc
hool
ing
year
s of
labo
urer
s
Scho
olin
g ye
ars o
f ho
useh
old
head
Soci
al c
apita
lm
easu
red
by
the
num
ber o
fm
embe
rshi
p
The
tota
l va
lue
of lo
an
in th
e pa
st
two
year
s
The
amou
nt
of lo
an
borr
owed
fr
om th
ein
form
al
cred
it m
arke
t
The
amou
nt
of lo
an
borr
owed
fr
om th
e fo
rmal
cre
dit
mar
ket
The
valu
e of
prod
uctiv
e as
sets
in lo
g
Farm
size
insq
uare
met
ers
Pear
son
Cor
rela
tion
1.7
83(*
*).0
51.0
51-.0
06.0
80.0
11.0
05.0
10.2
66(*
*)
Sig.
(2-ta
iled)
.000
.269
.269
.901
.083
.816
.914
.828
.000
N47
747
747
747
747
747
747
747
747
747
7
Farm
size
per
capi
taPe
arso
n C
orre
latio
n.7
83(*
*)1
-.107
(*)
-.117
(*)
-.048
-.091
(*)
-.063
-.054
-.035
.108
(*)
Sig.
(2-ta
iled)
.000
.020
.010
.293
.047
.167
.243
.448
.019
N47
747
747
747
747
747
747
747
747
747
7
Aver
age
scho
olin
gye
ars o
fla
bour
ers
Pear
son
Cor
rela
tion
.051
-.107
(*)
1.9
71(*
*).5
63(*
*).4
86(*
*).1
14(*
).0
39.1
19(*
*).4
03(*
*)
Sig.
(2-ta
iled)
.269
.020
.000
.000
.000
.013
.390
.009
.000
N47
747
747
747
747
747
747
747
747
747
7
Med
ian
ofsc
hool
ing
year
s of
labo
urer
s
Pear
son
Cor
rela
tion
.051
-.117
(*)
.971
(**)
1.5
45(*
*).4
84(*
*).1
22(*
*).0
38.1
32(*
*).3
96(*
*)
Tabl
e 2:
Cor
rela
tions
bet
wee
n liv
elih
ood
capi
tals

39
The Senshu Social Capital Review No.4 (2013)
Farm
size
in
squa
re
met
ers
Farm
size
pe
r cap
ita
Aver
age
scho
olin
g ye
ars o
f la
bour
ers
Med
ian
ofsc
hool
ing
year
s of
labo
urer
s
Scho
olin
g ye
ars o
f ho
useh
old
head
Soci
al c
apita
lm
easu
red
by
the
num
ber o
fm
embe
rshi
p
The
tota
l va
lue
of lo
an
in th
e pa
st
two
year
s
The
amou
nt
of lo
an
borr
owed
fr
om th
ein
form
al
cred
it m
arke
t
The
amou
nt
of lo
an
borr
owed
fr
om th
e fo
rmal
cre
dit
mar
ket
The
valu
e of
prod
uctiv
e as
sets
in lo
g
Sig.
(2-ta
iled)
.269
.010
.000
.000
.000
.008
.414
.004
.000
N47
747
747
747
747
747
747
747
747
747
7
Scho
olin
gye
ars o
fho
useh
old
head
Pear
son
Cor
rela
tion
-.006
-.048
.563
(**)
.545
(**)
1.2
32(*
*).0
21-.0
18.0
47.2
69(*
*)
Sig.
(2-ta
iled)
.901
.293
.000
.000
.000
.646
.693
.304
.000
N47
747
747
747
747
747
747
747
747
747
7
Soci
al c
apita
lm
easu
red
byth
e nu
mbe
r of
mem
bers
hip
Pear
son
Cor
rela
tion
.080
-.091
(*)
.486
(**)
.484
(**)
.232
(**)
1.0
26-.0
20.0
56.3
01(*
*)
Sig.
(2-ta
iled)
.083
.047
.000
.000
.000
.570
.659
.220
.000
N47
747
747
747
747
747
747
747
747
747
7
The
tota
l val
ueof
loan
in th
epa
st tw
o ye
ars
Pear
son
Cor
rela
tion
.011
-.063
.114
(*)
.122
(**)
.021
.026
1.6
93(*
*).7
00(*
*).1
33(*
*)
Sig.
(2-ta
iled)
.816
.167
.013
.008
.646
.570
.000
.000
.004
N47
747
747
747
747
747
747
747
747
747
7
The
amou
nt o
flo
an b
orro
wed
from
the
info
rmal
cre
dit
mar
ket
Pear
son
Cor
rela
tion
.005
-.054
.039
.038
-.018
-.020
.693
(**)
1-.0
29.0
87

40
Farm
size
in
squa
re
met
ers
Farm
size
pe
r cap
ita
Aver
age
scho
olin
g ye
ars o
f la
bour
ers
Med
ian
ofsc
hool
ing
year
s of
labo
urer
s
Scho
olin
g ye
ars o
f ho
useh
old
head
Soci
al c
apita
lm
easu
red
by
the
num
ber o
fm
embe
rshi
p
The
tota
l va
lue
of lo
an
in th
e pa
st
two
year
s
The
amou
nt
of lo
an
borr
owed
fr
om th
ein
form
al
cred
it m
arke
t
The
amou
nt
of lo
an
borr
owed
fr
om th
e fo
rmal
cre
dit
mar
ket
The
valu
e of
prod
uctiv
e as
sets
in lo
g
Sig.
(2-ta
iled)
.914
.243
.390
.414
.693
.659
.000
.530
.058
N47
747
747
747
747
747
747
747
747
747
7
The
amou
nt o
flo
an b
orro
wed
from
the
form
al c
redi
tm
arke
t
Pear
son
Cor
rela
tion
.010
-.035
.119
(**)
.132
(**)
.047
.056
.700
(**)
-.029
1.0
99(*
)
Sig.
(2-ta
iled)
.828
.448
.009
.004
.304
.220
.000
.530
.031
N47
747
747
747
747
747
747
747
747
747
7
The
valu
e of
prod
uctiv
e as
sets
in lo
g
Pear
son
Cor
rela
tion
.266
(**)
.108
(*)
.403
(**)
.396
(**)
.269
(**)
.301
(**)
.133
(**)
.087
.099
(*)
1
Sig.
(2-ta
iled)
.000
.019
.000
.000
.000
.000
.004
.058
.031
N47
747
747
747
747
747
747
747
747
747
7
** C
orre
latio
n is
sign
ifica
nt a
t the
0.0
1 le
vel (
2-ta
iled)
.*
Cor
rela
tion
is si
gnifi
cant
at t
he 0
.05
leve
l (2-
taile
d).
41
The Senshu Social Capital Review No.4 (2013)
ReferencesADB. (2006). The Industrial and Commercial Land Market Processes and Their Impacts on the Poor. Retrieved
25 October, 2009, from http://www.markets4poor.org/index.php?name=publication&op=view
DetailNews&id=588&language=english&mid=&cmid=
ADB. (2007). Agricultural land conversion for industrial and commercial use: competing interests of the poor.
In ADB (Ed.), Markets and Development Bulletin (pp. 85-93). Hanoi: Asian Development Bank.
ANZDEC Limited. (2000). Viet Nam Agricultural Sector Program ADB TA 3223-VIE: Phase I Technical Report:
International Food Policy Research Institute.
Chen, J. (2007). Rapid urbanization in China: A real challenge to soil protection and food security. Catena,
69(1), 1-15.
Chen, W. (1998). The political economy of rural industrialization in China: village conglomerates in Shandong
Province. Modern China, 24(1), 73-96.
De Silva, M., Harpham, T., Tuan, T., Bartolini, R., Penny, M., & Huttly, S. (2006). Psychometric and cognitive
validation of a social capital measurement tool in Peru and Vietnam. Social Science & Medicine, 62(4),
941-953.
Deng, X., Huang, J., Rozelle, S., & Uchida, E. (2006). Cultivated land conversion and potential agricultural
productivity in China. Land Use Policy, 23(4), 372-384.
Do, T. N. (2006). Loss of Land and Farmers' Livelihood: A Case Study in Tho Da Village, Kim No Commune,
Dong Anh District, Hanoi, Vietnam. (Unpublished MA Thesis), Swedish University of Agricultural
Sciences, Sweden. Retrieved from http://www.sol.slu.se/publications/masters_35.pdf
Doan, T. T. (2011). Impacts of Household Credit on the Poor in Peri-urban Areas of Ho Chi Minh City, Vietnam.
(Unpublished PhD Thesis), The University of Waikato, Hamilton.
Fazal, S. (2000). Urban expansion and loss of agricultural land-a GIS based study of Saharanpur City, India.
Environment and Urbanization, 12(2), 133.
Fazal, S. (2001). The need for preserving farmland: A case study from a predominantly agrarian economy (India).
Landscape and Urban Planning, 55(1), 1-13.
Gale Johnson, D. (2002). Can agricultural labour adjustment occur primarily through creation of rural non-farm
jobs in China? Urban Studies, 39(12), 2163.
General Department of Taxation. (2006). New Decree on Land: Will the New Decree on Land Facilitate the
Flow in Real Estate Market ? , from
http://www.gdt.gov.vn/wps/wcm/connect/Web+Content/english/news/other/100244_127810?
presentationTemplate=Web%20Content/pt_new_detail_print_english
Groves, R. M., Fowler, F. J., Couper, M. P., Lepkowski, J. M., & Singer, E. (2009). Survey methodology (Vol.
561): John Wiley & Sons Inc.
GSO. (2006). VHLSS-2006: The Questionnair on Household Survey. Hanoi, Vietnam.: The General Statistical
Office.
Ha Tay Province People's Committee. (2006). Decision 289/2006/QĐ-UBND. Ha Dong, Ha Tay, Vietnam: Ha
Tay Province People's Committee.
Ha Tay Province People's Committee. (2008a). Decision 370/2008/QD-UBND. Ha Dong, Ha Tay, Vietnam:
Ha Tay Province People's Committee.

42
Ha Tay Province People's Committee. (2008b). Decision 3035/QD-UBND; (2008). Decision 3036/QD-UBND;
(2008). Decision 3201/QD-UBND; (2008). Decision 3264/QD-UBND;(2008). Ha Dong, Ha Tay,
Vietnam: Ha Tay Province People's Committee, Vietnam.
Han, S. S., & Vu, K. T. (2008). Land acquisition in transitional Hanoi, Vietnam. Urban Studies, 45(5-6), 1097.
Hoai Duc District People's Committee. (2009). Bảng tổng hợp lao động việc làm Huyện Hoài Đức [The synthetic
indicators of labour and employment of Hoai Duc District]. Hoai Duc, Hanoi, Vietnam: Hoai Duc District
People's Committee.
Hoai Duc District People's Committee. (2010a). Báo cáo thuyết minh kiểm kê đất đai năm 2010 [2010 land
inventory report]. Hoai Duc, Ha Noi, Vietnam.
Hoai Duc District People's Committee. (2010b). Báo cáo tình hình thực hiện nhiệm vụ phát triển KTXH-ANQG
năm 2009 và phương hướng nhiệm vụ năm 2010 [The report on the performance of socio-economic,
security and defence in 2009, and the directions and tasks for 2010]. Hanoi: Hoai Duc People's
committee.
Hoang. (2009). Thousands of Red River Farmer in Fear of Relocation. Vietnam Investment News, 2011.
Retrieved from http://www.vietnaminvestment.net/news
Hoang, B. T. (2008). Công nghiệp hóa nông thôn và những biến đổi trong gia đình nông thôn hiện nay( Nghiên
cứu trường hợp xã Ái Quốc, Nam Sách, Hải Dương) [Rural industrialization and changes in the life of
Vietnamese rural families : A case study in Ai Quoc Commune, Nam Sach, Hai Duong)]. Paper presented
at the Proceeding on the third international conference on Vietnam studies, Hanoi, Vietnam.
Hop Nhan. (2008). Giải phóng mặt bằng tại Hà Tây: Bao giờ hết "tắc"? [Site clearance in Ha Tay: when will it
be solved?], from
http://www.monre.gov.vn/v35/default.aspx?tabid=428&cateID=4&id=43669&code=CKE7S43669
Huu Hoa. (2011). " Mỏi mắt" ngóng trông đất dịch vụ [Waiting for "land for services" for a weary long time in
vain], from http://hanoimoi.com.vn/newsdetail/Kinh-te/532088/moi-mat-ngong-dat-dich-vu.htm
Kirk, M., & Nguyen, D. A. T. (2009). Land-Tenure Policy Reforms: Decollectivization and the Doi Moi System
in Vietnam (IFPRI Discussion Paper). The International Food Policy Research Institute (IFPRI). Retrieved
from http://www.ifpri.org/sites/default/files/publications/ifpridp00927.pdf
Le, D. P. (2007). Thu nhập, đời sống, việc làm của người có đất bị thu hồi để xây dựng các khu công nghiệp,
khu đô thị, kết cấu hạ tầng kinh tế-xã hội, các công trình công cộng phục vụ lợi ích quốc gia [The income,
living and employment farmers whose land ceded for urbanization and construction of industrial zones,
infrastructures and for public demand and national benefit purposes]. Hanoi: National Political Publisher.
LH. (2010). Giải phóng mặt bằng ở Huyện Hoài Đức: Vướng nhất là giao đất dịch vụ cho dân [Site clearance
in Hoai Duc: Granting the " land for services" to people is the biggest obstacle], Hanoimoi. Retrieved
from http://www.hanoimoi.com.vn/newsdetail/Kinh-te/401995/vuong-nhat-o-phan-giao-dat-dich-vu-cho-
dan.htm
Minh Tuan. (2011). Hà Nội: Đất dịch vụ lại "sốt" [Hanoi: "land for services" fever occurs again].
Hanoimoi.com.vn, from http://hanoimoi.com.vn/newsdetail/Bat-dong-san/471214/ha-noi-%C4%91at-
dich-vu-lai-sot.htm
MONRE. (2007). Hà Tây: Khai thác nguồn lực để công nghiệp hóa, hiện đại hóa nông thôn [Ha Tay: Exploiting
land resources for the agricultural and rural industrialization and modernization], from

43
The Senshu Social Capital Review No.4 (2013)
http://www.monre.gov.vn/v35/default.aspx?tabid=428&cateID=4&id=30785&code=OX4BL30785
National Assembly of Vietnam. (2003). Law on Land Hanoi, Vietnam: Retrieved from http://www.
vietnamlaws.com/freelaws/Lw13na26Nov03Land%5BX2865%5D.pdf.
Nguyen, Q. V., Nguyen, H. M., Nguyen, X. M., Pham, Q. H., & Nguyen, V. T. (2005). The impact of urbanization
on agriculture in Hanoi: Results of inteviews with districts and municipality officals. Hanoi.
Nguyen, T. D., Vu, D. T., & Lebailly, P. (2011). Peasant responses to agricultural land conversion and mechanism
of rural social differentiation in Hung Yen province, Northern Vietnam. Paper presented at the 7th ASAE
International Conference " Meeting the Challenges Facing Asian Agricultural and Agricultural Economics
toward a Sustainable Future", Hanoi, Vietnam.
Nguyen, T. T. (2012). Land Reform and Farm Production in the Northern Uplands of Vietnam. Asian Economic
Journal, 26(1), 43-61.
Nguyen, V. S. (2009a). Agricultural land conversion and its effects on farmers in contemporary Vietnam. Focaal,
2009(54), 106-113.
Nguyen, V. S. (2009b). Industrialization and Urbanization in Vietnam: How Appropriation of Agricultural Land
Use Rights Transformed Farmers' Livelihoodsin a Per-Urban Hanoi Village? . (EADN working paper
No.38). Hanoi. Retrieved from http://www.eadn.org/eadnwp_38.pdf
Parish, W., Zhe, X., & Li, F. (1995). Nonfarm work and marketization of the Chinese countryside. The China
Quarterly, 143, 697-730.
Statistics Department of Hoai Duc District. (2010). Statistical Yearbook of Hoai Duc 2009. Hanoi: Statistics
Department of Hoai Duc District.
T. Nghi. (2009). Công nghiệp hóa không có lỗi [Industrialization has no fault]. Retrieved from
http://www.toquoc.gov.vn
Tan, R., Beckmann, V., Van Den Berg, L., & Qu, F. (2009). Governing farmland conversion: Comparing China
with the Netherlands and Germany. Land Use Policy, 26(4), 961-974.
The Government of Vietnam. (2004). Decree 197/2004/ND-CP. Ha Noi, Vietnam: The Government of Vietnam
Retrieved from http://moj.gov.vn/vbpq/en/Lists/Vn%20bn%20php%20lut/View_Detail.aspx?ItemID=
7429.
Thien Thu, T., & Perera, R. (2011). Consequences of the two-price system for land in the land and housing
market in Ho Chi Minh City, Vietnam. Habitat International, 35(1), 30-39.
Thuy (Cartographer). (2011a). Administrative map of Hoai Duc District, Hanoi.
Thuy (Cartographer). (2011b). Map of Hanoi, Vietnam.
Thuy Duong. (2011). Đầu tư đất dịch vụ: Canh bạc với rủi ro! [Investing in "land for services" is a risky gamble],
from http://tamnhin.net/Batdongsan/11744/Dau-tu-dat-dich-vu-Canh-bac-voi-rui-ro.html
Toufique, K. A., & Turton, C. (2002). Hands not Land: How Livelihoods are Changing in Rural Bangladesh.
Dhaka, Bangladesh BIDS (Bangladesh Institute of Development Studies).
Truong Giang. (2008). Hà Tây: Nông dân âm thầm bán ruộng! [Farmers silently sell farmland in Ha Tay ], from
http://nongnghiep.vn/nongnghiepvn/72/1/1/11452/Ha-Tay-Nong-dan-am-tham-ban-ruong.aspx
Vietnam Government Web Portal. (2010). HN eyes US $12,000 per capita income by 2030. Retrieved from
http://hanoi1000yrs.vietnam.gov.vn
VietNamNet/TN. (2009). Industrial boom hurts farmers, threatens food supply: seminar, VietnamNews.biz.

44
Retrieved from http://www.vietnamnews.biz/Industrial-boom-hurts-farmers-threatens-food-supply-
seminar_470.html
WB. (2008). The Midle-term Constulative Group Meeting for Vietnam. Sapa, Vietnam: The World Bank.
WB. (2011a). Compulsory Land Acquisition and Voluntary Land Conversion in Vietnam: the conceptual
approach, land valuation and grievance redress mechanism. Hanoi, Vietnam: The World Bank.
WB. (2011b). Vietnam Development Report (VDR) 2011: Natural Resources Management: The World Bank.
WB. (2011c). Vietnam Urbanization Review: Techincal Assistance Report. Hanoi, Vietnam.
Xie, Y., Mei, Y., Guangjin, T., & Xuerong, X. (2005). Socio-economic driving forces of arable land conversion:
a case study of Wuxian City, China. Global Environmental Change Part A, 15(3), 238-252.