Embed Size (px)
Citation preview

Thinking big Doing better
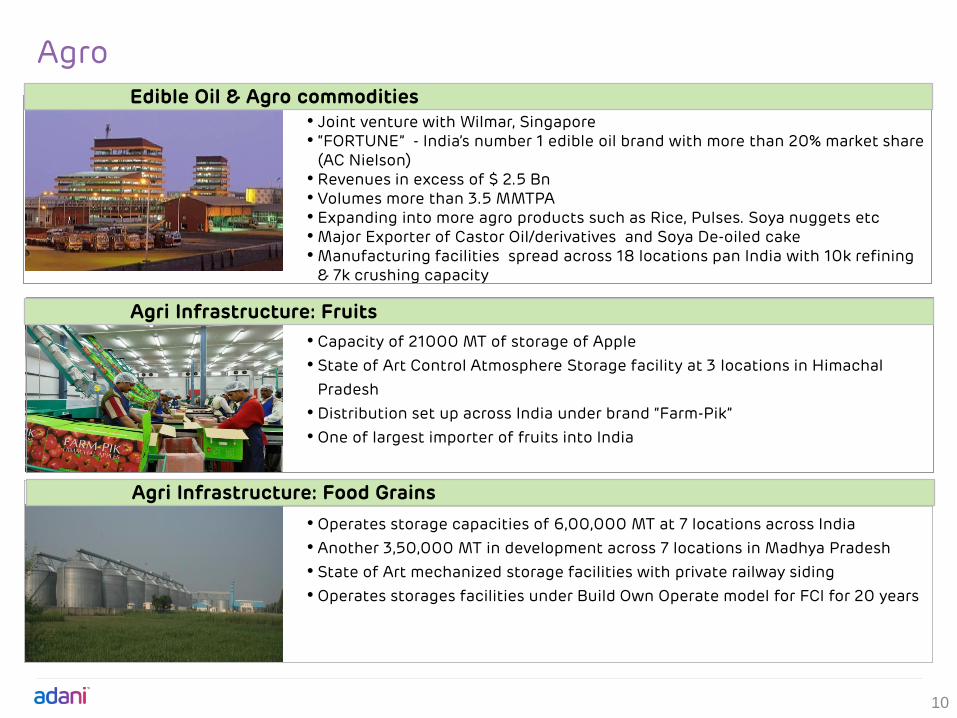
Resources Logistics Energy

55 96 146
230 185 184
85 142 213
185 205 229
255 192 0
212 226 185
192 80 77
155 187 89
96 74 123
75 172 198
183 222 232
247 150 70
2
Vision - To be globally admired leader in integrated infrastructure businesses with a deep commitment to nation building. We shall be known for the scale of our ambition, speed of execution and quality of operations
Leading Player in private
power generation
• Power Generation
• Power Transmission
• City Gas Distribution
Energy
India:
• Largest trader of Coal
• Largest contract mining
developer & operator
• Contract order book of 97 mtpa
Indonesia:
• Resource 269 mn tn
• Mine life: 15 yrs
• 11 mtpa (peak)
Australia:
• JORC Resource: 11 bn ton
• Mine life:100 yrs
• 100 mtpa (peak)
India:
• No. 1 Port of India
• Largest indigenous Ports
Developer & Operator
• 6 Operational Ports / Terminals
• Developing 2 terminals on west
and east India
• Largest Private Rail Developer
Shipping:
• Own & operate 4 capesize
vessels
India:
Generation:
• 9240 MW thermal capacity by
2014
• 40 MW Solar Power Plant
Transmission:
• 5051 Ckt km of transmission
network
City Gas Distribution:
• Operate in 4 cities in
India.(Ahmedabad, Baroda,
Faridabad & Khurja)
Owning a large network of ports,
rail lines, ships
• Ports
• Multi Modal Logistics
• Special Economic Zones
Logistics
Sourcing Coal from around the
world
• Coal Mining
• Coal Trading
• Integrated Coal Management
Resources
Adani Group: Integrated & synergistic business model

3,077 5,654
12,822
16,764* 18,133
17,358
-
5,000
10,000
15,000
20,000
FY09 FY10 FY11 FY12 FY13 FY14
200 384
1,000 1,084 1,271
1,700
-
500
1,000
1,500
2,000
FY09 FY10 FY11 FY12 FY13 FY14
Adani Group – Thinking Big, Doing Better
3
Net Asset (USD mn)
EBIDTA (USD mn)
• Commercial Port in India
• Coal Import Terminal at Mundra
• Private Power Producer in India
• Mine Developer and Operator in India
• Trader of coal in India with consistent share of
about 50%
• Edible Oil Company in India in terms of market share
No.1 :-
* Figure is excluding Abbot asset

Resources Logistics Energy
•Coal Trading
•Coal Mining
•Sea Ports
•Railways
•Power
• Generation
• Transmission

Coal Business: Growth Potential
5 Source: Research Reports
Coal Mining (MDO)
Coal Mines Ordinance:
The ordinance has carved out special provision for allotment of the cancelled coal blocks to the Government companies, having specific end use (only captive use) without going through public auction
In view of this, we expect our MDO coal blocks (Parsa Kente, Machhakata, Chendipada and Parsa) to be reallocated to the respective utilities being Government companies and having specific end use
Our MDO contract for Kente Ext. is not affected by Honorable SC order since it was allocated to RRUVNL under new auction by competitive bidding of Coal Mines Rules 2012
This ordinance brings further opportunity for Adani Group to retain & strengthen its presence in the MDO business and also obtain coal resources for our power business
Thermal Coal Import (MMT)
0
100
200
300
20
11-1
2
20
12-1
3
20
13-1
4
20
14-1
5 P
20
15-1
6 P
20
16-1
7 P
20
17-1
8 P
20
18-1
9 P
20
19-2
0 P
90 116 139 169 194 218 243 270 299
0
200
400
600
800
1000
1200
20
11-1
2
20
12-1
3
20
13-1
4
20
14-1
5 P
20
15-1
6 P
20
16-1
7 P
20
17-1
8 P
20
18-1
9 P
20
19-2
0 P
Power (Mt) Cement CPP (Captive) Sponge Iron Others
Thermal Coal Demand Sector-wise (MMT)
Thermal coal import in India is estimated at 169 MT in FY2015 and expected to grow at 15% YoY

Multi-Country Procurement
Multi modal Logistics
Customer Account Management
Financing
South Africa
Richard Bay
Ports
Locations served
Indonesia
Indonesia
Tarakan
Tanjung Bara Bontang
Samarinda
Muara Satui Tanjung
Pemancingan
Australia
Queensland
Mundra
Gangavaram
Kakinada
Vishakhaptnam
Tuticorin
Haldia
Suratgarh
Tanda
Unchahar
Sipat Korba
Koradi
Parli
Chanderpur
Simhadri
Kota
Chhabra
Gandhinagar Wanabori
Dadri
Panipat
Yamunagar
Hissar
Panki
Parichha
Harduaganj
Kahalgaon
Ramagundam
Kondapalli
North Chennai
Mettur Tuticorin
Rihand
Vindyachal
Paradip
[Talcher]
Mejia
Badarpur
Ennore
Dahej
Bedi Navlakhi
Kandla
Kolaghat
Bakreshwar Bandel
Sagardighi
Durgapur
Hazira
Goa
Tiroda
Coal Business
Electricity Boards
Private Business
Adani Power Ltd
Third Country
Consistent Market share in
electricity business ~50%
We are a team of 200 + People with operations spread across globe through our 25 satellite offices, 18 branch offices, 3 global offices and a head
office based out of Gurgaon.
Coal Trading: Largest Integrated Coal Management
6

Mining Locations Ports
Mundra
Machhakata
Dahej Port
Hazira Port
Parsa
Chhendipada
Parsa – Kente Mormugao Port
Vizag
Kandla
7
State Chhattisgarh Odisha
Mine Parsa -Kente
(RRUVNL)
Parsa
(CSPGCL)
Kente Extension (RRUVNL)
Machhakata
(MGCL)
Chendipada
(UCMCCL)
Block Area (Sq
Km) 27.67 12.52 17.00 20.43 27.42
Mineable Reserve (Mn MT)
452 150 200 1244 1589
Capacity at peak level (MMTPA)
15 5 7 30 40
Overall Stripping Ratio
5.16 5.46 5.10 2.44 2.75
Commencement of Production
Started Feb 13
2016 2017 2016 2016
Notes:
1. RRVUNL – Rajasthan Rajya Vidyut Utpadan Nigam Limited ; 2. MGCL – Mahaguj Collieries Ltd. ; 3. CSPGCL – Chhattisgarh State Power Generation Company
Limited 4. UCMCCL - UCM Coal Company Limited
Coal Mining: Largest Mine Developer & Operator

8
Coal Mining: Indonesia
Indonesia
Bunyu Island
Coal Crushing
Coal Loading
Particulars Capacity
Location Bunyu Island, Indonesia
Resource 269 MMT (JORC)
Current Capacity 7 MMPTA
Production FY14: 3 MMT
FY15: 4.5 MMT (budgeted)
Coal Mining

55 96 146
230 185 184
85 142 213
185 205 229
255 192 0
212 226 185
192 80 77
155 187 89
96 74 123
75 172 198
183 222 232
247 150 70
9
Australia Mine: Funding Plan and Timeline
Particulars Mine
Total Capex 4,200
Debt 2,940
Project Finance 2,140
Equipment Financing 800
Equity 1,260
Of which already invested 800
USD mn
Particulars Mine
Open Cut Mining 28 MMT
First Coal Open Cut Aug-17
Underground Mining 14 MMT
First Coal Underground Mar-18
Q1 2015 Off-Site & On-Site Infra Construction Commencement
Q4 2015 Financial closure
Q3 2017 Open Pit E - First Coal
Q4 2017 Open Pit D - First Coal
Q1 2018 Underground 1 System Cut First Coal
Q3 2018 Underground 2 System Cut First Coal
Timeline Carmichael Coal Mine
Agro
10
• Capacity of 21000 MT of storage of Apple
• State of Art Control Atmosphere Storage facility at 3 locations in Himachal
Pradesh
• Distribution set up across India under brand “Farm-Pik”
• One of largest importer of fruits into India
• Operates storage capacities of 6,00,000 MT at 7 locations across India
• Another 3,50,000 MT in development across 7 locations in Madhya Pradesh
• State of Art mechanized storage facilities with private railway siding
• Operates storages facilities under Build Own Operate model for FCI for 20 years
Agri Infrastructure: Food Grains
• Joint venture with Wilmar, Singapore • “FORTUNE” - India’s number 1 edible oil brand with more than 20% market share
(AC Nielson) • Revenues in excess of $ 2.5 Bn • Volumes more than 3.5 MMTPA • Expanding into more agro products such as Rice, Pulses. Soya nuggets etc • Major Exporter of Castor Oil/derivatives and Soya De-oiled cake • Manufacturing facilities spread across 18 locations pan India with 10k refining
& 7k crushing capacity
Edible Oil & Agro commodities
Agri Infrastructure: Fruits
Agri Infrastructure: Food Grains
Resources Logistics Energy
•Coal Trading
•Coal Mining
•Sea Ports
•Railways
•Power
• Generation
• Transmission
55 96 146
230 185 184
85 142 213
185 205 229
255 192 0
212 226 185
192 80 77
155 187 89
96 74 123
75 172 198
183 222 232
247 150 70
12
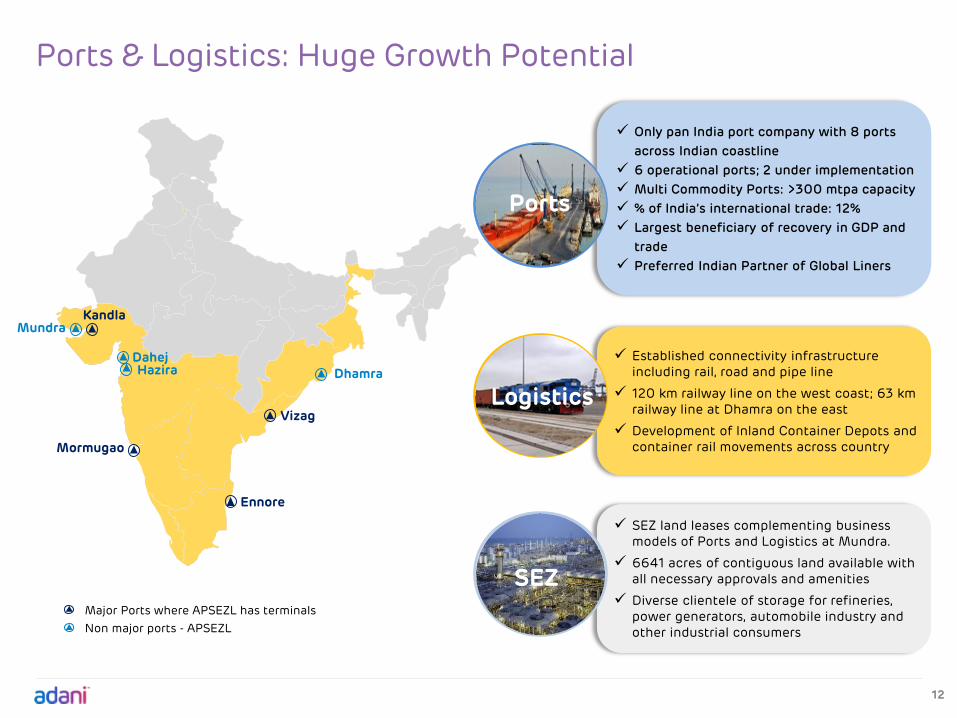
SEZ land leases complementing business models of Ports and Logistics at Mundra.
6641 acres of contiguous land available with all necessary approvals and amenities
Diverse clientele of storage for refineries, power generators, automobile industry and other industrial consumers
Ports & Logistics: Huge Growth Potential
Dahej
Vizag
Mundra
Hazira
Mormugao
Kandla
Dhamra
Ennore
Major Ports where APSEZL has terminals
Non major ports - APSEZL
SEZ
Established connectivity infrastructure including rail, road and pipe line
120 km railway line on the west coast; 63 km railway line at Dhamra on the east
Development of Inland Container Depots and container rail movements across country
Only pan India port company with 8 ports
across Indian coastline
6 operational ports; 2 under implementation
Multi Commodity Ports: >300 mtpa capacity
% of India’s international trade: 12%
Largest beneficiary of recovery in GDP and
trade
Preferred Indian Partner of Global Liners
Logistics
Ports

55 96 146
230 185 184
85 142 213
185 205 229
255 192 0
212 226 185
192 80 77
155 187 89
96 74 123
75 172 198
183 222 232
247 150 70
13
Pipe Road Rail
Mundra
Hazira
Dahej
Dhamra
Ports\Mode
P P P
- P P
- P P
- P P
Ports & Logistics: Robust Evacuation Infrastructure
Origin Destination Distance (Kms) Advantage
Mundra
Mundra- Delhi 1,105 -
Mundra- Bhatinda 1,128 -
Mumbai-Bhatinda 1,536 408
Mumbai- Delhi 1,350 245
Pipavav- Delhi 1,191 88
Pipavav-Bhatinda 1,377 249
Shorter Route Compared to other Ports in the region

55 96 146
230 185 184
85 142 213
185 205 229
255 192 0
212 226 185
192 80 77
155 187 89
96 74 123
75 172 198
183 222 232
247 150 70
14
Ports & Logistics: DFC/DMIC – a Cargo Booster
DFC/
DMIC
• The development & construction of high
speed, more efficient railway lines
• DFC is also expected to drive the
establishment of industrial corridors & logistic
parks along its alignment
• Total length: ~3300 kms
• Investment: Rs 900 bn
Status • Western corridor to be completed by 2018
• Eastern corridor to be completed by 2019
Capacity • Double stacking vs single stacking currently
• Axle load of 32 ton vs 22 ton currently
• 8-15 ton carrying capacity vs 4-5 ton currently
• Average speed 100 kmph – almost 3 times
current speed
Benefit • Mundra Port is connected with western
corridor through Mundra – Adipur – Palanpur
rail line (Kutchh Rail Corporation)
• Triple industrial output in five years (25%
CAGR)
• Quadruple exports from the region in five years
(32% CAGR)
Source: DFCCIL/DMIC website
55 96 146
230 185 184
85 142 213
185 205 229
255 192 0
212 226 185
192 80 77
155 187 89
96 74 123
75 172 198
183 222 232
247 150 70
15
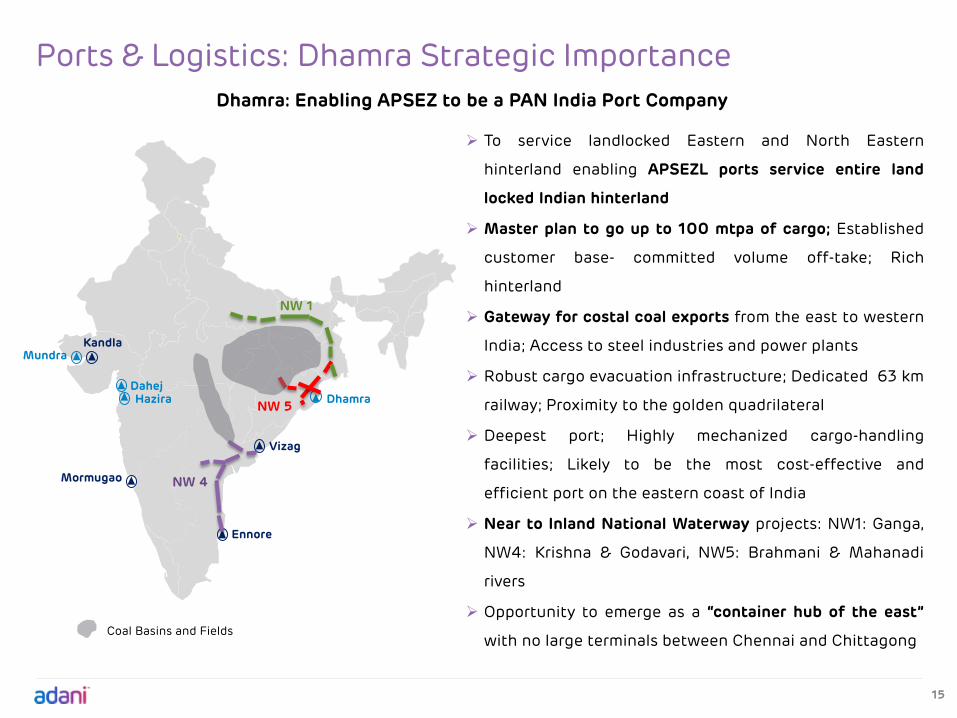
Ports & Logistics: Dhamra Strategic Importance
Dhamra: Enabling APSEZ to be a PAN India Port Company
To service landlocked Eastern and North Eastern
hinterland enabling APSEZL ports service entire land
locked Indian hinterland
Master plan to go up to 100 mtpa of cargo; Established
customer base- committed volume off-take; Rich
hinterland
Gateway for costal coal exports from the east to western
India; Access to steel industries and power plants
Robust cargo evacuation infrastructure; Dedicated 63 km
railway; Proximity to the golden quadrilateral
Deepest port; Highly mechanized cargo-handling
facilities; Likely to be the most cost-effective and
efficient port on the eastern coast of India
Near to Inland National Waterway projects: NW1: Ganga,
NW4: Krishna & Godavari, NW5: Brahmani & Mahanadi
rivers
Opportunity to emerge as a “container hub of the east”
with no large terminals between Chennai and Chittagong
Dahej
Vizag
Mundra
Hazira
Mormugao
Kandla
Dhamra
Ennore
NW 4
NW 5
NW 1
Coal Basins and Fields

Resources Logistics Energy
•Coal Trading
•Coal Mining
•Sea Ports
•Railways
•Power
• Generation
• Transmission
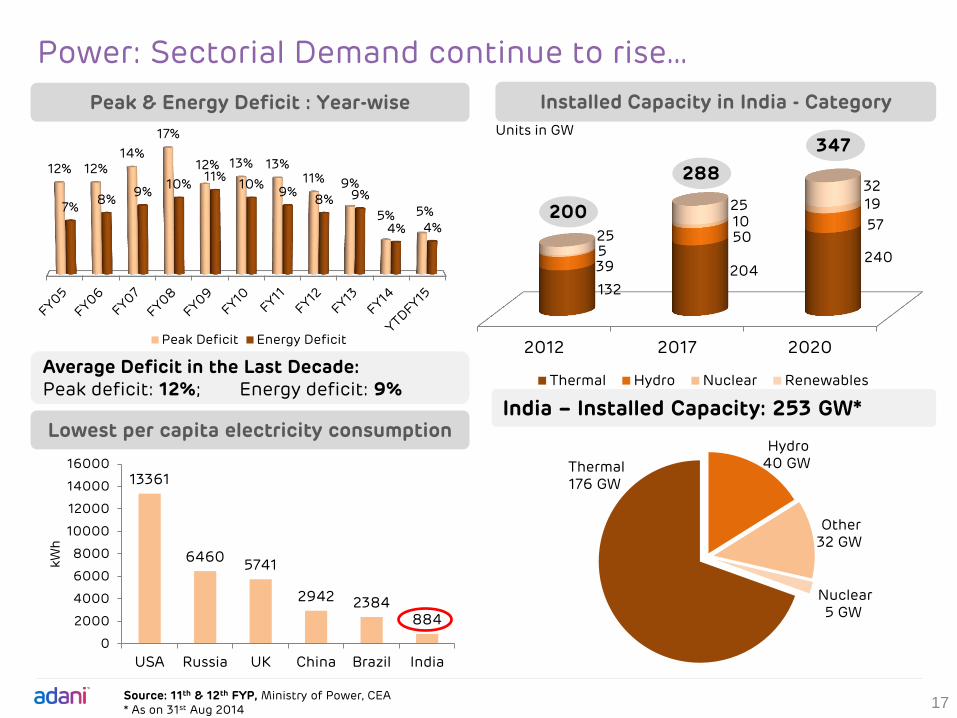
Power: Sectorial Demand continue to rise…
17
Average Deficit in the Last Decade: Peak deficit: 12%; Energy deficit: 9%
India – Installed Capacity: 253 GW*
Installed Capacity in India - Category
Source: 11th & 12th FYP, Ministry of Power, CEA * As on 31st Aug 2014
Units in GW
2012 2017 2020
132
204 240
39
50 57
5
10 19
25
25
32
Thermal Hydro Nuclear Renewables
200
288
347
Peak & Energy Deficit : Year-wise
Hydro 40 GW
Other 32 GW
Nuclear 5 GW
Thermal 176 GW 13361
6460 5741
2942 2384 884
0
2000
4000
6000
8000
10000
12000
14000
16000
USA Russia UK China Brazil India
kW
h
Lowest per capita electricity consumption
12% 12% 14%
17%
12% 13% 13% 11% 9%
5% 5% 7% 8%
9% 10%
11% 10%
9% 8% 9%
4% 4%
Peak Deficit Energy Deficit

Power: Generation & Transmission
18 Notes: 1. Project under AEL Subsidiary
# Line 1 operational
Commissioned: 3.300MW
Commissioned: 1,320MW
Kawai
Commissioned: 4,620MW
Mundra
Tiroda
Dehgam
Mohindergarh
Aurangabad Warora
Adani Power projects are in high growth states of India. Also these states have financially strong SEBs
40 MW Operational Solar Power Project1 in Gujarat
SN Location Capacity
(MW)
1 Mundra (Gujarat) 4,620
2 Tiroda (Maharashtra) 3,300
3 Kawai (Rajasthan) 1,320
Total - Implementation 9,240
Power Generation
Power Transmission
SN Connecting Locations Length
(Ckt Kms)
1 *Mundra – Dehgam 1000 MW, 400 KV
868 Operational
2 *Tiroda – Warora 1000 MW, 400 KV DC
438 Operational
3 *Mundra – Mohindergarh 2500 MW, 500 KV HVDC
2,530 Operational
4 Tiroda – Aurangabad1 4500 MW, 765 KV SC
1,215 Operational#
Total 5,051
Operation(MW)
4,620
3,300
1,320
9,240
*Transmission lines are part of inter-state transmission system

19
Power: Fuel Security & Off-take in Place
Customer Total
Capacity (MW)
Capacity contracted
(MW)
Levelised tariff
(INR/unit)
PPA starts from
Coal Availability Qty (MMT)
Coal Required (MMT)
Remark
GUVNL (330x4) 1,320 1,000 2.89 Feb-10 Imported Coal 10.2 ~40% of coal requirement tied up
through CIL domestic coal supply
Balance coal cost pass through as per CCEA directive
CERC issued final order granting
compensatory tariff
GUVNL (660x2) 1,320 1,000 2.35 Feb-12
UHBVNL & DHBVNL (660x3)
1,980 475 + 949 2.94 Aug-12 / Feb-13
FSA signed for 6.4 MMT
6.4
Mundra 4,620 3,424 16.6
MSEDCL (660x2)
1,320 1,320 2.64 Aug-12 FSA signed for 4.91 MMT FSA - Tapering linkage signed for 800 MW#
8.3
~66% of coal requirement tied up through CIL domestic coal supply
Balance coal cost pass through as per
CCEA directive
MERC issued final order granting compensatory tariff
MSEDCL (660x3)
660 125 + 440
3.28**
Aug-14 / Feb-17
1,320 1200 Apr-14 MoU signed for 3.39 MMT
5.5
Tiroda 3,300 3,085 13.8
RRVPNL (660x2) 1,320 1,200 3.24** Aug-13 MoU signed for 3.39 MMT
5.5
~62% of coal requirement tied up through CIL domestic coal supply
Balance coal cost pass through as per
CCEA directive
Proceedings completed in RERC. Order awaited.
Kawai 1,320 1,200 5.5
Grand Total 9240 7709^ 19 35.9 ~53% of coal requirement tied up through CIL domestic coal supply
**Fuel & Fuel Transportation are linked to CERC escalation index in PPA tariff ^ PPA Capacity 92% of Net capacity
# SLC (LT) has approved 1 year extension of tapering coal supplies, pending decision of competent authority

20
20
Disha: Power Operations Ignite: Ports Operations
Agile: Capital Projects Synergy: Services (Finance, IT, HR)
BPT of Power Operations Group with ATK:
– Strategic Planning
– Revenue Management
– Operations and Maintenance
– Fuel Sourcing and Mgmt.
BPT of Ports Operations Group with KPMG :
– Marine Operations
– Terminal Operations
– Engineering Services
– Customer Service & Marketing
BPT of Projects with Accenture:
– Sourcing and Procurement
– Project Management
– Engineering
– Construction and Commissioning
BPT of Services with Strategy&*:
– Finance: B2P, O2C, Tax, R2R, Treasury, FP&A, ABEX
– IT: Planning, Delivery, Support
– HR: TM, TA, L&D, PMS, HR Ops
Tezz Transformation: Components and Key Processes
TEZZ
Adani Group: Business Process Transformation
* Formerly Booz & Company

55 96 146
230 185 184
85 142 213
185 205 229
255 192 0
212 226 185
192 80 77
155 187 89
96 74 123
75 172 198
183 222 232
247 150 70
21
Power: Growth Enablers
Domestic coal availability can now be a reality based on ordinance
• Ensures a long-term fuel supply for the sector, with overall fuel
production to rise
• Increased coal production and efficiencies result in lower fuel
pricing
• Opportunity for private IPPs with operational / ready to use capacity
New Projects – sources of funding & opportunity for growth
5/25 scheme announced by RBI
• Existing long term debt are allowed to be refinanced till
economic life of asset
• Average debt tenure for long term loan of Adani Power would
be about 20 years
55 96 146
230 185 184
85 142 213
185 205 229
255 192 0
212 226 185
192 80 77
155 187 89
96 74 123
75 172 198
183 222 232
247 150 70
22
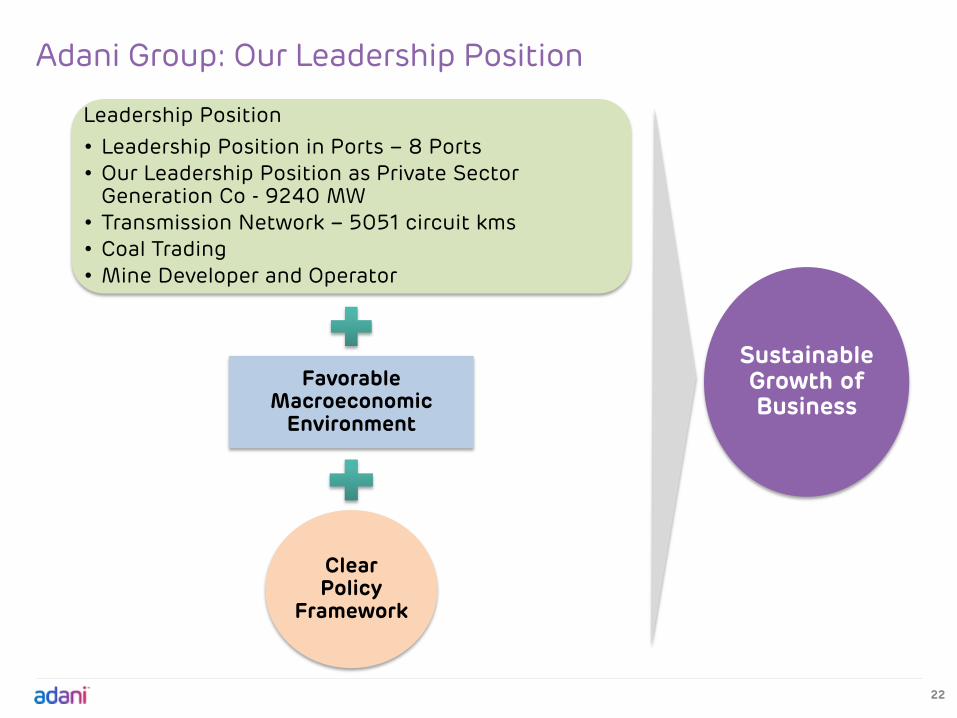
Adani Group: Our Leadership Position
Leadership Position
• Leadership Position in Ports – 8 Ports • Our Leadership Position as Private Sector
Generation Co - 9240 MW • Transmission Network – 5051 circuit kms • Coal Trading
• Mine Developer and Operator
Favorable Macroeconomic
Environment
Clear Policy
Framework
Sustainable Growth of Business

23
AEL assumes no responsibility to publicly amend, modify or revise any forward looking statements, on the basis of any subsequent development, information or events, or otherwise. Unless otherwise stated in this document, the information contained herein is based on management information and estimates. The information contained herein is subject to change without notice and past performance is not indicative of future results. AEL may alter, modify or otherwise change in any manner the content of this presentation, without obligation to notify any person of such revision or changes. No person is authorized to give any information or to make any representation not contained in and not consistent with this presentation and, if given or made, such information or representation must not be relied upon as having been authorized by or on behalf of AEL. This presentation is strictly confidential. This presentation does not constitute an offer or invitation to purchase or subscribe for any securities in any jurisdiction, including the United States. No part of its should form the basis of or be relied upon in connection with any investment decision or any contract or commitment to purchase or subscribe for any securities. None of our securities may be offered or sold in the United States, without registration under the U.S. Securities Act of 1933, as amended, or pursuant to an exemption from registration therefrom. This presentation is confidential and may not be copied or disseminated, in whole or in part, and in any manner. This presentation contains translations of certain Rupees amounts into U.S. dollar amounts at specified rates solely for the convenience of the reader.
Certain statements made in this presentation may not be based on historical information or facts and may be “forward-looking statements,” including those relating to general business plans and strategy of Adani Enterprises Limited (“AEL”) and Adani Ports and Special Economic Zone Limited (“APSEZ”) & Adani Power Limited (“APL”), their future outlook and growth prospects, and future developments in their businesses and their competitive and regulatory environment, and statements which contain words or phrases such as ‘will’, ‘expected to’, etc., or similar expressions or variations of such expressions. Actual results may differ materially from these forward-looking statements due to a number of factors, including future changes or developments in their business, their competitive environment, their ability to implement their strategies and initiatives and respond to technological changes and political, economic, regulatory and social conditions in India. This presentation does not constitute a prospectus, offering circular or offering memorandum or an offer, or a solicitation of any offer, to purchase or sell, any shares and should not be considered as a recommendation that any investor should subscribe for or purchase any of AEL’s shares. Neither this presentation nor any other documentation or information (or any part thereof) delivered or supplied under or in relation to the shares shall be deemed to constitute an offer of or an invitation by or on behalf of AEL. AEL, as such, makes no representation or warranty, express or implied, as to, and does not accept any responsibility or liability with respect to, the fairness, accuracy, completeness or correctness of any information or opinions contained herein. The information contained in this presentation, unless otherwise specified is only current as of the date of this presentation.
Legal disclaimer