Embed Size (px)
Citation preview

Resource Booms and Politics:
The Effects of Oil Shocks on Public Goods and Elections∗
Joana Monteiro†
PUC-Rio
December 2009
Abstract
The abundance of natural resources can be a blessing or a curse to developing countries.
I examine the political economy mechanisms that link resource abundance to long-run devel-
opment using the recent increase in Brazil’s oil production and the large payments made to
municipalities in the form of royalties. Using yearly variation in oil royalties I examine the
effects of oil windfall on politicians’ behavior while in power and electoral success. I find that oil
booms generate modest effects on education supply and increase municipal payrolls by raising
public employment and wages. I also find that oil windfall affects local politics by creating an
incumbency advantage and reducing political competition. These results are compatible with
the model I present where voters do not perfectly assess royalty value and get satisfied with
modest improvements in living standards.
Key words: natural resources, elections, political competition.
JEL: D72, D78, Q33.
∗I am grateful to Juliano Assuncao, Filipe Campante, Claudio Ferraz, Roberto Moraes, Rodrigo Serra, RodrigoSoares, Denise Terra and seminar participants at Harvard Development Lunch, IPEA and LACEA for helpful dis-cussions and suggestions. I thank Nicole Saba for excellent research assistance. I gratefully acknowledges financialsupport from Corporacion Andina de Fomento (CAF) and CAPES.†Department of Economics, Pontifıcia Universidade Catolica do Rio de Janeiro (PUC-Rio), Rua Marques de Sao
Vicente, 225- Gavea Rio de Janeiro, RJ, 22453-900, Brasil. Contact: [email protected]
1 Introduction
The abundance of natural resources can be a blessing or a curse. While some countries are able
to exploit resource riches to improve their welfare, many others are doomed by such discoveries
(e.g. Botswana and Nigeria). Despite the existence of many studies that examine the effects
of resource abundance on economic performance across countries, there is still great controversy
over the true effects of resource booms.1 The reason for this is twofold. First, there are inherent
difficulties in controlling for other factors that co-vary with both resource abundance and economic
performance in cross-country regressions. Secondly, while there is a growing theoretical literature
on the mechanisms that link resource booms with long-run development, empirical evidence is still
lacking.
In this paper I examine the effects of resource booms on the behavior of politicians in power,
entry into politics and the quality of politicians. I also examine how resource abundance affects
electoral outcomes. I do so by using variation across municipalities that have benefited from Brazil’s
recent oil production boom and new rules for distributing oil royalties to drilling regions. Over the
last decade, oil production in Brazil more than doubled from 900 thousand to 1,900 thousand
barrels a day. Moreover, royalty payments increased from 5 to 10 percent of the production value
and were indexed to the international oil price. Hence, from 1999 to 2008, 120 new municipalities
began to receive oil royalties and municipal oil revenues increased by approximately 700%, creating
several “new” rich municipalities.
This paper presents innovations which allow a better estimation of the effects of oil booms on
development. Because I use variation in royalties of oil collected by the Federal Government, but
redistributed to municipalities based on a fixed geographic criterion, I circumvent the potential
endogeneity in the decision to extract oil. Moreover, by using variation across local governments
within a country, I keep constant all the variation in macro institutions that might also affect
long-term economic growth. Finally, since royalty payments increased considerably during the last
decade, I have enough temporal variation in the data which allows for the estimation of fixed-effect
1See, among others, Haber and Menaldo (2008), Hodler (2006), Lederman and Maloney (2007), Mehlum, Moeneand Torvik (2002), Rodriguez and Sachs 1999; Ross (1999, 2001), Sachs and Warner (1995).
1
regressions. Therefore, by using panel-data for municipalities I am able to control for all potential
geographical characteristics that are likely to affect resource availability, economic growth potential,
and political outcomes.
I begin the analysis by developing a theoretical model in order to understand how oil windfall
affect politicians’ and voters’ behavior. In the model, voters know that the municipality receives
oil royalties but they cannot perfectly assess the amount received. Voters can only observe the
amount of public goods provided and they know that this depends on the total revenue and on
the incumbent’s ability, which is not observed. Therefore, oil windfall allows the incumbent to
signal a higher ability and voters respond by reappointing more often the mayor to office. The
model also shed light on royalty effects on political competition, showing that that the number of
candidates should decrease in close-seat elections and decrease or increase in open-seat ballots. I
then use royalty payment variation across Brazilian municipalities and along the years to test the
predictions from the model. I find that municipalities are using royalty rents to hire more public
employees and pay higher wages. In addition, I assess that oil-rich municipalities are paying higher
wages to lower educated people and that they are expanding the public sector without increasing the
share of health and educational professionals. Overall, the results suggest that a better provision
of public services was not the main objective of public authorities when they expanded the public
sector, what I interpret as a support for the idea that natural resources increase patronage practices.
I also find that oil-rich municipalities promoted some improvements in education by enrolling more
children in school, building some schools and buying more computers to schools. However, the
improvements generated are not compatible to the size of royalty rents. When I look at local
politics, I find that, although mayors are not promoting great improvements in living standards,
they are being able to remain in power and that less candidates are willing to challenge them. No
effects on political selection were found.
These results are related to different literatures. This paper contributes to a growing literature
that examines the political economy of the resource curse. One line of research argues that an
increase in the stock of natural resources induces rent-seeking which distorts the incentives for
productive investment (Baland and Francois, 2000; Lane and Tornell 1996; Tornell and Lane 1999;
2

Torvik, 2002). Most of these models, however, do not explain why a resource curse might occur in
some countries, but not in others. More recently, political economy models have been developed
to shed light on the incentives and constraints faced by politicians. Caselli (2006) emphasizes that
natural resources can bring political instability since it increase the probability of coups, which in
turn reduces the effective rate of return to investing in the country’s development. Acemoglu et al.
(2004) show that in places dominated by “kleptocractic” rulers, continuation in power is a function
of the availability of large rents from natural resources which can be used to bribe decisive groups.
These papers, however, are highly motivated by Africa context. Caselli and Cuningham (2007)
offer more insights to my analysis by showing how resource revenue can affect politicians’ decision
problem. They argue that the natural resource revenue effect occur through two main channels: by
increasing the value to stay in power and by raising competition over power. In addition, Robinson
et al (2006) shed light on the effects of natural resources in a democratic context. They argue
that incumbent politicians can use revenues from natural resources to spend in patronage in order
to influence future election. In some sense, this work can be interpreted as an empirical test for
Robinson et al (2006) model.2
This paper complements recent papers that use geographical variation in oil availability within
countries to examine the effects of oil abundance on long-run economic development and the quality
of government. Michaels (2007) uses geological variation in oil abundance in U.S. counties to
investigate the effects of oil specialization. He finds that the development of oil sector increased
education and income per capita without causing ill effects on industrialization or inequality. More
related to this study is Caselli and Michaels (2009) who use variation in oil abundance among
Brazilian municipalities to assess the effects of resource abundance on local economic activity,
public spending, public good provision, and living standards. They find only modest effects on
non-oil GDP, public good provision, no significant improvements in living standards, leading them
to conclude that most of oil royalties received by municipalities go missing. This work differs from
Caselli and Michaels (2009), however, on the focus placed on the political economy mechanisms that
2There are at least two other types of mechanisms put forward in the existing literature. One is described in Gyl-fason (2001) and Leamer et al. (1999) who argue that politicians in resource rich environments do not have incentivesto spend in education. The lack of human capital accumulation reduces long-run growth. Another mechanism is thetraditional idea of the Dutch-disease, see Corden and Neary (1982).
3

link resource booms to long-run development. Hence, this paper is also related to Vicente (2008)
who examines the effect of oil discovery announcements in Sao Tome and Principe on measures of
perceived corruption. This paper is also part on a recent literature on Brazil which include Brollo et
al (2009). They investigate the effect of federal transfers on reelection outcomes, political selection
and corruption in Brazilian municipalities. They look to different types of federal transfers to
municipalities than me and also show that they increase election outcomes. However, the mechanism
highlighted in their work is different from mine.3 Finally, my findings also complement a literature
on voters’ rationality. In particular, my theoretical framework is similar to Wolfers (2007) who
present a model where voters cannot discern between incumbent’s competence and luck. I find
results in line with his work, which shows that governors in oil-producing states are likely to be
reelected following a rise in oil prices, while their counterparts in the rust-belt are likely to be
ousted.
The rest of the paper is organized as follows. Section 2 describes the institutional background
and present a case study to help illustrate the potential effects of oil windfall. Section 3 presents
a theoretical framework. Section Section 4 explains the methodology I employ and describes the
data used. Section 5 presents the empirical findings. Section 6 discusses the implications of my
results and concludes.
2 Institutional Background
2.1 Oil Production and the Distribution of Royalties to Municipalities
Brazil has been extracting oil since the 1960s, but it has never been considered a major oil producer.
In the beginning of 2007, Brazil’s reserves accounted for about 12 billion barrels or 1% of the world’s
total. An industry upturn took place in the end of the 1990s. The milestone was the enactment of
Law no. 9478 in 1997, coined as the Oil Law, which phased-out the state oil extraction monopoly
and was followed by a great increase in oil and gas prospection and production.
3Their model states that an incumbency advantage arises due to an impoverish in the pool of candidates, while inmy model there is an incumbency advantage because voters are unable to assess royalty value. I do not find evidencethat royalties affect political selection.
4
In the last decade, production more than doubled from 900 thousand to 1,900 thousand barrels a
day. This boost was accompanied by a new rule for distributing oil royalties which increased royalty
payments from 5 to 10 percent of the production value and indexed oil value to the international
price. These changes, together with the upward trajectory of international prices and the large
Brazilian Real devaluation, induced an enormous increase in the revenues from royalties.
Royalty revenue partition is defined by law and is divided among the Ministry of Navy (15%),
the Ministry of Science and Technology (12%), state (31%) and local governments (34%) and a
special fund (8%).4 The local government share greatly benefits the municipalities where drilling
is done (in the case of land extraction) or municipalities which are near sea platforms.5 The
criteria to determine proximity to sea platform is based on orthogonal and parallel lines designed
by the Brazilian Institute of Geography and Statistics (IBGE) in the 1980s and are orthogonal to
other factor that might affect economic and political outcomes. The remaining portion goes to
municipalities which host production plants, transportation sites, harbors used by the oil industry
or which are crossed by pipelines. In addition, a small amount is distributed to cities located
on “zona limitrofe”, i.e., adjacent cities or others located in the same geographic area within the
state. The cities benefited by these criteria are determined by IBGE which announces the eligible
municipalities and their shares every six months. Therefore, royalty distribution is quite unequal:
992 out of 5565 municipalities in Brazil received royalties between 1999 and 2008, but 54 cities
concentrates 81 percent of the municipal share of royalty revenue.
This partition rule offers an opportunity for investigating the royalty impacts on city perfor-
mance because for the major part of the municipalities this payment is plausibly exogenous to local
economy. When a new oil patch is discovered, exogenous geographical criteria determines whether
a municipality will receive royalties and the amount received. I show an illustration of the criteria
in Figure 1 for the coast of Rio de Janeiro, the main producer state. In addition, technological
development and resource extraction are decided by Petrobras and other companies and are not
influenced by municipal authorities. This characteristic allows me to circumvent the possibility of
4The percentages in brackets corresponds to amounts received by each group of beneficiaries in 2007 and not topre-determinate percentages owned by them.
5Off-shore extraction is responsible for the lions’ share of Brazil’s production
5

endogeneity in the extraction. Moreover, by using panel-data for municipalities I am also able to
control for all potential geographical characteristics that are likely to affect resource availability,
economic growth potential, and political outcomes.
The oil windfall is transferred by Brazilian Treasury every month and municipalities are free
to allocate this income. There are only two restrictions. They cannot use this rent to hire public
employees in a permanent basis, nor can pay debts with it.6 One consideration on the use of
nomenclature is needed. I use the denomination royalty loosely throughout the paper to refer
to royalties plus “participacoes especiais”. “Participacoes especiais” are extra payments made by
production sites which are highly productive. These payments were introduced by the Oil Law
in 1997 and about 30 municipalities currently receive it.7 The second term loosely used is oil
production. I use oil to denote oil and natural gas production since oil corresponds to the bulk of
oil and gas production.
2.2 Oil Royalties and Malfeasance: the case of Campos dos Goytacazes
To illustrate how oil windfall can impact the political environment of local economies I now briefly
discuss the case of Campos dos Goytacazes, a municipality located in the north of Rio de Janeiro
state and the largest beneficiary of royalty rents in Brazil. It received R$ 780 million or 24 percent
of total rents distributed to all local governments in 2007.
Campos is known for being the political cradle of Anthony Garotinho, an ambitious politician
who governed the state of Rio de Janeiro between 1998 and 2002. He was also the second runner-up
in the 2002 presidential election. Garotinho started its political career as the mayor of Campos
in 1989, two years after the city began to receive revenues from royalties. The oil rents and the
populist profile gave him a large popularity. In 1992, he elected his candidate for succession and
in the 1996 ballot he came back to power, where he stayed for two years until successfully running
for the state governor.
During the 2000’s, when oil windfall dramatically increased from R$ 50 million in 1999 to R$ 1
billion in 2008, the municipality witnessed a series of unique political events. The 2004 election was
6The only exception is debt with Federal Government, which can be paid with this income.7ANP calls the sum of both payments as ”participacoes governamentais”.
6

remarkable. There were denounces of vote-buying, two radio stations were turned off charged of
illegal propaganda, R$ 316,000 in cash was found in one party’s office in the day before the election,
people were arrested charged of electoral fraud and federal troops were sent to the municipality in
order to guarantee ballot security. In addition, the state governor, Rosinha Garotinho, moved the
state office headquarter to Campos few days before the election in order to influence its outcome.
At the end, the incumbent’s candidate won Garotinho’s candidate by a narrow margin, but both
had their candidature suspended by the Electoral Court. The local legislature president assumed
power and was elected mayor by a new election which took place in 2006.
The analysis of incumbents’ behavior sheds light on the intention behind all this effort to get
in office. Arnaldo Vianna, Campos’s mayor from 1998 to 2004, is charged of having US$ 35 million
in a private foreign bank account. He was accused of malfeasance by state attorneys and had his
candidature for 2008 election suspended. He got famous for using public resources for financing free
live concerts. His successor, Alexandre Mocaiber, was temporarily suspended from office in 2008
accused of fraud in public procurements. The federal policy investigation estimated that R$ 240
million was misappropriated from public resources and that 20,000 public employees were illegally
hired only in the first trimester of 2008.8
This type of story is not unique. Other oil rich municipalities accumulate political scandals as
well. Carapebus, the third largest recipient in per capita terms in 2007, almost replicate Campos
history in its 2008 election. The frontrunner did not have his votes computed because the Elec-
toral Court suspended his candidature due to improper use of public funds during his previous
administration. A new ballot was set since the second place in the election couldn’t be nominated
mayor either due to problems with Justice. Sao Francisco do Conde, in Bahia, which is the Brazil’s
largest per capita GDP due to the location of an oil refinery and the 26th place in royalty per capita
distribution almost went to 2008 ballot without candidates: three out of four runners were facing
accusations of malfeasance. At the end, two candidates run for mayor. In the empirical section, I
assess whether such type of events are regular in oil rich municipalities or are isolated cases.
8Source: http://noticias.uol.com.br/ultnot/eleicoes/eleito/campos.jhtm and Globo On Line, 11/03/2008.“Prefeito de Campos e afastado do cargo e acusados de envolvimento em fraudes da prefeitura sao presos”.
7

3 Theoretical Framework
This section develops a simple approach to understand voters’ and politicians’ behavior in munici-
palities affected by oil windfall. The basic idea is that voters know that the municipality receives
oil royalties but they cannot perfectly assess the amount received. Voters can only observe the
amount of public goods provided and they know that this depends on the total revenue and on
the incumbent ability, which is not observed. Therefore, shocks which increase the budget and
are not observed by voters create an incumbency advantage since they are interpreted as superior
incumbent’s ability. In this sense, the model is similar to the one present in Wolfers (2006) where
voters cannot fully distinguish between luck and ability.
3.1 Basic Model
I consider a municipality composed by several citizens who have the same preferences over a public
good g.9 Citizens only differ by their decision to participate in politics and their political ability
a. I refer to citizens who decided to run for mayor as politicians and the rest of the population as
voters. The ability term a has a broader interpretation and the reader can consider a citizen with
a high a not only as a high ability politician but also as one who put more effort while in office or
who is less corrupt. This ability is private information and is distributed according to N(µ, σ).
There are several periods which are divided by elections. There are term-limits and a politician
can only govern a municipality for two subsequent periods. Hence, there are two-types of elections:
the open-seat election, which the mayor face a term-limit and cannot be a candidate, and the
close-seat one, which the mayor is running for reelection.
In every period, the municipality receives a budget shock γt whose total value is only observed
by politicians. Voters are aware that the municipality receives royalties but they assess its value
as bt, which can be thought as the average amount received in the past years. However, the total
amount depends also on a random shock θt which is normally distributed according to N(0, vt). In
addition, municipalities also receive a constant tax revenue and federal transfers, which generate
9This public good is a generic definition of a vector of public services and goods provided by the municipality suchas education, health services and infrastructure and can also include private transfers.
8

the revenue T . Hence, total budget revenue is B(γ) = T + γt.
I begin the analysis of election outcomes considering the entry into politics as exogenous and
assuming that the number of candidates is n. The election outcome in open-seat elections is
straightforward. Voters cannot rely on recent information on politicians’ performance while in
office in order to assess politicians’ quality. Assuming there is no good campaign technology, voters
cannot distinguish between different candidates and all of them face the same probability of winning
1n .
The political scenario in close-seat elections is more interesting. In this case, voters need to
decide whether to reelect the incumbent or to elect a challenger in the end of the period. Their
decision is based on a private assessment on whether they believe their payoff could be better or
not under the government of another politician. Voters know that the level of public goods depends
on the municipality budget and on the unobservable politician ability a. For simplicity, I assume
a linear form for g such that g = T + γ + a. Therefore, voters rely on the observed value of public
goods gt and their assessment of public budget T + bt to evaluate the incumbent’s ability. This
information provide them the signal at = gt−T − bt. By using the Bayes’s rule, this signal and the
prior, they estimate the incumbent ability or effort as:
apt = E(at/gt, T, bt) =µvt + (gt − T − bt)σ
vt + σ(1)
Therefore, voters’ posterior belief on the incumbent’s ability increases with the level of public
goods (gt) and decreases with their expectation on royalties value (bt). In addition, their positive
assessment on incumbent’s quality increases with the variance of both the royalty shock and the
incumbent’s ability. However, they are aware that noisier budget shocks are less informative and
therefore the larger the variance of royalty (vt), the higher the weight attributed to the prior.
A citizen will vote for the incumbent if the expected ability difference between the incumbent
and the challenger plus an idiosyncratic ideological bias for the incumbent δi ∼ U [− 12h ,
12h ] is greater
than zero:
µvt + (gt − T − bt)σvt + σ
+ E(ac) + δi > 0 (2)
9

The value of E(ac) depends on the challenger previous experience. With no track record, the
expected value will equal the average politician ability: E(ac) = µ. In this case, the probability
that the incumbent is reelected is:
PI = Pr
[∑ µvt + (gt − T − bt)σvt + σ
− µ+ δi >1
2
]
PI =1
2+ h(
σ
vt + σ)(gt − T − bt − µ) (3)
Therefore, the royalty shock creates an incumbency advantage which is increasing in the amount
of public goods provided (gt) and decreasing in the variance of the shock (vt) and in the voter
awareness (bt). Since all these values change each period, there is no reason to believe that the
incumbency advantage should be the same across elections.
Now consider the case that the incumbent faces a challenger who is a former mayor and, in
particular, has also run the municipality during the royalty boom. In this case, the voters have a
posterior belief of both candidates and will select the incumbent if:
µvI + aIσ
vI + σ− µvc + acσ
vc + σ+ δi > 0
where ai = gi − T − bi is the ability signal and subscript I and c denotes, respectively, the values
faced by the incumbent and the challenger while in office. Rearranging the terms, I have that the
incumbent’s vote share is:
V S = µ(vI − vc) + σ(aI − ac)− (acvI − aIvc) + δi (4)
In this case, the incumbent’s vote share depends on a combination of his relative performance
while in office aI − ac and on the shock variances that each politician faced. Simple calculations
can show that, everything else constant, the incumbent’s vote share increases with his evaluated
performance while in office (his ability signal aI) and decrease with his opponent one (ac). Note that
equal a do not imply similar levels of publics goods. If voters improve their assessment of royalty
value, i.e., if bI > bc, the actual incumbent needs to provide gI > gc to give a signal of ability
10

similar to his opponent. Finally, note that when the election is between two former mayors, royalty
variance does not clearly reduce the incumbency advantage. Its effect depends on the relative size
of their opponent signal and the average politician ability.10 If the signal that the opponent gave
while in office was sufficiently high, such that ac > µ, the increase in royalty variance will have
a negative effect on the incumbent’s vote share. The intuition is that voters know that higher
variance generate a poor signal of incumbent’s ability and they will them prefer the challenger
whose quality assessment is above average.
3.2 Endogenous Political Entry
The analysis so far considered the entry into politics and the quality of the challenger as exogenous.
The literature on natural resources, however, has emphasized that one of the potential effects of
natural resource abundance is to increase the competition over power (see Caselli and Cunningham,
2007 and Collier, 2007). Therefore, I now turn to discuss the political entry. The discussion is based
on a citizen-candidate framework where any citizen can enter the electoral race if the benefits of
entry exceed the costs. The time of the game is similar to the one described above with the
exception that there is an additional stage between the realization of g and the election, where
citizens decide whether or not to run for election.
In order to incorporate the idea that oil windfall increases power attractiveness, I assume that
there is a private benefit of holding power which is increasing in oil royalty revenue and which I
denote as R(γ). The reader can think in R(γ) as the utility value of all rewards from office, which
include ego-rents and present and future financial compensations. Hence, the citizen in power has
utility V (aj) = g(aj) +R(γ), while ordinary citizens’ utility only depends on g.
Let’s first consider the case where citizen j evaluates whether or not to run against the incumbent
who was benefited by oil windfall. A prospective candidate enters the race if running gives a higher
expected utility, net of entry costs (ε), than not running, i.e., if:
pjV (aj)− pIV (aI) > ε
10To see why note that dV SdvI
= µ− ac.
11

Since the incumbent’s ability is evaluated according to (1) and considering that gt = B(γ) + ai, I
can rewrite the entry decision as:
pj [B(γ) + aj +R(γ)]− pI [B(γ) +µvt + (gt − T − bt)σ
vt + σ] > ε (5)
Rearranging the terms, I have that the probability of running for mayor is equal to:
Pr{aj > (ε+ (pIpj− 1)B(γ)− pjR(γ) +
pIpjapt )} = 1− Φ(A) (6)
where A = [ε + (pIpj − 1)B(γ) − pjR(γ) + pIpjapt − µσ] 1√
σand Φ is the standard normal cumulative
function.
Hence, I have that the higher A, the lower the range of citizens who find worthwhile to run for
office. This implies that the number of citizens who run for mayor decreases with the incumbency
advantage (pI/pj), the entry cost adjusted for the winning probability (ε = εpj
) and the posterior
incumbent’s ability (apt = µvt+(gt−T−bt)σvt+σ
), while it increases with the benefits of holding power
(R(γ)).
Equation (6) allows me to understand the effects of oil windfall on political competition. A
higher γ has two opposite effects on political entry. By increasing the benefits of holding power, it
stimulates entry. However, the oil windfall allows the incumbent to signalize that he is more able
than the average citizen. This, in turn, reduces a prospective candidate incentive to run for mayor
because it reduces his chance of winning (by creating an incumbency advantage) and it increases
the perceived benefit to be governed by the incumbent. The net effect on entry depends, therefore,
on which effect is larger: (pIpj −1)B(γ) + pIpjapt >< R(γ). Note that the oil windfall can only reduces
entry into politics if the incumbent is able to signalize a higher ability, or, equivalent, if the citizens
are sufficiently uninformed on the value of royalty windfall. If the incumbent delivers a level a
public good inferior to voters expectation on royalty value, an incumbency disadvantage emerge
and citizens have a higher incentive to run for office. In this case, royalty effect on political entry
is unambiguously positive.
Finally, note that royalty revenue does not impact the election prospects (pj) of citizens with no
12
track record in power. Therefore, in an open-seat election where no candidates have previous office
experience, the entry decision only depends on R(γ) and on the entry costs (ε). This implies that
open-seat contests in royalty-rich municipalities should be more competitive (in comparison to close-
seat elections in these same municipalities or to open-seat elections in non-benefited municipalities).
This analysis also sheds light on the royalties effects on political selection. If the perceived
incumbent ability is large, only top ability citizens will consider to run for election. In this case
we would see a decrease in the number of political candidates but a increase in their quality.11
On the other hand, when the benefits of holding office are larger than the incumbency advantage,
oil-rich municipalities can experience an increase in competition and an impoverish of the pool of
candidates.
3.3 Discussion
The analysis sketched above considers that voters are not fully informed about the amount of
royalties received by the municipality where they live. This hypothesis is based on the characteristics
of Brazilian oil production and royalty distribution rule, which I believe that challenges voters’
assessment of royalty value. The lion’s share of oil production in Brazil is located offshore and the
inland basis is concentrated in one municipality (Macae).Therefore, voters would be unaware of
this oil windfall unless this revenue is made public by the media, politicians or informed citizens.
Even harder is to voters get informed about the exact amount received. Royalty payments depend
on the oil international price, the exchange rate, production and quality levels of each oil well and
the proximity to oil fields. Therefore, royalty revenue varies a lot across municipalities and along
the years and voters need to update their information frequently. Although they can do that by
assessing the Brazilian Oil Agency (ANP) website, there is evidence, that, at least in the first years
of oil boom, awareness level was quite low. A survey carried out on September 2002 in Campos dos
Goytacazes, the largest beneficiary of royalty rents, indicates that 58 percent of the respondents are
not familiar with the term royalties.12 For whom that mentioned to know the meaning of royalties,
11Note that although in this case the challenger can be more able than the incumbent, his election chances will notbe larger unless he find a campaign strategy to signalize his higher ability to voters.
12Survey of 1,400 respondents detailed at UCAM, Petroleo, Royalties e Regiao, Boletim, Ano 1, Numero 1, Setem-bro/2003.
13

56 percent pointed out that didn’t know where the revenue was being invested.
However, I believe that voters’ awareness have raised along the years and with the increase of oil
windfall. In municipalities where this money represents a key part of total budget, informed citizens,
the media, political challengers and think-tanks should have improved their technologies to disclose
information to the median citizen. Indeed, local initiatives to disclose information on royalty values
have come out since 2004 at least in the largest benefited municipalities. The InfoRoyalties website
was created in June 2004 by a local research center in order to deliver information on royalty
payments and their use. Regional blogs have been posted in order to freely discuss local politics
and public budget. These blogs are nowadays a reference for whom do not trust on local newspapers
which are considered to be political aligned.13
Therefore, I believe that along the years voters have improved their capacity to distinguish luck
and ability. In addition to this learning process, there are two other reasons to believe that royalty
effects on election outcomes should decrease along the years. The variance of the royalty payment
increased with its value due to huge variations in exchange rate and oil international price. In
addition, in the third election after the boom, which took place in 2008, the first pos-boom mayors
(the ones in power in 1997-2000 term) could run again for election. In the municipalities where
these politicians came back, voters needed to choose between two former mayors. In this case, the
effects of royalty payments on incumbent reelection chances are less straightforward and depends
on relative signals and relative shock variance, as shown in equation (4).
To summarize, the conceptual framework discussed above provides the following predictions.
An increase in oil windfall should:
• Increase the investment in public goods.The larger the voters’ knowledge about royalty value,
the higher should be the provision of public goods.
• Generate an incumbency advantage. This advantage is increasing in the amount of public
goods provided and decreasing in the variance of the shock and in the voter awareness.
• Increase political entry and impoverish the quality of political candidates in open-seat elec-
13Roberto Moraes blog is a case in point. Posted for the first time in August 2004, it had more than 1.4 millionreaders since then and had an active role in the 2004 and 2008 election debate.
14
tions.
• Increase or decrease political entry in close-seat elections. The higher (lower) the incumbency
advantage, the larger is the negative (positive) effect on political entry and the positive
(negative) effect on the quality of candidates.
These are the predictions I take to the data using the variation in oil windfall within Brazilian
municipalities and along the years.
4 Empirical Strategy
4.1 Identification Strategy
The main approach to identify the effects of royalties on political outcomes uses longitudinal vari-
ation in the amount of royalties received by municipalities over time. I use data for Brazil’s 5565
municipalities from 1999 to 2008.14 The source of variation over time comes from two sources. First,
benefited municipalities experienced a dramatic increase in royalty windfall due to a combination
of new rules for royalty payments, Brazilian currency devaluation and an upward trajectory in oil
international prices. Figure 2 shows the magnitude of this increase: total payment to municipalities
was R$ 190 million in 1998, increased almost three-fold in only one year and continuously increased
up to R$ 4.4 billion in 2008. Second, approximately 120 cities started to receive rents from oil
royalties or are excluded from the recipient group due to the depletion of an oil-well, new drilling,
the closing of an oil plant or the phase-out of landing places.
Revenue variation allows me to identify the effects of royalties using a difference-in-difference
approach. The estimated equation is:
yit = α+ βRit + δXit + ηi + λt + εit, (7)
where yit is the outcome variable (e.g. public employment and wages, educational supply measures,
electoral outcomes and measures of political competition); Rit is a measure of royalties received by
14Data on the amount paid to each municipality is not available prior to 1999.
15

the municipality, Xit includes city characteristics that vary over time such population and public
revenue, ηi is a municipal fixed-effects, λt is a year effect and εit is the error term. The key identifica-
tion assumption is that after controlling for time-varying city observable characteristics, city effects
and year effects, the variation in royalty revenue is uncorrelated with unobservable citywide shocks
that vary over time. Therefore, fixed municipal characteristics and all geographic characteristics
such as distance to the coast and latitude are controlled in my analysis. In addition, by exploring
variation within municipalities, I can control for aggregate shocks that affect simultaneously all
municipalities, national economic conditions and political institutions and reduce problems with
omitted variable bias which challenge many of the results of the literature based on cross-country
analysis. My approach is different from Caselli and Michaels (2009) who uses variation from 1991
to 2000 and explore a IV strategy where the instrument is the value of oil production. In my
strategy, I focus on annual variation of royalty payments between 1999 and 2008, the period when
the oil boom was most remarkable .
A situation that would violate the identifying assumption would be a skilled mayor who works
to attract oil production plants or build infrastructure for landing offshore oil in order to receive
royalties. In this case, I would see a spurious correlation between oil windfall and an outcome
variable (reelection probability, for example) that is truly caused by mayor ability, which in turn
is omitted from the regressions because I do not observe it and it varies over time.
This example is a concern to the set of municipalities which receive royalty income due to factors
that are not purely exogenous to the local economy. This is the case of municipalities which are
benefited because in their territory is located production plants, transportation sites, harbors used
by the oil industry or are crossed by pipelines. To deal with this problem, I use information on the
determinants of royalty payments to identify municipalities which are not exogenous recipients and
create a restricted sample which do not include these cities. Hence, I present all the results for two
samples: a whole sample which include all Brazilian municipalities and a restricted one composed
by municipalities which are onshore or offshore producers and by non-beneficiary municipalities (to
be used as control). Along the text, I refer to the second group as oil-rich municipalities and use
restricted sample as interchangeable name. As I will show, the results do not change much between
16

samples.
The exclusion of non-exogenous beneficiaries is especially important under the light of denounce
made by a Brazilian newspaper on April 2009 on lobby schemes to influence the amount of royalties
received by municipalities. A consulting firm was accused of intermediating requests for changing
the classification of Angra dos Reis and its neighbor municipalities. Angra dos Reis received
royalties until 2002 due to the location of infrastructure for landing offshore oil. In 2003, ANP
changed it classification to industrial zone which considerably increased their royalty income.
Although this is strong evidence that royalty income can be manipulated by some municipalities,
there is much less scope, if any, for municipalities influence their classification as producers since
this depends on Petrobras and other companies decisions on where to drill. The beneficiary mu-
nicipalities are on average small in terms of population and economic weight, thus I do not believe
(and there is no anecdotal evidence) that they can influence Petrobras’ drill locations. Therefore,
I believe that the assertion that oil windfall is exogenous to local economies is reasonable at least
for the producers municipalities.
4.2 Data
In order to estimate the effects of royalties on economic and political outcomes, I use a large number
of data sources. The identity of municipalities that receive royalties, the value received and the
eligibility status of each municipality is available from the National Oil Agency (ANP) from 1999
to 2008.15 I extend this data in order to be able to include 1996 election in the analysis by using
the information on total payments to local governments from 1995 to 1998 and the eligibility status
in 1999 to estimate the value received by each municipality from 1995 to 1998.16
Data on public finance, including revenues and expenses, are available from Brazil’s National
15The value of monetary transfers informed by ANP corresponds only to the direct transfers made by Brazil’sTreasury to municipalities. Indirect payments related to state quotas and the division of ”special fund” are paid tomunicipalities together with other state and federal transfers according to FPM and ICMS rules and are not reportedby ANP.
16I did the following calculation. I first calculate the percentage value of 1996 total transfers to municipalities inrelation to 1999 figures. I assess that in 1996 municipalities received altogether and in real terms 20.78 percent ofwhat they received in 1999. I then input the 1996 royalty revenue of each municipality as the 20.78 percent of its1999 royalty revenue. The same procedure was used for other years. This calculation is based on the hypothesis thatthe eligibility status between 1995 and 1998 was the same as in 1999.
17

Treasury through a dataset called FINBRA. Information on municipal public employees is from
the the social security registry of all formal workers in Brazil (RAIS), collected by the Brazilian
Ministry of Labor.
Electoral outcome data came from the Tribunal Superior Eleitoral (TSE), which provides elec-
toral information from 1996, 2000, 2004 and 2008 municipal elections. This database contains
information on all candidates running for mayor and city councils which include candidates’ char-
acteristics (gender, education, previous ocupation), party affiliation, and votes. Based on this
information, I constructed measures of electoral competition and performance such as vote shares,
effective number of political parties and margin of victory.
The 2000 population census provides demographic characteristics such as population density
and percentage of urban households which are used as controls in some regressions. I also use
information on the existence of local radio gathered from IBGE municipality survey Perfil do
Municpios Brasileiros: Gestao Publica.
All monetary variables used throughout the analysis have been deflated using IPCA index and
represent real values on 2007 prices.
Table 1 provides the descriptive statistics of some variables from the data set. The first lines
show statistics from royalty distribution. The average value of oil windfall is R$ 75 per habitant per
year but the distribution is highly unequal. Municipalities which are on the 75 percentile receives
R$ 12 per capita per year while the ones in the 99 percentile get R$ 1,515. The number of benefited
municipalities increases along the period analyzed from 792 to 912.
Royalty distribution asymmetry leads me to look at the sub-sample of oil producer municipali-
ties, which receive the lion’s share of royalty payments to municipalities. There were 88 oil producer
municipalities in 1999 and this number increased to 107 in 2008. Among these municipalities, 53
are onshore producers, 41 are offshore producers and 13 have both land and sea wells). These
oil-rich municipalities receive on average R$ 441 per capita per year, which corresponds on average
to 16 percent of their per capita income and to 29 percent of their municipal total revenue (net of
royalties). The size of the windfall is remarkable for the top beneficiary municipalities. The ones
at the 90 percentile of royalty distribution receive 1,255 per capita per year which is equivalent to
18
83 percent of its total revenue and to 46 percent of annual per capita income.
The second part of Table 1 displays means and standard deviations of municipal characteristics,
with information provided separately for three group of municipalities: all royalty recipient, oil pro-
ducer municipalities (onshore and offshore) and non-recipient ones. Benefited municipalities have
characteristics of Brazilian coastal cities: they have larger populations, higher urbanization rate,
more educated population and a larger radio coverage than other Brazilian cities. These municipal-
ities also have higher municipal budget, employ more public employees and have a smaller income
per capita. These differences are even more striking when I compare only oil-rich municipalities to
non-recipient ones (with population and public revenue being the only exceptions), which reflect
the fact that these municipalities are even closer to the coast.
The bottom of Table 1 shows political characteristics of the three groups. These statistics reveal
that benefited municipalities have a higher reelection rate but no difference in the average margin
of victory. On average, benefited municipalities have a higher number of political candidates, but
lower levels of political competition if I compare statistics normalized by the size of the electorate.
The pool of candidates in benefited municipalities is more educated, which should be a reflection
of a higher educated population. Again, these differences are even more striking when I compare
only oil rich municipalities to non-recipient ones.
Overall, Table 1 shows that benefited municipalities are much different from non-recipient ones.
However much of this difference should reflect differences from Brazilian coastal cities and country-
side ones. In the next section, I analyze whether differences in political characteristic persist after
controlling for municipal fixed-effects and observable characteristics.
5 Results
In this section, I test the predictions of the theoretical framework. Subsection 5.1 shows how
municipalities are spending this extraordinary revenue. Section 5.2 analyzes the effects on the local
political environment.
19

5.1 How municipalities are applying royalty revenue?
I begin the analysis by looking at municipal public accounts and investigating how municipalities are
reporting to allocate royalty revenue. Table 2 present the results. Panel A presents the coefficients
from regressions of different types of expenses on total revenue and includes population, year and
city effects as controls. All expenses and revenue values are measured in 1,000 Reais per habitant
and are deflated by the consumer price index, representing 2007 values. The idea is to create a
benchmark and understand how Brazilian municipalities on average allocate their budget. Column
1 shows that local governments spend on average every Real of their revenue, not generating neither
deficits nor surpluses. In columns 2 to 6 regressions, I decompose public expenses. I estimate that
for every Real received, 88 cents are allocated in current expenses,17 while the remaining 12 cents
are used for investments. From the 88 cents used for current expenses, 30 cents or 34 percent
are allocated to the payroll and other direct labor costs, and 17 cents are spent with other types
of labor and service hiring, such as consulting services, outsourced services and labor hired on a
temporarily basis (see columns 3 and 4). On average, municipalities do not allocate money for debt
amortization.
Columns 7 to 11 offer another way to look at budget allocation by examining the destination
of expenses. Expenses with educational and culture are the main destination of local revenues,
receiving 32 percent of total revenue, followed by administration and planning (21 percent), health
and sanitation (12 percent), housing and urbanization (8 percent) and transportation (4 percent).
In Panel B and C I conduct an exercise different from the others in this paper. I use royalties
as an instrument for municipal revenue and them assess the effect of the predicted revenue on
different types of expenses. This gives me the revenue variation caused by royalty rents and allows
me to understand how royalty revenue affects public expenses. The difference between panels B
and C are the sample. Panel B regressions use a sample with all Brazilian cities, while in Panel C I
restrict the sample to only oil producer municipalities and the ones that do not receive any royalty
revenue (to be used as controls). The idea is to exclude all municipalities that receive royalties due
to reasons which may not be exogenous to their economies. The results are quite similar, which
17These include all direct and indirect labor cost, interest payments and other current expenses
20
show that the effects are being driven by oil-rich municipalities, and I describe only the estimates
for this group. In panel C, I estimate that for one Real increase in total budget, 93 cents are spent
in the current year. By looking at expenses composition, we see that municipalities do not apply
royalty rents as the same way they allocate other revenues. Royalty rents promote an increase in all
expenses, but relatively less money is allocated to current expenses and payroll, while investments
receive 27 percent of royalty rents (15 percentage points more than usual). In addition, 0.5 percent
of the extraordinary revenue is used to amortize debt. More interesting is what happens to “other
labor and service contracts” expenses. This budget line receives 25 cents of every Real earned as
royalties, a similar value than the one allocated to investment and a share almost 47 percent higher
than what is usually applied with these expenses.
I interpret this result as a reflection of law restrictions to the use of royalty rents, which do
not allow municipalities to use royalty revenue to hire public employees on a permanent basis. A
way to circumvent this restriction is to hire people through other means. When I disaggregate
“other labor and service contracts” by its components,18 we see that the bulk of this expense is
used to pay for outsourced services provided by companies. This budget line can include several
expenses, including two famous expenses in oil-rich municipalities: free live concerts and labor
hiring through NGOs. Both expenses are usually cited in scandals on the use of public funds on
oil-rich municipalities and have been object of police investigation.19 Finally, the analysis of the
destination of expenses show that municipalities apply similar shares of the revenue generated by
royalties in “housing and urbanization” (21 percent), “health and sanitation” (20%), “education
and culture” (19%), and “adminstration and planning” (18%). This implies that municipalities
report to invest 67 percent more in health and sanitation and 262 percent more in housing and
urbanization when the resources are originated by royalty rents in comparison to ordinary revenue.
On average, municipalities do not use royalty rents to invest in transportation.
18Consulting services, outsourced services and labor hired on a temporarily basis (locacao de mao-de-obra +contrato por tempo determinado).
19In 2008, the federal police arrested 14 people in Campos dos Goytacazes charged of fraud on public procurementto hire outsourced services. In particular, two companies received about R$ 15 million to organize live concerts inthe city with non-famous singers. In addition, Campos dos Goytacazes’ mayor between 2005 and 2008 is chargedof using NGOs and Foundations to divert more than R$ 200 million by hiring 16,000 outsourced employees. See http ://oglobo.globo.com/pais/mat/2008/05/30/ministeriopublicofederalpedejusticaafastamentodos17vereadoresdecampos−546596081.asp
21
This analysis of the destination of expenses are, however, not much informative on the real
provision of public goods. I have two main concerns with this data. First, the simple report that
the municipality spent resources with some expense do not necessary imply that such service has
been delivered is an efficient way. The second concern is related to the fact that data on municipal
public finance are self-declarations of municipal budget to the Brazilian National Treasury and
some municipalities do not report their finances every year. Campos dos Goytacazes, the largest
recipient of royalty rents, for instance, only disclosed information on its public expenses on 2000
and 2006.20 This can limit the capacity of these data to inform how municipalities are investing
royalty rents if oil benefited municipalities have a higher probability of not disclosing their public
accounts. Indeed, a regression of the probability of declaring FINBRA on a dummy on whether the
municipality is an oil producing site (onshore or offshore) shows that producers municipalities have
a 4.5 percentage points lower probability of disclosing their public accounts (result not shown).21
With these caveats in mind, I turn to look to de facto public provision of education, which
is the main destination of municipal revenue. I regress school enrollments and four indicators
of education supply - number of school per habitants between 5 and 19 years old, percentage of
teachers with college degree, percentage of schools with computer and number of school hours per
day - on royalty revenue per capita received in the contemporaneous year. I use the logarithm
of these variables (except by the percentage of teachers with college degree and the percentage
of schools with computer) in order to calculate the percentage variation. I add the following
controls: population, FUNDEF/FUNDEB revenue per capita,22 municipality and year effects.
Table 3 present the results. Panel A, which consider all recipient municipalities, shows that for
each 1,000 Reais received, municipalities increase the number of school enrollments by 4.4 percent,
raise the number of schools per thousand habitants in school age by 9 percent and increase the
percentage of schools with computer by 9 percentage points. There are not statistically significant
20The only record for “other labor and service contracts” is from 2006. In this year, this municipality spent R 387million with these contracts, which corresponds to 31 percent of its total expenses or 122 percent of its payroll.
21This result is not robust to the inclusion of municipalities fixed-effects.22FUNDEF is the acronym for Fundo de Desenvolvimento da Educacao Fundamental (Basic Education Develop-
ment Fund) and is fund composed by municipal, state and federal contributions whose resources are redistributed tomunicipalities according to the number of school enrollments to finance education expenses. In 2007, FUNDEF wasreplaced by FUNDEB.
22

effects on the percentage of teachers with college degree and on the number of school hours per
day.
Panel B redo this exercise in a different sample, considering only municipalities which are
onshore or offshore oil producers and non-recipients municipalities. The point-estimates and the
estimates precision are quite similar.23 Panel B shows that one-standard-deviation increase in
royalty revenue per capita increased the number of school enrollments by 3.3 percent (or 0.06
standard deviation), raised the number of schools per thousand habitants in school age by 7.2
percent (or 0.09 standard deviation) and increased the percentage of schools with computer by 9
percentage points (or 0.24 standard-deviation). All the results present in Table 3 are essentially the
same when I regress the educational indicators on royalties received in the previous year. Hence,
I do not find evidence that municipalities take time to transform royalty revenue in educational
services as shown in Caselli and Michaels (2009).
These results indicate that royalties revenue promoted some improvements in education supply,
but how relevant are them in comparison to the size of the oil windfall? In order to conduct
this calculation, let’s focus on oil producer municipalities, which are the ones most affected by oil
windfall. These municipalities received on average R$ 441 per capita per year between 1999 and
2008. This money allows them to increase the number of schools per 1,000 habitants between 5
and 19 years old by 3.3 percent (R$ 441 x 0.08 percentage increase for every R$ 1000) or to build
0.14 additional schools per thousand young habitants (0.033 x 4.91 (the average number of schools
per 1000 young habitants in 1999)). Considering that these municipalities have on average 24,387
habitants between 5 and 19 years old, my estimates indicate that oil producer municipalities built
on average 3.9 schools. Similar calculations indicate that these municipalities enrolled more 144
children on school and brought computers to 4 percent of schools. The average additional revenue
was about R$ 10.75 million of royalty rents (R$ 441 per capita x 24,387), from which 19 percent
was spent in education and culture according to municipalities’ financial reports (see Table 2).
Thus, oil-rich municipalities used on average R$ 2.15 million to build 3.9 schools (an increase of 3.3
percent), enroll more 144 children on basic education and buy computers to 4 percent of schools.
23The major difference is in relation to the effect on school enrollment which is only statistically different from zeroat 12 percent level when I exclude non-exogenous recipients.
23

In order to have on some indication on whether these impacts are reasonable vis-a-vis their
costs, I rely on a report commissioned by the Ministry of Education in 2003 to evaluate the average
cost per student per year in Brazil’s public schools.24 Updating the estimates for 2007 values, the
report measures the cost per student per year in Brazilian schools as R$ 4,900. This value includes
current expenses (R$ 2082) such as teachers wages and materials and an estimated rent for the
school building, as well as, expenses to provide food to children (R$ 2818 for the last two items).
This implies that the enrollment of more 144 children in school would cost on average R$ 705,600,
or 33 percent of what municipalities report to have spent with education and culture.25 I believe
that these calculations indicate that oil windfall generated modest improvements in education.
Another major object of public expenses is the payroll. I can think in several reasons why mayors
would like to increase public employment or raise wages. First, if they want to improve services
such as health and education, they may need to hire more and higher-skilled people. Second, the
offer of public employment can be an action a politician takes to obtain political support. Voters
may reward more public employment because they have ideological preferences for a larger state,
or because they assess a higher probability of being hired as a public employee, or even because
this is a kind of direct transfer.26
Table 4 look at the impact of royalty revenue in municipal public employment. All regressions
cover the period from 1999 to 2008 and controls for municipal revenue per capita net of royalties,
city and year effects. I again follow the procedure to show the results in panel A for the whole sample
(all Brazilian municipalities) and in panel B for the restricted sample (only oil producers and non-
recipient municipalities). In both panels the sample used is smaller than in other exercises because
24Source: Verhine (2003). This study is based on a sample of 95 schools from 44 municipalities of 8 Brazilian states.The sample is composed by schools which achieved quality standards based on measures of Educational Census andfield research. The sample is not representative of Brazilian schools but I believe they can provide a rough estimateof the costs to provide education in Brazil.
25In this exercise, I am supposing that the new schools were built to enroll these 144 additional children. Hence,the costs of provision of new schools and computers are embedded is this calculation.
26There is a large number of papers which relate patronage and resource-rich economies. Collier (2007) pointsout that ”patronage politics can be a more cost-effective use of public money to attract votes than the provision ofpublic goods, yet it is too expensive to be feasible”. Therefore, I could see more patronage practices in resource-richeconomies just because resource wealth provides funds to bribe voters. Robinson et al (2006) develops a model whichrationalizes why politicians can use patronage defined as public employment in order to influence the outcome ofelections in resource-rich economies.
24

I drop employment record outliers.27 Column 1 present the estimate for the impact of royalties
on the number of public employees. Panel A shows that for each R$ 1,000 per capita received,
municipalities increase the number of public employees by 8 percent (standard error=0.035). If I
exclude non-exogenous recipients (Panel B), I obtain an estimate which is smaller and less precise
(point estimate=0.06 and standard error=0.042). However, a closer look at the data reveals that
this results is driven by one municipality, Quissama, which is the largest recipient of royalty rents
in per capita terms. Quissama is considered in case studies as one that best applies oil windfall28
and, in 2007 and 2008, it reduced the number of municipal employees although it received higher
royalty rents. When I drop Quissama from the sample, the effect on the number of public employees
increases from 0.08 to 0.10 (standard errors of 0.036) in the whole sample and from 0.06 to 0.09
(standard errors of 0.049) in the restricted sample. The results shown in column 1 indicate that an
one-standard-deviation increase in royalty per capita caused an 5 percent increase in the number
of public employees (or a 8 percent increase if I exclude Quissama).
Note that municipalities are forbidden to use royalty income to hire employees in a permanent
basis. However, it is widely believed in Brazil that a large share of royalty rents was used to hire
employees.29 In practice, municipalities have several options to hire more employees: they can
reallocate expenses in order to use the regular budget to pay for the hiring, they can bring in
temporarily employees or they can hire people indirectly, by establishing contracts with companies
which hire people in their place (see note (5.1) on corruption scandals related to this last point).
Since the data on Ministry of Labor only consider direct employees, these results should be viewed
as a lower bound for the effects on royalties on public hiring.
Column 2 in Table 4 shows the results of a regression which assess whether oil windfall has
affected municipal public sector wages. In order to account for differences in price levels among
27Some municipalities declared huge increases or drops in the number of employees or their average salary (morethan ten times from one year to another). I believe that these drastically variations are misreports. I thereforecalculated the annual employment growth and created a dummy variable on whether the municipality has one recordwhich is above the top 1 percent of employment growth distribution or bellow the bottom 1 percent.This excludes1,100 municipalities from the sample. The results are the same when I do not exclude any outlier.
28See Cruz, J.L.V. and Pinto, A.B.M. (2007). ”Quissama: um municıpio petro-rentista”29See, for instance, an article at Estado de Sao Paulo: ”Lucro com petrleo banca farra de
contrataes em municpios” (Oil rents support excessive employment in municipalities), at http ://www.estadao.com.br/estadaodehoje/20080414/notimp156256, 0.php
25

municipalities, I use as measure the ratio between the average wage in public sector and the average
rate in the private sector. The average of this variable is 1.14 in Brazil for 1999-2008 period,
indicating that public employees earn on average 14 percent more than private sector employees.30
Column 2 shows that the increase in public employment was accompanied by an increase in relative
wages. The results are quite similar for both samples. In oil-rich municipalities, a one-standard-
deviation increase in royalty rents increased the relative wage in 0.07 points, which means that
in these municipalities the difference between public and private employees wage is 7 percentage
points higher than in non-recipient municipalities.
Assessing that oil-rich municipalities are using royalty rents to increase public employment and
wages are not enough to understand whether this windfall is being properly used. As discussed,
to pay better wages or to hire more people can be a measure to improve services or can be pure
patronage. In column 3 to 5 I try to shed light on the composition and quality of the payroll
increase. In column 3, I show the results of a regression which estimate the impact of oil royalties
on the percentage of public employees with a college degree. Again, the results are quite similar in
both samples and highly significant. In oil-rich municipalities, a one-standard-deviation increase in
royalty rents promoted a decrease of 2 percentage points in the percentage of public employees with
a college degree. In order to understand the significance of these results, it worth mention that the
public sector in all Brazilian municipalities suffered a boost in the period under analysis. Between
1999 and 2008, municipal employment in per capita terms increased 64 percent (from 22 to 36
employees per 1000 habitants). There was also a major improvement in the average educational
level: the percentage of employees with college degree changed from 7 percent to 25 percent. What
my results indicate, therefore, is that oil-rich municipalities experienced a even starker growth in
public sector and that, although they also improved the educational level of its employees, they
did that in a reduced pace than other Brazilian municipalities. Rough calculations indicate that in
non-recipient municipalities, 55 percent of the new hirings were people with college degree, while
in oil-rich cities 48 percent of the new employees completed college. However, I cannot tell whether
30The relative wage suffered a huge increase in the period under analysis. In 1999, the first year in my sample, therelative wage in Brazil was 0.96. In 2008, this ratio jumped to 1.25. The increase in oil-rich municipalities are evenstarker in the period: it increased from 0.79 to 1.25.
26

this difference is a consequence of intentional decisions of public authorities to hire low educated
people or whether it is a consequence of a supply constraint in the number of habitants with
college degree in oil-rich municipalities.31 What I can tell is that it is not reasonable that oil-rich
municipalities promoted an above average increase in wages to hire a below average proportion of
people with college degree.
Finally, I investigate whether the oil windfall was used to increase the number of professionals
in health and education, which are the two main services provided by municipalities in Brazil.
Column 4 and 5 show that the point estimate of the effect of royalty rents on the number of health
professionals and teachers are negative but the estimates are not statistically different from zero.
Therefore, more employees are being used everywhere but not in health and educational services.
Although the data do not allow me to prove that, it seems that extra employees are being hired to
administrative and bureaucratic services.32 Unfortunately, there is no way to assess if these services
have been improved.
5.2 How royalty revenue is affecting local politics?
The results presented so far indicate that oil windfall was used to hire more public employees and
increase their wages, as well as, to promote some improvements in education supply. The impacts
seem modest in relation to the size of the windfall but they are consistent with the model where
people are poorly informed of the size of the windfall and hence the mayor do not need to promote
a huge increase in public goods supply to be able to please voters. The theoretical framework also
states that mayors should experience an incumbency advantage, which is increasing in the amount
of public goods provided and decreasing in the variance of the shock and in the voter awareness.
I now turn to understand whether oil windfall affected mayors’ reelection outcomes. I look at
the three municipal elections that followed the oil boom which took place in 2000, 2004 and 2008.
31A supply constrain may emerge in two cases. If fewer people in oil-rich municipalities have a college degree,local governments would not be able to hire enough high-skilled people. However, this seems not to be the case sinceeducational level in oil-rich municipalities are higher than in non-recipients ones in year 2000 (4.31 years of schoolingin comparison with 4.07). But even with better levels of education in oil-rich municipalities, a supply constraintwould emerge if the additional public sector demand is more than the additional level of people with college degree.
32I can rule out the possibility that extra employees are being hired to promote security since this is a responsibilityof state governments. Only the state capitals have a police force.
27

I use as royalty measure the amount received in the two years previous to the election divided by
the size of the electorate in each election. I consider only municipalities where the mayor is in the
first-term (and therefore can run for reelection). I use as controls the average characteristics of
mayors’ opponents (years of schooling, age and percentage of men), number of candidates and city
and year effects. Column 1 from Table 5 show the results. The estimates in both samples are very
imprecise and are not statistically different from zero.
However, this results should be interpreted with caution because the use of panel data is chal-
lenged by sample selection issues caused by term-limits and the recent possibility of mayor re-
election. Mayor reelection is only possible in Brazil since 1997 when a constitution amendment
was made allowing mayors, governors and presidents to run one time for reelection. This and the
two-term limit cause the sample of municipalities to be very different among the three elections
analyzed. The first election that followed the oil boom (year 2000) was also the first one which
mayors could run for reelection. Therefore, in this ballot all mayors could run for reelection. In
2004 election, the successful mayors faced a term-limit, what let these municipalities out the sam-
ple. Finally, the results from both 2000 and 2004 elections determine whether 2008 is a close or a
open seat election and, hence, if the municipality is or not on the sample. Figure 1 shows that the
municipalities could have followed five different political trajectories depending on when the mayor
was able to be reelected. If oil windfall creates an incumbency advantage, I will see most of oil-rich
municipalities in group A, which is composed by municipalities which reelected the mayor in 2000
and 2008. But if the incumbency advantage reduces along the years, I would see most of them
in group B. In turn, an incumbency disadvantage effect is in accordance with group D trajectory.
A simple exercise that regress the probability of being in one of these groups against oil royalties
in 1999 and a set of municipal characteristics shows that royalty revenue increase the probability
of being in group A, while decrease the probability of being in groups D and E.33 In addition to
suggest that royalty revenue created an incumbency advantage, this exercise shows that a panel
33In oil-rich municipalities, one-standard deviation increase the royalty revenue raises the probability of followinggroup A trajectory in 23 percentage points (robust standard errors=0.15) and reduces the probability of being ingroup D and E in, respectively 11 and 16 percentage points (robust standard errors=0.05 and 0.07, respectively).These results are from regressions for 1999 which include the following controls: population, population density in2000, urbanization rate in 2000, media presence, area, altitude, latitude and longitude.
28
estimation cannot detect it. Take the example of group A municipalities. They enter the sample
in years 2000 and 2008 and they have a dependent variable which does not vary in this period (re-
election outcome is one in both elections), while royalty rents have dramatically increased. Thus,
municipalities where the incumbency advantage were more pronounced are the one who contribute
to a zero estimate in a panel analysis strategy.
An alternative to overcome this selection problem is to run cross-section regressions, one for
each election, where I compare reelection rates in royalty recipients municipalities and in non-
benefited ones. I use the same royalty measure, the same controls from before but I add additional
ones in order to control for geographic differences such as latitude and altitude.34 The results of
these regressions are present in columns 2 to 4. The results in both samples are very similar and
show a large incumbency advantage. In oil-rich municipalities, a one-standard-deviation increase
in royalty rents raised reelection probability in 11 percentage points in 2000, in 54 percentage
points in 2004 and in 9 percentage points in 2008. These results indicate that mayors from oil-
rich municipalities saw their reelections chances being increased by 28 percent, 128 percent and
17 percent for every one-standard-deviation increase in oil windfall in the three elections which
followed the oil boom. And these results are only averages. If we look what happened at the
top beneficiary municipalities, we see that the probability of they reelect their mayors in 2000 was
almost one.35 The same happen in the few oil-rich municipalities which were governed by a new
mayor between 2001 and 2004. These municipalities on average reelected their mayors in 2004 with
probability one.
I acknowledge that these results are not free from biases. Cross-section estimates cannot control
for unobservable city-effects, what can overestimate the results if oil recipient municipalities have
some unobservable characteristics which increase mayor reelection chances. However, I don’t believe
this is a major challenge to my results because the royalty distribution criteria is quite exogenous
to municipalities’ political and economic environment and the main difference between beneficiaries
34I add the following controls: mayors’ opponents average characteristics (years of schooling, age and percentageof men), number of candidates, media presence, population, population density in 2000, urbanization rate in 2000,altitude, distance to the state capital, area, latitude, longitude and state fixed effects.
35In the list of top ten beneficiaries, 8 reelected their mayor in 2000 and in only one the mayor lost the election (inthe other he didn’t run).
29
municipalities and non-recipients one is the proximity to the coast, which are controlled for with
latitude and altitude regressors.
These results also suggest the incumbency advantage measured in terms of reelection probability
haven’t diminished along the years, what I would expect if voters have improved their capacity to
assess the value of oil windfall. Unfortunately, I do not have any variable of voters’ information
that varies along time to be able to test its effect on the incumbency advantage.
A second group of predictions from my model is related to political competition and selection.
According to my model, royalty effects on political competition is ambiguous and depends on
the relative size of the incumbency advantage and the boost in power attractiveness. Therefore,
royalty impact on political competition needs to be establish by the empirical analysis. I do that by
regressing royalty rents per voter on three different measures of political competition. I cover four
elections in the sample: 1996, 2000, 2004 and 2008. In order to include 1996 election, I estimate
royalty revenue values in 1996 as described in the data section.36 I control for a dummy indicating
whether the mayor is in the first-term, candidates’ average characteristics (years of schooling, age
and percentage of men), population and city and year effects. Regression results are presented in
Table 6. In column 1, I show estimates of the effect of royalties on the logarithm of the number
of political candidates per 1000 voters, which in a measure of pre-election competition. Column
1 indicates that there is a negative effect of royalty rents on political competition. In oil-rich
municipalities, a one-standard-deviation increase in the number of candidates reduces the number
of candidates by 9 percent. According to the model, political competition is reduced because
potential challengers believe that mayors’ reelection chances are too high and decide not to run for
election. Column 2 estimate royalty effect on the logarithm of the effective number of candidates
and find a similar result: in oil-rich municipalities, a one-standard-deviation increase in the number
of candidates reduces the number of effective candidates by 9 percent. Column 3 show the results
of a regression of the royalty rents on the logarithm of the margin of victory which is the difference
in vote-share between the winner and the second runner-up. Contrary to the others, this estimate
is very imprecise and cannot be distinguished from zero.
36The inclusion of 1996 are crucial to the results.
30
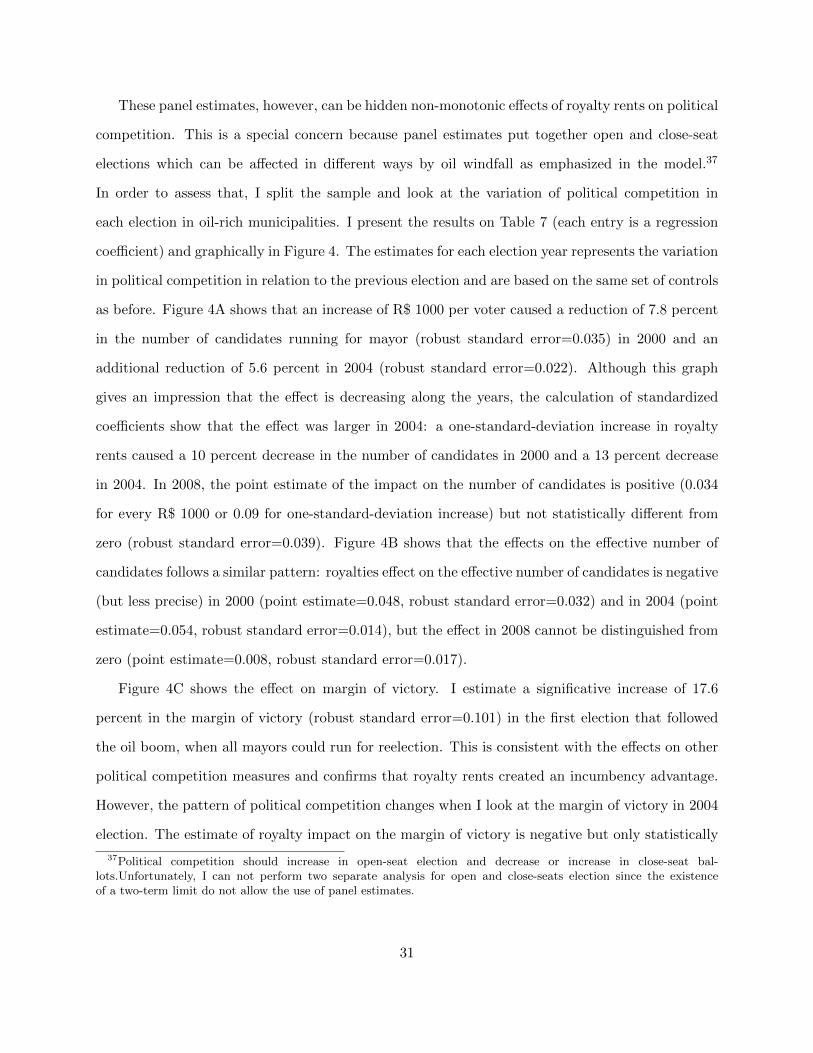
These panel estimates, however, can be hidden non-monotonic effects of royalty rents on political
competition. This is a special concern because panel estimates put together open and close-seat
elections which can be affected in different ways by oil windfall as emphasized in the model.37
In order to assess that, I split the sample and look at the variation of political competition in
each election in oil-rich municipalities. I present the results on Table 7 (each entry is a regression
coefficient) and graphically in Figure 4. The estimates for each election year represents the variation
in political competition in relation to the previous election and are based on the same set of controls
as before. Figure 4A shows that an increase of R$ 1000 per voter caused a reduction of 7.8 percent
in the number of candidates running for mayor (robust standard error=0.035) in 2000 and an
additional reduction of 5.6 percent in 2004 (robust standard error=0.022). Although this graph
gives an impression that the effect is decreasing along the years, the calculation of standardized
coefficients show that the effect was larger in 2004: a one-standard-deviation increase in royalty
rents caused a 10 percent decrease in the number of candidates in 2000 and a 13 percent decrease
in 2004. In 2008, the point estimate of the impact on the number of candidates is positive (0.034
for every R$ 1000 or 0.09 for one-standard-deviation increase) but not statistically different from
zero (robust standard error=0.039). Figure 4B shows that the effects on the effective number of
candidates follows a similar pattern: royalties effect on the effective number of candidates is negative
(but less precise) in 2000 (point estimate=0.048, robust standard error=0.032) and in 2004 (point
estimate=0.054, robust standard error=0.014), but the effect in 2008 cannot be distinguished from
zero (point estimate=0.008, robust standard error=0.017).
Figure 4C shows the effect on margin of victory. I estimate a significative increase of 17.6
percent in the margin of victory (robust standard error=0.101) in the first election that followed
the oil boom, when all mayors could run for reelection. This is consistent with the effects on other
political competition measures and confirms that royalty rents created an incumbency advantage.
However, the pattern of political competition changes when I look at the margin of victory in 2004
election. The estimate of royalty impact on the margin of victory is negative but only statistically
37Political competition should increase in open-seat election and decrease or increase in close-seat bal-lots.Unfortunately, I can not perform two separate analysis for open and close-seats election since the existenceof a two-term limit do not allow the use of panel estimates.
31

different from zero at 16 percent level. This result, although not much precise, indicates a increasing
in political competition in 2004 and a reversing to 1996 mean. In 2008, there is again a positive
and statistically significant effect of royalty rents on the margin of victory. This effect is quite large
and indicates that a one-standard-deviation increase in royalty rents in 2008 caused an increase of
47 percent in the margin of victory (in comparison to 2004 level).
A story which conciliate all these results is the following. Royalty rents reduced the number
of candidates that run for mayor in 2000 and 2004, concentrating political dispute between the
mayor (or his candidate) and a major opponent. However, royalty revenue only clearly facilitated
the victory when the mayor is running for reelection since oil rents allowed them to signal a higher
ability. But when mayors face a term-limit, which occurred in 2004 in most oil-rich municipalities,
his candidate does not enjoy the same signaling advantage and face a more competitive election
with his major opponent. In 2008 election, most mayors were in the first-term, ran for reelection
and succeed. The significant and positive effect of royalty rents on reelection outcomes and on the
margin of victory in 2008 suggests that the incumbency advantage hasn’t been reduced along the
years. Finally, the positive and non-statistically significant effect on the number of candidates on
2008 may indicate that municipalities reached a lower-bound on the number of candidates.
I conclude the analysis by looking at the last prediction of the model. The model states that
a decrease in political competition should be accompanied by an improvement on the candidates’
quality since only high ability individuals would find election prospects worthwhile. I test this
hypothesis by estimating royalties effects on candidates’ average years of schooling. Column 4
of Table 6 show that royalty revenue does not affect this measure of candidates’ quality (point
estimate=0.005, robust standard error=0.008).
6 Discussion and Conclusion
In this paper I empirically assess the political mechanisms which can explain how natural resource
booms affect economic development. I do that by studying the recent boom of oil production in
Brazil and the distribution of oil royalties to approximately 900 municipalities. I first develop a
theoretical model in other to understand oil windfall effects on politicians’and voters’ behavior.
32

In the model, voters know that the municipality receives oil royalties but they cannot perfectly
assess the amount received. Voters can only observe the amount of public goods provided and
they know that this depends on the total revenue and on the incumbent ability, which is not
observed. Therefore, oil windfall allows the incumbent to signal a higher ability and voters respond
by reappointing ore often the mayor to office. The model is extended in order to shed light on
royalty effects on political competition. I show that the number of candidates should decrease in
close-seat elections and decrease or increase in open-seat ballots.
I then use royalty payment variation across Brazilian municipalities and along the years to test
the predictions from the model. The findings can be summarized as follows. Municipalities are
using royalty rents to hire more public employees and pay higher wages. They also promoted some
improvements in education by enrolling more children in school, building some schools and buying
more computers to schools. In this sense, my results differ from Caselli and Michaels (2009) who do
not find any effect on public employment and find only lagged effects on education. I believe that
these differences arise because I look at different periods of analysis and use different data sources.
However, our papers agree by pointing that the living standards improvements are not compatible
to the size of royalty rents.
A corollary of the model, however, is that the increase in the supply of public goods do not
need to be equivalent to the increase in royalty rents in order to satisfy voters. If voters are
poorly informed about royalty values, only modest improvements in public goods are necessary
to create an incumbency advantage. Indeed, this is exactly what I find when I look at election
outcomes. Cross-section estimates show that a one-standard-deviation increase in royalty rents
raises reelection probability by 28 percent in 2000 election, by 128 percent in 2004 ballot and by
17 percent in 2008 election. I present some discussion that voters’ awareness of royalty value could
have increased along the years due to initiatives to disclose information. Although I do not have any
measure of voter’s information of royalty value which vary along the years to test this hypothesis,
my estimates show a slight reduction of the incumbency advantage across the elections. I believe
that information dissemination has in fact increased, but as royalty values also increase a lot, it
was really hard to voters get to know the exact amount of royalty rents and estimate the amount
33

of resources which has being wasted. The analysis of public goods provision and election outcomes
in the next years can help to better understand the effects of royalty rents since for the first time
royalty payments are following a downward trajectory.
The empirical analysis also shows that oil-rich municipalities experienced a decrease in political
competition, which was more pronounced in the first election after the boom. I do not find any
effect of royalty rents on political selection.
Therefore, I find empirical support for some of the theoretical mechanism present by the lit-
erature. In particular, I find some support for the idea that natural resources increase patronage
practices. Although I cannot prove that the increase in employment and wages were given in
exchange for political support, the results that oil-rich municipalities are paying higher wages to
lower educated people and that they are expanding the public sector without increasing the share
of health and educational professionals suggest that a better provision of public services was not
the main objective of public authorities. This work also emphasize the political mechanisms of
the resource curse which has been explored by Robinson et al (2006) and Robinson and Verdier
(2003). The results that mayors are being able to remain in power without promoting great im-
provements in living standards and that less candidates are willing to challenge them suggest that
these municipalities are experience a natural resource political curse.
I still have a great avenue for research. The main open question is where the rest of the money
is going. There are several anecdotal evidence of diversion of public funds. For instance, Campos
dos Goytacazes, which is the largest beneficiary of royalty rents, collects a series of scandals which
include the payment for an extraordinary number of live concerts, several overpriced contracts and
two former mayor investigated by federal police charged of diversion of public funds. Unfortunately,
it is much more difficult to prove corruption than improvements in living standards. Data on
politicians that have their candidature suspended due to charges of malfeasance may help and deal
with this information is the next step in my research agenda.
In addition, as pointed out by Robinson et al (2006), the overall impact of resources booms
on the economy depends critically on institutions such as the ones which promote accountability
of politicians and state competence. In this sense, the Brazilian setting offers a great opportunity
34

since I can compare oil-rich municipalities which face distinct local institutions such as the size of
legislature, electoral reelection and participatory budget systems and the presence of local media.
The comprehension on how institutions determine the extent to which political incentives map into
policy outcomes is crucial and is also in my research agenda.
35

References Acemoglu, D., Johnson, S. and Robinson, J.A. (2001). “The Colonial Origins of Comparative
Development: An Empirical Investigation”, The American Economic Review, 91, No. 5,
December.
Acemoglu, D.; Robinson, J.A.; and Verdier T. (2004) “Kleptocracy and Divide and Rule: A Theory
of Personal Rule”, Journal of the European Economic Association, 2, p. 162‐192.
Baland, J and Francois, P. (2000) “Rent‐Seeking and Resource Booms”, Journal of Development
Economics, 61, p. 527‐542.
Bravo‐Ortega, C. and De Gregorio, J.. “The Relative Richness of the Poor: natural resources,
human capital and economic growth”, in Lederman and Maloney (eds), Natural Resources:
neither curse nor destiny. Palo Alto, CA: Stanford University Press, 2007.
Brollo, F.; Nannicini, T.; Perotti, R. and Tabellini, G. (2009). “The Political Resource Curse”,
unpublished manuscript.
Caseli, F. (2006). “Power Struggles and the Natural Resource Curse”, unpublished manuscript.
Caselli, F. and Cunningham, T. (2007). “Leader Behavior and the Natural Resource Curse”,
unpublished manuscript.
Caselli, F. and Michaels, G. (2009). “Do Oil Windfall Improve Living Standards? Evidence from
Brazil”, NBER Working Paper No. 15550.
Collier, P. The Bottom Billion: why the poorest countries are failing and waht can be done about
it. New York: Oxford University Press, 2007.
Cruz, J.L.V. and Pinto, A.B.M.. “Quissamã: um munípio petro‐rentista”, in: Rosélia Piquet and
Rodrigo Serra (eds), Petroléo, Região no Brasil: o desafio da abundância. Rio de Janeiro:
Garamond, 2007.
Ferraz, C. and Finan, F.(2008). “Exposing Corrupt Politicians: The Effects of Brazil’s Publicly
Released Audits on Electoral Outcomes”, Quarterly Journal of Economics, 123, No. 2.
Goldberg, E., Wibbels, E. and Myukiyehe, E. (2008). “Lessons from Strange Cases: democracy,
development and the resource curse in U.S. States”, Comparative Political Studies, 41, p. 477‐
514.
Gylfason, T. (2001). “Natural Resources, Education and Economic Development”, European
Economic Review, 45, Issues 4‐6, p. 847‐859.
Harber, S. and Menaldo, V. (2008). “Do Natural Resources Fuel Authoritarianism? A reappraisal
of the resource curse”, unpublished manuscript.
Hodler, R. (2006). “The Curse of Natural Resources in Fractionalized Countries”, European
Economic Review, 50, No. 6, p. 1367‐1386.
Humphreys, M.; Sachs, J.; and Stiglitz, J., Escaping The Resource Curse. New York, NY: Columbia
University Press, 2007.
Lane, P. R. and Tornell, A. (1996). "Power, Growth, and the Voracity Effect." Journal of Economic
Growth, 1, No. 2, p. 213‐41.
Leamer, E.E.; Maul, H.; Rodriguez, S. and Schott, P.K. (1999). “Does Natural Resource
Abundance Increase Latin American Income Inequality?”, Journal of Development Economics
59, No. 1, p. 3‐42.
Lederman, D. and Maloney W. F. (editors), Natural Resources: Neither Curse nor Destiny. Palo
Alto, CA: Stanford University Press, 2007.
Leite, C. and Weidmannm J. (1999). “Does Mother Nature Corrupt? Natural Resources.
Corruption and Economic Growth”, IMF, Working Paper 85.
Mehlum, H.; Moene, K. and Torvik, R. (2006) “Institutions and the Resource Curse”, The
Economic Journal, 116, No. 508, p. 1‐20.
Michaels, G. (2007). “The Long‐Term Consequences of Resource based Specialization”,
unpublished manuscript.
Papyrakis, E. and Gerlagh, R. (2004). “Resource‐Abundance and Economic Growth in U.S.”, Nota
di Lavoro 62.2004.
Robinson, J. and Verdier, T. (2003). “The Political Economy of Clientelism”, unpublished
manuscript.
Robinson, J.; Torvik, R. and Verdier, T. (2006) “Political Foundations of the Resource Curse”,
Journal of Development Economics, 79, No. 2, p. 447‐468.
Rodriguez, F. and Sachs, J. (1999) “Why Do Resource‐Abundant Economies Grow More
Slowly?”, Journal of Economic Growth, 4, No. 3, p. 277‐303.
Ross, M. L. (1999). “The Political Economy of the Resource Curse”, World Politics, 51, p. 297‐
322.
Ross, Michael L. (2001) Timber Booms and Institutional Breakdown in Southeast Asia, New
York; Cambridge University Press.
Sakurai, S. N. and Menezes‐Filho, N.A. (2008). “Fiscal policy and reelection in Brazilian
municipalities”, Public Choice, 137, p. 301–314.
Sachs, J. D. and Warner, A.M. (1995) “Natural Resource Abundance and Economic Growth”,
NBER Working Paper n 5398.
Sachs, J. D. and Warner, A.M. (1999) “The Big Push, Natural Resource Booms and Growth”,
Journal of Development Economics, 59, p. 43‐76.
The Economist (2008a). “What Lies Beneath – Is there really an ocean of oil in Brazil?”, April
16th 2008.
The Economist (2008b) “An Economic Superpower, and Now Oil Too”, Apr 17th 2008, print
edition.
Tornell, A. and Lane, P. (1999). “The Voracity Effect,” American Economic Review, 89, p. 22‐46.
Torvik, R. (2002). “Natural Resources, Rent Seeking and Welfare”, Journal of Development
Economics, 67, p. 455‐470.
van Wijnbergen, S. (1984). “Dutch Disease’: a disease after all?”, Economic Journal, 94, No. 373,
p. 41‐55.
Vicente, P. C. (2008). “Does Oil Corrupt? Evidence from a Natural Experiment in West Africa”,
University of Oxford, Working Paper.
Verhine, R. (2006). Custo‐Aluno‐Ano em Escolas de Educação Básica – 2 etapa, Relatório Anual
de Pesquisa. Brasíla: INEP, 2006. Available at
http://www.publicacoes.inep.gov.br/detalhes.asp?pub=4071#
Wolfers, J. (2007). “Are Voters Rational? Evidence from Gubernatorial Elections”, Stanford GSB Working Paper #1730.

Table 1 – Summary Statistics
All royalty recipients
Oil producers
Non‐recipients
Royalty Distribution (R$ per capita) Mean 75 441 Standard error 351 906 p75 12 362 p90 159 1,255 p99 1,515 2,149 Number of benefited municipalities in 1999 792 88
Number of benefited municipalities in 2008 912 107
Royalty / Municipal Revenue without royalties Mean 0.05 0.29 p75 0.01 0.29 p90 0.15 0.83 P99 0.98 2.15
Municipal Characteristics Population 78,398* 76,092* 23,667
(461.156) (273,805) (76,925) Number of voters 50,585* 46,536* 15,761
(320,742) (159,676) (50.531) % urban population 0.60* 0.69* 0.59
(0.24) (0.51) (0.23) Average years of schooling in 2000 3.84 4.31 4.07
(1.46) (1.25) (1.26) Anual income per capita in 2000 2823* 2748* 3408 (2007 real values) Local radio 0.52* 0.57* 0.48
(0.50) (0.49) (0.50)
Number of public employees per 1000 habitants 32* 37* 27 (19) (28) (18)
Budget revenue net of royalties in millions 89.0* 68.0* 21.0 (2007 real values) (687.9) (201.9) (82.6)
Political Characterisitcs Mayor reelected 0.47* 0.51* 0.44 (only first‐term mayors) (0.50) (0.50) (0.50) Margin of victory 0.18 0.18 0.17
(0.20) (0.18) (0.20) Number of political candidates 3.20* 3.49* 2.71
(0.03) (0.07) (0.01) Number of political candidates per 1000 voters 0.28* 0.31* 0.48
(0.23) (0.30) (0.39)
Effective number of political candidates per 1000 voters 0.22* 0.23* 0.41
(0.20) (0.24) (0.35)
Candidates' average years of schooling 12.77* 12.94* 12.13
(2.61) (2.22) (2.95) Note: *Asterisks denote that the mean of this variable in oil‐benefited municipalities is significant different at five percent level
from the mean variable in non‐recipient municipalities.
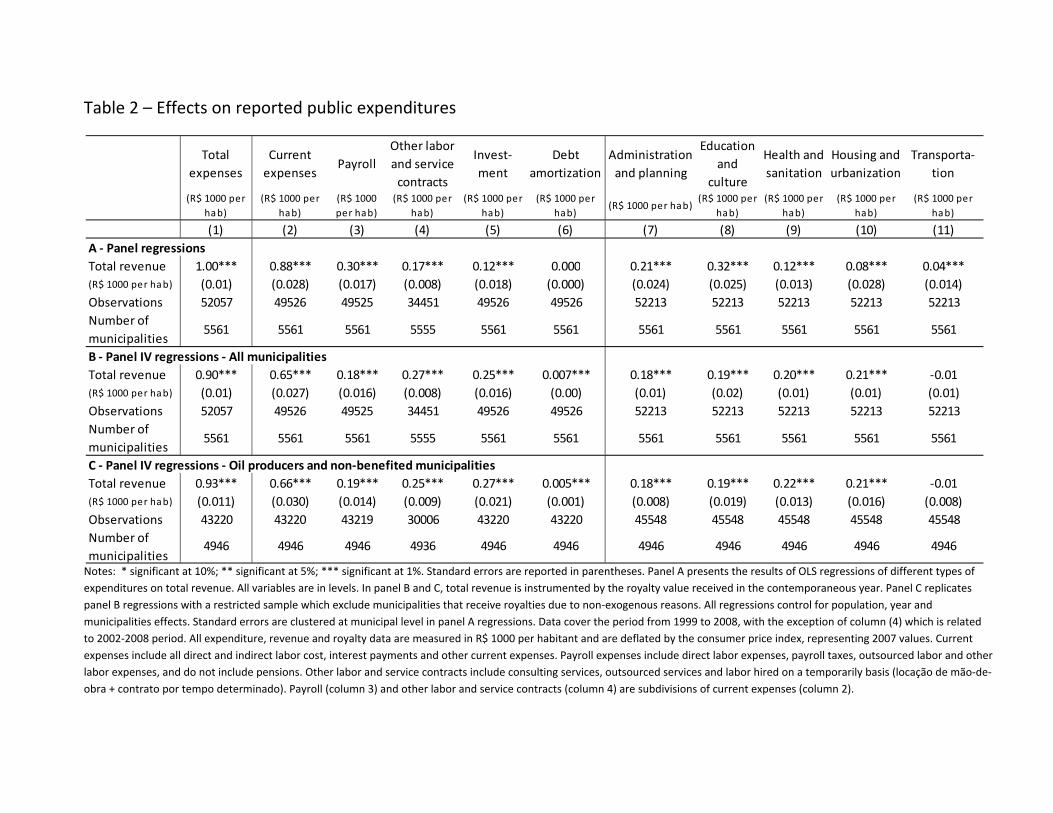
Table 2 – Effects on reported public expenditures
Notes: * significant at 10%; ** significant at 5%; *** significant at 1%. Standard errors are reported in parentheses. Panel A presents the results of OLS regressions of different types of
expenditures on total revenue. All variables are in levels. In panel B and C, total revenue is instrumented by the royalty value received in the contemporaneous year. Panel C replicates
panel B regressions with a restricted sample which exclude municipalities that receive royalties due to non‐exogenous reasons. All regressions control for population, year and
municipalities effects. Standard errors are clustered at municipal level in panel A regressions. Data cover the period from 1999 to 2008, with the exception of column (4) which is related
to 2002‐2008 period. All expenditure, revenue and royalty data are measured in R$ 1000 per habitant and are deflated by the consumer price index, representing 2007 values. Current
expenses include all direct and indirect labor cost, interest payments and other current expenses. Payroll expenses include direct labor expenses, payroll taxes, outsourced labor and other
labor expenses, and do not include pensions. Other labor and service contracts include consulting services, outsourced services and labor hired on a temporarily basis (locação de mão‐de‐
obra + contrato por tempo determinado). Payroll (column 3) and other labor and service contracts (column 4) are subdivisions of current expenses (column 2).
Total
expenses
Current
expensesPayroll
Other labor
and service
contracts
Invest‐
ment
Debt
amortization
Administration
and planning
Education
and
culture
Health and
sanitation
Housing and
urbanization
Transporta‐
tion
(R$ 1000 per
hab)
(R$ 1000 per
hab)
(R$ 1000
per hab)
(R$ 1000 per
hab)
(R$ 1000 per
hab)
(R$ 1000 per
hab)(R$ 1000 per hab)
(R$ 1000 per
hab)
(R$ 1000 per
hab)
(R$ 1000 per
hab)
(R$ 1000 per
hab)
(1) (2) (3) (4) (5) (6) (7) (8) (9) (10) (11)
A ‐ Panel regressions
Total revenue 1.00*** 0.88*** 0.30*** 0.17*** 0.12*** 0.000 0.21*** 0.32*** 0.12*** 0.08*** 0.04***
(R$ 1000 per hab) (0.01) (0.028) (0.017) (0.008) (0.018) (0.000) (0.024) (0.025) (0.013) (0.028) (0.014)
Observations 52057 49526 49525 34451 49526 49526 52213 52213 52213 52213 52213
Number of
municipalities5561 5561 5561 5555 5561 5561 5561 5561 5561 5561 5561
B ‐ Panel IV regressions ‐ All municipalities
Total revenue 0.90*** 0.65*** 0.18*** 0.27*** 0.25*** 0.007*** 0.18*** 0.19*** 0.20*** 0.21*** ‐0.01
(R$ 1000 per hab) (0.01) (0.027) (0.016) (0.008) (0.016) (0.00) (0.01) (0.02) (0.01) (0.01) (0.01)
Observations 52057 49526 49525 34451 49526 49526 52213 52213 52213 52213 52213
Number of
municipalities5561 5561 5561 5555 5561 5561 5561 5561 5561 5561 5561
C ‐ Panel IV regressions ‐ Oil producers and non‐benefited municipalities
Total revenue 0.93*** 0.66*** 0.19*** 0.25*** 0.27*** 0.005*** 0.18*** 0.19*** 0.22*** 0.21*** ‐0.01
(R$ 1000 per hab) (0.011) (0.030) (0.014) (0.009) (0.021) (0.001) (0.008) (0.019) (0.013) (0.016) (0.008)
Observations 43220 43220 43219 30006 43220 43220 45548 45548 45548 45548 45548
Number of
municipalities4946 4946 4946 4936 4946 4946 4946 4946 4946 4946 4946

Table 3 – Effects on Educational Supply
School enrollment per 1,000 young
habitants (log)
Number of schools per 1,000 young habitants (log)
Percentage of teachers with college degree
Percentage of schools with computer
Number of school hours per day (log)
(1) (2) (3) (4) (5)
A‐All municipalities
Royalties 0.044* 0.09*** 1.43 0.09*** 0.005 (R$ 1,000 per capita) (0.023) (0.02) (1.80) (0.03) (0.005)
Observations 40871 40871 40018 40871 40879
Number of municipalities 5475 5475 5476 5475 5476
B‐ Only producers and non‐recipient municipalities
Royalties 0.037 0.08*** 2.44 0.10*** 0.006 (R$ 1,000 per capita) (0.024) (0.02) (2.19) (0.02) (0.01)
Observations 35681 35681 34928 35681 35689
Number of municipalities 4858 4858 4859 4858 4859 Notes: * significant at 10%; ** significant at 5%; *** significant at 1%. Standard errors are clustered at municipal level and reported in parentheses. Each column reports royalty
coefficients of a regression on the dependent variable listed in the column. Panel A regressions include all Brazilian municipalities. Panel B include onshore and offshore producer
municipalities and non‐benefited ones and excludes municipalities which receive royalties due to non‐exogenous factors. Young habitants in columns 1 and 2 refer to population
between 5 and 19 years old. All regressions control for population, FUNDEF per capita revenue, year and municipality effects. Data cover the period from 1999 to 2006. Royalty
payments are the value received in the contemporaneous year, are measured in R$ 1000 per habitant and are deflated by the consumer price index, representing 2007 values.

Table 4 – Effects on Public Employment
Number employees per 1,000 hab (log)
Average relative wage (log)
Percentage of employees
with a college degree
Number of health
professionals per 1,000 hab
(log)
Number of teachers per 1,000 hab (log)
(1) (2) (3) (4) (5)
A‐All municipalities
Royalties 0.08** 0.071** ‐0.024*** ‐0.08 ‐0.02
(R$ 1,000 per capita) (0.035) (0.028) (0.007) (0.072) (0.064)
Observations 41566 41174 29153 35259 39642
Number of municipalities 4457 4430 5558 4385 4443
B‐ Only producers and non‐recipient municipalities
Royalties 0.06 0.083*** ‐0.021*** ‐0.07 ‐0.08
(R$ 1,000 per capita) (0.042) (0.031) (0.008) (0.068) (0.063)
Observations 36243 35852 25477 30693 34503
Number of municipalities 3963 3936 4938 3881 3949 Notes: * significant at 10%; ** significant at 5%; *** significant at 1%. Standard errors are clustered at municipal level and reported in parentheses. Panel A regressions include all
Brazilian municipalities. Panel B include onshore and offshore producer municipalities and non‐benefited ones and excludes municipalities which receive royalties due to non‐
exogenous factors. . All regressions control for municipal revenue per capita net of royalties, year and municipality effects. Data cover the period from 1999 to 2008. Royalty payments
are the value received in the contemporaneous year, are measured in R$ 1000 per habitant and are deflated by the consumer price index, representing 2007 values. Number of
employees in column 1 relates to all employees hired by the local municipality. Average relative wage is the ratio between public and private sector wages. Health professionals in
column 4 refer to any professional hired by local authorities who provide medical services. Teachers in column 5 include all professionals hired by local authorities who teach in any
educational grade. It includes professionals with different levels of education and school inspectors.

Table 5 – Effects on reelection outcomes
Panel 2000 2004 2008
(1) (2) (3) (4)
A‐All municipalities
Royalties 0.018 0.091*** 0.188*** 0.035***
(R$ 1,000 per voters) (0.032) (0.021) (0.056) (0.013)
Observations 12609 5388 3163 3933
Number of municipalities 5551
B‐ Only producers and non‐recipient municipalities
Royalties ‐0.033 0.089*** 0.226*** 0.033**
(R$ 1,000 per voters) (0.036) (0.021) (0.058) (0.016)
Observations 11016 4753 2781 3362
Number of municipalities 4930
Mean characteristics of incumbent's challengers
Yes Yes Yes Yes
Municipal characteristics No Yes Yes Yes
Municipal dummies Yes No No No
State dummies No Yes Yes Yes
Year dummies Yes No No No Notes: Column show royalty coefficients of regressions where the dependent variable is a dummy variable indicating whether the mayor was reelected. The sample includes only
municipalities where the mayor is in the first‐term (and therefore can run for reelection). Royalty payments are measured by the amount received in the two years previous to the
election divided by the size of the electorate (R$ 1000 per voter) and are deflated by the consumer price index, representing 2007 values. Column 1 regression controls for the average
characteristics of mayors' opponents (years of schooling, age and percentage of men), number of candidates and city and year effects. Column 2 to 4 regressions control for mayors'
opponents average characteristics (years of schooling, age and percentage of men), number of candidates, media presence, population, population density in 2000, urbanization rate in
2000, altitude, distance to the state capital, area, latitude, longitude and state fixed effects. Panel A regressions include all Brazilian municipalities. Panel B include onshore and offshore
producer municipalities and non‐benefited ones and excludes municipalities which receive royalties due to non‐exogenous factors. Data cover 2000, 2004 and 2008 elections. *
significant at 10%; ** significant at 5%; *** significant at 1%. Standard errors are reported in parentheses and are clustered at municipal level in column A.

Table 6 – Effects on political competition and selection
Number of candidates per 1,000 voters (log)
Effective number of candidates per 1,000 voters (log)
Margin of
victory (log)
Candidates' average years of schooling (log)
(1) (2) (3) (4)
A‐All municipalities
Royalties ‐0.049*** ‐0.048*** 0.023 0.000
(R$ 1,000 per voters) (0.009) (0.013) (0.031) (0.007)
Observations 20067 20064 19966 20147
Number of municipalities 5559 5559 5559 5559
B‐ Only producers and non‐recipient municipalities
Royalties ‐0.047*** ‐0.045*** 0.012 0.005
(R$ 1,000 per voters) (0.010) (0.013) (0.035) (0.008)
Observations 17515 17512 17438 17588
Number of municipalities 4941 4941 4944 4944 Notes: Panels A and B show royalty coefficients on the dependent variable indicate in each column. Column 1 dependent variable is the logarithm of the number of candidates who run for mayor normalized by the number of voters. Column 2 dependent variable is the logarithm of the effective number of candidates who run for mayor normalized by the number of voters. The effective number of candidates is computed by dividing one by the Herfindahl index. Column 3 dependent variable is the logarithm of margin of victory, which is the difference in vote‐share between the winner and the second runner‐up. Columns 1 to 3 regressions control for an indicator variable for whether the mayor is in first‐term, candidates’ average characteristics (years of schooling, age and percentage of men), population and year and municipality effects. Column 4 controls for an indicator variable for whether the mayor is in first‐term, population and year and municipal effects. Panel A regressions include all Brazilian municipalities. Panel B include onshore and offshore producer municipalities and non‐benefited ones and excludes municipalities which receive royalties due to non‐exogenous factors. Data cover four elections: 1996, 2000, 2004 and 2008. Royalty payments are measured by the amount received in the two years previous to the election divided by the size of the electorate (R$ 1000 per voter) and are deflated by the consumer price index, representing 2007 values. * significant at 10%; ** significant at 5%; *** significant at 1%. Standard errors are clustered at municipal level and reported in parentheses.

Table 7 –Effect on political competition by election in oil‐rich municipalities
Panel (1996‐2000)
Panel (2000‐2004)
Panel (2004‐2008)
Number of Candidates per 1,000 voters (log)
‐0.078** ‐0.056** 0.034 (0.035) (0.022) (0.039)
Effective Number of Candidates per 1,000 voters (log)
‐0.048 ‐0.054*** 0.008
(0.032) (0.014) (0.017)
Margin of victory (log) 0.176* ‐0.129 0.176***
(0.101) (0.093) (0.056) Notes: Each entry represents the royalty coefficient of a regression of the dependent variable indicated in the line on royalties received in the two years previous to the election per
1000 voters, an indicator variable for whether the mayor is in first‐term, candidates’ average characteristics (years of schooling, age and percentage of men), population and year and
municipality effects. Line 1 dependent variable is the logarithm of the number of candidates who run for mayor normalized by the number of voters. Line 2 dependent variable is the
logarithm of the effective number of candidates who run for mayor normalized by the number of voters. The effective number of candidates is computed by dividing one by the
Herfindahl index. Line 3 dependent variable is the logarithm of margin of victory, which is the difference in vote‐share between the winner and the second runner‐up. The sample only
include oil‐rich municipalities and cities which do not receive royalties. Data cover four elections: 1996, 2000, 2004 and 2008. * significant at 10%; ** significant at 5%; *** significant at
1%. Standard errors are clustered at municipal level and reported in parentheses.

Figure 1 – Example of royalty distribution rule
Notes: Lines represent the orthogonal and parallel lines used by ANP to determine which municipalities is in front at each oil field. White dots represent oil wells. Source: ANP (2001). Guia dos Royalties e do Gás Natural.
Figure 2 – Municipal Share of Oil Royalties: 1995‐2008 (R$ 2007 million)
010
0020
0030
0040
00R
oya
lties
(R
$ m
illio
n)
1995 1996 1997 1998 1999 2000 2001 2002 2003 2004 2005 2006 2007 2008

Figure 3 – Political trajectories
1996 Term 2000 Term 2004 Term 2008 Term Group
open‐seat
1 close‐seat
2 open‐seat
1 close‐seat
2 A
1 B
1 close‐seat
2 open‐seat
1 C
1 close‐seat
1 D
2 E

Figure 4 – Effects on political competion by election
A - B -
C -
Note: Graphs show royalty coefficients and their confidence intervals of
the regressions described in Table 7. Each estimate corresponds to the
variation in relation to the previous election.