Embed Size (px)
Citation preview

•
I•
RESIDUAL STRESS AND THE COMPRESSIVE PROPERTIES OF STEEL
Progress Report
RESIDUAL STRESSES IN WIDE-FLANGE BEAMS AND COLUMNS
by
A~ W. Huber
This work has been carried out as a partof an investigation sponsored jointly by theColumn Research Council, the PennsylvaniaDepartment of Highways and Bureau of PublicRoads, and the National Science Foundation o
Fritz Engineering LaboratoryDepartment of Civil Engineering and Mechanics
Lehigh UniversityBethlehem, Pennsylvania
July, 1956
Fritz Laboratory Report No o 220A o 25

The scope of the investigation upon which this report
is based was to determine whether the magnitude and distribution
of cooling residual stresses in wide-flange beams and columns
are a function of shape 9 material properties and manufacturing
conditions. Further the residual stresses due to cold bending
wer~_investigated, as well as the cooling residual stresses and
the plastic deformation during fabrication o
This report shows that, within satisfactory engineering
accuracy, the prediction of residual stresses is possible.
Further, data on the residual stresses are presented.

..
..1. INTRODUCTION
TABLE OF CONTENTS
o 0 0 a 0 0 0 0 0 0 o 0 • 0 0 • 0 .00 1
2. THEORY 00.00 000 • 0 0 • • 0 • • 0 0 0 0 0 3
2 0 1 General derivation o~ Residual StressRelationships in Beams
(a) Linear Stress-Strain Relation
(b) Non~linear Stress Strain Relation
2~2 The Formation of C~oling Residual Stresses(a) Formation of Residual Stresses in a Plate(b) Examples of Residual Stresses in WF Shapes
2 0 3 Residual Stresses Due To Pl~stic Deformation
• EXPERIMENTAL INVESTIGATION 0 .0' .0.0. • 0 • ~21
.. 3 0 1 Description of Residual Stress Measurements
302 Test Results
4 0 DISCUSSION. OOOOOOGOOOO ••••••• • • o· 24
SUMMARY o • 0 0 0 00000 OOGO.O ••••••• 30
ACKNOWLEDGMENT 0 • 0 0 0 coo 0 0 • 0 .. • • • • • • 0 32
70 REFERENCES 0 0 0 0 0 • 0 • 0 • • • • • •.• • • • • • • • 33
NomenclatureSome theoretical considerations withrespect to the measuring techniqueTablesFigures..
8 0 APPENDIX.
8 0 18 0 2
80 38 0 4
o • 0 • 0 • • • 0 0 0 0 0 • 0 • • •

220A.25
I N T ROD U C T ION
When a structural member such as a WF=column
-1
..
..
..
..
or I-beam is subjected to uneven cooling, cold-bending
or welding during production the finished product will have
internal stresses, although no external forces are applied.
If a member which contains residual stresses is loaded
progressively, stresses due to the loads and residual stresses
are superposed and certain portions of the cross-section
will reach the yield point at a lower load than would be the
case if no residual stresses were present. In the load
deformation relationship, the effect of residual stresses
will be expressed by a higher rate of increase in deformations.
So far the observations have been very general.
It has been shown that the ultimate strength of beams is not
affected by the presence of residual stress, although
deflections are increased near the ultimate 10ad.(l,4)
However, in columns, residual stresses lower the ultimate
strength and for this reason their evaluation is of
great importance. (1) (9) (11)
formation of residual stresses due to permanent deformation
during cooling and plastic deformation during fabrication, and
to their magnitude and distribution. Cold bending processes

..
..
220A.25-2
and their effects will be considered, and data will be shown
for the estimation of the magnitude and distribution of the
resulting residual stresses o Their influence on axially
loaded columns will be considered in a later report.. The
reader is also referred to the list of references o *
*Beams are discussed in Ref.. (1) (4) (5); Columnsin Ref .. (1) (9) (10) (12)

..
! 1'.
•
220A.25 ~3
2 0 T. H E 0 R Y
2 0 1 General Derivation of Residual Stress Re1ationshi~ in Beams
(a) Linear Stress =Strain Relation
If the fibers of a long beam are subjected to a non~
linear strain distribution, an internal stress system is
necessary to satisfy both equilibrium and compatibilityo
The corresponding strains, E. 9 could be due to such causes
as uneven temperature distribution~ or deformations beyond
the elastic limit of the material o A solution will be sought
only for the interior of the beam o
The assumptions for the derivation are the same
as used in the strength of materials ioeo .the material is"~
homogenous and isotropic, the fibers follow the same stress-
strain curve as the material exhibits in simple tension and
compre"ssion, previously plane cross-sections remain plane after
deformation of the beam and the stress-strain relationship
is linear and identical in tension and compression o
Let us consider the fibers of a beam of arbitrary
cross-section as shown on Fig o lao If the fibers are free to
expand individually due to any of the causes listed above,
the condition of continuity at the ends will be viblated o
To make all fibers equally long~ stresses will
have to be introduced at the ends to counteract tpe various
elongationso The strains will be constant along the length
of each fiber (Fig~ lb) Now the fibers should be consideredo
to act together o At the ends of the beam, however, boundary
conditions require zero magnitude of stresses o To remove the

..
violation of the boundary conditions" stresses of opposite
sign have to be superposed~ which is a legitimate procedure
in the theory of elasticity (5)(Fig o lc)o According t9
St o Venant's principle these superimposed boundary stresses
will become linearly distributed a sufficient distance away
from the endso(5) For the' residual stress in the interior
of the beam we may then write the following equationg
0; = E [i -. (n +.px +c ~~ (1)
where the second term is the expression for a plane strain
distribution o Equilibrium requires that the following set
of equations be satisfied:
..
• (2 )
With the aid of the equations (2) we can find the three
unknowns a" b, and c in equation (lL
j <r;. dA =.£ E [Eo - (a+ bx + C.:J)J d A = 0
jE£dA- c:JEdA -:-bfExdA -clEjdA=O'4 ~ ~ ~-
If we choose the coordinate system such that the last two
integrals become zero (for E constant for all fibers" thebe
. origin would/identical with the center of gravity of the
section), "ali can be determined directly from the expression..
• Q=1EfdA
.hf dAand
From the second of equations (2)

220A.25....5
1<J;- x d A 1E [£ X .-. (Q x -+ b x2 +C j x)J etA = 0
JEt..)< d A - ojE >< dA - '=IE x' etA - c;E 'j d A -= 0(3)
If K is consta.nt for all fibers 9 the last two
integrals in equation (3) express simply the moments of
inertia multiplied by Eo
Using the third of equations (2)? another equation
similar to equation (3) is obtained. Writing {:=.J.Elj2.dA.af\d~'~j)
the following simultaneous equations can be solved forb and c.
•
b:L- cJ ==01 ~1 .
bJ -cJ ==-0'K.y )(
(4 )
a? b? and c back into equation (1)
(x ~ - y Iy)j.EE. x dA + (VJy - x f y)..[ E£ ya1J J - Jl.X Y x.y
(4) is very similar to the general beam
Finally sUbstituting
_ [ JEf,dA(J,.. - E E. 1
E. d4i4
Equation
bending equation. For axial symmetry of the section and
of the strain distribution, £ ? only the first two terms of
equation (4) remain~ which means that no rotation of the
strain plane occurs (Fig. ·ld) 0,
..
I .
If £ is linear of the form £ ~ d + ex + f:y equation (1)
takes the form
~ = E [Cd-a) + {e-b).x. + (t-c)y]
substituting into equation (2) a, b J and c can be determined.
a=d )~b=e. 1 c.-=f;This result is important because it shows that no
residual stresses will result from a linear distribution

in order that residual stresses may form o..
220A.25
of strains o
--6
There must be non=linearity of applied strain
•
An important engineering material, steel, has a
. stress-strain relation that agrees ,..;e1l \..rith the assumptions
made o However? beyond the yield point tb.6 strains increase
while the stress remains constant (Fig o 2)0 Unloading
follows again a linear law at the same modulus of elasticity
as in loading o
Next 9 the strain 9 E., in equation (1) will be assumed
to be such that the yield point was exceededo Then equation
(1) takes the form
() -r
0; = E [c:. -(a' -t- b1x +
[y - E( C1' +- b)(
(6 )
•
Equations (5) together with the equilibrium equation (2)
will be sufficient to solve the problemo A closed general
solution cannot be given without specifying the strain, E ,.
and the shape of the bea.m o
If c· is assumed to be a linear bending strain 9 E to
be constant for the elastic region, and the x and y-axes to
be axes (It' syrimletry for the section, a relatively simple
solution results (Fig o 3)0 Considering the applied stress to
be made up of an elastic stress, E£ , minus the stress that
is in excess of the yield point, EEu , we can rewrite equation
(4) as follows:
a- = E E. - T'Y (fE E- '-( d A -.l ~ £' Ya A)r -.c :-of A,-
a;. : o-y - f (.( E £ l' d A -;; E. t: I VdA)~ l

(y ~ 1",)(y ~ 1';) (7)
permanent strain, l.',
..
..
220A.25
where the first of equations (6) applies in the area, AI' and
the second in the area, A29 of the cross-section& The
fibers in the area,'A2' have been deformed permanently to,
the strain, E & Equation (6) can be si~plified further, when
it is recognized thatg
.1 jE£ydA - EE1 A~ ,
Since the left side represents elastic bending stress which
is equal to Ec. , Then(Jr=.:t..j E£'ydA ,
II( "2. YI'V' = -E,E ' + - Et:'ydA
r .Ix 1'\ 1-
Equation (7) indicates that only the
causes residual stress& This result is important and will
be useful in later developments o
(b) Non=linear Stress=Strain Relation
In order to study the in~luence of the stress=strain
relation on the forma ti,aTL CiT: :Be"Sidual stresses, dueto,
bending, a general stress-strain law will be considered
infuis section o The basic assumptions are the same as beforee,
Loading follows a non=linear law, but unloading is again
assumed to be under a constant slope, E, a behavior typical
for materials in engineering useo The discussion will be
limited to beams where the y=axis is an axis of symmetry
(Fig 0 4) 0 Similar to the previous development'... we,;pan'ittl'ite
the residual stresses as the summation of applied stress, 0(£),
axial stress, ~a, and bending stress 0b
(,J
-0"':b

220A.25
where the axial stress is given by~
0;::= ~ffJ{C;.)dAi4 .
and the bending stress must satisfy the equationg
-8
•
..
..
J a-(£)ydA = J: ~ y ciAA A
In accordance with the assumption of linear bending
strain·'distribution, the axial and bending strains are
linear 0
In the.special-case of beam bending followed by
utrr6ading~ eq'uat:ton (8) can be written in a more specific
_ form because (Jb will be linear, and
The problem that was solved by equation (7) could
also be solved by equation (9) since the stress-strain
relation of Fig 0 2 is non-linear for strains greater than £; Yo
Application of the equations developed in this
section will be made in t he following sections 0
20 2 Formation of Cooling Residual stresses
Hot rolled steel beams and columns are widely
usediin many types of engineering structures. It is also
known that such members contain residual stresses o Some
of these stresses are due to non=uniform cooling during
the production process o Others are due to fabrication
operations, such as the stresses due to cold bending which will
be treated in Section 2 0 30

220A.25-9·,
•
The behavior of a plate during 'cooling will now
be analyzed" This will be followed by a presentation of
typical examples of cooling residual stresses"
(a) Formation of Residual stre~~~~ in ~ Plate
A long plate (cross section shown in Fig" 5) is
cooled from a unifrom ~~highVO temperature 9 To" Residual
stresses will be set-up due to the temperature gradient in
the material" These stresses will be a function of time o
Of particular interest is the distribution of residual stress
after the cooling of the plate to a uniform temperature"
At first the temperature distribution must be known
for any time 9 to The assumption is made that the thermal
diffusivitY9 a2 , and thermal conductivity, k, are independent
of temperature" It is further assumed that Newton's law of
cooling is applicable ioe., the rate of heat emission is
proportional to the difference in temperature between the
surface and the surroundings., (6) For convenience the latter
can betaken as zero 9 since only relative temperatures are
required"
The partial differential equation of non-stationary
•heat flow is
(10)
• The boundary conditions are
(11)
where C" and h are constants 9 and n is a direction normal to

220A,25
the surfaceo
-10
The subscript s refers to the surface of the
plate o The rate ,of heat emission per unit area is given by (6)
d~ == c. 1;.cit . = - K(Q T)a n 5
For one~dimensional heat flow equation (10) can be solved
readilyo For two=dimensional flow a product solution will
be used~ which is made up of the solutions of one=
dimensional flow for the x and for the y direction o W~ can
then write
(12)
where A is a constant o
Taking the partial differential of Eqo 12 on the one hand and
on the other.~ sUbstituting back into equation (10) we obtain:
aT "".- Go 'T '2 T-' -, + O_'z.T = Q (~, 1: + 0_2. T\ (\3)'0 "t~. 0 t I . '"C) x:z. .. 2. 0 Y 2. I)
Since d1; = Q< o£ I, 9 and 0 Tz. :: a2.o"'7; Eqo 13 is identically6't 0 x~ '0 t '0 y"9.
satisfied and ,equation 12 is a solution o
From equation "(12)' for t ... Og To f!'!/ AT o2 and it ~-1To
•
A solution for one~>dimensional flov.! is given by
the seriesg
(14)
In reference (11) the solutions for one=dimensional heat
flow in infinitely long plates are tabulated o With the aid
of these tables the temperature for any point can be obtained·
with relative ease from Eqo (12)0 In order to simplify

220A.25 ~ll
subsequent calculations the temperature distribution across
the thickness was replaced by the mean temperature o
Now that the temperature distribution as a function
of time has been determined the magnitude and distribution
of residual stresses due to cooling can be investiga;ted o. Due
to the temperature differences in the plate 9 non-linear
strains will be produced which may be computed from the
(16)
T(~, 'I' t)
joct
dT'
T(o,o,t)
Of course, the material properties such as the modulus of
expression:
•
•
elasticity~ E~ the coefficient of linear expansion ' oCt ~
and the yield point, a; , must be known as functions of
temperature o It is also assumed that stresses and strains
are proportional JlP to the yield poi,nt and that from here on
the material is ideallyplastic o For the particular plate
that is analyzed below, the assumed temperature relationships
of the material properties are shown in Figures 6b~ 6c and 6d.(13)
Equation (15) is readily evaluated for the linear relation-
ship ofQ(t shown in Figure 6c o From the temperature dis
tribution, as plotted for a particular plate in Figure.6e~ the
strains, E. , can be computed from equation (15)0 Figure 6f
shows a plot of the strain distribution over one half of the'
plate width o The basic equation (4) for residual stresses
• was derived in section 2 0 1 0 This equation may now be used to
calculate the residual stresses in the plate for any desired
timeo At first the strain distribution as shown in Fig o 6f
i. "
220A.25-12
(16)
•
•
•
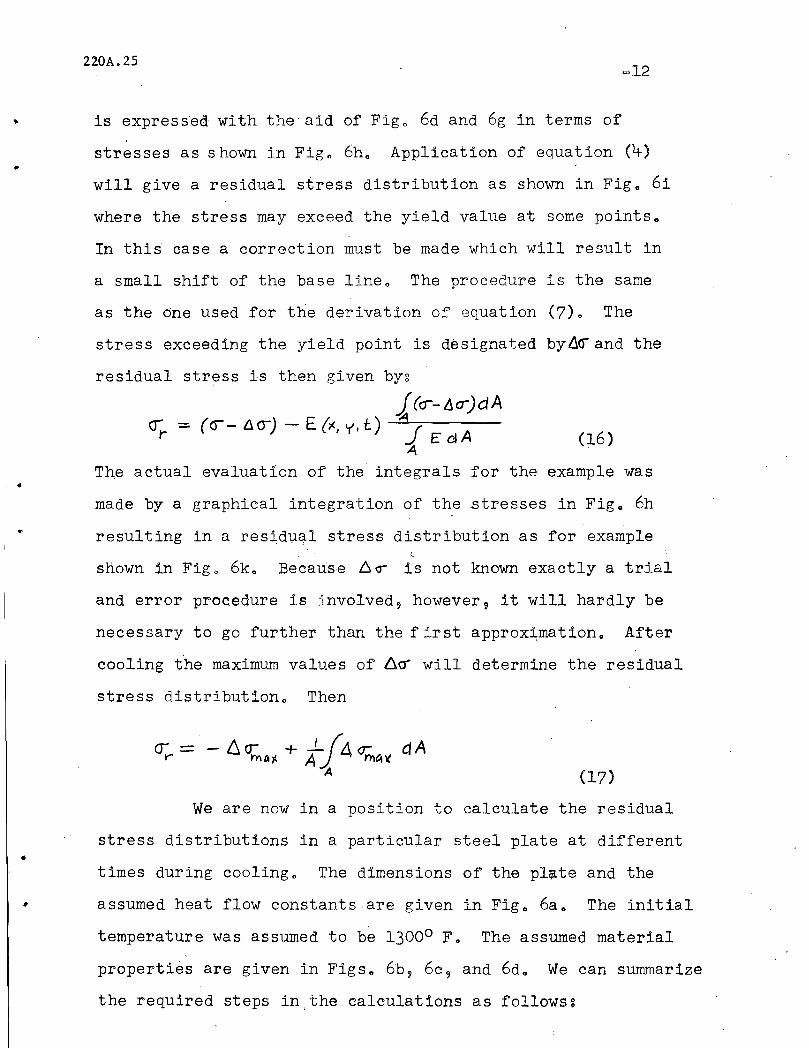
is express~d with the" aid of Fig o 6d and 6g in terms of
stresses as shown in Fig o 6h o Application of equation (4)
will give a residual stress distribution as shown in Fig o 6i
where the stress may exceed the yield value at some points.
In this case a correction must be made which will result in
a small shift of the base lineo The procedure is the same
as the One used for the derivation of equation (7)0 The
stress exceeding the yield point is designated by6~and the
residual stress is then given byg
i {a--IJa-)dAerr = (<J- ~()) - E ()(, '1', t) J E ciA
4
The actual evaluation of the integrals for the example was
made by a graphical integration of the stresses in Figo 6h
resulting in a resid~al stress distribution as for example
shown in Fig 0 6k o Because 6, (J'" is not known exactly a trJal
and error procedure is involved, however 9 it will hardly be
necessary to go further than the first approximation. After
cooling the maximum values of b.r::r will determine the residual
stress distribut1on o Then
We are now in a position to calculate the residual
stress distributions in a particular steel plate at different
times during cooling o The dimensions of the pl~te and the
assumed heat flow constants are given in Fig o 6a. The initial
temperature was assumed to be 13000 Fo The assumed material
properties are given in Figs o 6b, 6c, and 6d o We can summarize
the required steps in,the calculations as followsg

•
..
220A.25 -13
Ie Evaluate the temperature distribution at any
point in the plate o (Fig. 6e) Note that the
mean temperature through the thickness was
used in order to simplify calculations.
2 0 Evaluate equation (15) giving the strain
distribution in the plate (Fig o 6f)0
30 From Figs o 6b and 6ethe auxiliary curves of
Fig o 6g are obtained, giving the values of the
modulus of elastici ty in the plateo These
values will be necessary for the evaluation
of equation (16)0
4,0 The strain distribution of Fig 0 6f is converted
with t he aid of Fig o 6g to a stress distribution
as shown in Fig o 6h o
5. For each desired time the stress distribution
of Fig. 6h is used to find the residual stress
distribution according to equation (16)0

..
220A.25 -14
In the following section the cooling stresses in
•
•
•
•
other shapes will be investigated proceeding from assumed
strain distributions o
(b) Examples of Residual StResses Qll WF Shapes
In the previous section the residual stresses in
a plate were investigated during cooling to room temperature.
A similar analysis of ~ructural shapes would be much more
complex. However, it was shown that for the final restdual
stress distribution only the strains greater than the strain
corresponding to the yield point are of importance. In this
section the effect of various assumed'strains on the residual
stress distribution will be investigated o It must be kept
in mind, however, that the strain distribution is also a
function of cross=sectional dimensions and this makes a
direct comparison between beams of the same shape but of
different size somewhat unrealistic o
Stresses have been computed by equation (4)0. The
assumed strains and the results of the calculations will now
be described.
k symmetrical strain distribution of parabolic
and linear shape with a maximum value of ~ 0 as shown in
Fig. 8a is assumed. The residual stress distribution is
obtained from equation (4) as follow~g
e:._r_
Et:oE£'o
d4 + '1-b (3+20<)
3(2. + w'd)tb
. Parabolic (18)Distribut ion.

•
220A.25
<J_---'-. .:...r _ E
£o
vvd ( 0<)I + t-b I + ~
. 2+ ~·f:.b Linear (19)
Dis tribution
term:
•
where ~r is the residual stress at an arbitrary point that
has the initial.· strain, £, and 0( is a factor which is
either positive ornegativeoThe stress 'distribution is
shown in Fig. 8b.
Equationsl8 and 19 were used to plot the graphs
shown in Fig. 8c.. The ratios of resid"tlal stress at the flange-
tips ( ~c ,) and' flange center· ( 0-;..0 ) are plotted as a
function of the web-flange thickness ratio: for ex.:: l ..and
0( = -1.· Te·st results are also shown in Fig. 8c~ These will
be discussed later ..
It would be of interest to' compare r,esidllal stres ses
resulting from these assumed strain distributions with actual
tests. Suppose residual strain measurements had been made.
Then, dividing eq-qation (4) by E andomitting'the bending
Err = E. - ~ .£ E.. dA
where.,[ r. has been measured. The s'train is
•~ £. + cr
wherec is an arbitrary constant, since
(20)

220A.,25 -16
This means then that the strain distribution, E., must have,
the same shape as the measured strains and the magnitude
differs ohly by a constant o
Let us new ,onsider an unsymmetrical strain pattern
as shown in Fig 0 90 The resulting residual stresses are
also shown in this figure o The pattern is of interest because
the residual stresses are symmetrical although the strains
,were unsymmetric. However 9 the initially straight beam would
take on a permanent curvature after introduction of the
residual stresses., This curvature is obtained from the
bending term of equation (4):
•
'(21)
•
While this indirect method of residual stress analysis
gives some qualitative results, we must depend on actual
measurements to obtain the residual stress d~stribut1on in
structural members.
The solution for residual stresses in a beam derived-
earlier (eqo 4) is only valid in the interior of long beams.
It is desirable to know the distance from the ends ofa beam
where this solution becomes valid o For a solid section
(rectangular beam for instance) this distance would be
approximately equal to the larger cross-sectional dimensions
• according to st. Venants i principle o For structural steel WF
shape'S, the, distance may also be aS'sumed to ,be equal the

..
'.
220A.25-17
larger cross-sectional dimension. When the flange and "reb
'thickness .becomes-very small with respect to the other cross-'
sectional dimensioristbe distance becomes larger 0 The
problem of findingthis.distance is. similar to the so called, -'
,lIshear-lag" problem'of stiffened panels o (8) (12)
2 •..3, Residual Stresses Due to Plastic Deformation
In this section residual stresses due. to mechanical
deformations (for instance gagging) will be investigated in
steel beams. In Section 2 0 1 it was stated that residual '.
stresses are the result of permanent deformations of parts of
a beam section.
Consider a rectangular steel beam initially with
out residual stress (Fig. 10). Bending which results in
yielding of some fibers will leave residuals in the beam(5).
Sinc.e the strain distribution is linear, direct use'. . ..
may be made of equation (7J.: We can therefore write:
E£' = 0;(:1 - ,') (j ~ ~~ ). Joand !!
2..4 'jf 1- '"d V (j ?:<lr = - (T' (- - I J dj ljo)d 3 ' 'j JO -je:> '
or after evaluation of the integral:::,. '
•,.r' • ,_ ...... (,. lj ',' 3 "'" -.4- IA L.#ol.)v r - v ~f ~o- d -+-,' ;p,J
(22)

..
•
220A.25
-18
Equations 22 give the residual stress for any fiber as a
function ofYo9 which isa measure of the plastification of
the .section o
Next let us consider a beam of rectangular crdss-"
section that contains·initial residual stresses 9 0-ri'. which
are symmetrically distributed" (Fig o l1a)o If the beam is
bent beyond the elastic lindt, the applied stresses may be
obtained as shown in Fig,o llb o In this figure the initial'
residual stresses have been subtracted from the yield points
in tension and compression; thereby the limit at which
Yielding is reached is determined as indidat~d by the yieldI
limit· lines in Fig. llb o Due to the initial residual stresses,
the yielding process isunsYmmetric o The total stresses inI
the ,beam before removal of the bending moment are given by
the addition o....f initial residual stresses, O"'ri, and applied
stresses, (j(E), (Fig 0 llc) 0 The bending stresses, Oh due to
the remo.yal
of the bending moment must be subtracted from the total
stresses in the b~am,before unloading in order to obtain the
final residual stress o The resulting stresses are hatched
in Fig o llc and give the f-inal residual stress distribution
which is' redrawn in Fig. lIdo
In the same way let us conside'r axial deformation
in a rectangular beam containing the same initial stress
pattern as before (Fig. l2a). The yield limit is indicated
in Fig., l2b. Superposition of a uniform stress will result
in a total stress distribution shown in Fig o 12e o and the

220A.25-19
•
•
final· stresses are shown in Fig,o. l2d o By sufficient plastic
deformation it is possible to wipe out completely the initial
stress patterno
Now le~us consider another example of an H-beam9
an example that was used in section 2 02 (Fig o 9)0 Due to
the unsYmmetrical residual stress pattern, bending of the
beam resulted, and the corresponding curvature amounted to
~=;0 .To obtain a straight beam a peTmarient curvature of
the opposite sign must be introducedo In production mills, .
this is done by "gagging~, a straightening process done by
application of a set of concentrated forceso From the
M-0. relationship of the beam with initial residual stresses
the required curvature and bending moment to insure straightpess
after deformation can be obtained (1) (Fig o l3a). From
the required bending moment the applied stress (J ( E. ) may
be determined (Fig o l3b)0 The unlbBding bending stress ob
is elastic. The final residual sress distribution is obtained
from the addition of G ( ~ ), cr b and the initial residual
stress (Figso 13c and l3d)4
If an. infinite curvature would be applied the
cooling stresses would be completely wiped out and only ,cold
bending residuals corresponding to a full plastic moment•
would remain o (1)

220A.25 -20
•
•
•
•
..
In this section it was shown how residual stresses
due to cold-bending can be calculated. It was also shown
how the presence of initial curvature and initial residual
stresses can be taken into account o
220Ao25
...21
•J. E X PER I MEN T AL I N V EST I GAT ION
•
•
•
•
While cold-bending residual stresses on WF shapes
can be calculated with relative ease and accuracy, it is not
possible to obtain the residual stresses due to cooling
in the same manner as pointed out earlier. Therefore, it
was ~he aim to determine by a simple method residual
stresses on a number of representative WF beams and columns.
All measurements and tests were conducted at the
Fritz Engineering Laboratory, Lehigh University. Residual
stresses were measured by the sectioning method. Only as-
delivered and annealed WF sections of steel rolled to ASTM A-?
specifications were used in the experiments •
~ Description of Residual Stress Measurements
The sectioning method (4) was adopted for the measure
ment of residual strains because of its simplicity (Fig. 14).
LongitUdinal strains were measured over a 10" gage length by
a 1/10',000 Wh:j..ttemore strain gage on a series of holes. It. '
standard 10 inch mild steel bar Was attached to the specimen
to observe changes due to temperature between readings.
The average error in these ~easurements corresponds to about
+600 psi. Following an initial set of readings on drilled
and reamed holes serving as gage points, a second set of
readings was taken after relaxation due to sawing. In one
case (8WF24) strain 'readings were taken over a 1" gage length

...
220A,25
-22
..with SR-4 gages.. Strips of about 1/2-1" width, each containing
one pair of gage holes, were severed from a one foot section
in the earlier tests.. Later it was found that the strips
could be made wider without impairing results. Each strip
contained several pairs of drilled and reamed gage holes.
In such cases checks on strips of small width were also made.
The errors in partial sectioning is for most cases small. A
Theoretical estimate of the error is made in Appendix 8.2.
The st~esses were calculated from the strains using an ealstic
modulus, :$, of 30 x 103 ksi.
~ Test Results
The following is a brief presentation of results ••
The latter are discussed and compared with the theory in Chapter 4.
Table 1 gives a summary of shapes tested, the residual stresses
at flange tops:, flange and web centers, and their classification
as to type. Three types of residual stress distribution have
been observed (Fig~ .15). A-summary of measured residual stress
distributions in WFshapes is shown in Fig. 18. The residual
stresses computed from stress measurements :ar~ plotted in
Figs ~ 17 . to 38. Most stress distributions can be considered
to besYmrnetric. Some measurements were made on sections that
were cold-straightened. These results are presented on
Figs. 33 to 37.
The differences resulting from partial versus strip
cutting may be seen in Figs 018, 30 and .31. An indication of

•
•
220A.'25
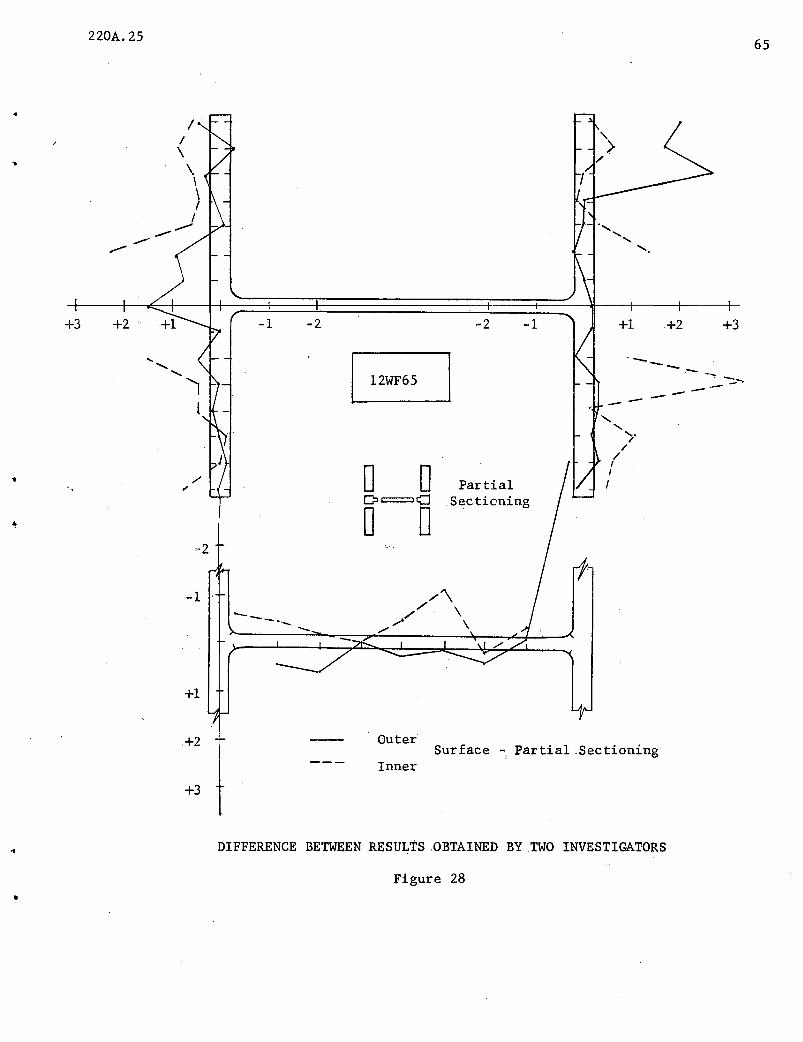
-23').8
the accuracy of the sectioning method is Fig. '2~ where the
stress differences of the results obtained independently by
two investigators are plotted. How cooling rate influences
the magnitUde and distribution of residual stresses may be
seen in Fig 0 29 0 While one 14 WF 43 was allowed to coolon. .
the cooling bed together with other sections~ the other was
set aside and allowed to cool at a faster rate. In Fig o 23
the stresses along the length of a 8 WF 31 beam are plotted
for three different sections o In Fig o 38 the average stresses
at the' flange tips and the flange centers are plotted along
the same 8 WF 31 beam o The average residual stresses for the
flange tops and the flange centers at a section i-j which is
located on the center part of the 81 WF 31 beam are shown in
Fig o 39 as a function of beam length.

220A.25
DIS C:U S S ION
-24
...
•
In this chapter some comments will be made on the
theory presented, the tests and their correlation.
4.1 Residual Stresses ~ 12 Cooling
The plastic deformations during cooling are de
pendent on various factors, the most important ones being
cooling rate, temperature distribution, material properties
and specimen dimensions, and all of these factors are
interrelSlted •
The behavior of the plate that was analyzed in Section
2.2 can serve as a guide in the qualitative analysis of other
shapes·. The portions of a section wh1ch coo], most rapidly
are at first under residual tension while the slower cooling
portions are under compression (Fig. 7). Yielding may occur
either in tension or compression, or both, depending on the
shape, temperature distribution and the magnitude of the yield
point. The non-elastic deformations during the cooling process
determine the magnitude and distribution of the residual
stresses after a uniform temperature has been obtained. As
a ruae, the fastest cooling portions of the section will be
under final compression stresses and the slowest cooling parts
under tension stresses.
If this reasoning is applied to a wide~flange
section, for instano.e a 36 WF 150 (Fig. 16 ), the flange tips
..
•
220A.25
-25
and th~ web center would cool more rapidly then' the flange
centers. As another example let us consider a 14 WF 426
(Fig. 16 ). Because of the shallow depth and large wep thick
ness, the flange tips would be cogling the fastest while
the web and flange centers will 'not have a large difference
in cooling rate. Finally let us consider anI-beam with
very small flanges. In that case the web center will cool
more rapidly and the flanges will be the slowest to cool.
Thus, the I-beam may have tensile residual stresses in the
flanges. A check of the other sections shown in Ftg. 16
will confirm the rule cited above.
Since cooling conditions are variable, residual
stresses may have different distributions and magnitudes even
in the same shape. This is shown by the measurements on
several shapes. Fig. 22 shows the residual stress distribution
in three ,8 WF 31 beams, from the same heat. Fig. 23 shows
the distribution in another 8 WF 31 beam which came from a
different heat and also had a greater difference in the stress
distribution than the other three beams. In Fig. 29 the
residual stress distribution is plotted for two 12 WF 43
beams which came from the same heat and rolling; however,
one beam was cooled separately and therefore cooled much
faster than the other which remained on the cooling bed
with the rest of the rolled sections. Fig.18 shows the
stress distribution" in a 5 WF 18.5 which was allowed to
cool in the middle of the other members of the rolling.
Fig. 36 shows. the residual stress distribution on the edge'

220A.25
member on the same cooling bed o
-26
The edge beam also retained
•
•
•
a p,ermanent bend after cooling while the other beam remained
straight.
The variation of residual stresses through the
thickness is relatively small in thin walled section
(Figures '19, 20,'26, '?T )~ but becomes appreciable for
thick walled shapes (Figs. 30,31, 32)0 In accordance with
the rule expounded above, the stresses on the outside flanges
are smaller than the stresses on the inside (if tension, ,
stresses are taken positive)~ because of the faster cooling
of the outside. The web shows no residual stress gradient
because of equal cooling conditions on both sides
(Figs. 19, 20,2~, 26, 27,Y30, 31, ~32) .
The measurements of the residual stresses were made
. by a simple method. In order to save time and costs complete
sectioning was not employed to all shapes. In Appendix 8.2
the probable error is estimated. However, some strips were
usually isolated in oTder,to.~ave also an experimental check... . .. ;
(Figs. 18, 25, 26, 30, 31)
.The personal factor on the strain measurements
with the Whittemore gage was found to be very small. Fig. 28
shows stress. difference of independent measurements made by
two different investigators •
In one test on a 8 WF 24;' the'; residual stresses as measured
. ,by the Whittemore gage over a 10" gage length were checked

•
•
•
•
220A.25
-27
by SR-4 gages of a 1" gage lengtho In consideration of the
stability of SR-4 gages in long range testing (several days)
the check was very good (Fig 0 20 ) 0
The residual stresses i.-11 the interior of long
beams and columns should be constant along each fiber accord
ing to the theoryo The comparison between the 1" and 10"
gage length mentioned above does not show any substantial
differenceo Measurements wer~ also made on a 9 ft o long
8 WF 31 beam on a 'gage length of 10"0 These tests confirmed
the theoretical prediction (Figs o 23 and 38a)0 The resultsl
of these measurements could also be used to show that at the
end of beams the residual stresses show a variation only
oyer a length equal to a bout the greater cross-sectional
dimension (Fig o 38a) or in other words that in the center of
a short beam length (minimum about 3d) residual stresses
still have their full magnitude (Fig o 38b)o
In Fig o 8c the results of the residual stress.~,
measurements are plotted as function of the web-flange thick-
ness ratio for shapes of a depth-width ratio of about unity.
The factor ~ varied between +1 and -1 for these sections.
On the basis of the theoretical studies and the test results
Table III has been prepared for an approximate estimate of
the residual stress distribution o The difference between
parabolic and linear distribution is small in comparison
.'to the uncertainty of the cooling conditions (see 8 WF 31
Fig o 8c). Since the majority of shapes contained residual

220A.25-28
stresses of approximately parabolic distributionJEq. (18) in
conjunction with Table III may be used for a rough estimate.
Welding residual stresses can be treated theoretically
in a very similar manner o-------..
However, the sequence of welding
.and the shape of the elements making up the section will
determine the final residual stresses.
4,2 Residual Stresses due to Cold-Bending
The measurements reported in the previous section
were made at locations in a beam that showed no evidence
of cold-bending. Measurements were also made at locations
that showed such evidence in the form of flaked mill-scale
'. (Figs o 33, 34 and 35). The amount of plastic stressing could
~ be estimated roughly ~~m the lengths of the yield lines. It
appears that all ·sections were straightened by bending about
the weak axis of the section o The results indicate that the
flanges were sometimes subjected to a different amount of
stressing o This was also the case in the laboratory for a
controlled 'bending test of a 5 WF 18 0 5. The initially curved
beam was placed in a test.ing machine with t he convex side up.
Loads were applied near the ends subjecting the major portion
of the beam to a constant moment (Fig. 38a)o The residual
•
stresses were measured on an adjacent piece of the beam
before the test (Fig. 36), and after straightening of the beam
(Fig o 37b). The procedure for straightening of the beam was
similar to the one which was used in the theoretical analysis

•
.'
•
220A,25-29
of a WF beam (Fig.13)o However~ actual deflections were'
used to determine the required amount of straightening
instead of the beam curvature (Fig.13a )0 Although the
conditions as sumed in the theoret ical anal ysis differed from
the actual conditions, the qualita:ive agreement between
theoretical residual stresses (Fig. 13d) , and the stresses
in 5' WF 18t beam after bending (Fig. 37b), is very good.
~ Effect of Residual Stresses Qn Structural Behavior
Only a few brief remarks will be made here.
Members subjected to bending reach the proportional limit
of the material at a lower load and' afterwards have increased,
deflections. Generally the ultimate load is not affected,
by the residual stresses.(1~4) A short specimen in compression
acts very similar (Fig o 39a)0 By comparison with an annealed
specimen (Fig o 39b) the effect is clearly demonst'rated. (9)
On the other hand unannealed steel columns show an appreciable,
effect as shown in Fig. 40 0 (9 9 10~ 12) This is due to the
loss of bending stiffness when portions of the cross-
section have yielded prematurely due to compressive residual
stresses o ' However 9 'annealing would not be an effective.
method to eliminate the ~ffect of residual stress because
it also lowers the yield point of the material o This variable
has been eliminated in Fig o 40~ Residual stresses have no
influence on slender steel columns iDe. for total stresses
-applied plus residual stresses below the proportional limit.

•
j'
•
1
'.
-30
59 SUM MAR Y
The principal results of this report may be
summarized as follows:
(1) Residual stresses are formed as a result of
permanent deformation of certain fibers during the cooling
process, or are due to plastic deformation during
fabrication. (Residual stresses due to non-linear tem
perature distributions are hot permanent but disappear
when the temperature distribution becomes either linear
or uniform.)
(2) The magnitude and distribution of cooling
residual stresses depend of shape, initial temperature,
cooling conditions and material properties.
(3) Cooling residual stresses of axial, symmetric
sections will also be symmetric under uniform cooling
conditions.
(4) Cooling residual stresses are constant along
the length of beams and columns except for a distance about
equal to the larger cross-sectional dimension at the ends o
(5) The sign of cooling residual stresses can be
estimq.ted from the relative cooling rate of various parts
of a section. The fastest cooling portions of the section
will be under final compression stresses and the slowest
cooling parts under tension stresses.

•
220A.25 -31
(6) Residual stresses due to cold-bending (gagging)
t'
•
•
..
t,
can be predicted with reasonable accuracyo The maximum and
minimum stresses are of the same order of magnitude as
the cooling residual stresses o
(7) The measurements of residual stresses made on
a large number of WF shapes should be helpful for an
estimate of the magnitude and distribution of residual
stresses likely to be encountered.
(8) The following maximum, average, and minimum
values of cooling residual stresses were measured in WF
shapes (tension, +, compression =), the average being ,shown
only where warranted by sufficient test data.
RESIDUAL STRESS~S DUE TO COOLING
FLANGE EDGE FLANGE CENTER WEB CENTER.
max. avo mino max o av., mino max. av. min o
COLUMNS' -505 130 41-1807 16 05 - -3.7 17.5 .,. -1505d/b'lo5n
BEAMS.,.4 0id/b)105 - 1-10 08 1907 = 8 03 -8.8 = -29.5
"

t'
0,
220.25 -32
6 0 A C K NOW LED G MEN T S
This report presents a part of the theoretical and
experimental studies made during the course of a three year
research program on the influence of residual stress on
column strength carried out at the Fritz Engineering
Laboratory, Lehigh University, Bethlehem 9 Pennsylvania, of
which William Jo Eney is director o
The Pennsylvania Department of Highways and the
Bureau of Public Roads, the National Science Foundation, and
the Engineering Foundation through the Column Research Council
sponsored jointly the research program which was directed by
LYnn S. Beedle. Many thanks are expressed to Research
Committee' A, in particular to its former chairman, Dr. Bruce
G. Johnston, for suggestions received during the progress of
this work.
Acknowledgment is also due to the Bethlehem Steel
Company and the Bettlehem Foundry for the excellent cooperation
in the procurement of special orders.
M~st test specimens were prepared in the machine
shop of Fritz Engineering Laboratory. Sincer~ appreciation
is expressed to Mr o Ken Harpel, Foreman, and the Laboratory
Staff.
Messrs o Yuzuru FUjita, Tadahiko Kawai and Lambert
Tall assisted in the tests. The renort was typed with care
by Miss Carolyn Smith o Messrs o Lambert Tall and Robert Wagner
also assisted in the preparation of the tables and figures.
Their cooperation is gratefUlly appreciated.

t"
•
. 220A. 25
-33
7, REF ERE N C E S
1 0 Yang~ CoHo? Beedle? LoS o and Johnston, BoGo~ "R'esidual Stressand the Yield Strength of Steel Beams ?~9 THE WELDINGJOURNAL~ 31 (4)9 Research Supplement, 205-s to 229-s(1952)
2 0 Trenting, RoG o, Wishart 7 HoBo, Lynch 9 JoJ o and Richards,D.G o ,
"Residual Stress Measurements", ASM 33rd NationalMetal Congress. (October 15-19, 1951).
30 Mathar, To, "Determination of Inherent Stresses by Measuring. Deformations of Drilled Holes", NACA TM 702 (March 1933).
4:0 Luxion, W.W. and Johnston, BoG., "Plastic Behavior of WideFlange Beams" ~ THE WELDING JOURNAL, 27 (11), ResearchSupplement~ 538-s to 554-s (1948)0
50 Timoshenko, So, UTheory of Elasticity", MCGRAW HILL, NewYork~ 1934 0
. II
Melan, Eo and Parkus, Ho , "Warme-Spannungen infolgestationMrer Temperatur Felder", Springer Verlag Wlen, 1953.
70 Baud, RoV o and Inan, M.~ "Determination des tensions internesdans les feres profiles", Institut Technique duBatiment et des TRA~UX PUBLICS, circulaire Serie 1,No o 29~ 1946 0 . .
8 0 Hilderbrand, F.B o, liThe Exact Solution of Shear-Lag Problemsin Flat Panels and Box Beams Assumed ~igid in theTransverse Direction 'IlT , NACA TN 894, 19430
90 Huber, Ao, and Beedle, LoS., "Residual Stress and the Com.... pressiveStrength of Steel" WELDING JOURNAL 33(12) 1954.
10 0 Ketter, RoL o, KaminskY,EoL o, and Beedle, LoS o, "PlasticDeformation of Wide-Flange Beam Columns", ASeE Trans-.actions Paper No o 2772 0 '
11 0 Russell, ToF o , "Some Mathematical Considerations on theHeating and Cooling of Steel!1l', First Report of the
. Alloy Steels Research Cornrnittee~ Iron and SteelInstitute~ London, 1936 0
12 0 Huber, Ao, liThe Influence of Residual Stress on theInstability of Columns", Pho Do Dissertation,University Microfilms, 1956.·
130 Wilson, WoM o and Chai-Chien Hao, VlResidual Stresses inWelded Strticturesn~ University of Illinois BulletinVol o 43, No o 40. 1946.

•
•
220A.25
8 0 A P PEN D I X
8~1 Nom~nclature
a2 thermal diffusivity
A
Aw =wd
b
c
d
E
h = clk
I
cTx
k
q
t
T
w
xo ' xl
olt
[,
Co
By
(J
cr' r
(j'rc
cr ro
e;J rw
cr rt
cry
cross=sectional area
approximated web area
flange width
plate dimensions~ a constant
depth of H section between center lines of flanges
YoungUs modulus of elasticity
a constant
moment of inertia
.1 C(/j)!/dA
A, thermal conductivity
heat emission per unit area
flange thickness, time
temperature
web thickness
distances from the center to the beginning of. theyielded area
coefficient of linear expansion
unit strain
reference strain
strain corresponding to the yield point
normal stress
residual stress
residual stress at flange edges
residual stress at flange centers
residual stress at web center
residual stress at web edges
yield stress leve19 awerage stress in the plasticrane:e

.....
220A.25
-35
8~2 Some Theoretical Considerations in Resnect 12 Measuring
Technique(
(a) Residual Stress 'Gradient ../
If a strip of width, S9 is cut, a stress gradient will result
in bending of the strip (Fig" 42)~ The curvature is given. . '-'---""j .
by G~-:.-~!~ an(~ the center line of the curved strip has the
equation: ··liJ= i~' ~(L-:Z:))
The error in axial str.ain measurement is then given byL • ~ LZoe = + JCdS -' d~) ~ ~{ t tJ,zd~ == Llz4 s:&....--~~=-=-=-=-~l
Taking typical values z ~)='OOl( 10-1, _ L ::': 10", . s = 05; $£ =/10 7 x 10- ,/L---.___ ._._ ....._-
which is negligible o
,(b) Partial Cutting
Time and costs are saved by cutting larger sections
instead of stripSo Ina plate of length, L, and thickness =1,
.> the residual stress distribution be given by
-.- -.- - - -(A .2)
The measured average value over L is then
crr(ov,) ~ .~ [10 - /:2.0 ~ ~ /'] - ~ - - - - - - - (A. 3 )
If the pl~te is cut in the center a rotation 'and an axial de
formation will take place causing a partial release of
'residual stresses" To calculate th~ final stresses it is
only necessary to substitute the initial residual stresses
for E 6""'1" in Eq" . (4)0 Then the remaining average residual
stress 9 ~ (Jr ,.in tI:-e plate is given by~
. Ll tr"'r .~ L- S + bO +- /20 C~~ Z] - - - - - -~( AA )

•
,.
•
e·
•
220A.25
-36
Both the initial stress distribution and the distribution after
the cut are shown for the center of the plate (x m ~) in Fig. 42.2
For a linear distribution of initial stress ,l1(J""r
would be zero. The error in axial stress measurements is
given by Eq. (A.l) 0. For l1t. r = ~. 3~ = ob37t. 10-3
, L::lO",
~e :: .7 x 10-6, a very small value and certainly
negligible.

\
220A.25 37
8: 3 TA8LES..
TABLE I
• Cooling Residual Stresses inWF Shapes(Average Values)
~~A 1\ L1 ~ (Jrc~>J7L1~
((Jro
~ frw( 0I II'I
Type I Type II Type III
•
, ..
,
. SHAPE wit d!b 0'rc (Jro (Jrw TYPE ,REMARKS
1 4WF1:f .811 1.022, .... 10.0 4.0 5.5 IIi ,
2 5WEI1L5 .632 1.018 =7.7 -2.0 16.5 . ,WnI, center beauL.on cooling~.,
3 5WF18.5 .632 1.018 ~10.6 3.2 6.0 ,- II edge beam on coolingbed
4 6~C15.5 ' .892 +.000 ,,15.1 10.5 -e.9 IIII - .. light column
5 8WF24 ' .616 1.138 -10!2 0.5 17 .5 nI/II
6 • 8WF31 .665 1.000 =13.9 5.6 9.3 II
7 8WF31 .665 1.000 -11.5 1.1 15.5 n/III same heat,. differentrn 114 n,,;'
8 8WF31 .665 1.000 -17.5 4.2 5.0 II
9 8WF31 .665 1.000 -16.1 10.1 1.3 1/11 different heat
10 8WF67 .616 1.088 =9.5 '-3.7 15.5 III.:n
11:. 12314 .893 3.00.0 -401 8.3 . -8.8 I beam
12 12WF50, .579 1.510 =505 9.2 -15'~'9 ',I.
13 12WF65 .644 LOll -18.7 16.5 -15.5 I
14 14WF43 0584 1.711 -8.5 19.7 -29.5 I on cooling bed(slow coolinI>' rat"'\
15 14WF43 .584 1.711 18 . 5 24.2 -41.0 I cooled separately'/ (hi~h coolinI>' rat-",'
16 14WF426 .619 1.120 -l!7.8 8.5 14.0 n;/ '.
17 36WF150 0665 2.990 -10.8 14.3 _l1500 I beam

•
220Ao 25
TABLE II
_Residual Stresses in Cold=Bent WF Shapes
SHAPE wit d/b ~n~F) o(naxo F) ~ax(min») Remarks--. (compr) (Tenso) (Web)
Flange Flange-,
5WF18-l/2 .632 1.018 -8 00 800 -0.5 cold-bent under uniformmoment (laboratorv test)
8WF3l .665 1.000 -9.0 800 0,600 as delivered: evidence ofheavy cold-bending (meas-sured near end of beam)
8WF67 , .616 1.088 -11.0 7.0 1500 as deliv.red: evidence ofmedium cotd-bending
,12WF50 .579 1.510 =5.5 9.0 ,"'11.5 as delivered: evidence ofmild cold-bending
Note: ~inF) = Maximum compressive stress in the flanges~axF) = Maximum tensile stress in the flangesc$lax(min» = maximum stress (compression or tension) in the' web. Fillet
stresses excluded
38
.. \,,
II
\\
\
TABLE III
,Residual Stress Types inDependence on DimensionsValves for Residual Stesss Estimate
II"
~ I II III IV
1(2.<3 1<~<1-1/4 1<~<1-l/4 ~>3B .. b b B
DIMENSIONS 1/2<~<1 ~<~<l -.!.<~<~ ~<1/2t 3 t 2 t 3 t
l2<d<36 4<d <18 4<d<12 d>12
RESIDUAL l2<E€od,6 l4<E€o<26 5<E€ <10 E€o<5'STRESS
. 0
ESTIMATE -1>~>=2 1/2> r;(;>-1/ 2 5>0£>1 0<.>5
EEo in Ksi d in inches
Note: The small number of tests, the unknown cooling conditions,etc. permit only a very rough estimate of the approximateresidual stress distribution

220A.25
TABLE IV
COMPARISON OF ESTIMATED AND MEASUREDRESIDUAL STRESSES (ksi)
39
•
..
Shape TYPE drc Cl'ro Cl'rwEst. Meas, Est. Meas. Est. Meas. . Est. Meas.
4WF13 II II -12.0 ",10 .0 2.0 4.0 8.9 5.5
5WF18.5 III II/III -8.4 '~7. 7 ·-2.4 -2.0 41.6 16,5
6LC15.5 II I/II -15.1 10.5 -0.9
8WF24 III II/III -8.8 -10.2 -1.8 0.5 12.2 17.5
8WF31 II il ~13.5 -13.9 4,5 5.6 4.5 . 9.3
8WF31 III II/III -8.6 -11. 5 -.6 1.1 15.. 4 15.5
8WF67 III III -8.7 -9.5 -~7 =3.7 15.3 1,~. 5f "
12T14 I I -5.7 -4.1 6.3 8.3)1
-5.7. -8.8I
12WF50 I I -6.8 -5.5 5.2 9.2 -6;8 -15.0
12WJr65 I I -18.7 16.5 -15.5
14WF43 I I -8.5 19.7 -29.5
14WF426 II II =16.0 -17 .8 8.0 8.5 14.0
36WF150 I I -10.8 14.3 -15.0
2~OA. 258.4 FIGURES
40
fo·
E €
(b) ~ ~ ;f
J(c) E~x
(d) I { tE
r
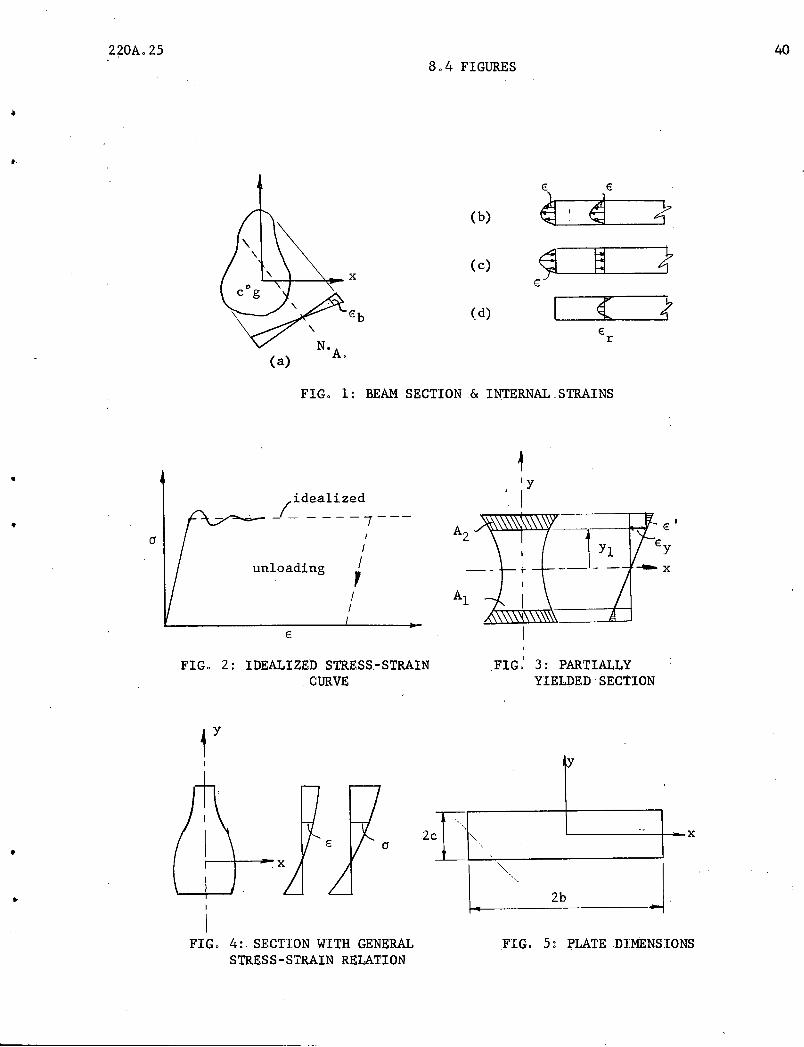
FIG. 1: BEAM SECTION .& INTERNAL STRAINS
unloading
•
....-=0.. (~d~a~~Z~d7 _
I
I/,
II
E
FIG. 2: IDEALIZED STRESS-STRAINCURVE
~Iy
. I
I
.FIG: 3: PARTIALLYYIELDED SECTION
y
2Cr~ xC1•
l '",
J• 2bI
IFIG. 4: SECTION WITH GENERAL FIG. 5: PLATE DIMENSIONS
STRESS-STRAIN RELATION

'~'.
\; .', .......:, ..,.;. ~'''' ..,'.
. -". .
.. i: :2G 1~1' ~ .:~:5 41
·4"
2$"
COnstants for steel
. " ..'
(a)
::It 18
30,oop1$
R O(tQtsi) 1
(10'''7)• 510,000
,!",
500 1000
T (oF)
(c)Plat.e (}.;
30fly
lOGO(kat)
't(x.l~2,t)20(0.)'If,
50018
.' :.-- ...•, --'
•.... :;:,1':'"•
. .,
.- ·LA.'~., ," (e)
• " . - : ~
mI>' 6t-~~':"~_$utAi S.SsEs'" ,.!·-,-·:1!N-A·S.~.·~~ .....
.'.','r .• ,.•..'..~.,..,._:.•_(;!.'_.•.: <.:'. ., ' _..~ \-. ,,~ " 1~..··· ~ ~" ::. ,t. . '

220A.25 42
10xo10xo
"
1500·
30,000 t =16.9
1000 .5.E€ (ksi) ~
-6 4.2(10 in/in)500
10 ,000
(f) (g)
30 30cr
t=8.5-." 4.2
cr 20 3.0 cr cry(ksi) 1.5 20
50.6
10 10
0 x 10 0 x 10
(h) (i)
err(20 ksi)
t=8.5 min.
(9 ksi)
(k)
• FIG·. 6: .CONTINUED
"

•....
•
';'" :
lHate ft
1":J
(time t in minutes)
1@
..5 I. '1"tc>~
-10
Flate er;ige-_
:nG~ 7 ~ RESIDUAL S'l'BESS ~ulS'i'RIBU'.I'IONS
FOB. VARIOlJS TItlJES

220A,<5
*.
d
///
(1 +0( h o
Oro
(;fro
1.0
----.-'-•
--
,8
-------
-
,00
w
-
--.'
;": -.j;) ~
- -' ~*~C>~ g~ :!. 'J) i
!
_.
"-
.4
Col =-1)
_~_--------t~-nr----:-1.----c·I I .. .' 0:[9... ' ..
\ ..\ 0!'t"J _an:-
--\4-~
i 'Ji.. , .
•
.2
.n
o
1.0
.2
I) ..t
..t
(c)

nOA.25 45
+
0-
..• 0625
-.0625
•18 7t---.. <::::::r::::>' /1-.0625
IE€OI
VALUES ARE RATIOS OF ~~_
E€o
-.0625
-. 18 7V,..==r---... ""'J
)
IW u-,t::: ... '00J
€o4
Figure 9
,
b cry
dfEE '.:
Lcr-'t
J
t·COLD-BENDING ,STRESSES IN STEEL BEAM
FIGURE 10

220A.25 46
:!LEeo Yield
-.2 101
Limit .066
(J e:)-¥ari-Crb
.1 ,0692Yield
Limit.. .022
-.2 -.066
(Jri ~ O'(e)+O'ri (Jr
Eeo Eeo Ee o Ee o
(a) (b) (c) (d)
•Figure 11
•
-5!L ~
. --t;eo~1Eeo
-.2 -.0335
ati 1 •23dl It=-(j- .0665E€ Yield - Ih-
0 If::Eeo..
Limit;
-.2
(a) (b) (c) (d)
•
Figure 12

220A.25 47
/1'>.. .d .187c::::;::>
v <"'"> '! _.063
.~·I ij
(a)€o
.4
o I 200
~~ol- - ~b.8
:!:l_ = .8EEo
~I I~ II I .300--
-- Yield -.205I . Limit
IE:r II~.. E€oI
Yield ~ ILimit
(b) (c) (d)
Figure 13

220A.25
o f==========t::==:s:S:\~ lIdSection A Saw Cuts
gage holes fcn: v·Jh:i. ttemorestrain gage
•
•
\ \\ \
\ \- \ \~~ \ \
\ \ \
~~\\
Section A
<--.......-----~o \\ \\ \\ \
\ \\ \
\ \, \ \
\ \\ \\
\ r.
~- Saw Cuts
Sec.ti.oningMethod for Measurement of residual stx'c:d.ns.
FiguTe It.;

•
•
),20,A.. 25
Type I
Type III
12vWSO> 12WF(,5, 1I);'W43 ~
6KI5,5, 36~W150, 12JI4
l;.HF13., STifF3:!., JJ:.l,")r'I::.2::".AoJFl&·~1./2, GLCli.5, 8WF2!:.
:.~vJF 2'+, 8ltlF67 , Sv.'F'l!>"1/::,SWF31
49
, TYPE OF RESIDUAL STRESS DISTRIBUTION
F:i.fsure 15

2Z0A.25 50
•
~ ISHAPE I IFLANGE PATTERN WE.B PATTERN r
-~llInrrlTh 1./
H 4WF13
H8~31 J
v
,2010
lI
10 020C l.....!_--J-__~_"""'---_--' T
8WF67
Ksi
FIG: - 16.RESIDUAL STRESS DISTRIBUTIONS INWF-SHAPES

220A.25 51
ISHAPE I I_FLANGE ·PATTERN I
12WF50
T10
12WF65 0 I l/
~ V10 \ II
c
•
-
14WF426 •v

220A.25
IShape I
'H'" ." . ,5WF18-1/2 '
IFlangep~tternr IWeb Pattern I
52
1i-----112J14,
I' ITCLl__I-._--.I.
-10 0+10ksi.
.,"Figure 16 continued

220Ao 25
HIFLANGE PATTERN I
6M15 1/2
IWEB PATTERN I
U
51
,
'36WF150
-,14WF43 -_=-=r---
20, 10 0 10 20C L!_~I-·_---JL.....-_....1__....1 T
ksi
.FIGo . - 16 CONCLUDED
T10
o
10.C
v

220,A.25. 54
Compressi~n compression
'., ...~
.. :'
.:'."
-ID .. ',
Str.ess
.-15II-----·-t--------+---
KSI)
WEB DISTRIBUTION
+10
1----++5--L- ._. ._ ._.._._.._ __ _.u u
o Ou t~or bEc!:ac.e - Co;nple tt~ Sec.:. tioning
+ Inner. Surface -- Co~(;pl",tc Sectioning,
FIGURE 17

..
220A;·25
-15
~o\~
\0\
\\
··1.D -5/
/0//
~
,--+_.._-- ...-\--..;_ .. I ....--.. +----, '.
S 1.0'; :i
o 0C: .==--=-, c:J
" 0! I
U
55
6 Outer Sl1rface - Complete ·Sec doning
o Innf~r.'S\lrface" Partial Sectioning 220A
+ Iriner'Surface P"wtie.l Sectio)].ing T·12
- - -Estimatedl1ee':':1 Curve - Partial. Sectioning
\~~ FIGURE ·18',1

220A.25
Comp • -----. FLANGE DISTRIBUTION. ~ Compo
56
•
•
-20
o Outer s~rface
10
WEB DISTRIBUTION
20 ksi
10
10ksi
o -10 ksi
>< Inner surface
Mean curve
Oomp1eteSectioning
RESIDUAL STRESS DISTRIBUTION
Figure 19

220A.25 57
I·
-10 -5 o +5ksi
r8WF24
+5 o -5 -10
•
ksi
+10
o
• Outer Surface
• x Inner Surface
Mean.Curve
•SR-4 Gages ( 1II)
Figure 20
Complete Sectioning

220A.25 53
•
FLANGE
STRESS DIFFERENCEKSI
\\\rI
~ , ,".PARTIAL .
.SECTIONING
+1 +2 +3 +3,
+~~---:r/ -1 -2 -3
--I , I -t -+--3 -2 ~1
STRESS ·DIFFERENCEKSI
•WEB
+1
-3
Outer Surface
Inner Surface
DIFFERENCE BETWEEN COMPLETE .SECTIONINGAND PARTIAL .SECTIONING
Figure 21

59
..FLANGE DISTRIBUTION
Tension,
-15-10
Stress KSI
+10
8WF31
+5
+
15 1+10
\
-5-10
Stress KSI
-15
t
•
+5 WE" DISTRIBUTION
Mean Curves - Complete Sectioning
Figure 22

220A.25 60
1 2 3
~ [8J ~9' _ 0" ..
1_-h'-----------=------------
•
-15 -10
Compression
-5
.FLM~GE DISTRIBUTION
8WF31
WEB DISTRIBUTION
-5 ... 10 -15--L. I --l
Compression
2
3
..
-5
o
+5
.Mean Curves - CompleteSectiGning
Mean
• DISTRUBUTIONOF RESIDUAL.STRESS AT TBREE LOCATIONS IN A SINGLE BEAM (T-6)
.Figure 23
,, ,

220A.25
,..... . .--• 01::........,
b,+0'+,
i\ 0
bI
0/ ......0
4>1/-/
0*i+ L.- l.-
I I I
-10 0 +10 +10 0 -10ksi .ksi
I 8WF67
0 0• CJ c=::::J cJ Partial Sectioning
0 0~
t--+--+- -t--tI .\
t \+10 .---
/ \.---
I \I \I 1\l.
0 \
ksi
-10
61
o
+
Outer Surface
Inner. Surface
Mean Curve
.Figure 24
Partial Sectioning

220A.25 62
•
Comp._ FLANGE PATTERN ~Comp.
=5ksi
o·
10 10 o
"
-5ksi
• I
Compo
)
ksi5
r4
IWEB P TTERN, .
( 12 U
l
•
Compo
..
•-10ksi
• --.---. Outer Surface
x----- Inner Surface
-- ----Mean CurveRESIDUAL STRESS DISTRIBUTION
(Complete Sectioning)
FIGURE 25

220A.25 63
•
........o , ,......... 0
.........+
b .......0 cr,
I I I-10 0 +10 +10 0 .,10
ksi ksi
I 12WF50
0 0Partial seCr¥0ning[)c=:Je;]
+10 0 0 I\ I
..
..
1\
ksio
-10
o Outside-Surface
• + Inner Surface Partia1Sectianing
Mean Curve
•
Figu:(e 26

220A.25 64
-
-..
..-
0-...--~ --
-10 oksi
+10 +10 o .,.10ksi
12WF65
oIl+to Partialo
+\o
~~ D=<J Sectioning Ir--
0 0 I\ I\ I\ I\\ I\ I
JI.\ . ,
~I
/\
j&-\
\ I"- t"+ +/
'-- "- Jf' -
o
~10
+10
ksi
•
..0 Outer Surfoce J+ Inner Surface
Mean ,Curve
• Outer .. Surface })< Inner .Surface
Partial Sectioning
Complete Sectioning
Figure 27
220A.2565
+3+2
'-- .--. --.--:::.-..--
+1
"- ....... ......."/
/II
I
-1-2
PartialSectioning
o 0D t:::=:::l(J
o 0
-2-1
-1
.... .............
It"
//\
\.\
)/
...-"--...- "
+2+3
+1
+2\1+3
Outer"Surface - Partial.Sectioning
Inner
DIFFERENCE BETWEEN RESULTS OBTAINED BY TWO INVESTIGATORS
Figure 28•

220A.25
cbmp. ' FLANGE PA,TTERN ,Compo66
'---;r---+-
kSi -:10 -5
high, cooling,,rate
-'~'-
5 -5 -lOksi
l4WF43
kd
"'"x-...L.- ~
-30 high cooling rate
DISTR.IBUTION
-15
-5
1t\10
-25
-20
=35 //
-4({'ksi
(\\15
-10
Figure 29 -RESIDUAL'S
Outside} C" I' 't ." ompe 'eInside ~Sectloning
\
,Mean Curve, - Piece \cooled on bed
-- - --' Mean C~!Jve - Piece~. . v / -_
cooled separately .
tv.
r.\,~
•

220Ao25 67
Camp. -"---I FLANGE:DISTRIBUTION 1---.....- Compo
•
ksi =15 =10 -5
14WF426
-10 -15 ksi
/
" 5...."-
.... i-....-....
..........
..... /'<
" " 1~ ... 0
o "
00 5 /' 10
./ + ...............~
o
o
FACEON
ksi ~
~-20 0/ I -20 ksi
~o=15FLANGE .TIP
=15 .DISTRIBUTI~ 0 D Partial
-10DC::JO _Sectioning0 0 -10
-5 ksi -5-20
v \ ~
-~±'--t - ... - -;-- - '-t~. .:7' - - It- -..:_"~
~
is'10
.--5
I I I
I0
WEB DIS'l RIBUTION Camp
eParti 1 Sec ioning
e
Camp.
. o. Outer _Surfac
+ Inner _Surfac
- - - Mean Curve
•
RESIDUAL STRESS DISTRIBUTION(Partial Sectioning)
Figure-30

220A.25 68Camp.
•
-20ksi
-10
Compo
-5
•
•
I
1
II
FLANGE DISTRIBUTION
•
=10 ~5
•
•
-20ksi
•
•
FLANGE TIP FACE'DISTRIBUTION
ksi~20
FLANGE TIP FACEDISTRIBUTION
~ Compo
1
=10 vlEB DISTRIBUTION -10.,
=5 -5
\kSiu u
~. 15 A/• " ..tlO
15I I,
I
I
e
1-5
f>lOe
~15
ksi
comp.!
l(. Inner Surfac
• Outer surfac
-- Mean Curve
•
..
RESIDUAL STRESS DISTRIBUTION(Complete ... S'ec,ti-oning)
FIGURE 31

220A.25 . 69
•
Camp. • FLANGE DISTRIBUTION --.-- Camp .
ksi -10 -5
•
-10 ksi
( 36 W" 150 )
ksi
WEB DIi~::UTION10.
t5
-5 ICamp. .Compo
~10
15
ksi
•
• Outer Surface
~ Inner Surface
Mean Curve
RESIDUAL .STRESSDISTRIBUTION(Complete Sectioning)
FIGURE 32

•
220A.25
,Compression -~.-~
70
-10
8WF31
-10ks,i
5.. WEB
0•
-5
1\:8i
MILL ,FLAKE,SKETCH
GAGE
f=~=~~~~1LENGTH: I .. lO'~ I
H]8"
l,
COLD BENDINGRESIDUAL.STRESSES IN 8WF31
,Figure 33

220A.25 71
Ii
-~
I 0
1+ +I
L..;..1._---........, I..:..-_-l-10=5 0 .+5
ksi+5
8WF67 Io -5
.ksi .
.'-10
o 0Dc::J(]o 0
Partial Sectioning
•
•
o
+Outside") S fl . ur aceInside S. .
,Mean ,Curve
Partial Sectioning
.Figure 34

. 1-' ~-'-_----'
PartialSectioni~g
,t
220A.25
o +
-5
.+10
o
-10
o +5ksi
I)
1\\\
-
o
.+10
\\
12WF50 I+5
+ iI
/
o -5ksi
......
-10
72
o
+outer}
Surfa,ceInner .
Mean Curve
Pigure 35
Partial Secti()ning

( 5 W'" /8.5 )
,
220A.2.5
I I . I
73
+5
o
• '. ., 0-0", ~X
'x •
•x
. "
outer}. Surface
Inner .'
"Complat~ Sectio~ing
Estimated Meail Curve
FIG~E 3~
c~\ w} eJJt (jfl\~,r\ (JY\ .
~W (JItr~leJ):·~t
cJi·~~

,
220A.25
11~01 P2
13'-6"
P2
1'-0"
74
0.2"r-r--__~: . ~IORIGINALl __~ ~ DEFLECTION
O. 2'[PF:---:;;:.--==3::,.-..~.~:....::::''""=.-:----:--.-d8 '_6" Column Length I
1>4 ... ,
FINALDEFLECTION
Figure 37 (a) COLD BENDING OF5WF18=1/2~COLUMN AND DEFLECTIONS

220A.25
-5 ksi -5 ksi
75
.~ .
•
••
+5ksi
• .Outer
x SurfaceInner
,Mean .Curve
Complete Sectioning
Figure 37 (b)

..
220A.25
Saw Cutsi j
IIIII ,1,1
CUTTING LAYOUT
9 '-0"
.. 76
Average Stre.ssat Flange .Centers
Region ContainingCold-bend Yield Lines
10
16
T
C
Stress at .FlangeEdges
(a)
GAGE LENGTH 10 II
Average StressFlange Centers
1O.J-~=---+-_-+--4--+---I---t-T--""16
Average StressFlange Edges
(b)
FIG. 38: (a) ,VARIATION OF RESIDUAL. STRESS (KSI) ALONGA8WF3l BEAM
(b) THE VARIATION OF RESIDUAL, STRESS (KSI) ATSECTION i- j AS A FtmCTION "OF BEAM LENGTH
CROSS SECTION'LENGTH (ft.)

220A.25 77
40
30,
(J
20
10
o
AVERAGE:COUPONS
CROSS,...SECTION
e(eq. 8.7)
I.. ~002 J e
CROSS~SECTIOH STRESSSTRAIN CURVE FOR
A$-DELIVERED MATERIAL
Figure (a)
AVERAGE CROSS-COUPONS SECTION
40
--3D
(J
20
10 ISWF31 I
0
I• .002 ~I €
',-CROSS-SECTION STRESS"
'~STRAIN, C,URVE FORANNEALED MATERIAL
Figure (b)
Figure 39

220A.25 78
Compr.
+TenS!On
p
Typical ResidualP Stress
--~xurep::::rn in Flanges
annealed column tests-H- -:-H-
..~f")Nn
It~00(000
o as-delivered column tests
•
------.---,~ . \
j 8WF3l \
!--8~~ \
, 0d'__ \, ........ \
theoretical '~solutions·
0:2
0.4
0.8
0 0 6
1.0
i
0.4 0.8 1.2 1.6 2.0
=!~.2h.". E r
THE INFLUENCE OF RESIDUAL STRESS ON COLUMN STRENGTHAS INDICATED BY THEORY AND TESTS
,Figure 40

220A.25 79
L
I. \
I \I \
IIIIII
X /
/ :y
-+~Figure 41 .
L
1
x
~Cut
b ~_----,..._I
y
L2
12X k:::;i
actualresidu~l.
stress (y=o)
measuredaveragestress
1-
.Figure 42
( \ .
\