Embed Size (px)
Citation preview
July 2006
Research and Training Center on Community LivingInstitute on Community Integration/UCEDD
Residential Services for Personswith Developmental Disabilities:Status and Trends Through 2005
Residential Services for Persons withDevelopmental Disabilities:
Status and Trends Through 2005
Contributions by: Robert Bruininks, Kathryn Coucouvanis, K. Charlie Lakin, and Robert W.Prouty
Edited by: Robert W. Prouty, Gary Smith and K. Charlie Lakin
Research and Training Center on Community LivingInstitute on Community Integration/UCEDD
College of Education and Human DevelopmentUniversity of Minnesota
214 Pattee Hall, 150 Pillsbury Drive SEMinneapolis, MN 55455
July 2006
This report is also available at http://rtc.umn.edu/risp05
Additional print copies may be requested by contacting Kathryn Coucouvanis at [email protected] or 612-624-8246
Preparation of this report was supported by a grant from the Administration on Developmental Disabilities(Grant No. 90DN0200/01) with supplemental support from the Center on Medicare and Medicaid Services of theU.S. Department of Health and Human Services. The Research and Training Center on Community Livingreceives core support from the National Institute on Disabilities and Rehabilitation Research, U.S. Departmentof Education (Agreement No. H133B031116 Act #1). The contents of this report do not necessarily reflect anofficial position of any sponsoring agency.
The recommended citation for statistics in this report is: [Chapter authors] (2006). [Chapter title]. In R.W.Prouty, Gary Smith & K.C. Lakin (Eds.), Residential services for persons with developmental disabilities:Status and trends through 2005. Minneapolis: University of Minnesota, Research and Training Center onCommunity Living, Institute on Community Integration.
The University of Minnesota is committed to the policy that all person shall have equal access to its programs,facilities, and employment without regard to race, color, creed, religion, national origin, sex, age, maritalstatus, disability, public assistance status, veteran status, or sexual orientation.
Table of Contents Acknowledgments....................................................................................................................................................... i Executive Summary.................................................................................................................................................. iii State Residential Services............................................................................................................................. iii Number and Size of Residential Settings....................................................................................... iii Number of Residents...................................................................................................................... iv Admissions, Discharges, Deaths..................................................................................................... iv
Expenditures................................................................................................................................... iv Facility Closures............................................................................................................................. iv All State and Nonstate Residential Services................................................................................................... iv Number and Size of Residential Settings..........................................................................................iv Number of Residents.........................................................................................................................v Interstate Variability...........................................................................................................................v State and Nonstate Residential Settings by Type.......................................................................... vi Patterns of Change in Residential Service Systems: 1977-2005................................................... vi Medicaid Funded Services......................................................................................................................... vii Intermediate Care Facilities for Persons with Mental Retardation (ICFs-MR)............................ vii Medicaid Home and Community Based Services (HCBS) .......................................................... viii ICF-MR and HCBS Combined.......................................................................................................viii Nursing Home Residents................................................................................................................ ix Introduction and Methodology................................................................................................................................ xi
Introduction................................................................................................................................................ xiii Methodology.............................................................................................................................................. xiv State Survey Data Collection........................................................................................................ xiv Individual State Residential Facility Survey.................................................................................. xv Historical Statistics on State Residential Facilities........................................................................ xv Section 1: Status and Changes in State Residential Services................................................................. 1 Chapter 1.................................................................................................................................................................... 3 Current Populations and Longitudinal Trends of State Residential Settings (1950-2005)............................. 3 Number of State Residential Settings.............................................................................................. 3 Residents with ID/DD of State Settings........................................................................................... 3 Change in Average Daily Population: 1980 - 2005......................................................................... 6 Average Daily Residents with ID/DD in Large State ID/DD and Psychiatric Facilities................................................................................................................... 6 Residents with ID/DD of Large State ID/DD and Psychiatric Facilities Per 100,000 of the General Population............................................................................................. 8 U.S. Trends in Average Residents with ID/DD in Large State Facilities Per 100,000 of the General Population............................................................................................... 9 Slowing Rates of Large State Facility Depopulation........................................................................ 9 Movement of Residents in Large State ID/DD Facilities in FY 2005.......................................... 11 Longitudinal Movement Patterns in Large State ID/DD Residential Facilities............................. 13 Annual Per Resident Expenditures................................................................................................ 14 Chapter 2.................................................................................................................................................................. 19
Large State ID/DD Residential Facilities, 1960-2005, Individual Facility Populations, Per Diem Costs, and Closures in 2005 and Projected in 2006................................................................ 19 Large State ID/DD Residential Facilities Operating and Closing, 1960-2005.............................. 19 Total Large State ID/DD Facility Closures................................................................................... 19 Individual Large State ID/DD Facility Populations and Per Diem Rates...................................... 20 Changes in Populations of Large State ID/DD Facilities............................................................... 20
Section 2: Status and Changes in Total State Residential Services Systems............................. 35 Chapter 3.................................................................................................................................................................. 37
Services Provided by State and Nonstate Agencies in 2005........................................................................ 37 Number of Residential Settings..................................................................................................... 37 Number of Persons Receiving Residential Services...................................................................... 37 Relative Size of Residential Settings............................................................................................. 40 Number of Residential Service Recipients Per 100,000 of General Population............................ 41 Persons Presently Not Receiving Residential Services on Waiting Lists for Residential Services................................................................................................... 43 Chapter 4.................................................................................................................................................................. 45
Number of Residential Settings and Residents by Type of Living Arrangement on June 30, 2005.......................................................................................................................................... 45
Congregate Care Settings and Residents....................................................................................... 45 Host Family/Foster Care Settings and Residents........................................................................... 45 Own Home Settings and Residents................................................................................................ 48 Family Home Settings and Residents..............................................................................................48 Chapter 5.................................................................................................................................................................... 51
Changing Patterns in Residential Service Systems, 1977-2005................................................................... 51 Changing Patterns in Residential Settings.......................................................................................51
Changes in Number of Residential Service Recipients................................................................... 52 Residential Settings, by Size, of Persons with ID/DD in 1982 and 2005...................................... 52 Section 3: Status and Changes in Medicaid Funded Residential and Related Services............. 55 Chapter 6.................................................................................................................................................................. 57
Background and Summary of Medicaid Long-Term Care Programs...........................................................57 Establishment of the ICF-MR Program......................................................................................... 57 Community ICF-MR Group Homes...............................................................................................58
Home and Community Based Services (HCBS)...........................................................................58 Medicaid Nursing Facilities............................................................................................................59
Chapter 7 ...................................................................................................................................................................61 Utilization of and Expenditures for Medicaid Institutional and Home and
Community Based Services.................................................................................................................... 61 ICF-MR Program Utilization on June 30, 2005............................................................................ 61 Nonstate ICFs-MR.............................................................................................................… 63 State ICF-MR Utilization.............................................................................................................. 63 Large and Community ICFs-MR................................................................................................... 66 Expenditures for ICF-MR Services............................................................................................... 69
Interstate Variations in ICF-MR Expenditures.............................................................................. 71 Medicaid HCBS Recipients........................................................................................................... 71
Expenditures for HCBS Recipients............................................................................................. 74 HCBS Recipients and Residents of Community ICFs-MR.......................................................... 79 ICF-MR and HCBS Recipients and Expenditures.........................................................................79 Variations in State Financial Benefit for Combined ICF-MR and HCBS Programs.....................79 Indexed Utilization Rates..............................................................................................................83 Residential Arrangements of HCBS Recipients........................................................................... 86 Persons with ID/DD in Medicaid Nursing Facilities.....................................................................89 Combined Per Person ICF-MR and HCBS Expenditures............................................................. 89 ICF-MR and HCBS for Persons with ID/DD as a Proportion of All Federal Medicaid Expenditures.............................................................................................................91 Medicaid ID/DD Expenditures Within the Larger State Medicaid Programs...............................93 HCBS and ICF-MR Expenditures, by State, Between 1994 and 2005......................................... 93
Section 4: State Profiles of Selected Service Indicators, 1977-2005..................................................97 Chapter 8................................................................................................................................................................... 99 Profiles of Trends in Residential Services by State..................................................................................... 99
Alabama.........................................................................................................................................100Alaska........................................................................................................................................... 101
Arizona..........................................................................................................................................102 Arkansas....................................................................................................................................... 103 California...................................................................................................................................... 104 Colorado........................................................................................................................................105 Connecticut................................................................................................................................... 106
Delaware........................................................................................................................................107 District of Columbia......................................................................................................................108 Florida......................................................................................................................................... 109 Georgia........................................................................................................................................ 110 Hawaii......................................................................................................................................... 111 Idaho............................................................................................................................................ 112 Illinois......................................................................................................................................... 113 Indiana......................................................................................................................................... 114 Iowa............................................................................................................................................. 115 Kansas......................................................................................................................................... 116 Kentucky..................................................................................................................................... 117 Louisiana..................................................................................................................................... 118 Maine........................................................................................................................................... 119 Maryland..................................................................................................................................... 120 Massachusetts.............................................................................................................................. 121 Michigan...................................................................................................................................... 122 Minnesota.................................................................................................................................... 123 Mississippi................................................................................................................................... 124 Missouri....................................................................................................................................... 125 Montana....................................................................................................................................... 126 Nebraska...................................................................................................................................... 127 Nevada......................................................................................................................................... 128 New Hampshire........................................................................................................................... 129 New Jersey.................................................................................................................................. 130 New Mexico................................................................................................................................ 131 New York.................................................................................................................................... 132 North Carolina............................................................................................................................. 133 North Dakota............................................................................................................................... 134 Ohio............................................................................................................................................. 135 Oklahoma.................................................................................................................................... 136 Oregon......................................................................................................................................... 137 Pennsylvania................................................................................................................................ 138 Rhode Island................................................................................................................................ 139 South Carolina............................................................................................................................. 140 South Dakota............................................................................................................................... 141 Tennessee.................................................................................................................................... 142 Texas........................................................................................................................................... 143 Utah............................................................................................................................................. 144 Vermont....................................................................................................................................... 145 Virginia........................................................................................................................................ 146 Washington.................................................................................................................................. 147 West Virginia.............................................................................................................................. 148
Wisconsin................................................................................................................................... 149 Wyoming..................................................................................................................................... 150 United States............................................................................................................................... 151 References and Data Sources ............................................................................................................................... 153 LIST OF TABLES Table 1.1 Number of State Residential Settings on June 30, 2005 by State................................................................ 4 Table 1.2 Persons with ID/DD Living in State Residential Settings on June 30, 2005 by State.................................. 5 Table 1.3 Average Daily Population of Persons with ID/DD Living in Large State ID/DD Facilities and Percentage Changes, Between 1980-2005, by State......................................................................... 7 Table 1.4 Average Daily Population of Persons with ID/DD in Large State ID/DD and Psychiatric Facilities, 1950-2005........................................................................................................................... 8 Table 1.5 Persons with ID/DD Living in State Residential Settings Per 100,000 of the General Population on June 30, 2005 by State...................................................................................................... 10 Table 1.6 Average Daily Population of Persons with ID/DD in Large State ID/DD and Psychiatric Facilities Per 100,000 of the General Population, 1950-2005............................................................. 11 Table 1.7 Movement of Persons with ID/DD In and Out of Large State ID/DD Facilities in Fiscal Year 2005 by State................................................................................................................... 12 Table 1.8 Movement Patterns in Large State ID/DD Residential Facilities, 1950-2005............................................ 14 Table 1.9 Average per Resident Daily Expenditures in State ID/DD Settings in Fiscal Year 2005 by State....................................................................................................................................... 16 Table 1.10 Average Annual per Resident Expenditures in Large State ID/DD Residential Facilities, 1950-2005........................................................................................................................... 17 Table 1.11 Number of Large State ID/DD Residential Facilities Operating, Closed, and Projected to Close (1960-2006)............................................................................................................................. 20 Table 1.12 Large State ID/DD Facilities, 1960-2006, Including Facility Populations, Per Diem Expenditures, Closures, Projected Closures and Resident Movement by Facility................................................. 21 Table 1.13 Residents of Large Public Residential Facilities by State on June 30, 2003 and June 30, 2005................................................................................................................................................... 33 Table 2.1 Residential Settings for Persons with ID/DD Served by State and Nonstate Agencies on June 30, 2005..................................................................................................................................... 38 Table 2.2 Persons with ID/DD Served by State and Nonstate Agencies on June 30, 2005........................................ 39 Table 2.3 Summary Statistics on the Size of Residential Settings for Persons with ID/DD on June 30, 2005..................................................................................................................................................... 40 Table 2.4 Persons with ID/DD Receiving Residential Services Per 100,000 of State General Population by Size of Residential Setting, June 30, 2005...................................................................................... 41 Table 2.5 Persons with ID/DD on a Waiting List for, But Not Receiving, Residential Services on June 30, 2005..................................................................................................................................... 43 Table 2.6 Congregate Care Settings (including ICFs-MR) and Residents by State on June 30, 2005.................................................................................................................................................... 46 Table 2.7 Host Family/Foster Care Settings and Residents by State on June 30, 2005............................................. 47 Table 2.8 Homes Owned or Leased by Persons with ID/DD and the Number of People Living in Them by State on June 30, 2005...................................................................................................................... 48 Table 2.9 Number of People with ID/DD Receiving Services While Living in the Home of a Family Member on June 30, 2005......................................................................................................................... 49 Table 2.10 State and Nonstate Residential Settings for Persons with ID/DD on June 30 of 1977, 1982, 1987, 1992, 1997, 2002 and 2005.................................................................................................... 51 Table 2.11 Persons with ID/DD in State and Nonstate Residential Settings on June 30 of 1977, 1982, 1987, 1992, 1997, 2002 and 2005..................................................................................................... 53 Table 3.1 ICF-MR Certified Settings by State and Size on June 30, 2005................................................................ 62 Table 3.2 Persons with ID/DD Living in ICF-MR Certified Settings by State and Size on June 30, 2005.................................................................................................................................................. 64
Table 3.3 Number and Percentage of Residents in ICF-MR Settings by State and Size on June 30, 2005.................................................................................................................................................. . 67 Table 3.4 Summary Statistics on ICF-MR Expenditures for Persons with ID/DD by State for Fiscal Year 2005..................................................................................................................................... 70 Table 3.5a Summary Statistics on HCBS Recipients by State on June 30 of Years 1982 through 1994.......................................................................................................................................................... 72 Table 3.5b Summary Statistics on HCBS Recipients by State on June 30 of Years 1995 through 2005.......................................................................................................................................................... 73 Table 3.6a HCBS Expenditures in Thousands of Dollars by State for Years 1987 through 1995............................. 75 Table 3.6b HCBS Expenditures in Thousands of Dollars by State for Years 1996 through 2005............................. 76 Table 3.7 Summary Statistics on HCBS Expenditures by State for Fiscal Year 2005............................................... 77 Table 3.8 HCBS Recipients and Community ICF-MR Residents by State on June 30, 2005.................................... 78 Table 3.9 ICF-MR Residents and HCBS Recipients and ICF-MR and HCBS Expenditures by State on June 30, 2005........................................................................................................................................81 Table 3.10 Summary of Combined ICF-MR and HCBS Contributions and State Benefit Ratios by State for Fiscal Year 2005................................................................................................................................. 82 Table 3.11 Utilization Rates Per 100,000 of State Population for ICF-MR, HCBS and All Residential Service Recipients by State on June 30, 2005..................................................................................... 84 Table 3.12 HCBS Recipients with ID/DD by Reported Type of Residential Setting on June 30, 2005..................................................................................................................................................... 87 Table 3.13 Persons with ID/DD in Nursing Facilities by State on June 30, 2005...................................................... 88 Table 3.14 Medicaid ICF-MR, HCBS and Combined Per Person Expenditures in FY 1993 and FY 2005.............. 90 Table 3.15 Federal Medicaid Expenditures for ICF-MR and HCBS Programs for Persons with ID/DD as a Proportion of All Federal Medicaid Expenditures..................................................................... 91 Table 3.16 Medicaid HCBS and ICF-MR Expenditures Within Total Medicaid Program in Fiscal Year 2005............................................................................................................................................... 92 Table 3.17a Annual Expenditures in Thousands of Dollars for HCBS and ICF-MR, by State in the Years 1994 - 2005......................................................................................................................... 94 Table 3.17b Annual Expenditures in Thousands of Dollars for HCBS and ICF-MR, by State in the Years 1994 - 2005......................................................................................................................... 95 LIST OF FIGURES Figure 1.1 U.S. Trends in Average Daily Population with ID/DD in Large State ID/DD and Psychiatric Facilities, 1950 - 2005.......................................................................................................................... 9 Figure 1.2 U.S. Trends in Average Daily Residents with ID/DD in Large State ID/DD and Psychiatric Facilities Per 100,000 of the General Population, 1950 - 2005.......................................................... 11 Figure 1.3 Average Annual Decreases in State Institution Average Daily Populations in Three and Four-Year Periods, 1968-2005........................................................................................................................ 13 Figure 1.4 Movement Patterns in Large State ID/DD Facilities, 1950 - 2005........................................................... 15 Figure 1.5 Average Annual Per Resident Expenditures in Large State ID/DD Residential Facilities, 1950-2005............................................................................................................................................. 17 Figure 1.6 Average Annual Closures and Planned Closures of Large State ID/DD Facilities, 1960 - 2005................................................................................................................................ 19 Figure 2.1 Average Number of Persons with ID/DD per Residential Setting on June 30 1977, 1982, 1987, 1992, 1997, 2002 and 2005..................................................................................................... 40 Figure 2.2 Percentage of All Residential Service Recipients in Settings with Six or Fewer Residents on June 30, 2005................................................................................................................................... 42 Figure 2.3 Residential Service Recipients Per 100,000 of State General Population on June 30, 2005..................... 42 Figure 2.4 Persons with ID/DD in State and Nonstate Residential Settings on June 30 of 1977, 1982, 1987, 1992, 1997, 2002 and 2005..................................................................................................... 53 Figure 2.5 Persons with ID/DD in Residential Settings of Different Sizes and Types on June 30, 1982 and June 30, 2005......................................................................................................................................... 54 Figure 3.1 ICF-MR Residents as a Proportion of all Residents of State and Nonstate Settings by Size on June 30, 2005....................................................................................................................................... 65
Figure 3.2 Residents of ICFs-MR by Size and State/Nonstate Operation on June 30 1977, 1982, 1987, 1992, 1997, 2003 and 2005...................................................................................................... 66 Figure 3.3 Percentage of All Residential Service Recipients in ICFs-MR on June 30, 2005..................................... 68 Figure 3.4 Number of Residents in ICF-MR and Non ICF-MR Residential Settings with 1-15 and 16 or More Total Residents on June 30, 1977, 1982, 1987, 1992, 1997, 2002 and 2005...................... 69 Figure 3.5 Community ICF-MR & HCBS Recipients as a Percentage of All ICF-MR & HCBS Recipients by State on June 30, 2005..................................................................................................................... 80 Figure 3.6 Service Recipients in Community Settings and Institutions (16 or More Residents) Among Medicaid ICF-MR and HCBS Recipients on June 30, 1982, 1987, 1992, 1997, 2002 and 2005........................................................................................................................................................ 80 Figure 3.7 Total ICF-MR Residents and HCBS Recipients Per 100,000 of State Population by State on June 30, 2005........................................................................................................................................... 85 Figure 3.8 Total Community ICF-MR and HCBS Recipients Per 100,000 of State Population by State on June 30, 2005...................................................................................................... 85 Figure 3.9 ICF-MR and Non ICF-MR Residential Service Recipients Per 100,000 of the U.S. Population, 1962 to 2005............................................................................................................................... 86 Figure 3.10 Average Per Person Annual Expenditures for Medicaid Long-Term Services and Supports, 1993 and 2005 ....................................................................................................................................... 89
i
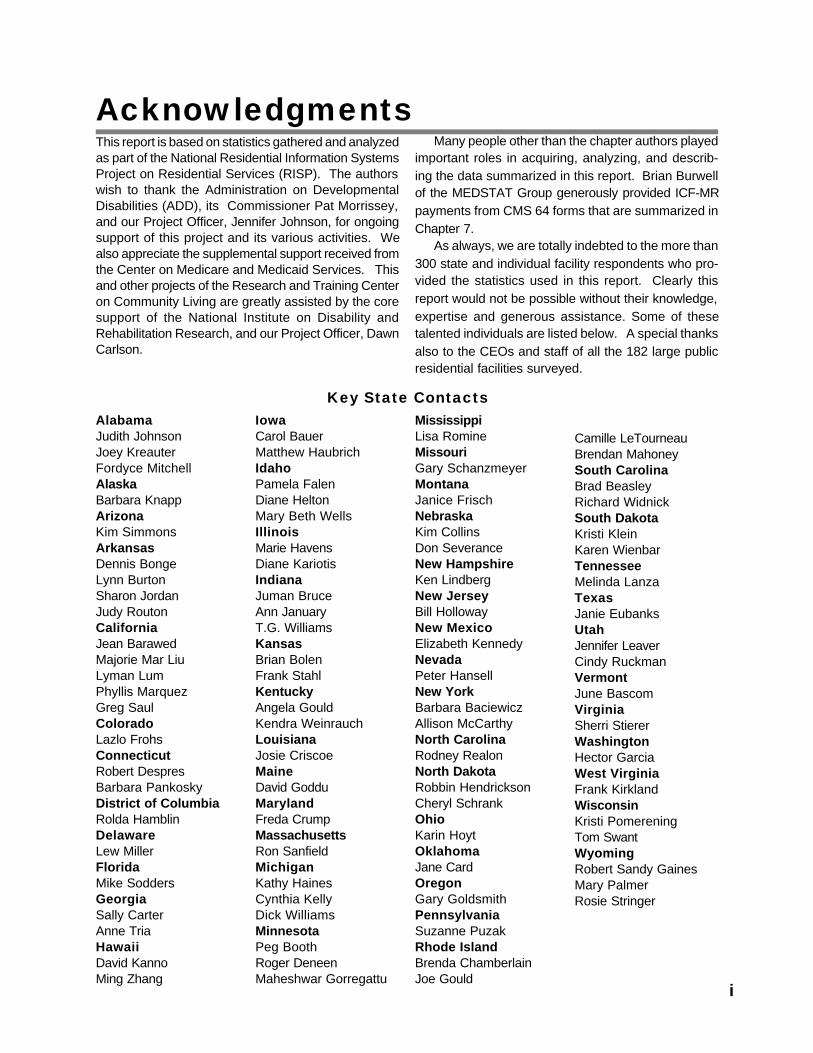
This report is based on statistics gathered and analyzedas part of the National Residential Information SystemsProject on Residential Services (RISP). The authorswish to thank the Administration on DevelopmentalDisabilities (ADD), its Commissioner Pat Morrissey,and our Project Officer, Jennifer Johnson, for ongoingsupport of this project and its various activities. Wealso appreciate the supplemental support received fromthe Center on Medicare and Medicaid Services. Thisand other projects of the Research and Training Centeron Community Living are greatly assisted by the coresupport of the National Institute on Disability andRehabilitation Research, and our Project Officer, DawnCarlson.
AcknowledgmentsMany people other than the chapter authors played
important roles in acquiring, analyzing, and describ-ing the data summarized in this report. Brian Burwellof the MEDSTAT Group generously provided ICF-MRpayments from CMS 64 forms that are summarized inChapter 7.
As always, we are totally indebted to the more than300 state and individual facility respondents who pro-vided the statistics used in this report. Clearly thisreport would not be possible without their knowledge,expertise and generous assistance. Some of thesetalented individuals are listed below. A special thanksalso to the CEOs and staff of all the 182 large publicresidential facilities surveyed.
Key State ContactsAlabamaJudith JohnsonJoey KreauterFordyce MitchellAlaskaBarbara KnappArizonaKim SimmonsArkansasDennis BongeLynn BurtonSharon JordanJudy RoutonCaliforniaJean BarawedMajorie Mar LiuLyman LumPhyllis MarquezGreg SaulColoradoLazlo FrohsConnecticutRobert DespresBarbara PankoskyDistrict of ColumbiaRolda HamblinDelawareLew MillerFloridaMike SoddersGeorgiaSally CarterAnne TriaHawaiiDavid KannoMing Zhang
IowaCarol BauerMatthew HaubrichIdahoPamela FalenDiane HeltonMary Beth WellsIllinoisMarie HavensDiane KariotisIndianaJuman BruceAnn JanuaryT.G. WilliamsKansasBrian BolenFrank StahlKentuckyAngela GouldKendra WeinrauchLouisianaJosie CriscoeMaineDavid GodduMarylandFreda CrumpMassachusettsRon SanfieldMichiganKathy HainesCynthia KellyDick WilliamsMinnesotaPeg BoothRoger DeneenMaheshwar Gorregattu
MississippiLisa RomineMissouriGary SchanzmeyerMontanaJanice FrischNebraskaKim CollinsDon SeveranceNew HampshireKen LindbergNew JerseyBill HollowayNew MexicoElizabeth KennedyNevadaPeter HansellNew YorkBarbara BaciewiczAllison McCarthyNorth CarolinaRodney RealonNorth DakotaRobbin HendricksonCheryl SchrankOhioKarin HoytOklahomaJane CardOregonGary GoldsmithPennsylvaniaSuzanne PuzakRhode IslandBrenda ChamberlainJoe Gould
Camille LeTourneauBrendan MahoneySouth CarolinaBrad BeasleyRichard WidnickSouth DakotaKristi KleinKaren WienbarTennesseeMelinda LanzaTexasJanie EubanksUtahJennifer LeaverCindy RuckmanVermontJune BascomVirginiaSherri StiererWashingtonHector GarciaWest VirginiaFrank KirklandWisconsinKristi PomereningTom SwantWyomingRobert Sandy GainesMary PalmerRosie Stringer

ii
iii
Executive SummaryState Residential ServicesNumber and Size of ResidentialSettingsThe number of state residential settingsdecreased in Fiscal Year 2005. On June 30, 2005states were directly operating 2,507 residentialsettings housing persons with intellectual disabilitiesand related developmental disabilities (ID/DD), 80 lessthan in the previous year. Of these 2,469 werefacilities, special units or other settings primarilyserving persons with ID/DD and 38 were facilitiesprimarily serving persons with psychiatric disabilities.Nine-tenths (91.5%) of the state ID/DD settings had15 or fewer residents, a proportion that increasedslightly from June 2004 (91.0%).
On June 30, 2005 every state except Alaska,District of Columbia, Hawaii, Maine, New Hamp-shire, New Mexico, Rhode Island, Vermont, andWest Virginia was operating at least one largestate ID/DD facility. New Hampshire closed its onlylarge (16 or more residents) state ID/DD facility inJanuary 1991. In 1994 Vermont, Rhode Island andthe District of Columbia closed the last of their largestate ID/DD facilities. New Mexico closed its last largestate facility in 1995 and Alaska did the same in 1997.In 1999, Maine’s last large facility dropped below 16residents and West Virginia and Hawaii closed thelast of their large state ID/DD facilities.
The number of state community residentialsettings decreased in FY 2005 and New York re-mained by far the largest operator of state com-munity residences. State community settings (15or fewer residents) decreased by 2.8% (64 settings)to a total of 2,260 in Fiscal Year 2005. At the end ofFiscal Year 2005, New York had 1,011 state commu-nity settings or 44.7% of the national total.
Number of ResidentsThe population of large state ID/DD facilitiescontinues to fall. The population of large state ID/DD facilities on June 30, 2005 was 40,061, a decreaseof 3.8% from June 30, 2004, continuing a trend firstevident in Fiscal Year 1968. Between Fiscal Years1980 and 2005 large state ID/DD facilities’ average
daily populations decreased by 90,813 (69.1%) to40,532 individuals. More than eighty percent (43) ofall states reduced the average daily populations oftheir large state ID/DD facilities by 50% or more duringthe period.
The population of state community residen-tial settings increased in Fiscal Year 2005. DuringFiscal Year 2005 the number of persons residing instate community settings (15 or fewer residents) in-creased 0.8%, to an end of year total of 12,451 per-sons. The average number of residents per statecommunity setting increased slightly to 5.5 from the2004 level of 5.3 residents. New York accounted forthree-fifths (60.4%) of all residents of state commu-nity settings.
Nationally, the population of large state ID/DDfacilities per 100,000 of the general populationcontinues to fall. On June 30, 2005 there were 13.5persons in large state ID/DD facilities per 100,000 ofthe general U.S. population. This compares with 14.2in 2004, 15.2 in 2003; 16.1 persons in 2001; 18.0 in1999; 19.0 in 1998; 20.0 in 1997; 23.5 in June 1995;and 99.7 in June 1967. Placement rates in 12 stateswere 150% or more of the national average, while in19 states they were half or less of the national aver-age (including 0 in 9 states).
Large state ID/DD facility average daily popu-lations were cut in half in the U.S. and in moststates between 1990 and 2005. The average dailynumber of persons with ID/DD living in large state ID/DD facilities decreased by 51.9% between Fiscal Year1990 and Fiscal Year 2005. The largest proportionaldecreases in large state ID/DD facility average dailypopulations were, of course, in Alaska, the District ofColumbia, Hawaii, Maine, New Hampshire, NewMexico, Rhode Island, Vermont, and West Virginiawhich closed all their large state ID/DD facilities. Inaddition, 24 other states reduced their large state ID/DD facility populations by more than 50% over thefifteen-year period.
iv
Rates of large state facility depopulation haveslowed in the last three years. The average dailypopulation of large state ID/DD facilities decreasedby 9.1% from the beginning to the end of the FiscalYears 2003-2005 period. This was the slowest de-crease of any three year period in more than 30 years.
Admissions, Discharges, and DeathsAdmissions to large state ID/DD facilitiesdecreased in 2005. In Fiscal Year 2005 a total of2,106 persons with ID/DD were admitted to large stateID/DD facilities, a decrease of 4.9% from the previousyear. Admissions were equal to 5.2% of the averagedaily population of these facilities during the year. Fourstates reported no admissions to their large state ID/DD facilities. Ten states reported admissionsexceeding 10% of their average daily population.
Discharge rates of large state ID/DD facilitiesincreased in 2005. In 2005 a total of 2,561 personswith ID/DD were discharged from large state ID/DDfacilities, an increase of 1.1% from 2,534 in 2004.Discharges were equal to 6.3% of the year’s averagedaily population of those facilities (as compared with6.0% in 2004). In 2005, 5 states reported dischargesthat equaled 20% or more of the average daily popu-lation of their large state ID/DD facilities. Seventeenstates with large state ID/DD facilities had dischargesless than 5% of their average daily population.
The death rate among residents of large stateID/DD facilities in 2005 (2.2%) was within the rangeevident throughout the past decade. In 2005 atotal of 905 persons with ID/DD died while residing inlarge state ID/DD facilities. The 2.2% death rate of2005 is above the 2.1% death rate of 2004, 2.0%death rate of 2003 and 1.8% in 2002. Death rateswere 2.0% in 2001, 1.9% in 1999 and 2000, 1.7% in1998, 1.7% in 1996, 1.5% in 1994, 1.4% in 1992 and1.4% in 1990. The small but steady increases in insti-tutional death rates in recent years may be associ-ated with the aging of large state ID/DD facility popu-lations.
ExpendituresIn 2005 expenditures for care in large state ID/DDfacilities continued to increase and reached anational annual average of $148,811 per person.Between 2004 and 2005 average annual expendituresper resident in large state ID/DD facilities increased7.1% from $138,996 to $148,811 (or an average of
$408 per day). The increase controlled for inflationwas 3.5%. Twenty-four states reported annualexpenditures per resident exceeding the nationalaverage. The increase between 2004 and 2005(7.1%) was more than the 6.0% increase from 2003to 2004. The average annual increase for the period1990-2005 (7.2%) remained well below the 15.0%average annual increase between 1970 and 1989.
Facility ClosuresThe closure of large state ID/DD facilitiescontinues. Seven large ID/DD facilities were closedor consolidated in Calender Year 2005; one each inFlorida, Georgia, Indiana, Ohio and Wisconsin, andtwo in Louisiana. Between 1996 and 2005, 58 largestate ID/DD facilities were closed, an average of 5.8closures per year. This compares with an average of1.25 per year between 1976 and 1979, 3.5 per yearbetween 1980 and 1983, 2.75 per year between 1984and 1987, 8.75 per year between 1988 and 1991, and12 per year between 1992 and 1995. Ohio andPennsylvania project that each will close another largestate ID/DD facility in 2006.
All State and Non-StateResidential ServicesNumber and Size of ResidentialSettingsThe number of residential settings for personswith ID/DD is growing very rapidly. On June 30,2005 there were an estimated 152,322 residentialsettings in which persons with ID/DD receivedresidential services from state operated or statelicensed residential service providers (excludingpsychiatric facilities, nursing homes and peoplereceiving services while living with family members).Since 1977 the number of settings in which peoplereceive residential services has grown more thanthirteen-fold. In comparison, on June 30, 1977 therewere 11,008 state licensed or state operatedresidential service settings; on June 30, 1987 therewere 33,477; on June 30, 1995 there were 84,532;and on June 30, 1998 there were 104,765. Of allresidential service settings on June 30, 2005, 2,469were operated or served by state agencies, with theremaining 149,853 residential settings served bynonstate agencies.
v
Most residences licensed or operated by statesfor persons with ID/DD were small and almost allpeople living in small residences were served bynonstate agencies. Of the 152,322 total residentialsettings on June 30, 2005, an estimated 151,331(99.3%) had 15 or fewer residents and 145,626(95.6%) had 6 or fewer residents. The estimated149,071 nonstate settings with 15 or fewer residentsmade up 98.5% of all settings with 15 or fewer resi-dents. The 144,084 nonstate settings with 6 or fewerresidents made up virtually all (98.9%) of the settingswith 6 or fewer residents.
Most large residences were also operated bynonstate agencies. Nonstate agencies operated 782(78.9%) of the total 991 facilities with 16 or more resi-dents. This compares to 80.8% in 1977, 82.7% in1987, 85.6% in 1999 and 78.4% in 2004.
Number of Residents
Between 1977 and 2005, there was a continuingincrease in the total number of persons with ID/DD receiving residential services. Between 1977and 2005 the total number of residential servicerecipients grew 66.0%, from 247,780 to a reported411,215. Total population increases (both nonstateand state settings) were limited to places with 15 orfewer residents, the populations of which increasedby an estimated 303,725 between 1977 and 2005.Total populations of facilities with 16 or more residentsdecreased by 140,290 persons between 1977 and2005. Between 2004 and 2005 residents of settingswith 15 or fewer residents decreased by an estimated6,905 persons, while residents of facilities with 16 ormore residents decreased by 2,082.
The national average rate of placement in resi-dential settings for persons with ID/DD in 2005was 138.7 persons per 100,000 of the generalpopulation. Twenty-four states reported residentialplacement rates (persons served per 100,000 resi-dents of the state) at or above the national average of138.7. The highest rate (317.1 per 100,000 state resi-dents) was in North Dakota. The lowest placementrate (60.5 per 100,000) was reported by Georgia. Tenstates reported placement rates 150% or more of thenational average and three states reported placementrates 50% or less of the national average. The na-tional average placement rate of 138.7 in 2005 waslower than the 2004 rate of 143.1 and higher than the1977 rate of 118.8.
In 2005 about 83.7% of the persons with ID/DDreceiving residential services lived in places with15 or fewer residents, 70.8% lived in places with6 or fewer residents, and 44.8% lived in placeswith 3 or fewer residents. On June 30, 2005, resi-dences of 15 or fewer persons housed an estimated344,149 residents (83.7% of all residents). Settingswith 6 or fewer residents housed 291,142 residents(70.8% of all residents) and settings with 3 or fewerresidents 184,024 (44.8% of all residents). Of the344,149 persons living in places with 15 or fewer resi-dents, 331,698 (96.4%) lived in settings operated bynonstate agencies. The 285,671 persons living innonstate settings with 6 or fewer residents made upalmost all (98.1%) of the 291,142 people living inplaces with 6 or fewer residents.
A substantial majority of persons with ID/DDwho received residential services from nonstateagencies lived in smaller settings, while a sub-stantial majority of persons who lived in state resi-dences lived in large facilities. On June 30, 2005more than nine-tenths (92.5%) of the 358,703 per-sons receiving residential services from nonstateagencies lived in settings of 15 or fewer residents,and nearly four-fifths (79.6%) lived in settings with 6or fewer residents. More than three-fourths (76.3%)of the 52,512 persons living in state operated set-tings were in facilities with 16 or more residents. Ofthe 67,066 residents of residential settings with 16 ormore residents, 40,061 (59.7%) lived in state facili-ties. In 1977, 74.6% of the 207,356 residents of fa-cilities with 16 or more residents lived in state facili-ties.
Interstate VariabilityOnly one state reported a majority of persons withID/DD receiving residential services lived infacilities of 16 or more residents. On June 30, 2005nearly three-fifths (59.2%) of the residents of allsettings in Mississippi lived in facilities with 16 or moreresidents. Nationally, 16.3% of all residential servicerecipients lived in settings of 16 or more residents.
In 46 states a majority of persons with ID/DDreceived residential services in settings with 6 orfewer residents. On June 30, 2005 more than halfof the residents of settings for persons with ID/DD inall but 5 states lived in settings with 6 or fewer resi-dents. In most states one-half or more of the resi-dents lived in settings of 3 or fewer.
vi
State and Nonstate ResidentialSettings by TypeMost people receiving residential services areresidents of “congregate care settings.”Congregate care is provided in settings owned, rentedor managed by the residential services provider, orthe provider’s agents in which paid staff come to thesettings to provide care, supervision, instruction andother support. They include, but are not limited toICFs-MR. An estimated 275,073 persons with ID/DDlived in congregate care settings on June 30, 2005(66.9% of all residential service recipients). A majorityof these persons (209,498 or 76.2%) lived in settingswith 15 or fewer residents and three-fourths of those(156,610 or 74.8%) lived in settings with 6 or fewerresidents.
The number of people living in host family/fos-ter care is slowly increasing. A reported nationaltotal of 35,386 persons with ID/DD lived in host fam-ily/foster care settings on June 30, 2005. This repre-sents a 11.2% decrease from one year earlier. Virtu-ally all (99.9%) host family/foster care residents livedin homes with 6 or fewer residents. Between June30, 1982 and June 30, 2005 the estimated number ofpeople in host family settings increased from approxi-mately 17,150 to 35,386 (106.3%).
About 24.6% of persons receiving ID/DD resi-dential services live in their “own homes” that theyown or lease. An estimated national total of 101,143persons with ID/DD receiving residential services andsupports lived in homes that they owned or leased forthemselves. The number of persons reported livingin homes of their own decreased 5.6% between June30, 2004 and June 30, 2005. Between 1993 and 2005the estimated number of people living in homes oftheir own increased nationally by 198.4% as the move-ment toward consumer controlled housing and sup-ported living continued.
The number of people with ID/DD reported tobe receiving residential services living in settingsof 3 or fewer persons decreased 5.1% between2004 and 2005. An estimated 184,024 (44.8%) ofpersons receiving residential services in 2005 wereliving in homes of 3 or fewer residents. This was morethan 12 times as many as in 1982. Among 42 statesfor which these data were available, persons with ID/DD living in settings of 3 or fewer persons ranged from0.0% to 94.3% of all persons with ID/DD receivingresidential services.
States reported a large number of service re-cipients living in their family homes. In 2005, anestimated 533,048 persons received services in theirfamily homes. This equals 56.5% of all persons re-ceiving ID/DD residential services in or out of theirfamily homes. States reported that recipients of ID/DD family-based services in states ranged from 6.0%to 84.6% of all service recipients.
Patterns of Change in ResidentialService Systems: 1977-2005The number of residential settings in whichpeople received services increased much fasterthan the total number of service recipients.Between 1977 and 2005, the total number ofresidential settings in which people with ID/DDreceived residential services grew from 11,008 to anestimated 152,322 (1,283.7%), while total servicerecipients increased by 66.0%, from about 247,780to an estimated 411,215 individuals.
The nation moved from large facility-centeredto community residential services. In 1977, anestimated 83.7% of the persons with ID/DD receivingresidential services lived in residences of 16 or morepeople. By 2005, an estimated 83.7% lived in com-munity settings of 15 or fewer people, and 70.8% livedin residential settings with 6 or fewer people.
The role of the state as a residential serviceprovider dramatically declined. In 1977, 62.9% ofall residential service recipients lived in state residen-tial settings. By 2005, 12.8% of all residential servicerecipients lived in state residential settings.
On June 30, 2005, there were an estimated73,828 persons waiting for residential services.Based on reports of 41 states it was estimated that73,828 persons not presently receiving ID/DD ser-vices outside their family homes are waiting for suchservices. It would require an estimated 18.0% growthin available residential service capacity to provide resi-dential services to all of the persons currently wait-ing. The required expansion of individual state resi-dential service systems to meet present needs rangedin the reporting states from 0.0% to 173.6%.
vii
Medicaid Funded ServicesIntermediate Care Facilities forPersons with Mental Retardation(ICFs-MR)The total number of ICFs-MR decreased by 78facilities between 2004 to 2005 . On June 30, 2005there were 6,457 ICFs-MR nationwide, as comparedto 6,535 in 2004. Average ICF-MR size in 2005 was15.8 residents; this compares with 186 residents in1977; 74.5 residents in 1982; 37 residents in 1987;22.5 residents in 1992; 17.5 residents in 1997 and16.0 residents in 2004.
In 2005, the population of ICFs-MR continuedto decrease. Between 1982 and 1994 the ICF-MRprogram was notable for its stability in the number ofpersons served. On June 30, 1994 there were142,118 persons living in all ICFs-MR. This compareswith 140,684 on June 30, 1982. By June 1999 thetotal ICF-MR population had decreased to 117,917.The June 2005 population of ICFs-MR was 101,821,a decrease of 2,705 (2.6%) from 104,526 the previ-ous year.
Populations of large ICFs-MR have continuedto decrease steadily. On June 30, 2005 there were61,171 persons living in ICFs-MR of 16 or more resi-dents (60.1% of all ICF-MR residents). This repre-sented a 47.8% decrease from the 117,147 personsin large ICFs-MR in 1988 and a 53.2% decrease from130,767 residents of large ICFs-MR in 1982. The2005 population of large ICFs-MR included 39,378residents of state ICFs-MR and 21,793 residents innonstate ICFs-MR. Between June 30, 1988 and June30, 2005, large state ICF-MR populations decreased53.7% (from 85,064), while large nonstate ICF-MRpopulations decreased by 32.1% (from 32,083).
Almost all residents of large state and nonstateresidential facilities live in ICFs-MR. In 2005,91.2% of persons living in all large state and nonstatefacilities lived in ICF-MR units, and 98.6% of peopleliving in state facilities of 16 or more residents lived inICF-MR units.
In 2005, less than 4 of 10 ICF-MR residents wereliving in state facilities. On June 30, 2005, 39.7%of all ICF-MR residents were living in state facilities.This compares with 44.9% in June 1996; 63.2% inJune 1987; and 87.5% on June 30, 1977. The de-
creased concentration of ICF-MR residents in statefacilities is associated with the general depopulationof large state ID/DD facilities and the increase in thenumber of community ICFs-MR. On June 30, 2005there were 39,378 persons in ICF-MR units of largestate ID/DD facilities (38.7% of all ICF-MR residents).This compares with 53,372 persons in June 1997(42.1% of all ICF-MR residents); 88,424 persons inJune 1987 (61.2% of all ICF-MR residents), and107,081 persons in June 1982 (76.3% of all ICF-MRresidents).
The number of residents of community ICFs-MR decreased slightly in 2005. On June 30, 2005there were 40,650 persons with ID/DD living in com-munity ICFs-MR with 15 or fewer residents. This rep-resents a slight decrease of 0.1% from June 30, 2004.Community ICFs-MR continued to house many morethan the 25,328 persons on June 30, 1987, and the9,985 persons on June 30, 1982. On June 30, 2005,47.3% of residents of community ICFs-MR lived infacilities with 6 or fewer residents. Between June 1982and June 2005 the total number of persons with ID/DD living in ICFs-MR of six or fewer residents in-creased from 2,572 to 22,394. Between June 2004and June 2005 the number of people living in ICFs-MR of 6 or fewer residents increased by 3,143 resi-dents (16.3%).
A relatively small proportion of persons withID/DD in community settings live in ICF-MR certi-fied residences. Nationally, on June 30, 2005 only11.8% of the persons in settings with 15 or fewer resi-dents lived in ICFs-MR. Persons living in settingswith 7 to 15 residents were far more likely to live inICFs-MR than persons living in settings of 6 or fewerresidents; 18,256 (34.4%) of the 53,007 persons liv-ing in settings with 7 to 15 residents lived in ICFs-MR, as compared with 22,394 (7.7%) of the 291,145living in settings with 6 or fewer residents.
In FY 2005 total ICF-MR expenditures weremore than in FY 2004. In Fiscal Year 2005 total fed-eral and state expenditures for ICF-MR services were12.1 billion dollars. This was an increase from 11.9billion dollars in FY 2004. Comparable expenditureswere 10.0 billion in 1997, $8.8 billion in 1992, $5.6billion in 1987, $3.6 billion in 1982 and $1.1 billion in1977.
viii
Per resident ICF-MR expenditures in 2005 con-tinued to increase. In 2005 the average expenditurefor end of year ICF-MR residents was $119,162. Thiscompares with the 2004 average of $114,132. Theaverage 2005 expenditure for average daily residentsin ICFs-MR was $117,600, or 173.3% of the averageper resident expenditure of 16 years earlier. Statesvaried substantially in expenditures per end-of-yearICF-MR resident, from more than $160,000 per yearin twelve states to less than $80,000 per year in eightstates. Total ICF-MR expenditures per person in thegeneral population averaged $40.93 per year nation-ally. Five states spent over twice the national aver-age.
Medicaid Home and CommunityBased Services (HCBS)Growth in HCBS recipients continues. On June30, 2005 there were 443,608 persons with ID/DDreceiving HCBS, an increase of 5.0% over the 422,395recipients on June 30, 2004. Between June 30, 1990and 2005, the number of HCBS recipients grew by403,770 persons (1,013.5%) from 39,838 HCBSrecipients and the number of states providing HCBSincreased from 42 to 51. Forty-nine states increasedtheir number of HCBS recipients by 1,000 or morebetween 1990 and 2005.
The number of people receiving HCBS is morethan four times the number living in ICFs-MR. OnJune 30, 2005 the number of HCBS recipients(443,608) was 435.7% of the number of persons liv-ing in ICFs-MR (101,821). Only eleven years earlieron June 30, 1994 the number of ICF-MR residents(142,118) was greater than the number of HCBS re-cipients (122,075).
The number of people receiving residentialservices outside the family home with HCBS fi-nancing is more than twice the number living inICFs-MR. Of the 51 states with HCBS programs, 47were able to report, in whole or part, the residentialarrangements of their HCBS recipients on June 30,2005. Based on these reports it is estimated that inJune 2005 HCBS financed residental arrangementsfor 241,766 persons with ID/DD outside the homes ofparents or relatives. This estimated number of indi-viduals receiving HCBS-financed residential serviceswas 2.37 times the number of ICF-MR residents.
Expenditures for Medicaid HCBS recipientscontinue to grow and show substantial interstatevariability. In Fiscal Year 2005 expenditures for Med-icaid HCBS recipients were 17.2 billion dollars for443,608 recipients, a per end of year recipient aver-age of $38,679 per year. Expenditures adjusted foraverage daily HCBS recipients were $39,627 per per-son. This represents a 86.5% total or 5.8% averageannual increase in per average daily recipient aver-age expenditures between Fiscal Year 1990 ($21,246)and Fiscal Year 2005. The states with the highestper recipient expenditures in Fiscal Year 2005 wereDelaware ($75,843), Maine ($75,751), Rhode Island($74,006) and Tennessee ($76,226). The states withthe lowest per recipient expenditures in Fiscal Year2005 were California ($19,907), District of Columbia($16,897) and Mississippi ($18,388).
ICF-MR and HCBS CombinedGrowth in the total number of ICF-MR and HCBSrecipients has continued at a steady rate. Thecombined total of 545,429 ICF-MR and HCBSrecipients on June 30, 2005 represented a 12.4%average annual increase between June 30, 1992 andJune 30, 2005. Between 1992 and 2005 the combinedtotal of ICF-MR and HCBS recipients grew by anaverage 25,901 persons per year. Combined totalsof ICF-MR and HCBS recipients increased at anannual average of about 4,995 persons between 1982and 1987 and by about 8,000 persons per yearbetween 1987 and 1992. On June 30, 2005, HCBSrecipients made up 81.3% of the combined total of545,429 ICF-MR and HCBS recipients, as comparedwith just 16.4% on June 30, 1987.
On June 30, 2005 community ICF-MR residentsand HCBS recipients made up 88.8% of all com-munity and institutional residents funded by theICF-MR and HCBS programs. On June 30, 2005residents of community ICFs-MR (15 or fewer resi-dents) and HCBS recipients made up 88.8% of allICF-MR and HCBS recipients. That compares with87.9% in June 2004, 85.9% in June 2002, 81.9% inJune 2000, 78.3% in June 1998; 57.8% in June 1993and 33.0% in June 1988. In all states most of thecombined ICF-MR and HCBS recipients were receiv-ing community services.
There remains remarkable variation amongstates in ICF-MR and HCBS utilization rates. OnJune 30, 2005 there was a national ICF-MR utiliza-
ix
tion rate of 34.4 ICF-MR residents per 100,000 per-sons in the United States. The highest individual stateICF-MR utilization rates were 139.3 in District of Co-lumbia and 120.7 in Louisiana. The highest utiliza-tion of large ICFs-MR were in Arkansas (45.7), Illi-nois (48.4), Iowa (52.5), Louisiana (53.1), Mississippi(69.7), and Ohio (41.2). State HCBS utilization ratesvaried from more than twice the national average of149.7 per 100,000 residents in five states to less thanhalf of the national average in four states. On June30, 2005 nationally there was an average combinedICF-MR and HCBS utilization rate of 184.0 per100,000 of the population. Individual state utilizationrates for the combined programs varied from the high-est rates in Iowa (442.1), Minnesota (330.0), New York(311.8), North Dakota (579.1), South Dakota (339.7),Vermont (322.4) and Wyoming (378.0) to the lowestrates in Kentucky (81.0), Michigan (86.9) and Nevada(63.1).
Medicaid expenditures are disproportionatelygreater for persons in ICFs-MR than HCBS recipi-ents. The annual Medicaid expenditures per aver-age daily recipient of ICF-MR services was $117,600as compared to $39,627 per each HCBS recipient.As a result, nationally in Fiscal Year 2005, HCBS re-cipients made up 81.3% of the total HCBS and ICF-MR recipient population but used only 58.6% of thetotal Medicaid HCBS and ICF-MR expenditures. InFY 2005 total HCBS expenditures were greater thantotal ICF-MR expenditures in 38 states.
Differences in state benefits from Medicaidspending continues. Almost any measure of eachstate’s relative benefits from Medicaid funding yieldssignificant interstate differences. Indexing Fiscal Year2005 federal reimbursements for ICF-MR and HCBSprograms in each state by federal income tax paid byresidents of each state, 11 states received over twicetheir relative federal income contributions tax back inbenefits per $1.00 contributed, Iowa ($2.43), Louisi-ana ($2.56), Maine ($3.41), Mississippi ($2.44), NewMexico ($3.25), New York ($2.06), North Dakota($3.28), South Dakota ($2.11), Vermont ($2.10), WestVirginia ($3.65) and Wyoming ($2.37). By the samemeasure five states received back less than half theirrelative contributions, California ($0.47), District ofColumbia ($0.45), Georgia ($0.43), Michigan ($0.35)and Nevada ($0.36).
Nursing Home ResidentsThe number of persons with ID/DD in NursingFacilities continues to remain relatively stablenationally but with major variations across states.On June 30, 2005 there were an estimated 30,027persons with ID/DD in Medicaid Nursing Facilities.This compares with an estimated 32,899 in June 2004and 38,799 on June 30, 1992. Nationwide, in 2005,6.8% of all persons with ID/DD receiving residentialservices and 5.2% of all with ID/DD receiving servicesthrough Medicaid ICF-MR, HCBS or Nursing Facilityprograms were in Medicaid Nursing Facilities. Thepercentage of residential service recipients in nursingfacilities varied from less than 5% in 24 states to morethan 20% in 2 states.

x

xi
Introduction and Methodology

xii
xiii
IntroductionThe National Residential Information Systems Project(RISP) on Residential Services of the Research andTraining Center on Community Living began in 1977.It has operated on a nearly continuous basis sincethen. This project gathers and reports statistics onpersons with intellectual disabilities and relateddevelopmental disabilities (ID/DD) receivingresidential services, both state and nonstate,Medicaid-funded and non-Medicaid funded programsin the United States, including residential servicesoperated specifically for persons with ID/DD, as wellas persons with ID/DD who are living in statepsychiatric facilities. This particular report providessuch statistics for the year ending June 30, 2005, aswell as comparative statistics from earlier years.
Section 1 of this report presents statistics on stateresidential services for Fiscal Year 2005, with com-parative trend data from earlier years. Chapter 1 pre-sents statistics that were compiled and reported byvarious state agencies. The data collection in Chap-ter 1 represents a continuation of a statistical pro-gram originated by the Office of Mental RetardationCoordination (now the Administration on Developmen-tal Disabilities) in 1968 which gathered statistics onstate ID/DD residential facilities with 16 or more resi-dents. It has since been expanded to include statis-tics on smaller state ID/DD residential settings (thosewith fewer than 15 residents) and on state psychiatricfacilities which house persons with intellectual dis-abilities and related conditions. The addition of statepsychiatric facilities was begun for Fiscal Year 1978,and the smaller state residential settings were addedin Fiscal Year 1986. As indicated at various pointsthroughout this report the statistics gathered as partof the National Residential Information SystemsProject since Fiscal Year 1977 have also been linkedto a longitudinal data base developed by the projectincluding statistics on residents and expenditures ofindividual large (16 or more residents) state ID/DDresidential facilities on June 30, 2005. That data basebegins with the first census of state ID/DD residentialfacilities carried out as part of the U.S. Census of1880.
Section I, Chapter 1 also presents the Fiscal Year2005 statistics as part of the longitudinal trends instate residential facility populations, resident move-ment, and expenditures for state residential facilitycare since 1950. A brief historical review of these
and other preceding surveys since 1950 can be foundin Lakin, Hill, Street, and Bruininks (1986). For a moredetailed review, including surveys and statistics since1880, see Lakin (1979).
Section I, Chapter 2 presents information on av-erage and end of Fiscal Year 2005 populations of stateresidential facilities for persons with ID/DD, averageper diem expenditures during Fiscal Year 2005 bylarge state residential facilities and patterns of largestate residential facility closure. It provides a listingof all large state residential facilities that have oper-ated since 1960, including those that closed in orbefore 2005, and those that are scheduled to close inFiscal Year 2006. These statistics were gatheredthrough the survey of individual state facilities includ-ing traditional state ID/DD residential facilities and ID/DD units contained within state psychiatric or other“mixed use” residential facilities.
Section II of this report presents combined statis-tics on the total numbers of persons with intellectualdisabilities and related developmental disabilities inboth state and nonstate residential settings. Statis-tics in this section have been compiled and reportedby individual state ID/DD agencies. This data set wasdesigned in cooperation with state agencies to per-mit the most comprehensive possible data collectionwhile maintaining congruence with administrative datasets maintained in each of the states. It should benoted that in certain states a significant amount ofstate effort is required to compile the requested sta-tistics, sometimes including separate surveys ofsubstate regions. Occasionally the demands of suchdata collection activities preclude a state’s reportingcompletely for a particular year. In such states statis-tics from the most recent data collection point havebeen substituted for Fiscal Year 2005 data. Whenearlier data are substituted, they are so indicated inthe tables presented.
Section II provides longitudinal trend statistics ontotal (i.e., state and nonstate) ID/DD residential ser-vice systems on the individual state and national lev-els. Section II, Chapter 3 provides data on total stateresidential services systems (i.e., services providedby both state and nonstate agencies). These statis-tics are reported by state/nonstate operation and bysize of residential settings on June 30, 2005. Stateservices include those described in Chapter 1 withthe exception of the psychiatric residential facilities,

xiv
which are excluded in Section II’s focus on the indi-vidual state and national ID/DD residential servicessystems. Although nonstate settings are almost en-tirely privately operated, in a few states local govern-ment agencies also operate residential programs.These local government programs are included withprivate programs in a nonstate category because typi-cally their relationship with the state with respect tolicensing, monitoring and funding is more like that ofa private agency than that of a state program. In ad-dition to state/nonstate operation, four residential set-ting size distinctions are provided: 1 to 3 residents, 4to 6 residents, 7 to 15 residents and 16 or more resi-dents. These size categories were established be-cause they were most congruent with the data thatthe individual states were able to report.
Chapter 4, presents statistics reported by the vari-ous states on residents living in different types of resi-dential settings of state and nonstate operation. Fourseparate categories of residential settings are identi-fied. These were developed after consultation withstate respondents during a 1986 feasibility study ofstates’ abilities to report residents by setting type.Without question this area presents states with thegreatest reporting challenge. States have in total lit-erally hundreds of different names for residential pro-grams and many of these programs have aspectswhich make them subtly different from similarly namedprograms in other states. Even in using just the fourbroad residential setting categories identified below,a few state data systems do not permit the breakdownsrequested. Therefore in some states some residen-tial settings and their residents must be subsumed inthe statistics of another setting type.
Chapter 5 presents Fiscal Year 2005 statisticsalong with longitudinal statistics from earlier years toshow the changing patterns of residential services forpersons with ID/DD from 1977 to 2005. This presen-tation of statistics focuses on overall residential ser-vice utilization as well as the utilization of residentialsettings of different state/nonstate operation, size andtype.
Section III focuses on the utilization of the Medic-aid program to sponsor long-term care services forpersons with intellectual disabilities and related de-velopmental disabilities. Chapter 6 describes the evo-lution of Medicaid involvement in services for persons
with intellectual disabilities and related conditions andthe specific programs funding residential services forpersons with ID/DD. Chapter 7 provides statistics onJune 30, 2005 utilization of these Medicaid programs.It also presents Fiscal Year 2005 statistics within thelongitudinal context of changing Medicaid utilization.This presentation also includes Medicaid residentialservices program utilization within the entire systemof residential services for persons with intellectualdisabilities and related conditions.
Section IV provides state-by-state trends in resi-dential services. Chapter 8 in this section providesindividual state summaries from 1977 to 2005 ofchanges in residential services by facility size, ser-vice recipients per 100,000 of state population andother descriptors for use in monitoring trends andcomparing states.
MethodologyThe contents of this report primarily derive from twodata collection activities. The first is a four-part surveyof designated state agencies and key respondents togather aggregated state statistics. The second is asurvey of administrators of all large (16 or moreresidents) state ID/DD facilities.
State Survey Data CollectionA five-part survey questionnaire for state agencystatistics for Fiscal Year 2005, was mailed with a coverletter to each state’s intellectual disabilities/developmental disabilities program director and thestate’s designated “key data informant” in July 2005.Part 1 of the questionnaire was on state residentialservices including state ICFs-MR. Part 2 gatheredstatistics on nonstate residential settings and residentswith intellectual disabilities and related developmentaldisabilities including nonstate ICFs-MR. Part 3contained questions on Medicaid Home andCommunity Based Services. Part 4 requested thenumber of persons with ID/DD on waiting lists forresidential services. Part 5 requested the number ofpersons with ID/DD living in generic Medicaid nursinghomes on June 30, 2005. Telephone follow-up begantwo weeks after the questionnaires were mailed toconfirm the individual(s) in each state agency whohad accepted responsibility for compiling the statisticsfor each part of the survey. Direct contacts were thenmade with each key data manager to answerquestions about the data requested.
xv
Additional follow-up telephone calls to promoteinitial response and to clarify and edit the statistics onreturned questionnaires continued and summaries ofthe data from each state were verified with each state.Reporting and special notes on state data were com-pleted by the end of May 2006. Compiling statisticsfrom states on the four-part survey took an averageof four telephone conversations involving up to fourdifferent people in each state. In several states con-tacts were made with two or more of the intellectualdisabilities/developmental disabilities, mental healthand Medicaid agencies to gather the required statis-tics.
Limitations are encountered when gathering sta-tistics at the state level. Most notable among theseare the variations that sometimes exist in the types ofstatistics maintained by the various states and thespecific operational definitions governing certain dataelements. For example, in a few states data on firstadmissions, discharges, and deaths were not avail-able according to the specific survey definitions. In afew other states the state statistical systems were notwholly compatible with the uniform data collection ofthis project. General problems in the collection ofthat data are presented in the discussion accompa-nying each table in the body of the report and/or innotes at the foot of tables.
Individual State Residential FacilitySurveyData in Chapter 2 of this report presents results froma survey of each large (16 or more) state ID/DDresidential facility or unit operating on June 30, 2005.
The survey used requested information on largestate facility populations, persons moving in and outof the facilities, per diems and closure plans, if any, ofthe facilities.
As in the past, this survey was conducted in coop-eration with the Association of Public DevelopmentalDisabilities Administrators (formerly the National As-sociation of Superintendents of Public Residential Fa-cilities for the Mentally Retarded).
Historical Statistics on StateResidential FacilitiesThe longitudinal data presented here are derived fromthe following sources: 1) state ID/DD and psychiatricfacilities for the years 1950 to 1968 come from theNational Institute of Mental Health’s surveys of“Patients in Institutions;” 2) state ID/DD facilities forFYs 1969 and 1970 come from surveys conductedby the Office on Mental Retardation Coordination, nowthe Administration on Developmental Disabilities; 3)large state ID/DD facilities for 1971 through 1977come from the surveys of the National Association ofSuperintendents of Public Residential Facilities forPersons with Mental Retardation, now the Associationof Public Developmental Disabilities Administrators;4) psychiatric facilities for 1969 to 1977 come fromthe National Institute of Mental Health’s surveys of“Patients in State and County Mental Hospitals;” and,5) large state ID/DD and psychiatric facilities for theyears 1978 through 2005 come from the ongoing datacollection of this project.

xvi
Section 1Status and Changes in
State Residential Services
3
Chapter 1
Current Populations and Longitudinal Trends of StateResidential Settings (1950-2005)
Kathryn Coucouvanis, Robert W. Prouty, Robert H. Bruininks, and K. Charlie Lakin
states except Alaska, District of Columbia, Hawaii,Maine, New Hampshire, New Mexico, Rhode Island,Vermont, and West Virginia operated at least onelarge (16 or more residents) state ID/DD facility onJune 30, 2005. Ten states reported at least one psy-chiatric facility housing persons with a primary diag-nosis of ID/DD in units other than special ID/DD units(the latter being counted among the ID/DD facilities).States (excluding Colorado) reported a total of 38 psy-chiatric facilities with residents with ID/DD as com-pared with 34 on June 30, 2004.
On June 30, 2005, 22 states were serving per-sons with ID/DD in state “community” settings (with15 or fewer total residents). There were 2,260 com-munity residential settings staffed by state employ-ees on June 30, 2005, including 718 (31.8%) hous-ing 7-15 residents, 856 (37.9%) housing 4-6 residentsand 665 (29.4%) housing 3 or fewer residents. Iowahad 21 state settings of 6 or fewer residents but couldnot furnish the 3 or fewer or 4-6 resident breakdowns.
The greatest number of state community residen-tial settings was in New York (1,011 settings). NewYork operated 44.7% of all such settings in the UnitedStates on June 30, 2005. More than one-half (52.7%)of New York‘s state community residential facilitieshad between 7 and 15 residents. In June 2005, ofthe 1,249 state community ID/DD residential settingsoutside of New York more than four-fifths (85.2%)had 6 or fewer residents.
Residents with ID/DD of State Settings
Table 1.2 presents the number of persons with ID/DD living in state ID/DD residential settings andpsychiatric facilities on June 30, 2005. On June 30,2005 there were 52,904 persons with ID/DD living instate residential settings. This represented adecrease of 1,500 (-2.8%) from the 54,404 residentson June 30, 2004. Of this population, 52,512 (99.3%)persons were residents of settings specifically
This chapter presents statistics by state and size ofstate residential settings serving persons withintellectual disabilities and related developmentaldisabilities (ID/DD). Data on resident populations,resident movement, and costs are presented forFiscal Year (FY) 2005 and national longitudinal trendsare provided for FYs 1950 through 2005. FY 2005’ssize of residence statistics are provided in detail forstate residential settings with 3 or fewer residents, 4to 6 residents, 7 to 15 residents and 16 or moreresidents and for persons with ID/DD residing in largestate psychiatric facilities. Longitudinal populationstatistics are provided for large (16 or more residents)state ID/DD facilities and psychiatric facilities.
FY 2005 data for all ID/DD community settingsand large state facilities, and psychiatric facilitiescome from the annual survey of all states conductedby this project. The longitudinal data presented hereare derived from the list of “References and DataSources,” which includes specific citations for the sur-veys and statistical summaries used to complete thislongitudinal data set. A description of these sourcesis in the “Introduction and Methodology.” A detaileddescription of these surveys can be found in Lakin(1979).
Number of State Residential Settings
Table 1.1 presents statistics by state on the numberof state residential settings serving persons with ID/DD in the United States on June 30, 2005. Thestatistics are broken down for state ID/DD settingswith 1-3 residents, 4-6 residents, 7-15 residents, and16 or more residents, for state psychiatric facilities,and total large state facilities and all state settings.
On June 30, 2005, states reported a total of 2,507state residential settings serving persons with ID/DD,a decline of 80 from the previous year. Of these,2,469 were settings primarily for persons with ID/DD.Of the 2,469 state ID/DD settings, 2,260 had 15 orfewer residents; 209 had 16 or more residents. All
* a state setting is a residence in which the persons providing direct support to the residents are state employees
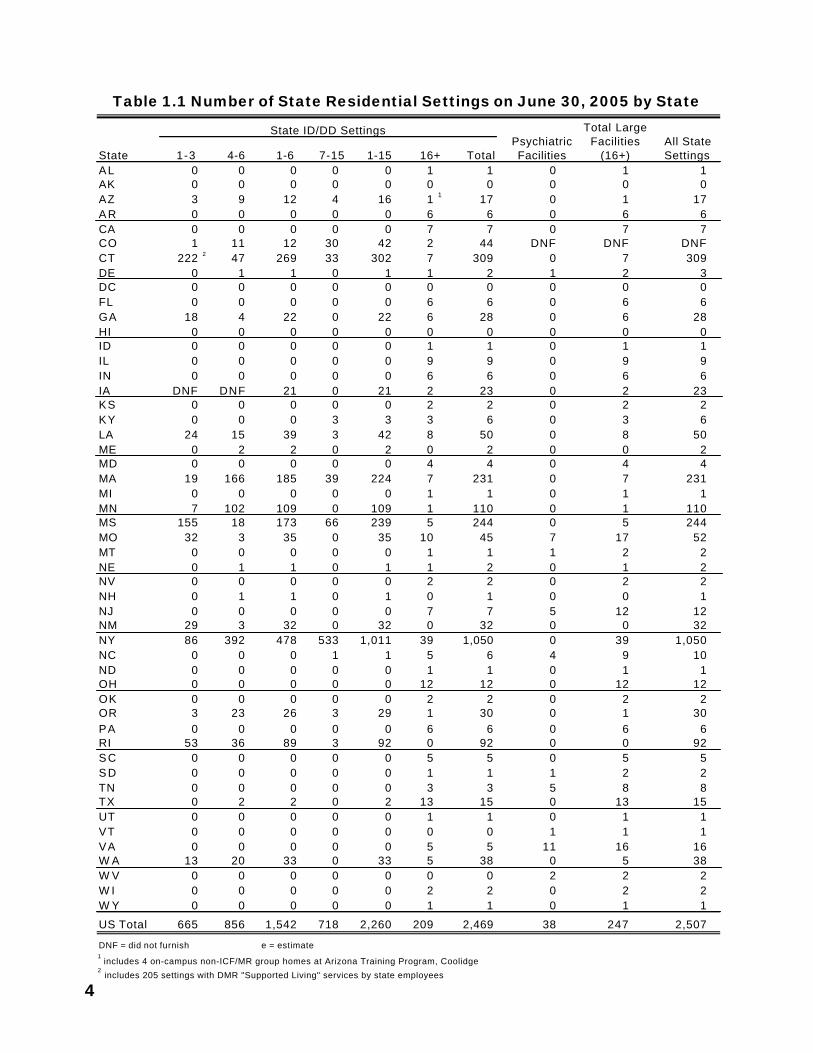
4
Table 1.1 Number of State Residential Settings on June 30, 2005 by State
StateAL 0 0 0 0 0 1 1 0 1 1AK 0 0 0 0 0 0 0 0 0 0AZ 3 9 12 4 16 1 1 17 0 1 17A R 0 0 0 0 0 6 6 0 6 6CA 0 0 0 0 0 7 7 0 7 7CO 1 11 12 30 42 2 44 DNF DNF DNFCT 222 2 47 269 33 302 7 309 0 7 309DE 0 1 1 0 1 1 2 1 2 3DC 0 0 0 0 0 0 0 0 0 0FL 0 0 0 0 0 6 6 0 6 6GA 18 4 22 0 22 6 28 0 6 28HI 0 0 0 0 0 0 0 0 0 0ID 0 0 0 0 0 1 1 0 1 1IL 0 0 0 0 0 9 9 0 9 9IN 0 0 0 0 0 6 6 0 6 6IA DNF DNF 21 0 21 2 23 0 2 23KS 0 0 0 0 0 2 2 0 2 2KY 0 0 0 3 3 3 6 0 3 6LA 24 15 39 3 42 8 50 0 8 50ME 0 2 2 0 2 0 2 0 0 2MD 0 0 0 0 0 4 4 0 4 4MA 19 166 185 39 224 7 231 0 7 231MI 0 0 0 0 0 1 1 0 1 1MN 7 102 109 0 109 1 110 0 1 110MS 155 18 173 66 239 5 244 0 5 244MO 32 3 35 0 35 10 45 7 17 52MT 0 0 0 0 0 1 1 1 2 2NE 0 1 1 0 1 1 2 0 1 2NV 0 0 0 0 0 2 2 0 2 2NH 0 1 1 0 1 0 1 0 0 1NJ 0 0 0 0 0 7 7 5 12 12NM 29 3 32 0 32 0 32 0 0 32NY 86 392 478 533 1,011 39 1,050 0 39 1,050NC 0 0 0 1 1 5 6 4 9 10ND 0 0 0 0 0 1 1 0 1 1OH 0 0 0 0 0 12 12 0 12 12OK 0 0 0 0 0 2 2 0 2 2OR 3 23 26 3 29 1 30 0 1 30PA 0 0 0 0 0 6 6 0 6 6RI 53 36 89 3 92 0 92 0 0 92S C 0 0 0 0 0 5 5 0 5 5S D 0 0 0 0 0 1 1 1 2 2TN 0 0 0 0 0 3 3 5 8 8TX 0 2 2 0 2 13 15 0 13 15UT 0 0 0 0 0 1 1 0 1 1VT 0 0 0 0 0 0 0 1 1 1VA 0 0 0 0 0 5 5 11 16 16W A 13 20 33 0 33 5 38 0 5 38W V 0 0 0 0 0 0 0 2 2 2W I 0 0 0 0 0 2 2 0 2 2W Y 0 0 0 0 0 1 1 0 1 1
US Total 665 856 1,542 718 2,260 209 2,469 38 247 2,507
DNF = did not furnish e = estimate1
includes 4 on-campus non-ICF/MR group homes at Arizona Training Program, Coolidge2 includes 205 settings with DMR "Supported Living" services by state employees
7-15 1-151-3
State ID/DD Settings Total Large Facilities
(16+)All State Settings
Psychiatric FacilitiesTotal16+4-6 1-6
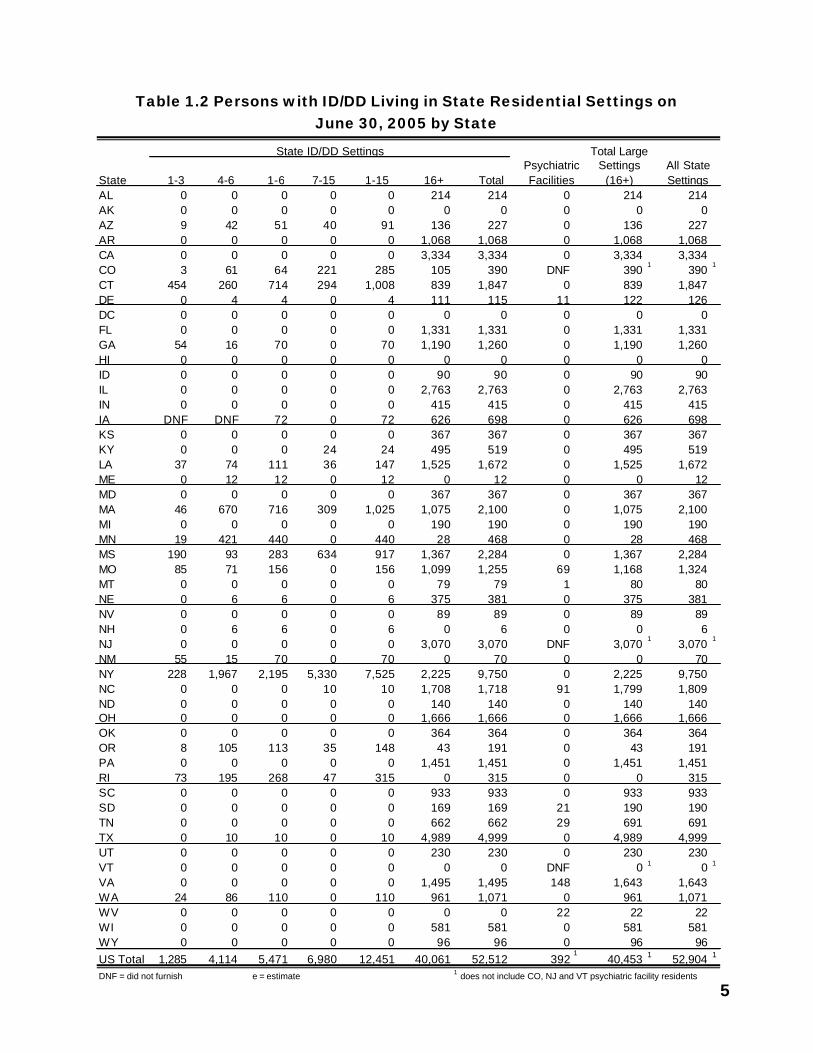
5
Table 1.2 Persons with ID/DD Living in State Residential Settings onJune 30, 2005 by State
StateAL 0 0 0 0 0 214 214 0 214 214AK 0 0 0 0 0 0 0 0 0 0AZ 9 42 51 40 91 136 227 0 136 227AR 0 0 0 0 0 1,068 1,068 0 1,068 1,068CA 0 0 0 0 0 3,334 3,334 0 3,334 3,334CO 3 61 64 221 285 105 390 DNF 390 1 390 1
CT 454 260 714 294 1,008 839 1,847 0 839 1,847DE 0 4 4 0 4 111 115 11 122 126DC 0 0 0 0 0 0 0 0 0 0FL 0 0 0 0 0 1,331 1,331 0 1,331 1,331GA 54 16 70 0 70 1,190 1,260 0 1,190 1,260HI 0 0 0 0 0 0 0 0 0 0ID 0 0 0 0 0 90 90 0 90 90IL 0 0 0 0 0 2,763 2,763 0 2,763 2,763IN 0 0 0 0 0 415 415 0 415 415IA DNF DNF 72 0 72 626 698 0 626 698KS 0 0 0 0 0 367 367 0 367 367KY 0 0 0 24 24 495 519 0 495 519LA 37 74 111 36 147 1,525 1,672 0 1,525 1,672ME 0 12 12 0 12 0 12 0 0 12MD 0 0 0 0 0 367 367 0 367 367MA 46 670 716 309 1,025 1,075 2,100 0 1,075 2,100MI 0 0 0 0 0 190 190 0 190 190MN 19 421 440 0 440 28 468 0 28 468MS 190 93 283 634 917 1,367 2,284 0 1,367 2,284MO 85 71 156 0 156 1,099 1,255 69 1,168 1,324MT 0 0 0 0 0 79 79 1 80 80NE 0 6 6 0 6 375 381 0 375 381NV 0 0 0 0 0 89 89 0 89 89NH 0 6 6 0 6 0 6 0 0 6NJ 0 0 0 0 0 3,070 3,070 DNF 3,070 1 3,070 1
NM 55 15 70 0 70 0 70 0 0 70NY 228 1,967 2,195 5,330 7,525 2,225 9,750 0 2,225 9,750NC 0 0 0 10 10 1,708 1,718 91 1,799 1,809ND 0 0 0 0 0 140 140 0 140 140OH 0 0 0 0 0 1,666 1,666 0 1,666 1,666OK 0 0 0 0 0 364 364 0 364 364OR 8 105 113 35 148 43 191 0 43 191PA 0 0 0 0 0 1,451 1,451 0 1,451 1,451RI 73 195 268 47 315 0 315 0 0 315SC 0 0 0 0 0 933 933 0 933 933SD 0 0 0 0 0 169 169 21 190 190TN 0 0 0 0 0 662 662 29 691 691TX 0 10 10 0 10 4,989 4,999 0 4,989 4,999UT 0 0 0 0 0 230 230 0 230 230VT 0 0 0 0 0 0 0 DNF 0 1 0 1
VA 0 0 0 0 0 1,495 1,495 148 1,643 1,643WA 24 86 110 0 110 961 1,071 0 961 1,071WV 0 0 0 0 0 0 0 22 22 22WI 0 0 0 0 0 581 581 0 581 581WY 0 0 0 0 0 96 96 0 96 96US Total 1,285 4,114 5,471 6,980 12,451 40,061 52,512 392
140,453 1 52,904 1
DNF = did not furnish e = estimate 1 does not include CO, NJ and VT psychiatric facility residents
State ID/DD SettingsPsychiatric Facilities
Total Large Settings
(16+)All State Settings1-3 4-6 1-6 7-15 1-15 16+ Total
6
designated for persons with ID/DD and 392 (0.7%)persons were residents of psychiatric facilities.
Of the 52,512 persons living in state ID/DD set-tings on June 30, 2005, 5,471 (10.4%) were in set-tings of 6 or fewer residents, with 3,625 (66.3%) ofthem concentrated in three states (Connecticut, Mas-sachusetts and New York). Of the 6,980 (13.3%) per-sons in settings with 7 to 15 residents, 5,330 (76.4%)were in New York. There were 40,061 persons instate ID/DD facilities of 16 or more residents on June30, 2005, a decrease from 41,653 a year earlier. Morethan two-fifths (40.9%) of the total of large state facil-ity residents lived in five states (California, Illinois, NewJersey, New York and Texas), each with more than2,200 residents of such facilities.
The decrease in the number of residents of largestate ID/DD facilities continued a trend first evident inFY 1968. The 3.8% rate of decrease between June30, 2004 and June 30, 2005 compares with decreasesof 2.8% in FY2004 and FY2003; 4.1% in FY2002;3.0% in FY2001; 3.6% in FY 2000; 4.6% in FY 1999;6.1% in FY 1998; 6.0 % in FY 1997; 6.0% in FY 1996;5.6% in FY 1995; 5.8% in FY 1994; and 6.4% in FY1993. A factor in the slowing rate ofdeinstitutionalization is the number of states (9) thathave no one left in large state ID/DD facilities andcannot, therefore, continue to contribute to furtherpopulation reductions.
Change in Average Daily Population:1980-2005
Table 1.3 presents summaries of the average dailypopulation of large state ID/DD facilities by state forFYs 1980, 1985, 1990, 1995, 2000, 2003, 2004 and2005 and the percentage of change in average dailypopulation between 1980, 1985, 1990, 1995, 2000and 2005 respectively. The average daily populationis the sum of the number of people living in a facilityon each of the days of the year divided by the numberof days of the year. In FY 2005, the average dailypopulation of large state ID/DD residential facilitieswas 40,532 people, a reduction of 1,588 (3.8%) fromthe 42,120 average daily population in FY 2004.
Average daily populations of large state ID/DDfacilities decreased by 90,813 (69.1%) between 1980and 2005. More than four-fifths (84.3%) of the statesreduced their populations in large state ID/DD facili-ties by more than 50% during the period. In 19 states,Alabama, Alaska, Colorado, District of Columbia, Ha-waii, Indiana, Maine, Maryland, Michigan, Minnesota,
New Hampshire, New Mexico, New York, North Da-kota, Oregon, Pennsylvania, Rhode Island, Vermont,and West Virginia decreases were 80% or more.
In the first five years of this period (1980-1985)average daily population of large state ID/DD facili-ties decreased by 21,731 (16.5%) or an annual aver-age decrease of 4,346 residents (3.3% per year). Inthe next five years (1985-1990) large state ID/DD fa-cilities’ average daily populations decreased by 25,375(23.1%) or an annual average decrease of 5,075 resi-dents (4.6%). Between 1990 and 1995 average dailypopulations of large state ID/DD facilities decreasedby 20,477 (24.3%) or an average of 4,095 (4.9%) resi-dents per year. Between 1995 and 2000 the averagedaily populations decreased by 15,890 (24.9%) or anannual average decrease of 3,178 (5.0%). In the lastfive years between 2000 and 2005, the average dailypopulations decreased only 7,340 (15.3%) and theannual average decrease of 1,468 (3.1%) was lessthan half the annual decrease of five years before.
All states reduced their average daily populationof large ID/DD facilities between 1990 and 2005. In33 states the average daily population decreased bymore than 50% over the 15 year period. Fifteen statesreduced their average daily populations by more than75% between 1990 and 2005 (Alabama, Alaska, Colo-rado, District of Columbia, Hawaii, Indiana, Maine,Michigan, Minnesota, New Hampshire, New Mexico,Oregon, Rhode Island, Vermont, and West Virginia).
Average Daily Residents with ID/DD inLarge State ID/DD and PsychiatricFacilities
Table 1.4 reports average daily population of residentswith ID/DD in large state ID/DD facilities andpsychiatric facilities in selected years between 1950and 2005. The gradual depopulation of large stateresidential facilities for persons with ID/DD has beenoccurring on a national basis since 1967. Nationally,there has been a decreasing total residentialpopulation of large state residential facilities for alltypes of mental disability (i.e., psychiatric and ID/DD)since 1956. Although the total population in statepsychiatric facilities peaked in 1955, the number ofpersons with a primary diagnosis of intellectualdisability in state psychiatric facilities continued toincrease until 1961. In 1961, there were nearly 42,000persons with a primary diagnosis of intellectualdisability in such facilities. The combined total ofpersons with ID/DD in both large state ID/DD andpsychiatric facilities in 1961 was 209,114. By 1967,
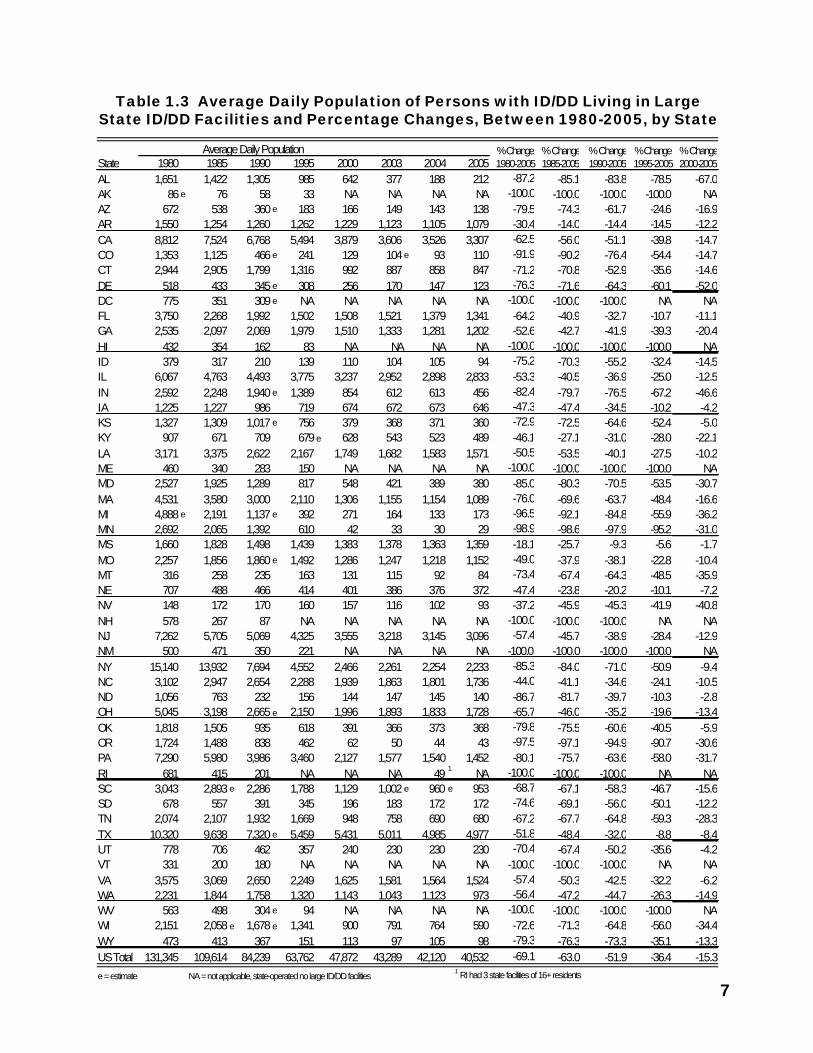
7
Table 1.3 Average Daily Population of Persons with ID/DD Living in LargeState ID/DD Facilities and Percentage Changes, Between 1980-2005, by State
State 1980 1985 1990 1995 2000 2003 2004 2005AL 1,651 1,422 1,305 985 642 377 188 212 -87.2 -85.1 -83.8 -78.5 -67.0AK 86e 76 58 33 NA NA NA NA -100.0 -100.0 -100.0 -100.0 NAAZ 672 538 360e 183 166 149 143 138 -79.5 -74.3 -61.7 -24.6 -16.9AR 1,550 1,254 1,260 1,262 1,229 1,123 1,105 1,079 -30.4 -14.0 -14.4 -14.5 -12.2CA 8,812 7,524 6,768 5,494 3,879 3,606 3,526 3,307 -62.5 -56.0 -51.1 -39.8 -14.7CO 1,353 1,125 466e 241 129 104e 93 110 -91.9 -90.2 -76.4 -54.4 -14.7CT 2,944 2,905 1,799 1,316 992 887 858 847 -71.2 -70.8 -52.9 -35.6 -14.6DE 518 433 345e 308 256 170 147 123 -76.3 -71.6 -64.3 -60.1 -52.0DC 775 351 309e NA NA NA NA NA -100.0 -100.0 -100.0 NA NAFL 3,750 2,268 1,992 1,502 1,508 1,521 1,379 1,341 -64.2 -40.9 -32.7 -10.7 -11.1GA 2,535 2,097 2,069 1,979 1,510 1,333 1,281 1,202 -52.6 -42.7 -41.9 -39.3 -20.4HI 432 354 162 83 NA NA NA NA -100.0 -100.0 -100.0 -100.0 NAID 379 317 210 139 110 104 105 94 -75.2 -70.3 -55.2 -32.4 -14.5IL 6,067 4,763 4,493 3,775 3,237 2,952 2,898 2,833 -53.3 -40.5 -36.9 -25.0 -12.5IN 2,592 2,248 1,940 e 1,389 854 612 613 456 -82.4 -79.7 -76.5 -67.2 -46.6IA 1,225 1,227 986 719 674 672 673 646 -47.3 -47.4 -34.5 -10.2 -4.2KS 1,327 1,309 1,017 e 756 379 368 371 360 -72.9 -72.5 -64.6 -52.4 -5.0KY 907 671 709 679e 628 543 523 489 -46.1 -27.1 -31.0 -28.0 -22.1LA 3,171 3,375 2,622 2,167 1,749 1,682 1,583 1,571 -50.5 -53.5 -40.1 -27.5 -10.2ME 460 340 283 150 NA NA NA NA -100.0 -100.0 -100.0 -100.0 NAMD 2,527 1,925 1,289 817 548 421 389 380 -85.0 -80.3 -70.5 -53.5 -30.7MA 4,531 3,580 3,000 2,110 1,306 1,155 1,154 1,089 -76.0 -69.6 -63.7 -48.4 -16.6MI 4,888 e 2,191 1,137 e 392 271 164 133 173 -96.5 -92.1 -84.8 -55.9 -36.2MN 2,692 2,065 1,392 610 42 33 30 29 -98.9 -98.6 -97.9 -95.2 -31.0MS 1,660 1,828 1,498 1,439 1,383 1,378 1,363 1,359 -18.1 -25.7 -9.3 -5.6 -1.7MO 2,257 1,856 1,860 e 1,492 1,286 1,247 1,218 1,152 -49.0 -37.9 -38.1 -22.8 -10.4MT 316 258 235 163 131 115 92 84 -73.4 -67.4 -64.3 -48.5 -35.9NE 707 488 466 414 401 386 376 372 -47.4 -23.8 -20.2 -10.1 -7.2NV 148 172 170 160 157 116 102 93 -37.2 -45.9 -45.3 -41.9 -40.8NH 578 267 87 NA NA NA NA NA -100.0 -100.0 -100.0 NA NANJ 7,262 5,705 5,069 4,325 3,555 3,218 3,145 3,096 -57.4 -45.7 -38.9 -28.4 -12.9NM 500 471 350 221 NA NA NA NA -100.0 -100.0 -100.0 -100.0 NANY 15,140 13,932 7,694 4,552 2,466 2,261 2,254 2,233 -85.3 -84.0 -71.0 -50.9 -9.4NC 3,102 2,947 2,654 2,288 1,939 1,863 1,801 1,736 -44.0 -41.1 -34.6 -24.1 -10.5ND 1,056 763 232 156 144 147 145 140 -86.7 -81.7 -39.7 -10.3 -2.8OH 5,045 3,198 2,665 e 2,150 1,996 1,893 1,833 1,728 -65.7 -46.0 -35.2 -19.6 -13.4OK 1,818 1,505 935 618 391 366 373 368 -79.8 -75.5 -60.6 -40.5 -5.9OR 1,724 1,488 838 462 62 50 44 43 -97.5 -97.1 -94.9 -90.7 -30.6PA 7,290 5,980 3,986 3,460 2,127 1,577 1,540 1,452 -80.1 -75.7 -63.6 -58.0 -31.7RI 681 415 201 NA NA NA 49 1 NA -100.0 -100.0 -100.0 NA NASC 3,043 2,893 e 2,286 1,788 1,129 1,002 e 960 e 953 -68.7 -67.1 -58.3 -46.7 -15.6SD 678 557 391 345 196 183 172 172 -74.6 -69.1 -56.0 -50.1 -12.2TN 2,074 2,107 1,932 1,669 948 758 690 680 -67.2 -67.7 -64.8 -59.3 -28.3TX 10,320 9,638 7,320 e 5,459 5,431 5,011 4,985 4,977 -51.8 -48.4 -32.0 -8.8 -8.4UT 778 706 462 357 240 230 230 230 -70.4 -67.4 -50.2 -35.6 -4.2VT 331 200 180 NA NA NA NA NA -100.0 -100.0 -100.0 NA NAVA 3,575 3,069 2,650 2,249 1,625 1,581 1,564 1,524 -57.4 -50.3 -42.5 -32.2 -6.2WA 2,231 1,844 1,758 1,320 1,143 1,043 1,123 973 -56.4 -47.2 -44.7 -26.3 -14.9WV 563 498 304e 94 NA NA NA NA -100.0 -100.0 -100.0 -100.0 NAWI 2,151 2,058 e 1,678 e 1,341 900 791 764 590 -72.6 -71.3 -64.8 -56.0 -34.4WY 473 413 367 151 113 97 105 98 -79.3 -76.3 -73.3 -35.1 -13.3US Total 131,345 109,614 84,239 63,762 47,872 43,289 42,120 40,532 -69.1 -63.0 -51.9 -36.4 -15.3
e = estimate NA = not applicable, state-operated no large ID/DD facilities1 RI had 3 state facilities of 16+ residents
% Change 2000-2005
% Change 1980-2005
% Change 1985-2005
% Change 1990-2005
% Change 1995-2005
Average Daily Population

8
Table 1.4 Average Daily Populationof Persons with ID/DD in Large StateID/DD and Psychiatric Facilities,1950-2005
the number of persons with ID/DD in state psychiatricfacilities had decreased to 33,850, but the totalnumber of persons with ID/DD in all large statefacilities had increased to 228,500 (194,650 of whomwere in large state ID/DD facilities.) This was thehighest total ever.
Since 1967, the number of persons with ID/DD inall large state residential facilities has decreased verysignificantly. During this period the number of per-sons with ID/DD in state psychiatric facilities de-creased much more rapidly than did the number ofpersons in large state ID/DD facilities. The differentrates of depopulation reflect a number of factors. Forone, the depopulation of state psychiatric facilitiesoccurred earlier and more rapidly than the depopula-tion of state ID/DD facilities. Between 1960 and 1980the total populations of state psychiatric facilities de-creased by about 75% (Zappolo, Lakin & Hill, 1990).
This rapid depopulation and frequent closing of facili-ties has contributed to major reductions in residentswith all types of disability, including ID/DD. Relatedlyover the years, many large state residential facilitiesbecame primarily dedicated to populations with ID/DD or developed independent ID/DD units on thegrounds of what were historically public psychiatricfacilities.
These changes were prompted by Medicaid leg-islation in the late 1960s and early 1970s that allowedstates to obtain federal cost-sharing of institutionalservices to persons with ID/DD in Intermediate CareFacilities-Mental Retardation (ICFs-MR) and in nurs-ing homes, but excluded residents of facilities for“mental diseases” from participation in Medicaid, ex-cept for children and elderly residents. Distinct unitsfor persons with ID/DD within psychiatric facilitiescould become ICF-MR certified. Many were and thoseunits within the definitions employed in this study arenow classified among the large state ID/DD residen-tial facilities.
The average daily number of persons with ID/DDin large state ID/DD facilities in FY 2005 (40,532) wasonly 20.8% of the average in large state ID/DD facili-ties in 1967, and the average of persons with ID/DDin all large state residential facilities (40,924) was only17.9% of the 1967 average. Figure 1.1 shows therelative contribution of state ID/DD and state psychi-atric facilities to the total average daily population ofresidents with ID/DD in all large state residential fa-cilities.
Residents with ID/DD of Large State ID/DD and Psychiatric Facilities per 100,000of the General Population
Indexing the population of large state facilities by thegeneral population of states or the U.S. at a giventime permits a better picture of the relative use of thesesettings for persons with ID/DD. This statistic isreferred to here as the “placement rate.” Placementrate is reported for the end-of-year population in Table1.5 and is shown as a trend based on the annualaverage resident populations in Table 1.6 and Figure1.2.
Residents with ID/DD of state residential settingsper 100,000 of the general population on June 30,2005. Table 1.5 indexes the population of personswith ID/DD living in state residential settings June 30,2005 by 100,000 of each state’s general population.The national placement rate for all state residential
Y e a r1 9 5 0 1 2 4 , 3 0 4 2 3 , 9 0 5 1 4 8 , 2 0 91 9 5 5 1 3 8 , 8 3 1 3 4 , 9 9 9 1 7 3 , 8 3 01 9 6 0 1 6 3 , 7 3 0 3 7 , 6 4 1 2 0 1 , 3 7 11 9 6 5 1 8 7 , 3 0 5 3 6 , 2 8 5 2 2 3 , 5 9 01 9 6 7 1 9 4 , 6 5 0 3 3 , 8 5 0 2 2 8 , 5 0 01 9 7 0 1 8 6 , 7 4 3 3 1 , 8 8 4 2 1 8 , 6 2 71 9 7 3 1 7 3 , 7 7 5 3 0 , 2 3 7 2 0 4 , 0 1 21 9 7 7 1 5 1 , 5 3 2 1 5 , 5 2 4 1 6 7 , 0 5 61 9 8 0 1 3 1 , 3 4 5 9 , 4 0 5 1 4 0 , 7 5 01 9 8 2 1 1 7 , 1 6 0 7 , 8 6 5 1 2 5 , 0 2 51 9 8 4 1 1 1 , 3 3 3 5 , 0 9 6 1 1 6 , 4 2 91 9 8 6 1 0 0 , 1 9 0 3 , 1 0 6 1 0 3 , 2 9 61 9 8 8 9 1 , 5 8 2 1 , 9 3 3 9 3 , 5 1 51 9 8 9 8 8 , 6 9 1 1 , 6 0 5 9 0 , 2 9 61 9 9 0 8 4 , 2 3 9 1 , 4 8 7 8 5 , 7 2 61 9 9 1 8 0 , 2 6 9 1 , 5 9 4 8 1 , 8 6 31 9 9 2 7 5 , 1 5 1 1 , 5 6 1 7 6 , 7 1 21 9 9 3 7 1 , 4 7 7 1 , 7 4 1 7 3 , 2 1 81 9 9 4 6 7 , 6 7 3 1 , 6 1 3 6 9 , 2 8 61 9 9 5 6 3 , 7 6 2 1 , 3 8 1 e 6 5 , 1 4 31 9 9 6 5 9 , 9 3 6 1 , 0 7 5 e 6 1 , 0 1 11 9 9 7 5 6 , 1 6 1 1 , 0 7 5 e 5 7 , 2 3 61 9 9 8 5 2 , 4 6 9 1 , 0 0 3 e 5 3 , 4 7 21 9 9 9 5 0 , 0 9 4 9 6 2 e 1 5 1 , 0 5 6
1
2 0 0 0 4 7 , 8 7 2 4 8 81
4 8 , 3 6 01
2 0 0 1 4 6 , 2 3 6 5 6 52
4 6 , 8 0 12
2 0 0 2 4 4 , 5 9 8 2 6 7 2 4 4 , 8 6 5 2
2 0 0 3 4 3 , 2 8 9 3 8 63
4 3 , 6 7 53
2 0 0 4 4 2 , 1 2 0 3 9 4 4 4 2 , 5 1 4 4
2 0 0 5 4 0 , 5 3 2 3 9 2 5 4 0 , 9 2 4 5
1 d o e s n o t i n c l u d e N Y p s y c h i a t r i c f a c i l i t i e s2 d o e s n o t i n c l u d e N J a n d N Y p s y c h i a t r i c f a c i l i t e s
3 d o e s n o t i n c l u d e N J , N Y a n d V A p s y c h i a t r i c f a c i l i t i e s4 d o e s n o t i n c l u d e I N a n d N J p s y c h i a t r i c f a c i l i t i e s
5 d o e s n o t i n c l u d e C O , N J a n d V T p s y c h i a t r i c f a c i l i t i e s
e = e s t i m a t e
P s y c h i a t r i c T o t a lI D / D D
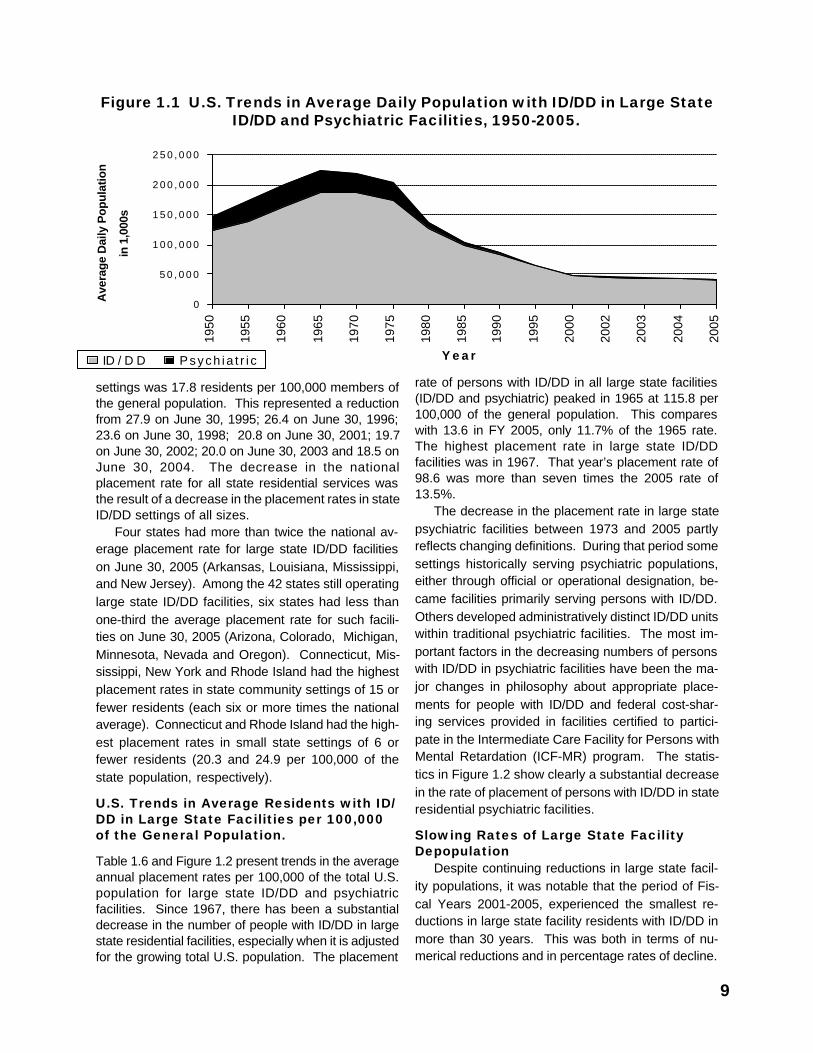
9
Figure 1.1 U.S. Trends in Average Daily Population with ID/DD in Large StateID/DD and Psychiatric Facilities, 1950-2005.
settings was 17.8 residents per 100,000 members ofthe general population. This represented a reductionfrom 27.9 on June 30, 1995; 26.4 on June 30, 1996;23.6 on June 30, 1998; 20.8 on June 30, 2001; 19.7on June 30, 2002; 20.0 on June 30, 2003 and 18.5 onJune 30, 2004. The decrease in the nationalplacement rate for all state residential services wasthe result of a decrease in the placement rates in stateID/DD settings of all sizes.
Four states had more than twice the national av-erage placement rate for large state ID/DD facilitieson June 30, 2005 (Arkansas, Louisiana, Mississippi,and New Jersey). Among the 42 states still operatinglarge state ID/DD facilities, six states had less thanone-third the average placement rate for such facili-ties on June 30, 2005 (Arizona, Colorado, Michigan,Minnesota, Nevada and Oregon). Connecticut, Mis-sissippi, New York and Rhode Island had the highestplacement rates in state community settings of 15 orfewer residents (each six or more times the nationalaverage). Connecticut and Rhode Island had the high-est placement rates in small state settings of 6 orfewer residents (20.3 and 24.9 per 100,000 of thestate population, respectively).
U.S. Trends in Average Residents with ID/DD in Large State Facilities per 100,000of the General Population.
Table 1.6 and Figure 1.2 present trends in the averageannual placement rates per 100,000 of the total U.S.population for large state ID/DD and psychiatricfacilities. Since 1967, there has been a substantialdecrease in the number of people with ID/DD in largestate residential facilities, especially when it is adjustedfor the growing total U.S. population. The placement
rate of persons with ID/DD in all large state facilities(ID/DD and psychiatric) peaked in 1965 at 115.8 per100,000 of the general population. This compareswith 13.6 in FY 2005, only 11.7% of the 1965 rate.The highest placement rate in large state ID/DDfacilities was in 1967. That year’s placement rate of98.6 was more than seven times the 2005 rate of13.5%.
The decrease in the placement rate in large statepsychiatric facilities between 1973 and 2005 partlyreflects changing definitions. During that period somesettings historically serving psychiatric populations,either through official or operational designation, be-came facilities primarily serving persons with ID/DD.Others developed administratively distinct ID/DD unitswithin traditional psychiatric facilities. The most im-portant factors in the decreasing numbers of personswith ID/DD in psychiatric facilities have been the ma-jor changes in philosophy about appropriate place-ments for people with ID/DD and federal cost-shar-ing services provided in facilities certified to partici-pate in the Intermediate Care Facility for Persons withMental Retardation (ICF-MR) program. The statis-tics in Figure 1.2 show clearly a substantial decreasein the rate of placement of persons with ID/DD in stateresidential psychiatric facilities.
Slowing Rates of Large State FacilityDepopulation
Despite continuing reductions in large state facil-ity populations, it was notable that the period of Fis-cal Years 2001-2005, experienced the smallest re-ductions in large state facility residents with ID/DD inmore than 30 years. This was both in terms of nu-merical reductions and in percentage rates of decline.
0
5 0 , 0 0 0
1 0 0 , 0 0 0
1 5 0 , 0 0 0
2 0 0 , 0 0 0
2 5 0 , 0 0 0
1950
1955
1960
1965
1970
1975
1980
1985
1990
1995
2000
2002
2003
2004
2005
Y e a r
Ave
rage
Dai
ly P
opul
atio
n
in 1
,000
s
ID / D D Psych ia t r i c
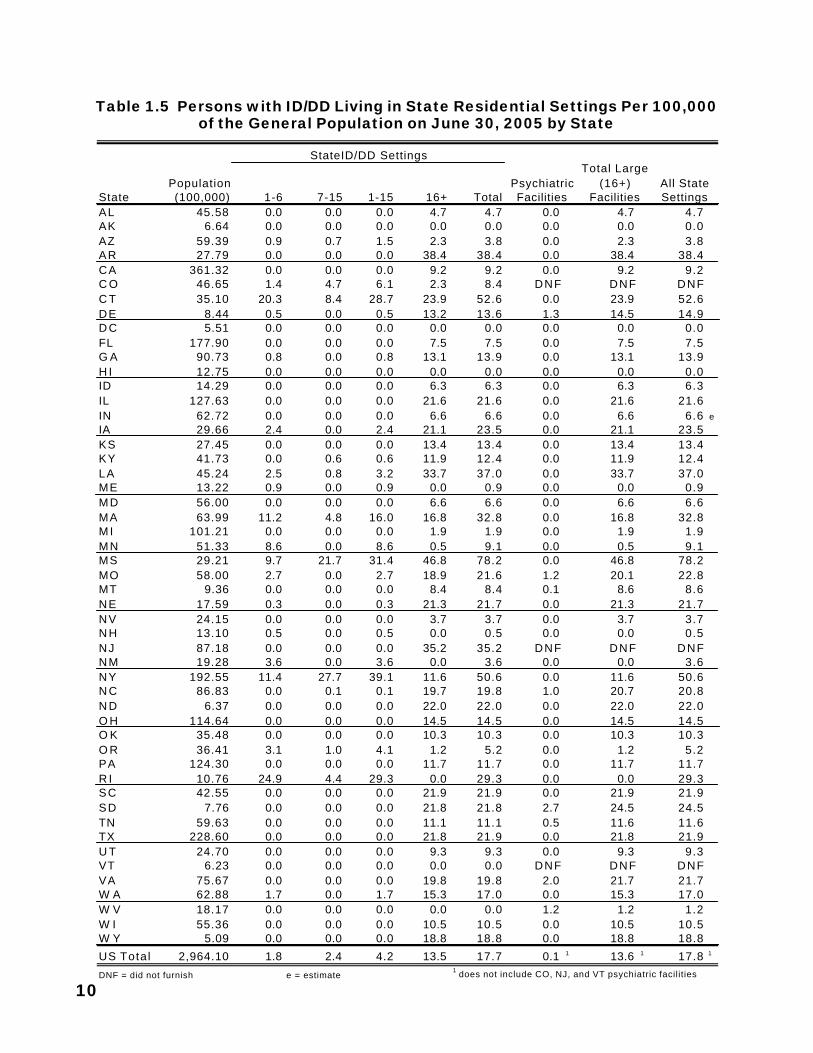
10
Table 1.5 Persons with ID/DD Living in State Residential Settings Per 100,000of the General Population on June 30, 2005 by State
StateID/DD Settings
State 1-6 7-15 1-15 16+ TotalAL 45.58 0.0 0.0 0.0 4.7 4.7 0.0 4.7 4.7AK 6.64 0.0 0.0 0.0 0.0 0.0 0.0 0.0 0.0AZ 59.39 0.9 0.7 1.5 2.3 3.8 0.0 2.3 3.8AR 27.79 0.0 0.0 0.0 38.4 38.4 0.0 38.4 38.4CA 361.32 0.0 0.0 0.0 9.2 9.2 0.0 9.2 9.2C O 46.65 1.4 4.7 6.1 2.3 8.4 DNF DNF DNFC T 35.10 20.3 8.4 28.7 23.9 52.6 0.0 23.9 52.6DE 8.44 0.5 0.0 0.5 13.2 13.6 1.3 14.5 14.9D C 5.51 0.0 0.0 0.0 0.0 0.0 0.0 0.0 0.0FL 177.90 0.0 0.0 0.0 7.5 7.5 0.0 7.5 7.5G A 90.73 0.8 0.0 0.8 13.1 13.9 0.0 13.1 13.9H I 12.75 0.0 0.0 0.0 0.0 0.0 0.0 0.0 0.0ID 14.29 0.0 0.0 0.0 6.3 6.3 0.0 6.3 6.3IL 127.63 0.0 0.0 0.0 21.6 21.6 0.0 21.6 21.6IN 62.72 0.0 0.0 0.0 6.6 6.6 0.0 6.6 6.6 e
IA 29.66 2.4 0.0 2.4 21.1 23.5 0.0 21.1 23.5KS 27.45 0.0 0.0 0.0 13.4 13.4 0.0 13.4 13.4KY 41.73 0.0 0.6 0.6 11.9 12.4 0.0 11.9 12.4LA 45.24 2.5 0.8 3.2 33.7 37.0 0.0 33.7 37.0ME 13.22 0.9 0.0 0.9 0.0 0.9 0.0 0.0 0.9MD 56.00 0.0 0.0 0.0 6.6 6.6 0.0 6.6 6.6MA 63.99 11.2 4.8 16.0 16.8 32.8 0.0 16.8 32.8M I 101.21 0.0 0.0 0.0 1.9 1.9 0.0 1.9 1.9MN 51.33 8.6 0.0 8.6 0.5 9.1 0.0 0.5 9.1MS 29.21 9.7 21.7 31.4 46.8 78.2 0.0 46.8 78.2MO 58.00 2.7 0.0 2.7 18.9 21.6 1.2 20.1 22.8MT 9.36 0.0 0.0 0.0 8.4 8.4 0.1 8.6 8.6NE 17.59 0.3 0.0 0.3 21.3 21.7 0.0 21.3 21.7NV 24.15 0.0 0.0 0.0 3.7 3.7 0.0 3.7 3.7N H 13.10 0.5 0.0 0.5 0.0 0.5 0.0 0.0 0.5NJ 87.18 0.0 0.0 0.0 35.2 35.2 DNF DNF DNFNM 19.28 3.6 0.0 3.6 0.0 3.6 0.0 0.0 3.6NY 192.55 11.4 27.7 39.1 11.6 50.6 0.0 11.6 50.6N C 86.83 0.0 0.1 0.1 19.7 19.8 1.0 20.7 20.8N D 6.37 0.0 0.0 0.0 22.0 22.0 0.0 22.0 22.0O H 114.64 0.0 0.0 0.0 14.5 14.5 0.0 14.5 14.5O K 35.48 0.0 0.0 0.0 10.3 10.3 0.0 10.3 10.3O R 36.41 3.1 1.0 4.1 1.2 5.2 0.0 1.2 5.2PA 124.30 0.0 0.0 0.0 11.7 11.7 0.0 11.7 11.7R I 10.76 24.9 4.4 29.3 0.0 29.3 0.0 0.0 29.3SC 42.55 0.0 0.0 0.0 21.9 21.9 0.0 21.9 21.9SD 7.76 0.0 0.0 0.0 21.8 21.8 2.7 24.5 24.5TN 59.63 0.0 0.0 0.0 11.1 11.1 0.5 11.6 11.6TX 228.60 0.0 0.0 0.0 21.8 21.9 0.0 21.8 21.9U T 24.70 0.0 0.0 0.0 9.3 9.3 0.0 9.3 9.3VT 6.23 0.0 0.0 0.0 0.0 0.0 DNF DNF DNFVA 75.67 0.0 0.0 0.0 19.8 19.8 2.0 21.7 21.7W A 62.88 1.7 0.0 1.7 15.3 17.0 0.0 15.3 17.0W V 18.17 0.0 0.0 0.0 0.0 0.0 1.2 1.2 1.2W I 55.36 0.0 0.0 0.0 10.5 10.5 0.0 10.5 10.5W Y 5.09 0.0 0.0 0.0 18.8 18.8 0.0 18.8 18.8
US Total 2,964.10 1.8 2.4 4.2 13.5 17.7 0.1 1 13.6 1 17.8 1
DNF = did not furnish e = estimate 1 does not include CO, NJ, and VT psychiatric facilities
Population (100,000)
Psychiatric Facilities
Total Large (16+)
FacilitiesAll State Settings
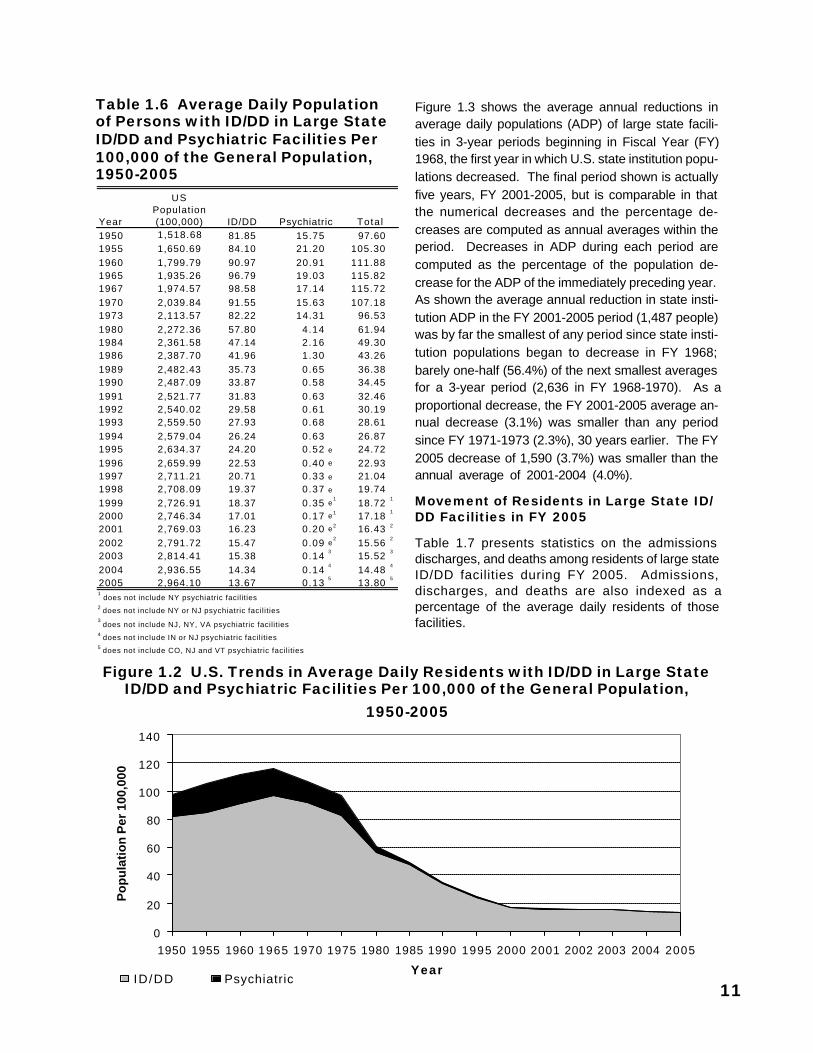
11
Table 1.6 Average Daily Populationof Persons with ID/DD in Large StateID/DD and Psychiatric Facilities Per100,000 of the General Population,1950-2005
Figure 1.2 U.S. Trends in Average Daily Residents with ID/DD in Large StateID/DD and Psychiatric Facilities Per 100,000 of the General Population,
1950-2005
Figure 1.3 shows the average annual reductions inaverage daily populations (ADP) of large state facili-ties in 3-year periods beginning in Fiscal Year (FY)1968, the first year in which U.S. state institution popu-lations decreased. The final period shown is actuallyfive years, FY 2001-2005, but is comparable in thatthe numerical decreases and the percentage de-creases are computed as annual averages within theperiod. Decreases in ADP during each period arecomputed as the percentage of the population de-crease for the ADP of the immediately preceding year.As shown the average annual reduction in state insti-tution ADP in the FY 2001-2005 period (1,487 people)was by far the smallest of any period since state insti-tution populations began to decrease in FY 1968;barely one-half (56.4%) of the next smallest averagesfor a 3-year period (2,636 in FY 1968-1970). As aproportional decrease, the FY 2001-2005 average an-nual decrease (3.1%) was smaller than any periodsince FY 1971-1973 (2.3%), 30 years earlier. The FY2005 decrease of 1,590 (3.7%) was smaller than theannual average of 2001-2004 (4.0%).
Movement of Residents in Large State ID/DD Facilities in FY 2005
Table 1.7 presents statistics on the admissionsdischarges, and deaths among residents of large stateID/DD facilities during FY 2005. Admissions,discharges, and deaths are also indexed as apercentage of the average daily residents of thosefacilities.
Year
US Population (100,000) ID/DD
1950 1,518.68 81.85 15.75 97.601955 1,650.69 84.10 21.20 105.301960 1,799.79 90.97 20.91 111.881965 1,935.26 96.79 19.03 115.821967 1,974.57 98.58 17.14 115.721970 2,039.84 91.55 15.63 107.181973 2,113.57 82.22 14.31 96.531980 2,272.36 57.80 4.14 61.941984 2,361.58 47.14 2.16 49.301986 2,387.70 41.96 1.30 43.261989 2,482.43 35.73 0.65 36.381990 2,487.09 33.87 0.58 34.451991 2,521.77 31.83 0.63 32.461992 2,540.02 29.58 0.61 30.191993 2,559.50 27.93 0.68 28.611994 2,579.04 26.24 0.63 26.871995 2,634.37 24.20 0.52 e 24.721996 2,659.99 22.53 0.40 e 22.931997 2,711.21 20.71 0.33 e 21.041998 2,708.09 19.37 0.37 e 19.741999 2,726.91 18.37 0.35 e
118.72
1
2000 2,746.34 17.01 0.17 e1 17.181
2001 2,769.03 16.23 0.20 e2 16.43 2
2002 2,791.72 15.47 0.09 e2
15.562
2003 2,814.41 15.38 0.143
15.523
2004 2,936.55 14.34 0.144
14.484
2005 2,964.10 13.67 0.135
13.805
1 does not include NY psychiatric facilities
2 does not include NY or NJ psychiatric facilities3
does not include NJ, NY, VA psychiatric facilities4 does not include IN or NJ psychiatric facilit ies5 does not include CO, NJ and VT psychiatric facilit ies
Psychiatric Tota l
0
20
40
60
80
100
120
140
1950 1955 1960 1965 1970 1975 1980 1985 1990 1995 2000 2001 2002 2003 2004 2005
Year
Po
pu
lati
on
Per
100
,000
ID/DD Psychiatric
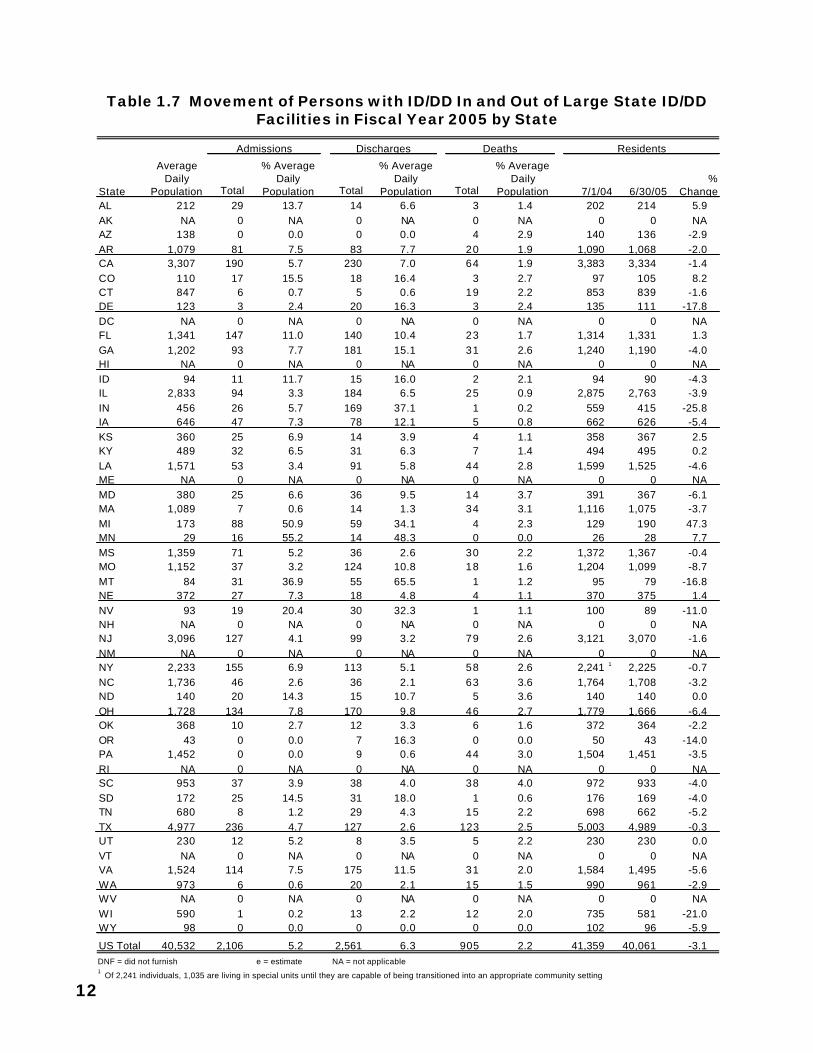
12
Table 1.7 Movement of Persons with ID/DD In and Out of Large State ID/DDFacilities in Fiscal Year 2005 by State
State Total Total TotalAL 212 29 13.7 14 6.6 3 1.4 202 214 5.9AK NA 0 NA 0 NA 0 NA 0 0 NAAZ 138 0 0.0 0 0.0 4 2.9 140 136 -2.9AR 1,079 81 7.5 83 7.7 20 1.9 1,090 1,068 -2.0CA 3,307 190 5.7 230 7.0 64 1.9 3,383 3,334 -1.4CO 110 17 15.5 18 16.4 3 2.7 97 105 8.2CT 847 6 0.7 5 0.6 19 2.2 853 839 -1.6DE 123 3 2.4 20 16.3 3 2.4 135 111 -17.8DC NA 0 NA 0 NA 0 NA 0 0 NAFL 1,341 147 11.0 140 10.4 23 1.7 1,314 1,331 1.3GA 1,202 93 7.7 181 15.1 31 2.6 1,240 1,190 -4.0HI NA 0 NA 0 NA 0 NA 0 0 NAID 94 11 11.7 15 16.0 2 2.1 94 90 -4.3IL 2,833 94 3.3 184 6.5 25 0.9 2,875 2,763 -3.9IN 456 26 5.7 169 37.1 1 0.2 559 415 -25.8IA 646 47 7.3 78 12.1 5 0.8 662 626 -5.4KS 360 25 6.9 14 3.9 4 1.1 358 367 2.5KY 489 32 6.5 31 6.3 7 1.4 494 495 0.2LA 1,571 53 3.4 91 5.8 44 2.8 1,599 1,525 -4.6ME NA 0 NA 0 NA 0 NA 0 0 NAMD 380 25 6.6 36 9.5 14 3.7 391 367 -6.1MA 1,089 7 0.6 14 1.3 34 3.1 1,116 1,075 -3.7MI 173 88 50.9 59 34.1 4 2.3 129 190 47.3MN 29 16 55.2 14 48.3 0 0.0 26 28 7.7MS 1,359 71 5.2 36 2.6 30 2.2 1,372 1,367 -0.4MO 1,152 37 3.2 124 10.8 18 1.6 1,204 1,099 -8.7MT 84 31 36.9 55 65.5 1 1.2 95 79 -16.8NE 372 27 7.3 18 4.8 4 1.1 370 375 1.4NV 93 19 20.4 30 32.3 1 1.1 100 89 -11.0NH NA 0 NA 0 NA 0 NA 0 0 NANJ 3,096 127 4.1 99 3.2 79 2.6 3,121 3,070 -1.6NM NA 0 NA 0 NA 0 NA 0 0 NANY 2,233 155 6.9 113 5.1 58 2.6 2,241 1 2,225 -0.7NC 1,736 46 2.6 36 2.1 63 3.6 1,764 1,708 -3.2ND 140 20 14.3 15 10.7 5 3.6 140 140 0.0OH 1,728 134 7.8 170 9.8 46 2.7 1,779 1,666 -6.4OK 368 10 2.7 12 3.3 6 1.6 372 364 -2.2OR 43 0 0.0 7 16.3 0 0.0 50 43 -14.0PA 1,452 0 0.0 9 0.6 44 3.0 1,504 1,451 -3.5RI NA 0 NA 0 NA 0 NA 0 0 NASC 953 37 3.9 38 4.0 38 4.0 972 933 -4.0SD 172 25 14.5 31 18.0 1 0.6 176 169 -4.0TN 680 8 1.2 29 4.3 15 2.2 698 662 -5.2TX 4,977 236 4.7 127 2.6 123 2.5 5,003 4,989 -0.3UT 230 12 5.2 8 3.5 5 2.2 230 230 0.0VT NA 0 NA 0 NA 0 NA 0 0 NAVA 1,524 114 7.5 175 11.5 31 2.0 1,584 1,495 -5.6WA 973 6 0.6 20 2.1 15 1.5 990 961 -2.9WV NA 0 NA 0 NA 0 NA 0 0 NAWI 590 1 0.2 13 2.2 12 2.0 735 581 -21.0WY 98 0 0.0 0 0.0 0 0.0 102 96 -5.9
US Total 40,532 2,106 5.2 2,561 6.3 905 2.2 41,359 40,061 -3.1DNF = did not furnish e = estimate1
Of 2,241 individuals, 1,035 are living in special units until they are capable of being transitioned into an appropriate community setting
% Average Daily
Population
Discharges
NA = not applicable
% Average Daily
Population
Deaths
7/1/04 6/30/05%
Change
Residents
Average Daily
Population
% Average Daily
Population
Admissions
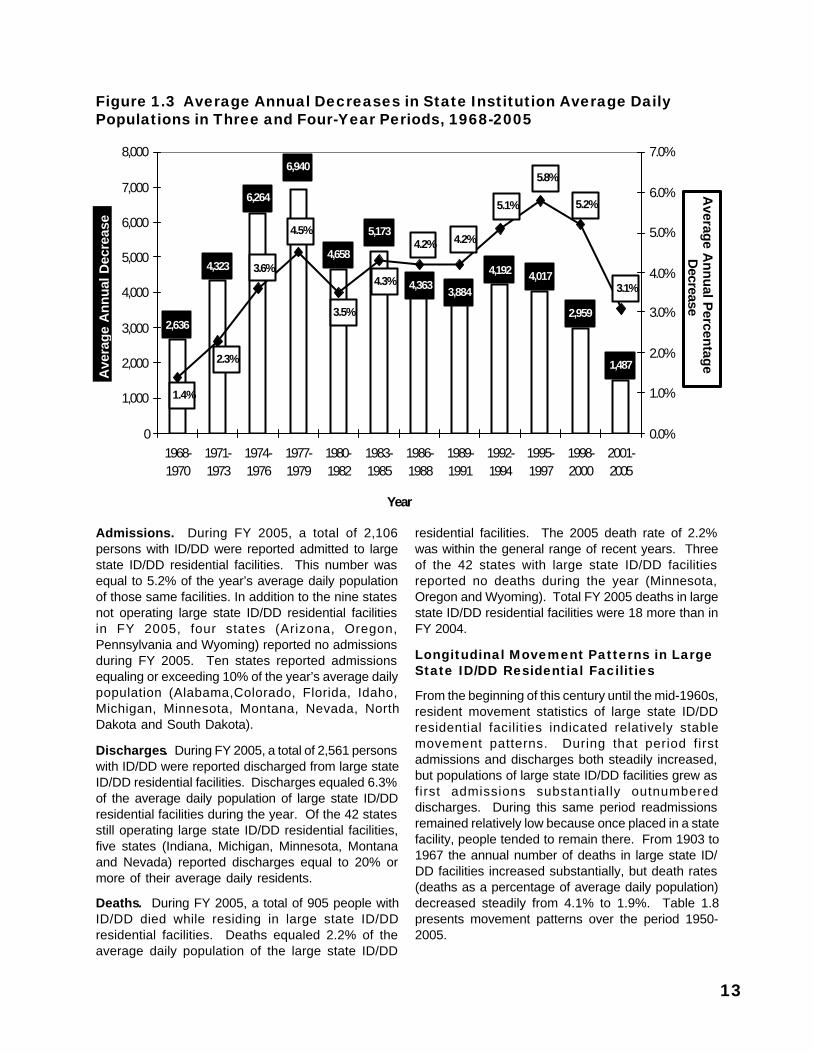
13
Figure 1.3 Average Annual Decreases in State Institution Average DailyPopulations in Three and Four-Year Periods, 1968-2005
Admissions. During FY 2005, a total of 2,106persons with ID/DD were reported admitted to largestate ID/DD residential facilities. This number wasequal to 5.2% of the year’s average daily populationof those same facilities. In addition to the nine statesnot operating large state ID/DD residential facilitiesin FY 2005, four states (Arizona, Oregon,Pennsylvania and Wyoming) reported no admissionsduring FY 2005. Ten states reported admissionsequaling or exceeding 10% of the year’s average dailypopulation (Alabama,Colorado, Florida, Idaho,Michigan, Minnesota, Montana, Nevada, NorthDakota and South Dakota).
Discharges. During FY 2005, a total of 2,561 personswith ID/DD were reported discharged from large stateID/DD residential facilities. Discharges equaled 6.3%of the average daily population of large state ID/DDresidential facilities during the year. Of the 42 statesstill operating large state ID/DD residential facilities,five states (Indiana, Michigan, Minnesota, Montanaand Nevada) reported discharges equal to 20% ormore of their average daily residents.
Deaths. During FY 2005, a total of 905 people withID/DD died while residing in large state ID/DDresidential facilities. Deaths equaled 2.2% of theaverage daily population of the large state ID/DD
residential facilities. The 2005 death rate of 2.2%was within the general range of recent years. Threeof the 42 states with large state ID/DD facilitiesreported no deaths during the year (Minnesota,Oregon and Wyoming). Total FY 2005 deaths in largestate ID/DD residential facilities were 18 more than inFY 2004.
Longitudinal Movement Patterns in LargeState ID/DD Residential Facilities
From the beginning of this century until the mid-1960s,resident movement statistics of large state ID/DDresidential facilities indicated relatively stablemovement patterns. During that period firstadmissions and discharges both steadily increased,but populations of large state ID/DD facilities grew asfirst admissions substantially outnumbereddischarges. During this same period readmissionsremained relatively low because once placed in a statefacility, people tended to remain there. From 1903 to1967 the annual number of deaths in large state ID/DD facilities increased substantially, but death rates(deaths as a percentage of average daily population)decreased steadily from 4.1% to 1.9%. Table 1.8presents movement patterns over the period 1950-2005.
4,323
6,264
4,6584,192 4,017
2,959
1,487
4,3633,884
5,173
2,636
6,940
4.2%
4.3%
3.5%
4.5%
1.4%
2.3%
3.6%
4.2%
5.1%
5.8%
5.2%
3.1%
0
1,000
2,000
3,000
4,000
5,000
6,000
7,000
8,000
1968-1970
1971-1973
1974-1976
1977-1979
1980-1982
1983-1985
1986-1988
1989-1991
1992-1994
1995-1997
1998-2000
2001-2005
Year
Ave
rage
Ann
ual D
ecre
ase
0.0%
1.0%
2.0%
3.0%
4.0%
5.0%
6.0%
7.0%
Average A
nnual Percentage
Decrease
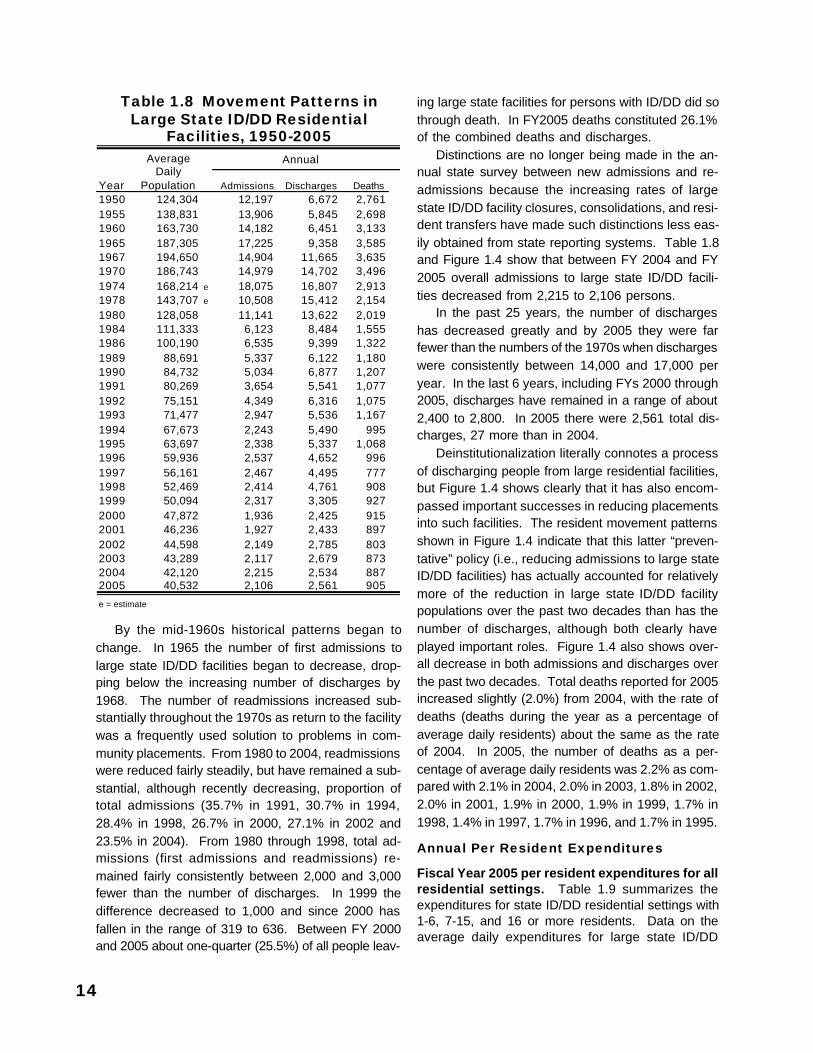
14
By the mid-1960s historical patterns began tochange. In 1965 the number of first admissions tolarge state ID/DD facilities began to decrease, drop-ping below the increasing number of discharges by1968. The number of readmissions increased sub-stantially throughout the 1970s as return to the facilitywas a frequently used solution to problems in com-munity placements. From 1980 to 2004, readmissionswere reduced fairly steadily, but have remained a sub-stantial, although recently decreasing, proportion oftotal admissions (35.7% in 1991, 30.7% in 1994,28.4% in 1998, 26.7% in 2000, 27.1% in 2002 and23.5% in 2004). From 1980 through 1998, total ad-missions (first admissions and readmissions) re-mained fairly consistently between 2,000 and 3,000fewer than the number of discharges. In 1999 thedifference decreased to 1,000 and since 2000 hasfallen in the range of 319 to 636. Between FY 2000and 2005 about one-quarter (25.5%) of all people leav-
ing large state facilities for persons with ID/DD did sothrough death. In FY2005 deaths constituted 26.1%of the combined deaths and discharges.
Distinctions are no longer being made in the an-nual state survey between new admissions and re-admissions because the increasing rates of largestate ID/DD facility closures, consolidations, and resi-dent transfers have made such distinctions less eas-ily obtained from state reporting systems. Table 1.8and Figure 1.4 show that between FY 2004 and FY2005 overall admissions to large state ID/DD facili-ties decreased from 2,215 to 2,106 persons.
In the past 25 years, the number of dischargeshas decreased greatly and by 2005 they were farfewer than the numbers of the 1970s when dischargeswere consistently between 14,000 and 17,000 peryear. In the last 6 years, including FYs 2000 through2005, discharges have remained in a range of about2,400 to 2,800. In 2005 there were 2,561 total dis-charges, 27 more than in 2004.
Deinstitutionalization literally connotes a processof discharging people from large residential facilities,but Figure 1.4 shows clearly that it has also encom-passed important successes in reducing placementsinto such facilities. The resident movement patternsshown in Figure 1.4 indicate that this latter “preven-tative” policy (i.e., reducing admissions to large stateID/DD facilities) has actually accounted for relativelymore of the reduction in large state ID/DD facilitypopulations over the past two decades than has thenumber of discharges, although both clearly haveplayed important roles. Figure 1.4 also shows over-all decrease in both admissions and discharges overthe past two decades. Total deaths reported for 2005increased slightly (2.0%) from 2004, with the rate ofdeaths (deaths during the year as a percentage ofaverage daily residents) about the same as the rateof 2004. In 2005, the number of deaths as a per-centage of average daily residents was 2.2% as com-pared with 2.1% in 2004, 2.0% in 2003, 1.8% in 2002,2.0% in 2001, 1.9% in 2000, 1.9% in 1999, 1.7% in1998, 1.4% in 1997, 1.7% in 1996, and 1.7% in 1995.
Annual Per Resident Expenditures
Fiscal Year 2005 per resident expenditures for allresidential settings. Table 1.9 summarizes theexpenditures for state ID/DD residential settings with1-6, 7-15, and 16 or more residents. Data on theaverage daily expenditures for large state ID/DD
Table 1.8 Movement Patterns inLarge State ID/DD Residential
Facilities, 1950-2005Annual
Year Admissions Discharges Deaths1950 124,304 12,197 6,672 2,7611955 138,831 13,906 5,845 2,6981960 163,730 14,182 6,451 3,1331965 187,305 17,225 9,358 3,5851967 194,650 14,904 11,665 3,6351970 186,743 14,979 14,702 3,4961974 168,214 e 18,075 16,807 2,9131978 143,707 e 10,508 15,412 2,1541980 128,058 11,141 13,622 2,0191984 111,333 6,123 8,484 1,5551986 100,190 6,535 9,399 1,3221989 88,691 5,337 6,122 1,1801990 84,732 5,034 6,877 1,2071991 80,269 3,654 5,541 1,0771992 75,151 4,349 6,316 1,0751993 71,477 2,947 5,536 1,1671994 67,673 2,243 5,490 9951995 63,697 2,338 5,337 1,0681996 59,936 2,537 4,652 9961997 56,161 2,467 4,495 7771998 52,469 2,414 4,761 9081999 50,094 2,317 3,305 9272000 47,872 1,936 2,425 9152001 46,236 1,927 2,433 8972002 44,598 2,149 2,785 8032003 43,289 2,117 2,679 8732004 42,120 2,215 2,534 8872005 40,532 2,106 2,561 905
e = estimate
Average Daily
Population
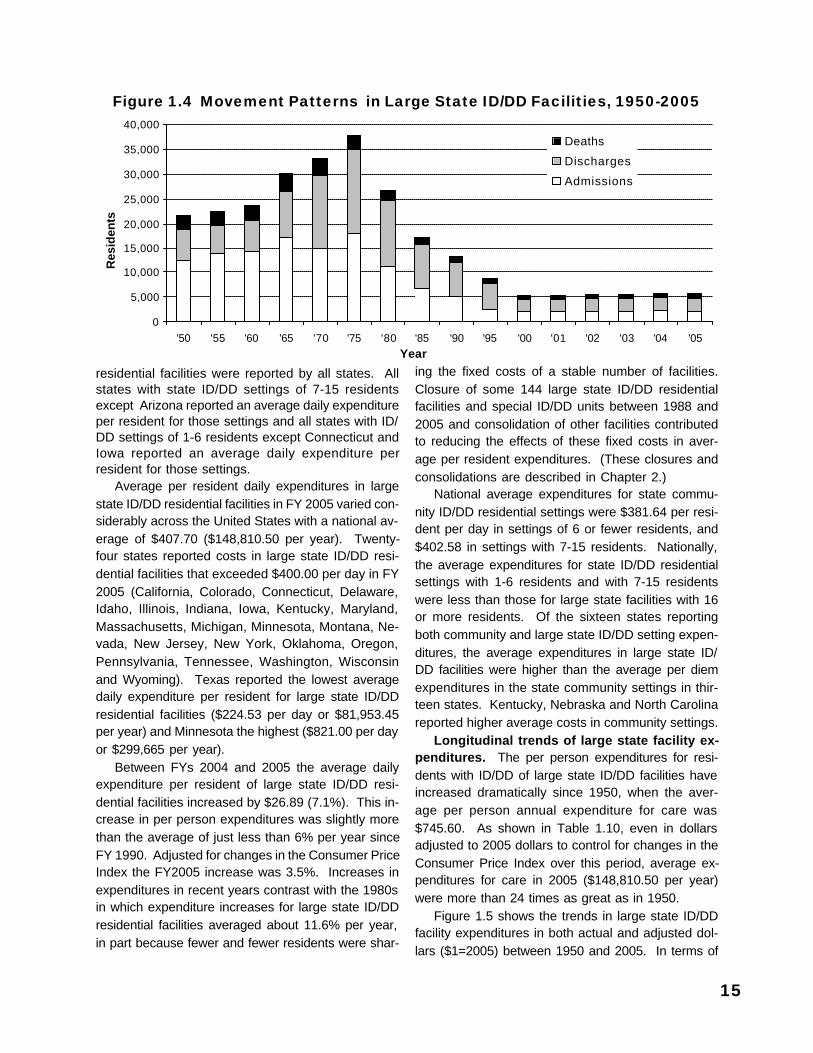
15
Figure 1.4 Movement Patterns in Large State ID/DD Facilities, 1950-2005
residential facilities were reported by all states. Allstates with state ID/DD settings of 7-15 residentsexcept Arizona reported an average daily expenditureper resident for those settings and all states with ID/DD settings of 1-6 residents except Connecticut andIowa reported an average daily expenditure perresident for those settings.
Average per resident daily expenditures in largestate ID/DD residential facilities in FY 2005 varied con-siderably across the United States with a national av-erage of $407.70 ($148,810.50 per year). Twenty-four states reported costs in large state ID/DD resi-dential facilities that exceeded $400.00 per day in FY2005 (California, Colorado, Connecticut, Delaware,Idaho, Illinois, Indiana, Iowa, Kentucky, Maryland,Massachusetts, Michigan, Minnesota, Montana, Ne-vada, New Jersey, New York, Oklahoma, Oregon,Pennsylvania, Tennessee, Washington, Wisconsinand Wyoming). Texas reported the lowest averagedaily expenditure per resident for large state ID/DDresidential facilities ($224.53 per day or $81,953.45per year) and Minnesota the highest ($821.00 per dayor $299,665 per year).
Between FYs 2004 and 2005 the average dailyexpenditure per resident of large state ID/DD resi-dential facilities increased by $26.89 (7.1%). This in-crease in per person expenditures was slightly morethan the average of just less than 6% per year sinceFY 1990. Adjusted for changes in the Consumer PriceIndex the FY2005 increase was 3.5%. Increases inexpenditures in recent years contrast with the 1980sin which expenditure increases for large state ID/DDresidential facilities averaged about 11.6% per year,in part because fewer and fewer residents were shar-
ing the fixed costs of a stable number of facilities.Closure of some 144 large state ID/DD residentialfacilities and special ID/DD units between 1988 and2005 and consolidation of other facilities contributedto reducing the effects of these fixed costs in aver-age per resident expenditures. (These closures andconsolidations are described in Chapter 2.)
National average expenditures for state commu-nity ID/DD residential settings were $381.64 per resi-dent per day in settings of 6 or fewer residents, and$402.58 in settings with 7-15 residents. Nationally,the average expenditures for state ID/DD residentialsettings with 1-6 residents and with 7-15 residentswere less than those for large state facilities with 16or more residents. Of the sixteen states reportingboth community and large state ID/DD setting expen-ditures, the average expenditures in large state ID/DD facilities were higher than the average per diemexpenditures in the state community settings in thir-teen states. Kentucky, Nebraska and North Carolinareported higher average costs in community settings.
Longitudinal trends of large state facility ex-penditures. The per person expenditures for resi-dents with ID/DD of large state ID/DD facilities haveincreased dramatically since 1950, when the aver-age per person annual expenditure for care was$745.60. As shown in Table 1.10, even in dollarsadjusted to 2005 dollars to control for changes in theConsumer Price Index over this period, average ex-penditures for care in 2005 ($148,810.50 per year)were more than 24 times as great as in 1950.
Figure 1.5 shows the trends in large state ID/DDfacility expenditures in both actual and adjusted dol-lars ($1=2005) between 1950 and 2005. In terms of
0
5,000
10,000
15,000
20,000
25,000
30,000
35,000
40,000
'50 '55 '60 '65 '70 '75 '80 '85 '90 '95 '00 '01 '02 '03 '04 '05Year
Res
iden
ts
Deaths
Discharges
Admissions
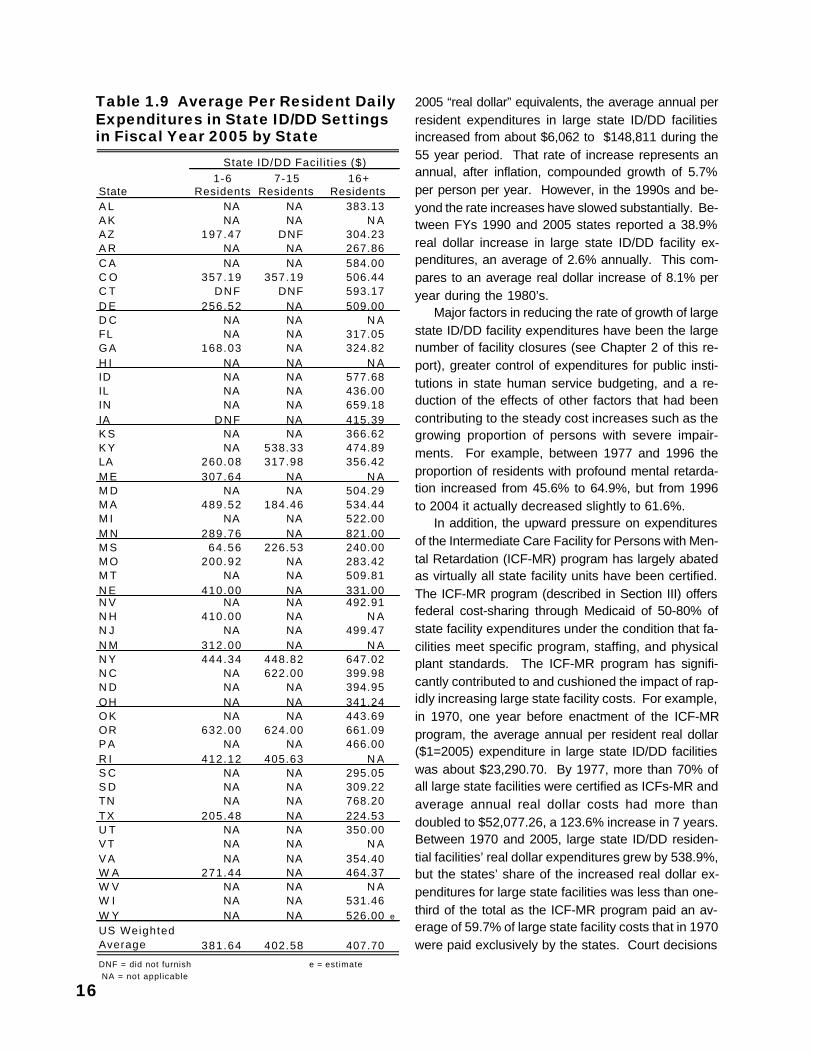
16
Table 1.9 Average Per Resident DailyExpenditures in State ID/DD Settingsin Fiscal Year 2005 by State
2005 “real dollar” equivalents, the average annual perresident expenditures in large state ID/DD facilitiesincreased from about $6,062 to $148,811 during the55 year period. That rate of increase represents anannual, after inflation, compounded growth of 5.7%per person per year. However, in the 1990s and be-yond the rate increases have slowed substantially. Be-tween FYs 1990 and 2005 states reported a 38.9%real dollar increase in large state ID/DD facility ex-penditures, an average of 2.6% annually. This com-pares to an average real dollar increase of 8.1% peryear during the 1980’s.
Major factors in reducing the rate of growth of largestate ID/DD facility expenditures have been the largenumber of facility closures (see Chapter 2 of this re-port), greater control of expenditures for public insti-tutions in state human service budgeting, and a re-duction of the effects of other factors that had beencontributing to the steady cost increases such as thegrowing proportion of persons with severe impair-ments. For example, between 1977 and 1996 theproportion of residents with profound mental retarda-tion increased from 45.6% to 64.9%, but from 1996to 2004 it actually decreased slightly to 61.6%.
In addition, the upward pressure on expendituresof the Intermediate Care Facility for Persons with Men-tal Retardation (ICF-MR) program has largely abatedas virtually all state facility units have been certified.The ICF-MR program (described in Section III) offersfederal cost-sharing through Medicaid of 50-80% ofstate facility expenditures under the condition that fa-cilities meet specific program, staffing, and physicalplant standards. The ICF-MR program has signifi-cantly contributed to and cushioned the impact of rap-idly increasing large state facility costs. For example,in 1970, one year before enactment of the ICF-MRprogram, the average annual per resident real dollar($1=2005) expenditure in large state ID/DD facilitieswas about $23,290.70. By 1977, more than 70% ofall large state facilities were certified as ICFs-MR andaverage annual real dollar costs had more thandoubled to $52,077.26, a 123.6% increase in 7 years.Between 1970 and 2005, large state ID/DD residen-tial facilities’ real dollar expenditures grew by 538.9%,but the states’ share of the increased real dollar ex-penditures for large state facilities was less than one-third of the total as the ICF-MR program paid an av-erage of 59.7% of large state facility costs that in 1970were paid exclusively by the states. Court decisions
StateA L NA NA 383.13A K NA NA N AAZ 197.47 DNF 304.23A R NA NA 267.86C A NA NA 584.00C O 357.19 357.19 506.44C T DNF DNF 593.17D E 256.52 NA 509.00D C NA NA N AFL NA NA 317.05G A 168.03 NA 324.82H I NA NA N AID NA NA 577.68IL NA NA 436.00IN NA NA 659.18IA DNF NA 415.39K S NA NA 366.62K Y NA 538.33 474.89LA 260.08 317.98 356.42M E 307.64 NA N AM D NA NA 504.29M A 489.52 184.46 534.44M I NA NA 522.00M N 289.76 NA 821.00M S 64.56 226.53 240.00M O 200.92 NA 283.42M T NA NA 509.81N E 410.00 NA 331.00N V NA NA 492.91N H 410.00 NA N AN J NA NA 499.47N M 312.00 NA N AN Y 444.34 448.82 647.02N C NA 622.00 399.98N D NA NA 394.95OH NA NA 341.24O K NA NA 443.69OR 632.00 624.00 661.09P A NA NA 466.00R I 412.12 405.63 N AS C NA NA 295.05S D NA NA 309.22TN NA NA 768.20TX 205.48 NA 224.53U T NA NA 350.00VT NA NA N AV A NA NA 354.40W A 271.44 NA 464.37W V NA NA N AW I NA NA 531.46W Y NA NA 526.00 e
US Weighted Average 381.64 402.58 407.70
DNF = did not furnish e = estimateNA = not applicable
1-6 Residents
7-15 Residents
16+ Residents
State ID/DD Facil i t ies ($)
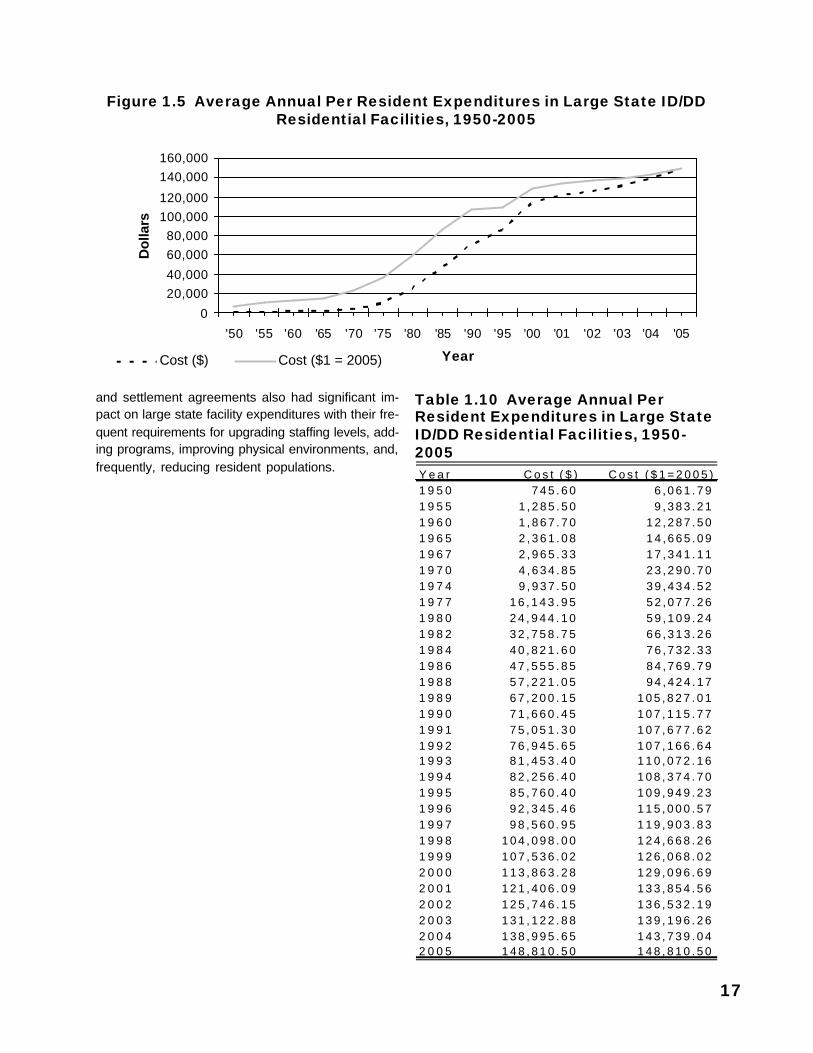
17
Figure 1.5 Average Annual Per Resident Expenditures in Large State ID/DDResidential Facilities, 1950-2005
Table 1.10 Average Annual PerResident Expenditures in Large StateID/DD Residential Facilities, 1950-2005
and settlement agreements also had significant im-pact on large state facility expenditures with their fre-quent requirements for upgrading staffing levels, add-ing programs, improving physical environments, and,frequently, reducing resident populations.
0
20,00040,000
60,00080,000
100,000120,000
140,000160,000
'50 '55 '60 '65 '70 '75 '80 '85 '90 '95 '00 '01 '02 '03 '04 '05
Year
Dol
lars
Cost ($) Cost ($1 = 2005)
Y e a r C o s t ( $ ) C o s t ( $ 1 = 2 0 0 5 )1 9 5 0 7 4 5 . 6 0 6 , 0 6 1 . 7 91 9 5 5 1 , 2 8 5 . 5 0 9 , 3 8 3 . 2 11 9 6 0 1 , 8 6 7 . 7 0 1 2 , 2 8 7 . 5 01 9 6 5 2 , 3 6 1 . 0 8 1 4 , 6 6 5 . 0 91 9 6 7 2 , 9 6 5 . 3 3 1 7 , 3 4 1 . 1 11 9 7 0 4 , 6 3 4 . 8 5 2 3 , 2 9 0 . 7 01 9 7 4 9 , 9 3 7 . 5 0 3 9 , 4 3 4 . 5 21 9 7 7 1 6 , 1 4 3 . 9 5 5 2 , 0 7 7 . 2 61 9 8 0 2 4 , 9 4 4 . 1 0 5 9 , 1 0 9 . 2 41 9 8 2 3 2 , 7 5 8 . 7 5 6 6 , 3 1 3 . 2 61 9 8 4 4 0 , 8 2 1 . 6 0 7 6 , 7 3 2 . 3 31 9 8 6 4 7 , 5 5 5 . 8 5 8 4 , 7 6 9 . 7 91 9 8 8 5 7 , 2 2 1 . 0 5 9 4 , 4 2 4 . 1 71 9 8 9 6 7 , 2 0 0 . 1 5 1 0 5 , 8 2 7 . 0 11 9 9 0 7 1 , 6 6 0 . 4 5 1 0 7 , 1 1 5 . 7 71 9 9 1 7 5 , 0 5 1 . 3 0 1 0 7 , 6 7 7 . 6 21 9 9 2 7 6 , 9 4 5 . 6 5 1 0 7 , 1 6 6 . 6 41 9 9 3 8 1 , 4 5 3 . 4 0 1 1 0 , 0 7 2 . 1 61 9 9 4 8 2 , 2 5 6 . 4 0 1 0 8 , 3 7 4 . 7 01 9 9 5 8 5 , 7 6 0 . 4 0 1 0 9 , 9 4 9 . 2 31 9 9 6 9 2 , 3 4 5 . 4 6 1 1 5 , 0 0 0 . 5 71 9 9 7 9 8 , 5 6 0 . 9 5 1 1 9 , 9 0 3 . 8 31 9 9 8 1 0 4 , 0 9 8 . 0 0 1 2 4 , 6 6 8 . 2 61 9 9 9 1 0 7 , 5 3 6 . 0 2 1 2 6 , 0 6 8 . 0 22 0 0 0 1 1 3 , 8 6 3 . 2 8 1 2 9 , 0 9 6 . 6 92 0 0 1 1 2 1 , 4 0 6 . 0 9 1 3 3 , 8 5 4 . 5 62 0 0 2 1 2 5 , 7 4 6 . 1 5 1 3 6 , 5 3 2 . 1 92 0 0 3 1 3 1 , 1 2 2 . 8 8 1 3 9 , 1 9 6 . 2 62 0 0 4 1 3 8 , 9 9 5 . 6 5 1 4 3 , 7 3 9 . 0 42 0 0 5 1 4 8 , 8 1 0 . 5 0 1 4 8 , 8 1 0 . 5 0

18
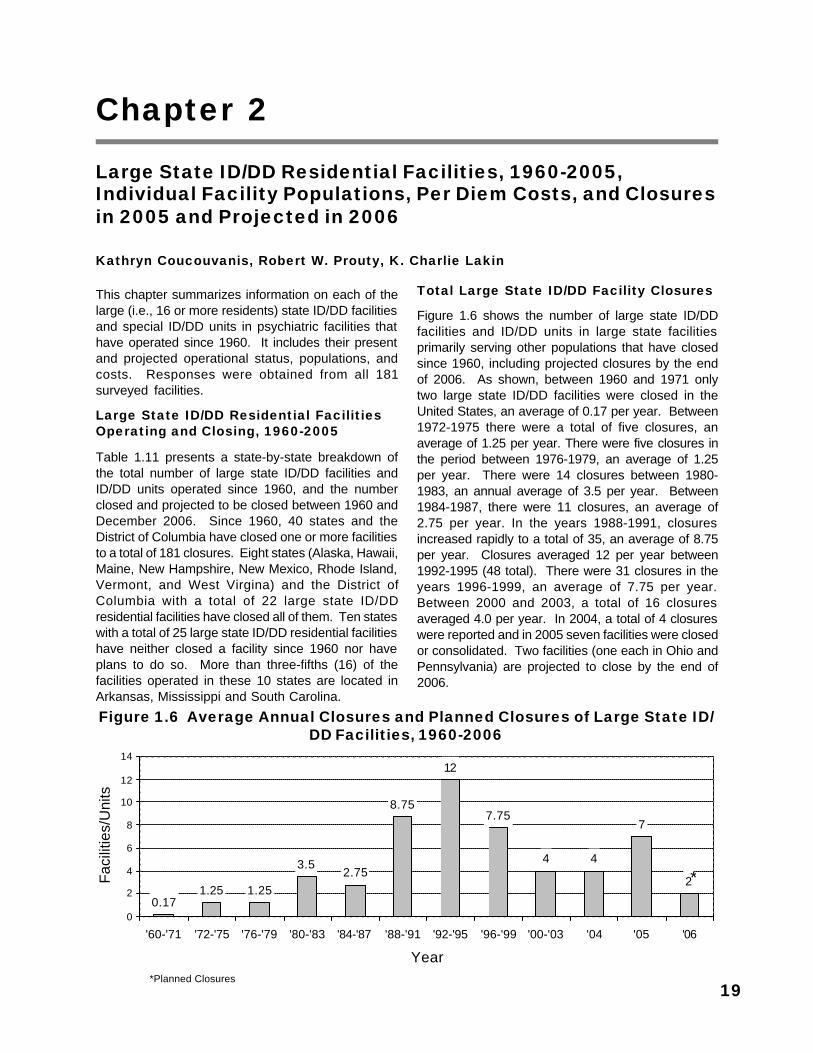
19
This chapter summarizes information on each of thelarge (i.e., 16 or more residents) state ID/DD facilitiesand special ID/DD units in psychiatric facilities thathave operated since 1960. It includes their presentand projected operational status, populations, andcosts. Responses were obtained from all 181surveyed facilities.
Large State ID/DD Residential FacilitiesOperating and Closing, 1960-2005
Table 1.11 presents a state-by-state breakdown ofthe total number of large state ID/DD facilities andID/DD units operated since 1960, and the numberclosed and projected to be closed between 1960 andDecember 2006. Since 1960, 40 states and theDistrict of Columbia have closed one or more facilitiesto a total of 181 closures. Eight states (Alaska, Hawaii,Maine, New Hampshire, New Mexico, Rhode Island,Vermont, and West Virgina) and the District ofColumbia with a total of 22 large state ID/DDresidential facilities have closed all of them. Ten stateswith a total of 25 large state ID/DD residential facilitieshave neither closed a facility since 1960 nor haveplans to do so. More than three-fifths (16) of thefacilities operated in these 10 states are located inArkansas, Mississippi and South Carolina.
Chapter 2
Large State ID/DD Residential Facilities, 1960-2005,Individual Facility Populations, Per Diem Costs, and Closuresin 2005 and Projected in 2006
Kathryn Coucouvanis, Robert W. Prouty, K. Charlie Lakin
Total Large State ID/DD Facility Closures
Figure 1.6 shows the number of large state ID/DDfacilities and ID/DD units in large state facilitiesprimarily serving other populations that have closedsince 1960, including projected closures by the endof 2006. As shown, between 1960 and 1971 onlytwo large state ID/DD facilities were closed in theUnited States, an average of 0.17 per year. Between1972-1975 there were a total of five closures, anaverage of 1.25 per year. There were five closures inthe period between 1976-1979, an average of 1.25per year. There were 14 closures between 1980-1983, an annual average of 3.5 per year. Between1984-1987, there were 11 closures, an average of2.75 per year. In the years 1988-1991, closuresincreased rapidly to a total of 35, an average of 8.75per year. Closures averaged 12 per year between1992-1995 (48 total). There were 31 closures in theyears 1996-1999, an average of 7.75 per year.Between 2000 and 2003, a total of 16 closuresaveraged 4.0 per year. In 2004, a total of 4 closureswere reported and in 2005 seven facilities were closedor consolidated. Two facilities (one each in Ohio andPennsylvania) are projected to close by the end of2006.
Figure 1.6 Average Annual Closures and Planned Closures of Large State ID/DD Facilities, 1960-2006
7
2
4
0.171.25 1.25
3.52.75
8.75
12
7.75
4
0
2
4
6
8
10
12
14
'60-'71 '72-'75 '76-'79 '80-'83 '84-'87 '88-'91 '92-'95 '96-'99 '00-'03 '04 '05 '06
Year
Fac
ilitie
s/U
nits
*Planned Closures
*
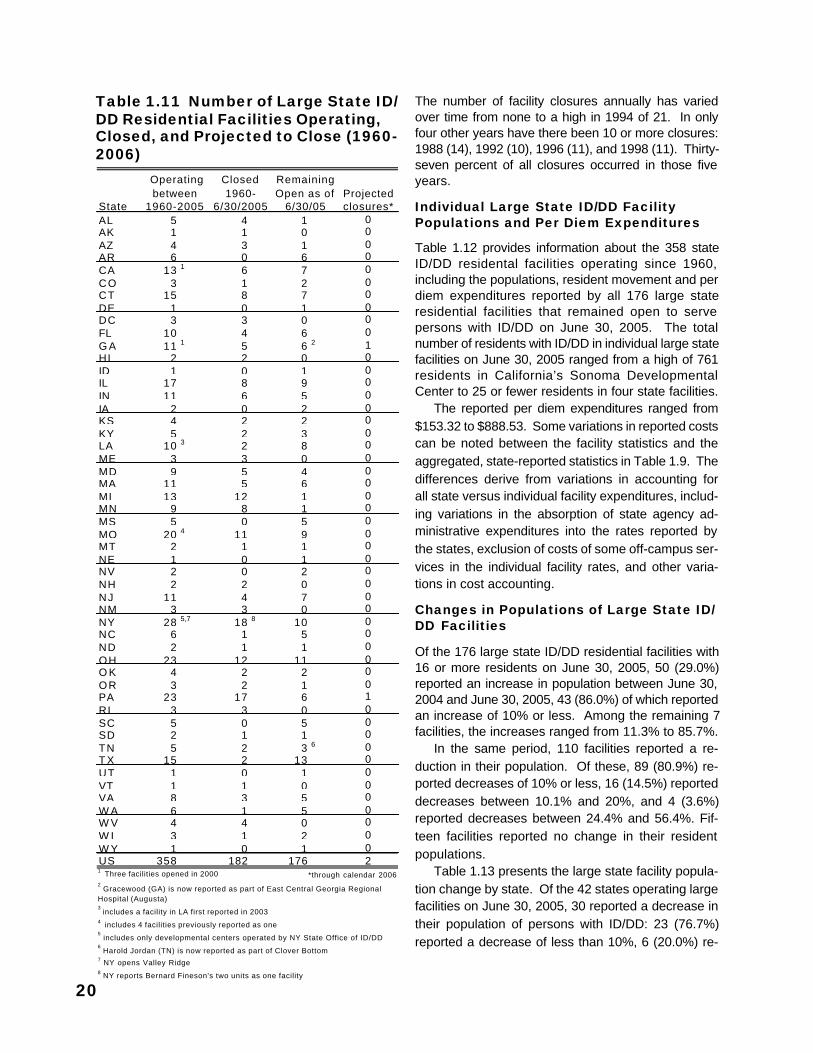
20
Table 1.11 Number of Large State ID/DD Residential Facilities Operating,Closed, and Projected to Close (1960-2006)
The number of facility closures annually has variedover time from none to a high in 1994 of 21. In onlyfour other years have there been 10 or more closures:1988 (14), 1992 (10), 1996 (11), and 1998 (11). Thirty-seven percent of all closures occurred in those fiveyears.
Individual Large State ID/DD FacilityPopulations and Per Diem Expenditures
Table 1.12 provides information about the 358 stateID/DD residental facilities operating since 1960,including the populations, resident movement and perdiem expenditures reported by all 176 large stateresidential facilities that remained open to servepersons with ID/DD on June 30, 2005. The totalnumber of residents with ID/DD in individual large statefacilities on June 30, 2005 ranged from a high of 761residents in California’s Sonoma DevelopmentalCenter to 25 or fewer residents in four state facilities.
The reported per diem expenditures ranged from$153.32 to $888.53. Some variations in reported costscan be noted between the facility statistics and theaggregated, state-reported statistics in Table 1.9. Thedifferences derive from variations in accounting forall state versus individual facility expenditures, includ-ing variations in the absorption of state agency ad-ministrative expenditures into the rates reported bythe states, exclusion of costs of some off-campus ser-vices in the individual facility rates, and other varia-tions in cost accounting.
Changes in Populations of Large State ID/DD Facilities
Of the 176 large state ID/DD residential facilities with16 or more residents on June 30, 2005, 50 (29.0%)reported an increase in population between June 30,2004 and June 30, 2005, 43 (86.0%) of which reportedan increase of 10% or less. Among the remaining 7facilities, the increases ranged from 11.3% to 85.7%.
In the same period, 110 facilities reported a re-duction in their population. Of these, 89 (80.9%) re-ported decreases of 10% or less, 16 (14.5%) reporteddecreases between 10.1% and 20%, and 4 (3.6%)reported decreases between 24.4% and 56.4%. Fif-teen facilities reported no change in their residentpopulations.
Table 1.13 presents the large state facility popula-tion change by state. Of the 42 states operating largefacilities on June 30, 2005, 30 reported a decrease intheir population of persons with ID/DD: 23 (76.7%)reported a decrease of less than 10%, 6 (20.0%) re-
StateAL 5 4 1 0AK 1 1 0 0AZ 4 3 1 0AR 6 0 6 0CA 13 1 6 7 0CO 3 1 2 0CT 15 8 7 0DE 1 0 1 0DC 3 3 0 0FL 10 4 6 0G A 11 1 5 6 2 1HI 2 2 0 0ID 1 0 1 0IL 17 8 9 0IN 11 6 5 0IA 2 0 2 0KS 4 2 2 0KY 5 2 3 0LA 10 3 2 8 0ME 3 3 0 0MD 9 5 4 0MA 11 5 6 0MI 13 12 1 0MN 9 8 1 0MS 5 0 5 0MO 20 4 11 9 0MT 2 1 1 0NE 1 0 1 0NV 2 0 2 0NH 2 2 0 0NJ 11 4 7 0NM 3 3 0 0NY 28 5,7 18 8 10 0NC 6 1 5 0ND 2 1 1 0OH 23 12 11 0O K 4 2 2 0OR 3 2 1 0PA 23 17 6 1RI 3 3 0 0SC 5 0 5 0SD 2 1 1 0TN 5 2 3 6 0T X 15 2 13 0UT 1 0 1 0VT 1 1 0 0VA 8 3 5 0W A 6 1 5 0W V 4 4 0 0W I 3 1 2 0W Y 1 0 1 0US 358 182 176 21 Three facilities opened in 2000
3 includes a facility in LA first reported in 2003
7 NY opens Valley Ridge8 NY reports Bernard Fineson's two units as one facility
Projected closures*
Closed 1960-
6/30/2005
Remaining Open as of
6/30/05
Operating between
1960-2005
5 includes only developmental centers operated by NY State Office of ID/DD
6 Harold Jordan (TN) is now reported as part of Clover Bottom
4 includes 4 facilities previously reported as one
*through calendar 20062 Gracewood (GA) is now reported as part of East Central Georgia Regional
Hospital (Augusta)
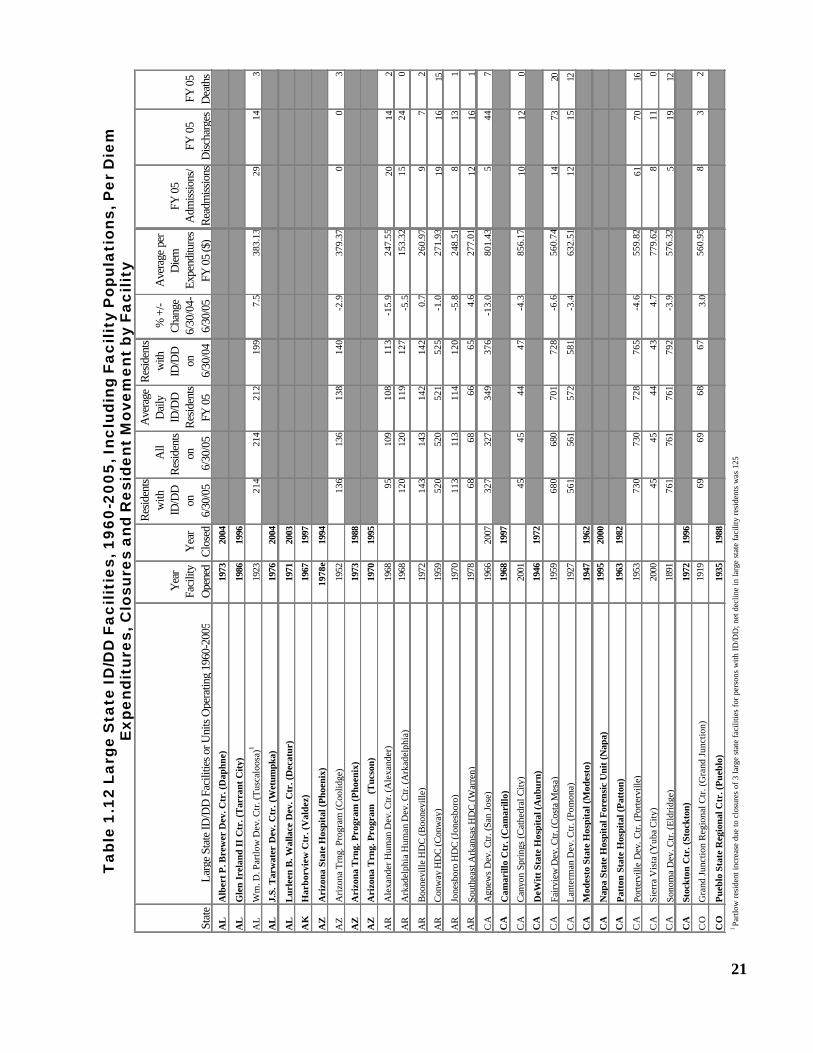
Tab
le 1
.12
Larg
e S
tate
ID/D
D F
acili
ties
, 196
0-20
05, I
nclu
ding
Fac
ility
Pop
ulat
ions
, Per
Die
mE
xpen
ditu
res,
Clo
sure
s an
d R
esid
ent
Mov
emen
t by
Fac
ility
Stat
eLa
rge
Stat
e ID
/DD
Fac
ilitie
s or U
nits
Ope
ratin
g 19
60-2
005
Yea
r Fa
cilit
y O
pene
dY
ear
Clo
sed
Res
iden
ts w
ith
ID/D
D
on
6/30
/05
All
Res
iden
ts on
6/
30/0
5
Ave
rage
D
aily
ID
/DD
R
esid
ents
FY 0
5
Res
iden
ts w
ith
ID/D
D
on
6/30
/04
% +
/- C
hang
e 6/
30/0
4-6/
30/0
5
Ave
rage
per
D
iem
Ex
pend
iture
s FY
05
($)
FY 0
5 A
dmiss
ions
/R
eadm
issio
nsFY
05
Disc
harg
esFY
05
Dea
ths
AL
Alb
ert P
. Bre
wer
Dev
. Ctr
. (D
aphn
e)19
7320
04
AL
Gle
n Ir
elan
d II
Ctr
. (T
arra
nt C
ity)
1986
1996
AL
Wm
. D. P
artlo
w D
ev. C
tr. (
Tus
calo
osa)
119
2321
421
421
219
97.
538
3.13
2914
3
AL
J.S.
Tar
wat
er D
ev. C
tr. (
Wet
umpk
a)19
7620
04
AL
Lur
leen
B. W
alla
ce D
ev. C
tr. (
Dec
atur
)19
7120
03
AK
Har
borv
iew
Ctr
. (V
alde
z)19
6719
97
AZ
Ari
zona
Sta
te H
ospi
tal (
Pho
enix
)19
78e
1994
AZ
Ariz
ona
Trn
g. P
rogr
am (C
oolid
ge)
1952
136
136
138
140
-2.9
379.
370
03
AZ
Ari
zona
Trn
g. P
rogr
am (P
hoen
ix)
1973
1988
AZ
Ari
zona
Trn
g. P
rogr
am
(Tuc
son)
1970
1995
AR
Ale
xand
er H
uman
Dev
. Ctr
. (A
lexa
nder
)19
6895
109
108
113
-15.
924
7.55
2014
2
AR
Ark
adel
phia
Hum
an D
ev. C
tr. (
Ark
adel
phia
)19
6812
012
011
912
7-5
.515
3.32
1524
0
AR
Boo
nevi
lle H
DC
(Boo
nevi
lle)
1972
143
143
142
142
0.7
260.
979
72
AR
Con
way
HD
C (C
onw
ay)
1959
520
520
521
525
-1.0
271.
9319
1615
AR
Jone
sbor
o H
DC
(Jon
esbo
ro)
1970
113
113
114
120
-5.8
248.
518
131
AR
Sout
heas
t Ark
ansa
s H
DC
(War
ren)
1978
6868
6665
4.6
277.
0112
161
CA
Agn
ews
Dev
. Ctr.
(San
Jos
e)19
6620
0732
732
734
937
6-1
3.0
801.
435
447
CA
Cam
arill
o C
tr. (
Cam
arill
o)19
6819
97
CA
Can
yon
Sprin
gs (C
athe
dral
City
)20
0145
4544
47-4
.385
6.17
1012
0
CA
DeW
itt S
tate
Hos
pita
l (A
ubur
n)19
4619
72
CA
Fair
view
Dev
. Ctr
. (C
osta
Mes
a)19
5968
068
070
172
8-6
.656
0.74
1473
20
CA
Lan
term
an D
ev. C
tr. (
Pom
ona)
1927
561
561
572
581
-3.4
632.
5112
1512
CA
Mod
esto
Sta
te H
ospi
tal (
Mod
esto
)19
4719
62
CA
Nap
a St
ate
Hos
pita
l For
ensi
c U
nit (
Nap
a)19
9520
00
CA
Patt
on S
tate
Hos
pita
l (Pa
tton
)19
6319
82
CA
Porte
rvill
e D
ev. C
tr. (
Porte
rvill
e)19
5373
073
072
876
5-4
.655
9.82
6170
16
CA
Sier
ra V
ista
(Yub
a C
ity)
2000
4545
4443
4.7
779.
628
110
CA
Sono
ma
Dev
. Ctr
. (E
ldri
dge)
1891
761
761
761
792
-3.9
576.
325
1912
CA
Stoc
kton
Ctr
. (St
ockt
on)
1972
1996
CO
Gra
nd J
unct
ion
Reg
iona
l Ctr
. (G
rand
Jun
ctio
n)19
1969
6968
673.
056
0.95
83
2
CO
Pue
blo
Stat
e R
egio
nal C
tr. (
Pue
blo)
1935
1988
1 Pa
rtlow
resi
dent
incr
ease
due
to c
losu
res
of 3
larg
e st
ate
faci
litie
s fo
r per
sons
with
ID/D
D; n
et d
eclin
e in
larg
e st
ate
faci
lity
resi
dent
s w
as 1
25
21
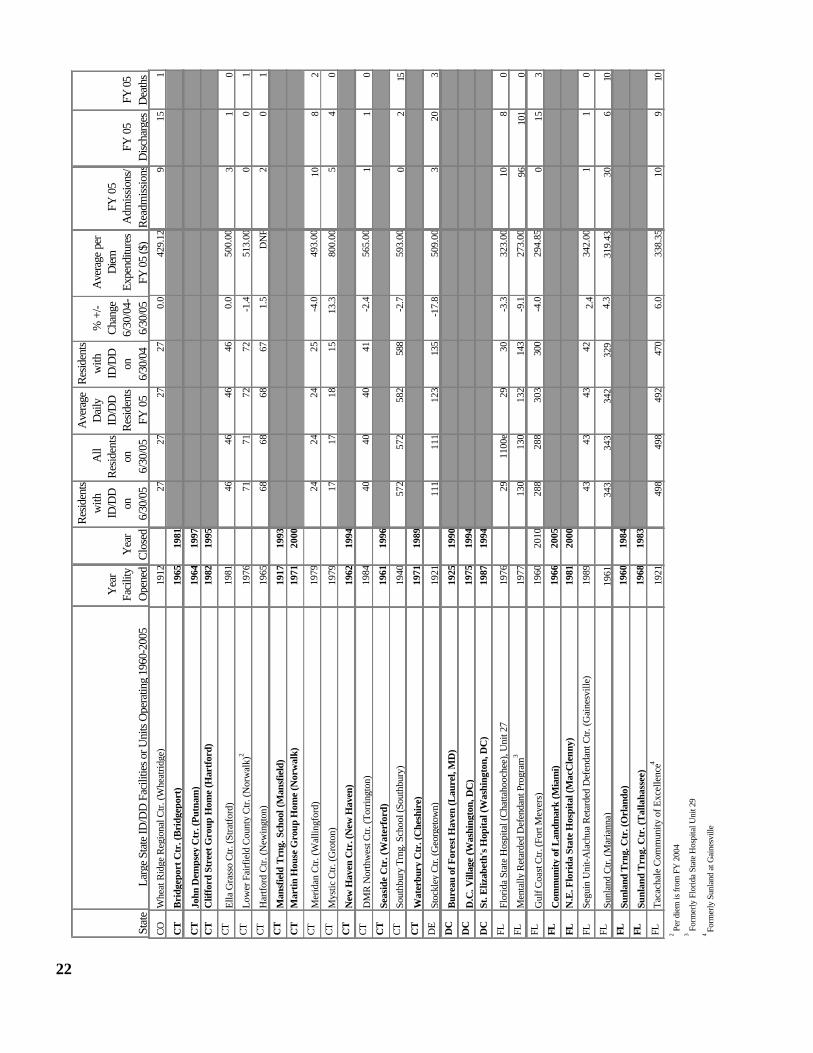
CO
Whe
at R
idge
Reg
iona
l Ctr.
(Whe
atrid
ge)
1912
2727
2727
0.0
429.
129
151
CT
Bri
dgep
ort C
tr. (
Bri
dgep
ort)
1965
1981
CT
John
Dem
psey
Ctr
. (Pu
tnam
)19
6419
97C
TC
liffo
rd S
tree
t Gro
up H
ome
(Har
tfor
d)19
8219
95
CTEl
la G
rass
o C
tr. (S
tratfo
rd)
1981
4646
4646
0.0
500.
003
10
CTLo
wer
Fai
rfie
ld C
ount
y C
tr. (N
orw
alk)
219
7671
7172
72-1
.451
3.00
00
1CT
Har
tford
Ctr.
(New
ingt
on)
1965
6868
6867
1.5
DN
F2
01
CT
Man
sfie
ld T
rng.
Sch
ool (
Man
sfie
ld)
1917
1993
CT
Mar
tin H
ouse
Gro
up H
ome
(Nor
wal
k)19
7120
00
CTM
erid
an C
tr. (W
allin
gfor
d)19
7924
2424
25-4
.049
3.00
108
2CT
Mys
tic C
tr. (G
roto
n)19
7917
1718
1513
.380
0.00
54
0C
TN
ew H
aven
Ctr
. (N
ew H
aven
)19
6219
94CT
DM
R N
orth
wes
t Ctr.
(Tor
ringt
on)
1984
4040
4041
-2.4
565.
001
10
CT
Seas
ide
Ctr
. (W
ater
ford
)19
6119
96CT
Sout
hbur
y Tr
ng. S
choo
l (So
uthb
ury)
1940
572
572
582
588
-2.7
593.
000
215
CT
Wat
erbu
ry C
tr. (
Che
shir
e)19
7119
89D
ESt
ockl
ey C
tr. (G
eorg
etow
n)19
2111
111
112
313
5-1
7.8
509.
003
203
DC
Bur
eau
of F
ores
t Hav
en (L
aure
l, M
D)
1925
1990
DC
D.C
. Vill
age
(Was
hing
ton,
DC
)19
7519
94D
CSt
. Eliz
abet
h's
Hop
ital (
Was
hing
ton,
DC
)19
8719
94
FLFl
orid
a St
ate
Hos
pita
l (C
hatta
hooc
hee)
, Uni
t 27
1976
2911
00e
2930
-3.3
323.
0010
80
FLM
enta
lly R
etar
ded
Def
enda
nt P
rogr
am3
1977
130
130
132
143
-9.1
273.
0096
101
0FL
Gul
f Coa
st C
tr. (F
ort M
eyer
s)19
6020
1028
828
830
330
0-4
.029
4.85
015
3FL
Com
mun
ity o
f Lan
dmar
k (M
iam
i)19
6620
05FL
N.E
. Flo
rida
Sta
te H
ospi
tal (
Mac
Cle
nny)
1981
2000
FLSe
guin
Uni
t-Ala
chua
Ret
arde
d D
efen
dant
Ctr.
(Gai
nesv
ille)
1989
4343
4342
2.4
342.
001
10
FLSu
nlan
d C
tr. (M
aria
nna)
1961
343
343
342
329
4.3
319.
4330
610
FLSu
nlan
d T
rng.
Ctr
. (O
rlan
do)
1960
1984
FLSu
nlan
d T
rng.
Ctr
. (T
alla
hass
ee)
1968
1983
FLTa
cach
ale
Com
mun
ity o
f Exc
elle
nce4
1921
498
498
492
470
6.0
338.
3510
910
4 Fo
rmer
ly S
unla
nd a
t Gai
nesv
ille
3 For
mer
ly F
lorid
a St
ate
Hos
pita
l Uni
t 29
2 Per
die
m is
from
FY
200
4
Stat
eLa
rge
Stat
e ID
/DD
Fac
ilitie
s or U
nits
Ope
ratin
g 19
60-2
005
Yea
r Fa
cilit
y O
pene
dY
ear
Clo
sed
Res
iden
ts w
ith
ID/D
D
on
6/30
/05
All
Res
iden
ts
on
6/30
/05
Ave
rage
D
aily
ID
/DD
R
esid
ents
FY 0
5
Res
iden
ts w
ith
ID/D
D
on
6/30
/04
% +
/- C
hang
e 6/
30/0
4-6/
30/0
5
Ave
rage
per
D
iem
Expe
nditu
res
FY 0
5 ($
)
FY 0
5 A
dmiss
ions
/R
eadm
issi
ons
FY 0
5 D
ischa
rges
FY 0
5 D
eath
s
22
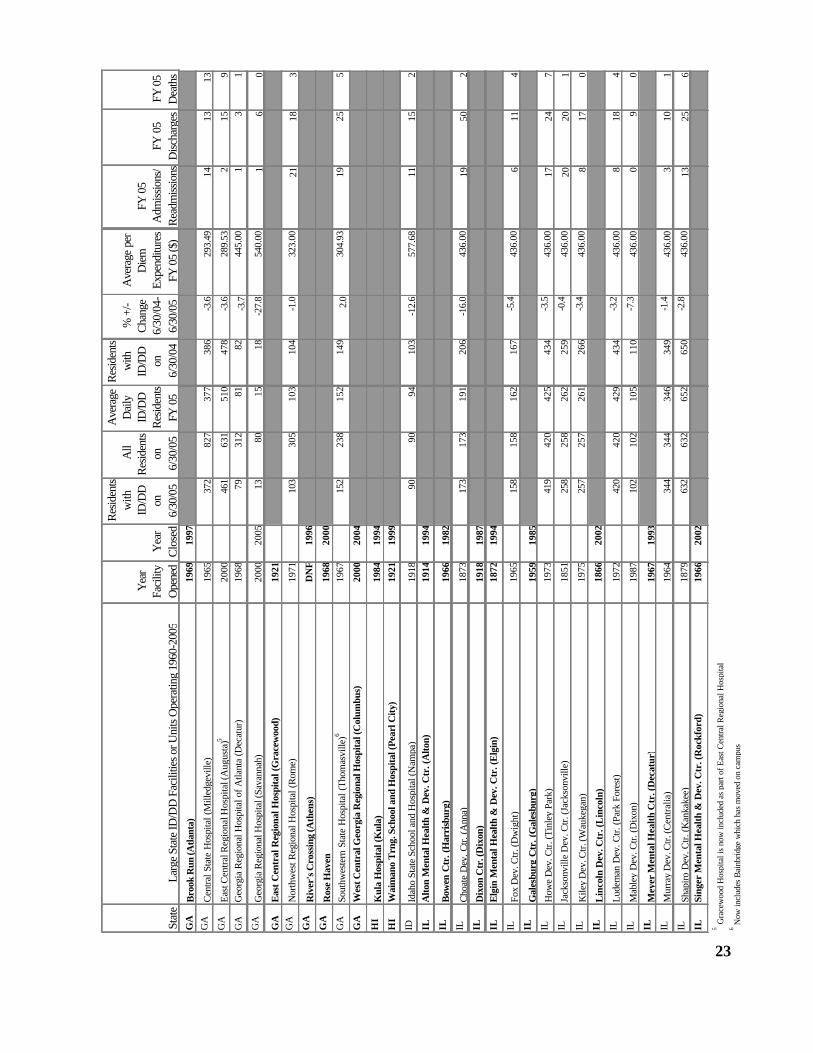
23
Stat
eLa
rge
Stat
e ID
/DD
Fac
ilitie
s or U
nits
Ope
ratin
g 19
60-2
005
Yea
r Fa
cilit
y O
pene
dY
ear
Clo
sed
Res
iden
ts w
ith
ID/D
D
on
6/30
/05
All
Res
iden
ts on
6/
30/0
5
Ave
rage
D
aily
ID
/DD
R
esid
ents
FY 0
5
Res
iden
ts w
ith
ID/D
D
on
6/30
/04
% +
/- C
hang
e 6/
30/0
4-6/
30/0
5
Ave
rage
per
D
iem
Ex
pend
iture
s FY
05
($)
FY 0
5 A
dmiss
ions
/R
eadm
issio
nsFY
05
Disc
harg
esFY
05
Dea
ths
GA
Bro
ok R
un (A
tlant
a)19
6919
97G
AC
entra
l Sta
te H
ospi
tal (
Mill
edge
ville
)19
6537
282
737
738
6-3
.629
3.49
1413
13G
AEa
st C
entra
l Reg
iona
l Hos
pita
l (A
ugus
ta)5
2000
461
631
510
478
-3.6
289.
532
159
GA
Geo
rgia
Reg
iona
l Hos
pita
l of A
tlant
a (D
ecat
ur)
1968
7931
281
82-3
.744
5.00
13
1
GA
Geo
rgia
Reg
iona
l Hos
pita
l (Sa
vann
ah)
2000
2005
1380
1518
-27.
854
0.00
16
0
GA
Eas
t Cen
tral
Reg
iona
l Hos
pita
l (G
race
woo
d)19
21G
AN
orth
wes
t Reg
iona
l Hos
pita
l (R
ome)
1971
103
305
103
104
-1.0
323.
0021
183
GA
Riv
er's
Cro
ssin
g (A
then
s)D
NF
1996
GA
Ros
e H
aven
1968
2000
GA
Sout
hwes
tern
Sta
te H
ospi
tal (
Thom
asvi
lle)6
1967
152
238
152
149
2.0
304.
9319
255
GA
Wes
t Cen
tral
Geo
rgia
Reg
iona
l Hos
pita
l (C
olum
bus)
2000
2004
HI
Kul
a H
ospi
tal (
Kul
a)19
8419
94H
IW
aim
ano
Trn
g. S
choo
l and
Hos
pita
l (Pe
arl C
ity)
1921
1999
IDId
aho
Stat
e Sc
hool
and
Hos
pita
l (N
ampa
)19
1890
9094
103
-12.
657
7.68
1115
2IL
Alto
n M
enta
l Hea
lth &
Dev
. Ctr
. (A
lton)
1914
1994
ILB
owen
Ctr
. (H
arri
sbur
g)19
6619
82IL
Cho
ate
Dev
. Ctr.
(A
nna)
1873
173
173
191
206
-16.
043
6.00
1950
2IL
Dix
on C
tr. (
Dix
on)
1918
1987
ILE
lgin
Men
tal H
ealth
& D
ev. C
tr. (
Elg
in)
1872
1994
ILFo
x D
ev. C
tr. (D
wig
ht)
1965
158
158
162
167
-5.4
436.
006
114
ILG
ales
burg
Ctr
. (G
ales
burg
)19
5919
85IL
How
e D
ev. C
tr. (T
inle
y Pa
rk)
1973
419
420
425
434
-3.5
436.
0017
247
ILJa
ckso
nvill
e D
ev. C
tr. (J
acks
onvi
lle)
1851
258
258
262
259
-0.4
436.
0020
201
ILK
iley
Dev
. Ctr.
(Wau
kega
n)19
7525
725
726
126
6-3
.443
6.00
817
0IL
Lin
coln
Dev
. Ctr
. (L
inco
ln)
1866
2002
ILLu
dem
an D
ev. C
tr. (P
ark
Fore
st)
1972
420
420
429
434
-3.2
436.
008
184
ILM
able
y D
ev. C
tr. (D
ixon
)19
8710
210
210
511
0-7
.343
6.00
09
0IL
Mey
er M
enta
l Hea
lth C
tr. (
Dec
atur
)19
6719
93IL
Mur
ray
Dev
. Ctr.
(Cen
tralia
)19
6434
434
434
634
9-1
.443
6.00
310
1IL
Shap
iro D
ev. C
tr. (K
anka
kee)
1879
632
632
652
650
-2.8
436.
0013
256
ILSi
nger
Men
tal H
ealth
& D
ev. C
tr. (
Roc
kfor
d)19
6620
02
6 Now
incl
udes
Bai
nbrid
ge w
hich
has
mov
ed o
n ca
mpu
s
5 G
race
woo
d H
ospi
tal i
s no
w in
clud
ed a
s pa
rt of
Eas
t Cen
tral R
egio
nal H
ospi
tal
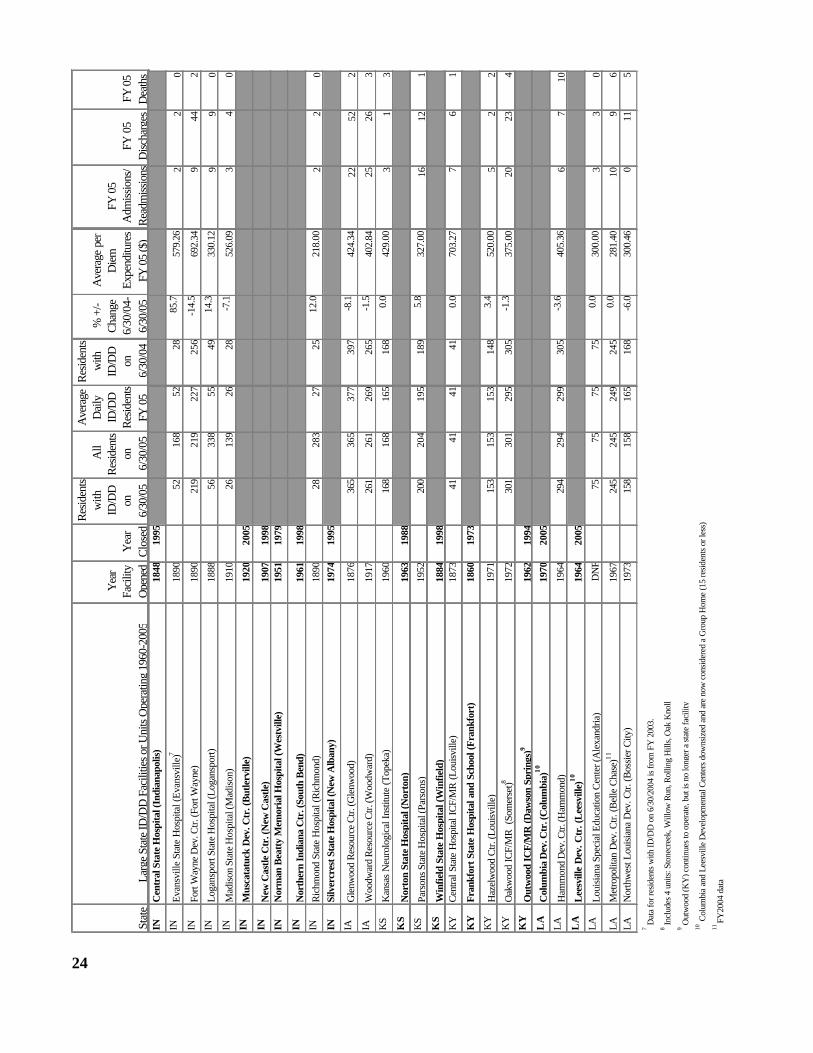
24
Stat
eLa
rge
Stat
e ID
/DD
Fac
ilitie
s or U
nits
Ope
ratin
g 19
60-2
005
Yea
r Fa
cilit
y O
pene
dY
ear
Clo
sed
Res
iden
ts w
ith
ID/D
D
on
6/30
/05
All
Res
iden
ts on
6/
30/0
5
Ave
rage
D
aily
ID
/DD
R
esid
ents
FY 0
5
Res
iden
ts w
ith
ID/D
D
on
6/30
/04
% +
/- C
hang
e 6/
30/0
4-6/
30/0
5
Ave
rage
per
D
iem
Ex
pend
iture
s FY
05
($)
FY 0
5 A
dmiss
ions
/R
eadm
issio
nsFY
05
Disc
harg
esFY
05
Dea
ths
INC
entr
al S
tate
Hos
pita
l (In
dian
apol
is)
1848
1995
INEv
ansv
ille
Stat
e H
ospi
tal (
Evan
svill
e)7
1890
5216
852
2885
.757
9.26
22
0IN
Fort
Way
ne D
ev. C
tr. (F
ort W
ayne
)18
9021
921
922
725
6-1
4.5
692.
349
442
INLo
gans
port
Stat
e H
ospi
tal (
Loga
nspo
rt)18
8856
338
5549
14.3
330.
129
90
INM
adis
on S
tate
Hos
pita
l (M
adis
on)
1910
2613
926
28-7
.152
6.09
34
0IN
Mus
cata
tuck
Dev
. Ctr
. (B
utle
rvill
e)19
2020
05IN
New
Cas
tle C
tr. (
New
Cas
tle)
1907
1998
INN
orm
an B
eatt
y M
emor
ial H
ospi
tal (
Wes
tvill
e)19
5119
79
INN
orth
ern
Indi
ana
Ctr
. (So
uth
Ben
d)19
6119
98IN
Ric
hmon
d St
ate
Hos
pita
l (R
ichm
ond)
1890
2828
327
2512
.021
8.00
22
0IN
Silv
ercr
est S
tate
Hos
pita
l (N
ew A
lban
y)19
7419
95
IAG
lenw
ood
Res
ourc
e C
tr. (G
lenw
ood)
1876
365
365
377
397
-8.1
424.
3422
522
IAW
oodw
ard
Res
ourc
e C
tr. (W
oodw
ard)
1917
261
261
269
265
-1.5
402.
8425
263
KS
Kan
sas
Neu
rolo
gica
l Ins
titut
e (T
opek
a)19
6016
816
816
516
80.
042
9.00
31
3K
SN
orto
n St
ate
Hos
pita
l (N
orto
n)19
6319
88K
SPa
rson
s Sta
te H
ospi
tal (
Pars
ons)
1952
200
204
195
189
5.8
327.
0016
121
KS
Win
field
Sta
te H
ospi
tal (
Win
field
)18
8419
98K
YC
entra
l Sta
te H
ospi
tal I
CF/
MR
(Lou
isvill
e)18
7341
4141
410.
070
3.27
76
1
KY
Fran
kfor
t Sta
te H
ospi
tal a
nd S
choo
l (Fr
ankf
ort)
1860
1973
KY
Haz
elw
ood
Ctr.
(Lou
isvi
lle)
1971
153
153
153
148
3.4
520.
005
22
KY
Oak
woo
d IC
F/M
R (
Som
erse
t)819
7230
130
129
530
5-1
.337
5.00
2023
4K
YO
utw
ood
ICF/
MR
(Daw
son
Spri
ngs)
919
6219
94L
AC
olum
bia
Dev
. Ctr
. (C
olum
bia)
1019
7020
05LA
Ham
mon
d D
ev. C
tr. (H
amm
ond)
1964
294
294
299
305
-3.6
405.
366
710
LA
Lee
svill
e D
ev. C
tr. (
Lee
svill
e)10
1964
2005
LALo
uisi
ana
Spec
ial E
duca
tion
Cen
ter (
Ale
xand
ria)
DN
F75
7575
750.
030
0.00
33
0
LAM
etro
polit
an D
ev. C
tr. (B
elle
Cha
se)11
1967
245
245
249
245
0.0
281.
4010
96
LAN
orth
wes
t Lou
isia
na D
ev. C
tr. (B
ossi
er C
ity)
1973
158
158
165
168
-6.0
300.
460
115
9 Out
woo
d (K
Y) c
ontin
ues t
o op
erat
e, b
ut is
no
long
er a
stat
e fa
cilit
y
8 Incl
udes
4 u
nits
: Sto
necr
eek,
Will
ow R
un, R
ollin
g H
ills,
Oak
Kno
ll
11 FY
2004
dat
a
7 Dat
a fo
r res
iden
ts w
ith ID
/DD
on
6/30
/200
4 is
from
FY
200
3.
10 C
olum
bia
and
Lees
ville
Dev
elop
men
tal C
ente
rs d
owns
ized
and
are
now
con
side
red
a G
roup
Hom
e (1
5 re
side
nts o
r les
s)
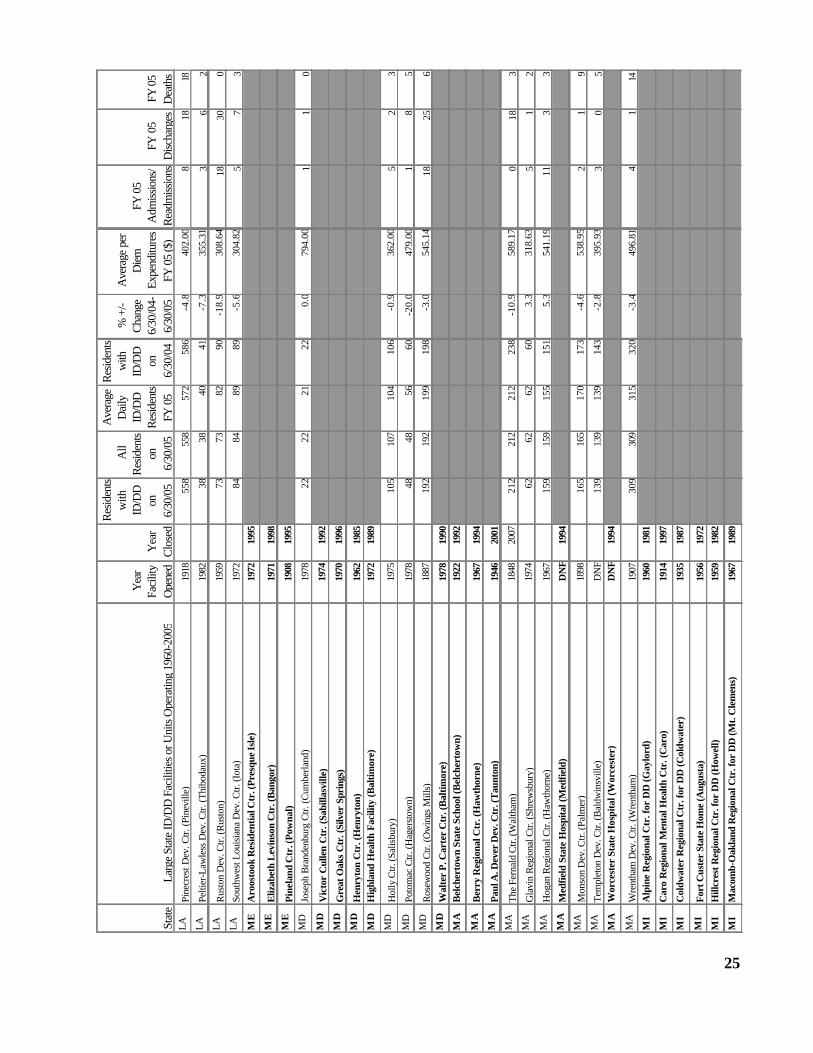
25
Stat
eLa
rge
Stat
e ID
/DD
Fac
ilitie
s or U
nits
Ope
ratin
g 19
60-2
005
Yea
r Fa
cilit
y O
pene
dY
ear
Clo
sed
Res
iden
ts w
ith
ID/D
D
on
6/30
/05
All
Res
iden
ts on
6/
30/0
5
Ave
rage
D
aily
ID
/DD
R
esid
ents
FY 0
5
Res
iden
ts w
ith
ID/D
D
on
6/30
/04
% +
/- C
hang
e 6/
30/0
4-6/
30/0
5
Ave
rage
per
D
iem
Ex
pend
iture
s FY
05
($)
FY 0
5 A
dmiss
ions
/R
eadm
issio
nsFY
05
Disc
harg
esFY
05
Dea
ths
LAPi
necr
est D
ev. C
tr. (P
inev
ille)
1918
558
558
572
586
-4.8
402.
008
1818
LAPe
ltier
-Law
less
Dev
. Ctr.
(Thi
boda
ux)
1982
3838
4041
-7.3
355.
313
62
LAR
usto
n D
ev. C
tr. (R
usto
n)19
5973
7382
90-1
8.9
308.
6418
300
LASo
uthw
est L
ouis
iana
Dev
. Ctr.
(Iot
a)19
7284
8489
89-5
.630
4.82
57
3M
EA
roos
took
Res
iden
tial C
tr. (
Pres
que
Isle
)19
7219
95
ME
Eliz
abet
h L
evin
son
Ctr
. (B
ango
r)19
7119
98M
EPi
nela
nd C
tr. (
Pow
nal)
1908
1995
MD
Jose
ph B
rand
enbu
rg C
tr. (C
umbe
rland
)19
7822
2221
220.
079
4.00
11
0M
DV
icto
r C
ulle
n C
tr. (
Sabi
llasv
ille)
1974
1992
MD
Gre
at O
aks
Ctr
. (Si
lver
Spr
ings
)19
7019
96M
DH
enry
ton
Ctr
. (H
enry
ton)
1962
1985
MD
Hig
hlan
d H
ealth
Fac
ility
(Bal
timor
e)19
7219
89
MD
Hol
ly C
tr. (S
alis
bury
)19
7510
510
710
410
6-0
.936
2.00
52
3M
DPo
tom
ac C
tr. (H
ager
stow
n)19
7848
4856
60-2
0.0
479.
001
85
MD
Ros
ewoo
d C
tr. (O
win
gs M
ills)
1887
192
192
199
198
-3.0
545.
1418
256
MD
Wal
ter
P. C
arte
r C
tr. (
Bal
timor
e)19
7819
90M
AB
elch
erto
wn
Stat
e Sc
hool
(Bel
cher
tow
n)19
2219
92
MA
Ber
ry R
egio
nal C
tr. (
Haw
thor
ne)
1967
1994
MA
Paul
A. D
ever
Dev
. Ctr
. (T
aunt
on)
1946
2001
MA
The
Fern
ald
Ctr.
(Wal
tham
)18
4820
0721
221
221
223
8-1
0.9
589.
170
183
MA
Gla
vin
Reg
iona
l Ctr.
(Shr
ewsb
ury)
1974
6262
6260
3.3
318.
635
12
MA
Hog
an R
egio
nal C
tr. (H
awth
orne
)19
6715
915
915
515
15.
354
1.19
113
3M
AM
edfie
ld S
tate
Hos
pita
l (M
edfie
ld)
DN
F19
94M
AM
onso
n D
ev. C
tr. (P
alm
er)
1898
165
165
170
173
-4.6
538.
952
19
MA
Tem
plet
on D
ev. C
tr. (B
aldw
insv
ille)
DN
F13
913
913
914
3-2
.839
5.93
30
5M
AW
orce
ster
Sta
te H
ospi
tal (
Wor
cest
er)
DN
F19
94
MA
Wre
ntha
m D
ev. C
tr. (W
rent
ham
)19
0730
930
931
532
0-3
.449
6.81
41
14M
IA
lpin
e R
egio
nal C
tr. f
or D
D (G
aylo
rd)
1960
1981
MI
Car
o R
egio
nal M
enta
l Hea
lth C
tr. (
Car
o)19
1419
97
MI
Col
dwat
er R
egio
nal C
tr. f
or D
D (C
oldw
ater
)19
3519
87
MI
Fort
Cus
ter
Stat
e H
ome
(Aug
usta
)19
5619
72M
IH
illcr
est R
egio
nal C
tr. f
or D
D (H
owel
l)19
5919
82
MI
Mac
omb-
Oak
land
Reg
iona
l Ctr
. for
DD
(Mt.
Cle
men
s)19
6719
89
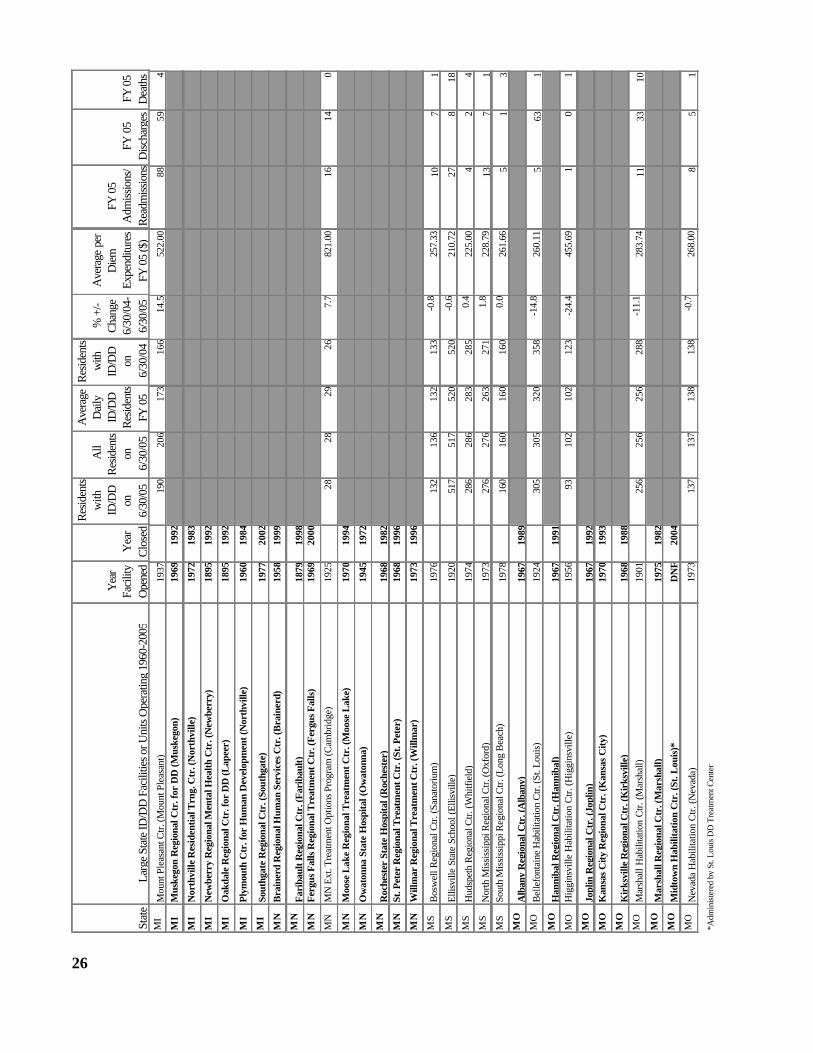
26
Stat
eLa
rge
Stat
e ID
/DD
Fac
ilitie
s or U
nits
Ope
ratin
g 19
60-2
005
Yea
r Fa
cilit
y O
pene
dY
ear
Clo
sed
Res
iden
ts w
ith
ID/D
D
on
6/30
/05
All
Res
iden
ts on
6/
30/0
5
Ave
rage
D
aily
ID
/DD
R
esid
ents
FY 0
5
Res
iden
ts w
ith
ID/D
D
on
6/30
/04
% +
/- C
hang
e 6/
30/0
4-6/
30/0
5
Ave
rage
per
D
iem
Ex
pend
iture
s FY
05
($)
FY 0
5 A
dmiss
ions
/R
eadm
issio
nsFY
05
Disc
harg
esFY
05
Dea
ths
MI
Mou
nt P
leas
ant C
tr. (M
ount
Ple
asan
t)19
3719
020
617
316
614
.552
2.00
8859
4M
IM
uske
gon
Reg
iona
l Ctr
. for
DD
(Mus
kego
n)19
6919
92
MI
Nor
thvi
lle R
esid
entia
l Trn
g. C
tr. (
Nor
thvi
lle)
1972
1983
MI
New
berr
y R
egio
nal M
enta
l Hea
lth C
tr. (
New
berr
y)18
9519
92
MI
Oak
dale
Reg
iona
l Ctr
. for
DD
(Lap
eer)
1895
1992
MI
Plym
outh
Ctr
. for
Hum
an D
evel
opm
ent (
Nor
thvi
lle)
1960
1984
MI
Sout
hgat
e R
egio
nal C
tr. (
Sout
hgat
e)19
7720
02M
NB
rain
erd
Reg
iona
l Hum
an S
ervi
ces C
tr. (
Bra
iner
d)19
5819
99
MN
Fari
baul
t Reg
iona
l Ctr
. (Fa
riba
ult)
1879
1998
MN
Ferg
us F
alls
Reg
iona
l Tre
atm
ent C
tr. (
Ferg
us F
alls
)19
6920
00
MN
MN
Ext
. Tre
atm
ent O
ptio
ns P
rogr
am (C
ambr
idge
)19
2528
2829
267.
782
1.00
1614
0
MN
Moo
se L
ake
Reg
iona
l Tre
atm
ent C
tr. (
Moo
se L
ake)
1970
1994
MN
Ow
aton
na S
tate
Hos
pita
l (O
wat
onna
)19
4519
72
MN
Roc
hest
er S
tate
Hos
pita
l (R
oche
ster
)19
6819
82M
NSt
. Pet
er R
egio
nal T
reat
men
t Ctr
. (St
. Pet
er)
1968
1996
MN
Will
mar
Reg
iona
l Tre
atm
ent C
tr. (
Will
mar
)19
7319
96
MS
Bos
wel
l Reg
iona
l Ctr.
(San
ator
ium
)19
7613
213
613
213
3-0
.825
7.33
107
1M
SEl
lisvi
lle S
tate
Sch
ool (
Ellis
ville
)19
2051
751
752
052
0-0
.621
0.72
278
18M
SH
udsp
eth
Reg
iona
l Ctr.
(Whi
tfiel
d)19
7428
628
628
328
50.
422
5.00
42
4M
SN
orth
Mis
siss
ippi
Reg
iona
l Ctr.
(Oxf
ord)
1973
276
276
263
271
1.8
228.
7913
71
MS
Sout
h M
issi
ssip
pi R
egio
nal C
tr. (L
ong
Bea
ch)
1978
160
160
160
160
0.0
261.
665
13
MO
Alb
any
Reg
iona
l Ctr
. (A
lban
y)19
6719
89M
OB
elle
font
aine
Hab
ilita
tion
Ctr.
(St.
Loui
s)19
2430
530
532
035
8-1
4.8
260.
115
631
MO
Han
niba
l Reg
iona
l Ctr
. (H
anni
bal)
1967
1991
MO
Hig
gins
ville
Hab
ilita
tion
Ctr.
(Hig
gins
ville
)19
5693
102
102
123
-24.
445
5.69
10
1
MO
Jopl
in R
egio
nal C
tr. (
Jopl
in)
1967
1992
MO
Kan
sas
City
Reg
iona
l Ctr
. (K
ansa
s C
ity)
1970
1993
MO
Kir
ksvi
lle R
egio
nal C
tr. (
Kir
ksvi
lle)
1968
1988
MO
Mar
shal
l Hab
ilita
tion
Ctr.
(M
arsh
all)
1901
256
256
256
288
-11.
128
3.74
1133
10M
OM
arsh
all R
egio
nal C
tr. (
Mar
shal
l)19
7519
82M
OM
idto
wn
Hab
ilita
tion
Ctr
. (St
. Lou
is)*
DN
F20
04M
ON
evad
a H
abili
tatio
n C
tr. (N
evad
a)19
7313
713
713
813
8-0
.726
8.00
85
1
*Adm
inis
tere
d by
St.
Loui
s DD
Tre
atm
ent C
ente
r
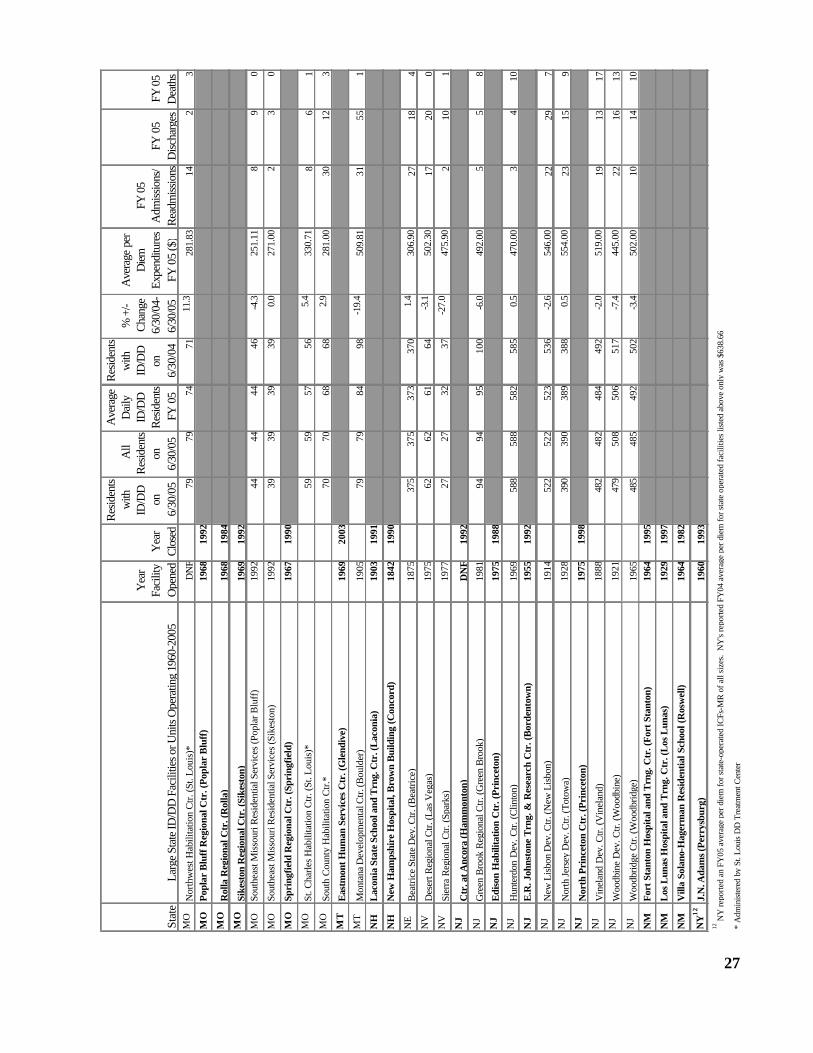
27
Stat
eLa
rge
Stat
e ID
/DD
Fac
ilitie
s or U
nits
Ope
ratin
g 19
60-2
005
Yea
r Fa
cilit
y O
pene
dY
ear
Clo
sed
Res
iden
ts w
ith
ID/D
D
on
6/30
/05
All
Res
iden
ts on
6/
30/0
5
Ave
rage
D
aily
ID
/DD
R
esid
ents
FY 0
5
Res
iden
ts w
ith
ID/D
D
on
6/30
/04
% +
/- C
hang
e 6/
30/0
4-6/
30/0
5
Ave
rage
per
D
iem
Expe
nditu
res
FY 0
5 ($
)
FY 0
5 A
dmiss
ions
/R
eadm
issio
nsFY
05
Disc
harg
esFY
05
Dea
ths
MO
Nor
thw
est H
abili
tatio
n C
tr. (S
t. Lo
uis)
*D
NF
7979
7471
11.3
281.
8314
23
MO
Popl
ar B
luff
Reg
iona
l Ctr
. (Po
plar
Blu
ff)
1968
1992
MO
Rol
la R
egio
nal C
tr. (
Rol
la)
1968
1984
MO
Sike
ston
Reg
iona
l Ctr
. (Si
kest
on)
1969
1992
MO
Sout
heas
t Mis
sour
i Res
iden
tial S
ervi
ces
(Pop
lar B
luff
)19
9244
4444
46-4
.325
1.11
89
0
MO
Sout
heas
t Mis
sour
i Res
iden
tial S
ervi
ces (
Sike
ston
)19
9239
3939
390.
027
1.00
23
0
MO
Spri
ngfie
ld R
egio
nal C
tr. (
Spri
ngfie
ld)
1967
1990
MO
St. C
harle
s H
abili
tatio
n C
tr. (S
t. Lo
uis)
*59
5957
565.
433
0.71
86
1M
OSo
uth
Cou
nty
Hab
ilita
tion
Ctr.
*70
7068
682.
928
1.00
3012
3M
TE
astm
ont H
uman
Ser
vice
s C
tr. (
Gle
ndiv
e)19
6920
03M
TM
onta
na D
evel
opm
enta
l Ctr.
(Bou
lder
)19
0579
7984
98-1
9.4
509.
8131
551
NH
Lac
onia
Sta
te S
choo
l and
Trn
g. C
tr. (
Lac
onia
)19
0319
91
NH
New
Ham
pshi
re H
ospi
tal,
Bro
wn
Bui
ldin
g (C
onco
rd)
1842
1990
NE
Bea
trice
Sta
te D
ev. C
tr. (B
eatri
ce)
1875
375
375
373
370
1.4
306.
9027
184
NV
Des
ert R
egio
nal C
tr. (L
as V
egas
)19
7562
6261
64-3
.150
2.30
1720
0N
VSi
erra
Reg
iona
l Ctr.
(Spa
rks)
1977
2727
3237
-27.
047
5.90
210
1N
JC
tr. a
t Anc
ora
(Ham
mon
ton)
DN
F19
92N
JG
reen
Bro
ok R
egio
nal C
tr. (G
reen
Bro
ok)
1981
9494
9510
0-6
.049
2.00
55
8N
JE
diso
n H
abili
tatio
n C
tr. (
Prin
ceto
n)19
7519
88N
JH
unte
rdon
Dev
. Ctr.
(C
linto
n)19
6958
858
858
258
50.
547
0.00
34
10N
JE
.R. J
ohns
tone
Trn
g. &
Res
earc
h C
tr. (
Bor
dent
own)
1955
1992
NJ
New
Lis
bon
Dev
. Ctr.
(New
Lis
bon)
1914
522
522
523
536
-2.6
546.
0022
297
NJ
Nor
th Je
rsey
Dev
. Ctr.
(Tot
owa)
1928
390
390
389
388
0.5
554.
0023
159
NJ
Nor
th P
rinc
eton
Ctr
. (Pr
ince
ton)
1975
1998
NJ
Vin
elan
d D
ev. C
tr. (V
inel
and)
1888
482
482
484
492
-2.0
519.
0019
1317
NJ
Woo
dbin
e D
ev. C
tr. (W
oodb
ine)
1921
479
508
506
517
-7.4
445.
0022
1613
NJ
Woo
dbrid
ge C
tr. (W
oodb
ridge
)19
6548
548
549
250
2-3
.450
2.00
1014
10N
MFo
rt S
tant
on H
ospi
tal a
nd T
rng.
Ctr
. (Fo
rt S
tant
on)
1964
1995
NM
Los
Lun
as H
ospi
tal a
nd T
rng.
Ctr
. (L
os L
unas
)19
2919
97
NM
Vill
a So
lano
-Hag
erm
an R
esid
entia
l Sch
ool (
Ros
wel
l)19
6419
82
NY
12J.
N. A
dam
s (Pe
rrys
burg
)19
6019
9312
NY
repo
rted
an F
Y05
ave
rage
per
die
m fo
r sta
te-o
pera
ted
ICFs
-MR
of a
ll si
zes.
NY
's re
porte
d FY
04 a
vera
ge p
er d
iem
for s
tate
ope
rate
d fa
cilit
ies
liste
d ab
ove
only
was
$63
8.66
* A
dmin
iste
red
by S
t. Lo
uis
DD
Tre
atm
ent C
ente
r

28
Stat
eLa
rge
Stat
e ID
/DD
Fac
ilitie
s or U
nits
Ope
ratin
g 19
60-2
005
Yea
r Fa
cilit
y O
pene
dY
ear
Clo
sed
Res
iden
ts w
ith
ID/D
D
on
6/30
/05
All
Res
iden
ts on
6/
30/0
5
Ave
rage
D
aily
ID
/DD
R
esid
ents
FY 0
5
Res
iden
ts w
ith
ID/D
D
on
6/30
/04
% +
/- C
hang
e 6/
30/0
4-6/
30/0
5
Ave
rage
per
D
iem
Ex
pend
iture
s FY
05
($)
FY 0
5 A
dmiss
ions
/R
eadm
issio
nsFY
05
Disc
harg
esFY
05
Dea
ths
NY
Ber
nard
M. F
ines
on D
evel
opm
enta
l C
ente
r13:
Hill
side
Cam
pus
1970
How
ard
Park
Uni
t19
70
NY
Bro
nx D
DSO
(Bro
nx)
1971
1992
NY
Bro
okly
n D
DSO
(Bro
okly
n)19
7229
629
629
930
1-1
.764
7.02
1415
4N
YB
room
e D
DSO
(Bin
gham
ton)
1970
277
277
285
291
-4.8
647.
0227
2318
NY
Cap
ital D
istri
ct D
DSO
(Sch
enec
tady
)1419
7355
5554
541.
964
7.02
43
0N
YC
entr
al N
ew Y
ork
DD
SO (S
yrac
use)
1518
5119
98
NY
Cra
ig D
DSO
(Son
yea)
1935
1988
NY
Fing
er L
akes
DD
SO (R
oche
ster
)1619
6910
410
410
298
6.1
647.
0213
70
NY
Gou
vern
eur
(New
Yor
k)19
6219
78N
YH
udso
n V
alle
y D
DSO
(Thi
ells
)19
1120
00N
YL
ong
Isla
nd D
DSO
(Com
mac
k)19
6519
93N
YL
ong
Isla
nd D
DSO
(Mel
ville
)19
6519
92N
YM
anha
ttan
Ctr
. (N
ew Y
ork)
1972
1992
NY
New
ark
Ctr
. (N
ewar
k)18
7819
91N
YR
ome
Ctr
. (R
ome)
1894
1989
NY
Sam
pson
Sta
te S
choo
l (W
illar
d)19
6119
71N
YSt
aten
Isla
nd D
DSO
(Sta
ten
Isla
nd)
1987
5757
5861
-6.6
647.
022
42
NY
Stat
en I
slan
d D
DSO
(Sta
ten
Isla
nd)
1947
1988
NY
Sunm
ount
DD
SO (T
uppe
r Lak
e)19
6522
622
622
622
40.
964
7.02
119
0N
YTa
coni
c D
DSO
(Was
saic
)19
3018
918
919
119
0-0
.564
7.02
2013
8N
YV
alat
ie (V
alat
ie)
1971
1974
NY
Val
ley
Rid
ge20
0060
6059
591.
764
7.02
86
1N
YW
estc
hest
er N
Y D
DSO
(Tar
ryto
wn)
1979
1988
NY
Wes
tern
NY
DD
SO (W
est S
enec
a)17
1962
8282
9110
2-1
9.6
647.
0211
292
NY
Will
owbr
ook
Stat
e Sc
hool
(Sta
ten
Isla
nd)
1947
1988
NY
Wilt
on D
DSO
(Wilt
on)
1960
1995
280
270
36.
764
7.02
244
16 F
inge
r Lak
es D
DSO
(NY
) was
form
erly
Mon
roe
DD
SO17
Wes
tern
New
Yor
k D
DSO
was
form
erly
Wes
t Sen
eca
DD
SO
288
288
15 C
entra
l New
Yor
k D
DSO
was
form
erly
Syr
acus
e D
DSO
14 C
apita
l Dis
trict
DD
SO (N
Y) w
as fo
rmer
ly O
.D. H
eck
DD
SO
13 N
Y c
ount
s as o
ne fa
cilit
y, b
ut th
ere
are
two
sepa
rate
uni
ts
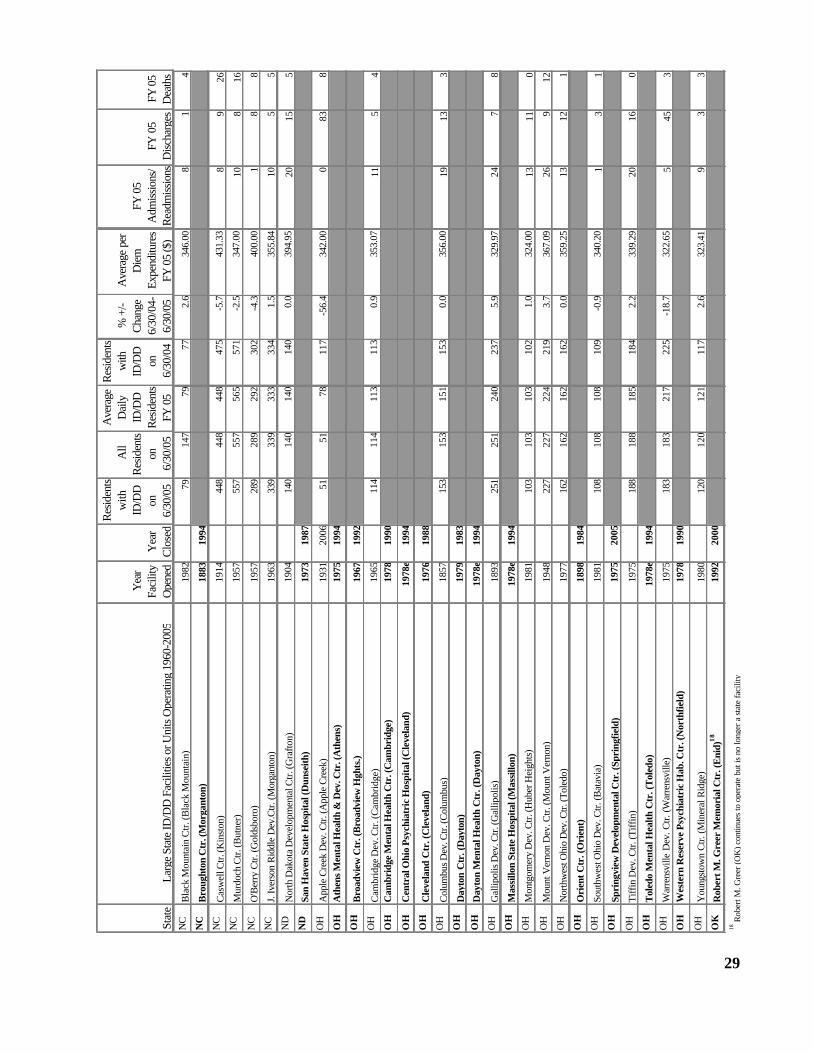
29
Stat
eLa
rge
Stat
e ID
/DD
Fac
ilitie
s or U
nits
Ope
ratin
g 19
60-2
005
Yea
r Fa
cilit
y O
pene
dY
ear
Clo
sed
Res
iden
ts w
ith
ID/D
D
on
6/30
/05
All
Res
iden
ts on
6/
30/0
5
Ave
rage
D
aily
ID
/DD
R
esid
ents
FY 0
5
Res
iden
ts w
ith
ID/D
D
on
6/30
/04
% +
/- C
hang
e 6/
30/0
4-6/
30/0
5
Ave
rage
per
D
iem
Ex
pend
iture
s FY
05
($)
FY 0
5 A
dmiss
ions
/R
eadm
issio
nsFY
05
Disc
harg
esFY
05
Dea
ths
NC
Bla
ck M
ount
ain
Ctr.
(Bla
ck M
ount
ain)
1982
7914
779
772.
634
6.00
81
4N
CB
roug
hton
Ctr
. (M
orga
nton
)18
8319
94N
CC
asw
ell C
tr. (K
inst
on)
1914
448
448
448
475
-5.7
431.
338
926
NC
Mur
doch
Ctr.
(But
ner)
1957
557
557
565
571
-2.5
347.
0010
816
NC
O'B
erry
Ctr.
(Gol
dsbo
ro)
1957
289
289
292
302
-4.3
400.
001
88
NC
J. Iv
erso
n R
iddl
e D
ev.C
tr. (M
orga
nton
)19
6333
933
933
333
41.
535
5.84
105
5N
DN
orth
Dak
ota
Dev
elop
men
tal C
tr. (G
rafto
n)19
0414
014
014
014
00.
039
4.95
2015
5N
DSa
n H
aven
Sta
te H
ospi
tal (
Dun
seith
)19
7319
87O
HA
pple
Cre
ek D
ev. C
tr. (A
pple
Cre
ek)
1931
2006
5151
7811
7-5
6.4
342.
000
838
OH
Ath
ens M
enta
l Hea
lth &
Dev
. Ctr
. (A
then
s)19
7519
94
OH
Bro
advi
ew C
tr. (
Bro
advi
ew H
ghts
.)19
6719
92O
HC
ambr
idge
Dev
. Ctr.
(Cam
brid
ge)
1965
114
114
113
113
0.9
353.
0711
54
OH
Cam
brid
ge M
enta
l Hea
lth C
tr. (
Cam
brid
ge)
1978
1990
OH
Cen
tral
Ohi
o Ps
ychi
atri
c H
ospi
tal (
Cle
vela
nd)
1978
e19
94
OH
Cle
vela
nd C
tr. (
Cle
vela
nd)
1976
1988
OH
Col
umbu
s Dev
. Ctr.
(Col
umbu
s)18
5715
315
315
115
30.
035
6.00
1913
3O
HD
ayto
n C
tr. (
Day
ton)
1979
1983
OH
Day
ton
Men
tal H
ealth
Ctr
. (D
ayto
n)19
78e
1994
OH
Gal
lipol
is D
ev. C
tr. (G
allip
olis
)18
9325
125
124
023
75.
932
9.97
247
8O
HM
assi
llon
Stat
e H
ospi
tal (
Mas
sillo
n)19
78e
1994
OH
Mon
tgom
ery
Dev
. Ctr.
(Hub
er H
eigh
ts)
1981
103
103
103
102
1.0
324.
0013
110
OH
Mou
nt V
erno
n D
ev. C
tr. (M
ount
Ver
non)
1948
227
227
224
219
3.7
367.
0926
912
OH
Nor
thw
est O
hio
Dev
. Ctr.
(Tol
edo)
1977
162
162
162
162
0.0
359.
2513
121
OH
Ori
ent C
tr. (
Ori
ent)
1898
1984
OH
Sout
hwes
t Ohi
o D
ev. C
tr. (B
atav
ia)
1981
108
108
108
109
-0.9
340.
201
31
OH
Spri
ngvi
ew D
evel
opm
enta
l Ctr
. (Sp
ring
field
)19
7520
05O
HTi
ffin
Dev
. Ctr.
(Tiff
in)
1975
188
188
185
184
2.2
339.
2920
160
OH
Tol
edo
Men
tal H
ealth
Ctr
. (T
oled
o)19
78e
1994
OH
War
rens
ville
Dev
. Ctr.
(War
rens
ville
)19
7518
318
321
722
5-1
8.7
322.
655
453
OH
Wes
tern
Res
erve
Psy
chia
tric
Hab
. Ctr
. (N
orth
field
)19
7819
90
OH
You
ngst
own
Ctr.
(Min
eral
Rid
ge)
1980
120
120
121
117
2.6
323.
419
33
OK
Rob
ert M
. Gre
er M
emor
ial C
tr. (
Eni
d)18
1992
2000
18 R
ober
t M. G
reer
(OK
) con
tinue
s to
ope
rate
but
is n
o lo
nger
a s
tate
faci
lity
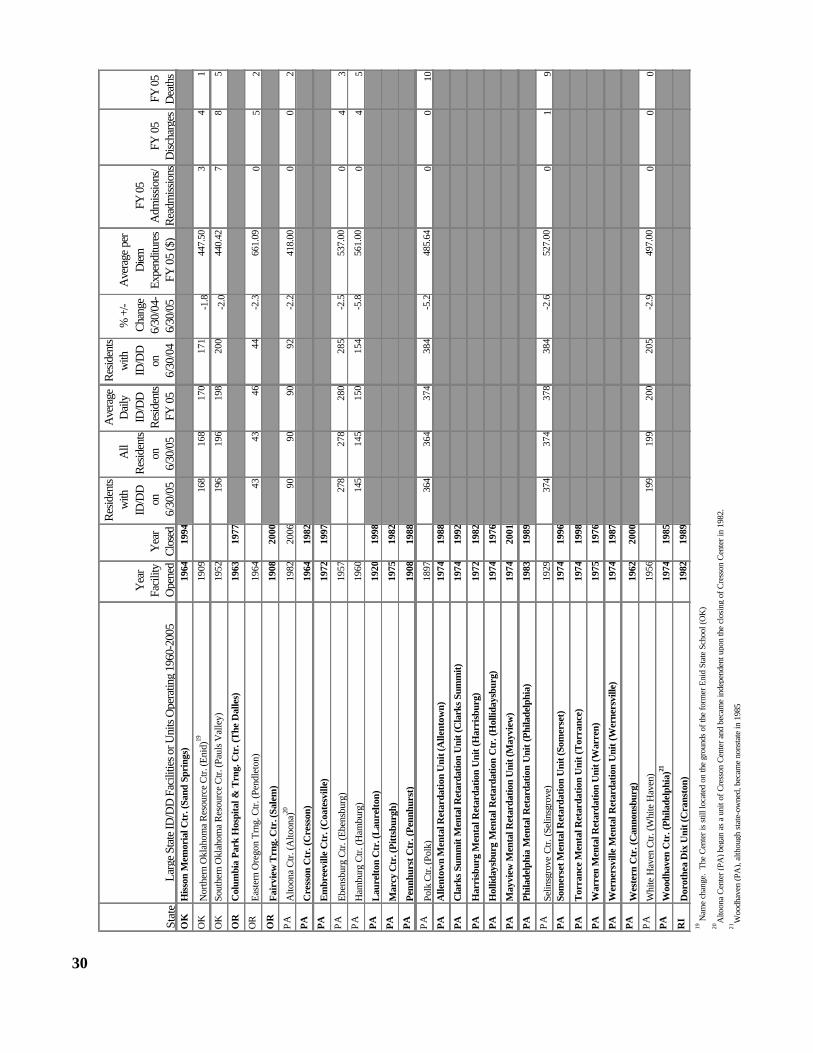
30
Stat
eLa
rge S
tate
ID/D
D F
acili
ties o
r Uni
ts O
pera
ting
1960
-200
5
Yea
r Fa
cilit
y O
pene
dY
ear
Clos
ed
Res
iden
ts w
ith
ID/D
D
on
6/30
/05
All
Res
iden
ts on
6/
30/0
5
Ave
rage
D
aily
ID
/DD
R
esid
ents
FY 0
5
Res
iden
ts w
ith
ID/D
D
on
6/30
/04
% +
/- C
hang
e 6/
30/0
4-6/
30/0
5
Ave
rage
per
D
iem
Expe
nditu
res
FY 0
5 ($
)
FY 0
5 A
dmiss
ions
/R
eadm
issio
nsFY
05
Disc
harg
esFY
05
Dea
ths
OK
His
son
Mem
oria
l Ctr
. (Sa
nd S
prin
gs)
1964
1994
OK
Nor
ther
n O
klah
oma
Res
ourc
e C
tr. (E
nid)
1919
0916
816
817
017
1-1
.844
7.50
34
1
OK
Sout
hern
Okl
ahom
a R
esou
rce
Ctr.
(Pau
ls V
alle
y)19
5219
619
619
820
0-2
.044
0.42
78
5
OR
Col
umbi
a Pa
rk H
ospi
tal &
Trn
g. C
tr. (
The
Dal
les)
1963
1977
OR
East
ern
Ore
gon
Trng
. Ctr.
(Pen
dlet
on)
1964
4343
4644
-2.3
661.
090
52
OR
Fair
view
Trn
g. C
tr. (
Sale
m)
1908
2000
PA
Alto
ona
Ctr.
(Alto
ona)
2019
8220
0690
9090
92-2
.241
8.00
00
2PA
Cre
sson
Ctr
. (C
ress
on)
1964
1982
PAE
mbr
eevi
lle C
tr. (
Coa
tesv
ille)
1972
1997
PA
Eben
sbur
g C
tr. (E
bens
burg
)19
5727
827
828
028
5-2
.553
7.00
04
3P
AH
ambu
rg C
tr. (H
ambu
rg)
1960
145
145
150
154
-5.8
561.
000
45
PAL
aure
lton
Ctr
. (L
aure
lton)
1920
1998
PAM
arcy
Ctr
. (Pi
ttsb
urgh
)19
7519
82PA
Penn
hurs
t Ctr
. (Pe
nnhu
rst)
1908
1988
PA
Polk
Ctr.
(Pol
k)18
9736
436
437
438
4-5
.248
5.64
00
10PA
Alle
ntow
n M
enta
l Ret
arda
tion
Uni
t (A
llent
own)
1974
1988
PAC
lark
s Su
mm
it M
enta
l Ret
arda
tion
Uni
t (C
lark
s Su
mm
it)19
7419
92
PAH
arri
sbur
g M
enta
l Ret
arda
tion
Uni
t (H
arri
sbur
g)19
7219
82
PAH
ollid
aysb
urg
Men
tal R
etar
datio
n C
tr. (
Hol
liday
sbur
g)19
7419
76
PAM
ayvi
ew M
enta
l Ret
arda
tion
Uni
t (M
ayvi
ew)
1974
2001
PAPh
ilade
lphi
a M
enta
l Ret
arda
tion
Uni
t (Ph
ilade
lphi
a)19
8319
89
PA
Selin
sgro
ve C
tr. (
Selin
sgro
ve)
1929
374
374
378
384
-2.6
527.
000
19
PASo
mer
set M
enta
l Ret
arda
tion
Uni
t (So
mer
set)
1974
1996
PAT
orra
nce
Men
tal R
etar
datio
n U
nit (
Tor
ranc
e)19
7419
98
PAW
arre
n M
enta
l Ret
arda
tion
Uni
t (W
arre
n)19
7519
76
PAW
erne
rsvi
lle M
enta
l Ret
arda
tion
Uni
t (W
erne
rsvi
lle)
1974
1987
PAW
este
rn C
tr. (
Can
nons
burg
)19
6220
00P
AW
hite
Hav
en C
tr. (W
hite
Hav
en)
1956
199
199
200
205
-2.9
497.
000
00
PAW
oodh
aven
Ctr
. (Ph
ilade
lphi
a)21
1974
1985
RI
Dor
othe
a D
ix U
nit (
Cra
nsto
n)19
8219
89
20A
ltoon
a C
ente
r (PA
) beg
an a
s a
unit
of C
ress
on C
ente
r and
bec
ame
inde
pend
ent u
pon
the
clos
ing
of C
ress
on C
ente
r in
1982
.21
Woo
dhav
en (P
A),
alth
ough
sta
te-o
wne
d, b
ecam
e no
nsta
te in
198
5
19 N
ame
chan
ge.
The
Cen
ter i
s st
ill lo
cate
d on
the
grou
nds
of th
e fo
rmer
Eni
d St
ate
Scho
ol (O
K)
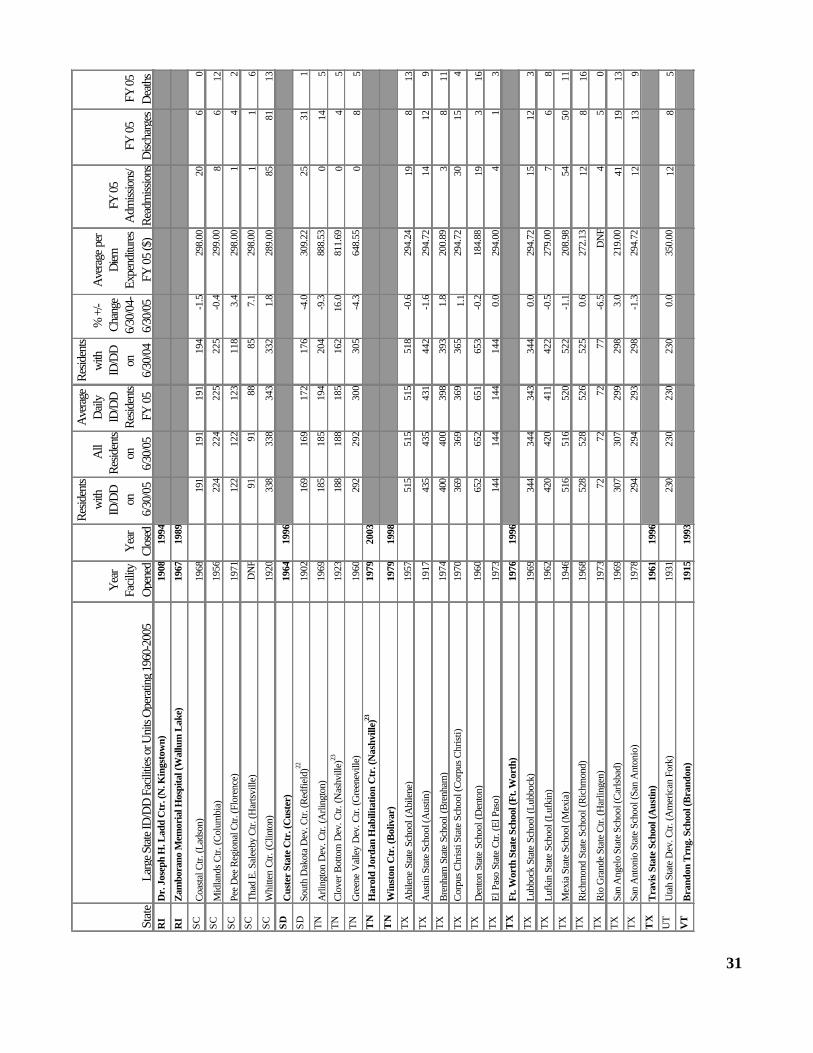
31
Stat
eLa
rge S
tate I
D/D
D F
acili
ties o
r Uni
ts O
pera
ting
1960
-200
5
Yea
r Fa
cilit
y O
pene
dY
ear
Clos
ed
Resid
ents
with
ID
/DD
on
6/
30/0
5
All
Resid
ents
on
6/30
/05
Ave
rage
D
aily
ID/D
D
Resid
ents
FY 0
5
Resid
ents
with
ID
/DD
on
6/
30/0
4
% +
/- Ch
ange
6/
30/0
4-6/
30/0
5
Ave
rage
per
D
iem
Expe
nditu
res
FY 0
5 ($
)
FY 05
A
dmiss
ions
/Re
adm
issio
nsFY
05
Disc
harg
esFY
05
Dea
ths
RI
Dr.
Jos
eph
H. L
add
Ctr
. (N
. Kin
gsto
wn)
1908
1994
RI
Zam
bora
no M
emor
ial H
ospi
tal (
Wal
lum
Lak
e)19
6719
89
SCC
oast
al C
tr. (L
adso
n)19
6819
119
119
119
4-1
.529
8.00
206
0SC
Mid
land
s C
tr. (C
olum
bia)
1956
224
224
225
225
-0.4
299.
008
612
SCPe
e D
ee R
egio
nal C
tr. (F
lore
nce)
1971
122
122
123
118
3.4
298.
001
42
SCTh
ad E
. Sal
eeby
Ctr.
(Har
tsvi
lle)
DN
F91
9188
857.
129
8.00
11
6SC
Whi
tten
Ctr.
(Clin
ton)
1920
338
338
343
332
1.8
289.
0085
8113
SDC
uste
r St
ate
Ctr
. (C
uste
r)19
6419
96SD
Sout
h D
akot
a D
ev. C
tr. (R
edfie
ld)22
1902
169
169
172
176
-4.0
309.
2225
311
TNA
rling
ton
Dev
. Ctr.
(Arli
ngto
n)19
6918
518
519
420
4-9
.388
8.53
014
5TN
Clo
ver B
otto
m D
ev. C
tr. (N
ashv
ille)
2319
2318
818
818
516
216
.081
1.69
04
5TN
Gre
ene
Val
ley
Dev
. Ctr.
(Gre
enev
ille)
1960
292
292
300
305
-4.3
648.
550
85
TN
Har
old
Jord
an H
abili
tatio
n C
tr. (
Nas
hvill
e)23
1979
2003
TN
Win
ston
Ctr
. (B
oliv
ar)
1979
1998
TXA
bile
ne S
tate
Sch
ool (
Abi
lene
)19
5751
551
551
551
8-0
.629
4.24
198
13TX
Aus
tin S
tate
Sch
ool (
Aus
tin)
1917
435
435
431
442
-1.6
294.
7214
129
TXB
renh
am S
tate
Sch
ool (
Bre
nham
)19
7440
040
039
839
31.
820
0.89
38
11TX
Cor
pus C
hris
ti St
ate
Scho
ol (C
orpu
s Chr
isti)
1970
369
369
369
365
1.1
294.
7230
154
TXD
ento
n St
ate
Scho
ol (D
ento
n)19
6065
265
265
165
3-0
.218
4.88
193
16TX
El P
aso
Stat
e C
tr. (E
l Pas
o)19
73
144
144
144
144
0.0
294.
004
13
TX
Ft. W
orth
Sta
te S
choo
l (Ft
. Wor
th)
1976
1996
TXLu
bboc
k St
ate
Scho
ol (L
ubbo
ck)
1969
344
344
343
344
0.0
294.
7215
123
TXLu
fkin
Sta
te S
choo
l (Lu
fkin
)19
6242
042
041
142
2-0
.527
9.00
76
8TX
Mex
ia S
tate
Sch
ool (
Mex
ia)
1946
516
516
520
522
-1.1
208.
9854
5011
TXR
ichm
ond
Stat
e Sc
hool
(Ric
hmon
d)19
6852
852
852
652
50.
627
2.13
128
16TX
Rio
Gra
nde
Stat
e C
tr. (H
arlin
gen)
1973
7272
7277
-6.5
DN
F4
50
TXSa
n A
ngel
o St
ate
Scho
ol (C
arls
bad)
1969
307
307
299
298
3.0
219.
0041
1913
TXSa
n A
nton
io S
tate
Sch
ool (
San
Ant
onio
)19
7829
429
429
329
8-1
.329
4.72
1213
9T
XT
ravi
s St
ate
Scho
ol (A
ustin
)19
6119
96U
TU
tah
Stat
e D
ev. C
tr. (A
mer
ican
For
k)19
3123
023
023
023
00.
035
0.00
128
5V
TB
rand
on T
rng.
Sch
ool (
Bra
ndon
)19
1519
93
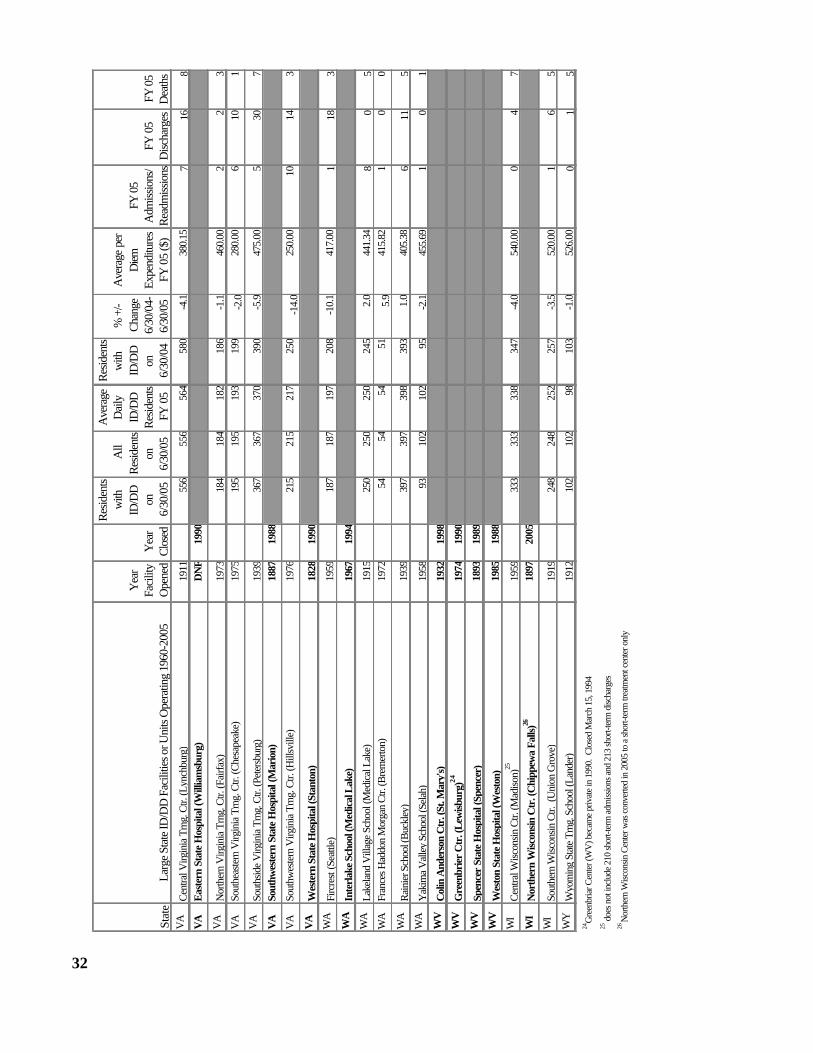
32
Stat
eLa
rge S
tate
ID/D
D F
acili
ties o
r Uni
ts O
pera
ting
1960
-200
5
Yea
r Fa
cilit
y O
pene
dY
ear
Clos
ed
Res
iden
ts w
ith
ID/D
D
on
6/30
/05
All
Res
iden
ts on
6/
30/0
5
Ave
rage
D
aily
ID
/DD
R
esid
ents
FY 0
5
Res
iden
ts w
ith
ID/D
D
on
6/30
/04
% +
/- C
hang
e 6/
30/0
4-6/
30/0
5
Ave
rage
per
D
iem
Expe
nditu
res
FY 0
5 ($
)
FY 0
5 A
dmiss
ions
/R
eadm
issio
nsFY
05
Disc
harg
esFY
05
Dea
ths
VA
Cen
tral V
irgin
ia T
rng.
Ctr.
(Lyn
chbu
rg)
1911
556
556
564
580
-4.1
380.
157
168
VA
Eas
tern
Sta
te H
ospi
tal (
Will
iam
sbur
g)D
NF
1990
VA
Nor
ther
n V
irgin
ia T
rng.
Ctr.
(Fai
rfax)
1973
184
184
182
186
-1.1
460.
002
23
VA
Sout
heas
tern
Virg
inia
Trn
g. C
tr. (C
hesa
peak
e)19
7519
519
519
319
9-2
.028
0.00
610
1
VA
Sout
hsid
e V
irgin
ia T
rng.
Ctr.
(Pet
ersb
urg)
1939
367
367
370
390
-5.9
475.
005
307
VA
Sout
hwes
tern
Sta
te H
ospi
tal (
Mar
ion)
1887
1988
VA
Sout
hwes
tern
Virg
inia
Trn
g. C
tr. (H
illsv
ille)
1976
215
215
217
250
-14.
025
0.00
1014
3
VA
Wes
tern
Sta
te H
ospi
tal (
Stan
ton)
1828
1990
WA
Firc
rest
(Sea
ttle)
1959
187
187
197
208
-10.
141
7.00
118
3W
AIn
terl
ake S
choo
l (M
edic
al L
ake)
1967
1994
WA
Lake
land
Vill
age
Scho
ol (M
edic
al L
ake)
1915
250
250
250
245
2.0
441.
348
05
WA
Fran
ces H
addo
n M
orga
n C
tr. (B
rem
erto
n)19
7254
5454
515.
941
5.82
10
0
WA
Rai
nier
Sch
ool (
Buc
kley
)19
3939
739
739
839
31.
040
5.38
611
5W
AY
akim
a Val
ley
Scho
ol (S
elah
)19
5893
102
102
95-2
.145
5.69
10
1W
VC
olin
And
erso
n C
tr. (
St. M
ary'
s)19
3219
98W
VG
reen
brie
r C
tr. (
Lew
isbur
g)24
1974
1990
WV
Spen
cer
Stat
e H
ospi
tal (
Spen
cer)
1893
1989
WV
Wes
ton
Stat
e H
ospi
tal (
Wes
ton)
1985
1988
WI
Cen
tral W
iscon
sin C
tr. (M
adiso
n)25
1959
333
333
338
347
-4.0
540.
000
47
WI
Nor
ther
n W
iscon
sin C
tr. (
Chi
ppew
a Fa
lls)26
1897
2005
WI
Sout
hern
Wisc
onsin
Ctr.
(U
nion
Gro
ve)
1919
248
248
252
257
-3.5
520.
001
65
WY
Wyo
min
g St
ate
Trng
. Sch
ool (
Land
er)
1912
102
102
9810
3-1
.052
6.00
01
5
26 N
orth
ern
Wisc
onsin
Cen
ter w
as c
onve
rted
in 2
005
to a
shor
t-ter
m tr
eatm
ent c
ente
r onl
y
24G
reen
bria
r Cen
ter (
WV
) bec
ame
priv
ate
in 1
990.
Clo
sed
Mar
ch 1
5, 1
994
25
doe
s not
incl
ude
210
shor
t-ter
m a
dmiss
ions
and
213
shor
t-ter
m d
ischa
rges
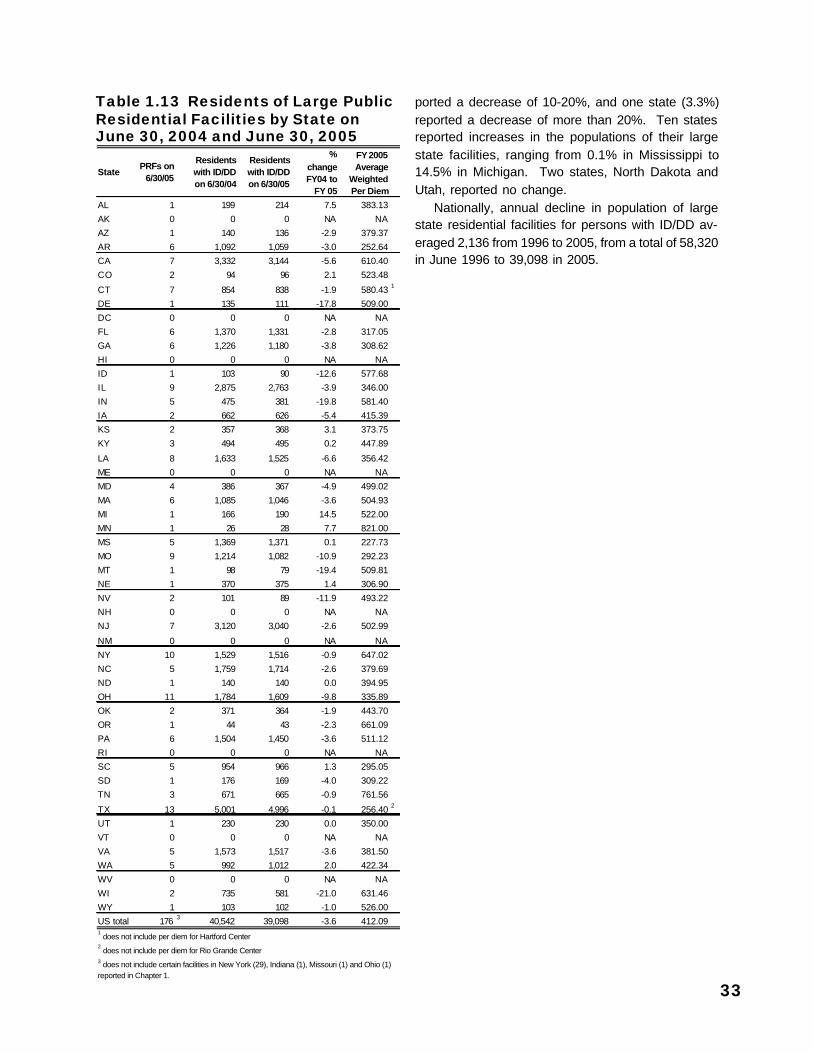
33
ported a decrease of 10-20%, and one state (3.3%)reported a decrease of more than 20%. Ten statesreported increases in the populations of their largestate facilities, ranging from 0.1% in Mississippi to14.5% in Michigan. Two states, North Dakota andUtah, reported no change.
Nationally, annual decline in population of largestate residential facilities for persons with ID/DD av-eraged 2,136 from 1996 to 2005, from a total of 58,320in June 1996 to 39,098 in 2005.
Table 1.13 Residents of Large PublicResidential Facilities by State onJune 30, 2004 and June 30, 2005
AL 1 199 214 7.5 383.13
AK 0 0 0 NA NA
AZ 1 140 136 -2.9 379.37
AR 6 1,092 1,059 -3.0 252.64
CA 7 3,332 3,144 -5.6 610.40
CO 2 94 96 2.1 523.48
CT 7 854 838 -1.9 580.43 1
DE 1 135 111 -17.8 509.00
DC 0 0 0 NA NA
FL 6 1,370 1,331 -2.8 317.05
GA 6 1,226 1,180 -3.8 308.62
HI 0 0 0 NA NA
ID 1 103 90 -12.6 577.68
IL 9 2,875 2,763 -3.9 346.00
IN 5 475 381 -19.8 581.40
IA 2 662 626 -5.4 415.39
KS 2 357 368 3.1 373.75
KY 3 494 495 0.2 447.89
LA 8 1,633 1,525 -6.6 356.42
ME 0 0 0 NA NA
MD 4 386 367 -4.9 499.02
MA 6 1,085 1,046 -3.6 504.93
MI 1 166 190 14.5 522.00
MN 1 26 28 7.7 821.00
MS 5 1,369 1,371 0.1 227.73
MO 9 1,214 1,082 -10.9 292.23
MT 1 98 79 -19.4 509.81
NE 1 370 375 1.4 306.90
NV 2 101 89 -11.9 493.22
NH 0 0 0 NA NA
NJ 7 3,120 3,040 -2.6 502.99
NM 0 0 0 NA NA
NY 10 1,529 1,516 -0.9 647.02
NC 5 1,759 1,714 -2.6 379.69
ND 1 140 140 0.0 394.95
OH 11 1,784 1,609 -9.8 335.89
OK 2 371 364 -1.9 443.70
OR 1 44 43 -2.3 661.09
PA 6 1,504 1,450 -3.6 511.12
RI 0 0 0 NA NA
SC 5 954 966 1.3 295.05
SD 1 176 169 -4.0 309.22
TN 3 671 665 -0.9 761.56
TX 13 5,001 4,996 -0.1 256.40 2
UT 1 230 230 0.0 350.00
VT 0 0 0 NA NA
VA 5 1,573 1,517 -3.6 381.50
WA 5 992 1,012 2.0 422.34
WV 0 0 0 NA NA
WI 2 735 581 -21.0 631.46
WY 1 103 102 -1.0 526.00
US total 176 3 40,542 39,098 -3.6 412.091 does not include per diem for Hartford Center
2 does not include per diem for Rio Grande Center
3 does not include certain facilities in New York (29), Indiana (1), Missouri (1) and Ohio (1) reported in Chapter 1.
StatePRFs on
6/30/05
FY 2005 Average
Weighted Per Diem
Residents with ID/DD on 6/30/04
Residents with ID/DD on 6/30/05
% change FY04 to
FY 05
Section 2Status and Changes in
Total State Residential ServiceSystems

36
37
Chapter 3Services Provided by State and Nonstate Agencies in 2005
Kathryn Coucouvanis, Robert W. Prouty, and K. Charlie Lakin
This chapter provides statistics on all residentialservices that were directly provided or licensed bystates for persons with intellectual disabilities andrelated developmental disabilities (ID/DD). Thesestatistics are reported by state, operator (state ornonstate agency), and residential setting size as ofJune 30, 2005. Residential services data for 2005are compared with similar statistics from June 30,1977, 1982, 1987, 1992, 1997, 2002 and 2004. Thestatistics in this chapter do not include psychiatricfacilities or nursing facilities, but do include residentialservices financed under the federal Medicaidprogram, most notably the Intermediate Care Facilitiesfor Persons with Mental Retardation (ICFs-MR) andHome and Community Based Services (HCBS)programs. Statistics on psychiatric facility residentswith ID/DD are reported in Chapter 1 and statisticson nursing facility residents with ID/DD are reportedin Chapter 7. They are excluded here because ofthis chapter’s focus on services provided within thedesignated ID/DD service systems of each state.
Number of Residential Settings
Table 2.1 presents statistics by state, operator, andsize on the number of individual residential settingsin which people received state licensed or stateprovided residential supports for persons with ID/DDon June 30, 2005. It excludes services provided topeople living with their natural or adoptive families.Statistics on persons with ID/DD receiving servicesin their family home are provided in Chapter 4.
There were an estimated 152,322 distinct residen-tial settings in which persons with ID/DD were receiv-ing residential services on June 30, 2005. Of the to-tal 152,322 residential settings, an estimated 149,853(98.4%) were operated or supported by employeesof nonstate agencies and 2,469 (1.6%) were oper-ated or supported by state agencies. In all, an esti-mated 145,626 (95.6%) settings had 6 or fewer resi-dents, 5,705 (3.7%) settings had 7 to 15 residentsand 991 (0.7%) settings had 16 or more residents.Virtually all residential settings with 6 or fewer resi-
dents were operated or supported by nonstate agen-cies (98.9%), as were most of those with 7 to 15 per-sons (87.4%) and with 16 or more residents (78.9%).
Number of Persons Receiving ResidentialServices
Table 2.2 presents statistics by state, operator, andsetting size on the number of people with ID/DDreceiving residential services on June 30, 2005. Itexcludes services provided to persons with ID/DDliving with their natural or adoptive families (seeChapter 4).
On June 30, 2005 a total of 411,215 persons withID/DD were receiving residential services sponsoredby state ID/DD agencies. Of these, 358,703 (87.2%)were served by nonstate agencies. Virtually all of theestimated 291,145 persons in settings with 6 or fewerresidents (98.1%) and an overwhelming majority ofthose in settings with 7 to 15 residents (86.8%) re-ceived services from nonstate agencies. In contrast,59.7% of all persons in facilities with 16 or more resi-dents were served by state agencies, even though78.4% of facilities with 16 or more residents were op-erated by nonstate agencies.
California and New York had by far the largestnumbers of persons receiving residential services(52,873 and 45,422 respectively). California, Illinois,and Texas reported the largest number of personsliving in facilities of 16 or more residents (5,820, 6,660and 6,568, respectively). Illinois had the largest num-ber of persons living in large nonstate facilities (3,897or 14.4% of the national total). California and NewYork reported the largest number of persons living innonstate residential settings of 15 or fewer persons(47,053 and 34,549, respectively). California, Michi-gan, and New York had the largest number of per-sons living in nonstate residential settings of 6 or fewerpersons (45,566, 14,107, and 20,840, respectively).
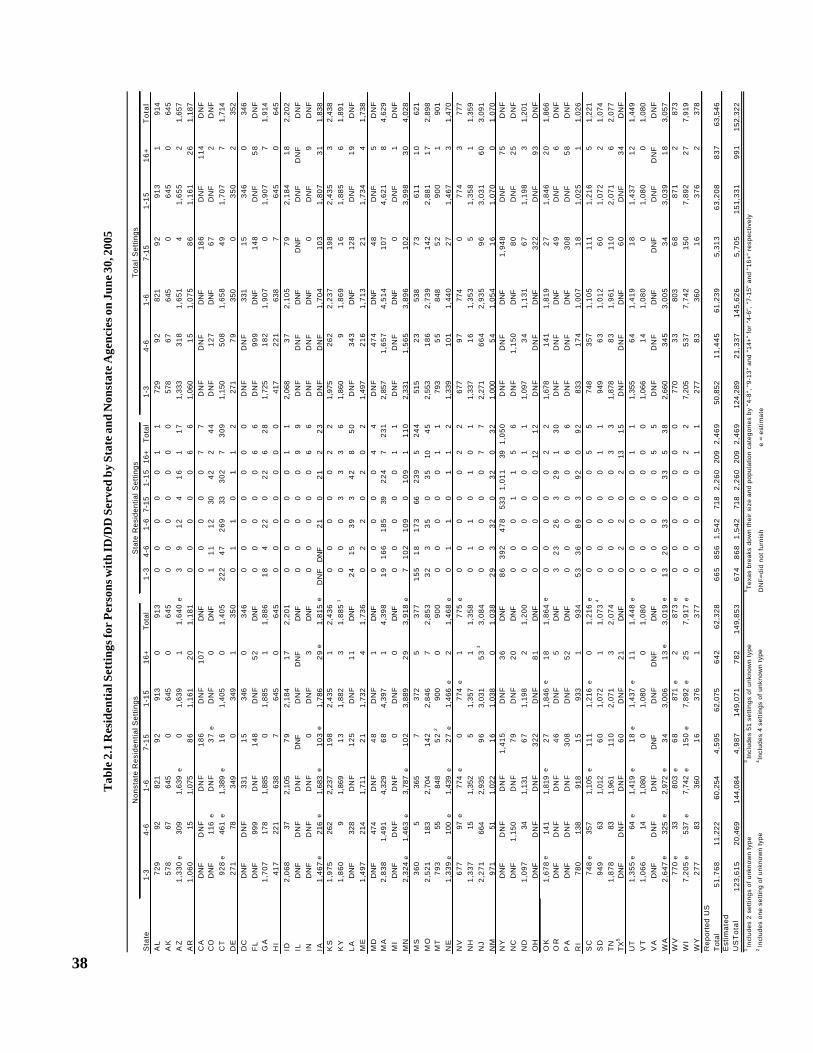
38
Tab
le 2
.1 R
esid
enti
al S
etti
ngs f
or P
erso
ns w
ith
ID/D
D S
erve
d by
Sta
te a
nd N
onst
ate
Age
ncie
s on
June
30,
200
5
Sta
teT
otal
1-3
4-6
1-6
7-15
1-1
516
+T
otal
AL
72
992
821
92
913
09
13
00
00
01
172
99
282
19
29
13
191
4A
K5
78
6764
50
645
06
45
00
00
00
057
86
764
50
64
50
645
AZ
1,3
30
e30
91,
639
e0
1,63
91
1,6
40
e3
91
24
16
11
71,
333
31
81
,65
14
1,6
55
21,
657
AR
1,0
60
151,
075
86
1,16
12
01
,18
10
00
00
66
1,06
01
51
,07
58
61
,16
12
61,
187
CA
DN
FD
NF
DN
F1
86
DN
F1
07
DN
F0
00
00
77
DN
FD
NF
DN
F1
86
DN
F1
14
DN
FC
OD
NF
116
eD
NF
37
eD
NF
0D
NF
11
11
230
42
24
4D
NF
12
7D
NF
67
DN
F2
DN
FC
T9
28
e46
1e
1,38
9e
16
1,40
50
1,4
05
22
24
72
69
333
02
73
09
1,15
05
08
1,6
58
49
1,7
07
71,
714
DE
27
178
349
034
91
35
00
11
01
12
271
79
350
03
50
235
2D
CD
NF
DN
F33
11
534
60
34
60
00
00
00
DN
FD
NF
331
15
34
60
346
FL
DN
F99
9D
NF
14
8D
NF
52
DN
F0
00
00
66
DN
F9
99
DN
F1
48
DN
F5
8D
NF
GA
1,7
07
178
1,88
50
1,88
51
1,8
86
18
42
20
22
62
81,
725
18
21
,90
70
1,9
07
71,
914
HI
41
722
163
87
645
06
45
00
00
00
041
72
21
638
76
45
064
5ID
2,0
68
372,
105
79
2,18
41
72
,20
10
00
00
11
2,06
83
72
,10
57
92
,18
41
82,
202
ILD
NF
DN
FD
NF
DN
FD
NF
DN
FD
NF
00
00
09
9D
NF
DN
FD
NF
DN
FD
NF
DN
FD
NF
IN
DN
FD
NF
DN
F0
DN
F3
DN
F0
00
00
66
DN
FD
NF
DN
F0
DN
F9
DN
FIA
1,4
67
e21
6e
1,68
3e
10
3e
1,78
62
9e
1,8
15
eD
NF
DN
F2
10
21
22
3D
NF
DN
F1
,70
41
03
1,8
07
31
1,83
8K
S1
,97
526
22,
237
19
82,
435
12
,43
60
00
00
22
1,97
52
62
2,2
37
19
82
,43
53
2,43
8K
Y1
,86
09
1,86
91
31,
882
31
,88
51
00
03
33
61,
860
91
,86
91
61
,88
56
1,89
1L
AD
NF
328
DN
F1
25
DN
F1
1D
NF
24
15
39
34
28
50
DN
F3
43
DN
F1
28
DN
F1
9D
NF
ME
1,4
97
214
1,71
12
11,
732
41
,73
60
22
02
02
1,49
72
16
1,7
13
21
1,7
34
41,
738
MD
DN
F47
4D
NF
48
DN
F1
DN
F0
00
00
44
DN
F4
74
DN
F4
8D
NF
5D
NF
MA
2,8
38
1,49
14,
329
68
4,39
71
4,3
98
19
16
61
85
392
24
72
31
2,85
71
,65
74
,51
41
07
4,6
21
84,
629
MI
DN
FD
NF
DN
F0
DN
F0
DN
F0
00
00
11
DN
FD
NF
DN
F0
DN
F1
DN
FM
N2
,32
4e
1,46
3e
3,78
7e
10
23,
889
29
3,9
18
e7
10
21
09
01
09
11
10
2,33
11
,56
53
,89
61
02
3,9
98
30
4,02
8M
S3
60
536
57
372
53
77
15
51
81
73
662
39
52
44
515
23
538
73
61
11
062
1M
O2
,52
118
32,
704
14
22,
846
72
,85
33
23
35
03
510
45
2,55
31
86
2,7
39
14
22
,88
11
72,
898
MT
79
355
848
52
290
00
90
00
00
00
11
793
55
848
52
90
01
901
NE
1,3
39
e10
0e
1,43
9e
27
e1,
466
e2
1,4
68
e0
11
01
12
1,33
91
01
1,4
40
27
1,4
67
31,
470
NV
67
797
e77
4e
077
4e
17
75
e0
00
00
22
677
97
774
07
74
377
7N
H1
,33
715
1,35
25
1,35
71
1,3
58
01
10
10
11,
337
16
1,3
53
51
,35
81
1,35
9N
J2
,27
166
42,
935
96
3,03
15
33
3,0
84
00
00
07
72,
271
66
42
,93
59
63
,03
16
03,
091
NM
97
151
1,02
21
61,
038
01
,03
82
93
32
03
20
32
1,00
05
41
,05
41
61
,07
00
1,07
0N
YD
NF
DN
FD
NF
1,4
15
DN
F3
6D
NF
86
39
24
78
533
1,0
11
391
,05
0D
NF
DN
FD
NF
1,9
48
DN
F7
5D
NF
NC
DN
F1,
150
DN
F7
9D
NF
20
DN
F0
00
11
56
DN
F1
,15
0D
NF
80
DN
F2
5D
NF
ND
1,0
97
341,
131
67
1,19
82
1,2
00
00
00
01
11,
097
34
1,1
31
67
1,1
98
31,
201
OH
D
NF
DN
FD
NF
32
2D
NF
81
DN
F0
00
00
121
2D
NF
DN
FD
NF
32
2D
NF
93
DN
FO
K1
,67
8e
141
1,81
9e
27
1,84
6e
18
1,8
64
e0
00
00
22
1,67
81
41
1,8
19
27
1,8
46
20
1,86
6O
RD
NF
DN
FD
NF
46
DN
F5
DN
F3
23
26
32
91
30
DN
FD
NF
DN
F4
9D
NF
6D
NF
PA
DN
FD
NF
DN
F3
08
DN
F5
2D
NF
00
00
06
6D
NF
DN
FD
NF
30
8D
NF
58
DN
FR
I7
80
138
918
15
933
19
34
53
36
89
39
20
92
833
17
41
,00
71
81
,02
51
1,02
6S
C7
48
e35
71,
105
e1
11
1,21
6e
01
,21
6e
00
00
05
574
83
57
1,1
05
11
11
,21
65
1,22
1S
D9
49
631,
012
60
1,07
21
1,0
73
40
00
00
11
949
63
1,0
12
60
1,0
72
21,
074
TN
1,8
78
831,
961
11
02,
071
32
,07
40
00
00
33
1,87
88
31
,96
11
10
2,0
71
62,
077
TX
5D
NF
DN
FD
NF
60
DN
F2
1D
NF
02
20
213
15
DN
FD
NF
DN
F6
0D
NF
34
DN
FU
T1
,35
5e
64e
1,41
9e
18
e1,
437
e1
11
,44
8e
00
00
01
11,
355
64
1,4
19
18
1,4
37
12
1,44
9V
T1
,06
614
1,08
00
1,08
00
1,0
80
00
00
00
01,
066
14
1,0
80
01
,08
00
1,08
0V
AD
NF
DN
FD
NF
DN
FD
NF
DN
FD
NF
00
00
05
5D
NF
DN
FD
NF
DN
FD
NF
DN
FD
NF
WA
2,6
47
e32
5e
2,97
2e
34
3,00
61
3e
3,0
19
e1
32
03
30
33
53
82,
660
34
53
,00
53
43
,03
91
83,
057
WV
77
0e
3380
3e
68
871
e2
87
3e
00
00
00
077
03
380
36
88
71
287
3W
I7
,20
5e
537
e7,
742
e1
50
e7,
892
e2
57
,91
7e
00
00
02
27,
205
53
77
,74
21
50
7,8
92
27
7,91
9W
Y2
77
8336
01
637
61
37
70
00
00
11
277
83
360
16
37
62
378
Rep
orte
d U
S
Tot
al5
1,7
68
11,2
2260
,254
4,5
95
62,0
756
42
62,3
286
65
85
61
,54
271
82
,26
020
92
,46
950
,852
11
,44
561
,239
5,3
13
63
,20
88
37
63,5
46E
stim
ate
d
US
To
tal
12
3,6
15
20,4
6914
4,08
44
,98
714
9,07
17
82
14
9,8
53
67
48
68
1,5
42
718
2,2
60
209
2,4
69
124,
289
21
,33
71
45
,62
65
,70
51
51
,33
19
91
152,
322
1 Inc
lude
s 2
sett
ings
of
unkn
own
type
3 In
clud
es 5
1 se
ttin
gs o
f un
know
n ty
pe5T
exas
bre
aks
dow
n th
eir
size
and
pop
ulat
ion
cate
gori
es b
y "4
-8",
"9-
13"
and
"14+
" fo
r "4
-6",
"7-
15"
and
"16+
" re
spec
tivel
y2 I
nclu
des
one
sett
ing
of u
nkno
wn
type
4In
clud
es 4
set
tings
of
unkn
own
type
DN
F=
did
not
furn
ish
16
+
e =
est
imat
e
To
tal
1-1
54
-61-
37-
151
-64
-61
-31
-61
-15
16
+7
-15
Tot
al S
ettin
gsS
tate
Res
iden
tial S
ettin
gsN
on
sta
te R
esi
de
ntia
l Se
ttin
gs

39
Tab
le 2
.2 P
erso
ns w
ith
ID/D
D S
erve
d by
Sta
te a
nd N
onst
ate
Age
ncie
s on
June
30,
200
5
Sta
te1
-34-
61
-67-
151-
151
6+
To
tal
1-3
4-6
1-6
7-15
1-15
16+
To
tal
1-3
4-6
1-6
7-1
51
-15
16+
To
tal
AL
1,67
139
92
,07
089
72,
967
02
,96
70
00
00
21
42
14
1,6
71
39
92
,07
08
97
2,9
67
21
43
,18
1A
K6
25
211
83
60
836
08
36
00
00
00
06
25
21
18
36
08
36
08
36
AZ
2,51
61,
016
3,5
32
03,
532
45
3,5
77
942
51
4091
13
62
27
2,5
25
1,0
58
3,5
83
40
3,6
23
18
13
,80
4A
R1,
148
671
,21
583
52,
050
51
22
,56
20
00
00
1,0
68
1,0
68
1,1
48
67
1,2
15
83
52
,05
01,
580
3,6
30
CA
DN
FD
NF
45
,56
61,
487
47,0
532
,48
64
9,5
39
00
00
03
,33
43
,33
4D
NF
DN
F4
5,5
66
1,4
87
47
,05
35,
820
52
,87
3C
O3,
766
e58
54
,35
127
8e
4,62
90
4,6
29
361
64
221
285
10
53
90
3,7
69
64
64
,41
54
99
4,9
14
10
55
,01
9C
T1,
689
e2,
425
e4
,11
4e
178
e4,
292
e0
4,2
92
e45
426
07
14
294
1,00
88
39
1,8
47
2,1
43
2,6
85
4,8
28
47
25
,30
08
39
6,1
39
DE
43
833
67
74
077
46
18
35
04
40
41
11
11
54
38
34
07
78
07
78
17
29
50
DC
DN
FD
NF
1,0
37
118
1,15
50
1,1
55
00
00
00
0D
NF
DN
F1
,03
71
18
1,1
55
01
,15
5F
L4,
248
4,51
58
,76
31,
286
10,0
492
,01
61
2,0
65
00
00
01
,33
11
,33
14
,24
84
,51
58
,76
31
,28
61
0,0
49
3,34
71
3,3
96
GA
3,41
570
84
,12
30
4,12
31
10
4,2
33
5416
70
070
1,1
90
1,2
60
3,4
69
72
44
,19
30
4,1
93
1,30
05
,49
3H
I5
88
469
1,0
57
81
1,06
50
1,0
65
00
00
00
05
88
46
91
,05
78
1,0
65
01
,06
5ID
2,48
120
52
,68
650
73,
193
19
03
,38
30
00
00
90
90
2,4
81
20
52
,68
65
07
3,1
93
28
03
,47
3IL
4,05
9e
3,67
7e
7,7
36
e6,
463
e14
,199
e3
,89
7e
18
,09
6e
00
00
02
,76
32
,76
34
,05
9e
3,6
77
e7
,73
6e
6,4
63
e1
4,1
99
e6,
660
e2
0,8
59
e
IN6,
869
3,25
41
0,1
23
010
,123
32
11
0,4
44
00
00
04
15
41
56
,86
93
,25
41
0,1
23
01
0,1
23
73
61
0,8
59
IA4,
388
e1,
106
e5
,49
4e
1,06
0e
6,55
4e
1,0
98
e7
,65
2e
DN
FD
NF
72
072
62
66
98
DN
FD
NF
5,5
66
1,0
60
6,6
26
1,72
48
,35
0K
S3,
657
1,40
65
,06
332
75,
390
60
5,4
50
00
00
03
67
36
73
,65
71
,40
65
,06
33
27
5,3
90
42
75
,81
7K
Y3,
132
443
,17
610
51
3,28
12
08
3,4
89
00
024
244
95
51
93
,13
24
43
,17
61
29
3,3
05
70
34
,00
8L
A1,
944
e1,
952
3,8
96
e99
44,
890
94
55
,83
537
741
11
3614
71
,52
51
,67
21
,98
12
,02
64
,00
71
,03
05
,03
72,
470
7,5
07
ME
2,10
01,
119
3,2
19
202
23,
421
49
23
,47
00
121
20
120
12
2,1
00
1,1
31
3,2
31
20
23
,43
349
3,4
82
MD
DN
FD
NF
6,2
42
313
6,55
52
56
,58
00
00
00
36
73
67
DN
FD
NF
6,2
42
31
36
,55
53
92
6,9
47
MA
3,92
14,
664
8,5
85
576
9,16
11
79
,17
846
670
71
630
91,
025
1,0
75
2,1
00
3,9
67
5,3
34
9,3
01
88
51
0,1
86
1,09
21
1,2
78
MI
DN
FD
NF
14
,10
70
14,1
070
15
,48
53
00
00
01
90
19
0D
NF
DN
F1
4,1
07
01
4,1
07
19
01
5,6
75
MN
4,41
3e
6,48
8e
10
,90
1e
1,02
711
,928
e8
10
13
,21
94
1942
14
40
044
02
84
68
4,4
32
6,9
09
11
,34
11
,02
71
2,3
68
83
81
3,6
87
MS
37
430
40
484
488
66
91
,15
719
093
28
363
491
71
,36
72
,28
45
64
12
36
87
71
81
,40
52,
036
3,4
41
MO
2,
677
912
3,5
89
1,22
44,
813
25
25
,06
585
711
56
015
61
,09
91
,25
52
,76
29
83
3,7
45
1,2
24
4,9
69
1,35
16
,32
0
MT
98
929
01
,27
940
55
1,68
40
1,6
84
00
00
07
97
99
89
29
01
,27
94
05
1,6
84
791
,76
3
NE
1,95
6e
488
e2
,44
4e
213
e2,
657
e2
32
2,8
89
e0
66
06
37
53
81
1,9
56
49
42
,45
02
13
2,6
63
60
73
,27
0
NV
1,00
7e
415
e1
,42
2e
01,
422
e1
81
,44
0e
00
00
08
98
91
,00
74
15
1,4
22
01
,42
21
07
1,5
29
NH
1,61
8e
72e
= e
stim
ate
1,6
90
e37
1,72
72
51
,75
20
66
06
06
1,6
18
78
1,6
96
37
1,7
33
251
,75
8N
J3,
617
2,95
66
,57
378
27,
355
71
36
8,0
68
00
00
03
,07
03
,07
03
,61
72
,95
66
,57
37
82
7,3
55
3,78
31
1,1
38
NM
1,52
820
71
,73
513
01,
865
01
,86
555
157
00
700
70
1,5
83
22
21
,80
51
30
1,9
35
01
,93
5N
Y1
3,2
78
7,56
22
0,8
40
13,7
0934
,549
1,1
23
35
,67
222
81
,96
72
,19
55,
330
7,52
52
,22
59
,75
01
3,5
06
9,5
29
23
,03
51
9,0
39
42
,07
43,
348
45
,42
2N
CD
NF
DN
F8
,40
21,
052
e9,
454
e7
60
e1
0,2
14
00
010
101
,70
81
,71
8D
NF
DN
F8
,40
21
,06
2e
9,4
64
2,46
81
1,9
32
ND
1,09
719
21
,28
953
61,
825
54
1,8
79
00
00
01
40
14
01
,09
71
92
1,2
89
53
61
,82
51
94
2,0
19
OH
DN
FD
NF
6,6
78
2,60
99,
287
3,0
86
13
,37
07
00
00
01
,66
61
,66
60
06
,67
82
,60
99
,28
74,
752
15
,03
6O
K2,
863
e80
23
,66
5e
326
3,99
1e
90
64
,89
7e
00
00
03
64
36
42
,86
38
02
3,6
65
32
63
,99
11,
270
5,2
61
OR
DN
FD
NF
4,6
57
399
5,05
61
00
5,1
56
810
51
13
3514
84
31
91
DN
FD
NF
4,7
70
43
45
,20
41
43
5,3
47
PA
3,35
5e
8,06
51
1,4
20
e1,
296
12,7
16e
1,7
73
14
,48
90
00
00
1,4
51
1,4
51
3,3
55
8,0
65
11
,42
01
,29
61
2,7
16
3,22
41
5,9
40
RI
1,07
263
01
,70
213
01,
832
23
1,8
55
7319
52
68
4731
50
31
51
,14
58
25
1,9
70
17
72
,14
723
2,1
70
SC
1,22
71,
436
2,6
63
910
3,57
30
3,5
73
00
00
09
33
93
31
,22
71
,43
62
,66
39
10
3,5
73
93
34
,50
6S
D
1,17
68
304
1,4
80
586
2,06
61
62
,08
20
00
00
16
91
69
1,1
76
30
41
,48
05
86
2,0
66
18
52
,25
1T
N2,
940
400
3,3
40
892
4,23
21
44
4,3
76
00
00
06
62
66
22
,94
04
00
3,3
40
89
24
,23
28
06
5,0
38
TX
9D
NF
DN
F1
3,6
97
689
14,3
861
,57
91
5,9
65
010
10
010
4,9
89
4,9
99
DN
FD
NF
13
,70
76
89
14
,39
66,
568
20
,96
4U
T1,
675
e31
1e
1,9
86
e16
0e
2,14
6e
52
42
,67
0e
00
00
02
30
23
01
,67
53
11
1,9
86
16
02
,14
67
54
2,9
00
VT
1,20
573
1,2
78
01,
278
01
,27
80
00
00
00
1,2
05
73
1,2
78
01
,27
80
1,2
78
VA
D
NF
DN
FD
NF
DN
FD
NF
DN
F5
,92
60
00
00
1,4
95
1,4
95
DN
FD
NF
DN
FD
NF
DN
FD
NF
7,4
21
WA
3,84
81,
733
5,5
81
307
5,88
82
40
6,1
28
2486
11
00
110
96
11
,07
13
,87
21
,81
95
,69
13
07
5,9
98
1,20
17
,19
9W
V1,
200
e17
01
,37
0e
555
1,92
5e
59
1,9
84
00
00
00
01
,20
01
70
1,3
70
55
51
,92
559
1,9
84
WI
7,93
72,
146
e1
0,0
83
e1,
083
11,1
66e
1,1
74
12
,34
0e
00
00
05
81
58
17
,93
72
,14
61
0,0
83
1,0
83
11
,16
61,
755
12
,92
1W
Y3
33
411
74
412
586
92
48
93
00
00
09
69
63
33
41
17
44
12
58
69
12
09
89
Rep
orte
d U
S
To
tal
11
4,0
40
64,2
512
78
,67
744
,900
323,
577
26
,34
43
58
,70
31,
285
4,1
14
5,4
71
6,98
012
,451
40
,06
15
2,5
12
110,
929
67
,14
42
84
,14
85
1,8
80
336,
028
64,9
104
11
,21
5E
stim
ate
d
US
To
tal
182,
722
10
2,9
49
28
5,6
71
46,0
2733
1,69
82
7,0
05
35
8,7
03
1,30
24
,16
95
,47
16,
980
12,4
514
0,0
61
52
,51
218
4,02
410
7,11
82
91
,14
25
3,0
07
344,
149
67,0
664
11
,21
51 I
nclu
des
15 p
eopl
e in
unk
own
sett
ings
4 I
nclu
des
481
peop
le in
unk
now
n se
ttin
gs7
Incl
ud
es
99
7 p
eo
ple
in u
nkn
ow
n s
ett
ing
sD
NF
= d
id n
ot f
urni
she
= e
stim
ate
2 P
erso
ns w
ith I
D/D
D in
mix
ed p
opul
atio
ns5
Inlu
des
7 pe
ople
in a
n un
know
n se
ttin
g8
Incl
ud
es
4 p
eo
ple
in u
nkn
ow
n s
ett
ing
s3
Incl
udes
1,3
78 p
eopl
e in
unk
now
n se
ttin
gs6
Incl
udes
639
peo
ple
in u
nkno
wn
sett
ings
9
Tex
as b
reak
s do
wn
thei
r si
ze a
nd p
opul
atio
n ca
tego
ries
by
"4-8
", "
9-13
" an
d "1
4+"
for
"4-6
", "
7-15
" an
d "1
6+"
resp
ectiv
ely
Res
iden
ts o
f A
ll N
onst
ate
Set
tings
by
Siz
eR
esid
ents
of
All
Set
tings
by
Siz
eR
esid
ents
of
All
Sta
te S
ettin
gs b
y S
ize
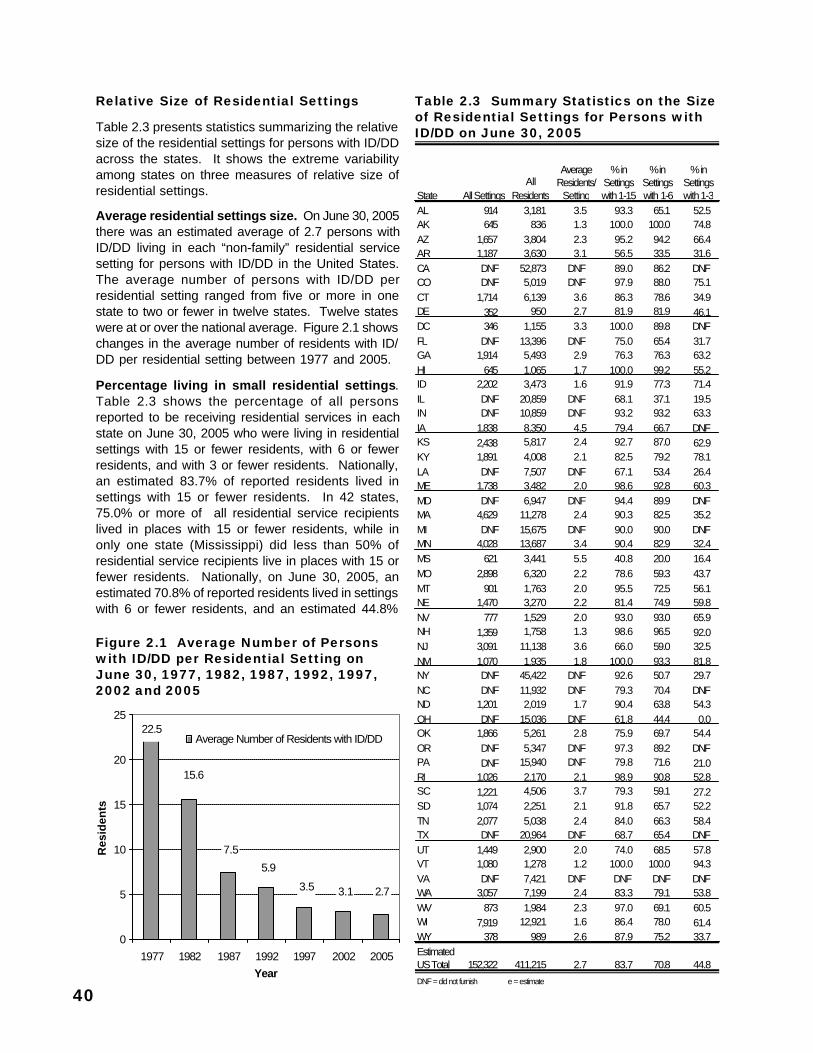
40
Relative Size of Residential Settings
Table 2.3 presents statistics summarizing the relativesize of the residential settings for persons with ID/DDacross the states. It shows the extreme variabilityamong states on three measures of relative size ofresidential settings.
Average residential settings size. On June 30, 2005there was an estimated average of 2.7 persons withID/DD living in each “non-family” residential servicesetting for persons with ID/DD in the United States.The average number of persons with ID/DD perresidential setting ranged from five or more in onestate to two or fewer in twelve states. Twelve stateswere at or over the national average. Figure 2.1 showschanges in the average number of residents with ID/DD per residential setting between 1977 and 2005.
Percentage living in small residential settings.Table 2.3 shows the percentage of all personsreported to be receiving residential services in eachstate on June 30, 2005 who were living in residentialsettings with 15 or fewer residents, with 6 or fewerresidents, and with 3 or fewer residents. Nationally,an estimated 83.7% of reported residents lived insettings with 15 or fewer residents. In 42 states,75.0% or more of all residential service recipientslived in places with 15 or fewer residents, while inonly one state (Mississippi) did less than 50% ofresidential service recipients live in places with 15 orfewer residents. Nationally, on June 30, 2005, anestimated 70.8% of reported residents lived in settingswith 6 or fewer residents, and an estimated 44.8%
Table 2.3 Summary Statistics on the Sizeof Residential Settings for Persons withID/DD on June 30, 2005
Figure 2.1 Average Number of Personswith ID/DD per Residential Setting onJune 30, 1977, 1982, 1987, 1992, 1997,2002 and 2005
2.73.13.5
5.9
7.5
15.6
22.5
0
5
10
15
20
25
1977 1982 1987 1992 1997 2002 2005Year
Res
iden
ts
Average Number of Residents with ID/DD
State All SettingsAll
ResidentsAL 914 3,181 3.5 93.3 65.1 52.5AK 645 836 1.3 100.0 100.0 74.8AZ 1,657 3,804 2.3 95.2 94.2 66.4AR 1,187 3,630 3.1 56.5 33.5 31.6CA DNF 52,873 DNF 89.0 86.2 DNFCO DNF 5,019 DNF 97.9 88.0 75.1CT 1,714 6,139 3.6 86.3 78.6 34.9DE 352 950 2.7 81.9 81.9 46.1DC 346 1,155 3.3 100.0 89.8 DNFFL DNF 13,396 DNF 75.0 65.4 31.7GA 1,914 5,493 2.9 76.3 76.3 63.2HI 645 1,065 1.7 100.0 99.2 55.2ID 2,202 3,473 1.6 91.9 77.3 71.4IL DNF 20,859 DNF 68.1 37.1 19.5IN DNF 10,859 DNF 93.2 93.2 63.3IA 1,838 8,350 4.5 79.4 66.7 DNFKS 2,438 5,817 2.4 92.7 87.0 62.9KY 1,891 4,008 2.1 82.5 79.2 78.1LA DNF 7,507 DNF 67.1 53.4 26.4ME 1,738 3,482 2.0 98.6 92.8 60.3MD DNF 6,947 DNF 94.4 89.9 DNFMA 4,629 11,278 2.4 90.3 82.5 35.2MI DNF 15,675 DNF 90.0 90.0 DNFMN 4,028 13,687 3.4 90.4 82.9 32.4MS 621 3,441 5.5 40.8 20.0 16.4MO 2,898 6,320 2.2 78.6 59.3 43.7MT 901 1,763 2.0 95.5 72.5 56.1NE 1,470 3,270 2.2 81.4 74.9 59.8NV 777 1,529 2.0 93.0 93.0 65.9NH 1,359 1,758 1.3 98.6 96.5 92.0NJ 3,091 11,138 3.6 66.0 59.0 32.5NM 1,070 1,935 1.8 100.0 93.3 81.8NY DNF 45,422 DNF 92.6 50.7 29.7NC DNF 11,932 DNF 79.3 70.4 DNFND 1,201 2,019 1.7 90.4 63.8 54.3OH DNF 15,036 DNF 61.8 44.4 0.0OK 1,866 5,261 2.8 75.9 69.7 54.4OR DNF 5,347 DNF 97.3 89.2 DNFPA DNF 15,940 DNF 79.8 71.6 21.0RI 1,026 2,170 2.1 98.9 90.8 52.8SC 1,221 4,506 3.7 79.3 59.1 27.2SD 1,074 2,251 2.1 91.8 65.7 52.2TN 2,077 5,038 2.4 84.0 66.3 58.4TX DNF 20,964 DNF 68.7 65.4 DNFUT 1,449 2,900 2.0 74.0 68.5 57.8VT 1,080 1,278 1.2 100.0 100.0 94.3VA DNF 7,421 DNF DNF DNF DNFWA 3,057 7,199 2.4 83.3 79.1 53.8WV 873 1,984 2.3 97.0 69.1 60.5WI 7,919 12,921 1.6 86.4 78.0 61.4WY 378 989 2.6 87.9 75.2 33.7Estimated US Total 152,322 411,215 2.7 83.7 70.8 44.8DNF = did not furnish e = estimate
% in Settings with 1-15
% in Settings with 1-6
% in Settings with 1-3
Average Residents/
Setting
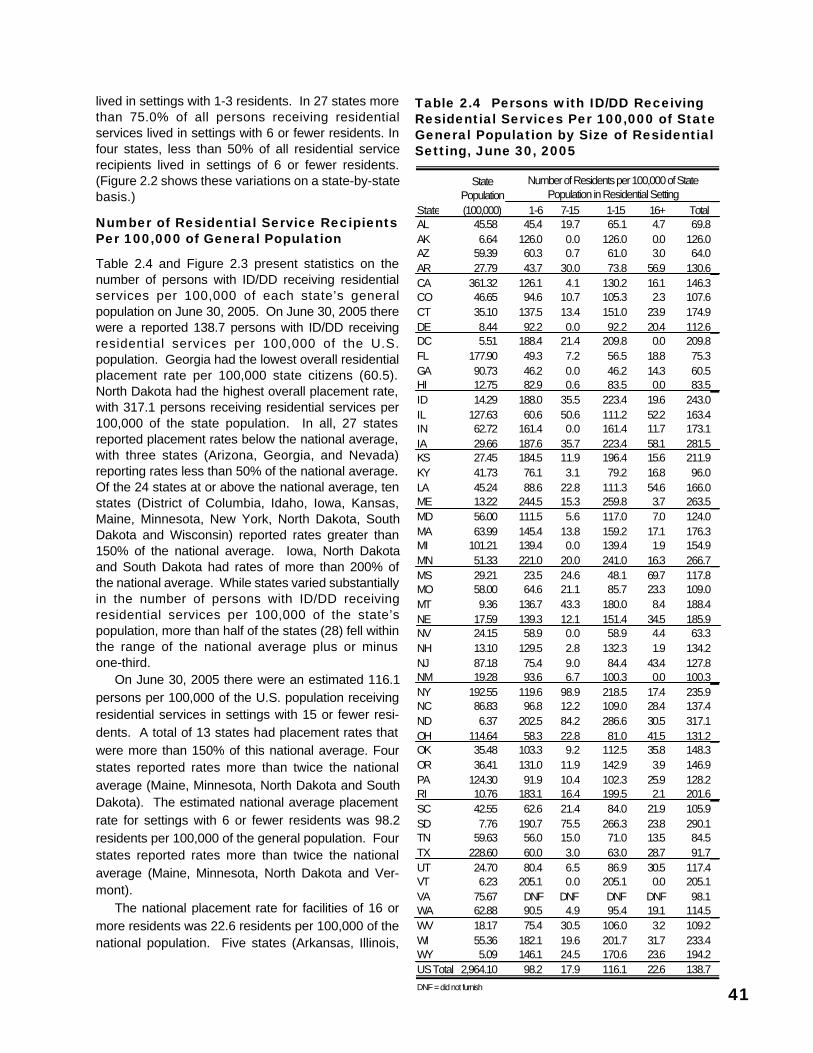
41
lived in settings with 1-3 residents. In 27 states morethan 75.0% of all persons receiving residentialservices lived in settings with 6 or fewer residents. Infour states, less than 50% of all residential servicerecipients lived in settings of 6 or fewer residents.(Figure 2.2 shows these variations on a state-by-statebasis.)
Number of Residential Service RecipientsPer 100,000 of General Population
Table 2.4 and Figure 2.3 present statistics on thenumber of persons with ID/DD receiving residentialservices per 100,000 of each state’s generalpopulation on June 30, 2005. On June 30, 2005 therewere a reported 138.7 persons with ID/DD receivingresidential services per 100,000 of the U.S.population. Georgia had the lowest overall residentialplacement rate per 100,000 state citizens (60.5).North Dakota had the highest overall placement rate,with 317.1 persons receiving residential services per100,000 of the state population. In all, 27 statesreported placement rates below the national average,with three states (Arizona, Georgia, and Nevada)reporting rates less than 50% of the national average.Of the 24 states at or above the national average, tenstates (District of Columbia, Idaho, Iowa, Kansas,Maine, Minnesota, New York, North Dakota, SouthDakota and Wisconsin) reported rates greater than150% of the national average. Iowa, North Dakotaand South Dakota had rates of more than 200% ofthe national average. While states varied substantiallyin the number of persons with ID/DD receivingresidential services per 100,000 of the state’spopulation, more than half of the states (28) fell withinthe range of the national average plus or minusone-third.
On June 30, 2005 there were an estimated 116.1persons per 100,000 of the U.S. population receivingresidential services in settings with 15 or fewer resi-dents. A total of 13 states had placement rates thatwere more than 150% of this national average. Fourstates reported rates more than twice the nationalaverage (Maine, Minnesota, North Dakota and SouthDakota). The estimated national average placementrate for settings with 6 or fewer residents was 98.2residents per 100,000 of the general population. Fourstates reported rates more than twice the nationalaverage (Maine, Minnesota, North Dakota and Ver-mont).
The national placement rate for facilities of 16 ormore residents was 22.6 residents per 100,000 of thenational population. Five states (Arkansas, Illinois,
Table 2.4 Persons with ID/DD ReceivingResidential Services Per 100,000 of StateGeneral Population by Size of ResidentialSetting, June 30, 2005
Number of Residents per 100,000 of State Population in Residential Setting
1-6 7-15 1-15 16+ TotalAL 45.58 45.4 19.7 65.1 4.7 69.8AK 6.64 126.0 0.0 126.0 0.0 126.0AZ 59.39 60.3 0.7 61.0 3.0 64.0AR 27.79 43.7 30.0 73.8 56.9 130.6CA 361.32 126.1 4.1 130.2 16.1 146.3CO 46.65 94.6 10.7 105.3 2.3 107.6CT 35.10 137.5 13.4 151.0 23.9 174.9DE 8.44 92.2 0.0 92.2 20.4 112.6DC 5.51 188.4 21.4 209.8 0.0 209.8FL 177.90 49.3 7.2 56.5 18.8 75.3GA 90.73 46.2 0.0 46.2 14.3 60.5HI 12.75 82.9 0.6 83.5 0.0 83.5ID 14.29 188.0 35.5 223.4 19.6 243.0IL 127.63 60.6 50.6 111.2 52.2 163.4IN 62.72 161.4 0.0 161.4 11.7 173.1IA 29.66 187.6 35.7 223.4 58.1 281.5KS 27.45 184.5 11.9 196.4 15.6 211.9KY 41.73 76.1 3.1 79.2 16.8 96.0LA 45.24 88.6 22.8 111.3 54.6 166.0ME 13.22 244.5 15.3 259.8 3.7 263.5MD 56.00 111.5 5.6 117.0 7.0 124.0MA 63.99 145.4 13.8 159.2 17.1 176.3MI 101.21 139.4 0.0 139.4 1.9 154.9MN 51.33 221.0 20.0 241.0 16.3 266.7MS 29.21 23.5 24.6 48.1 69.7 117.8MO 58.00 64.6 21.1 85.7 23.3 109.0MT 9.36 136.7 43.3 180.0 8.4 188.4NE 17.59 139.3 12.1 151.4 34.5 185.9NV 24.15 58.9 0.0 58.9 4.4 63.3NH 13.10 129.5 2.8 132.3 1.9 134.2NJ 87.18 75.4 9.0 84.4 43.4 127.8NM 19.28 93.6 6.7 100.3 0.0 100.3NY 192.55 119.6 98.9 218.5 17.4 235.9NC 86.83 96.8 12.2 109.0 28.4 137.4ND 6.37 202.5 84.2 286.6 30.5 317.1OH 114.64 58.3 22.8 81.0 41.5 131.2OK 35.48 103.3 9.2 112.5 35.8 148.3OR 36.41 131.0 11.9 142.9 3.9 146.9PA 124.30 91.9 10.4 102.3 25.9 128.2RI 10.76 183.1 16.4 199.5 2.1 201.6SC 42.55 62.6 21.4 84.0 21.9 105.9SD 7.76 190.7 75.5 266.3 23.8 290.1TN 59.63 56.0 15.0 71.0 13.5 84.5TX 228.60 60.0 3.0 63.0 28.7 91.7UT 24.70 80.4 6.5 86.9 30.5 117.4VT 6.23 205.1 0.0 205.1 0.0 205.1VA 75.67 DNF DNF DNF DNF 98.1WA 62.88 90.5 4.9 95.4 19.1 114.5WV 18.17 75.4 30.5 106.0 3.2 109.2WI 55.36 182.1 19.6 201.7 31.7 233.4WY 5.09 146.1 24.5 170.6 23.6 194.2US Total 2,964.10 98.2 17.9 116.1 22.6 138.7DNF = did not furnish
State
State Population (100,000)
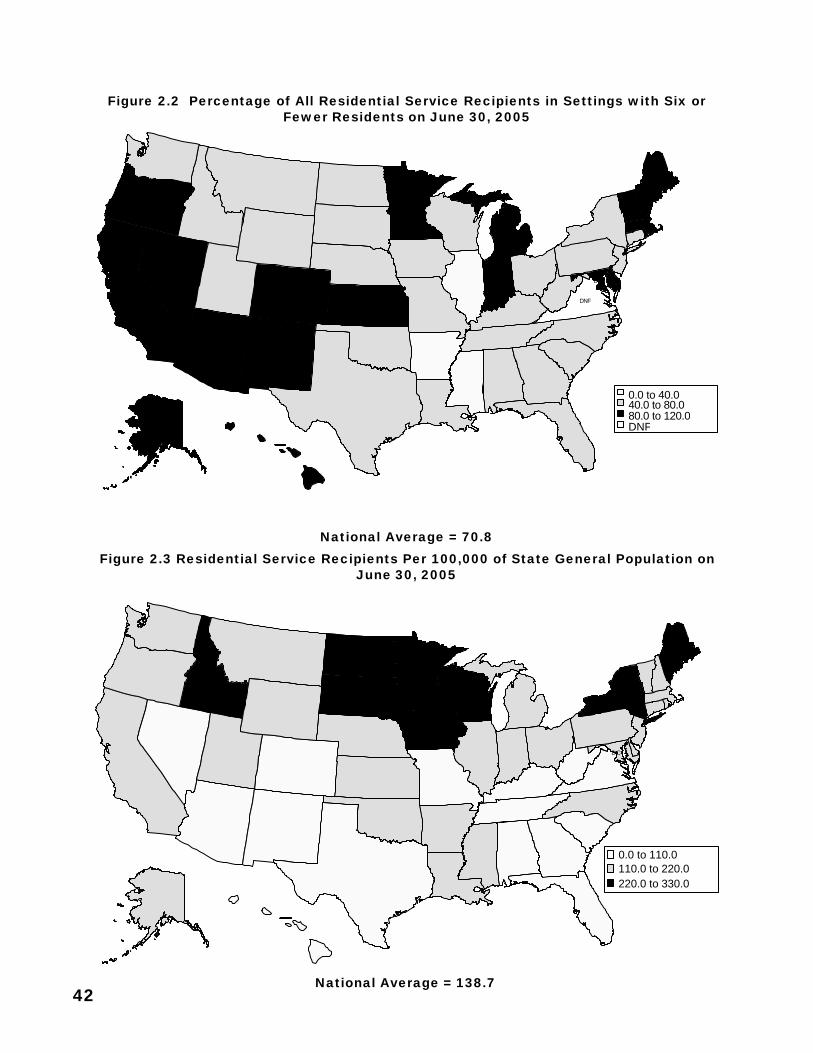
42
Figure 2.2 Percentage of All Residential Service Recipients in Settings with Six orFewer Residents on June 30, 2005
Figure 2.3 Residential Service Recipients Per 100,000 of State General Population onJune 30, 2005
National Average = 70.8
National Average = 138.7
DNF
MN
CA
KS
CO
OR
DC
MI
ME
NV IN
NMAZ
AK
0.0 to 40.040.0 to 80.080.0 to 120.0DNF
DC
WI NYID
M EMN
IA
SD
ND
0.0 to 110.0110.0 to 220.0220.0 to 330.0
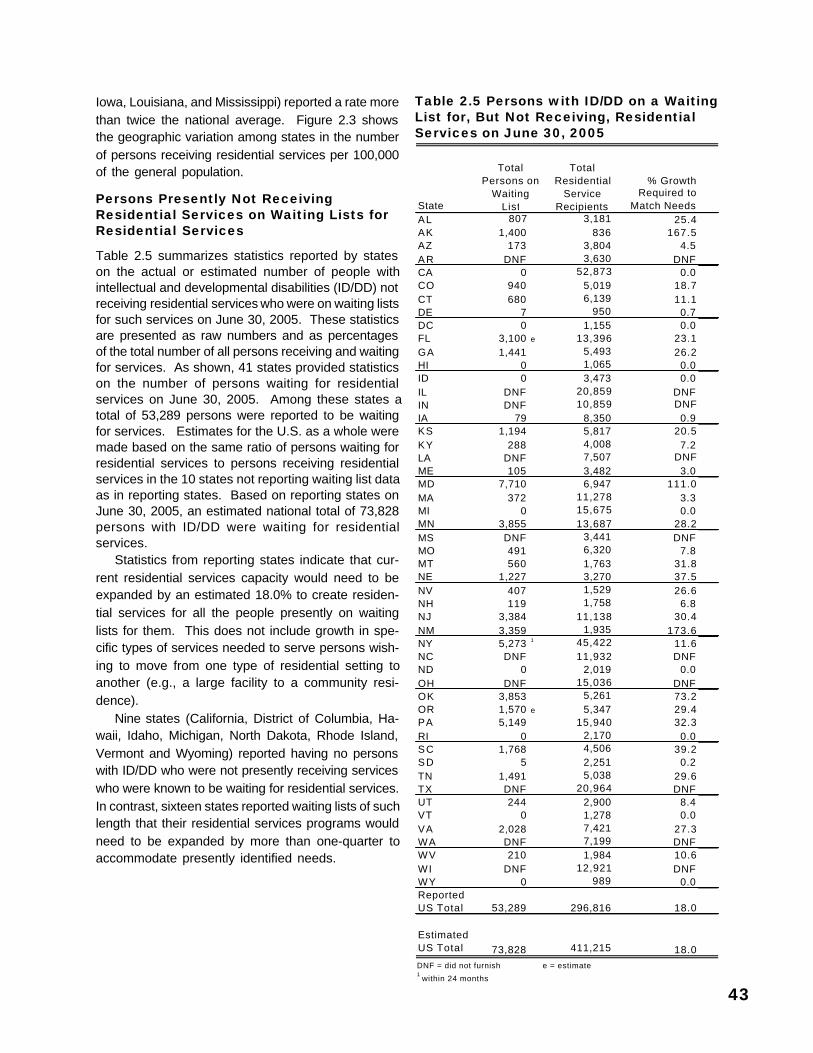
43
Iowa, Louisiana, and Mississippi) reported a rate morethan twice the national average. Figure 2.3 showsthe geographic variation among states in the numberof persons receiving residential services per 100,000of the general population.
Persons Presently Not ReceivingResidential Services on Waiting Lists forResidential Services
Table 2.5 summarizes statistics reported by stateson the actual or estimated number of people withintellectual and developmental disabilities (ID/DD) notreceiving residential services who were on waiting listsfor such services on June 30, 2005. These statisticsare presented as raw numbers and as percentagesof the total number of all persons receiving and waitingfor services. As shown, 41 states provided statisticson the number of persons waiting for residentialservices on June 30, 2005. Among these states atotal of 53,289 persons were reported to be waitingfor services. Estimates for the U.S. as a whole weremade based on the same ratio of persons waiting forresidential services to persons receiving residentialservices in the 10 states not reporting waiting list dataas in reporting states. Based on reporting states onJune 30, 2005, an estimated national total of 73,828persons with ID/DD were waiting for residentialservices.
Statistics from reporting states indicate that cur-rent residential services capacity would need to beexpanded by an estimated 18.0% to create residen-tial services for all the people presently on waitinglists for them. This does not include growth in spe-cific types of services needed to serve persons wish-ing to move from one type of residential setting toanother (e.g., a large facility to a community resi-dence).
Nine states (California, District of Columbia, Ha-waii, Idaho, Michigan, North Dakota, Rhode Island,Vermont and Wyoming) reported having no personswith ID/DD who were not presently receiving serviceswho were known to be waiting for residential services.In contrast, sixteen states reported waiting lists of suchlength that their residential services programs wouldneed to be expanded by more than one-quarter toaccommodate presently identified needs.
Table 2.5 Persons with ID/DD on a WaitingList for, But Not Receiving, ResidentialServices on June 30, 2005
State
% Growth Required to
Match NeedsAL 807 3,181 25.4AK 1,400 836 167.5AZ 173 3,804 4.5AR DNF 3,630 DNFCA 0 52,873 0.0CO 940 5,019 18.7CT 680 6,139 11.1DE 7 950 0.7DC 0 1,155 0.0FL 3,100 e 13,396 23.1GA 1,441 5,493 26.2HI 0 1,065 0.0ID 0 3,473 0.0IL DNF 20,859 DNFIN DNF 10,859 DNFIA 79 8,350 0.9KS 1,194 5,817 20.5KY 288 4,008 7.2LA DNF 7,507 DNFME 105 3,482 3.0MD 7,710 6,947 111.0MA 372 11,278 3.3MI 0 15,675 0.0MN 3,855 13,687 28.2MS DNF 3,441 DNFMO 491 6,320 7.8MT 560 1,763 31.8NE 1,227 3,270 37.5NV 407 1,529 26.6NH 119 1,758 6.8NJ 3,384 11,138 30.4NM 3,359 1,935 173.6NY 5,273 1 45,422 11.6NC DNF 11,932 DNFND 0 2,019 0.0OH DNF 15,036 DNFOK 3,853 5,261 73.2OR 1,570 e 5,347 29.4PA 5,149 15,940 32.3RI 0 2,170 0.0SC 1,768 4,506 39.2SD 5 2,251 0.2TN 1,491 5,038 29.6TX DNF 20,964 DNFUT 244 2,900 8.4VT 0 1,278 0.0VA 2,028 7,421 27.3WA DNF 7,199 DNFWV 210 1,984 10.6WI DNF 12,921 DNFWY 0 989 0.0Reported US Total 53,289 296,816 18.0
Estimated US Total 73,828 411,215 18.0DNF = did not furnish e = estimate1
within 24 months
Total Persons on
Waiting List
Total Residential
Service Recipients

44
45
Chapter 4Number of Residential Settings and Residents by Type ofLiving Arrangement on June 30, 2005
Kathryn Coucouvanis, Robert W. Prouty, and K. Charlie Lakin
This chapter describes residential settings for personswith intellectual diasbilities and related developmentaldisabilities (ID/DD) by setting type. Four separatetypes of residential settings have been developed toconform to state ID/DD reporting systems. Theseinclude:
Congregate Care: A residence owned, rented,or managed by the residential services provider, orthe provider’s agent, to provide housing for personswith ID/DD in which staff provide care, instruction, su-pervision, and other support for residents with ID/DD(includes ICF-MR certified facilities).
Host Family/Foster Care: A home owned orrented by an individual or family in which they liveand in which they provide care and support for one ormore unrelated persons with ID/DD.
Own Home: A home owned or rented by one ormore persons with ID/DD as their personal home inwhich personal assistance, instruction, supervision,and other support is provided to them as needed.
Family Home: A home owned or rented by a fam-ily member of a person with ID/DD in which the indi-vidual with ID/DD resides and in which the individualreceives care, instruction, supervision and other sup-port from persons other than family members and/orfrom family members who are paid.
Congregate Care Settings and Residents
Table 2.6 presents statistics on congregate careresidential settings and persons with ID/DD living inthese settings on June 30, 2005, by size and state,for all 50 states and the District of Columbia. Of theestimated total 55,942 congregate care residentialsettings, 54,976 (98.3%) had 15 or fewer residentsand 48,483 (86.6%) had six or fewer residents.California (5,657), New York (5,490), andPennsylvania (3,405) accounted for more than one-fourth (28.5%) of the estimated total congregate careresidences, while three states reported fewer than 100such settings each.
Of the estimated 275,073 residents of congregatecare settings an estimated 209,498 (76.2%) lived insettings with 15 or fewer residents and an estimated156,610 (56.9%) lived in settings with six or fewerresidents. Seven of the reporting states, California(31,301), Illinois (16,839), Michigan (10,919) New York(34,410), Ohio (10,021), Pennsylvania (12,821), andTexas (15,410) accounted for 131,721 (49.1%) of thereported total congregate care residents.
Host Family/Foster Care Settings andResidents
Table 2.7 presents statistics on host family/foster care(“host family”) settings and persons with ID/DD livingin such settings on June 30, 2005, by size and state.Three states reported no persons with ID/DD in hostfamily settings. Forty states reported the number ofhost family settings by each size and forty-tworeported the resident populations of each size. Therewere a reported U.S. total 15,993 host family settingsand 35,386 residents. Based on the reporting states,it was estimated that there were a total of 21,317 hostfamily settings in the United States.
Of the states reporting host family settings, onlyNew Hampshire and New York reported settings ofmore than 6 individuals (a total of 3 settings com-bined). Of the 35,386 persons with ID/DD reportedin host family settings, all but 22 lived in settings withsix or fewer residents. Idaho (1008), Massachusetts(702), New Hampshire (834), New Jersey (732), NewYork (1,760), Pennsylvania (904), Vermont (864) andWisconsin (1,810) accounted for two-fifths (40.4%)of the estimated total host family settings. Nine stateswith host family settings reported 100 or fewer hostfamily settings.
Ten states (California, Idaho, Minnesota, NewHampshire, New Jersey, New York, Oregon, Penn-sylvania, Texas and Wisconsin) accounted for morethan three-fifths (63.6%) of the estimated national to-
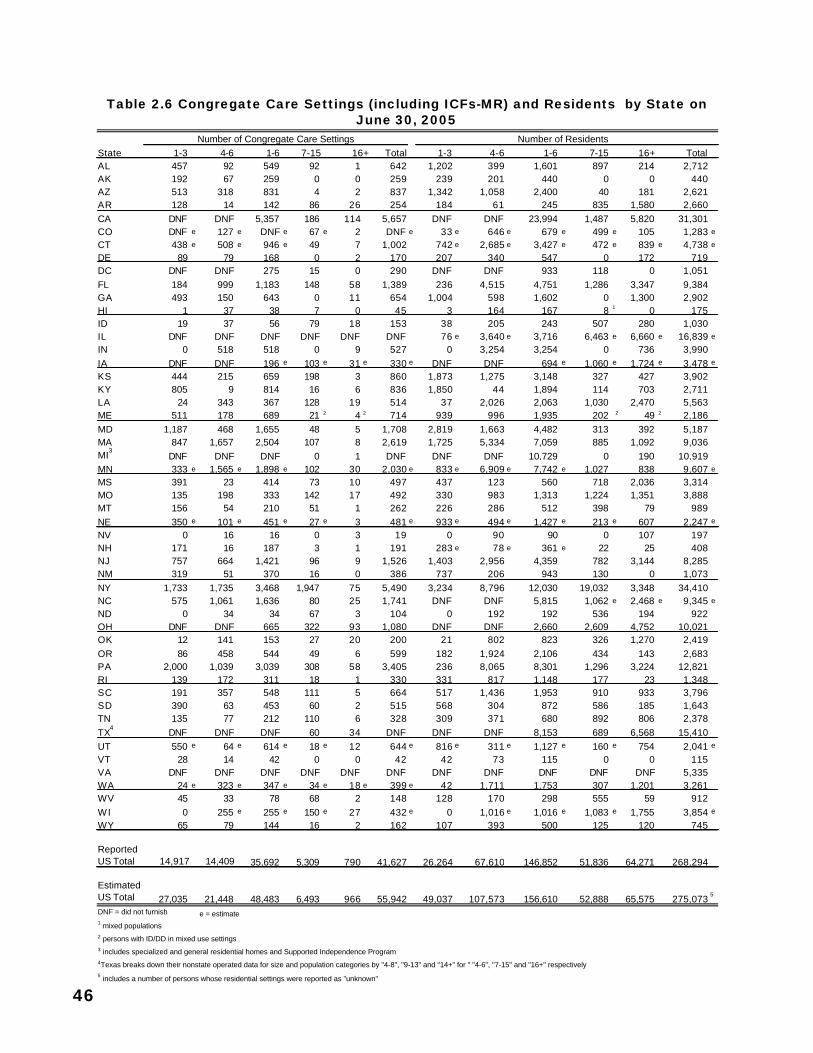
46
Table 2.6 Congregate Care Settings (including ICFs-MR) and Residents by State onJune 30, 2005
Number of ResidentsState 1-3 4-6 1-6 Total 1-3 4-6 1-6 7-15 16+ TotalAL 457 92 549 92 1 642 1,202 399 1,601 897 214 2,712AK 192 67 259 0 0 259 239 201 440 0 0 440AZ 513 318 831 4 2 837 1,342 1,058 2,400 40 181 2,621AR 128 14 142 86 26 254 184 61 245 835 1,580 2,660CA DNF DNF 5,357 186 114 5,657 DNF DNF 23,994 1,487 5,820 31,301CO DNF e 127 e DNF e 67 e 2 DNF e 33 e 646 e 679 e 499 e 105 1,283 e
CT 438 e 508 e 946 e 49 7 1,002 742 e 2,685 e 3,427 e 472 e 839 e 4,738 e
DE 89 79 168 0 2 170 207 340 547 0 172 719DC DNF DNF 275 15 0 290 DNF DNF 933 118 0 1,051FL 184 999 1,183 148 58 1,389 236 4,515 4,751 1,286 3,347 9,384GA 493 150 643 0 11 654 1,004 598 1,602 0 1,300 2,902HI 1 37 38 7 0 45 3 164 167 8 1 0 175ID 19 37 56 79 18 153 38 205 243 507 280 1,030IL DNF DNF DNF DNF DNF DNF 76 e 3,640 e 3,716 6,463 e 6,660 e 16,839 e
IN 0 518 518 0 9 527 0 3,254 3,254 0 736 3,990IA DNF DNF 196 e 103 e 31 e 330 e DNF DNF 694 e 1,060 e 1,724 e 3,478 e
KS 444 215 659 198 3 860 1,873 1,275 3,148 327 427 3,902KY 805 9 814 16 6 836 1,850 44 1,894 114 703 2,711LA 24 343 367 128 19 514 37 2,026 2,063 1,030 2,470 5,563ME 511 178 689 21 2 4 2 714 939 996 1,935 202 2 49 2 2,186MD 1,187 468 1,655 48 5 1,708 2,819 1,663 4,482 313 392 5,187MA 847 1,657 2,504 107 8 2,619 1,725 5,334 7,059 885 1,092 9,036MI
3DNF DNF DNF 0 1 DNF DNF DNF 10,729 0 190 10,919
MN 333 e 1,565 e 1,898 e 102 30 2,030 e 833 e 6,909 e 7,742 e 1,027 838 9,607 e
MS 391 23 414 73 10 497 437 123 560 718 2,036 3,314MO 135 198 333 142 17 492 330 983 1,313 1,224 1,351 3,888MT 156 54 210 51 1 262 226 286 512 398 79 989NE 350 e 101 e 451 e 27 e 3 481 e 933 e 494 e 1,427 e 213 e 607 2,247 e
NV 0 16 16 0 3 19 0 90 90 0 107 197NH 171 16 187 3 1 191 283 e 78 e 361 e 22 25 408NJ 757 664 1,421 96 9 1,526 1,403 2,956 4,359 782 3,144 8,285NM 319 51 370 16 0 386 737 206 943 130 0 1,073NY 1,733 1,735 3,468 1,947 75 5,490 3,234 8,796 12,030 19,032 3,348 34,410NC 575 1,061 1,636 80 25 1,741 DNF DNF 5,815 1,062 e 2,468 e 9,345 e
ND 0 34 34 67 3 104 0 192 192 536 194 922OH DNF DNF 665 322 93 1,080 DNF DNF 2,660 2,609 4,752 10,021OK 12 141 153 27 20 200 21 802 823 326 1,270 2,419OR 86 458 544 49 6 599 182 1,924 2,106 434 143 2,683PA 2,000 1,039 3,039 308 58 3,405 236 8,065 8,301 1,296 3,224 12,821RI 139 172 311 18 1 330 331 817 1,148 177 23 1,348SC 191 357 548 111 5 664 517 1,436 1,953 910 933 3,796SD 390 63 453 60 2 515 568 304 872 586 185 1,643TN 135 77 212 110 6 328 309 371 680 892 806 2,378TX
4DNF DNF DNF 60 34 DNF DNF DNF 8,153 689 6,568 15,410
UT 550 e 64 e 614 e 18 e 12 644 e 816 e 311 e 1,127 e 160 e 754 2,041 e
VT 28 14 42 0 0 42 42 73 115 0 0 115VA DNF DNF DNF DNF DNF DNF DNF DNF DNF DNF DNF 5,335WA 24 e 323 e 347 e 34 e 18 e 399 e 42 1,711 1,753 307 1,201 3,261WV 45 33 78 68 2 148 128 170 298 555 59 912WI 0 255 e 255 e 150 e 27 432 e 0 1,016 e 1,016 e 1,083 e 1,755 3,854 e
WY 65 79 144 16 2 162 107 393 500 125 120 745
Reported US Total 14,917 14,409 35,692 5,309 790 41,627 26,264 67,610 146,852 51,836 64,271 268,294
Estimated US Total 27,035 21,448 48,483 6,493 966 55,942 49,037 107,573 156,610 52,888 65,575 275,073
5
DNF = did not furnish e = estimate1 mixed populations2 persons with ID/DD in mixed use settings3 includes specialized and general residential homes and Supported Independence Program4Texas breaks down their nonstate operated data for size and population categories by "4-8", "9-13" and "14+" for " "4-6", "7-15" and "16+" respectively5 includes a number of persons whose residential settings were reported as "unknown"
Number of Congregate Care Settings16+7-15

47
Table 2.7 Host Family/Foster Care Settings and Residents by State on June 30, 2005Number of Residents
State 1-3 4-6 1-6 7-15 Total 1-3 4-6 1-6 7-15 TotalAL 80 0 80 0 80 247 0 247 0 247AK 162 0 162 0 162 162 10 172 0 172AZ 500 e 0 500 e 0 500 e 749 0 749 0 749AR 432 0 432 0 432 436 0 436 0 436CA DNF DNF DNF 0 DNF DNF DNF 3,901 0 3,901CO 0 0 0 0 0 0 0 0 0 0CT 282 0 282 0 282 542 0 542 0 542DE 168 0 168 0 168 206 0 206 0 206DC 42 0 42 0 42 82 0 82 0 82FL 0 0 0 0 0 0 0 0 0 0GA 174 4 178 0 178 348 15 363 0 363HI 275 184 459 0 459 435 305 740 0 740ID 1,008 0 1,008 0 1,008 1,215 0 1,215 0 1,215IL DNF DNF DNF 0 DNF 230 15 245 0 245IN DNF 0 DNF 0 DNF 316 0 316 0 316IA 6 0 6 0 6 6 0 6 0 6KS 140 0 140 0 140 141 0 141 0 141KY 312 0 312 0 312 512 0 512 0 512LA 41 0 41 0 41 53 0 53 0 53ME 444 38 482 0 482 593 135 728 0 728MD 164 6 170 0 170 DNF DNF 251 0 251MA 702 0 702 0 702 934 0 934 0 934MI DNF DNF DNF 0 DNF DNF DNF 766 0 766MN 603 e 0 603 e 0 603 1,507 e 0 1,507 e 0 1,507 e
MS 0 0 0 0 0 0 0 0 0 0MO 27 0 27 0 27 41 0 41 0 41MT 166 1 167 0 167 177 4 181 0 181NE 210 e 0 210 e 0 210 e 244 0 e 244 e 0 e 244 e
NV 14 6 20 0 20 23 16 39 0 39NH 832 0 832 2 834 1,001 e 0 1,001 e 15 1,016NJ 732 0 732 0 732 1,432 0 1,432 0 1,432NM 349 2 351 0 351 383 8 391 0 391NY 1,580 179 1,759 1 1,760 2,582 733 3,315 7 3,322NC 179 89 268 0 268 DNF DNF 295 0 295 1
ND 27 0 27 0 27 27 0 27 0 27OH DNF DNF DNF 0 DNF DNF DNF 908 0 908OK 536 0 536 0 536 542 0 542 0 542OR DNF DNF 492 0 492 DNF DNF 1,967 0 1,967PA 904 0 904 0 904 1,600 0 1,600 0 1,600RI 48 1 49 0 49 61 4 65 0 65SC 102 0 102 0 102 141 0 141 0 141SD 4 0 4 0 4 7 0 7 0 7TN 169 1 170 0 170 236 4 240 0 240TX
2DNF 0 DNF 0 DNF 3,158 0 3,158 0 3,158
UT 247 0 247 0 247 247 0 247 0 247VT 864 0 864 0 864 979 0 979 0 979VA DNF 0 DNF 0 DNF 351 0 351 0 351WA 214 e 0 214 e 0 214 214 0 214 0 214WV 310 0 310 0 310 335 0 335 0 335WI 1,528 e 282 e 1,810 e 0 e 1,810 e 2,260 e 1,130 3,390 e 0 3,390WY 130 1 131 0 131 138 4 142 0 142Reported US Total 14,707 794 15,993 3 15,996 24,893 2,383 35,364 22 35,386Estimated US Total 20,222 1,092 21,314 3 21,317 32,274 3,090 35,364 22 35,386
1 reduction from FY04 reflects refined data reporting2
Texas breaks down their nonstate operated data for size and population categories by "4-8", "9-13" and "14+" for " "4-6", "7-15" and "16+" respectively
Number of Family Foster Care Settings
e = estimateDNF = did not furnish
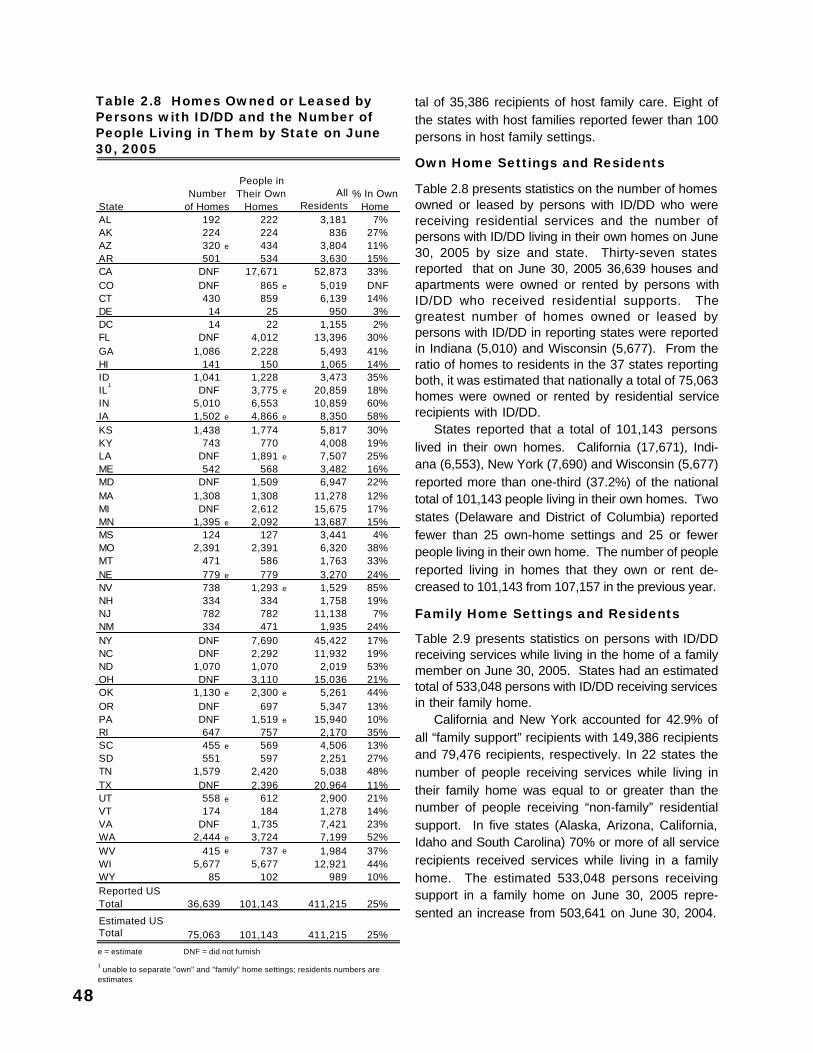
48
tal of 35,386 recipients of host family care. Eight ofthe states with host families reported fewer than 100persons in host family settings.
Own Home Settings and Residents
Table 2.8 presents statistics on the number of homesowned or leased by persons with ID/DD who werereceiving residential services and the number ofpersons with ID/DD living in their own homes on June30, 2005 by size and state. Thirty-seven statesreported that on June 30, 2005 36,639 houses andapartments were owned or rented by persons withID/DD who received residential supports. Thegreatest number of homes owned or leased bypersons with ID/DD in reporting states were reportedin Indiana (5,010) and Wisconsin (5,677). From theratio of homes to residents in the 37 states reportingboth, it was estimated that nationally a total of 75,063homes were owned or rented by residential servicerecipients with ID/DD.
States reported that a total of 101,143 personslived in their own homes. California (17,671), Indi-ana (6,553), New York (7,690) and Wisconsin (5,677)reported more than one-third (37.2%) of the nationaltotal of 101,143 people living in their own homes. Twostates (Delaware and District of Columbia) reportedfewer than 25 own-home settings and 25 or fewerpeople living in their own home. The number of peoplereported living in homes that they own or rent de-creased to 101,143 from 107,157 in the previous year.
Family Home Settings and Residents
Table 2.9 presents statistics on persons with ID/DDreceiving services while living in the home of a familymember on June 30, 2005. States had an estimatedtotal of 533,048 persons with ID/DD receiving servicesin their family home.
California and New York accounted for 42.9% ofall “family support” recipients with 149,386 recipientsand 79,476 recipients, respectively. In 22 states thenumber of people receiving services while living intheir family home was equal to or greater than thenumber of people receiving “non-family” residentialsupport. In five states (Alaska, Arizona, California,Idaho and South Carolina) 70% or more of all servicerecipients received services while living in a familyhome. The estimated 533,048 persons receivingsupport in a family home on June 30, 2005 repre-sented an increase from 503,641 on June 30, 2004.
Table 2.8 Homes Owned or Leased byPersons with ID/DD and the Number ofPeople Living in Them by State on June30, 2005
StateAll
Residents AL 192 222 3,181 7%AK 224 224 836 27%AZ 320 e 434 3,804 11%AR 501 534 3,630 15%CA DNF 17,671 52,873 33%CO DNF 865 e 5,019 DNFCT 430 859 6,139 14%DE 14 25 950 3%DC 14 22 1,155 2%FL DNF 4,012 13,396 30%GA 1,086 2,228 5,493 41%HI 141 150 1,065 14%ID 1,041 1,228 3,473 35%IL
1DNF 3,775 e 20,859 18%
IN 5,010 6,553 10,859 60%IA 1,502 e 4,866 e 8,350 58%KS 1,438 1,774 5,817 30%KY 743 770 4,008 19%LA DNF 1,891 e 7,507 25%ME 542 568 3,482 16%MD DNF 1,509 6,947 22%MA 1,308 1,308 11,278 12%MI DNF 2,612 15,675 17%MN 1,395 e 2,092 13,687 15%MS 124 127 3,441 4%MO 2,391 2,391 6,320 38%MT 471 586 1,763 33%NE 779 e 779 3,270 24%NV 738 1,293 e 1,529 85%NH 334 334 1,758 19%NJ 782 782 11,138 7%NM 334 471 1,935 24%NY DNF 7,690 45,422 17%NC DNF 2,292 11,932 19%ND 1,070 1,070 2,019 53%OH DNF 3,110 15,036 21%OK 1,130 e 2,300 e 5,261 44%OR DNF 697 5,347 13%PA DNF 1,519 e 15,940 10%RI 647 757 2,170 35%SC 455 e 569 4,506 13%SD 551 597 2,251 27%TN 1,579 2,420 5,038 48%TX DNF 2,396 20,964 11%UT 558 e 612 2,900 21%VT 174 184 1,278 14%VA DNF 1,735 7,421 23%WA 2,444 e 3,724 7,199 52%WV 415 e 737 e 1,984 37%WI 5,677 5,677 12,921 44%WY 85 102 989 10%Reported US Total 36,639 101,143 411,215 25%
Estimated US Total 75,063 101,143 411,215 25%
e = estimate DNF = did not furnish
Number of Homes
People in Their Own
Homes % In Own
Home
1 unable to separate "own" and "family" home settings; residents numbers are
estimates
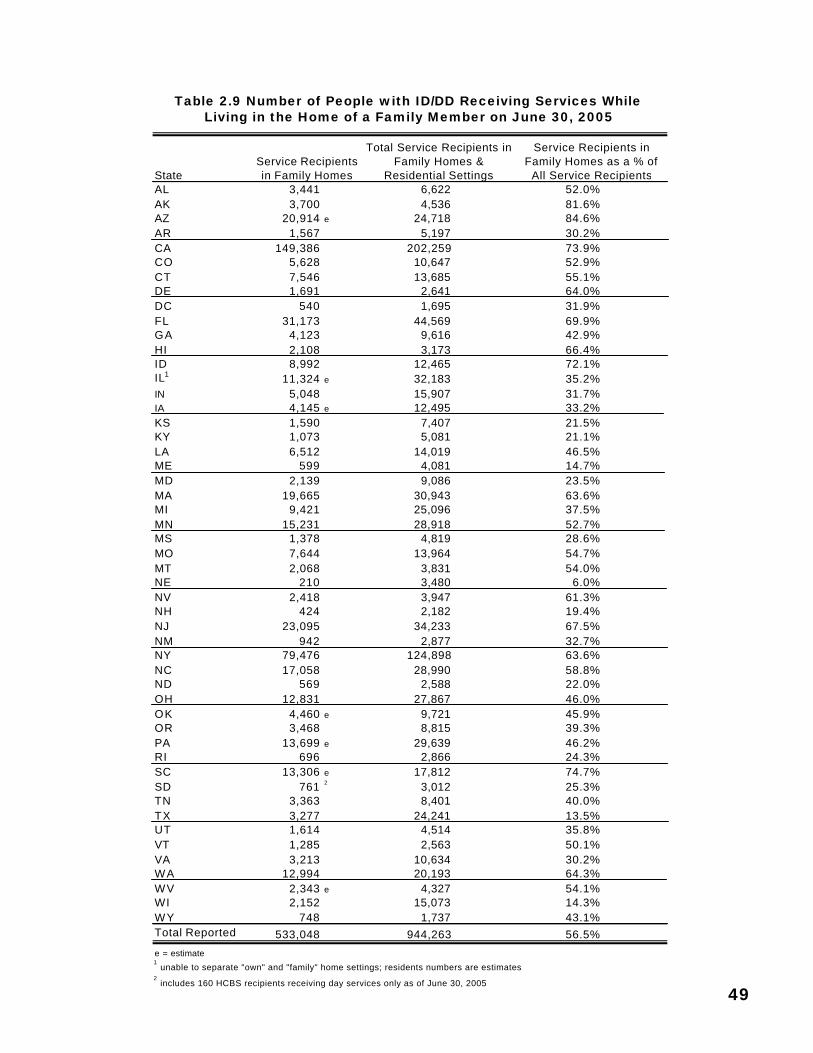
49
Table 2.9 Number of People with ID/DD Receiving Services WhileLiving in the Home of a Family Member on June 30, 2005
StateAL 3,441 6,622 52.0%AK 3,700 4,536 81.6%AZ 20,914 e 24,718 84.6%AR 1,567 5,197 30.2%CA 149,386 202,259 73.9%CO 5,628 10,647 52.9%CT 7,546 13,685 55.1%DE 1,691 2,641 64.0%DC 540 1,695 31.9%FL 31,173 44,569 69.9%GA 4,123 9,616 42.9%HI 2,108 3,173 66.4%ID 8,992 12,465 72.1%IL1 11,324 e 32,183 35.2%IN 5,048 15,907 31.7%IA 4,145 e 12,495 33.2%KS 1,590 7,407 21.5%KY 1,073 5,081 21.1%LA 6,512 14,019 46.5%ME 599 4,081 14.7%MD 2,139 9,086 23.5%MA 19,665 30,943 63.6%MI 9,421 25,096 37.5%MN 15,231 28,918 52.7%MS 1,378 4,819 28.6%MO 7,644 13,964 54.7%MT 2,068 3,831 54.0%NE 210 3,480 6.0%NV 2,418 3,947 61.3%NH 424 2,182 19.4%NJ 23,095 34,233 67.5%NM 942 2,877 32.7%NY 79,476 124,898 63.6%NC 17,058 28,990 58.8%ND 569 2,588 22.0%OH 12,831 27,867 46.0%OK 4,460 e 9,721 45.9%OR 3,468 8,815 39.3%PA 13,699 e 29,639 46.2%RI 696 2,866 24.3%SC 13,306 e 17,812 74.7%SD 761 2 3,012 25.3%TN 3,363 8,401 40.0%TX 3,277 24,241 13.5%UT 1,614 4,514 35.8%VT 1,285 2,563 50.1%VA 3,213 10,634 30.2%WA 12,994 20,193 64.3%WV 2,343 e 4,327 54.1%WI 2,152 15,073 14.3%WY 748 1,737 43.1%Total Reported 533,048 944,263 56.5%
e = estimate1 unable to separate "own" and "family" home settings; residents numbers are estimates
2 includes 160 HCBS recipients receiving day services only as of June 30, 2005
Service Recipients in Family Homes
Total Service Recipients in Family Homes &
Residential Settings
Service Recipients in Family Homes as a % of
All Service Recipients

5050
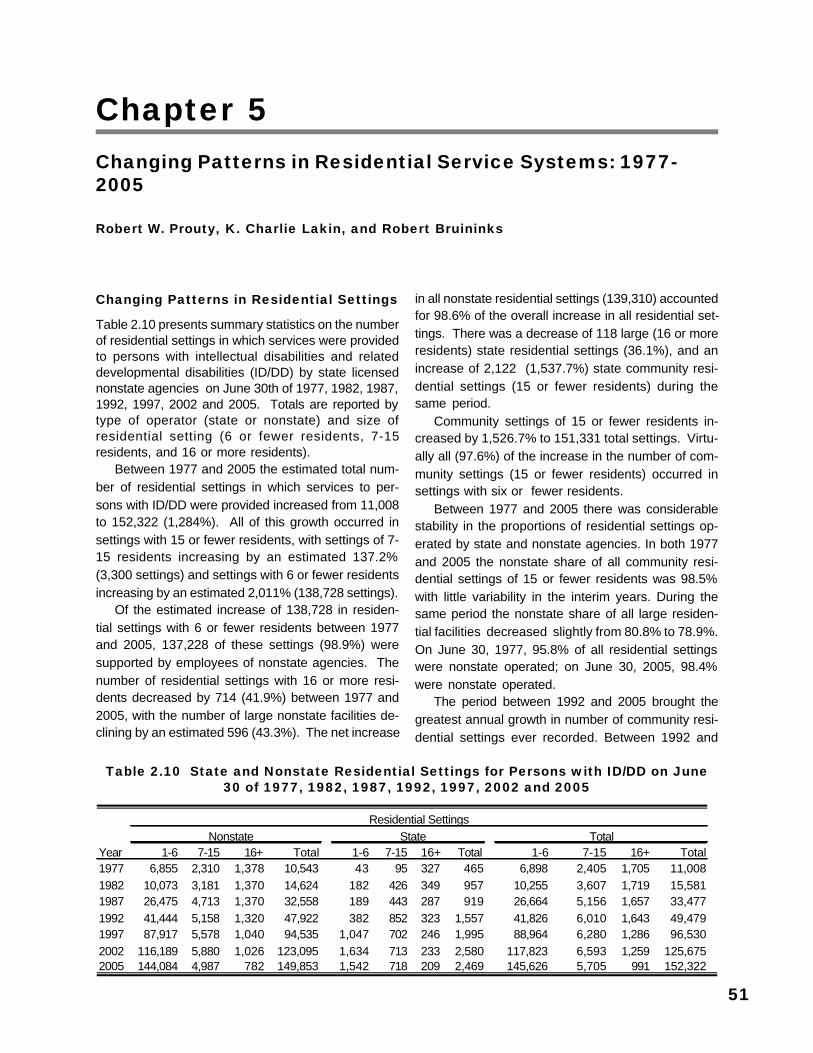
51
Chapter 5Changing Patterns in Residential Service Systems: 1977-2005
Robert W. Prouty, K. Charlie Lakin, and Robert Bruininks
Changing Patterns in Residential Settings
Table 2.10 presents summary statistics on the numberof residential settings in which services were providedto persons with intellectual disabilities and relateddevelopmental disabilities (ID/DD) by state licensednonstate agencies on June 30th of 1977, 1982, 1987,1992, 1997, 2002 and 2005. Totals are reported bytype of operator (state or nonstate) and size ofresidential setting (6 or fewer residents, 7-15residents, and 16 or more residents).
Between 1977 and 2005 the estimated total num-ber of residential settings in which services to per-sons with ID/DD were provided increased from 11,008to 152,322 (1,284%). All of this growth occurred insettings with 15 or fewer residents, with settings of 7-15 residents increasing by an estimated 137.2%(3,300 settings) and settings with 6 or fewer residentsincreasing by an estimated 2,011% (138,728 settings).
Of the estimated increase of 138,728 in residen-tial settings with 6 or fewer residents between 1977and 2005, 137,228 of these settings (98.9%) weresupported by employees of nonstate agencies. Thenumber of residential settings with 16 or more resi-dents decreased by 714 (41.9%) between 1977 and2005, with the number of large nonstate facilities de-clining by an estimated 596 (43.3%). The net increase
in all nonstate residential settings (139,310) accountedfor 98.6% of the overall increase in all residential set-tings. There was a decrease of 118 large (16 or moreresidents) state residential settings (36.1%), and anincrease of 2,122 (1,537.7%) state community resi-dential settings (15 or fewer residents) during thesame period.
Community settings of 15 or fewer residents in-creased by 1,526.7% to 151,331 total settings. Virtu-ally all (97.6%) of the increase in the number of com-munity settings (15 or fewer residents) occurred insettings with six or fewer residents.
Between 1977 and 2005 there was considerablestability in the proportions of residential settings op-erated by state and nonstate agencies. In both 1977and 2005 the nonstate share of all community resi-dential settings of 15 or fewer residents was 98.5%with little variability in the interim years. During thesame period the nonstate share of all large residen-tial facilities decreased slightly from 80.8% to 78.9%.On June 30, 1977, 95.8% of all residential settingswere nonstate operated; on June 30, 2005, 98.4%were nonstate operated.
The period between 1992 and 2005 brought thegreatest annual growth in number of community resi-dential settings ever recorded. Between 1992 and
Table 2.10 State and Nonstate Residential Settings for Persons with ID/DD on June30 of 1977, 1982, 1987, 1992, 1997, 2002 and 2005
Nonstate State TotalYear 1-6 7-15 16+ Total 1-6 7-15 16+ Total 1-6 7-15 16+ Total1977 6,855 2,310 1,378 10,543 43 95 327 465 6,898 2,405 1,705 11,0081982 10,073 3,181 1,370 14,624 182 426 349 957 10,255 3,607 1,719 15,5811987 26,475 4,713 1,370 32,558 189 443 287 919 26,664 5,156 1,657 33,4771992 41,444 5,158 1,320 47,922 382 852 323 1,557 41,826 6,010 1,643 49,4791997 87,917 5,578 1,040 94,535 1,047 702 246 1,995 88,964 6,280 1,286 96,5302002 116,189 5,880 1,026 123,095 1,634 713 233 2,580 117,823 6,593 1,259 125,6752005 144,084 4,987 782 149,853 1,542 718 209 2,469 145,626 5,705 991 152,322
Residential Settings
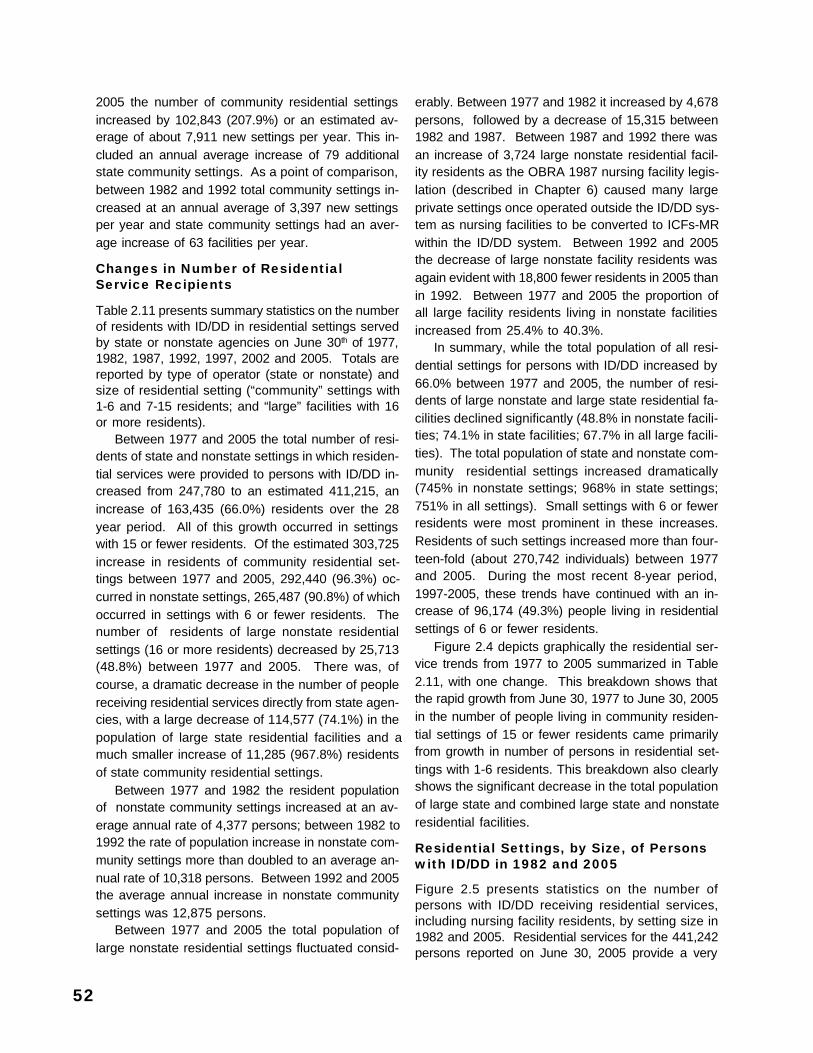
52
2005 the number of community residential settingsincreased by 102,843 (207.9%) or an estimated av-erage of about 7,911 new settings per year. This in-cluded an annual average increase of 79 additionalstate community settings. As a point of comparison,between 1982 and 1992 total community settings in-creased at an annual average of 3,397 new settingsper year and state community settings had an aver-age increase of 63 facilities per year.
Changes in Number of ResidentialService Recipients
Table 2.11 presents summary statistics on the numberof residents with ID/DD in residential settings servedby state or nonstate agencies on June 30th of 1977,1982, 1987, 1992, 1997, 2002 and 2005. Totals arereported by type of operator (state or nonstate) andsize of residential setting (“community” settings with1-6 and 7-15 residents; and “large” facilities with 16or more residents).
Between 1977 and 2005 the total number of resi-dents of state and nonstate settings in which residen-tial services were provided to persons with ID/DD in-creased from 247,780 to an estimated 411,215, anincrease of 163,435 (66.0%) residents over the 28year period. All of this growth occurred in settingswith 15 or fewer residents. Of the estimated 303,725increase in residents of community residential set-tings between 1977 and 2005, 292,440 (96.3%) oc-curred in nonstate settings, 265,487 (90.8%) of whichoccurred in settings with 6 or fewer residents. Thenumber of residents of large nonstate residentialsettings (16 or more residents) decreased by 25,713(48.8%) between 1977 and 2005. There was, ofcourse, a dramatic decrease in the number of peoplereceiving residential services directly from state agen-cies, with a large decrease of 114,577 (74.1%) in thepopulation of large state residential facilities and amuch smaller increase of 11,285 (967.8%) residentsof state community residential settings.
Between 1977 and 1982 the resident populationof nonstate community settings increased at an av-erage annual rate of 4,377 persons; between 1982 to1992 the rate of population increase in nonstate com-munity settings more than doubled to an average an-nual rate of 10,318 persons. Between 1992 and 2005the average annual increase in nonstate communitysettings was 12,875 persons.
Between 1977 and 2005 the total population oflarge nonstate residential settings fluctuated consid-
erably. Between 1977 and 1982 it increased by 4,678persons, followed by a decrease of 15,315 between1982 and 1987. Between 1987 and 1992 there wasan increase of 3,724 large nonstate residential facil-ity residents as the OBRA 1987 nursing facility legis-lation (described in Chapter 6) caused many largeprivate settings once operated outside the ID/DD sys-tem as nursing facilities to be converted to ICFs-MRwithin the ID/DD system. Between 1992 and 2005the decrease of large nonstate facility residents wasagain evident with 18,800 fewer residents in 2005 thanin 1992. Between 1977 and 2005 the proportion ofall large facility residents living in nonstate facilitiesincreased from 25.4% to 40.3%.
In summary, while the total population of all resi-dential settings for persons with ID/DD increased by66.0% between 1977 and 2005, the number of resi-dents of large nonstate and large state residential fa-cilities declined significantly (48.8% in nonstate facili-ties; 74.1% in state facilities; 67.7% in all large facili-ties). The total population of state and nonstate com-munity residential settings increased dramatically(745% in nonstate settings; 968% in state settings;751% in all settings). Small settings with 6 or fewerresidents were most prominent in these increases.Residents of such settings increased more than four-teen-fold (about 270,742 individuals) between 1977and 2005. During the most recent 8-year period,1997-2005, these trends have continued with an in-crease of 96,174 (49.3%) people living in residentialsettings of 6 or fewer residents.
Figure 2.4 depicts graphically the residential ser-vice trends from 1977 to 2005 summarized in Table2.11, with one change. This breakdown shows thatthe rapid growth from June 30, 1977 to June 30, 2005in the number of people living in community residen-tial settings of 15 or fewer residents came primarilyfrom growth in number of persons in residential set-tings with 1-6 residents. This breakdown also clearlyshows the significant decrease in the total populationof large state and combined large state and nonstateresidential facilities.
Residential Settings, by Size, of Personswith ID/DD in 1982 and 2005
Figure 2.5 presents statistics on the number ofpersons with ID/DD receiving residential services,including nursing facility residents, by setting size in1982 and 2005. Residential services for the 441,242persons reported on June 30, 2005 provide a very
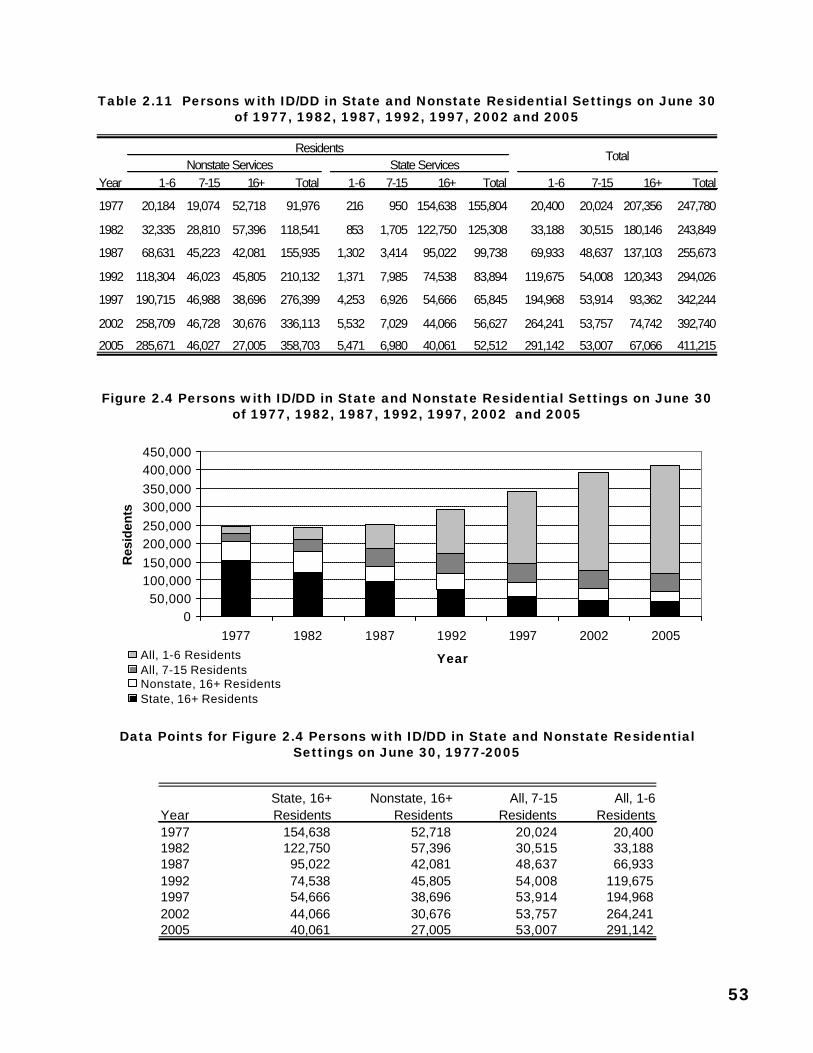
53
Table 2.11 Persons with ID/DD in State and Nonstate Residential Settings on June 30of 1977, 1982, 1987, 1992, 1997, 2002 and 2005
Figure 2.4 Persons with ID/DD in State and Nonstate Residential Settings on June 30of 1977, 1982, 1987, 1992, 1997, 2002 and 2005
Data Points for Figure 2.4 Persons with ID/DD in State and Nonstate ResidentialSettings on June 30, 1977-2005
050,000
100,000150,000200,000250,000300,000350,000400,000450,000
1977 1982 1987 1992 1997 2002 2005
Year
Res
iden
ts
All, 1-6 ResidentsAll, 7-15 ResidentsNonstate, 16+ ResidentsState, 16+ Residents
YearState, 16+ Residents
Nonstate, 16+ Residents
All, 7-15 Residents
All, 1-6 Residents
1977 154,638 52,718 20,024 20,4001982 122,750 57,396 30,515 33,1881987 95,022 42,081 48,637 66,9331992 74,538 45,805 54,008 119,6751997 54,666 38,696 53,914 194,9682002 44,066 30,676 53,757 264,2412005 40,061 27,005 53,007 291,142
Nonstate Services State ServicesYear 1-6 7-15 16+ Total 1-6 7-15 16+ Total 1-6 7-15 16+ Total
1977 20,184 19,074 52,718 91,976 216 950 154,638 155,804 20,400 20,024 207,356 247,780
1982 32,335 28,810 57,396 118,541 853 1,705 122,750 125,308 33,188 30,515 180,146 243,849
1987 68,631 45,223 42,081 155,935 1,302 3,414 95,022 99,738 69,933 48,637 137,103 255,673
1992 118,304 46,023 45,805 210,132 1,371 7,985 74,538 83,894 119,675 54,008 120,343 294,026
1997 190,715 46,988 38,696 276,399 4,253 6,926 54,666 65,845 194,968 53,914 93,362 342,244
2002 258,709 46,728 30,676 336,113 5,532 7,029 44,066 56,627 264,241 53,757 74,742 392,740
2005 285,671 46,027 27,005 358,703 5,471 6,980 40,061 52,512 291,142 53,007 67,066 411,215
ResidentsTotal
54
different profile than those of the 284,387 personswith ID/DD reported on June 30, 1982.
In 1982, more than three-fifths (63.3%) of all resi-dents lived in state and nonstate ID/DD settings of 16or more persons, 68.1% of whom were in state facili-ties. An additional 14.3% were in generic nursing fa-cilities. In total, in 1982 more than three-quarters(77.6%) of persons with ID/DD receiving long-termservices and support received them in institutional(large ID/DD or nursing) facilities; only 11.7% lived insettings of 6 or fewer residents, with an additional10.7% in settings of 7 to 15 residents.
Figure 2.5 Persons with ID/DD in Residential Settings of Different Sizes and Types onJune 30, 1982 and June 30, 2005
Data Points for Figure 2.5 Persons with ID/DD in Residential Settings of Different Sizes and Types on June 30, 1982 and June 30, 2005
By 2005, over three-fifths (66.0%) of all residentslived in ID/DD settings of 6 or fewer persons, with anadditional 12.0% living in settings of 7 to 15 persons.Only an estimated 67,066 (15.2%) were in ID/DD set-tings of 16 or more residents, 59.7% of whom were instate facilities. Generic nursing facility residents withID/DD were 6.8% of the estimated total population inJune 2005. In total, in 2005 only 15.2% of personswith ID/DD receiving long-term services and supportreceived them in settings of 16 or more residents.Nevertheless this constituted about 67,066 individu-als in such facilities.
0 20,000 40,000 60,000 80,000 100,000 120,000 140,000 160,000 180,000 200,000
1-3 Residents
4-6 Residents
7-15 Residents
16+ Residents/Nonstate
16+ Residents/State
Nursing Facilities
Set
tin
gs
Residents
1982
2005
Year1-3
Residents4-6
Residents7-15
Residents16+ Residents/
Nonstate16+ Residents/
StateNursing
Facilities1982 15,702 17,486 30,515 57,396 122,750 40,5382005 184,024 107,118 53,007 27,005 40,061 30,027
Section 3Status and Changes in
Medicaid Funded Residential andRelated Services
57
Chapter 6Background and Summary of Medicaid Long-Term CareProgramsThis chapter provides a brief overview of Medicaidprograms for persons with intellectual disabilities andrelated developmental disabilities (ID/DD) on whichstatistics are presented in Chapter 7.
Establishment of the ICF-MR Program
Before 1965 there was no federal participation in long-term care for persons with intellectual disabilities andrelated developmental disabilities. In 1965, Medicaidwas enacted as Medical Assistance, Title XIX of theSocial Security Act. It provided federal matching fundsfrom 50% to 83%, depending on each state’s percapita income, for medical assistance, includingSkilled Nursing Facilities (SNFs), for people in thecategories of elderly, blind, disabled, and dependentchildren and their families.
It was only shortly after the introduction of federalreimbursement for skilled nursing care in 1965 thatgovernment officials noted rapid growth in the num-ber of patients in SNFs. It was further documentedthat many of these individuals were receiving far moremedical care than they actually needed, at a greatercost than was needed, largely because of the incen-tives of placing people in facilities for which half ormore of the costs were reimbursed through the fed-eral Title XIX program. Therefore, in 1967, a lessmedically oriented and less expensive “IntermediateCare Facility” (ICF) program for elderly and disabledadults was authorized under Title XI of the SocialSecurity Act.
In 1971 the SNF and ICF programs were com-bined under Title XIX. Within the legislation combin-ing the two programs was a little noticed, scarcelydebated amendment that for the first time authorizedfederal financial participation (FFP) for “intermediatecare” provided in facilities specifically for people withID/DD. Three primary outcomes of the new ICF-MRlegislation appear to have been intended by propo-nents of this legislation: 1) to provide substantial fed-eral incentives for upgrading the physical environmentand the quality of care and habilitation being providedin large public ID/DD facilities; 2) to neutralize incen-tives for states to place persons with ID/DD in nonstate
nursing homes and/or to certify their large state facili-ties as SNFs; and 3) to provide a program for careand habilitation (“active treatment”) specifically fo-cused on the needs of persons with ID/DD rather thanupon medical care. It was also a way to enlist thefederal government in assisting states with their rap-idly increasing large state facility costs, which wereaveraging real dollar increases of 14% per year inthe five years prior to the passage of the ICF-MR leg-islation (Greenberg, Lakin, Hill, Bruininks, & Hauber,1985).
The ICF-MR program was initiated in a period ofrapid change in residential care for persons with ID/DD. By Fiscal Year 1973 state facility populationshad already decreased to 173,775 from their high of194,650 in Fiscal Year 1967 (Lakin, 1979). Never-theless, states overwhelmingly opted to certify theirpublic institutions to participate in the ICF-MR pro-gram, with two notable outcomes: 1) nearly every statetook steps to secure federal participation in payingfor large state facility services, and 2) in order to main-tain federal participation, most states were compelledto invest substantial amounts of state dollars in bring-ing large state facilities into conformity with ICF-MRstandards. Forty states had at least one ICF-MR cer-tified state facility by June 30, 1977. Nearly a billionstate dollars were invested in facility improvementefforts in Fiscal Years 1978-1980 alone, primarily tomeet ICF-MR standards (Gettings & Mitchell, 1980).
In the context of growing support for communityresidential services, such statistics were used by agrowing number of critics to charge that the ICF-MRprogram 1) had created direct incentives for main-taining people in large state facilities by providing fed-eral contributions to the costs of those facilities; 2)had diverted funds that could otherwise have beenspent on community program development into facil-ity renovations solely to obtain FFP; 3) had promotedthe development of large private ICF-MR facilities forpeople leaving large state facilities through availableFFP (11,943 people were living in large private ICFs-MR by June 1977); and 4) had promoted organiza-
58
tional inefficiency and individual dependency by pro-moting a single uniform standard for care and over-sight of ICF-MR residents irrespective of the natureand degree of their disabilities and/or their relativecapacity for independence. These criticisms, and thegrowing desire to increase residential opportunitiesin community settings, along with the continued de-sire of states to avail themselves of the favorableMedicaid cost-share, helped stimulate the develop-ment of community ICFs-MR and the eventual clarifi-cation by the Health Care Financing Administration(HCFA) of how the ICF-MR level of care could bedelivered in 4-15 person group homes.
Community ICF-MR Group Homes
Expansion of ICF-MR services to privately-operatedprograms in the late 1970s and the 1980s was a majordevelopment in the evolution of the program. Privateresidential facilities were not an issue at the time oforiginal ICF-MR enactment in 1971, probably be-cause: 1) most private facilities were already techni-cally covered under the 1967 amendments to theSocial Security Act authorizing private ICF programs,and 2) in 1971 large state facilities were by far thepredominant model of residential care. Indeed, the1969 Master Facility Inventory indicated a total popu-lation in nonstate ID/DD facilities of about 25,000,compared with a large state ID/DD facility populationof 190,000 (Lakin, Bruininks, Doth, Hill, & Hauber,1982).
Although Congressional debate about the ICF-MRprogram had focused on large public facilities, thestatute did not specifically limit ICF-MR coverage ei-ther to large public facilities, or to “institutions” in thecommon meaning of the term. The definition of “in-stitution” which served as the basis for participationin the ICF-MR program was (and remains) the onethat also covered the general ICF institution: “four ormore people in single or multiple units” (45 CFR Sec.448.60 (6) (1)). Although it cannot be determinedwhether Congress, in authorizing a “four or more bed”facility, purposely intended the ICF-MR benefit to beavailable in small settings, it does seem reasonableto suppose, in the absence of specific limitations, thatCongress was more interested in improving the gen-eral quality of residential care than it was in targetingspecific types of residential settings. ICF-MR regula-tions, first published in January 1974, also supportedthe option of developing relatively small settings, de-lineating two categories of ICFs-MR, those housing
16 or more people (“large”) and those housing 15 orfewer people (“community”) and providing severalspecifications that allowed greater flexibility in meet-ing ICF-MR standards in the smaller settings.
Despite the regulatory recognition of communityICFs-MR, the numbers of such ICFs-MR actuallydeveloped varied enormously among states and re-gions. In some DHHS regions (e.g., Region V) hun-dreds of community ICFs-MR were developed whileother regions (e.g., II and X) had none. By mid-1977three-quarters (74.5%) of the 188 community ICFs-MR were located in just two states (Minnesota andTexas), and by mid-1982 nearly half (46.4%) of the1,202 community ICFs-MR were located in Minne-sota and New York and nearly two-thirds (65.1%) werelocated in Minnesota, New York, Michigan and Texas.These variations reflected what some states and na-tional organizations considered a failure of HCFA todelineate clear and consistent policy guidelines forcertifying community settings for ICF-MR participa-tion and/or reluctance on the part of some regionalHCFA agencies to promote the option.
In response to continued complaints from thestates that there was a need to clarify policy regard-ing the certification of community ICFs-MR, in 1981HCFA issued “Interpretive Guidelines” for certifyingcommunity ICFs-MR. These guidelines did notchange the existing standards for the ICF-MR pro-gram, but clarified how the existing standards couldbe applied to delivering the ICF-MR level of care incommunity settings with 4 to 15 residents. The pub-lication of the 1981 guidelines was followed by sub-stantially greater numbers of states exercising the op-tion to develop community ICFs-MR. Ironically, theseguidelines were published in the same year (1981)that Congress enacted legislation that would give evengreater opportunity and flexibility to states to useMedicaid funding for community services through theMedicaid Home and Community Based Serviceswaiver authority (Section 2176 of P.L. 97-35).
Home and Community Based Services(HCBS)
Section 2176 of the Omnibus Budget ReconciliationAct of 1981 (P.L. 97-35), passed on August 13, 1981,granted the Secretary of Health and Human Servicesthe authority to waive certain existing Medicaid re-quirements and allow states to finance “noninstitu-tional” services for Medicaid-eligible individuals. The
59
Medicaid Home and Community-Based Services(HCBS) waiver program was designed to providenoninstitutional, community services to people whoare aged, blind, disabled, or who have ID/DD and who,in the absence of alternative noninstitutional services,would remain in or would be at a risk of being placedin a Medicaid facility (i.e., a Nursing Facility or an ICF-MR). Final regulations were published in March 1985and since then a number of new regulations and in-terpretations have been developed, although nonehave changed the fundamental premise of the pro-gram, that of using community services to reduce theneed for institutional services.
A wide variety of noninstitutional services are pro-vided in state HCBS programs, most frequently theseinclude service coordination/case management; in-home supports; vocational and day habilitation ser-vices; and respite care. Although not allowed to useHCBS reimbursements to pay for room and board,all states provide residential support services undercategories such as personal care, residential habili-tation, and in-home supports. HCBS recipients withID/DD use their own resources, usually cash assis-tance from other Social Security Act programs andstate supplements to cover room and board costs. InJune 2005 about 54.5% of HCBS recipients in thestates reporting such data received services in set-tings other than the home of natural or adoptive fam-ily members.
Given both its flexibility and its potential for pro-moting individualization of services, the HCBS pro-gram is recognized in all states as a significant re-source in the provision of community services as analternative to institutional care. Beginning in the early1990s, stringent standards that previously requiredstates to demonstrate reductions in projected ICF-MR residents and expenditures roughly equal to theincreases in HCBS participants and expenditureswere considerably relaxed and then dropped in the
1994 revision of the HCBS regulations. As a result,from 1992 to 2005 there was dramatic growth (610.6%)in the number of HCBS participants, even as the num-ber of ICF-MR residents declined by 30.4%. All statesnow provide HCBS and more than 4.3 times as manypersons with ID/DD (443,608) participate in the HCBSprogram as live in ICFs-MR (101,821).
Medicaid Nursing Facilities
Almost from the inception of Medicaid, states notedincentives for placing persons with ID/DD in Medic-aid certified nursing facilities. Almost as soon as thisbegan to happen, there was a sense among the ad-vocacy community that many more people with ID/DD were living in nursing homes than were appropri-ately served in them (National Association for Re-tarded Citizens, 1975). In 1987 Congress respondedto these and other criticisms of nursing facility care inthe Omnibus Budget Reconciliation Act (OBRA) of1987 (P.L. 100-203). Provisions of this legislationrestricted criteria for admissions to Medicaid reim-bursed nursing facilities, so that only those personsrequiring the medical/nursing services offered wouldbe admitted. Current residents not in need of nurs-ing services were required to be moved to “more ap-propriate” residential settings, with the exception ofindividuals living in a specific nursing home for morethan 30 months should they choose to stay. In eithercase nursing facilities were required to assure thateach person’s needs for “active treatment” (latertermed “specialized services”) were met. The esti-mated number of people with ID/DD in Medicaid-cer-tified nursing facilities in June 2005 (30,027), was basedon direct reports from 42 states. The estimated num-ber of nursing facility residents with ID/DD in June 2005was 21.0% less than the number in 1970 (38,000), theyear before the ICF-MR program began and 24.0%less than in 1986 (39,528), the year before OBRA 1987reform was enacted.

60
61
Chapter 7Utilization of and Expenditures for Medicaid Institutionaland Home and Community Based Services
K. Charlie Lakin, Kathryn Coucouvanis, and Robert W. Prouty
This chapter provides statistics on the utilization ofthe three primary Medicaid long-term care programsfor persons with intellectual disabilities and relateddevelopmental disabilities (ID/DD): Intermediate CareFacilities for (persons with) Mental Retardation (ICF-MR), Home and Community Based Services (HCBS),and Nursing Facilities (NF). These statistics are re-ported on a state-by-state basis, reflecting the inde-pendent state administration and the substantial vari-ability among states in the use of these programs.
ICF-MR Program Utilization on June 30,2005
Number of facilities. Table 3.1 presents state-by-state statistics on the number of ICFs-MR in the UnitedStates by size and state/nonstate operation on June30, 2005. The total of 6,457 ICFs-MR on June 30,2005 compares with 574 ICFs-MR reported on June30, 1977; 1,889 on June 30, 1982; 3,913 on June 30,1987; 6,512 on June 30, 1992; 7,249 on June 30,1997; 6,623 on June 30, 2002; 6,645 on June 30,2003 and 6,535 on June 30, 2004.
The period between June 1993 and June 1995 pro-vided the first ever decrease in the total number ofICFs-MR. Between June 1993 and June 1995 therewas a substantial reduction of 664 from the 1993 to-tal of 7,611. The major contributor to this reductionwas New York which was operating 526 fewer ICFs-MR in 1994 than 1993, and 515 fewer in June 1995than in 1994, due to the conversion of communityICFs-MR (with 15 or fewer residents) to settings fi-nanced by the Medicaid Home and Community BasedServices (HCBS) waiver. Between 1995 and 2005, thetotal number of ICFs-MR has been somewhat variable:increasing by 136 settings between 1995 and 1996(112 of which served 6 or fewer residents), and by 166settings between 1996 and 1997 (again mostly set-tings with 6 or fewer residents). Between 1997 and1998 ICFs-MR decreased by 133 settings, and thenby another 363 settings between 1998 and 1999 dueto Michigan’s conversion of 436 nonstate ICFs-MR of
6 or fewer residents to HCBS sites. Between 1999and 2000 the total number decreased by 82 and be-tween 2000 and 2001 by 56. Between 2001 and 2002the number of ICFs-MR increased by 8 settings andby 22 between 2002 and 2003. The number decreasedby 110 between 2003 and 2004 and by 78 between2004 and 2005.
Over five-sixths (85.6%) of the 6,457 ICFs-MR onJune 30, 2005 were in the 13 states with 100 or moreICFs-MR each. Of these, close to three-fifths (56.7%)were concentrated in four states (California, Indiana,New York, and Texas) with more than 500 ICFs-MReach. In contrast, 18 states with ICFs-MR had fewerthan 10 each and their combined total of 69 was just1.1% of all ICFs-MR. Alaska had no ICFs-MR.
The vast majority of all ICFs-MR (90.2%) on June30, 2005 were community settings (15 or fewer resi-dents), of which more than three-fifths (61.9%) had sixor fewer residents. Most (85.5%) of all ICFs-MR withsix or fewer residents were in eight states (California,District of Columbia, Indiana, Louisiana, Minnesota,North Carolina, Pennsylvania, and Texas) with morethan 100 ICFs-MR each. Nineteen states reported noICFs-MR with six or fewer residents and twelve statesreported no community ICFs-MR of any size.
Five states (Alaska, District of Columbia, Hawaii,New Mexico and Vermont) reported having no largeICFs-MR (16 or more residents) on June 30, 2005.Twenty-one other states reported having five or fewerlarge ICFs-MR. Over two-fifths (42.5%) of all largeICFs-MR were located in four states with 50 or morelarge ICFs-MR each (Florida, Illinois, New York, andOhio) and over one-half (52.6%) were in the six stateswith 30 or more large ICFs-MR each.
Most large ICFs-MR (67.8%) were operated bynonstate agencies. Almost all ICFs-MR (98.9%) withsix or fewer residents were nonstate operated, as werealmost all ICFs-MR (95.7%) of 7 to 15 residents. Of
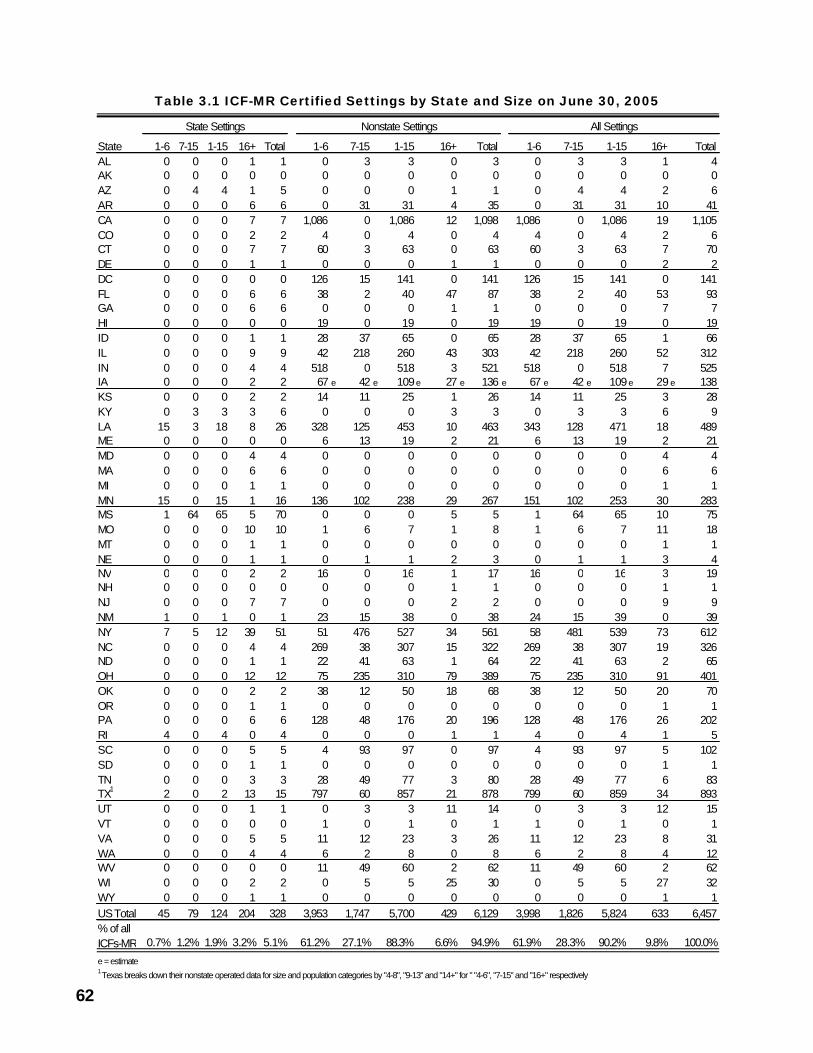
62
Table 3.1 ICF-MR Certified Settings by State and Size on June 30, 2005
State 1-6 7-15 1-15 16+ Total 1-6 7-15 1-15 16+ Total 1-6 7-15 1-15 16+ TotalAL 0 0 0 1 1 0 3 3 0 3 0 3 3 1 4AK 0 0 0 0 0 0 0 0 0 0 0 0 0 0 0AZ 0 4 4 1 5 0 0 0 1 1 0 4 4 2 6AR 0 0 0 6 6 0 31 31 4 35 0 31 31 10 41CA 0 0 0 7 7 1,086 0 1,086 12 1,098 1,086 0 1,086 19 1,105CO 0 0 0 2 2 4 0 4 0 4 4 0 4 2 6CT 0 0 0 7 7 60 3 63 0 63 60 3 63 7 70DE 0 0 0 1 1 0 0 0 1 1 0 0 0 2 2DC 0 0 0 0 0 126 15 141 0 141 126 15 141 0 141FL 0 0 0 6 6 38 2 40 47 87 38 2 40 53 93GA 0 0 0 6 6 0 0 0 1 1 0 0 0 7 7HI 0 0 0 0 0 19 0 19 0 19 19 0 19 0 19ID 0 0 0 1 1 28 37 65 0 65 28 37 65 1 66IL 0 0 0 9 9 42 218 260 43 303 42 218 260 52 312IN 0 0 0 4 4 518 0 518 3 521 518 0 518 7 525IA 0 0 0 2 2 67 e 42 e 109e 27 e 136 e 67 e 42 e 109e 29 e 138KS 0 0 0 2 2 14 11 25 1 26 14 11 25 3 28KY 0 3 3 3 6 0 0 0 3 3 0 3 3 6 9LA 15 3 18 8 26 328 125 453 10 463 343 128 471 18 489ME 0 0 0 0 0 6 13 19 2 21 6 13 19 2 21MD 0 0 0 4 4 0 0 0 0 0 0 0 0 4 4MA 0 0 0 6 6 0 0 0 0 0 0 0 0 6 6MI 0 0 0 1 1 0 0 0 0 0 0 0 0 1 1MN 15 0 15 1 16 136 102 238 29 267 151 102 253 30 283MS 1 64 65 5 70 0 0 0 5 5 1 64 65 10 75MO 0 0 0 10 10 1 6 7 1 8 1 6 7 11 18MT 0 0 0 1 1 0 0 0 0 0 0 0 0 1 1NE 0 0 0 1 1 0 1 1 2 3 0 1 1 3 4NV 0 0 0 2 2 16 0 16 1 17 16 0 16 3 19NH 0 0 0 0 0 0 0 0 1 1 0 0 0 1 1NJ 0 0 0 7 7 0 0 0 2 2 0 0 0 9 9NM 1 0 1 0 1 23 15 38 0 38 24 15 39 0 39NY 7 5 12 39 51 51 476 527 34 561 58 481 539 73 612NC 0 0 0 4 4 269 38 307 15 322 269 38 307 19 326ND 0 0 0 1 1 22 41 63 1 64 22 41 63 2 65OH 0 0 0 12 12 75 235 310 79 389 75 235 310 91 401OK 0 0 0 2 2 38 12 50 18 68 38 12 50 20 70OR 0 0 0 1 1 0 0 0 0 0 0 0 0 1 1PA 0 0 0 6 6 128 48 176 20 196 128 48 176 26 202RI 4 0 4 0 4 0 0 0 1 1 4 0 4 1 5SC 0 0 0 5 5 4 93 97 0 97 4 93 97 5 102SD 0 0 0 1 1 0 0 0 0 0 0 0 0 1 1TN 0 0 0 3 3 28 49 77 3 80 28 49 77 6 83TX1 2 0 2 13 15 797 60 857 21 878 799 60 859 34 893UT 0 0 0 1 1 0 3 3 11 14 0 3 3 12 15VT 0 0 0 0 0 1 0 1 0 1 1 0 1 0 1VA 0 0 0 5 5 11 12 23 3 26 11 12 23 8 31WA 0 0 0 4 4 6 2 8 0 8 6 2 8 4 12WV 0 0 0 0 0 11 49 60 2 62 11 49 60 2 62WI 0 0 0 2 2 0 5 5 25 30 0 5 5 27 32WY 0 0 0 1 1 0 0 0 0 0 0 0 0 1 1US Total 45 79 124 204 328 3,953 1,747 5,700 429 6,129 3,998 1,826 5,824 633 6,457% of all ICFs-MR 0.7% 1.2% 1.9% 3.2% 5.1% 61.2% 27.1% 88.3% 6.6% 94.9% 61.9% 28.3% 90.2% 9.8% 100.0%
e = estimate1 Texas breaks down their nonstate operated data for size and population categories by "4-8", "9-13" and "14+" for " "4-6", "7-15" and "16+" respectively
All SettingsState Settings Nonstate Settings
63
the total 6,457 ICFs-MR reported on June 30, 2005,6,129 (94.9%) were operated by nonstate agencies.
Number of residents. Table 3.2 presents state-by-state statistics on the number of people residing inICFs-MR of different sizes and state/nonstate opera-tion on June 30, 2005. There was a total of 101,821ICF-MR residents on June 30, 2005. This representedthe twelfth consecutive year of decrease in ICF-MRpopulations. The decrease of 2,705 residents in ICF-MR populations between June 2004 and June 2005was more than the annual decreases between 2003and 2004 (2,539), but less than those between 2002and 2003 (3,507) and 2001 and 2002 (3,335). It wassomewhat less than the average annual decrease of3,110 between June 1996 and June 2001, and sub-stantially less than the average annual decrease of5,784 between June 1993 and June 1996. Thirty-threestates reported reduction in their total population ofICF-MR residents between June 30, 2004 and June30, 2005. The largest reduction was in New York inwhich there were 662 fewer ICF-MR residents on June30, 2005 than on June 30, 2004. In June 2005 thelargest numbers of ICF-MR residents were in Texas(11,924), California (10,369), Illinois (9,592) and NewYork (8,558). Alaska had none, and New Hampshire,Rhode Island and Vermont each had fewer than 50.
Nonstate ICFs-MR
Throughout the period from 1977 to 2005, there hasbeen a steady and substantial shift toward nonstateoperation of ICFs-MR, although significantly less thanthe shift toward nonstate residential services gener-ally. In 1977 there were 13,312 nonstate ICF-MR resi-dents. They made up only 12.5% of all ICF-MR resi-dents. In 1987, the 53,052 nonstate ICF-MR resi-dents were 36.8% of all ICF-MR residents and byJune 30, 1995, a majority (73,437 or 54.6%) of allICF-MR residents were in nonstate ICFs-MR. OnJune 30, 2005, there were 61,446 residents of nonstateICFs-MR and they made up 60.3% of all ICF-MR resi-dents, almost the same percentage as in June 2004.
Large nonstate ICFs-MR. Most of the growth in thenumber of residents in large nonstate ICFs- MR tookplace in the decade between program inception and1982. There were 23,686 residents of large nonstateICF-MR facilities on June 30, 1982, 11,728 more thanon June 30, 1977. The ICF-MR certification of largenonstate facilities continued at a generally high rateuntil 1987, when there were 32,398 residents. Be-tween 1987 and 2005, large nonstate ICF-MR popula-tions decreased by 10,605 residents (an average of589 per year) to 21,793 persons with ID/DD on June30, 2005.
Nonstate community ICFs-MR. On June 30, 2005nonstate community ICFs-MR (15 or fewer residents)made up 88.3% of all ICFs-MR, although only 38.9%of all ICF-MR residents lived in them. These numberscompare with 26.0% of ICF-MR certified settings and1.3% of residents in 1977; 56.0% of settings and 6.0%of residents in 1982; 70.3% of settings and 14.3% ofresidents in 1987; 73.5% of settings and 23.9% ofresidents in 1992; 87.3% of settings and 34.6% ofresidents in 1997; 87.0% of settings and 36.9% ofresidents in 2002 and 87.7% of settings, 37.2% ofresidents in 2003 and 88.0% of settings and 38.0% ofresidents in 2004. Between 1982 and 2005, nonstatecommunity ICFs-MR grew by 31,295 residents ascompared with a decrease of 1,893 residents in largenonstate ICFs-MR.
Further broken down, on June 30, 2005, of the39,653 people living in nonstate community ICFs-MR,55.9% (22,162) were living in ICFs-MR of six or fewerresidents. In comparison, on June 30, 1982, 28.3%(2,364) of the 8,358 community nonstate ICF-MR resi-dents, were living in ICFs-MR of six or fewer residents.
On June 30, 2005 the ten states with the greatestnumber of nonstate community ICF-MR residents(California, Illinois, Indiana, Louisiana, Minnesota,New York, North Carolina, Ohio, Pennsylvania andTexas) had 83.4% of all nonstate community ICF-MRresidents. California, New York and Texas each hadmore than 5,000 residents in nonstate communityICFs-MR. In contrast, the 10 states with the smallestresident populations had a total of only 1.1% of allresidents on June 30, 2005. Sixteen states had nononstate community ICFs-MR.
State ICF-MR Utilization
The proportion of ICF-MR residents living in state fa-cilities has been decreasing steadily since 1982. FY2005 was the thirteenth year that fewer ICF-MR resi-dents lived in state settings than in nonstate settings(39.7% of all ICF-MR residents on June 30, 2005).
Large state ICFs-MR. Nationally on June 30, 2005,the population of large state ICFs-MR was 39,378 (outof a total residential population of all large state insti-tutions of 40,061). Although the percentage of largestate ID/DD facility residents living in ICF-MR certifiedunits increased from 88% to 98.3% between 1982 and2005, there was a large overall reduction in the popu-lation of large state ICFs-MR. From June 30, 1982 toJune 30, 2005 there was a national net decrease of67,703 residents of large state ICFs-MR, as comparedwith a net increase of 14,583 residents between June30, 1977 and June 30, 1982.
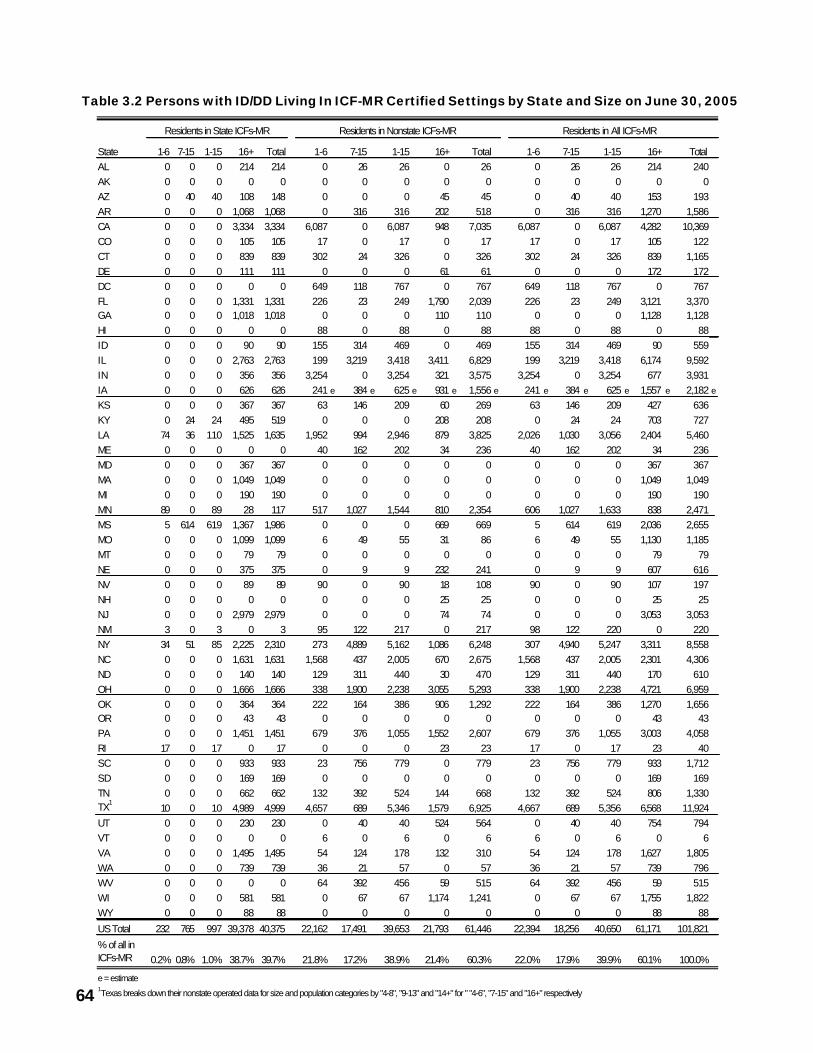
64
Table 3.2 Persons with ID/DD Living In ICF-MR Certified Settings by State and Size on June 30, 2005
Residents in All ICFs-MR
State 1-6 7-15 1-15 16+ Total 1-6 7-15 1-15 16+ Total 1-6 7-15 1-15 16+ TotalAL 0 0 0 214 214 0 26 26 0 26 0 26 26 214 240AK 0 0 0 0 0 0 0 0 0 0 0 0 0 0 0AZ 0 40 40 108 148 0 0 0 45 45 0 40 40 153 193AR 0 0 0 1,068 1,068 0 316 316 202 518 0 316 316 1,270 1,586CA 0 0 0 3,334 3,334 6,087 0 6,087 948 7,035 6,087 0 6,087 4,282 10,369CO 0 0 0 105 105 17 0 17 0 17 17 0 17 105 122CT 0 0 0 839 839 302 24 326 0 326 302 24 326 839 1,165DE 0 0 0 111 111 0 0 0 61 61 0 0 0 172 172DC 0 0 0 0 0 649 118 767 0 767 649 118 767 0 767FL 0 0 0 1,331 1,331 226 23 249 1,790 2,039 226 23 249 3,121 3,370GA 0 0 0 1,018 1,018 0 0 0 110 110 0 0 0 1,128 1,128HI 0 0 0 0 0 88 0 88 0 88 88 0 88 0 88ID 0 0 0 90 90 155 314 469 0 469 155 314 469 90 559IL 0 0 0 2,763 2,763 199 3,219 3,418 3,411 6,829 199 3,219 3,418 6,174 9,592IN 0 0 0 356 356 3,254 0 3,254 321 3,575 3,254 0 3,254 677 3,931IA 0 0 0 626 626 241 e 384 e 625 e 931 e 1,556 e 241 e 384 e 625 e 1,557 e 2,182 e
KS 0 0 0 367 367 63 146 209 60 269 63 146 209 427 636KY 0 24 24 495 519 0 0 0 208 208 0 24 24 703 727LA 74 36 110 1,525 1,635 1,952 994 2,946 879 3,825 2,026 1,030 3,056 2,404 5,460ME 0 0 0 0 0 40 162 202 34 236 40 162 202 34 236MD 0 0 0 367 367 0 0 0 0 0 0 0 0 367 367MA 0 0 0 1,049 1,049 0 0 0 0 0 0 0 0 1,049 1,049MI 0 0 0 190 190 0 0 0 0 0 0 0 0 190 190MN 89 0 89 28 117 517 1,027 1,544 810 2,354 606 1,027 1,633 838 2,471MS 5 614 619 1,367 1,986 0 0 0 669 669 5 614 619 2,036 2,655MO 0 0 0 1,099 1,099 6 49 55 31 86 6 49 55 1,130 1,185MT 0 0 0 79 79 0 0 0 0 0 0 0 0 79 79NE 0 0 0 375 375 0 9 9 232 241 0 9 9 607 616NV 0 0 0 89 89 90 0 90 18 108 90 0 90 107 197NH 0 0 0 0 0 0 0 0 25 25 0 0 0 25 25NJ 0 0 0 2,979 2,979 0 0 0 74 74 0 0 0 3,053 3,053NM 3 0 3 0 3 95 122 217 0 217 98 122 220 0 220NY 34 51 85 2,225 2,310 273 4,889 5,162 1,086 6,248 307 4,940 5,247 3,311 8,558NC 0 0 0 1,631 1,631 1,568 437 2,005 670 2,675 1,568 437 2,005 2,301 4,306ND 0 0 0 140 140 129 311 440 30 470 129 311 440 170 610OH 0 0 0 1,666 1,666 338 1,900 2,238 3,055 5,293 338 1,900 2,238 4,721 6,959OK 0 0 0 364 364 222 164 386 906 1,292 222 164 386 1,270 1,656OR 0 0 0 43 43 0 0 0 0 0 0 0 0 43 43PA 0 0 0 1,451 1,451 679 376 1,055 1,552 2,607 679 376 1,055 3,003 4,058RI 17 0 17 0 17 0 0 0 23 23 17 0 17 23 40SC 0 0 0 933 933 23 756 779 0 779 23 756 779 933 1,712SD 0 0 0 169 169 0 0 0 0 0 0 0 0 169 169TN 0 0 0 662 662 132 392 524 144 668 132 392 524 806 1,330TX1
10 0 10 4,989 4,999 4,657 689 5,346 1,579 6,925 4,667 689 5,356 6,568 11,924UT 0 0 0 230 230 0 40 40 524 564 0 40 40 754 794VT 0 0 0 0 0 6 0 6 0 6 6 0 6 0 6VA 0 0 0 1,495 1,495 54 124 178 132 310 54 124 178 1,627 1,805WA 0 0 0 739 739 36 21 57 0 57 36 21 57 739 796WV 0 0 0 0 0 64 392 456 59 515 64 392 456 59 515WI 0 0 0 581 581 0 67 67 1,174 1,241 0 67 67 1,755 1,822WY 0 0 0 88 88 0 0 0 0 0 0 0 0 88 88
US Total 232 765 997 39,378 40,375 22,162 17,491 39,653 21,793 61,446 22,394 18,256 40,650 61,171 101,821
% of all in ICFs-MR 0.2% 0.8% 1.0% 38.7% 39.7% 21.8% 17.2% 38.9% 21.4% 60.3% 22.0% 17.9% 39.9% 60.1% 100.0%
e = estimate1Texas breaks down their nonstate operated data for size and population categories by "4-8", "9-13" and "14+" for " "4-6", "7-15" and "16+" respectively
Residents in Nonstate ICFs-MRResidents in State ICFs-MR
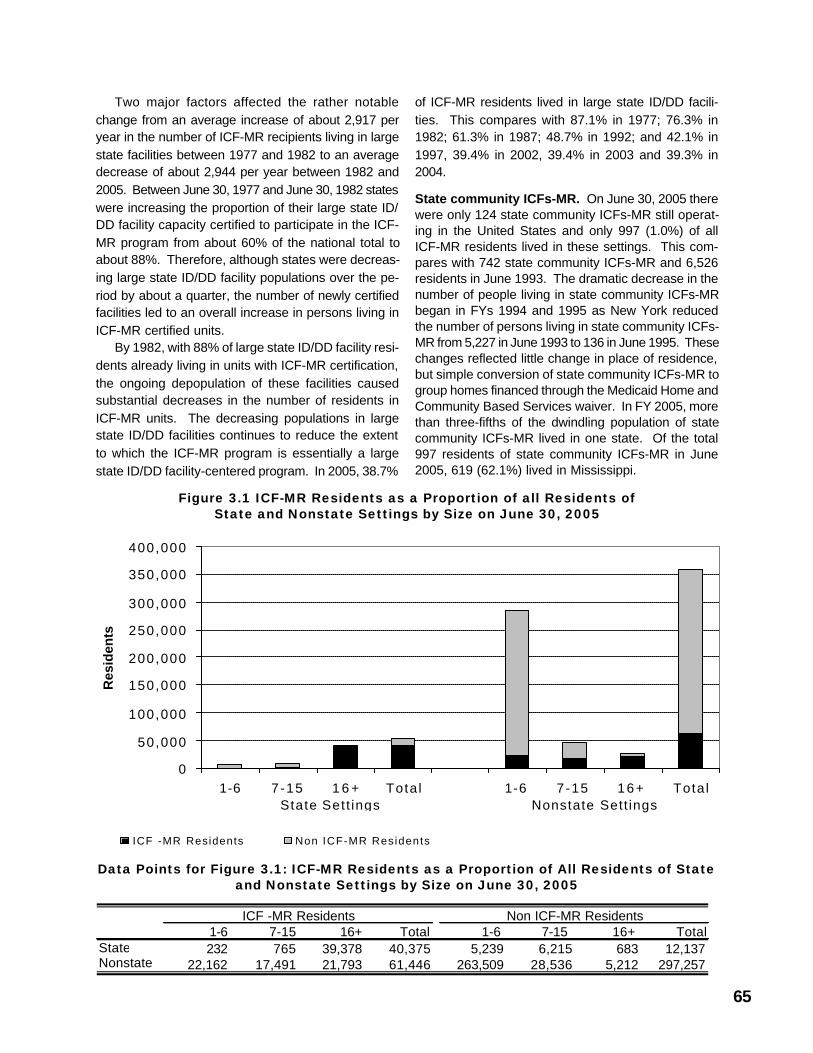
65
Two major factors affected the rather notablechange from an average increase of about 2,917 peryear in the number of ICF-MR recipients living in largestate facilities between 1977 and 1982 to an averagedecrease of about 2,944 per year between 1982 and2005. Between June 30, 1977 and June 30, 1982 stateswere increasing the proportion of their large state ID/DD facility capacity certified to participate in the ICF-MR program from about 60% of the national total toabout 88%. Therefore, although states were decreas-ing large state ID/DD facility populations over the pe-riod by about a quarter, the number of newly certifiedfacilities led to an overall increase in persons living inICF-MR certified units.
By 1982, with 88% of large state ID/DD facility resi-dents already living in units with ICF-MR certification,the ongoing depopulation of these facilities causedsubstantial decreases in the number of residents inICF-MR units. The decreasing populations in largestate ID/DD facilities continues to reduce the extentto which the ICF-MR program is essentially a largestate ID/DD facility-centered program. In 2005, 38.7%
of ICF-MR residents lived in large state ID/DD facili-ties. This compares with 87.1% in 1977; 76.3% in1982; 61.3% in 1987; 48.7% in 1992; and 42.1% in1997, 39.4% in 2002, 39.4% in 2003 and 39.3% in2004.
State community ICFs-MR. On June 30, 2005 therewere only 124 state community ICFs-MR still operat-ing in the United States and only 997 (1.0%) of allICF-MR residents lived in these settings. This com-pares with 742 state community ICFs-MR and 6,526residents in June 1993. The dramatic decrease in thenumber of people living in state community ICFs-MRbegan in FYs 1994 and 1995 as New York reducedthe number of persons living in state community ICFs-MR from 5,227 in June 1993 to 136 in June 1995. Thesechanges reflected little change in place of residence,but simple conversion of state community ICFs-MR togroup homes financed through the Medicaid Home andCommunity Based Services waiver. In FY 2005, morethan three-fifths of the dwindling population of statecommunity ICFs-MR lived in one state. Of the total997 residents of state community ICFs-MR in June2005, 619 (62.1%) lived in Mississippi.
Figure 3.1 ICF-MR Residents as a Proportion of all Residents ofState and Nonstate Settings by Size on June 30, 2005
Data Points for Figure 3.1: ICF-MR Residents as a Proportion of All Residents of Stateand Nonstate Settings by Size on June 30, 2005
0
50,000
100,000
150,000
200,000
250,000
300,000
350,000
400,000
1-6 7-15 1 6 + Tota l 1-6 7-15 16+ Tota l
Res
iden
ts
ICF -MR Residents Non ICF-MR Residents
State Sett ings Nonstate Sett ings
1-6 7-15 16+ Total 1-6 7-15 16+ TotalState 232 765 39,378 40,375 5,239 6,215 683 12,137Nonstate 22,162 17,491 21,793 61,446 263,509 28,536 5,212 297,257
ICF -MR Residents Non ICF-MR Residents
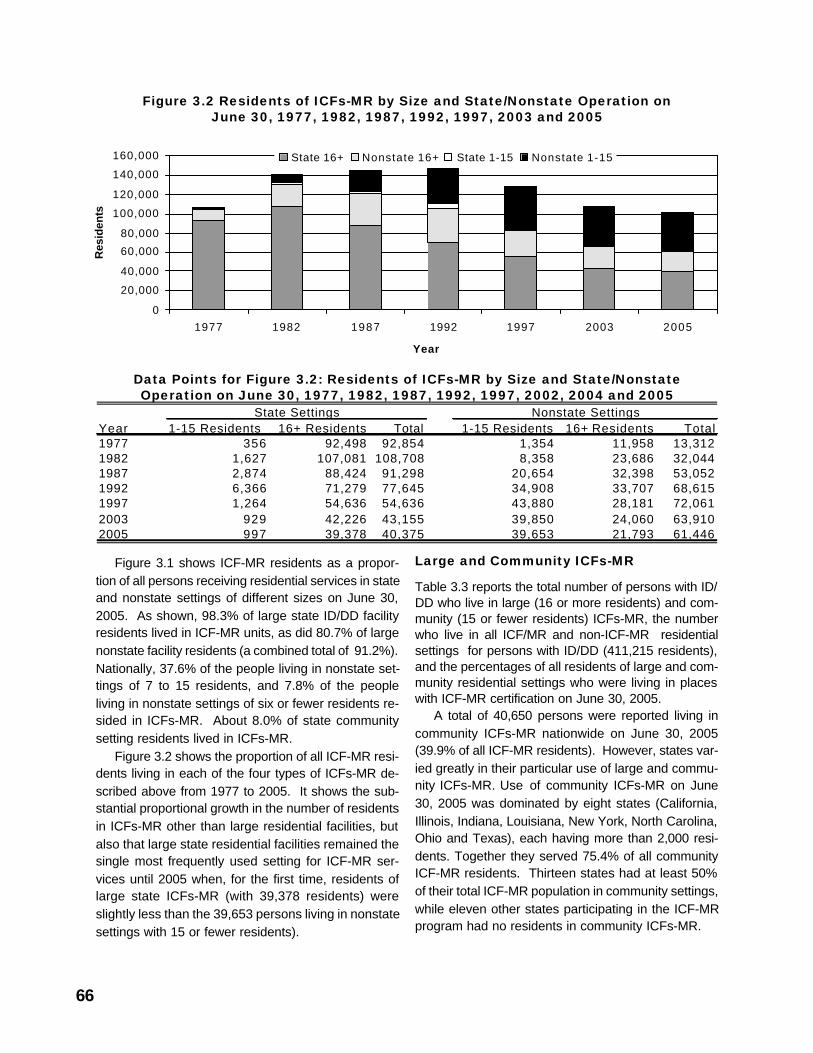
66
Figure 3.2 Residents of ICFs-MR by Size and State/Nonstate Operation onJune 30, 1977, 1982, 1987, 1992, 1997, 2003 and 2005
Data Points for Figure 3.2: Residents of ICFs-MR by Size and State/NonstateOperation on June 30, 1977, 1982, 1987, 1992, 1997, 2002, 2004 and 2005
Figure 3.1 shows ICF-MR residents as a propor-tion of all persons receiving residential services in stateand nonstate settings of different sizes on June 30,2005. As shown, 98.3% of large state ID/DD facilityresidents lived in ICF-MR units, as did 80.7% of largenonstate facility residents (a combined total of 91.2%).Nationally, 37.6% of the people living in nonstate set-tings of 7 to 15 residents, and 7.8% of the peopleliving in nonstate settings of six or fewer residents re-sided in ICFs-MR. About 8.0% of state communitysetting residents lived in ICFs-MR.
Figure 3.2 shows the proportion of all ICF-MR resi-dents living in each of the four types of ICFs-MR de-scribed above from 1977 to 2005. It shows the sub-stantial proportional growth in the number of residentsin ICFs-MR other than large residential facilities, butalso that large state residential facilities remained thesingle most frequently used setting for ICF-MR ser-vices until 2005 when, for the first time, residents oflarge state ICFs-MR (with 39,378 residents) wereslightly less than the 39,653 persons living in nonstatesettings with 15 or fewer residents).
Large and Community ICFs-MR
Table 3.3 reports the total number of persons with ID/DD who live in large (16 or more residents) and com-munity (15 or fewer residents) ICFs-MR, the numberwho live in all ICF/MR and non-ICF-MR residentialsettings for persons with ID/DD (411,215 residents),and the percentages of all residents of large and com-munity residential settings who were living in placeswith ICF-MR certification on June 30, 2005.
A total of 40,650 persons were reported living incommunity ICFs-MR nationwide on June 30, 2005(39.9% of all ICF-MR residents). However, states var-ied greatly in their particular use of large and commu-nity ICFs-MR. Use of community ICFs-MR on June30, 2005 was dominated by eight states (California,Illinois, Indiana, Louisiana, New York, North Carolina,Ohio and Texas), each having more than 2,000 resi-dents. Together they served 75.4% of all communityICF-MR residents. Thirteen states had at least 50%of their total ICF-MR population in community settings,while eleven other states participating in the ICF-MRprogram had no residents in community ICFs-MR.
0
20,000
40,000
60,000
80,000
100,000
120,000
140,000
160,000
1977 1982 1987 1992 1997 2003 2005
Year
Res
iden
ts
State 16+ Nonstate 16+ State 1-15 Nonstate 1-15
Year 1-15 Residents 16+ Residents Total 1-15 Residents 16+ Residents Total1977 356 92,498 92,854 1,354 11,958 13,3121982 1,627 107,081 108,708 8,358 23,686 32,0441987 2,874 88,424 91,298 20,654 32,398 53,0521992 6,366 71,279 77,645 34,908 33,707 68,6151997 1,264 54,636 54,636 43,880 28,181 72,0612003 929 42,226 43,155 39,850 24,060 63,9102005 997 39,378 40,375 39,653 21,793 61,446
State Settings Nonstate Settings
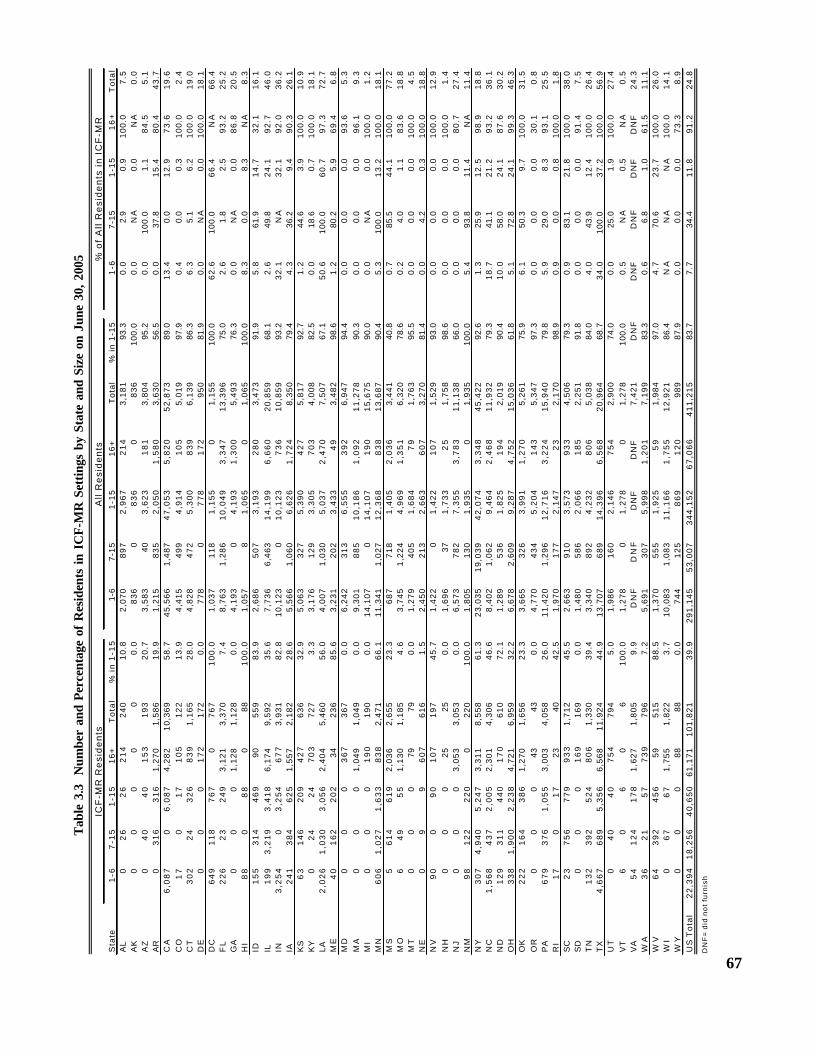
67
Tab
le 3
.3
Num
ber
and
Perc
enta
ge o
f R
esid
ents
in I
CF-
MR
Set
tings
by
Stat
e an
d Si
ze o
n Ju
ne 3
0, 2
005
Sta
te1
-67
-15
1-1
51
6+
To
tal
% i
n 1
-15
1-6
7-1
51
-15
16
+T
ota
l%
in
1-1
51
-67
-15
1-1
51
6+
To
tal
AL
02
62
62
14
24
01
0.8
2,0
70
89
72
,96
72
14
3,1
81
93.3
0.0
2.9
0.9
10
0.0
7.5
AK
00
00
00
.08
36
08
36
08
36
100.
00
.0N
A0
.0N
A0
.0A
Z0
40
40
15
31
93
20
.73
,58
340
3,6
23
18
13
,80
495
.20
.010
0.0
1.1
84
.55
.1A
R0
31
63
16
1,2
70
1,5
86
19
.91
,21
58
35
2,0
50
1,5
80
3,6
30
56.5
0.0
37.8
15
.48
0.4
43
.7C
A6
,08
70
6,0
87
4,2
82
10
,36
95
8.7
45
,56
61
,48
74
7,0
53
5,8
20
52
,87
389
.01
3.4
0.0
12
.97
3.6
19
.6C
O1
70
17
10
51
22
13
.94
,41
54
99
4,9
14
10
55
,01
997
.90
.40.
00
.31
00
.02
.4C
T3
02
24
32
68
39
1,1
65
28
.04
,82
84
72
5,3
00
83
96
,13
986
.36
.35.
16
.21
00
.01
9.0
DE
00
01
72
17
20
.07
78
07
78
17
29
50
81.9
0.0
NA
0.0
10
0.0
18
.1D
C6
49
11
87
67
07
67
10
0.0
1,0
37
11
81
,15
50
1,1
55
100.
06
2.6
100.
06
6.4
NA
66
.4F
L2
26
23
24
93
,12
13
,37
07
.48
,76
31
,28
61
0,0
49
3,3
47
13
,39
675
.02
.61.
82
.59
3.2
25
.2G
A0
00
1,1
28
1,1
28
0.0
4,1
93
04
,19
31
,30
05
,49
376
.30
.0N
A0
.08
6.8
20
.5H
I8
80
88
088
10
0.0
1,0
57
81
,06
50
1,0
65
100.
08
.30.
08
.3N
A8
.3ID
15
53
14
46
990
55
98
3.9
2,6
86
50
73
,19
32
80
3,4
73
91.9
5.8
61.9
14
.73
2.1
16
.1IL
19
93
,21
93
,41
86
,17
49
,59
23
5.6
7,7
36
6,4
63
14
,19
96
,66
02
0,8
59
68.1
2.6
49.8
24
.19
2.7
46
.0IN
3,2
54
03
,25
46
77
3,9
31
82
.81
0,1
23
01
0,1
23
73
61
0,8
59
93.2
32
.1N
A3
2.1
92
.03
6.2
IA2
41
38
46
25
1,5
57
2,1
82
28
.65
,56
61
,06
06
,62
61
,72
48
,35
079
.44
.336
.29
.49
0.3
26
.1K
S6
31
46
20
94
27
63
63
2.9
5,0
63
32
75
,39
04
27
5,8
17
92.7
1.2
44.6
3.9
10
0.0
10
.9K
Y0
24
24
70
37
27
3.3
3,1
76
12
93
,30
57
03
4,0
08
82.5
0.0
18.6
0.7
10
0.0
18
.1LA
2,0
26
1,0
30
3,0
56
2,4
04
5,4
60
56
.04
,00
71
,03
05
,03
72
,47
07
,50
767
.15
0.6
100.
06
0.7
97
.37
2.7
ME
40
16
22
02
342
36
85
.63
,23
12
02
3,4
33
49
3,4
82
98.6
1.2
80.2
5.9
69
.46
.8M
D0
00
36
73
67
0.0
6,2
42
31
36
,55
53
92
6,9
47
94.4
0.0
0.0
0.0
93
.65
.3M
A0
00
1,0
49
1,0
49
0.0
9,3
01
88
51
0,1
86
1,0
92
11
,27
890
.30
.00.
00
.09
6.1
9.3
MI
00
01
90
19
00
.01
4,1
07
01
4,1
07
19
01
5,6
75
90.0
0.0
NA
0.0
10
0.0
1.2
MN
60
61
,02
71
,63
38
38
2,4
71
66
.11
1,3
41
1,0
27
12
,36
88
38
13
,68
790
.45
.310
0.0
13
.21
00
.01
8.1
MS
56
14
61
92
,03
62
,65
52
3.3
68
77
18
1,4
05
2,0
36
3,4
41
40.8
0.7
85.5
44
.11
00
.07
7.2
MO
64
95
51
,13
01
,18
54
.63
,74
51
,22
44
,96
91
,35
16
,32
078
.60
.24.
01
.18
3.6
18
.8M
T0
00
7979
0.0
1,2
79
40
51
,68
47
91
,76
395
.50
.00.
00
.01
00
.04
.5N
E0
99
60
76
16
1.5
2,4
50
21
32
,66
36
07
3,2
70
81.4
0.0
4.2
0.3
10
0.0
18
.8N
V9
00
90
10
71
97
45
.71
,42
20
1,4
22
10
71
,52
993
.00
.00.
00
.01
00
.01
2.9
NH
00
025
250
.01
,69
637
1,7
33
25
1,7
58
98.6
0.0
0.0
0.0
10
0.0
1.4
NJ
00
03
,05
33
,05
30
.06
,57
37
82
7,3
55
3,7
83
11
,13
866
.00
.00.
00
.08
0.7
27
.4N
M9
81
22
22
00
22
01
00
.01
,80
51
30
1,9
35
01
,93
510
0.0
5.4
93.8
11
.4N
A1
1.4
NY
30
74
,94
05
,24
73
,31
18
,55
86
1.3
23
,03
51
9,0
39
42
,07
43
,34
84
5,4
22
92.6
1.3
25.9
12
.59
8.9
18
.8N
C1
,56
84
37
2,0
05
2,3
01
4,3
06
46
.68
,40
21
,06
29
,46
42
,46
81
1,9
32
79.3
18
.741
.12
1.2
93
.23
6.1
ND
12
93
11
44
01
70
61
07
2.1
1,2
89
53
61
,82
51
94
2,0
19
90.4
10
.058
.02
4.1
87
.63
0.2
OH
33
81
,90
02
,23
84
,72
16
,95
93
2.2
6,6
78
2,6
09
9,2
87
4,7
52
15
,03
661
.85
.172
.82
4.1
99
.34
6.3
OK
22
21
64
38
61
,27
01
,65
62
3.3
3,6
65
32
63
,99
11
,27
05
,26
175
.96
.150
.39
.71
00
.03
1.5
OR
00
043
430
.04
,77
04
34
5,2
04
14
35
,34
797
.30
.00.
00
.03
0.1
0.8
PA
67
93
76
1,0
55
3,0
03
4,0
58
26
.01
1,4
20
1,2
96
12
,71
63
,22
41
5,9
40
79.8
5.9
29.0
8.3
93
.12
5.5
RI
17
01
723
404
2.5
1,9
70
17
72
,14
72
32
,17
098
.90
.90.
00
.81
00
.01
.8S
C2
37
56
77
99
33
1,7
12
45
.52
,66
39
10
3,5
73
93
34
,50
679
.30
.983
.12
1.8
10
0.0
38
.0S
D0
00
16
91
69
0.0
1,4
80
58
62
,06
61
85
2,2
51
91.8
0.0
0.0
0.0
91
.47
.5T
N1
32
39
25
24
80
61
,33
03
9.4
3,3
40
89
24
,23
28
06
5,0
38
84.0
4.0
43.9
12
.41
00
.02
6.4
TX
4,6
67
68
95
,35
66
,56
81
1,9
24
44
.91
3,7
07
68
91
4,3
96
6,5
68
20
,96
468
.73
4.0
100.
03
7.2
10
0.0
56
.9U
T0
40
40
75
47
94
5.0
1,9
86
16
02
,14
67
54
2,9
00
74.0
0.0
25.0
1.9
10
0.0
27
.4V
T6
06
06
10
0.0
1,2
78
01
,27
80
1,2
78
100.
00
.5N
A0
.5N
A0
.5V
A5
41
24
17
81
,62
71
,80
59
.9D
NF
DN
FD
NF
DN
F7
,42
1D
NF
DN
FD
NF
DN
FD
NF
24
.3W
A3
62
15
77
39
79
67
.25
,69
13
07
5,9
98
1,2
01
7,1
99
83.3
0.6
6.8
1.0
61
.51
1.1
WV
64
39
24
56
595
15
88
.51
,37
05
55
1,9
25
59
1,9
84
97.0
4.7
70.6
23
.71
00
.02
6.0
WI
06
76
71
,75
51
,82
23
.71
0,0
83
1,0
83
11
,16
61
,75
51
2,9
21
86.4
NA
NA
NA
10
0.0
14
.1W
Y0
00
8888
0.0
74
41
25
86
91
20
98
987
.90
.00.
00
.07
3.3
8.9
US
To
tal
22
,39
41
8,2
56
40
,65
06
1,1
71
10
1,8
21
39
.92
91
,14
55
3,0
07
34
4,1
52
67
,06
64
11
,21
583
.77
.734
.41
1.8
91
.22
4.8
DN
F=
did
no
t fu
rnis
h
ICF
-MR
Re
sid
en
tsA
ll R
esi
de
nts
% o
f A
ll R
esi
de
nts
in
IC
F-M
R
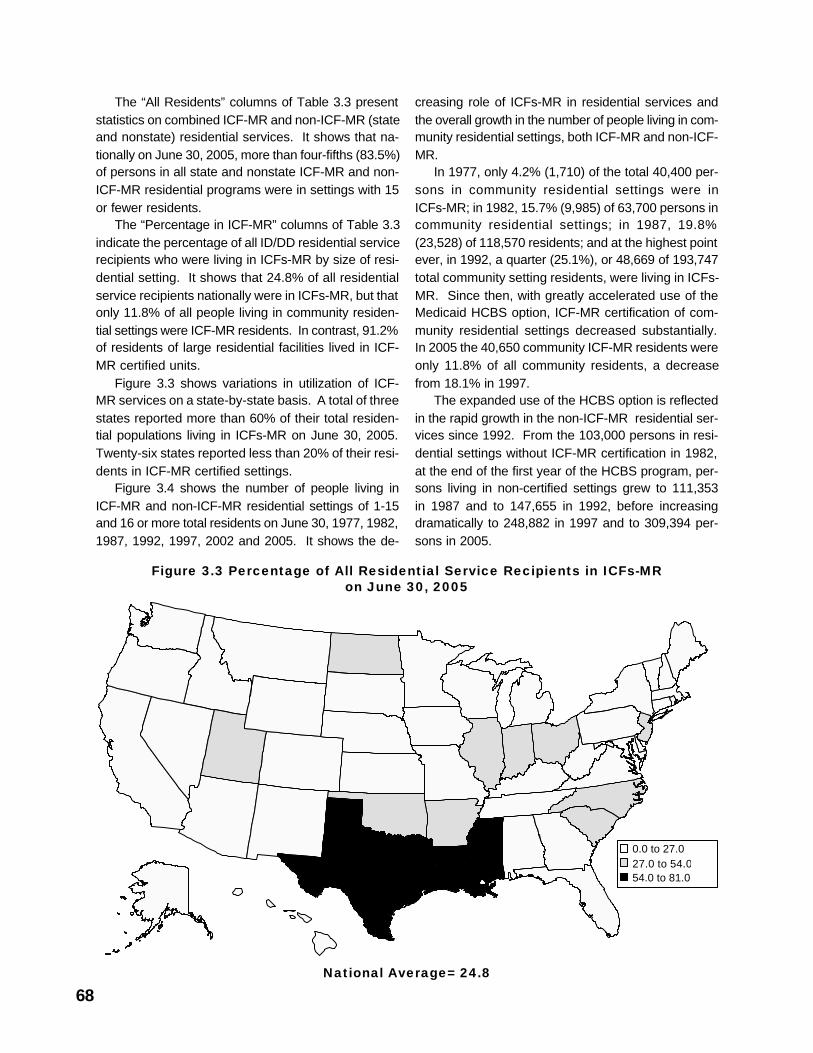
68
Figure 3.3 Percentage of All Residential Service Recipients in ICFs-MRon June 30, 2005
National Average= 24.8
The “All Residents” columns of Table 3.3 presentstatistics on combined ICF-MR and non-ICF-MR (stateand nonstate) residential services. It shows that na-tionally on June 30, 2005, more than four-fifths (83.5%)of persons in all state and nonstate ICF-MR and non-ICF-MR residential programs were in settings with 15or fewer residents.
The “Percentage in ICF-MR” columns of Table 3.3indicate the percentage of all ID/DD residential servicerecipients who were living in ICFs-MR by size of resi-dential setting. It shows that 24.8% of all residentialservice recipients nationally were in ICFs-MR, but thatonly 11.8% of all people living in community residen-tial settings were ICF-MR residents. In contrast, 91.2%of residents of large residential facilities lived in ICF-MR certified units.
Figure 3.3 shows variations in utilization of ICF-MR services on a state-by-state basis. A total of threestates reported more than 60% of their total residen-tial populations living in ICFs-MR on June 30, 2005.Twenty-six states reported less than 20% of their resi-dents in ICF-MR certified settings.
Figure 3.4 shows the number of people living inICF-MR and non-ICF-MR residential settings of 1-15and 16 or more total residents on June 30, 1977, 1982,1987, 1992, 1997, 2002 and 2005. It shows the de-
creasing role of ICFs-MR in residential services andthe overall growth in the number of people living in com-munity residential settings, both ICF-MR and non-ICF-MR.
In 1977, only 4.2% (1,710) of the total 40,400 per-sons in community residential settings were inICFs-MR; in 1982, 15.7% (9,985) of 63,700 persons incommunity residential settings; in 1987, 19.8%(23,528) of 118,570 residents; and at the highest pointever, in 1992, a quarter (25.1%), or 48,669 of 193,747total community setting residents, were living in ICFs-MR. Since then, with greatly accelerated use of theMedicaid HCBS option, ICF-MR certification of com-munity residential settings decreased substantially.In 2005 the 40,650 community ICF-MR residents wereonly 11.8% of all community residents, a decreasefrom 18.1% in 1997.
The expanded use of the HCBS option is reflectedin the rapid growth in the non-ICF-MR residential ser-vices since 1992. From the 103,000 persons in resi-dential settings without ICF-MR certification in 1982,at the end of the first year of the HCBS program, per-sons living in non-certified settings grew to 111,353in 1987 and to 147,655 in 1992, before increasingdramatically to 248,882 in 1997 and to 309,394 per-sons in 2005.
TX L A
MS 0.0 to 27.027.0 to 54.054.0 to 81.0
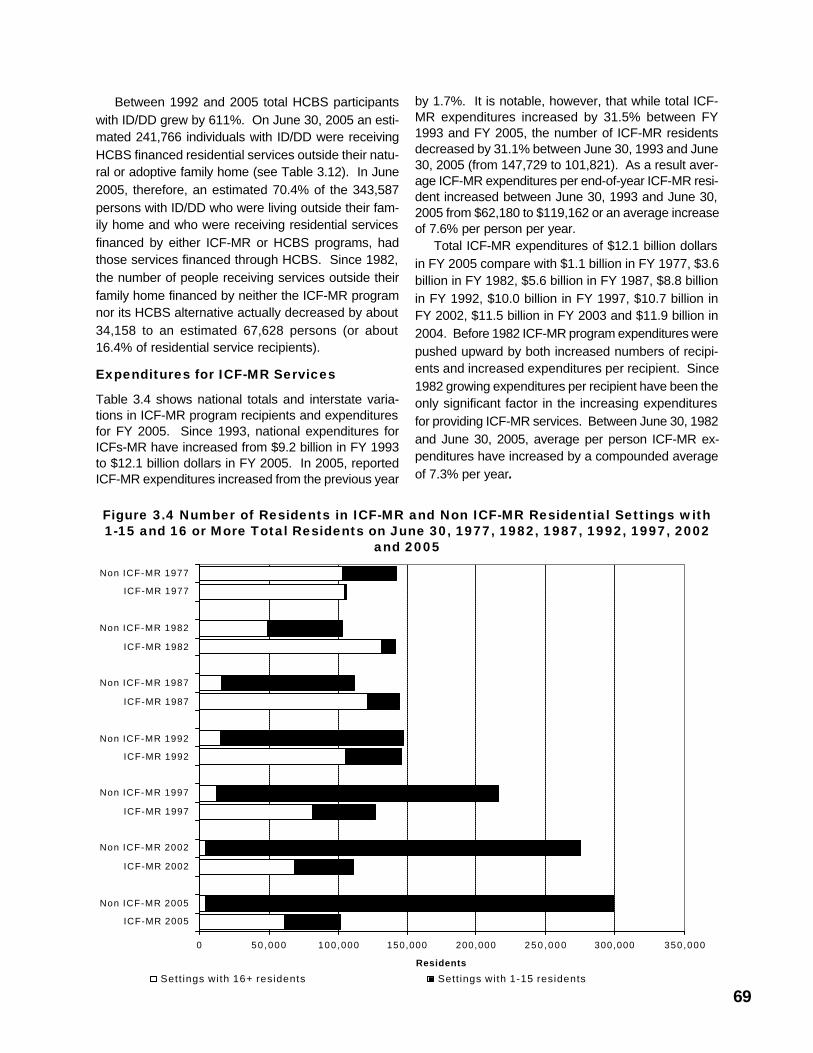
69
Between 1992 and 2005 total HCBS participantswith ID/DD grew by 611%. On June 30, 2005 an esti-mated 241,766 individuals with ID/DD were receivingHCBS financed residential services outside their natu-ral or adoptive family home (see Table 3.12). In June2005, therefore, an estimated 70.4% of the 343,587persons with ID/DD who were living outside their fam-ily home and who were receiving residential servicesfinanced by either ICF-MR or HCBS programs, hadthose services financed through HCBS. Since 1982,the number of people receiving services outside theirfamily home financed by neither the ICF-MR programnor its HCBS alternative actually decreased by about34,158 to an estimated 67,628 persons (or about16.4% of residential service recipients).
Expenditures for ICF-MR Services
Table 3.4 shows national totals and interstate varia-tions in ICF-MR program recipients and expendituresfor FY 2005. Since 1993, national expenditures forICFs-MR have increased from $9.2 billion in FY 1993to $12.1 billion dollars in FY 2005. In 2005, reportedICF-MR expenditures increased from the previous year
by 1.7%. It is notable, however, that while total ICF-MR expenditures increased by 31.5% between FY1993 and FY 2005, the number of ICF-MR residentsdecreased by 31.1% between June 30, 1993 and June30, 2005 (from 147,729 to 101,821). As a result aver-age ICF-MR expenditures per end-of-year ICF-MR resi-dent increased between June 30, 1993 and June 30,2005 from $62,180 to $119,162 or an average increaseof 7.6% per person per year.
Total ICF-MR expenditures of $12.1 billion dollarsin FY 2005 compare with $1.1 billion in FY 1977, $3.6billion in FY 1982, $5.6 billion in FY 1987, $8.8 billionin FY 1992, $10.0 billion in FY 1997, $10.7 billion inFY 2002, $11.5 billion in FY 2003 and $11.9 billion in2004. Before 1982 ICF-MR program expenditures werepushed upward by both increased numbers of recipi-ents and increased expenditures per recipient. Since1982 growing expenditures per recipient have been theonly significant factor in the increasing expendituresfor providing ICF-MR services. Between June 30, 1982and June 30, 2005, average per person ICF-MR ex-penditures have increased by a compounded averageof 7.3% per year.
Figure 3.4 Number of Residents in ICF-MR and Non ICF-MR Residential Settings with1-15 and 16 or More Total Residents on June 30, 1977, 1982, 1987, 1992, 1997, 2002
and 2005
0 50 ,000 100,000 150,000 200,000 250 ,000 300,000 350,000
ICF-MR 2005
Non ICF-MR 2005
ICF-MR 2002
Non ICF-MR 2002
ICF-MR 1997
Non ICF-MR 1997
ICF-MR 1992
Non ICF-MR 1992
ICF-MR 1987
Non ICF-MR 1987
ICF-MR 1982
Non ICF-MR 1982
ICF-MR 1977
Non ICF-MR 1977
Residents
Sett ings with 16+ residents Sett ings with 1-15 residents
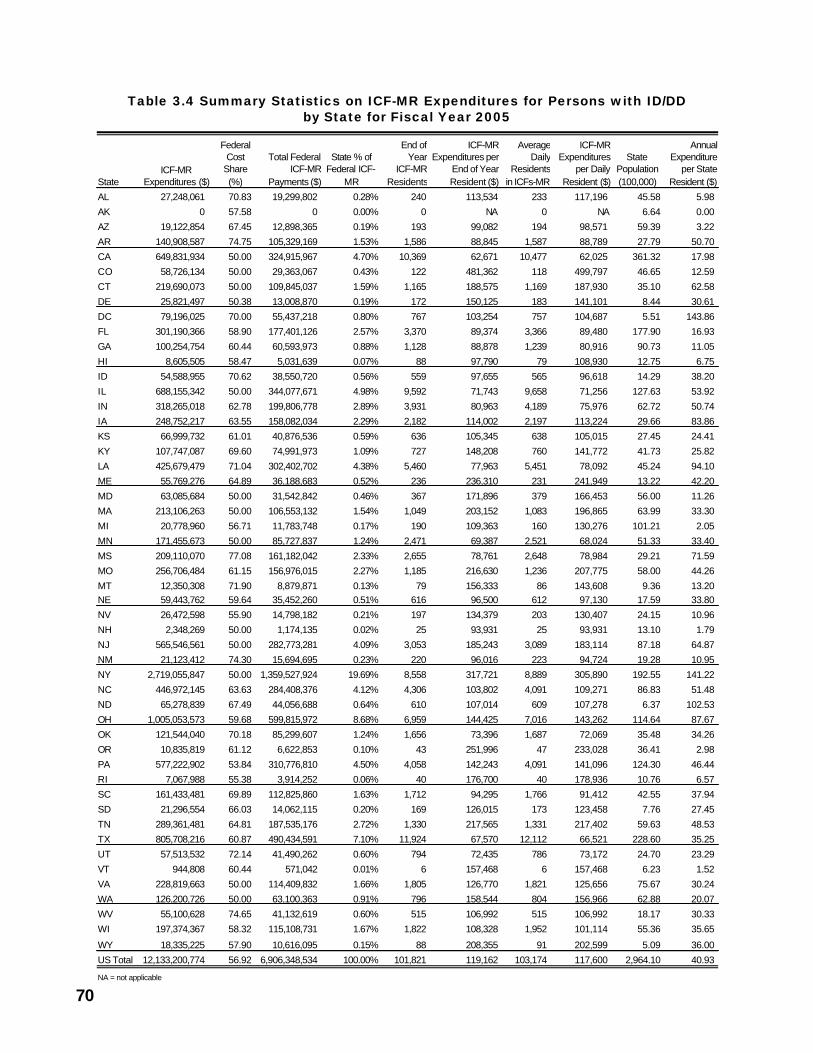
70
Table 3.4 Summary Statistics on ICF-MR Expenditures for Persons with ID/DDby State for Fiscal Year 2005
State
Federal Cost
Share (%)
Total Federal ICF-MR
Payments ($)
State % of Federal ICF-
MR
End of Year
ICF-MR Residents
ICF-MR Expenditures per
End of Year Resident ($)
Average Daily
Residents in ICFs-MR
ICF-MR Expenditures
per Daily Resident ($)
State Population (100,000)
Annual Expenditure
per State Resident ($)
AL 27,248,061 70.83 19,299,802 0.28% 240 113,534 233 117,196 45.58 5.98
AK 0 57.58 0 0.00% 0 NA 0 NA 6.64 0.00
AZ 19,122,854 67.45 12,898,365 0.19% 193 99,082 194 98,571 59.39 3.22
AR 140,908,587 74.75 105,329,169 1.53% 1,586 88,845 1,587 88,789 27.79 50.70
CA 649,831,934 50.00 324,915,967 4.70% 10,369 62,671 10,477 62,025 361.32 17.98
CO 58,726,134 50.00 29,363,067 0.43% 122 481,362 118 499,797 46.65 12.59
CT 219,690,073 50.00 109,845,037 1.59% 1,165 188,575 1,169 187,930 35.10 62.58
DE 25,821,497 50.38 13,008,870 0.19% 172 150,125 183 141,101 8.44 30.61
DC 79,196,025 70.00 55,437,218 0.80% 767 103,254 757 104,687 5.51 143.86
FL 301,190,366 58.90 177,401,126 2.57% 3,370 89,374 3,366 89,480 177.90 16.93
GA 100,254,754 60.44 60,593,973 0.88% 1,128 88,878 1,239 80,916 90.73 11.05
HI 8,605,505 58.47 5,031,639 0.07% 88 97,790 79 108,930 12.75 6.75
ID 54,588,955 70.62 38,550,720 0.56% 559 97,655 565 96,618 14.29 38.20
IL 688,155,342 50.00 344,077,671 4.98% 9,592 71,743 9,658 71,256 127.63 53.92
IN 318,265,018 62.78 199,806,778 2.89% 3,931 80,963 4,189 75,976 62.72 50.74
IA 248,752,217 63.55 158,082,034 2.29% 2,182 114,002 2,197 113,224 29.66 83.86
KS 66,999,732 61.01 40,876,536 0.59% 636 105,345 638 105,015 27.45 24.41
KY 107,747,087 69.60 74,991,973 1.09% 727 148,208 760 141,772 41.73 25.82
LA 425,679,479 71.04 302,402,702 4.38% 5,460 77,963 5,451 78,092 45.24 94.10
ME 55,769,276 64.89 36,188,683 0.52% 236 236,310 231 241,949 13.22 42.20
MD 63,085,684 50.00 31,542,842 0.46% 367 171,896 379 166,453 56.00 11.26
MA 213,106,263 50.00 106,553,132 1.54% 1,049 203,152 1,083 196,865 63.99 33.30
MI 20,778,960 56.71 11,783,748 0.17% 190 109,363 160 130,276 101.21 2.05
MN 171,455,673 50.00 85,727,837 1.24% 2,471 69,387 2,521 68,024 51.33 33.40
MS 209,110,070 77.08 161,182,042 2.33% 2,655 78,761 2,648 78,984 29.21 71.59
MO 256,706,484 61.15 156,976,015 2.27% 1,185 216,630 1,236 207,775 58.00 44.26
MT 12,350,308 71.90 8,879,871 0.13% 79 156,333 86 143,608 9.36 13.20NE 59,443,762 59.64 35,452,260 0.51% 616 96,500 612 97,130 17.59 33.80
NV 26,472,598 55.90 14,798,182 0.21% 197 134,379 203 130,407 24.15 10.96
NH 2,348,269 50.00 1,174,135 0.02% 25 93,931 25 93,931 13.10 1.79
NJ 565,546,561 50.00 282,773,281 4.09% 3,053 185,243 3,089 183,114 87.18 64.87
NM 21,123,412 74.30 15,694,695 0.23% 220 96,016 223 94,724 19.28 10.95
NY 2,719,055,847 50.00 1,359,527,924 19.69% 8,558 317,721 8,889 305,890 192.55 141.22
NC 446,972,145 63.63 284,408,376 4.12% 4,306 103,802 4,091 109,271 86.83 51.48
ND 65,278,839 67.49 44,056,688 0.64% 610 107,014 609 107,278 6.37 102.53
OH 1,005,053,573 59.68 599,815,972 8.68% 6,959 144,425 7,016 143,262 114.64 87.67
OK 121,544,040 70.18 85,299,607 1.24% 1,656 73,396 1,687 72,069 35.48 34.26
OR 10,835,819 61.12 6,622,853 0.10% 43 251,996 47 233,028 36.41 2.98
PA 577,222,902 53.84 310,776,810 4.50% 4,058 142,243 4,091 141,096 124.30 46.44
RI 7,067,988 55.38 3,914,252 0.06% 40 176,700 40 178,936 10.76 6.57
SC 161,433,481 69.89 112,825,860 1.63% 1,712 94,295 1,766 91,412 42.55 37.94
SD 21,296,554 66.03 14,062,115 0.20% 169 126,015 173 123,458 7.76 27.45
TN 289,361,481 64.81 187,535,176 2.72% 1,330 217,565 1,331 217,402 59.63 48.53
TX 805,708,216 60.87 490,434,591 7.10% 11,924 67,570 12,112 66,521 228.60 35.25
UT 57,513,532 72.14 41,490,262 0.60% 794 72,435 786 73,172 24.70 23.29
VT 944,808 60.44 571,042 0.01% 6 157,468 6 157,468 6.23 1.52
VA 228,819,663 50.00 114,409,832 1.66% 1,805 126,770 1,821 125,656 75.67 30.24
WA 126,200,726 50.00 63,100,363 0.91% 796 158,544 804 156,966 62.88 20.07
WV 55,100,628 74.65 41,132,619 0.60% 515 106,992 515 106,992 18.17 30.33
WI 197,374,367 58.32 115,108,731 1.67% 1,822 108,328 1,952 101,114 55.36 35.65
WY 18,335,225 57.90 10,616,095 0.15% 88 208,355 91 202,599 5.09 36.00
US Total 12,133,200,774 56.92 6,906,348,534 100.00% 101,821 119,162 103,174 117,600 2,964.10 40.93
NA = not applicable
ICF-MR Expenditures ($)
71
In addition to the changing patterns in overall ex-penditures, there has also been a substantial reduc-tion in the past decade in the per resident rate of in-crease in expenditures for ICF-MR care. While perrecipient expenditures in the 12 years between 1975and 1987 increased from $5,530 to $38,150 per year,overall ICF-MR expenditures remained relatively stableand average per resident cost inflation of ICFs-MR inthe past ten years (6.8% on average per year) wasless compared to other periods. For the most part,attention now given to Medicaid services by federaland state policy makers is directed toward issues ofsystemwide expenditures, quality, and equity of ac-cess. States have much more attended to the rapidlygrowing HCBS alternative as the program focus ofthese considerations. However, cost managementin ICF-MR services remains a major concern in a num-ber of states, and opportunities to reallocate ICF-MRexpenditures to more flexible and less costly HCBSand similar services have been of growing interest tostates. Between 1992 and 2005 that interest was ex-pressed in efforts to depopulate and close ICFs-MR,in efforts to simply “decertify” community ICFs-MR tofinance them under HCBS, and in the explosive growthin HCBS enrollments (610.6% increase) as ICF-MRpopulations decreased by 30.4%.
Interstate Variations in ICF-MRExpenditures
There are major differences between states in theirexpenditures for ICF-MR services. The variability instate ICF-MR expenditures, and federal contributionsto those expenditures, is by no means predictablesolely by general factors such as total ICF-MR resi-dents or state size. Table 3.4 presents FY 2005 sta-tistics for ICF-MR expenditures across the states. Itshows total expenditures, federal expenditures, perrecipient average annual expenditures, per capitaannual ICF-MR expenditures (ICF-MR expendituresper resident of the state), and each state’s proportionof the total federal ICF-MR expenditures.
Per capita cost variations. One indicator of thevariation among states in ICF-MR expenditures is theaverage expenditure for ICF-MR services per resi-dent of the state. Table 3.4 shows the great variationin these expenditures among the states. While na-tionally in FY 2005 the average daily expenditure forICF-MR services was $40.93 per U.S. resident, theaverage varied from well over three times the nationalaverage in the District of Columbia and New York to
less than one-third the national average in fourteenstates with ICFs-MR (Alabama, Arizona, Colorado,Georgia, Hawaii, Maryland, Michigan, Montana, Ne-vada, New Hampshire, New Mexico, Oregon, RhodeIsland and Vermont). The variability in total and perresident expenditures among states is affected by twomajor factors: the number of people living in ICFs-MRand the amount spent per resident.
Variations due to disproportionate placements.Variations in ICF-MR utilization rates across stateshave a direct effect on interstate differences in totalexpenditures and federal contributions. As an ex-ample of the variability, on June 30, 2005, three stateshoused more than 60% of their total residential carepopulation in ICF-MR certified settings, and 30 stateshoused 20% or less of their residents in ICFs-MR.Obviously states with disproportionately high place-ment rates tended to account for disproportionateamounts of total ICF-MR expenditures.
Variations in per resident costs. Average cost ex-pended per ICF-MR resident is also a key factor intotal expenditures. Table 3.4 shows the enormousvariations among states in the average per residentexpenditures for ICFs-MR. The national average ex-penditures for ICF-MR services per recipient in FY 2005(total ICF-MR expenditures in the year divided by thenumber of average daily recipients in 2005) was$117,600 per year. Among the states with the highestper recipient expenditures in 2005 were Colorado($499,797), Maine ($241,949), Missouri ($207,775),New York ($305,890), Oregon ($233,028), Tennessee($217,402) and Wyoming ($202,599). Among thestates with the lowest per recipient expenditures wereCalifornia ($62,025), Illinois ($71,256), Minnesota($68,024), Oklahoma ($72,069) and Texas ($66,521).The effects of relatively high per resident expendituresare straightforward. Colorado, New York and Oregonhad 8.7% of all ICF-MR average daily residents in FY05,but accounted for 23.0% of total FY 2005 ICF-MR ex-penditures.
Medicaid HCBS Recipients
The Medicaid Home and Community Based Services(HCBS) program is associated with the ICF-MR pro-gram through its dedication to persons who but forthe services available through the Medicaid HCBSprogram would be at risk of placement in an ICF-MR.Between enactment of the Medicaid HCBS programin 1981 and June 30, 2005, all states have receivedauthorization to provide Home and Community BasedServices as an alternative to ICF-MR services. Thisgrowth in state participation is shown in Table 3.5.
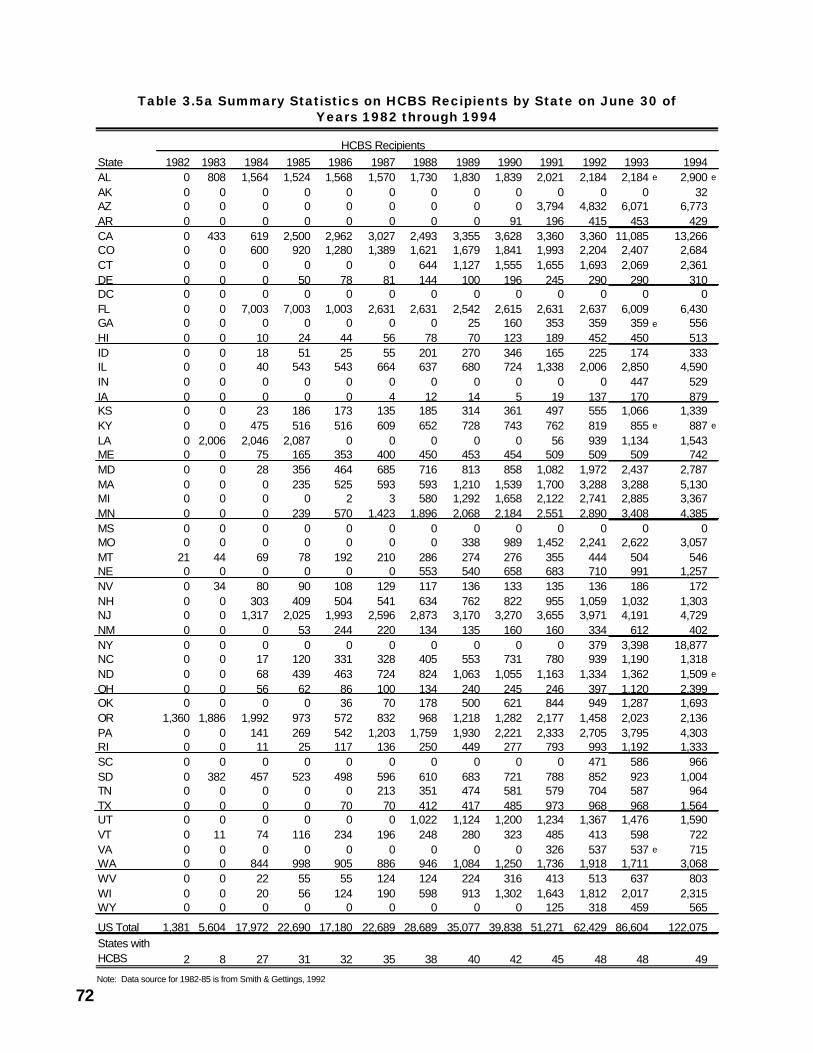
72
Table 3.5a Summary Statistics on HCBS Recipients by State on June 30 ofYears 1982 through 1994
HCBS RecipientsState 1982 1983 1984 1985 1986 1987 1988 1989 1990 1991 1992 1993 1994AL 0 808 1,564 1,524 1,568 1,570 1,730 1,830 1,839 2,021 2,184 2,184 e 2,900 e
AK 0 0 0 0 0 0 0 0 0 0 0 0 32AZ 0 0 0 0 0 0 0 0 0 3,794 4,832 6,071 6,773AR 0 0 0 0 0 0 0 0 91 196 415 453 429CA 0 433 619 2,500 2,962 3,027 2,493 3,355 3,628 3,360 3,360 11,085 13,266CO 0 0 600 920 1,280 1,389 1,621 1,679 1,841 1,993 2,204 2,407 2,684CT 0 0 0 0 0 0 644 1,127 1,555 1,655 1,693 2,069 2,361DE 0 0 0 50 78 81 144 100 196 245 290 290 310DC 0 0 0 0 0 0 0 0 0 0 0 0 0FL 0 0 7,003 7,003 1,003 2,631 2,631 2,542 2,615 2,631 2,637 6,009 6,430GA 0 0 0 0 0 0 0 25 160 353 359 359 e 556HI 0 0 10 24 44 56 78 70 123 189 452 450 513ID 0 0 18 51 25 55 201 270 346 165 225 174 333IL 0 0 40 543 543 664 637 680 724 1,338 2,006 2,850 4,590IN 0 0 0 0 0 0 0 0 0 0 0 447 529IA 0 0 0 0 0 4 12 14 5 19 137 170 879KS 0 0 23 186 173 135 185 314 361 497 555 1,066 1,339KY 0 0 475 516 516 609 652 728 743 762 819 855 e 887 e
LA 0 2,006 2,046 2,087 0 0 0 0 0 56 939 1,134 1,543ME 0 0 75 165 353 400 450 453 454 509 509 509 742MD 0 0 28 356 464 685 716 813 858 1,082 1,972 2,437 2,787MA 0 0 0 235 525 593 593 1,210 1,539 1,700 3,288 3,288 5,130MI 0 0 0 0 2 3 580 1,292 1,658 2,122 2,741 2,885 3,367MN 0 0 0 239 570 1,423 1,896 2,068 2,184 2,551 2,890 3,408 4,385MS 0 0 0 0 0 0 0 0 0 0 0 0 0MO 0 0 0 0 0 0 0 338 989 1,452 2,241 2,622 3,057MT 21 44 69 78 192 210 286 274 276 355 444 504 546NE 0 0 0 0 0 0 553 540 658 683 710 991 1,257NV 0 34 80 90 108 129 117 136 133 135 136 186 172NH 0 0 303 409 504 541 634 762 822 955 1,059 1,032 1,303NJ 0 0 1,317 2,025 1,993 2,596 2,873 3,170 3,270 3,655 3,971 4,191 4,729NM 0 0 0 53 244 220 134 135 160 160 334 612 402NY 0 0 0 0 0 0 0 0 0 0 379 3,398 18,877NC 0 0 17 120 331 328 405 553 731 780 939 1,190 1,318ND 0 0 68 439 463 724 824 1,063 1,055 1,163 1,334 1,362 1,509 e
OH 0 0 56 62 86 100 134 240 245 246 397 1,120 2,399OK 0 0 0 0 36 70 178 500 621 844 949 1,287 1,693OR 1,360 1,886 1,992 973 572 832 968 1,218 1,282 2,177 1,458 2,023 2,136PA 0 0 141 269 542 1,203 1,759 1,930 2,221 2,333 2,705 3,795 4,303RI 0 0 11 25 117 136 250 449 277 793 993 1,192 1,333SC 0 0 0 0 0 0 0 0 0 0 471 586 966SD 0 382 457 523 498 596 610 683 721 788 852 923 1,004TN 0 0 0 0 0 213 351 474 581 579 704 587 964TX 0 0 0 0 70 70 412 417 485 973 968 968 1,564UT 0 0 0 0 0 0 1,022 1,124 1,200 1,234 1,367 1,476 1,590VT 0 11 74 116 234 196 248 280 323 485 413 598 722VA 0 0 0 0 0 0 0 0 0 326 537 537 e 715WA 0 0 844 998 905 886 946 1,084 1,250 1,736 1,918 1,711 3,068WV 0 0 22 55 55 124 124 224 316 413 513 637 803WI 0 0 20 56 124 190 598 913 1,302 1,643 1,812 2,017 2,315WY 0 0 0 0 0 0 0 0 0 125 318 459 565
US Total 1,381 5,604 17,972 22,690 17,180 22,689 28,689 35,077 39,838 51,271 62,429 86,604 122,075States with HCBS 2 8 27 31 32 35 38 40 42 45 48 48 49
Note: Data source for 1982-85 is from Smith & Gettings, 1992
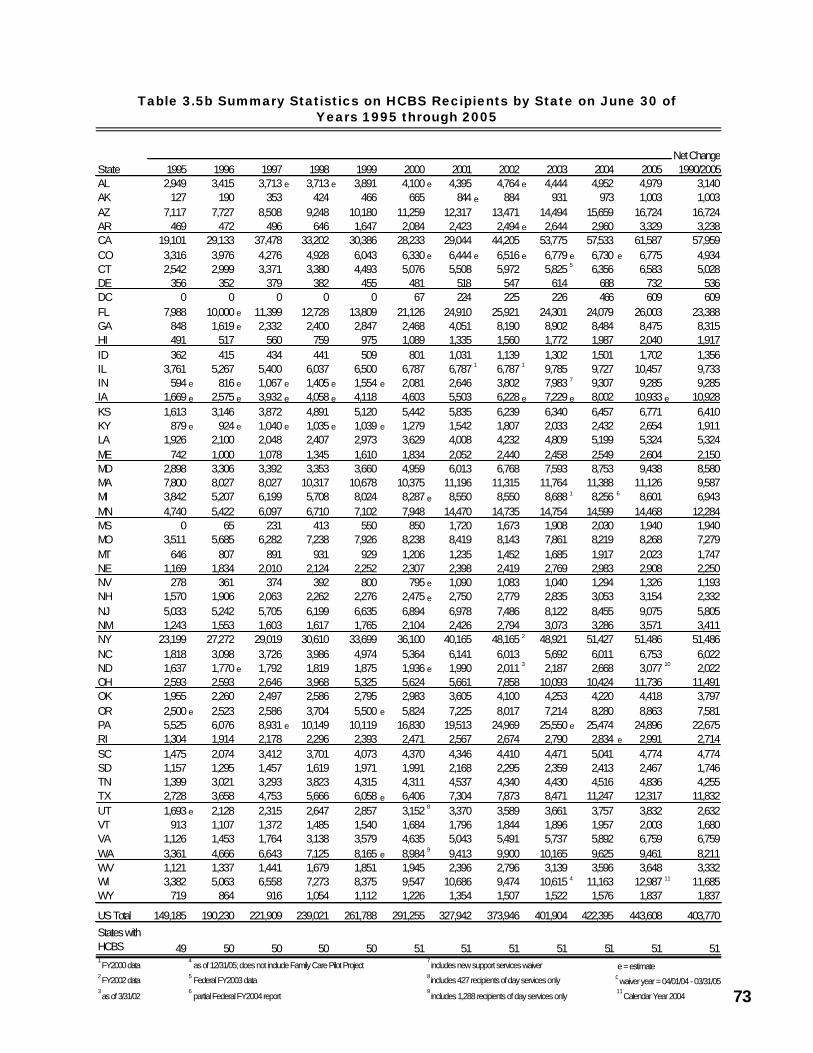
73
Table 3.5b Summary Statistics on HCBS Recipients by State on June 30 ofYears 1995 through 2005
State 1995 1996 1997 1998 1999 2000 2001 2002 2003 2004 2005AL 2,949 3,415 3,713 e 3,713 e 3,891 4,100 e 4,395 4,764 e 4,444 4,952 4,979 3,140AK 127 190 353 424 466 665 844 e 884 931 973 1,003 1,003AZ 7,117 7,727 8,508 9,248 10,180 11,259 12,317 13,471 14,494 15,659 16,724 16,724AR 469 472 496 646 1,647 2,084 2,423 2,494 e 2,644 2,960 3,329 3,238CA 19,101 29,133 37,478 33,202 30,386 28,233 29,044 44,205 53,775 57,533 61,587 57,959CO 3,316 3,976 4,276 4,928 6,043 6,330 e 6,444 e 6,516 e 6,779 e 6,730 e 6,775 4,934CT 2,542 2,999 3,371 3,380 4,493 5,076 5,508 5,972 5,825 5 6,356 6,583 5,028DE 356 352 379 382 455 481 518 547 614 688 732 536DC 0 0 0 0 0 67 224 225 226 466 609 609FL 7,988 10,000 e 11,399 12,728 13,809 21,126 24,910 25,921 24,301 24,079 26,003 23,388GA 848 1,619 e 2,332 2,400 2,847 2,468 4,051 8,190 8,902 8,484 8,475 8,315HI 491 517 560 759 975 1,089 1,335 1,560 1,772 1,987 2,040 1,917ID 362 415 434 441 509 801 1,031 1,139 1,302 1,501 1,702 1,356IL 3,761 5,267 5,400 6,037 6,500 6,787 6,787 1 6,787 1 9,785 9,727 10,457 9,733IN 594 e 816 e 1,067 e 1,405 e 1,554 e 2,081 2,646 3,802 7,983 7 9,307 9,285 9,285IA 1,669 e 2,575 e 3,932 e 4,058 e 4,118 4,603 5,503 6,228 e 7,229 e 8,002 10,933 e 10,928KS 1,613 3,146 3,872 4,891 5,120 5,442 5,835 6,239 6,340 6,457 6,771 6,410KY 879 e 924 e 1,040 e 1,035 e 1,039 e 1,279 1,542 1,807 2,033 2,432 2,654 1,911LA 1,926 2,100 2,048 2,407 2,973 3,629 4,008 4,232 4,809 5,199 5,324 5,324ME 742 1,000 1,078 1,345 1,610 1,834 2,052 2,440 2,458 2,549 2,604 2,150MD 2,898 3,306 3,392 3,353 3,660 4,959 6,013 6,768 7,593 8,753 9,438 8,580MA 7,800 8,027 8,027 10,317 10,678 10,375 11,196 11,315 11,764 11,388 11,126 9,587MI 3,842 5,207 6,199 5,708 8,024 8,287 e 8,550 8,550 8,688 1 8,256 6 8,601 6,943MN 4,740 5,422 6,097 6,710 7,102 7,948 14,470 14,735 14,754 14,599 14,468 12,284MS 0 65 231 413 550 850 1,720 1,673 1,908 2,030 1,940 1,940MO 3,511 5,685 6,282 7,238 7,926 8,238 8,419 8,143 7,861 8,219 8,268 7,279MT 646 807 891 931 929 1,206 1,235 1,452 1,685 1,917 2,023 1,747NE 1,169 1,834 2,010 2,124 2,252 2,307 2,398 2,419 2,769 2,983 2,908 2,250NV 278 361 374 392 800 795 e 1,090 1,083 1,040 1,294 1,326 1,193NH 1,570 1,906 2,063 2,262 2,276 2,475 e 2,750 2,779 2,835 3,053 3,154 2,332NJ 5,033 5,242 5,705 6,199 6,635 6,894 6,978 7,486 8,122 8,455 9,075 5,805NM 1,243 1,553 1,603 1,617 1,765 2,104 2,426 2,794 3,073 3,286 3,571 3,411NY 23,199 27,272 29,019 30,610 33,699 36,100 40,165 48,165 2 48,921 51,427 51,486 51,486NC 1,818 3,098 3,726 3,986 4,974 5,364 6,141 6,013 5,692 6,011 6,753 6,022ND 1,637 1,770 e 1,792 1,819 1,875 1,936 e 1,990 2,011 3 2,187 2,668 3,077 10 2,022OH 2,593 2,593 2,646 3,968 5,325 5,624 5,661 7,858 10,093 10,424 11,736 11,491OK 1,955 2,260 2,497 2,586 2,795 2,983 3,605 4,100 4,253 4,220 4,418 3,797OR 2,500 e 2,523 2,586 3,704 5,500 e 5,824 7,225 8,017 7,214 8,280 8,863 7,581PA 5,525 6,076 8,931 e 10,149 10,119 16,830 19,513 24,969 25,550 e 25,474 24,896 22,675RI 1,304 1,914 2,178 2,296 2,393 2,471 2,567 2,674 2,790 2,834 e 2,991 2,714SC 1,475 2,074 3,412 3,701 4,073 4,370 4,346 4,410 4,471 5,041 4,774 4,774SD 1,157 1,295 1,457 1,619 1,971 1,991 2,168 2,295 2,359 2,413 2,467 1,746TN 1,399 3,021 3,293 3,823 4,315 4,311 4,537 4,340 4,430 4,516 4,836 4,255TX 2,728 3,658 4,753 5,666 6,058 e 6,406 7,304 7,873 8,471 11,247 12,317 11,832UT 1,693 e 2,128 2,315 2,647 2,857 3,152 8 3,370 3,589 3,661 3,757 3,832 2,632VT 913 1,107 1,372 1,485 1,540 1,684 1,796 1,844 1,896 1,957 2,003 1,680VA 1,126 1,453 1,764 3,138 3,579 4,635 5,043 5,491 5,737 5,892 6,759 6,759WA 3,361 4,666 6,643 7,125 8,165 e 8,984 9 9,413 9,900 10,165 9,625 9,461 8,211WV 1,121 1,337 1,441 1,679 1,851 1,945 2,396 2,796 3,139 3,596 3,648 3,332WI 3,382 5,063 6,558 7,273 8,375 9,547 10,686 9,474 10,615 4 11,163 12,987 11 11,685WY 719 864 916 1,054 1,112 1,226 1,354 1,507 1,522 1,576 1,837 1,837
US Total 149,185 190,230 221,909 239,021 261,788 291,255 327,942 373,946 401,904 422,395 443,608 403,770States with HCBS 49 50 50 50 50 51 51 51 51 51 51 511 FY2000 data
4 as of 12/31/05; does not include Family Care Pilot Project
7 includes new support services waiver e = estimate
2 FY2002 data 5 Federal FY2003 data 8 includes 427 recipients of day services only3 as of 3/31/02
6 partial Federal FY2004 report
9 includes 1,288 recipients of day services only
11 Calendar Year 2004
10 waiver year = 04/01/04 - 03/31/05
Net Change 1990/2005

74
At the end of the HCBS program’s first year onJune 30, 1982, there were 1,381 HCBS program par-ticipants. By June 30, 1987 there were 22,689 HCBSrecipients. On June 30, 1992 there were 62,429 per-sons with ID/DD receiving Medicaid Home and Com-munity Based Services. In just two years betweenJune 30, 1992 and June 30, 1994, states nearlydoubled again the number of HCBS recipients, with anincrease of 95.5% to 122,075 residents. Between June1994 and June 1996 HCBS recipients increased by55.8% to 190,230 persons. Between June 30, 1996and June 30, 1999 HCBS recipients increased another37.6% to a total of 261,788 persons. Between June30, 1999 and June 30, 2005 HCBS recipients increasedby 181,820 (69.5%) to 443,608 individuals.
States with the greatest increase in total recipi-ents between June 1990 to June 2005 were California(57,959), Florida (23,388), New York (51,486), andPennsylvania (22,675). Between June 1990 and June2005, all states more than doubled HCBS recipients.
Expenditures for HCBS Recipients
Table 3.6 shows the total annual Medicaid expendi-tures for HCBS by state and national totals in each ofthe FYs 1987 through 2005. In the eighteen yearsbetween June 30, 1987 and June 30, 2005, the num-ber of states providing HCBS increased from 35 to 51.During the same period, HCBS expenditures increasedfrom $293,938,668 to $17,158,367,282 (5,737.4%) asthe number of HCBS recipients rose from 22,689 to443,608 recipients (1,855.2%). New York’s HCBS ex-penditures of $3,159,343,756 (18.4% of the U.S. total)were the highest among all the states in 2005. Bycontrast, in 1987, California led all states with HCBSexpenditures of $42,499,500 (14.5% of the U.S. total).
Table 3.7 presents FY 2005 statistics for HCBSexpenditures across states including total expendi-tures, federal expenditures, per participant averageannual expenditures, per capita annual HCBS expen-ditures (HCBS expenditures per resident of the state),and each state’s proportion of the federal HCBS ex-penditures. FY 2005 HCBS expenditures were$17,158,367,282 for 443,608 end-of-year HCBS recipi-ents. FY 2005 expenditures divided by end of yearHCBS recipients yielded an “average” cost per recipi-ent of $38,679. Because large numbers of personswere being added to the HCBS program during FY2005, this statistic underestimates the annualized av-
erage cost. Assuming persons were being added tothe HCBS program at an even rate all through the year,the estimated average number of HCBS participantsduring the year was 432,684. This yields an annual-ized average expenditure of $39,627. The unadjusted“average” HCBS expenditure of $38,679 represents a82.1% increase over June 30, 1990, when HCBS ex-penditures were 846 million dollars for 36,564 recipi-ents or $21,236 per recipient.
Per capita cost variations. Table 3.7 shows the varia-tion among states in HCBS expenditures per citizenof the state. Nationally, in FY 2005, the average dailyexpenditure for HCBS per citizen was $57.89. Theaverage varied from more than twice the national aver-age in eight states (Connecticut, Maine, Minnesota,New Mexico, New York, Rhode Island, Vermont andWyoming) to one-third or less of the national averagein four states (District of Columbia, Mississippi, Ne-vada, and Texas). The variability in total and per citi-zen expenditures among states is affected by boththe number of persons who received HCBS and theamount of money spent per recipient.
Variations due to differences in per recipient ex-penditures. The average expenditures per HCBSparticipant is also a key factor in interstate differencesin total expenditures. Table 3.7 shows the substan-tial variations among the states in the average perparticipant expenditures. The national average ex-penditures for HCBS per recipient in FY 2005 (totalHCBS expenditures divided by average daily recipi-ents) was $39,627. Among the states with the high-est per recipient expenditures in 2005 were Alaska($63,775), Connecticut ($65,123), Delaware ($75,843),Maine ($75,751), New Mexico ($64,967), Rhode Is-land ($74,006) and Tennessee ($76,226). The stateswith the lowest per recipient expenditures were Cali-fornia ($19,907), District of Columbia ($16,897) andMississippi ($18,388).
Variations due to disproportionate HCBS use .Variations in HCBS utilization rates across states havean important direct effect on interstate differences intotal and per capita expenditures. Nationally, on June30, 2005, HCBS recipients were 81.3% of the totalHCBS and ICF-MR recipient population. In two statesHCBS recipients made up less than 45% of combinedHCBS and ICF-MR recipients, while in 19 states HCBSrecipients were more than 90% of the total HCBS andICF-MR populations.
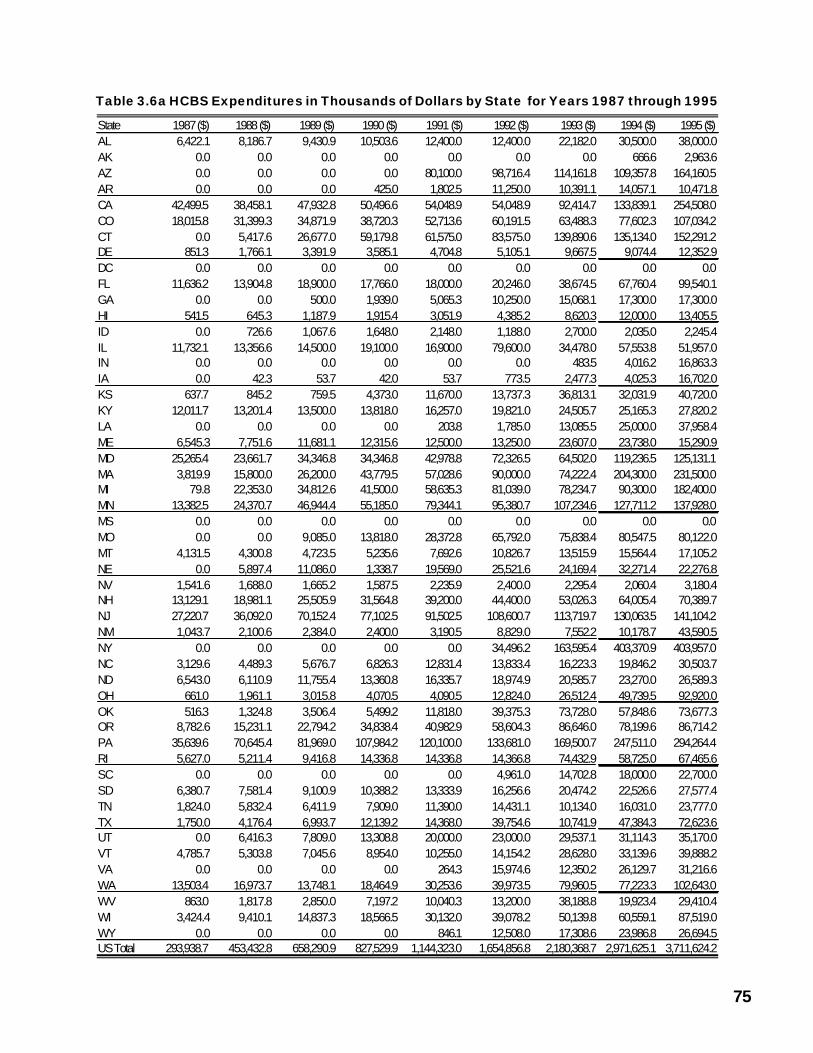
75
Table 3.6a HCBS Expenditures in Thousands of Dollars by State for Years 1987 through 1995
State 1987 ($) 1988 ($) 1989 ($) 1990 ($) 1991 ($) 1992 ($) 1993 ($) 1994 ($) 1995 ($)AL 6,422.1 8,186.7 9,430.9 10,503.6 12,400.0 12,400.0 22,182.0 30,500.0 38,000.0AK 0.0 0.0 0.0 0.0 0.0 0.0 0.0 666.6 2,963.6AZ 0.0 0.0 0.0 0.0 80,100.0 98,716.4 114,161.8 109,357.8 164,160.5AR 0.0 0.0 0.0 425.0 1,802.5 11,250.0 10,391.1 14,057.1 10,471.8CA 42,499.5 38,458.1 47,932.8 50,496.6 54,048.9 54,048.9 92,414.7 133,839.1 254,508.0CO 18,015.8 31,399.3 34,871.9 38,720.3 52,713.6 60,191.5 63,488.3 77,602.3 107,034.2CT 0.0 5,417.6 26,677.0 59,179.8 61,575.0 83,575.0 139,890.6 135,134.0 152,291.2DE 851.3 1,766.1 3,391.9 3,585.1 4,704.8 5,105.1 9,667.5 9,074.4 12,352.9DC 0.0 0.0 0.0 0.0 0.0 0.0 0.0 0.0 0.0FL 11,636.2 13,904.8 18,900.0 17,766.0 18,000.0 20,246.0 38,674.5 67,760.4 99,540.1GA 0.0 0.0 500.0 1,939.0 5,065.3 10,250.0 15,068.1 17,300.0 17,300.0HI 541.5 645.3 1,187.9 1,915.4 3,051.9 4,385.2 8,620.3 12,000.0 13,405.5ID 0.0 726.6 1,067.6 1,648.0 2,148.0 1,188.0 2,700.0 2,035.0 2,245.4IL 11,732.1 13,356.6 14,500.0 19,100.0 16,900.0 79,600.0 34,478.0 57,553.8 51,957.0IN 0.0 0.0 0.0 0.0 0.0 0.0 483.5 4,016.2 16,863.3IA 0.0 42.3 53.7 42.0 53.7 773.5 2,477.3 4,025.3 16,702.0KS 637.7 845.2 759.5 4,373.0 11,670.0 13,737.3 36,813.1 32,031.9 40,720.0KY 12,011.7 13,201.4 13,500.0 13,818.0 16,257.0 19,821.0 24,505.7 25,165.3 27,820.2LA 0.0 0.0 0.0 0.0 203.8 1,785.0 13,085.5 25,000.0 37,958.4ME 6,545.3 7,751.6 11,681.1 12,315.6 12,500.0 13,250.0 23,607.0 23,738.0 15,290.9MD 25,265.4 23,661.7 34,346.8 34,346.8 42,978.8 72,326.5 64,502.0 119,236.5 125,131.1MA 3,819.9 15,800.0 26,200.0 43,779.5 57,028.6 90,000.0 74,222.4 204,300.0 231,500.0MI 79.8 22,353.0 34,812.6 41,500.0 58,635.3 81,039.0 78,234.7 90,300.0 182,400.0MN 13,382.5 24,370.7 46,944.4 55,185.0 79,344.1 95,380.7 107,234.6 127,711.2 137,928.0MS 0.0 0.0 0.0 0.0 0.0 0.0 0.0 0.0 0.0MO 0.0 0.0 9,085.0 13,818.0 28,372.8 65,792.0 75,838.4 80,547.5 80,122.0MT 4,131.5 4,300.8 4,723.5 5,235.6 7,692.6 10,826.7 13,515.9 15,564.4 17,105.2NE 0.0 5,897.4 11,086.0 1,338.7 19,569.0 25,521.6 24,169.4 32,271.4 22,276.8NV 1,541.6 1,688.0 1,665.2 1,587.5 2,235.9 2,400.0 2,295.4 2,060.4 3,180.4NH 13,129.1 18,981.1 25,505.9 31,564.8 39,200.0 44,400.0 53,026.3 64,005.4 70,389.7NJ 27,220.7 36,092.0 70,152.4 77,102.5 91,502.5 108,600.7 113,719.7 130,063.5 141,104.2NM 1,043.7 2,100.6 2,384.0 2,400.0 3,190.5 8,829.0 7,552.2 10,178.7 43,590.5NY 0.0 0.0 0.0 0.0 0.0 34,496.2 163,595.4 403,370.9 403,957.0NC 3,129.6 4,489.3 5,676.7 6,826.3 12,831.4 13,833.4 16,223.3 19,846.2 30,503.7ND 6,543.0 6,110.9 11,755.4 13,360.8 16,335.7 18,974.9 20,585.7 23,270.0 26,589.3OH 661.0 1,961.1 3,015.8 4,070.5 4,090.5 12,824.0 26,512.4 49,739.5 92,920.0OK 516.3 1,324.8 3,506.4 5,499.2 11,818.0 39,375.3 73,728.0 57,848.6 73,677.3OR 8,782.6 15,231.1 22,794.2 34,838.4 40,982.9 58,604.3 86,646.0 78,199.6 86,714.2PA 35,639.6 70,645.4 81,969.0 107,984.2 120,100.0 133,681.0 169,500.7 247,511.0 294,264.4RI 5,627.0 5,211.4 9,416.8 14,336.8 14,336.8 14,366.8 74,432.9 58,725.0 67,465.6SC 0.0 0.0 0.0 0.0 0.0 4,961.0 14,702.8 18,000.0 22,700.0SD 6,380.7 7,581.4 9,100.9 10,388.2 13,333.9 16,256.6 20,474.2 22,526.6 27,577.4TN 1,824.0 5,832.4 6,411.9 7,909.0 11,390.0 14,431.1 10,134.0 16,031.0 23,777.0TX 1,750.0 4,176.4 6,993.7 12,139.2 14,368.0 39,754.6 10,741.9 47,384.3 72,623.6UT 0.0 6,416.3 7,809.0 13,308.8 20,000.0 23,000.0 29,537.1 31,114.3 35,170.0VT 4,785.7 5,303.8 7,045.6 8,954.0 10,255.0 14,154.2 28,628.0 33,139.6 39,888.2VA 0.0 0.0 0.0 0.0 264.3 15,974.6 12,350.2 26,129.7 31,216.6WA 13,503.4 16,973.7 13,748.1 18,464.9 30,253.6 39,973.5 79,960.5 77,223.3 102,643.0WV 863.0 1,817.8 2,850.0 7,197.2 10,040.3 13,200.0 38,188.8 19,923.4 29,410.4WI 3,424.4 9,410.1 14,837.3 18,566.5 30,132.0 39,078.2 50,139.8 60,559.1 87,519.0WY 0.0 0.0 0.0 0.0 846.1 12,508.0 17,308.6 23,986.8 26,694.5US Total 293,938.7 453,432.8 658,290.9 827,529.9 1,144,323.0 1,654,856.8 2,180,368.7 2,971,625.1 3,711,624.2
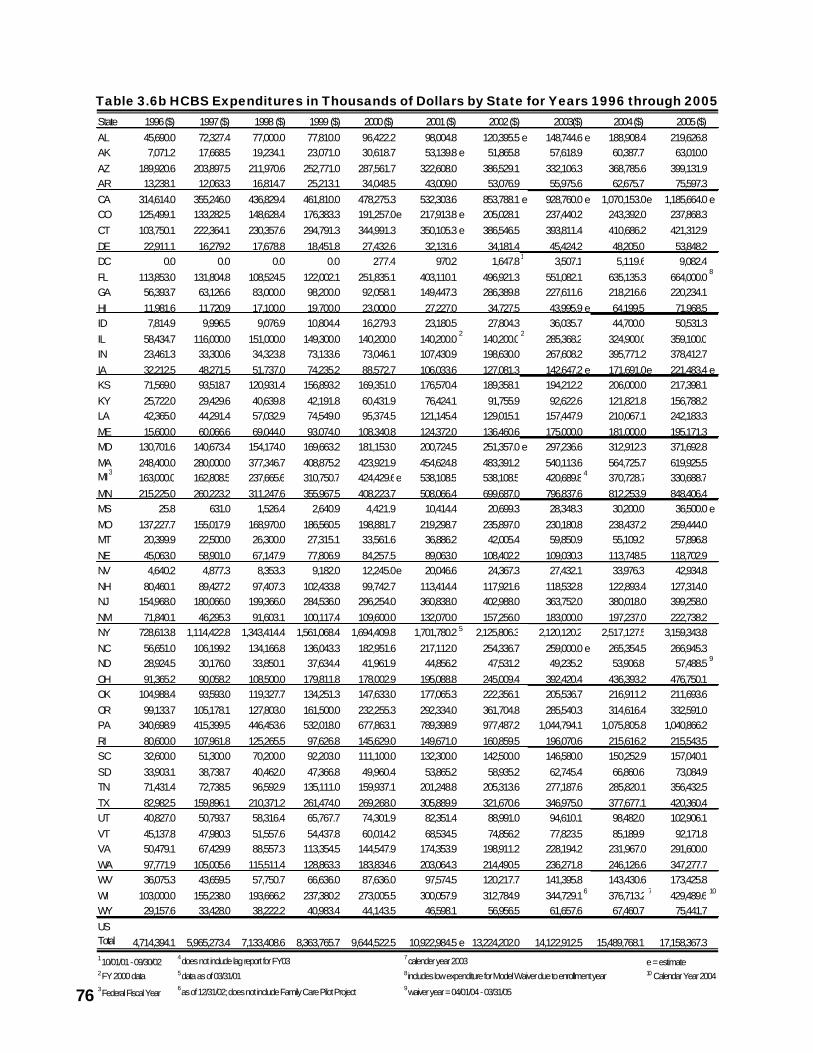
76
Table 3.6b HCBS Expenditures in Thousands of Dollars by State for Years 1996 through 2005State 1996 ($) 1997 ($) 1998 ($) 1999 ($) 2000 ($) 2001 ($) 2002 ($) 2003($) 2004 ($) 2005 ($)AL 45,690.0 72,327.4 77,000.0 77,810.0 96,422.2 98,004.8 120,395.5 e 148,744.6 e 188,908.4 219,626.8AK 7,071.2 17,668.5 19,234.1 23,071.0 30,618.7 53,139.8 e 51,865.8 57,618.9 60,387.7 63,010.0AZ 189,920.6 203,897.5 211,970.6 252,771.0 287,561.7 322,608.0 386,529.1 332,106.3 368,785.6 399,131.9AR 13,238.1 12,063.3 16,814.7 25,213.1 34,048.5 43,009.0 53,076.9 55,975.6 62,675.7 75,597.3CA 314,614.0 355,246.0 436,829.4 461,810.0 478,275.3 532,303.6 853,788.1 e 928,760.0 e 1,070,153.0e 1,185,664.0 eCO 125,499.1 133,282.5 148,628.4 176,383.3 191,257.0e 217,913.8 e 205,028.1 237,440.2 243,392.0 237,868.3CT 103,750.1 222,364.1 230,357.6 294,791.3 344,991.3 350,105.3 e 386,546.5 393,811.4 410,686.2 421,312.9DE 22,911.1 16,279.2 17,678.8 18,451.8 27,432.6 32,131.6 34,181.4 45,424.2 48,205.0 53,848.2DC 0.0 0.0 0.0 0.0 277.4 970.2 1,647.81 3,507.1 5,119.6 9,082.4FL 113,853.0 131,804.8 108,524.5 122,002.1 251,835.1 403,110.1 496,921.3 551,082.1 635,135.3 664,000.0
8
GA 56,393.7 63,126.6 83,000.0 98,200.0 92,058.1 149,447.3 286,389.8 227,611.6 218,216.6 220,234.1HI 11,981.6 11,720.9 17,100.0 19,700.0 23,000.0 27,227.0 34,727.5 43,995.9 e 64,199.5 71,968.5ID 7,814.9 9,996.5 9,076.9 10,804.4 16,279.3 23,180.5 27,804.3 36,035.7 44,700.0 50,531.3IL 58,434.7 116,000.0 151,000.0 149,300.0 140,200.0 140,200.0
2140,200.0
2285,368.2 324,900.0 359,100.0
IN 23,461.3 33,300.6 34,323.8 73,133.6 73,046.1 107,430.9 198,630.0 267,608.2 395,771.2 378,412.7IA 32,212.5 48,271.5 51,737.0 74,235.2 88,572.7 106,033.6 127,081.3 142,647.2 e 171,691.0e 221,483.4 eKS 71,569.0 93,518.7 120,931.4 156,893.2 169,351.0 176,570.4 189,358.1 194,212.2 206,000.0 217,398.1KY 25,722.0 29,429.6 40,639.8 42,191.8 60,431.9 76,424.1 91,755.9 92,622.6 121,821.8 156,788.2LA 42,365.0 44,291.4 57,032.9 74,549.0 95,374.5 121,145.4 129,015.1 157,447.9 210,067.1 242,183.3ME 15,600.0 60,066.6 69,044.0 93,074.0 108,340.8 124,372.0 136,460.6 175,000.0 181,000.0 195,171.3MD 130,701.6 140,673.4 154,174.0 169,663.2 181,153.0 200,724.5 251,357.0 e 297,236.6 312,912.3 371,692.8MA 248,400.0 280,000.0 377,346.7 408,875.2 423,921.9 454,624.8 483,391.2 540,113.6 564,725.7 619,925.5MI 3 163,000.0 162,808.5 237,665.6 310,750.7 424,429.6e 538,108.5 538,108.5 420,689.84 370,728.7 330,688.7MN 215,225.0 260,223.2 311,247.6 355,967.5 408,223.7 508,066.4 699,687.0 796,837.6 812,253.9 848,406.4MS 25.8 631.0 1,526.4 2,640.9 4,421.9 10,414.4 20,699.3 28,348.3 30,200.0 36,500.0 eMO 137,227.7 155,017.9 168,970.0 186,560.5 198,881.7 219,298.7 235,897.0 230,180.8 238,437.2 259,444.0MT 20,399.9 22,500.0 26,300.0 27,315.1 33,561.6 36,886.2 42,005.4 59,850.9 55,109.2 57,896.8NE 45,063.0 58,901.0 67,147.9 77,806.9 84,257.5 89,063.0 108,402.2 109,030.3 113,748.5 118,702.9NV 4,640.2 4,877.3 8,353.3 9,182.0 12,245.0e 20,046.6 24,367.3 27,432.1 33,976.3 42,934.8NH 80,460.1 89,427.2 97,407.3 102,433.8 99,742.7 113,414.4 117,921.6 118,532.8 122,893.4 127,314.0NJ 154,968.0 180,066.0 199,366.0 284,536.0 296,254.0 360,838.0 402,988.0 363,752.0 380,018.0 399,258.0NM 71,840.1 46,295.3 91,603.1 100,117.4 109,600.0 132,070.0 157,256.0 183,000.0 197,237.0 222,738.2NY 728,613.8 1,114,422.8 1,343,414.4 1,561,068.4 1,694,409.8 1,701,780.2 5 2,125,806.3 2,120,120.2 2,517,127.5 3,159,343.8NC 56,651.0 106,199.2 134,166.8 136,043.3 182,951.6 217,112.0 254,336.7 259,000.0 e 265,354.5 266,945.3ND 28,924.5 30,176.0 33,850.1 37,634.4 41,961.9 44,856.2 47,531.2 49,235.2 53,906.8 57,488.5 9
OH 91,365.2 90,058.2 108,500.0 179,811.8 178,002.9 195,088.8 245,009.4 392,420.4 436,393.2 476,750.1OK 104,988.4 93,593.0 119,327.7 134,251.3 147,633.0 177,065.3 222,356.1 205,536.7 216,911.2 211,693.6OR 99,133.7 105,178.1 127,803.0 161,500.0 232,255.3 292,334.0 361,704.8 285,540.3 314,616.4 332,591.0PA 340,698.9 415,399.5 446,453.6 532,018.0 677,863.1 789,398.9 977,487.2 1,044,794.1 1,075,805.8 1,040,866.2RI 80,600.0 107,961.8 125,265.5 97,626.8 145,629.0 149,671.0 160,859.5 196,070.6 215,616.2 215,543.5SC 32,600.0 51,300.0 70,200.0 92,203.0 111,100.0 132,300.0 142,500.0 146,580.0 150,252.9 157,040.1SD 33,903.1 38,738.7 40,462.0 47,366.8 49,960.4 53,865.2 58,935.2 62,745.4 66,860.6 73,084.9TN 71,431.4 72,738.5 96,592.9 135,111.0 159,937.1 201,248.8 205,313.6 277,187.6 285,820.1 356,432.5TX 82,982.5 159,896.1 210,371.2 261,474.0 269,268.0 305,889.9 321,670.6 346,975.0 377,677.1 420,360.4UT 40,827.0 50,793.7 58,316.4 65,767.7 74,301.9 82,351.4 88,991.0 94,610.1 98,482.0 102,906.1VT 45,137.8 47,980.3 51,557.6 54,437.8 60,014.2 68,534.5 74,856.2 77,823.5 85,189.9 92,171.8VA 50,479.1 67,429.9 88,557.3 113,354.5 144,547.9 174,353.9 198,911.2 228,194.2 231,967.0 291,600.0WA 97,771.9 105,005.6 115,511.4 128,863.3 183,834.6 203,064.3 214,490.5 236,271.8 246,126.6 347,277.7WV 36,075.3 43,659.5 57,750.7 66,636.0 87,636.0 97,574.5 120,217.7 141,395.8 143,430.6 173,425.8WI 103,000.0 155,238.0 193,666.2 237,380.2 273,005.5 300,057.9 312,784.9 344,729.16 376,713.2 7 429,489.6 10
WY 29,157.6 33,428.0 38,222.2 40,983.4 44,143.5 46,598.1 56,956.5 61,657.6 67,460.7 75,441.7US Total 4,714,394.1 5,965,273.4 7,133,408.6 8,363,765.7 9,644,522.5 10,922,984.5 e 13,224,202.0 14,122,912.5 15,489,768.1 17,158,367.3
4 does not include lag report for FY03 7 calender year 2003 e = estimate2 FY 2000 data 5 data as of 03/31/01 8 includes low expenditure for Model Waiver due to enrollment year 10 Calendar Year 2004
6 as of 12/31/02; does not include Family Care Pilot Project 9 waiver year = 04/01/04 - 03/31/05
1 10/01/01 - 09/30/02
3 Federal Fiscal Year
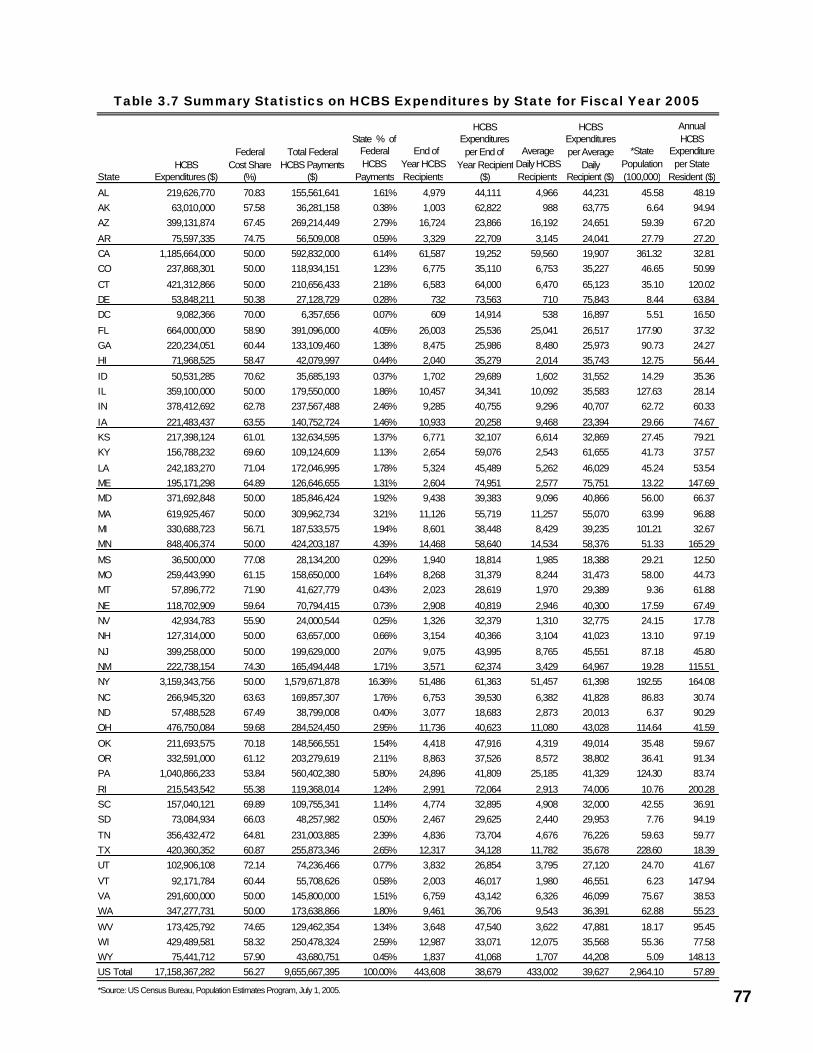
77
Table 3.7 Summary Statistics on HCBS Expenditures by State for Fiscal Year 2005
State
State % of Federal HCBS
Payments
End of Year HCBS Recipients
Average Daily HCBS Recipients
*State Population (100,000)
Annual HCBS
Expenditure per State
Resident ($)
AL 219,626,770 70.83 155,561,641 1.61% 4,979 44,111 4,966 44,231 45.58 48.19AK 63,010,000 57.58 36,281,158 0.38% 1,003 62,822 988 63,775 6.64 94.94AZ 399,131,874 67.45 269,214,449 2.79% 16,724 23,866 16,192 24,651 59.39 67.20
AR 75,597,335 74.75 56,509,008 0.59% 3,329 22,709 3,145 24,041 27.79 27.20CA 1,185,664,000 50.00 592,832,000 6.14% 61,587 19,252 59,560 19,907 361.32 32.81CO 237,868,301 50.00 118,934,151 1.23% 6,775 35,110 6,753 35,227 46.65 50.99
CT 421,312,866 50.00 210,656,433 2.18% 6,583 64,000 6,470 65,123 35.10 120.02DE 53,848,211 50.38 27,128,729 0.28% 732 73,563 710 75,843 8.44 63.84DC 9,082,366 70.00 6,357,656 0.07% 609 14,914 538 16,897 5.51 16.50
FL 664,000,000 58.90 391,096,000 4.05% 26,003 25,536 25,041 26,517 177.90 37.32GA 220,234,051 60.44 133,109,460 1.38% 8,475 25,986 8,480 25,973 90.73 24.27HI 71,968,525 58.47 42,079,997 0.44% 2,040 35,279 2,014 35,743 12.75 56.44
ID 50,531,285 70.62 35,685,193 0.37% 1,702 29,689 1,602 31,552 14.29 35.36IL 359,100,000 50.00 179,550,000 1.86% 10,457 34,341 10,092 35,583 127.63 28.14IN 378,412,692 62.78 237,567,488 2.46% 9,285 40,755 9,296 40,707 62.72 60.33
IA 221,483,437 63.55 140,752,724 1.46% 10,933 20,258 9,468 23,394 29.66 74.67KS 217,398,124 61.01 132,634,595 1.37% 6,771 32,107 6,614 32,869 27.45 79.21KY 156,788,232 69.60 109,124,609 1.13% 2,654 59,076 2,543 61,655 41.73 37.57
LA 242,183,270 71.04 172,046,995 1.78% 5,324 45,489 5,262 46,029 45.24 53.54ME 195,171,298 64.89 126,646,655 1.31% 2,604 74,951 2,577 75,751 13.22 147.69MD 371,692,848 50.00 185,846,424 1.92% 9,438 39,383 9,096 40,866 56.00 66.37
MA 619,925,467 50.00 309,962,734 3.21% 11,126 55,719 11,257 55,070 63.99 96.88MI 330,688,723 56.71 187,533,575 1.94% 8,601 38,448 8,429 39,235 101.21 32.67MN 848,406,374 50.00 424,203,187 4.39% 14,468 58,640 14,534 58,376 51.33 165.29
MS 36,500,000 77.08 28,134,200 0.29% 1,940 18,814 1,985 18,388 29.21 12.50MO 259,443,990 61.15 158,650,000 1.64% 8,268 31,379 8,244 31,473 58.00 44.73MT 57,896,772 71.90 41,627,779 0.43% 2,023 28,619 1,970 29,389 9.36 61.88
NE 118,702,909 59.64 70,794,415 0.73% 2,908 40,819 2,946 40,300 17.59 67.49NV 42,934,783 55.90 24,000,544 0.25% 1,326 32,379 1,310 32,775 24.15 17.78NH 127,314,000 50.00 63,657,000 0.66% 3,154 40,366 3,104 41,023 13.10 97.19
NJ 399,258,000 50.00 199,629,000 2.07% 9,075 43,995 8,765 45,551 87.18 45.80NM 222,738,154 74.30 165,494,448 1.71% 3,571 62,374 3,429 64,967 19.28 115.51NY 3,159,343,756 50.00 1,579,671,878 16.36% 51,486 61,363 51,457 61,398 192.55 164.08
NC 266,945,320 63.63 169,857,307 1.76% 6,753 39,530 6,382 41,828 86.83 30.74ND 57,488,528 67.49 38,799,008 0.40% 3,077 18,683 2,873 20,013 6.37 90.29OH 476,750,084 59.68 284,524,450 2.95% 11,736 40,623 11,080 43,028 114.64 41.59
OK 211,693,575 70.18 148,566,551 1.54% 4,418 47,916 4,319 49,014 35.48 59.67OR 332,591,000 61.12 203,279,619 2.11% 8,863 37,526 8,572 38,802 36.41 91.34PA 1,040,866,233 53.84 560,402,380 5.80% 24,896 41,809 25,185 41,329 124.30 83.74
RI 215,543,542 55.38 119,368,014 1.24% 2,991 72,064 2,913 74,006 10.76 200.28SC 157,040,121 69.89 109,755,341 1.14% 4,774 32,895 4,908 32,000 42.55 36.91SD 73,084,934 66.03 48,257,982 0.50% 2,467 29,625 2,440 29,953 7.76 94.19
TN 356,432,472 64.81 231,003,885 2.39% 4,836 73,704 4,676 76,226 59.63 59.77TX 420,360,352 60.87 255,873,346 2.65% 12,317 34,128 11,782 35,678 228.60 18.39UT 102,906,108 72.14 74,236,466 0.77% 3,832 26,854 3,795 27,120 24.70 41.67
VT 92,171,784 60.44 55,708,626 0.58% 2,003 46,017 1,980 46,551 6.23 147.94VA 291,600,000 50.00 145,800,000 1.51% 6,759 43,142 6,326 46,099 75.67 38.53WA 347,277,731 50.00 173,638,866 1.80% 9,461 36,706 9,543 36,391 62.88 55.23
WV 173,425,792 74.65 129,462,354 1.34% 3,648 47,540 3,622 47,881 18.17 95.45WI 429,489,581 58.32 250,478,324 2.59% 12,987 33,071 12,075 35,568 55.36 77.58WY 75,441,712 57.90 43,680,751 0.45% 1,837 41,068 1,707 44,208 5.09 148.13US Total 17,158,367,282 56.27 9,655,667,395 100.00% 443,608 38,679 433,002 39,627 2,964.10 57.89
*Source: US Census Bureau, Population Estimates Program, July 1, 2005.
Federal Cost Share
(%)
Total Federal HCBS Payments
($)HCBS
Expenditures ($)
HCBS Expenditures per Average
Daily Recipient ($)
HCBS Expenditures per End of
Year Recipient ($)
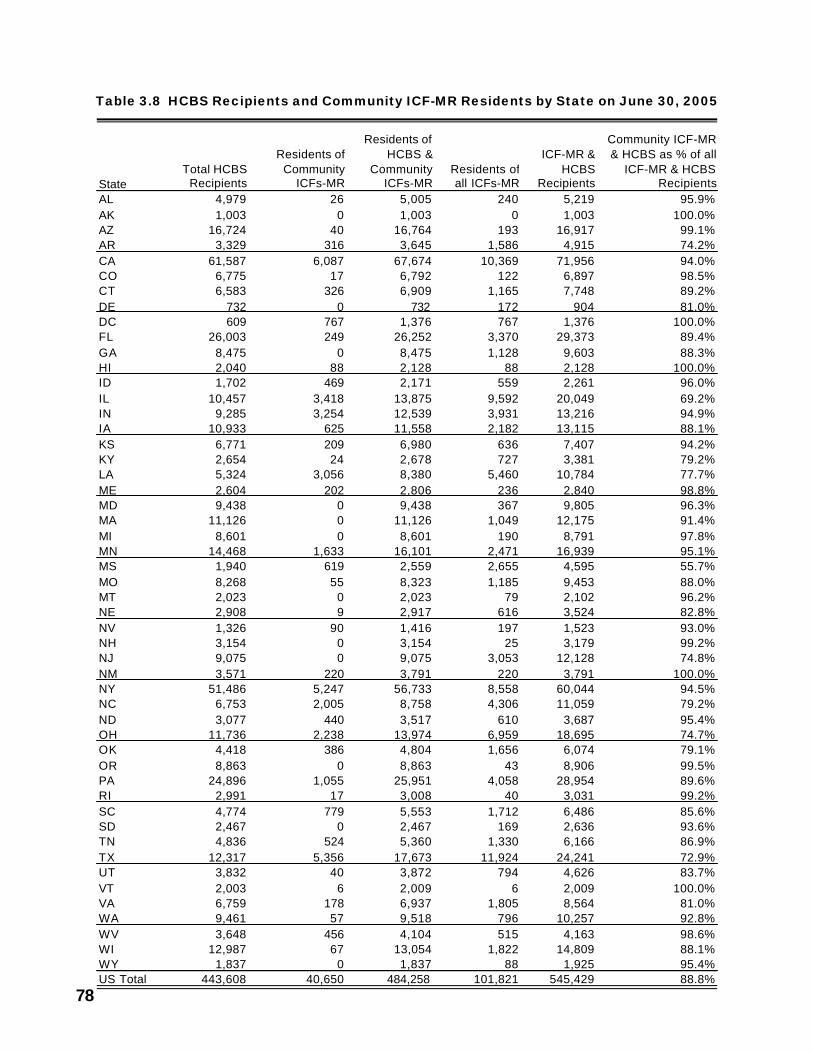
78
Table 3.8 HCBS Recipients and Community ICF-MR Residents by State on June 30, 2005
StateTotal HCBS
Recipients
Residents of Community
ICFs-MR
Residents of HCBS &
Community ICFs-MR
Residents of all ICFs-MR
ICF-MR & HCBS
Recipients
Community ICF-MR & HCBS as % of all
ICF-MR & HCBS Recipients
AL 4,979 26 5,005 240 5,219 95.9%AK 1,003 0 1,003 0 1,003 100.0%AZ 16,724 40 16,764 193 16,917 99.1%AR 3,329 316 3,645 1,586 4,915 74.2%CA 61,587 6,087 67,674 10,369 71,956 94.0%CO 6,775 17 6,792 122 6,897 98.5%CT 6,583 326 6,909 1,165 7,748 89.2%DE 732 0 732 172 904 81.0%DC 609 767 1,376 767 1,376 100.0%FL 26,003 249 26,252 3,370 29,373 89.4%GA 8,475 0 8,475 1,128 9,603 88.3%HI 2,040 88 2,128 88 2,128 100.0%ID 1,702 469 2,171 559 2,261 96.0%IL 10,457 3,418 13,875 9,592 20,049 69.2%IN 9,285 3,254 12,539 3,931 13,216 94.9%IA 10,933 625 11,558 2,182 13,115 88.1%KS 6,771 209 6,980 636 7,407 94.2%KY 2,654 24 2,678 727 3,381 79.2%LA 5,324 3,056 8,380 5,460 10,784 77.7%ME 2,604 202 2,806 236 2,840 98.8%MD 9,438 0 9,438 367 9,805 96.3%MA 11,126 0 11,126 1,049 12,175 91.4%MI 8,601 0 8,601 190 8,791 97.8%MN 14,468 1,633 16,101 2,471 16,939 95.1%MS 1,940 619 2,559 2,655 4,595 55.7%MO 8,268 55 8,323 1,185 9,453 88.0%MT 2,023 0 2,023 79 2,102 96.2%NE 2,908 9 2,917 616 3,524 82.8%NV 1,326 90 1,416 197 1,523 93.0%NH 3,154 0 3,154 25 3,179 99.2%NJ 9,075 0 9,075 3,053 12,128 74.8%NM 3,571 220 3,791 220 3,791 100.0%NY 51,486 5,247 56,733 8,558 60,044 94.5%NC 6,753 2,005 8,758 4,306 11,059 79.2%ND 3,077 440 3,517 610 3,687 95.4%OH 11,736 2,238 13,974 6,959 18,695 74.7%OK 4,418 386 4,804 1,656 6,074 79.1%OR 8,863 0 8,863 43 8,906 99.5%PA 24,896 1,055 25,951 4,058 28,954 89.6%RI 2,991 17 3,008 40 3,031 99.2%SC 4,774 779 5,553 1,712 6,486 85.6%SD 2,467 0 2,467 169 2,636 93.6%TN 4,836 524 5,360 1,330 6,166 86.9%TX 12,317 5,356 17,673 11,924 24,241 72.9%UT 3,832 40 3,872 794 4,626 83.7%VT 2,003 6 2,009 6 2,009 100.0%VA 6,759 178 6,937 1,805 8,564 81.0%WA 9,461 57 9,518 796 10,257 92.8%WV 3,648 456 4,104 515 4,163 98.6%WI 12,987 67 13,054 1,822 14,809 88.1%WY 1,837 0 1,837 88 1,925 95.4%US Total 443,608 40,650 484,258 101,821 545,429 88.8%

79
HCBS Recipients and Residents ofCommunity ICFs-MR
Table 3.8 summarizes the combined use of the Med-icaid HCBS and ICF-MR to provide community ser-vices within the individual states. On June 30, 2005there were 443,608 people receiving Medicaid HCBSservices and 40,650 persons living in communityICFs-MR. This combined total of community Medi-caid service recipients (484,258) was 88.8% of the545,429 total of all HCBS and ICF-MR recipients. Inall of the 51 states the majority of recipients of theMedicaid-financed long-term care ICF-MR and HCBSfor persons with ID/DD were served in HCBS or ICF-MR funded community programs. Forty-five stateswere serving three-quarters or more of their Medicaid-financed long-term care recipients with ID/DD in com-munity settings. Figure 3.5 shows this variation on astate-by-state basis.
Figure 3.6 shows the total of large (16 or moreresidents) state and nonstate ICF-MR residents, com-munity state and nonstate ICF-MR residents, andHCBS recipients for 1982, 1987, 1992, 1997, 2002and 2005. It shows the dramatic increase in Medicaidcommunity service recipients from 1982 to 2005, from9,985 to 484,258. It also shows the substantial de-crease of the population of large ICFs-MR from 1982to 2005, from 130,767 to 61,171.
ICF-MR and HCBS Recipients andExpenditures
Medicaid Intermediate Care Facilities (ICFs-MR) andHome and Community Based Services (HCBS) sharecommon eligibility criteria and are intended to servethe same general population. Yet, as reported in Table3.9, expenditures for ICF-MR and HCBS services tendto be disproportionately higher in the former. In 2005,nationally, HCBS recipients made up 81.3% of the to-tal HCBS and ICF-MR recipient population but usedonly 58.6% of total HCBS and ICF-MR expenditures.FY 2001 was a milestone in that for the first time ever,HCBS expenditures were greater than for ICFs-MR.
HCBS and ICF-MR recipients and expendituresvaried among individual states but in most states theHCBS share of total expenditures was disproportion-ately low when measured against the HCBS share oftotal recipient population. In one state (District of Co-lumbia), HCBS recipients as a proportion of all recipi-ents exceeded HCBS expenditures as a proportion ofall expenditures by a factor of 3 or greater.
Direct comparisons of the costs of ICF-MR andHCBS approaches to financing residential services are
complicated by a number of factors. In some states,disproportionately higher expenditures for ICF-MR re-cipients may be explained by artificially inflated insti-tutional costs resulting from deinstitutionalization. Theconsistent pattern of relatively lower expenditures forHCBS recipients in some states is an intended andcontrolled program goal. In almost all states substan-tial numbers of HCBS recipients live in their familyhomes (an estimated 45.5% nationally), reducing long-term care costs by the relative value of the supportsprovided by family members and other non-paid sup-port providers. Somewhat related, children and youthare more likely to be served under HCBS than ICF-MRand as a result “day program” costs are more likely tobe covered by educational agencies. In addition, al-though federal regulations require that both HCBS andICF-MR recipients meet the same eligibility criteriaand level of care needs, in actual practice some statesHCBS tend to be a less intensive service than ICF-MR, making HCBS in some states, almost by defini-tion, less costly than ICF-MR. Finally, because Med-icaid law specifically prohibits HCBS financing of roomand board costs, HCBS recipients pay for such coststhrough their own funds, typically from Social SecurityAct cash benefit programs. These individual “contri-butions” to room and board may represent up to $6,700per HCBS recipient per year, and can be even higherbecause of state supplements.
Variations in State Financial Benefit forCombined ICF-MR and HCBS Programs
As in all Medicaid programs, the federal governmentshares the costs of the ICF-MR and HCBS programswith the states as a function of the state per capitaincome relative to national per capita income (seeTable 3.7 for 2005 federal contributions or “match” rates).Relatively rich states share total expenditures on anequal basis with the federal government; relatively poorstates may have federal involvement in financing Med-icaid services up to 83% (Mississippi’s 77% was thehighest federal share in 2005). It is often presumed,therefore, that the extent to which states benefit fromICF-MR and HCBS program participation is directlyrelated to their general need for assistance as reflectedin the federal Medicaid cost share ratio. Becausestates vary considerably in their ICF-MR and HCBSutilization rates, proportions of ICF-MR and HCBS re-cipients, and expenditures per recipient, some varia-tion is expected among states in relative benefit fromfederal matching funds beyond that built into the ac-tual cost-share rate for Medicaid. To assess the dif-
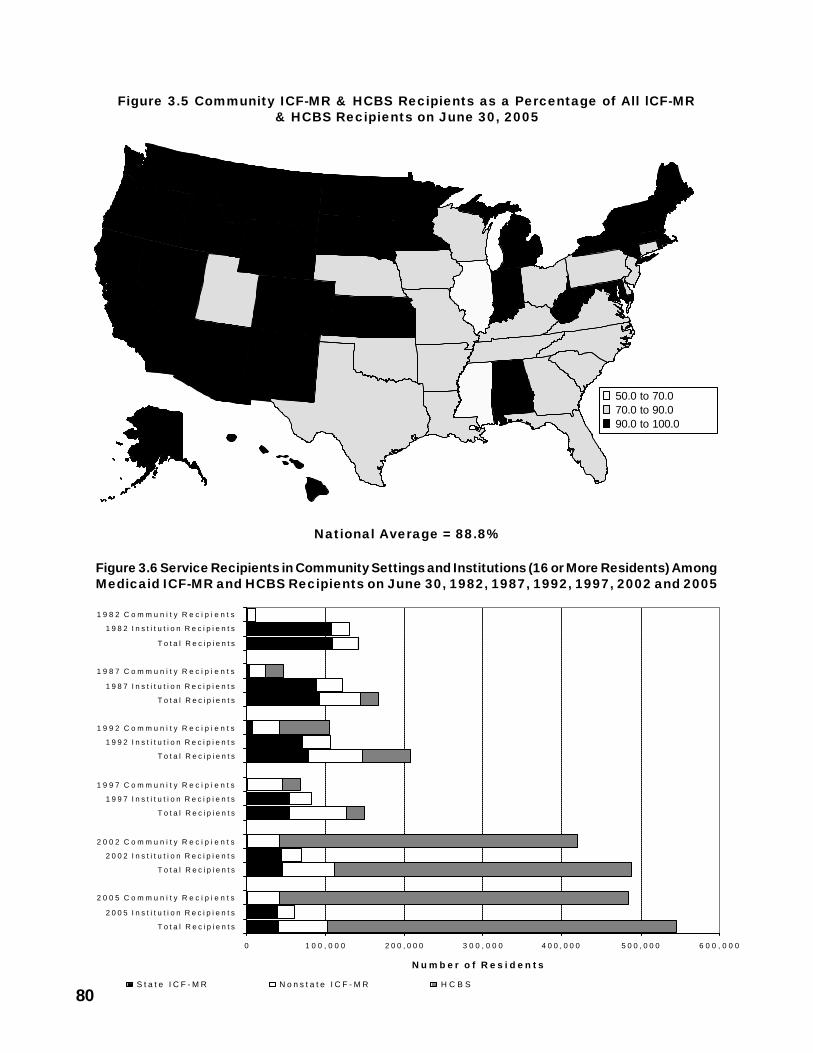
80
Figure 3.5 Community ICF-MR & HCBS Recipients as a Percentage of All lCF-MR& HCBS Recipients on June 30, 2005
National Average = 88.8%
Figure 3.6 Service Recipients in Community Settings and Institutions (16 or More Residents) AmongMedicaid ICF-MR and HCBS Recipients on June 30, 1982, 1987, 1992, 1997, 2002 and 2005
0 1 0 0 , 0 0 0 2 0 0 , 0 0 0 3 0 0 , 0 0 0 4 0 0 , 0 0 0 5 0 0 , 0 0 0 6 0 0 , 0 0 0
T o t a l R e c i p i e n t s
2 0 0 5 I n s t i t u t i o n R e c i p i e n t s
2 0 0 5 C o m m u n i t y R e c i p i e n t s
T o t a l R e c i p i e n t s
2 0 0 2 I n s t i t u t i o n R e c i p i e n t s
2 0 0 2 C o m m u n i t y R e c i p i e n t s
T o t a l R e c i p i e n t s
1 9 9 7 I n s t i t u t i o n R e c i p i e n t s
1 9 9 7 C o m m u n i t y R e c i p i e n t s
T o t a l R e c i p i e n t s
1 9 9 2 I n s t i t u t i o n R e c i p i e n t s
1 9 9 2 C o m m u n i t y R e c i p i e n t s
T o t a l R e c i p i e n t s
1 9 8 7 I n s t i t u t i o n R e c i p i e n t s
1 9 8 7 C o m m u n i t y R e c i p i e n t s
T o t a l R e c i p i e n t s
1 9 8 2 I n s t i t u t i o n R e c i p i e n t s
1 9 8 2 C o m m u n i t y R e c i p i e n t s
N u m b e r o f R e s i d e n t s
S t a t e I C F - M R N o n s t a t e I C F - M R H C B S
WA
NV
SD
CA
KS
NY
IN
MNND
WY
AL
ID
MT
MI
CO WV
ME
AZ
OR
AK
DC
NM
50.0 to 70.070.0 to 90.090.0 to 100.0
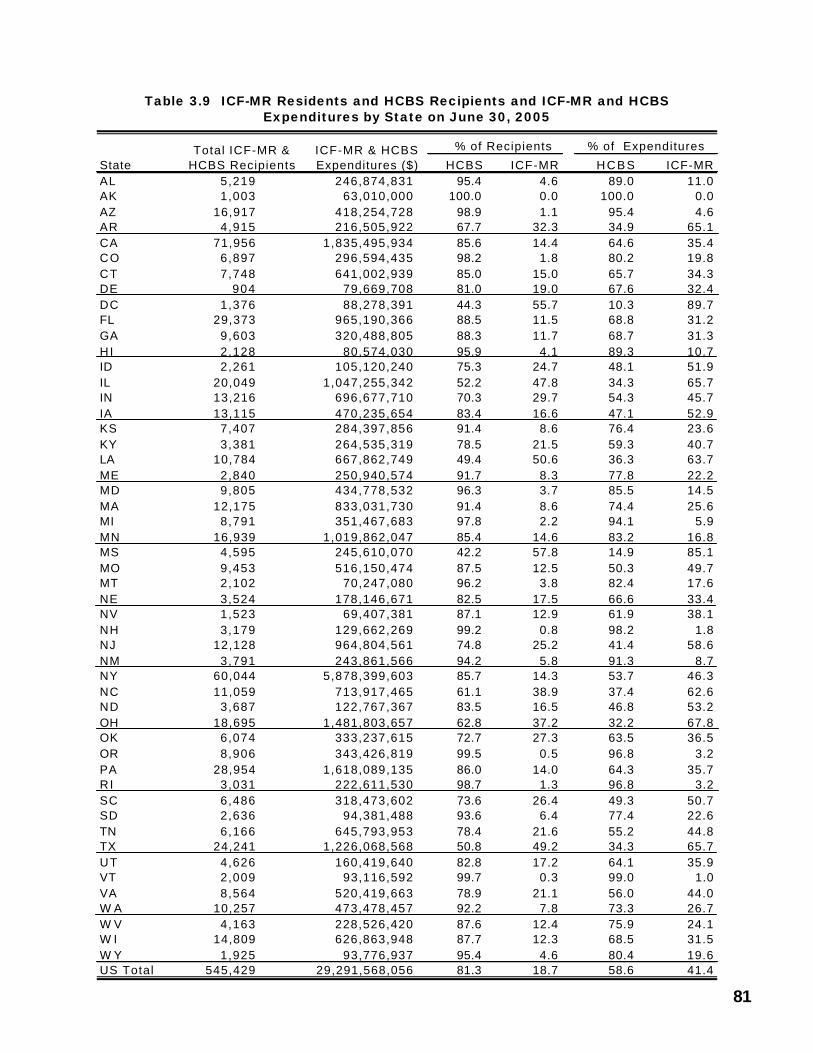
81
Table 3.9 ICF-MR Residents and HCBS Recipients and ICF-MR and HCBSExpenditures by State on June 30, 2005
% of Recipients % of Expenditures
HCBS ICF-MR HCBS ICF-MRAL 5,219 246,874,831 95.4 4.6 89.0 11.0AK 1,003 63,010,000 100.0 0.0 100.0 0.0AZ 16,917 418,254,728 98.9 1.1 95.4 4.6AR 4,915 216,505,922 67.7 32.3 34.9 65.1CA 71,956 1,835,495,934 85.6 14.4 64.6 35.4CO 6,897 296,594,435 98.2 1.8 80.2 19.8CT 7,748 641,002,939 85.0 15.0 65.7 34.3DE 904 79,669,708 81.0 19.0 67.6 32.4DC 1,376 88,278,391 44.3 55.7 10.3 89.7FL 29,373 965,190,366 88.5 11.5 68.8 31.2GA 9,603 320,488,805 88.3 11.7 68.7 31.3HI 2,128 80,574,030 95.9 4.1 89.3 10.7ID 2,261 105,120,240 75.3 24.7 48.1 51.9IL 20,049 1,047,255,342 52.2 47.8 34.3 65.7IN 13,216 696,677,710 70.3 29.7 54.3 45.7IA 13,115 470,235,654 83.4 16.6 47.1 52.9KS 7,407 284,397,856 91.4 8.6 76.4 23.6KY 3,381 264,535,319 78.5 21.5 59.3 40.7LA 10,784 667,862,749 49.4 50.6 36.3 63.7ME 2,840 250,940,574 91.7 8.3 77.8 22.2MD 9,805 434,778,532 96.3 3.7 85.5 14.5MA 12,175 833,031,730 91.4 8.6 74.4 25.6MI 8,791 351,467,683 97.8 2.2 94.1 5.9MN 16,939 1,019,862,047 85.4 14.6 83.2 16.8MS 4,595 245,610,070 42.2 57.8 14.9 85.1MO 9,453 516,150,474 87.5 12.5 50.3 49.7MT 2,102 70,247,080 96.2 3.8 82.4 17.6NE 3,524 178,146,671 82.5 17.5 66.6 33.4NV 1,523 69,407,381 87.1 12.9 61.9 38.1NH 3,179 129,662,269 99.2 0.8 98.2 1.8NJ 12,128 964,804,561 74.8 25.2 41.4 58.6NM 3,791 243,861,566 94.2 5.8 91.3 8.7NY 60,044 5,878,399,603 85.7 14.3 53.7 46.3NC 11,059 713,917,465 61.1 38.9 37.4 62.6ND 3,687 122,767,367 83.5 16.5 46.8 53.2OH 18,695 1,481,803,657 62.8 37.2 32.2 67.8OK 6,074 333,237,615 72.7 27.3 63.5 36.5OR 8,906 343,426,819 99.5 0.5 96.8 3.2PA 28,954 1,618,089,135 86.0 14.0 64.3 35.7RI 3,031 222,611,530 98.7 1.3 96.8 3.2SC 6,486 318,473,602 73.6 26.4 49.3 50.7SD 2,636 94,381,488 93.6 6.4 77.4 22.6TN 6,166 645,793,953 78.4 21.6 55.2 44.8TX 24,241 1,226,068,568 50.8 49.2 34.3 65.7UT 4,626 160,419,640 82.8 17.2 64.1 35.9VT 2,009 93,116,592 99.7 0.3 99.0 1.0VA 8,564 520,419,663 78.9 21.1 56.0 44.0W A 10,257 473,478,457 92.2 7.8 73.3 26.7W V 4,163 228,526,420 87.6 12.4 75.9 24.1W I 14,809 626,863,948 87.7 12.3 68.5 31.5W Y 1,925 93,776,937 95.4 4.6 80.4 19.6US Total 545,429 29,291,568,056 81.3 18.7 58.6 41.4
StateTotal ICF-MR &
HCBS RecipientsICF-MR & HCBS Expenditures ($)
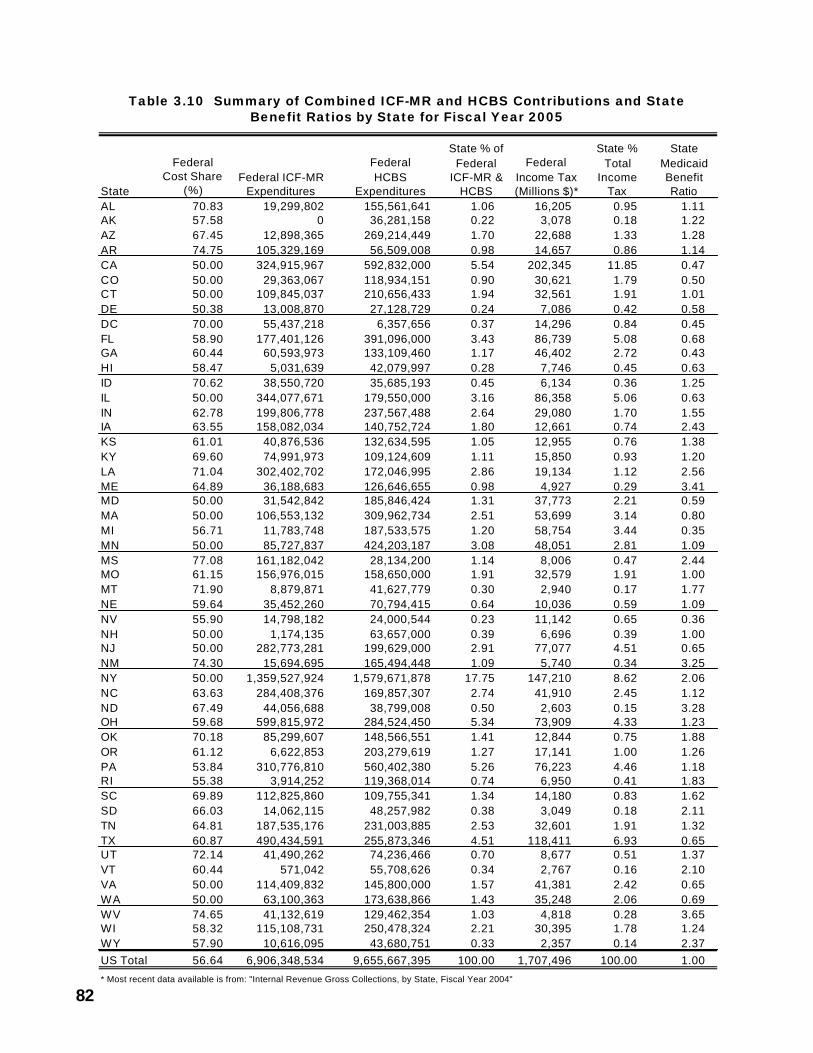
82
Table 3.10 Summary of Combined ICF-MR and HCBS Contributions and StateBenefit Ratios by State for Fiscal Year 2005
State
Federal Cost Share
(%)AL 70.83 19,299,802 155,561,641 1.06 16,205 0.95 1.11AK 57.58 0 36,281,158 0.22 3,078 0.18 1.22AZ 67.45 12,898,365 269,214,449 1.70 22,688 1.33 1.28AR 74.75 105,329,169 56,509,008 0.98 14,657 0.86 1.14CA 50.00 324,915,967 592,832,000 5.54 202,345 11.85 0.47CO 50.00 29,363,067 118,934,151 0.90 30,621 1.79 0.50CT 50.00 109,845,037 210,656,433 1.94 32,561 1.91 1.01DE 50.38 13,008,870 27,128,729 0.24 7,086 0.42 0.58DC 70.00 55,437,218 6,357,656 0.37 14,296 0.84 0.45FL 58.90 177,401,126 391,096,000 3.43 86,739 5.08 0.68GA 60.44 60,593,973 133,109,460 1.17 46,402 2.72 0.43HI 58.47 5,031,639 42,079,997 0.28 7,746 0.45 0.63ID 70.62 38,550,720 35,685,193 0.45 6,134 0.36 1.25IL 50.00 344,077,671 179,550,000 3.16 86,358 5.06 0.63IN 62.78 199,806,778 237,567,488 2.64 29,080 1.70 1.55IA 63.55 158,082,034 140,752,724 1.80 12,661 0.74 2.43KS 61.01 40,876,536 132,634,595 1.05 12,955 0.76 1.38KY 69.60 74,991,973 109,124,609 1.11 15,850 0.93 1.20LA 71.04 302,402,702 172,046,995 2.86 19,134 1.12 2.56ME 64.89 36,188,683 126,646,655 0.98 4,927 0.29 3.41MD 50.00 31,542,842 185,846,424 1.31 37,773 2.21 0.59MA 50.00 106,553,132 309,962,734 2.51 53,699 3.14 0.80MI 56.71 11,783,748 187,533,575 1.20 58,754 3.44 0.35MN 50.00 85,727,837 424,203,187 3.08 48,051 2.81 1.09MS 77.08 161,182,042 28,134,200 1.14 8,006 0.47 2.44MO 61.15 156,976,015 158,650,000 1.91 32,579 1.91 1.00MT 71.90 8,879,871 41,627,779 0.30 2,940 0.17 1.77NE 59.64 35,452,260 70,794,415 0.64 10,036 0.59 1.09NV 55.90 14,798,182 24,000,544 0.23 11,142 0.65 0.36NH 50.00 1,174,135 63,657,000 0.39 6,696 0.39 1.00NJ 50.00 282,773,281 199,629,000 2.91 77,077 4.51 0.65NM 74.30 15,694,695 165,494,448 1.09 5,740 0.34 3.25NY 50.00 1,359,527,924 1,579,671,878 17.75 147,210 8.62 2.06NC 63.63 284,408,376 169,857,307 2.74 41,910 2.45 1.12ND 67.49 44,056,688 38,799,008 0.50 2,603 0.15 3.28OH 59.68 599,815,972 284,524,450 5.34 73,909 4.33 1.23OK 70.18 85,299,607 148,566,551 1.41 12,844 0.75 1.88OR 61.12 6,622,853 203,279,619 1.27 17,141 1.00 1.26PA 53.84 310,776,810 560,402,380 5.26 76,223 4.46 1.18RI 55.38 3,914,252 119,368,014 0.74 6,950 0.41 1.83SC 69.89 112,825,860 109,755,341 1.34 14,180 0.83 1.62SD 66.03 14,062,115 48,257,982 0.38 3,049 0.18 2.11TN 64.81 187,535,176 231,003,885 2.53 32,601 1.91 1.32TX 60.87 490,434,591 255,873,346 4.51 118,411 6.93 0.65UT 72.14 41,490,262 74,236,466 0.70 8,677 0.51 1.37VT 60.44 571,042 55,708,626 0.34 2,767 0.16 2.10VA 50.00 114,409,832 145,800,000 1.57 41,381 2.42 0.65WA 50.00 63,100,363 173,638,866 1.43 35,248 2.06 0.69WV 74.65 41,132,619 129,462,354 1.03 4,818 0.28 3.65WI 58.32 115,108,731 250,478,324 2.21 30,395 1.78 1.24WY 57.90 10,616,095 43,680,751 0.33 2,357 0.14 2.37US Total 56.64 6,906,348,534 9,655,667,395 100.00 1,707,496 100.00 1.00
* Most recent data available is from: "Internal Revenue Gross Collections, by State, Fiscal Year 2004"
State % Total
Income Tax
State Medicaid Benefit Ratio
Federal ICF-MR Expenditures
Federal HCBS
Expenditures
State % of Federal
ICF-MR & HCBS
Federal Income Tax (Millions $)*
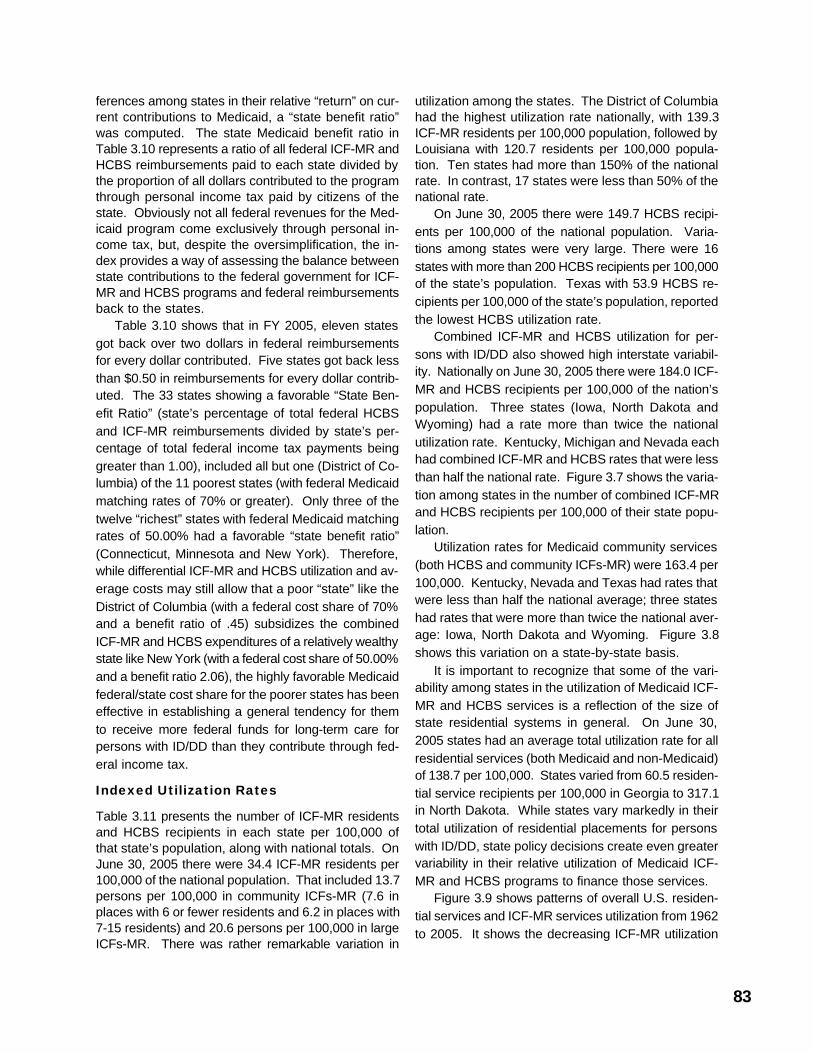
83
ferences among states in their relative “return” on cur-rent contributions to Medicaid, a “state benefit ratio”was computed. The state Medicaid benefit ratio inTable 3.10 represents a ratio of all federal ICF-MR andHCBS reimbursements paid to each state divided bythe proportion of all dollars contributed to the programthrough personal income tax paid by citizens of thestate. Obviously not all federal revenues for the Med-icaid program come exclusively through personal in-come tax, but, despite the oversimplification, the in-dex provides a way of assessing the balance betweenstate contributions to the federal government for ICF-MR and HCBS programs and federal reimbursementsback to the states.
Table 3.10 shows that in FY 2005, eleven statesgot back over two dollars in federal reimbursementsfor every dollar contributed. Five states got back lessthan $0.50 in reimbursements for every dollar contrib-uted. The 33 states showing a favorable “State Ben-efit Ratio” (state’s percentage of total federal HCBSand ICF-MR reimbursements divided by state’s per-centage of total federal income tax payments beinggreater than 1.00), included all but one (District of Co-lumbia) of the 11 poorest states (with federal Medicaidmatching rates of 70% or greater). Only three of thetwelve “richest” states with federal Medicaid matchingrates of 50.00% had a favorable “state benefit ratio”(Connecticut, Minnesota and New York). Therefore,while differential ICF-MR and HCBS utilization and av-erage costs may still allow that a poor “state” like theDistrict of Columbia (with a federal cost share of 70%and a benefit ratio of .45) subsidizes the combinedICF-MR and HCBS expenditures of a relatively wealthystate like New York (with a federal cost share of 50.00%and a benefit ratio 2.06), the highly favorable Medicaidfederal/state cost share for the poorer states has beeneffective in establishing a general tendency for themto receive more federal funds for long-term care forpersons with ID/DD than they contribute through fed-eral income tax.
Indexed Utilization Rates
Table 3.11 presents the number of ICF-MR residentsand HCBS recipients in each state per 100,000 ofthat state’s population, along with national totals. OnJune 30, 2005 there were 34.4 ICF-MR residents per100,000 of the national population. That included 13.7persons per 100,000 in community ICFs-MR (7.6 inplaces with 6 or fewer residents and 6.2 in places with7-15 residents) and 20.6 persons per 100,000 in largeICFs-MR. There was rather remarkable variation in
utilization among the states. The District of Columbiahad the highest utilization rate nationally, with 139.3ICF-MR residents per 100,000 population, followed byLouisiana with 120.7 residents per 100,000 popula-tion. Ten states had more than 150% of the nationalrate. In contrast, 17 states were less than 50% of thenational rate.
On June 30, 2005 there were 149.7 HCBS recipi-ents per 100,000 of the national population. Varia-tions among states were very large. There were 16states with more than 200 HCBS recipients per 100,000of the state’s population. Texas with 53.9 HCBS re-cipients per 100,000 of the state’s population, reportedthe lowest HCBS utilization rate.
Combined ICF-MR and HCBS utilization for per-sons with ID/DD also showed high interstate variabil-ity. Nationally on June 30, 2005 there were 184.0 ICF-MR and HCBS recipients per 100,000 of the nation’spopulation. Three states (Iowa, North Dakota andWyoming) had a rate more than twice the nationalutilization rate. Kentucky, Michigan and Nevada eachhad combined ICF-MR and HCBS rates that were lessthan half the national rate. Figure 3.7 shows the varia-tion among states in the number of combined ICF-MRand HCBS recipients per 100,000 of their state popu-lation.
Utilization rates for Medicaid community services(both HCBS and community ICFs-MR) were 163.4 per100,000. Kentucky, Nevada and Texas had rates thatwere less than half the national average; three stateshad rates that were more than twice the national aver-age: Iowa, North Dakota and Wyoming. Figure 3.8shows this variation on a state-by-state basis.
It is important to recognize that some of the vari-ability among states in the utilization of Medicaid ICF-MR and HCBS services is a reflection of the size ofstate residential systems in general. On June 30,2005 states had an average total utilization rate for allresidential services (both Medicaid and non-Medicaid)of 138.7 per 100,000. States varied from 60.5 residen-tial service recipients per 100,000 in Georgia to 317.1in North Dakota. While states vary markedly in theirtotal utilization of residential placements for personswith ID/DD, state policy decisions create even greatervariability in their relative utilization of Medicaid ICF-MR and HCBS programs to finance those services.
Figure 3.9 shows patterns of overall U.S. residen-tial services and ICF-MR services utilization from 1962to 2005. It shows the decreasing ICF-MR utilization
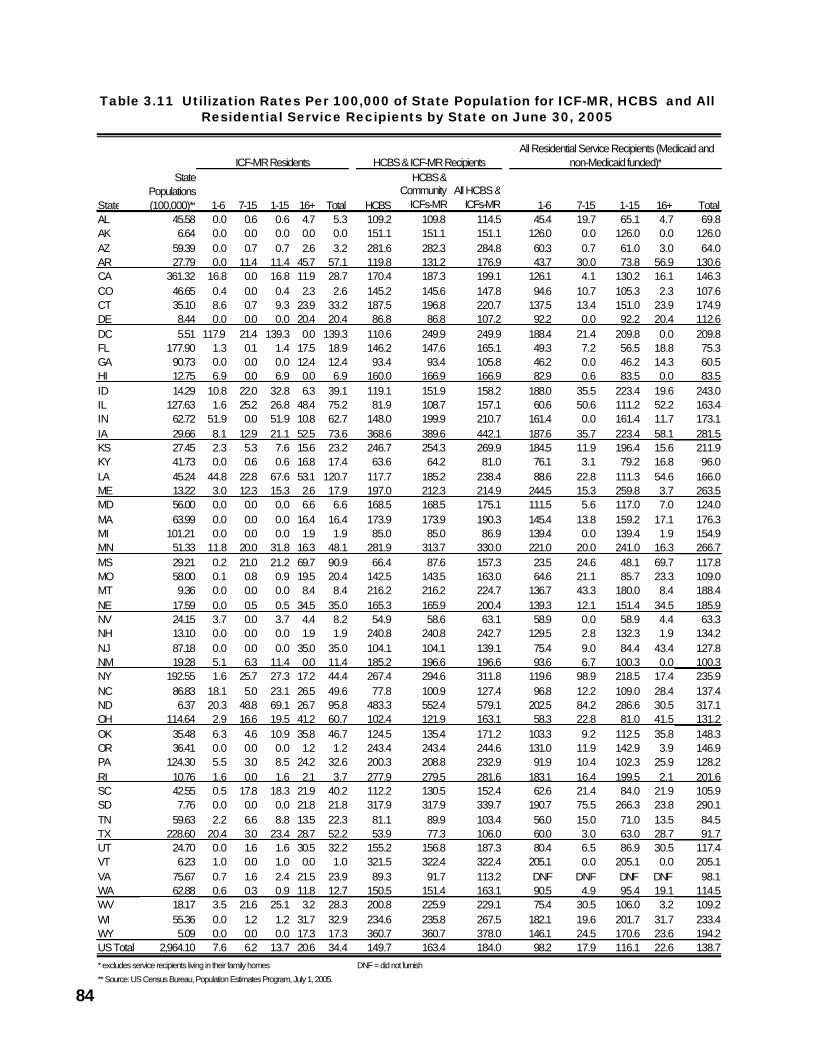
84
Table 3.11 Utilization Rates Per 100,000 of State Population for ICF-MR, HCBS and AllResidential Service Recipients by State on June 30, 2005
1-6 7-15 1-15 16+ Total HCBS
HCBS & Community
ICFs-MRAll HCBS &
ICFs-MR 1-6 7-15 1-15 16+ TotalAL 45.58 0.0 0.6 0.6 4.7 5.3 109.2 109.8 114.5 45.4 19.7 65.1 4.7 69.8AK 6.64 0.0 0.0 0.0 0.0 0.0 151.1 151.1 151.1 126.0 0.0 126.0 0.0 126.0AZ 59.39 0.0 0.7 0.7 2.6 3.2 281.6 282.3 284.8 60.3 0.7 61.0 3.0 64.0AR 27.79 0.0 11.4 11.4 45.7 57.1 119.8 131.2 176.9 43.7 30.0 73.8 56.9 130.6CA 361.32 16.8 0.0 16.8 11.9 28.7 170.4 187.3 199.1 126.1 4.1 130.2 16.1 146.3CO 46.65 0.4 0.0 0.4 2.3 2.6 145.2 145.6 147.8 94.6 10.7 105.3 2.3 107.6CT 35.10 8.6 0.7 9.3 23.9 33.2 187.5 196.8 220.7 137.5 13.4 151.0 23.9 174.9DE 8.44 0.0 0.0 0.0 20.4 20.4 86.8 86.8 107.2 92.2 0.0 92.2 20.4 112.6DC 5.51 117.9 21.4 139.3 0.0 139.3 110.6 249.9 249.9 188.4 21.4 209.8 0.0 209.8FL 177.90 1.3 0.1 1.4 17.5 18.9 146.2 147.6 165.1 49.3 7.2 56.5 18.8 75.3GA 90.73 0.0 0.0 0.0 12.4 12.4 93.4 93.4 105.8 46.2 0.0 46.2 14.3 60.5HI 12.75 6.9 0.0 6.9 0.0 6.9 160.0 166.9 166.9 82.9 0.6 83.5 0.0 83.5ID 14.29 10.8 22.0 32.8 6.3 39.1 119.1 151.9 158.2 188.0 35.5 223.4 19.6 243.0IL 127.63 1.6 25.2 26.8 48.4 75.2 81.9 108.7 157.1 60.6 50.6 111.2 52.2 163.4IN 62.72 51.9 0.0 51.9 10.8 62.7 148.0 199.9 210.7 161.4 0.0 161.4 11.7 173.1IA 29.66 8.1 12.9 21.1 52.5 73.6 368.6 389.6 442.1 187.6 35.7 223.4 58.1 281.5KS 27.45 2.3 5.3 7.6 15.6 23.2 246.7 254.3 269.9 184.5 11.9 196.4 15.6 211.9KY 41.73 0.0 0.6 0.6 16.8 17.4 63.6 64.2 81.0 76.1 3.1 79.2 16.8 96.0LA 45.24 44.8 22.8 67.6 53.1 120.7 117.7 185.2 238.4 88.6 22.8 111.3 54.6 166.0ME 13.22 3.0 12.3 15.3 2.6 17.9 197.0 212.3 214.9 244.5 15.3 259.8 3.7 263.5MD 56.00 0.0 0.0 0.0 6.6 6.6 168.5 168.5 175.1 111.5 5.6 117.0 7.0 124.0MA 63.99 0.0 0.0 0.0 16.4 16.4 173.9 173.9 190.3 145.4 13.8 159.2 17.1 176.3MI 101.21 0.0 0.0 0.0 1.9 1.9 85.0 85.0 86.9 139.4 0.0 139.4 1.9 154.9MN 51.33 11.8 20.0 31.8 16.3 48.1 281.9 313.7 330.0 221.0 20.0 241.0 16.3 266.7MS 29.21 0.2 21.0 21.2 69.7 90.9 66.4 87.6 157.3 23.5 24.6 48.1 69.7 117.8MO 58.00 0.1 0.8 0.9 19.5 20.4 142.5 143.5 163.0 64.6 21.1 85.7 23.3 109.0MT 9.36 0.0 0.0 0.0 8.4 8.4 216.2 216.2 224.7 136.7 43.3 180.0 8.4 188.4NE 17.59 0.0 0.5 0.5 34.5 35.0 165.3 165.9 200.4 139.3 12.1 151.4 34.5 185.9NV 24.15 3.7 0.0 3.7 4.4 8.2 54.9 58.6 63.1 58.9 0.0 58.9 4.4 63.3NH 13.10 0.0 0.0 0.0 1.9 1.9 240.8 240.8 242.7 129.5 2.8 132.3 1.9 134.2NJ 87.18 0.0 0.0 0.0 35.0 35.0 104.1 104.1 139.1 75.4 9.0 84.4 43.4 127.8NM 19.28 5.1 6.3 11.4 0.0 11.4 185.2 196.6 196.6 93.6 6.7 100.3 0.0 100.3NY 192.55 1.6 25.7 27.3 17.2 44.4 267.4 294.6 311.8 119.6 98.9 218.5 17.4 235.9NC 86.83 18.1 5.0 23.1 26.5 49.6 77.8 100.9 127.4 96.8 12.2 109.0 28.4 137.4ND 6.37 20.3 48.8 69.1 26.7 95.8 483.3 552.4 579.1 202.5 84.2 286.6 30.5 317.1OH 114.64 2.9 16.6 19.5 41.2 60.7 102.4 121.9 163.1 58.3 22.8 81.0 41.5 131.2OK 35.48 6.3 4.6 10.9 35.8 46.7 124.5 135.4 171.2 103.3 9.2 112.5 35.8 148.3OR 36.41 0.0 0.0 0.0 1.2 1.2 243.4 243.4 244.6 131.0 11.9 142.9 3.9 146.9PA 124.30 5.5 3.0 8.5 24.2 32.6 200.3 208.8 232.9 91.9 10.4 102.3 25.9 128.2RI 10.76 1.6 0.0 1.6 2.1 3.7 277.9 279.5 281.6 183.1 16.4 199.5 2.1 201.6SC 42.55 0.5 17.8 18.3 21.9 40.2 112.2 130.5 152.4 62.6 21.4 84.0 21.9 105.9SD 7.76 0.0 0.0 0.0 21.8 21.8 317.9 317.9 339.7 190.7 75.5 266.3 23.8 290.1TN 59.63 2.2 6.6 8.8 13.5 22.3 81.1 89.9 103.4 56.0 15.0 71.0 13.5 84.5TX 228.60 20.4 3.0 23.4 28.7 52.2 53.9 77.3 106.0 60.0 3.0 63.0 28.7 91.7UT 24.70 0.0 1.6 1.6 30.5 32.2 155.2 156.8 187.3 80.4 6.5 86.9 30.5 117.4VT 6.23 1.0 0.0 1.0 0.0 1.0 321.5 322.4 322.4 205.1 0.0 205.1 0.0 205.1VA 75.67 0.7 1.6 2.4 21.5 23.9 89.3 91.7 113.2 DNF DNF DNF DNF 98.1WA 62.88 0.6 0.3 0.9 11.8 12.7 150.5 151.4 163.1 90.5 4.9 95.4 19.1 114.5WV 18.17 3.5 21.6 25.1 3.2 28.3 200.8 225.9 229.1 75.4 30.5 106.0 3.2 109.2WI 55.36 0.0 1.2 1.2 31.7 32.9 234.6 235.8 267.5 182.1 19.6 201.7 31.7 233.4WY 5.09 0.0 0.0 0.0 17.3 17.3 360.7 360.7 378.0 146.1 24.5 170.6 23.6 194.2US Total 2,964.10 7.6 6.2 13.7 20.6 34.4 149.7 163.4 184.0 98.2 17.9 116.1 22.6 138.7
* excludes service recipients living in their family homes DNF = did not furnish
** Source: US Census Bureau, Population Estimates Program, July 1, 2005.
All Residential Service Recipients (Medicaid and non-Medicaid funded)*ICF-MR Residents HCBS & ICF-MR Recipients
State Populations (100,000)**State
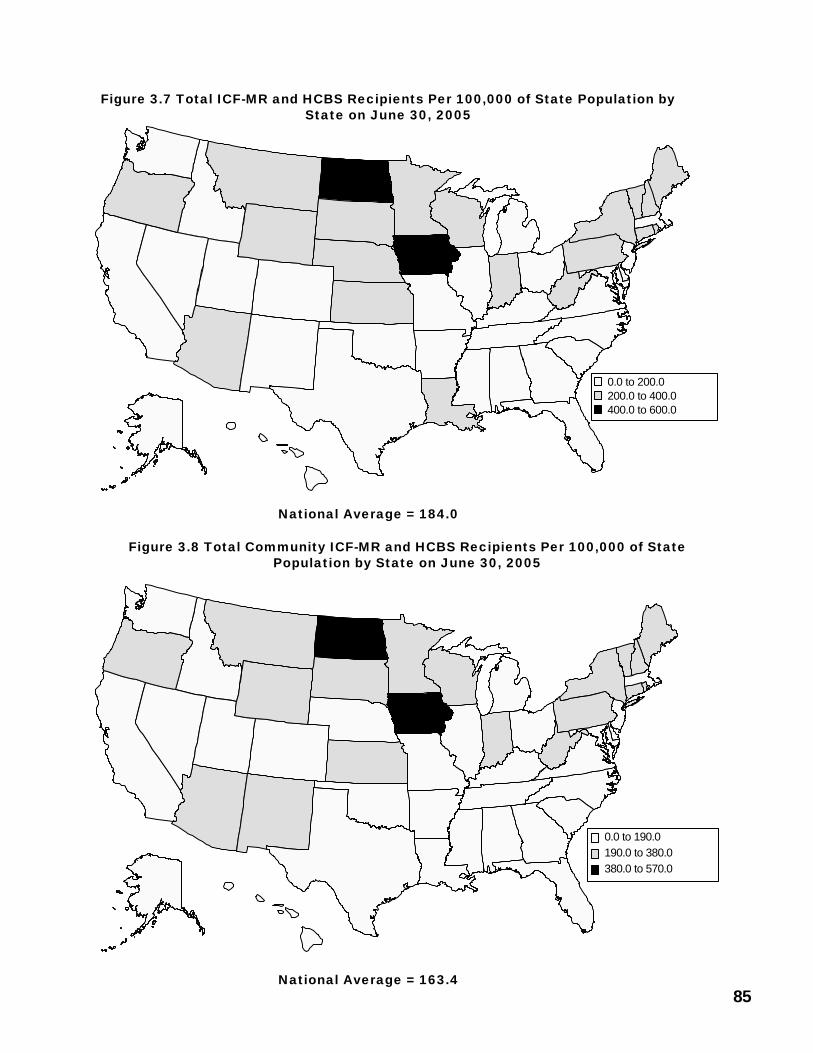
85
Figure 3.7 Total ICF-MR and HCBS Recipients Per 100,000 of State Population byState on June 30, 2005
Figure 3.8 Total Community ICF-MR and HCBS Recipients Per 100,000 of StatePopulation by State on June 30, 2005
National Average = 184.0
National Average = 163.4
IA
ND
0.0 to 200.0200.0 to 400.0400.0 to 600.0
IA
ND
0.0 to 190.0190.0 to 380.0380.0 to 570.0
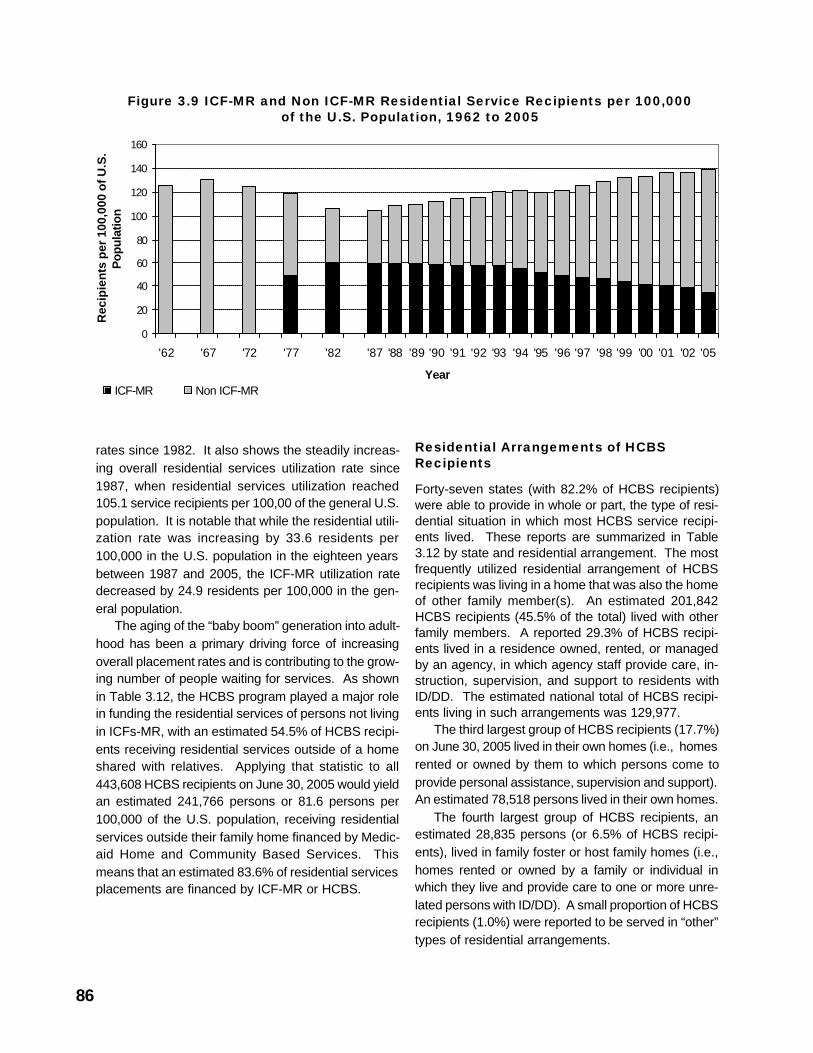
86
Figure 3.9 ICF-MR and Non ICF-MR Residential Service Recipients per 100,000of the U.S. Population, 1962 to 2005
rates since 1982. It also shows the steadily increas-ing overall residential services utilization rate since1987, when residential services utilization reached105.1 service recipients per 100,00 of the general U.S.population. It is notable that while the residential utili-zation rate was increasing by 33.6 residents per100,000 in the U.S. population in the eighteen yearsbetween 1987 and 2005, the ICF-MR utilization ratedecreased by 24.9 residents per 100,000 in the gen-eral population.
The aging of the “baby boom” generation into adult-hood has been a primary driving force of increasingoverall placement rates and is contributing to the grow-ing number of people waiting for services. As shownin Table 3.12, the HCBS program played a major rolein funding the residential services of persons not livingin ICFs-MR, with an estimated 54.5% of HCBS recipi-ents receiving residential services outside of a homeshared with relatives. Applying that statistic to all443,608 HCBS recipients on June 30, 2005 would yieldan estimated 241,766 persons or 81.6 persons per100,000 of the U.S. population, receiving residentialservices outside their family home financed by Medic-aid Home and Community Based Services. Thismeans that an estimated 83.6% of residential servicesplacements are financed by ICF-MR or HCBS.
Residential Arrangements of HCBSRecipients
Forty-seven states (with 82.2% of HCBS recipients)were able to provide in whole or part, the type of resi-dential situation in which most HCBS service recipi-ents lived. These reports are summarized in Table3.12 by state and residential arrangement. The mostfrequently utilized residential arrangement of HCBSrecipients was living in a home that was also the homeof other family member(s). An estimated 201,842HCBS recipients (45.5% of the total) lived with otherfamily members. A reported 29.3% of HCBS recipi-ents lived in a residence owned, rented, or managedby an agency, in which agency staff provide care, in-struction, supervision, and support to residents withID/DD. The estimated national total of HCBS recipi-ents living in such arrangements was 129,977.
The third largest group of HCBS recipients (17.7%)on June 30, 2005 lived in their own homes (i.e., homesrented or owned by them to which persons come toprovide personal assistance, supervision and support).An estimated 78,518 persons lived in their own homes.
The fourth largest group of HCBS recipients, anestimated 28,835 persons (or 6.5% of HCBS recipi-ents), lived in family foster or host family homes (i.e.,homes rented or owned by a family or individual inwhich they live and provide care to one or more unre-lated persons with ID/DD). A small proportion of HCBSrecipients (1.0%) were reported to be served in “other”types of residential arrangements.
0
20
40
60
80
100
120
140
160
'62 '67 '72 '77 '82 '87 '88 '89 '90 '91 '92 '93 '94 '95 '96 '97 '98 '99 '00 '01 '02 '05
Year
Rec
ipie
nts
per
100
,000
of U
.S.
Pop
ulat
ion
ICF-MR Non ICF-MR
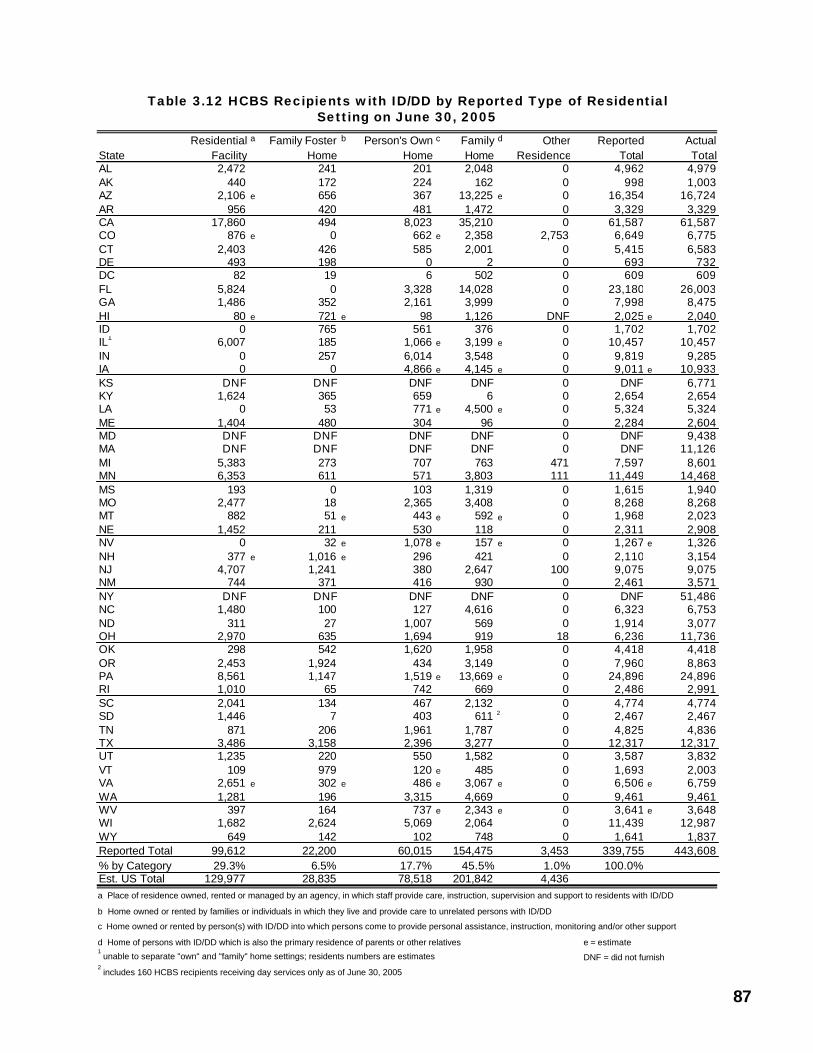
87
Table 3.12 HCBS Recipients with ID/DD by Reported Type of ResidentialSetting on June 30, 2005
StateResidential
Facility
a Family Foster Home
b Person's Own Home
c Family Home
d Other Residence
Reported Total
Actual Total
AL 2,472 241 201 2,048 0 4,962 4,979AK 440 172 224 162 0 998 1,003AZ 2,106 e 656 367 13,225 e 0 16,354 16,724AR 956 420 481 1,472 0 3,329 3,329CA 17,860 494 8,023 35,210 0 61,587 61,587CO 876 e 0 662 e 2,358 2,753 6,649 6,775CT 2,403 426 585 2,001 0 5,415 6,583DE 493 198 0 2 0 693 732DC 82 19 6 502 0 609 609FL 5,824 0 3,328 14,028 0 23,180 26,003GA 1,486 352 2,161 3,999 0 7,998 8,475HI 80 e 721 e 98 1,126 DNF 2,025 e 2,040ID 0 765 561 376 0 1,702 1,702IL1 6,007 185 1,066 e 3,199 e 0 10,457 10,457IN 0 257 6,014 3,548 0 9,819 9,285IA 0 0 4,866 e 4,145 e 0 9,011 e 10,933KS DNF DNF DNF DNF 0 DNF 6,771KY 1,624 365 659 6 0 2,654 2,654LA 0 53 771 e 4,500 e 0 5,324 5,324ME 1,404 480 304 96 0 2,284 2,604MD DNF DNF DNF DNF 0 DNF 9,438MA DNF DNF DNF DNF 0 DNF 11,126MI 5,383 273 707 763 471 7,597 8,601MN 6,353 611 571 3,803 111 11,449 14,468MS 193 0 103 1,319 0 1,615 1,940MO 2,477 18 2,365 3,408 0 8,268 8,268MT 882 51 e 443 e 592 e 0 1,968 2,023NE 1,452 211 530 118 0 2,311 2,908NV 0 32 e 1,078 e 157 e 0 1,267 e 1,326NH 377 e 1,016 e 296 421 0 2,110 3,154NJ 4,707 1,241 380 2,647 100 9,075 9,075NM 744 371 416 930 0 2,461 3,571NY DNF DNF DNF DNF 0 DNF 51,486NC 1,480 100 127 4,616 0 6,323 6,753ND 311 27 1,007 569 0 1,914 3,077OH 2,970 635 1,694 919 18 6,236 11,736OK 298 542 1,620 1,958 0 4,418 4,418OR 2,453 1,924 434 3,149 0 7,960 8,863PA 8,561 1,147 1,519 e 13,669 e 0 24,896 24,896RI 1,010 65 742 669 0 2,486 2,991SC 2,041 134 467 2,132 0 4,774 4,774SD 1,446 7 403 611 2 0 2,467 2,467TN 871 206 1,961 1,787 0 4,825 4,836TX 3,486 3,158 2,396 3,277 0 12,317 12,317UT 1,235 220 550 1,582 0 3,587 3,832VT 109 979 120 e 485 0 1,693 2,003VA 2,651 e 302 e 486 e 3,067 e 0 6,506 e 6,759WA 1,281 196 3,315 4,669 0 9,461 9,461WV 397 164 737 e 2,343 e 0 3,641 e 3,648WI 1,682 2,624 5,069 2,064 0 11,439 12,987WY 649 142 102 748 0 1,641 1,837Reported Total 99,612 22,200 60,015 154,475 3,453 339,755 443,608% by Category 29.3% 6.5% 17.7% 45.5% 1.0% 100.0%Est. US Total 129,977 28,835 78,518 201,842 4,436
b Home owned or rented by families or individuals in which they live and provide care to unrelated persons with ID/DD
c Home owned or rented by person(s) with ID/DD into which persons come to provide personal assistance, instruction, monitoring and/or other support
d Home of persons with ID/DD which is also the primary residence of parents or other relatives e = estimate1 unable to separate "own" and "family" home settings; residents numbers are estimates DNF = did not furnish
2 includes 160 HCBS recipients receiving day services only as of June 30, 2005
a Place of residence owned, rented or managed by an agency, in which staff provide care, instruction, supervision and support to residents with ID/DD
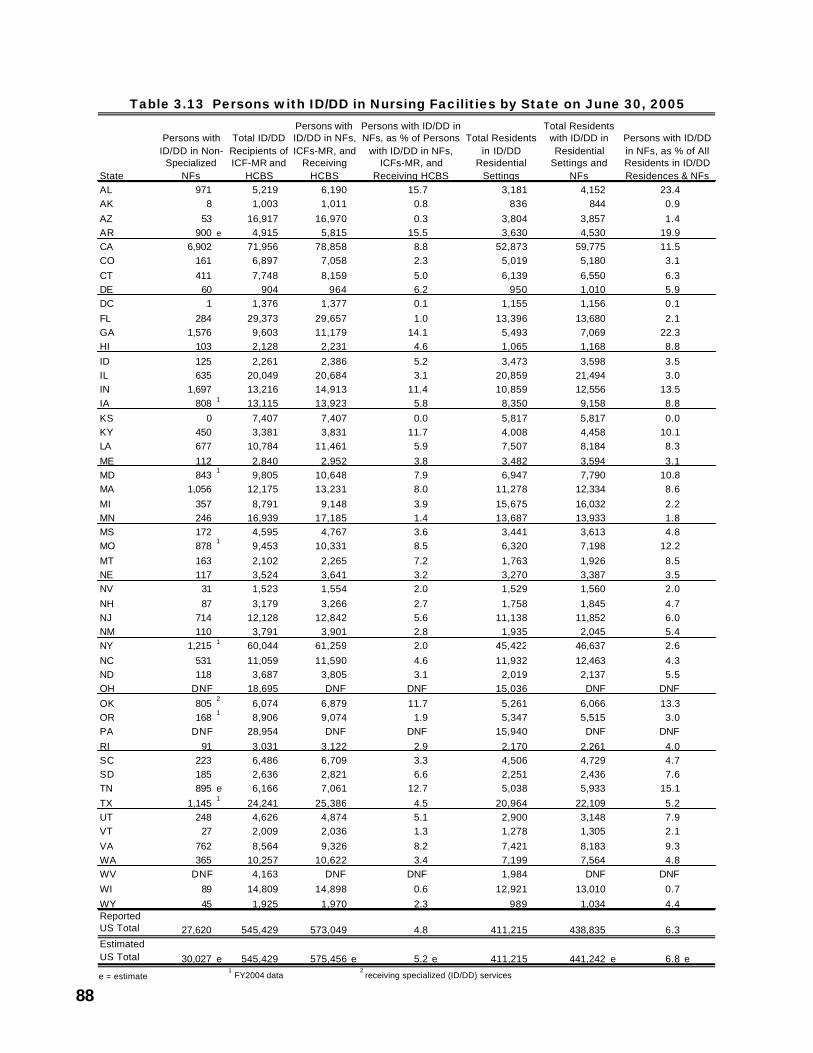
88
Table 3.13 Persons with ID/DD in Nursing Facilities by State on June 30, 2005
StateAL 971 5,219 6,190 15.7 3,181 4,152 23.4AK 8 1,003 1,011 0.8 836 844 0.9
AZ 53 16,917 16,970 0.3 3,804 3,857 1.4AR 900 e 4,915 5,815 15.5 3,630 4,530 19.9CA 6,902 71,956 78,858 8.8 52,873 59,775 11.5CO 161 6,897 7,058 2.3 5,019 5,180 3.1
CT 411 7,748 8,159 5.0 6,139 6,550 6.3DE 60 904 964 6.2 950 1,010 5.9DC 1 1,376 1,377 0.1 1,155 1,156 0.1
FL 284 29,373 29,657 1.0 13,396 13,680 2.1GA 1,576 9,603 11,179 14.1 5,493 7,069 22.3HI 103 2,128 2,231 4.6 1,065 1,168 8.8
ID 125 2,261 2,386 5.2 3,473 3,598 3.5IL 635 20,049 20,684 3.1 20,859 21,494 3.0IN 1,697 13,216 14,913 11.4 10,859 12,556 13.5IA 808 1 13,115 13,923 5.8 8,350 9,158 8.8
KS 0 7,407 7,407 0.0 5,817 5,817 0.0KY 450 3,381 3,831 11.7 4,008 4,458 10.1LA 677 10,784 11,461 5.9 7,507 8,184 8.3
ME 112 2,840 2,952 3.8 3,482 3,594 3.1MD 843
19,805 10,648 7.9 6,947 7,790 10.8
MA 1,056 12,175 13,231 8.0 11,278 12,334 8.6
MI 357 8,791 9,148 3.9 15,675 16,032 2.2MN 246 16,939 17,185 1.4 13,687 13,933 1.8MS 172 4,595 4,767 3.6 3,441 3,613 4.8MO 878
19,453 10,331 8.5 6,320 7,198 12.2
MT 163 2,102 2,265 7.2 1,763 1,926 8.5NE 117 3,524 3,641 3.2 3,270 3,387 3.5NV 31 1,523 1,554 2.0 1,529 1,560 2.0
NH 87 3,179 3,266 2.7 1,758 1,845 4.7NJ 714 12,128 12,842 5.6 11,138 11,852 6.0NM 110 3,791 3,901 2.8 1,935 2,045 5.4NY 1,215 1 60,044 61,259 2.0 45,422 46,637 2.6
NC 531 11,059 11,590 4.6 11,932 12,463 4.3ND 118 3,687 3,805 3.1 2,019 2,137 5.5OH DNF 18,695 DNF DNF 15,036 DNF DNF
OK 8052
6,074 6,879 11.7 5,261 6,066 13.3OR 168
18,906 9,074 1.9 5,347 5,515 3.0
PA DNF 28,954 DNF DNF 15,940 DNF DNF
RI 91 3,031 3,122 2.9 2,170 2,261 4.0SC 223 6,486 6,709 3.3 4,506 4,729 4.7SD 185 2,636 2,821 6.6 2,251 2,436 7.6TN 895 e 6,166 7,061 12.7 5,038 5,933 15.1
TX 1,1451
24,241 25,386 4.5 20,964 22,109 5.2UT 248 4,626 4,874 5.1 2,900 3,148 7.9VT 27 2,009 2,036 1.3 1,278 1,305 2.1
VA 762 8,564 9,326 8.2 7,421 8,183 9.3WA 365 10,257 10,622 3.4 7,199 7,564 4.8WV DNF 4,163 DNF DNF 1,984 DNF DNF
WI 89 14,809 14,898 0.6 12,921 13,010 0.7
WY 45 1,925 1,970 2.3 989 1,034 4.4Reported US Total 27,620 545,429 573,049 4.8 411,215 438,835 6.3Estimated US Total 30,027 e 545,429 575,456 e 5.2 e 411,215 441,242 e 6.8 e
e = estimate1 FY2004 data
2 receiving specialized (ID/DD) services
Persons with ID/DD in Non-
Specialized NFs
Total ID/DD Recipients of ICF-MR and
HCBS
Persons with ID/DD in NFs, ICFs-MR, and
Receiving HCBS
Persons with ID/DD in NFs, as % of Persons
with ID/DD in NFs, ICFs-MR, and
Receiving HCBS
Total Residents in ID/DD
Residential Settings
Total Residents with ID/DD in Residential
Settings and NFs
Persons with ID/DD in NFs, as % of All Residents in ID/DD Residences & NFs
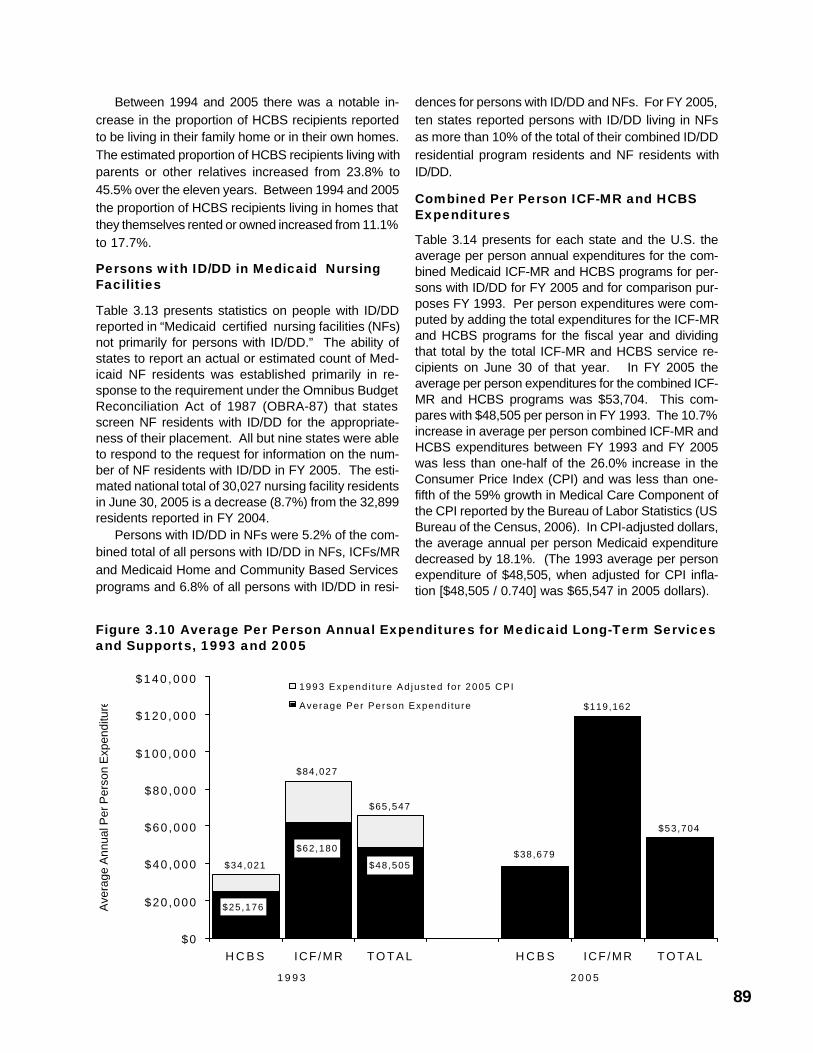
89
Between 1994 and 2005 there was a notable in-crease in the proportion of HCBS recipients reportedto be living in their family home or in their own homes.The estimated proportion of HCBS recipients living withparents or other relatives increased from 23.8% to45.5% over the eleven years. Between 1994 and 2005the proportion of HCBS recipients living in homes thatthey themselves rented or owned increased from 11.1%to 17.7%.
Persons with ID/DD in Medicaid NursingFacilities
Table 3.13 presents statistics on people with ID/DDreported in “Medicaid certified nursing facilities (NFs)not primarily for persons with ID/DD.” The ability ofstates to report an actual or estimated count of Med-icaid NF residents was established primarily in re-sponse to the requirement under the Omnibus BudgetReconciliation Act of 1987 (OBRA-87) that statesscreen NF residents with ID/DD for the appropriate-ness of their placement. All but nine states were ableto respond to the request for information on the num-ber of NF residents with ID/DD in FY 2005. The esti-mated national total of 30,027 nursing facility residentsin June 30, 2005 is a decrease (8.7%) from the 32,899residents reported in FY 2004.
Persons with ID/DD in NFs were 5.2% of the com-bined total of all persons with ID/DD in NFs, ICFs/MRand Medicaid Home and Community Based Servicesprograms and 6.8% of all persons with ID/DD in resi-
dences for persons with ID/DD and NFs. For FY 2005,ten states reported persons with ID/DD living in NFsas more than 10% of the total of their combined ID/DDresidential program residents and NF residents withID/DD.
Combined Per Person ICF-MR and HCBSExpenditures
Table 3.14 presents for each state and the U.S. theaverage per person annual expenditures for the com-bined Medicaid ICF-MR and HCBS programs for per-sons with ID/DD for FY 2005 and for comparison pur-poses FY 1993. Per person expenditures were com-puted by adding the total expenditures for the ICF-MRand HCBS programs for the fiscal year and dividingthat total by the total ICF-MR and HCBS service re-cipients on June 30 of that year. In FY 2005 theaverage per person expenditures for the combined ICF-MR and HCBS programs was $53,704. This com-pares with $48,505 per person in FY 1993. The 10.7%increase in average per person combined ICF-MR andHCBS expenditures between FY 1993 and FY 2005was less than one-half of the 26.0% increase in theConsumer Price Index (CPI) and was less than one-fifth of the 59% growth in Medical Care Component ofthe CPI reported by the Bureau of Labor Statistics (USBureau of the Census, 2006). In CPI-adjusted dollars,the average annual per person Medicaid expendituredecreased by 18.1%. (The 1993 average per personexpenditure of $48,505, when adjusted for CPI infla-tion [$48,505 / 0.740] was $65,547 in 2005 dollars).
Figure 3.10 Average Per Person Annual Expenditures for Medicaid Long-Term Servicesand Supports, 1993 and 2005
$34,021
$84,027
$65,547
$119,162
$53,704
$38,679
$25,176
$48,505
$62,180
$0
$20 ,000
$40 ,000
$60 ,000
$80 ,000
$100 ,000
$120 ,000
$140 ,000
H C B S ICF /MR T O T A L H C B S ICF /MR T O T A L
Ave
rage
Ann
ual P
er P
erso
n E
xpen
ditu
re
1993 Expend i tu re Ad jus ted fo r 2005 CPI
Average Per Person Expend i tu re
1 9 9 3 2 0 0 5
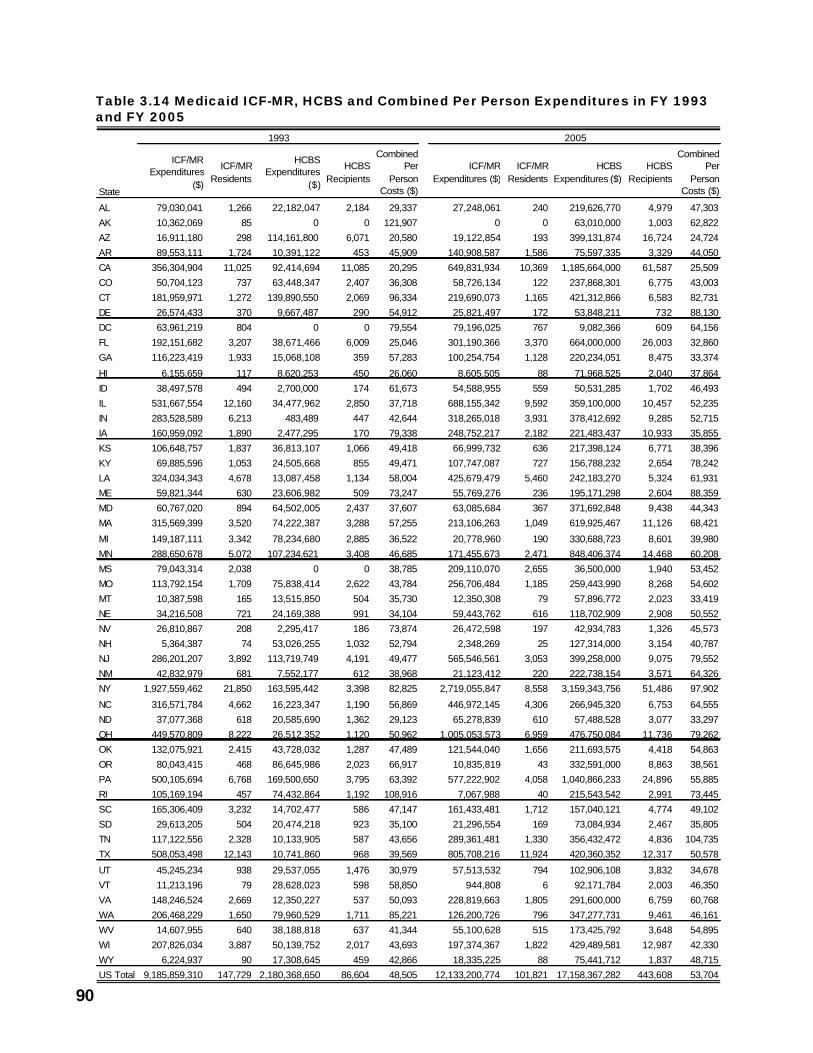
90
Table 3.14 Medicaid ICF-MR, HCBS and Combined Per Person Expenditures in FY 1993and FY 2005
State
ICF/MR Expenditures
($)
ICF/MR Residents
HCBS Expenditures
($)
HCBS Recipients
Combined Per
Person Costs ($)
ICF/MR Expenditures ($)
ICF/MR Residents
HCBS Expenditures ($)
HCBS Recipients
Combined Per
Person Costs ($)
AL 79,030,041 1,266 22,182,047 2,184 29,337 27,248,061 240 219,626,770 4,979 47,303
AK 10,362,069 85 0 0 121,907 0 0 63,010,000 1,003 62,822
AZ 16,911,180 298 114,161,800 6,071 20,580 19,122,854 193 399,131,874 16,724 24,724
AR 89,553,111 1,724 10,391,122 453 45,909 140,908,587 1,586 75,597,335 3,329 44,050
CA 356,304,904 11,025 92,414,694 11,085 20,295 649,831,934 10,369 1,185,664,000 61,587 25,509
CO 50,704,123 737 63,448,347 2,407 36,308 58,726,134 122 237,868,301 6,775 43,003
CT 181,959,971 1,272 139,890,550 2,069 96,334 219,690,073 1,165 421,312,866 6,583 82,731
DE 26,574,433 370 9,667,487 290 54,912 25,821,497 172 53,848,211 732 88,130
DC 63,961,219 804 0 0 79,554 79,196,025 767 9,082,366 609 64,156
FL 192,151,682 3,207 38,671,466 6,009 25,046 301,190,366 3,370 664,000,000 26,003 32,860
GA 116,223,419 1,933 15,068,108 359 57,283 100,254,754 1,128 220,234,051 8,475 33,374
HI 6,155,659 117 8,620,253 450 26,060 8,605,505 88 71,968,525 2,040 37,864
ID 38,497,578 494 2,700,000 174 61,673 54,588,955 559 50,531,285 1,702 46,493
IL 531,667,554 12,160 34,477,962 2,850 37,718 688,155,342 9,592 359,100,000 10,457 52,235
IN 283,528,589 6,213 483,489 447 42,644 318,265,018 3,931 378,412,692 9,285 52,715
IA 160,959,092 1,890 2,477,295 170 79,338 248,752,217 2,182 221,483,437 10,933 35,855
KS 106,648,757 1,837 36,813,107 1,066 49,418 66,999,732 636 217,398,124 6,771 38,396
KY 69,885,596 1,053 24,505,668 855 49,471 107,747,087 727 156,788,232 2,654 78,242
LA 324,034,343 4,678 13,087,458 1,134 58,004 425,679,479 5,460 242,183,270 5,324 61,931
ME 59,821,344 630 23,606,982 509 73,247 55,769,276 236 195,171,298 2,604 88,359
MD 60,767,020 894 64,502,005 2,437 37,607 63,085,684 367 371,692,848 9,438 44,343
MA 315,569,399 3,520 74,222,387 3,288 57,255 213,106,263 1,049 619,925,467 11,126 68,421
MI 149,187,111 3,342 78,234,680 2,885 36,522 20,778,960 190 330,688,723 8,601 39,980
MN 288,650,678 5,072 107,234,621 3,408 46,685 171,455,673 2,471 848,406,374 14,468 60,208
MS 79,043,314 2,038 0 0 38,785 209,110,070 2,655 36,500,000 1,940 53,452
MO 113,792,154 1,709 75,838,414 2,622 43,784 256,706,484 1,185 259,443,990 8,268 54,602
MT 10,387,598 165 13,515,850 504 35,730 12,350,308 79 57,896,772 2,023 33,419
NE 34,216,508 721 24,169,388 991 34,104 59,443,762 616 118,702,909 2,908 50,552
NV 26,810,867 208 2,295,417 186 73,874 26,472,598 197 42,934,783 1,326 45,573
NH 5,364,387 74 53,026,255 1,032 52,794 2,348,269 25 127,314,000 3,154 40,787
NJ 286,201,207 3,892 113,719,749 4,191 49,477 565,546,561 3,053 399,258,000 9,075 79,552
NM 42,832,979 681 7,552,177 612 38,968 21,123,412 220 222,738,154 3,571 64,326
NY 1,927,559,462 21,850 163,595,442 3,398 82,825 2,719,055,847 8,558 3,159,343,756 51,486 97,902
NC 316,571,784 4,662 16,223,347 1,190 56,869 446,972,145 4,306 266,945,320 6,753 64,555
ND 37,077,368 618 20,585,690 1,362 29,123 65,278,839 610 57,488,528 3,077 33,297
OH 449,570,809 8,222 26,512,352 1,120 50,962 1,005,053,573 6,959 476,750,084 11,736 79,262
OK 132,075,921 2,415 43,728,032 1,287 47,489 121,544,040 1,656 211,693,575 4,418 54,863
OR 80,043,415 468 86,645,986 2,023 66,917 10,835,819 43 332,591,000 8,863 38,561
PA 500,105,694 6,768 169,500,650 3,795 63,392 577,222,902 4,058 1,040,866,233 24,896 55,885
RI 105,169,194 457 74,432,864 1,192 108,916 7,067,988 40 215,543,542 2,991 73,445
SC 165,306,409 3,232 14,702,477 586 47,147 161,433,481 1,712 157,040,121 4,774 49,102
SD 29,613,205 504 20,474,218 923 35,100 21,296,554 169 73,084,934 2,467 35,805
TN 117,122,556 2,328 10,133,905 587 43,656 289,361,481 1,330 356,432,472 4,836 104,735
TX 508,053,498 12,143 10,741,860 968 39,569 805,708,216 11,924 420,360,352 12,317 50,578
UT 45,245,234 938 29,537,055 1,476 30,979 57,513,532 794 102,906,108 3,832 34,678
VT 11,213,196 79 28,628,023 598 58,850 944,808 6 92,171,784 2,003 46,350
VA 148,246,524 2,669 12,350,227 537 50,093 228,819,663 1,805 291,600,000 6,759 60,768
WA 206,468,229 1,650 79,960,529 1,711 85,221 126,200,726 796 347,277,731 9,461 46,161
WV 14,607,955 640 38,188,818 637 41,344 55,100,628 515 173,425,792 3,648 54,895
WI 207,826,034 3,887 50,139,752 2,017 43,693 197,374,367 1,822 429,489,581 12,987 42,330
WY 6,224,937 90 17,308,645 459 42,866 18,335,225 88 75,441,712 1,837 48,715
US Total 9,185,859,310 147,729 2,180,368,650 86,604 48,505 12,133,200,774 101,821 17,158,367,282 443,608 53,704
1993 2005
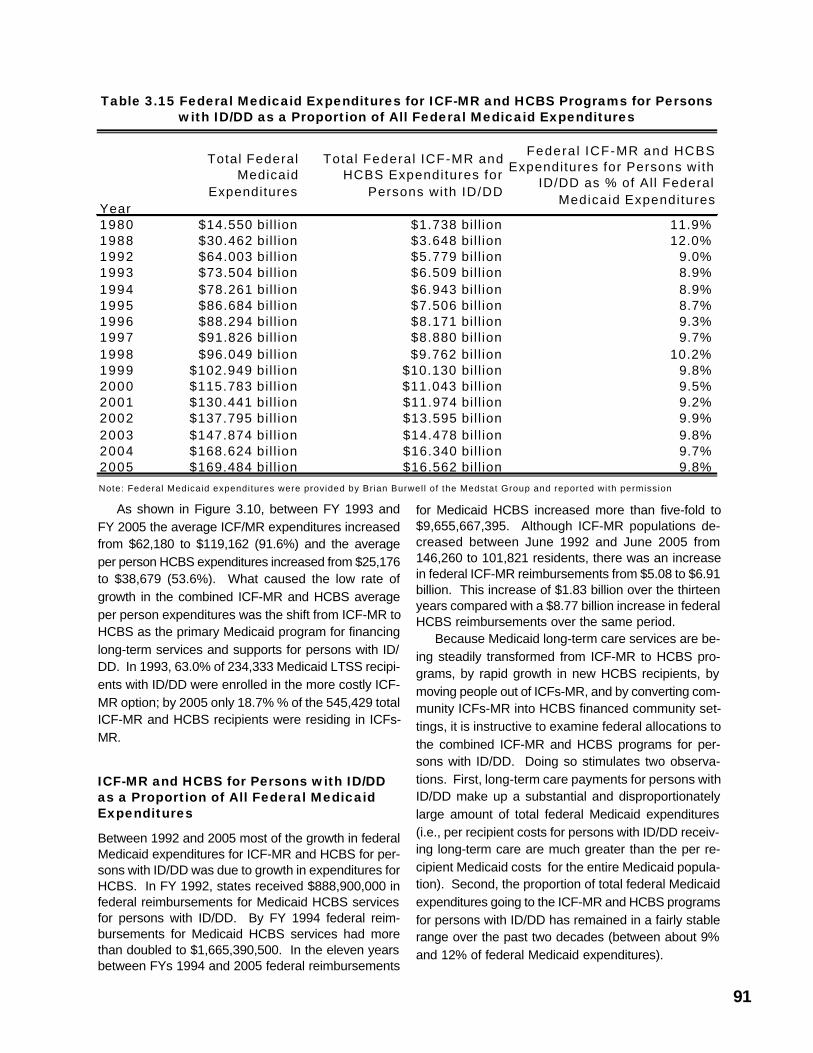
91
Table 3.15 Federal Medicaid Expenditures for ICF-MR and HCBS Programs for Personswith ID/DD as a Proportion of All Federal Medicaid Expenditures
As shown in Figure 3.10, between FY 1993 andFY 2005 the average ICF/MR expenditures increasedfrom $62,180 to $119,162 (91.6%) and the averageper person HCBS expenditures increased from $25,176to $38,679 (53.6%). What caused the low rate ofgrowth in the combined ICF-MR and HCBS averageper person expenditures was the shift from ICF-MR toHCBS as the primary Medicaid program for financinglong-term services and supports for persons with ID/DD. In 1993, 63.0% of 234,333 Medicaid LTSS recipi-ents with ID/DD were enrolled in the more costly ICF-MR option; by 2005 only 18.7% % of the 545,429 totalICF-MR and HCBS recipients were residing in ICFs-MR.
ICF-MR and HCBS for Persons with ID/DDas a Proportion of All Federal MedicaidExpenditures
Between 1992 and 2005 most of the growth in federalMedicaid expenditures for ICF-MR and HCBS for per-sons with ID/DD was due to growth in expenditures forHCBS. In FY 1992, states received $888,900,000 infederal reimbursements for Medicaid HCBS servicesfor persons with ID/DD. By FY 1994 federal reim-bursements for Medicaid HCBS services had morethan doubled to $1,665,390,500. In the eleven yearsbetween FYs 1994 and 2005 federal reimbursements
for Medicaid HCBS increased more than five-fold to$9,655,667,395. Although ICF-MR populations de-creased between June 1992 and June 2005 from146,260 to 101,821 residents, there was an increasein federal ICF-MR reimbursements from $5.08 to $6.91billion. This increase of $1.83 billion over the thirteenyears compared with a $8.77 billion increase in federalHCBS reimbursements over the same period.
Because Medicaid long-term care services are be-ing steadily transformed from ICF-MR to HCBS pro-grams, by rapid growth in new HCBS recipients, bymoving people out of ICFs-MR, and by converting com-munity ICFs-MR into HCBS financed community set-tings, it is instructive to examine federal allocations tothe combined ICF-MR and HCBS programs for per-sons with ID/DD. Doing so stimulates two observa-tions. First, long-term care payments for persons withID/DD make up a substantial and disproportionatelylarge amount of total federal Medicaid expenditures(i.e., per recipient costs for persons with ID/DD receiv-ing long-term care are much greater than the per re-cipient Medicaid costs for the entire Medicaid popula-tion). Second, the proportion of total federal Medicaidexpenditures going to the ICF-MR and HCBS programsfor persons with ID/DD has remained in a fairly stablerange over the past two decades (between about 9%and 12% of federal Medicaid expenditures).
Year
Total Federal Medicaid
Expenditures
Total Federal ICF-MR and HCBS Expenditures for
Persons with ID/DD
Federa l ICF-MR and HCBS Expenditures for Persons with
ID/DD as % of Al l Federal Medicaid Expenditures
1980 $14.550 bil l ion $1.738 bi l l ion 11.9%1988 $30.462 bil l ion $3.648 bi l l ion 12.0%1992 $64.003 bil l ion $5.779 bi l l ion 9.0%1993 $73.504 bil l ion $6.509 bi l l ion 8.9%1994 $78.261 bil l ion $6.943 bi l l ion 8.9%1995 $86.684 bil l ion $7.506 bi l l ion 8.7%1996 $88.294 bil l ion $8.171 bi l l ion 9.3%1997 $91.826 bil l ion $8.880 bi l l ion 9.7%1998 $96.049 bil l ion $9.762 bi l l ion 10.2%1999 $102.949 bi l l ion $10.130 bil l ion 9.8%2000 $115.783 bi l l ion $11.043 bil l ion 9.5%2001 $130.441 bi l l ion $11.974 bil l ion 9.2%2002 $137.795 bi l l ion $13.595 bil l ion 9.9%2003 $147.874 bi l l ion $14.478 bil l ion 9.8%2004 $168.624 bi l l ion $16.340 bil l ion 9.7%2005 $169.484 bi l l ion $16.562 bil l ion 9.8%
Note: Federal Medicaid expenditures were provided by Brian Burwell of the Medstat Group and reported with permission
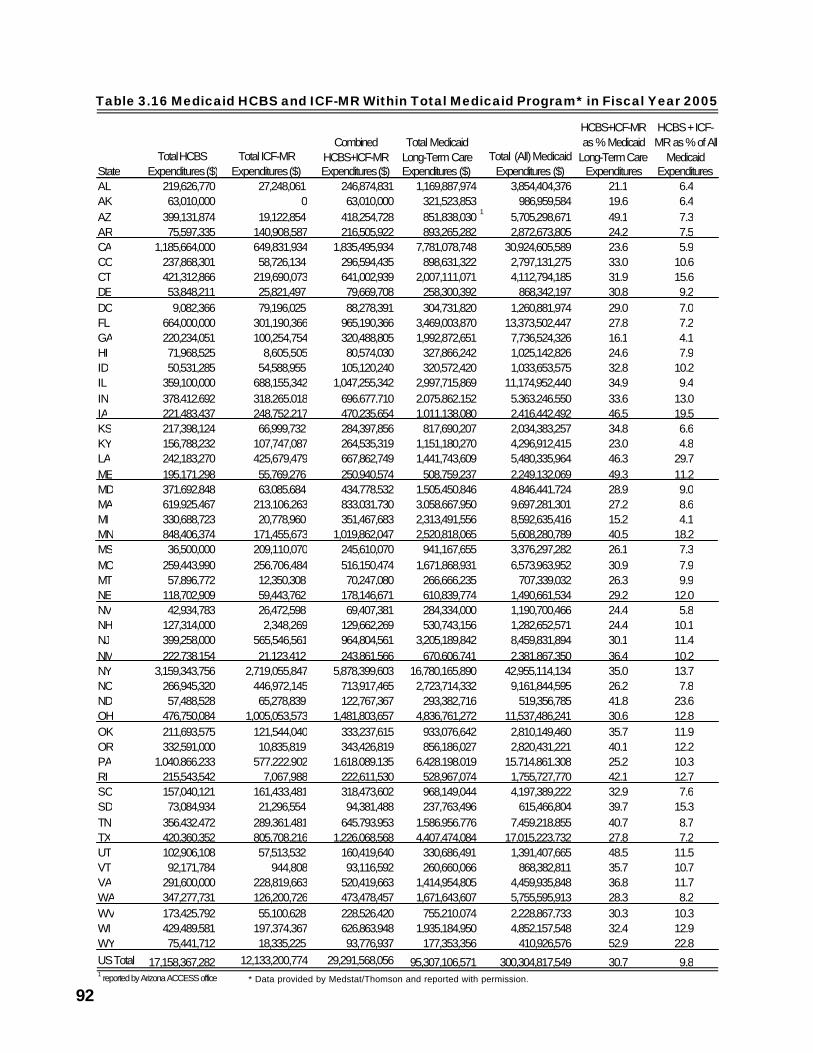
92
Table 3.16 Medicaid HCBS and ICF-MR Within Total Medicaid Program* in Fiscal Year 2005
AL 219,626,770 27,248,061 246,874,831 1,169,887,974 3,854,404,376 21.1 6.4AK 63,010,000 0 63,010,000 321,523,853 986,959,584 19.6 6.4AZ 399,131,874 19,122,854 418,254,728 851,838,030 1 5,705,298,671 49.1 7.3AR 75,597,335 140,908,587 216,505,922 893,265,282 2,872,673,805 24.2 7.5CA 1,185,664,000 649,831,934 1,835,495,934 7,781,078,748 30,924,605,589 23.6 5.9CO 237,868,301 58,726,134 296,594,435 898,631,322 2,797,131,275 33.0 10.6CT 421,312,866 219,690,073 641,002,939 2,007,111,071 4,112,794,185 31.9 15.6DE 53,848,211 25,821,497 79,669,708 258,300,392 868,342,197 30.8 9.2DC 9,082,366 79,196,025 88,278,391 304,731,820 1,260,881,974 29.0 7.0FL 664,000,000 301,190,366 965,190,366 3,469,003,870 13,373,502,447 27.8 7.2GA 220,234,051 100,254,754 320,488,805 1,992,872,651 7,736,524,326 16.1 4.1HI 71,968,525 8,605,505 80,574,030 327,866,242 1,025,142,826 24.6 7.9ID 50,531,285 54,588,955 105,120,240 320,572,420 1,033,653,575 32.8 10.2IL 359,100,000 688,155,342 1,047,255,342 2,997,715,869 11,174,952,440 34.9 9.4IN 378,412,692 318,265,018 696,677,710 2,075,862,152 5,363,246,550 33.6 13.0IA 221,483,437 248,752,217 470,235,654 1,011,138,080 2,416,442,492 46.5 19.5KS 217,398,124 66,999,732 284,397,856 817,690,207 2,034,383,257 34.8 6.6KY 156,788,232 107,747,087 264,535,319 1,151,180,270 4,296,912,415 23.0 4.8LA 242,183,270 425,679,479 667,862,749 1,441,743,609 5,480,335,964 46.3 29.7ME 195,171,298 55,769,276 250,940,574 508,759,237 2,249,132,069 49.3 11.2MD 371,692,848 63,085,684 434,778,532 1,505,450,846 4,846,441,724 28.9 9.0MA 619,925,467 213,106,263 833,031,730 3,058,667,950 9,697,281,301 27.2 8.6MI 330,688,723 20,778,960 351,467,683 2,313,491,556 8,592,635,416 15.2 4.1MN 848,406,374 171,455,673 1,019,862,047 2,520,818,065 5,608,280,789 40.5 18.2MS 36,500,000 209,110,070 245,610,070 941,167,655 3,376,297,282 26.1 7.3MO 259,443,990 256,706,484 516,150,474 1,671,868,931 6,573,963,952 30.9 7.9MT 57,896,772 12,350,308 70,247,080 266,666,235 707,339,032 26.3 9.9NE 118,702,909 59,443,762 178,146,671 610,839,774 1,490,661,534 29.2 12.0NV 42,934,783 26,472,598 69,407,381 284,334,000 1,190,700,466 24.4 5.8NH 127,314,000 2,348,269 129,662,269 530,743,156 1,282,652,571 24.4 10.1NJ 399,258,000 565,546,561 964,804,561 3,205,189,842 8,459,831,894 30.1 11.4NM 222,738,154 21,123,412 243,861,566 670,606,741 2,381,867,350 36.4 10.2NY 3,159,343,756 2,719,055,847 5,878,399,603 16,780,165,890 42,955,114,134 35.0 13.7NC 266,945,320 446,972,145 713,917,465 2,723,714,332 9,161,844,595 26.2 7.8ND 57,488,528 65,278,839 122,767,367 293,382,716 519,356,785 41.8 23.6OH 476,750,084 1,005,053,573 1,481,803,657 4,836,761,272 11,537,486,241 30.6 12.8OK 211,693,575 121,544,040 333,237,615 933,076,642 2,810,149,460 35.7 11.9OR 332,591,000 10,835,819 343,426,819 856,186,027 2,820,431,221 40.1 12.2PA 1,040,866,233 577,222,902 1,618,089,135 6,428,198,019 15,714,861,308 25.2 10.3RI 215,543,542 7,067,988 222,611,530 528,967,074 1,755,727,770 42.1 12.7SC 157,040,121 161,433,481 318,473,602 968,149,044 4,197,389,222 32.9 7.6SD 73,084,934 21,296,554 94,381,488 237,763,496 615,466,804 39.7 15.3TN 356,432,472 289,361,481 645,793,953 1,586,956,776 7,459,218,855 40.7 8.7TX 420,360,352 805,708,216 1,226,068,568 4,407,474,084 17,015,223,732 27.8 7.2UT 102,906,108 57,513,532 160,419,640 330,686,491 1,391,407,665 48.5 11.5VT 92,171,784 944,808 93,116,592 260,660,066 868,382,811 35.7 10.7VA 291,600,000 228,819,663 520,419,663 1,414,954,805 4,459,935,848 36.8 11.7WA 347,277,731 126,200,726 473,478,457 1,671,643,607 5,755,595,913 28.3 8.2WV 173,425,792 55,100,628 228,526,420 755,210,074 2,228,867,733 30.3 10.3WI 429,489,581 197,374,367 626,863,948 1,935,184,950 4,852,157,548 32.4 12.9WY 75,441,712 18,335,225 93,776,937 177,353,356 410,926,576 52.9 22.8US Total 17,158,367,282 12,133,200,774 29,291,568,056 95,307,106,571 300,304,817,549 30.7 9.8
StateTotal ICF-MR
Expenditures ($)
Combined HCBS+ICF-MR Expenditures ($)
Total Medicaid Long-Term Care Expenditures ($)
Total (All) Medicaid Expenditures ($)
Total HCBS Expenditures ($)
HCBS+ICF-MR as % Medicaid
Long-Term Care Expenditures
HCBS + ICF-MR as % of All
Medicaid Expenditures
1 reported by Arizona ACCESS office * Data provided by Medstat/Thomson and reported with permission.
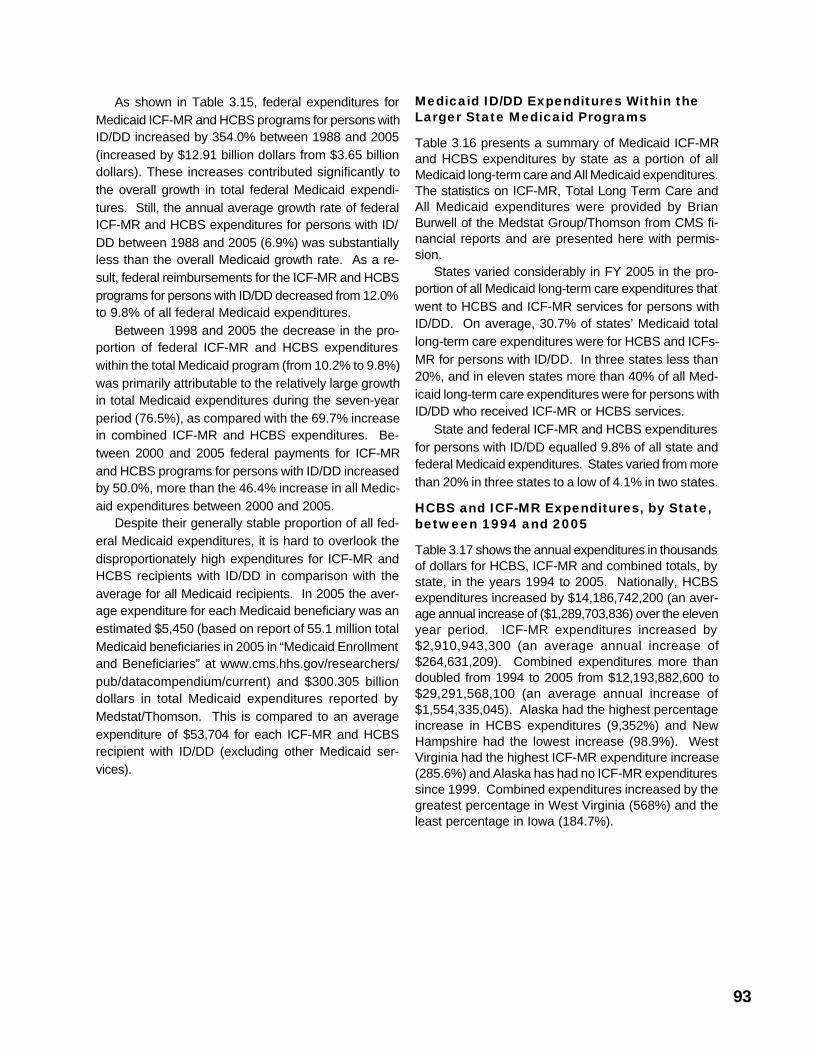
93
As shown in Table 3.15, federal expenditures forMedicaid ICF-MR and HCBS programs for persons withID/DD increased by 354.0% between 1988 and 2005(increased by $12.91 billion dollars from $3.65 billiondollars). These increases contributed significantly tothe overall growth in total federal Medicaid expendi-tures. Still, the annual average growth rate of federalICF-MR and HCBS expenditures for persons with ID/DD between 1988 and 2005 (6.9%) was substantiallyless than the overall Medicaid growth rate. As a re-sult, federal reimbursements for the ICF-MR and HCBSprograms for persons with ID/DD decreased from 12.0%to 9.8% of all federal Medicaid expenditures.
Between 1998 and 2005 the decrease in the pro-portion of federal ICF-MR and HCBS expenditureswithin the total Medicaid program (from 10.2% to 9.8%)was primarily attributable to the relatively large growthin total Medicaid expenditures during the seven-yearperiod (76.5%), as compared with the 69.7% increasein combined ICF-MR and HCBS expenditures. Be-tween 2000 and 2005 federal payments for ICF-MRand HCBS programs for persons with ID/DD increasedby 50.0%, more than the 46.4% increase in all Medic-aid expenditures between 2000 and 2005.
Despite their generally stable proportion of all fed-eral Medicaid expenditures, it is hard to overlook thedisproportionately high expenditures for ICF-MR andHCBS recipients with ID/DD in comparison with theaverage for all Medicaid recipients. In 2005 the aver-age expenditure for each Medicaid beneficiary was anestimated $5,450 (based on report of 55.1 million totalMedicaid beneficiaries in 2005 in “Medicaid Enrollmentand Beneficiaries” at www.cms.hhs.gov/researchers/pub/datacompendium/current) and $300.305 billiondollars in total Medicaid expenditures reported byMedstat/Thomson. This is compared to an averageexpenditure of $53,704 for each ICF-MR and HCBSrecipient with ID/DD (excluding other Medicaid ser-vices).
Medicaid ID/DD Expenditures Within theLarger State Medicaid Programs
Table 3.16 presents a summary of Medicaid ICF-MRand HCBS expenditures by state as a portion of allMedicaid long-term care and All Medicaid expenditures.The statistics on ICF-MR, Total Long Term Care andAll Medicaid expenditures were provided by BrianBurwell of the Medstat Group/Thomson from CMS fi-nancial reports and are presented here with permis-sion.
States varied considerably in FY 2005 in the pro-portion of all Medicaid long-term care expenditures thatwent to HCBS and ICF-MR services for persons withID/DD. On average, 30.7% of states’ Medicaid totallong-term care expenditures were for HCBS and ICFs-MR for persons with ID/DD. In three states less than20%, and in eleven states more than 40% of all Med-icaid long-term care expenditures were for persons withID/DD who received ICF-MR or HCBS services.
State and federal ICF-MR and HCBS expendituresfor persons with ID/DD equalled 9.8% of all state andfederal Medicaid expenditures. States varied from morethan 20% in three states to a low of 4.1% in two states.
HCBS and ICF-MR Expenditures, by State,between 1994 and 2005
Table 3.17 shows the annual expenditures in thousandsof dollars for HCBS, ICF-MR and combined totals, bystate, in the years 1994 to 2005. Nationally, HCBSexpenditures increased by $14,186,742,200 (an aver-age annual increase of ($1,289,703,836) over the elevenyear period. ICF-MR expenditures increased by$2,910,943,300 (an average annual increase of$264,631,209). Combined expenditures more thandoubled from 1994 to 2005 from $12,193,882,600 to$29,291,568,100 (an average annual increase of$1,554,335,045). Alaska had the highest percentageincrease in HCBS expenditures (9,352%) and NewHampshire had the lowest increase (98.9%). WestVirginia had the highest ICF-MR expenditure increase(285.6%) and Alaska has had no ICF-MR expendituressince 1999. Combined expenditures increased by thegreatest percentage in West Virginia (568%) and theleast percentage in Iowa (184.7%).
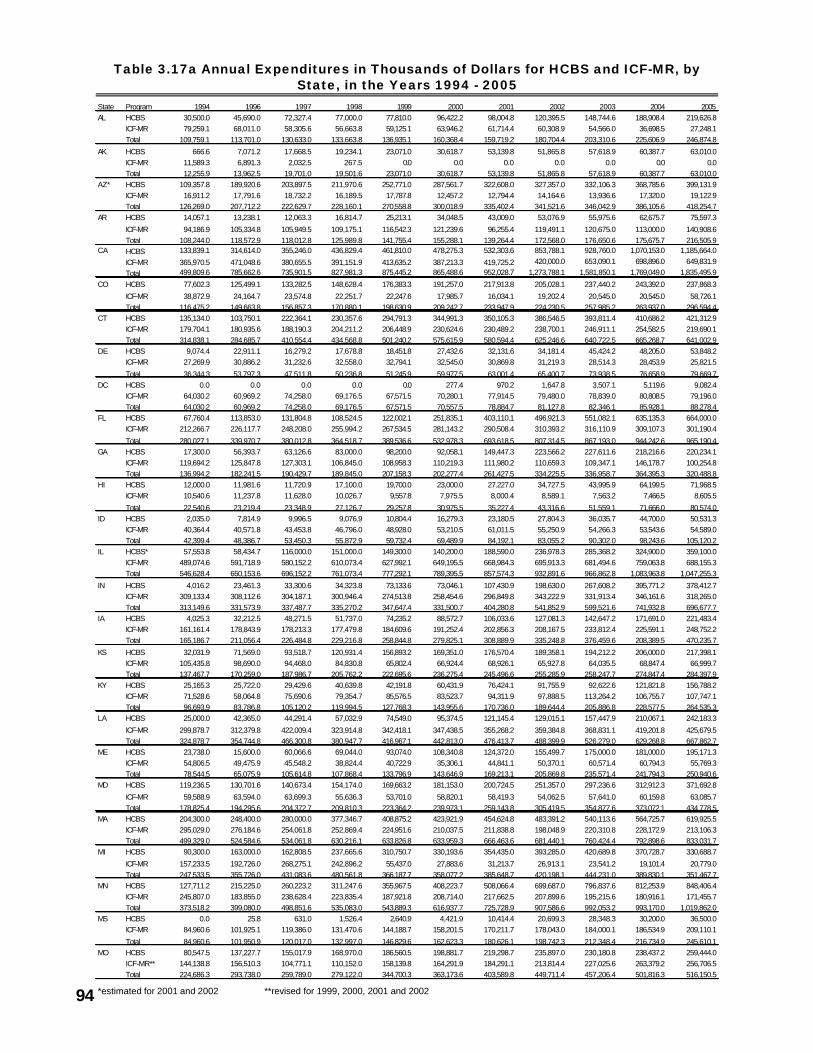
94
Table 3.17a Annual Expenditures in Thousands of Dollars for HCBS and ICF-MR, byState, in the Years 1994 - 2005
*estimated for 2001 and 2002 **revised for 1999, 2000, 2001 and 2002
State Program 1994 1996 1997 1998 1999 2000 2001 2002 2003 2004 2005AL HCBS 30,500.0 45,690.0 72,327.4 77,000.0 77,810.0 96,422.2 98,004.8 120,395.5 148,744.6 188,908.4 219,626.8
ICF-MR 79,259.1 68,011.0 58,305.6 56,663.8 59,125.1 63,946.2 61,714.4 60,308.9 54,566.0 36,698.5 27,248.1Total 109,759.1 113,701.0 130,633.0 133,663.8 136,935.1 160,368.4 159,719.2 180,704.4 203,310.6 225,606.9 246,874.8
AK HCBS 666.6 7,071.2 17,668.5 19,234.1 23,071.0 30,618.7 53,139.8 51,865.8 57,618.9 60,387.7 63,010.0ICF-MR 11,589.3 6,891.3 2,032.5 267.5 0.0 0.0 0.0 0.0 0.0 0.0 0.0Total 12,255.9 13,962.5 19,701.0 19,501.6 23,071.0 30,618.7 53,139.8 51,865.8 57,618.9 60,387.7 63,010.0
AZ* HCBS 109,357.8 189,920.6 203,897.5 211,970.6 252,771.0 287,561.7 322,608.0 327,357.0 332,106.3 368,785.6 399,131.9ICF-MR 16,911.2 17,791.6 18,732.2 16,189.5 17,787.8 12,457.2 12,794.4 14,164.6 13,936.6 17,320.0 19,122.9Total 126,269.0 207,712.2 222,629.7 228,160.1 270,558.8 300,018.9 335,402.4 341,521.6 346,042.9 386,105.6 418,254.7
AR HCBS 14,057.1 13,238.1 12,063.3 16,814.7 25,213.1 34,048.5 43,009.0 53,076.9 55,975.6 62,675.7 75,597.3
ICF-MR 94,186.9 105,334.8 105,949.5 109,175.1 116,542.3 121,239.6 96,255.4 119,491.1 120,675.0 113,000.0 140,908.6Total 108,244.0 118,572.9 118,012.8 125,989.8 141,755.4 155,288.1 139,264.4 172,568.0 176,650.6 175,675.7 216,505.9
CA HCBS 133,839.1 314,614.0 355,246.0 436,829.4 461,810.0 478,275.3 532,303.6 853,788.1 928,760.0 1,070,153.0 1,185,664.0
ICF-MR 365,970.5 471,048.6 380,655.5 391,151.9 413,635.2 387,213.3 419,725.2 420,000.0 653,090.1 698,896.0 649,831.9
Total 499,809.6 785,662.6 735,901.5 827,981.3 875,445.2 865,488.6 952,028.7 1,273,788.1 1,581,850.1 1,769,049.0 1,835,495.9
CO HCBS 77,602.3 125,499.1 133,282.5 148,628.4 176,383.3 191,257.0 217,913.8 205,028.1 237,440.2 243,392.0 237,868.3
ICF-MR 38,872.9 24,164.7 23,574.8 22,251.7 22,247.6 17,985.7 16,034.1 19,202.4 20,545.0 20,545.0 58,726.1Total 116,475.2 149,663.8 156,857.3 170,880.1 198,630.9 209,242.7 233,947.9 224,230.5 257,985.2 263,937.0 296,594.4
CT HCBS 135,134.0 103,750.1 222,364.1 230,357.6 294,791.3 344,991.3 350,105.3 386,546.5 393,811.4 410,686.2 421,312.9ICF-MR 179,704.1 180,935.6 188,190.3 204,211.2 206,448.9 230,624.6 230,489.2 238,700.1 246,911.1 254,582.5 219,690.1Total 314,838.1 284,685.7 410,554.4 434,568.8 501,240.2 575,615.9 580,594.4 625,246.6 640,722.5 665,268.7 641,002.9
DE HCBS 9,074.4 22,911.1 16,279.2 17,678.8 18,451.8 27,432.6 32,131.6 34,181.4 45,424.2 48,205.0 53,848.2ICF-MR 27,269.9 30,886.2 31,232.6 32,558.0 32,794.1 32,545.0 30,869.8 31,219.3 28,514.3 28,453.9 25,821.5
Total 36,344.3 53,797.3 47,511.8 50,236.8 51,245.9 59,977.5 63,001.4 65,400.7 73,938.5 76,658.9 79,669.7DC HCBS 0.0 0.0 0.0 0.0 0.0 277.4 970.2 1,647.8 3,507.1 5,119.6 9,082.4
ICF-MR 64,030.2 60,969.2 74,258.0 69,176.5 67,571.5 70,280.1 77,914.5 79,480.0 78,839.0 80,808.5 79,196.0Total 64,030.2 60,969.2 74,258.0 69,176.5 67,571.5 70,557.5 78,884.7 81,127.8 82,346.1 85,928.1 88,278.4
FL HCBS 67,760.4 113,853.0 131,804.8 108,524.5 122,002.1 251,835.1 403,110.1 496,921.3 551,082.1 635,135.3 664,000.0ICF-MR 212,266.7 226,117.7 248,208.0 255,994.2 267,534.5 281,143.2 290,508.4 310,393.2 316,110.9 309,107.3 301,190.4
Total 280,027.1 339,970.7 380,012.8 364,518.7 389,536.6 532,978.3 693,618.5 807,314.5 867,193.0 944,242.6 965,190.4GA HCBS 17,300.0 56,393.7 63,126.6 83,000.0 98,200.0 92,058.1 149,447.3 223,566.2 227,611.6 218,216.6 220,234.1
ICF-MR 119,694.2 125,847.8 127,303.1 106,845.0 108,958.3 110,219.3 111,980.2 110,659.3 109,347.1 146,178.7 100,254.8Total 136,994.2 182,241.5 190,429.7 189,845.0 207,158.3 202,277.4 261,427.5 334,225.5 336,958.7 364,395.3 320,488.8
HI HCBS 12,000.0 11,981.6 11,720.9 17,100.0 19,700.0 23,000.0 27.227.0 34,727.5 43,995.9 64,199.5 71,968.5ICF-MR 10,540.6 11,237.8 11,628.0 10,026.7 9,557.8 7,975.5 8,000.4 8,589.1 7,563.2 7,466.5 8,605.5
Total 22,540.6 23,219.4 23,348.9 27,126.7 29,257.8 30,975.5 35,227.4 43,316.6 51,559.1 71,666.0 80,574.0ID HCBS 2,035.0 7,814.9 9,996.5 9,076.9 10,804.4 16,279.3 23,180.5 27,804.3 36,035.7 44,700.0 50,531.3
ICF-MR 40,364.4 40,571.8 43,453.8 46,796.0 48,928.0 53,210.5 61,011.5 55,250.9 54,266.3 53,543.6 54,589.0Total 42,399.4 48,386.7 53,450.3 55,872.9 59,732.4 69,489.9 84,192.1 83,055.2 90,302.0 98,243.6 105,120.2
IL HCBS* 57,553.8 58,434.7 116,000.0 151,000.0 149,300.0 140,200.0 188,590.0 236,978.3 285,368.2 324,900.0 359,100.0ICF-MR 489,074.6 591,718.9 580,152.2 610,073.4 627,992.1 649,195.5 668,984.3 695,913.3 681,494.6 759,063.8 688,155.3Total 546,628.4 650,153.6 696,152.2 761,073.4 777,292.1 789,395.5 857,574.3 932,891.6 966,862.8 1,083,963.8 1,047,255.3
IN HCBS 4,016.2 23,461.3 33,300.6 34,323.8 73,133.6 73,046.1 107,430.9 198,630.0 267,608.2 395,771.2 378,412.7ICF-MR 309,133.4 308,112.6 304,187.1 300,946.4 274,513.8 258,454.6 296,849.8 343,222.9 331,913.4 346,161.6 318,265.0Total 313,149.6 331,573.9 337,487.7 335,270.2 347,647.4 331,500.7 404,280.8 541,852.9 599,521.6 741,932.8 696,677.7
IA HCBS 4,025.3 32,212.5 48,271.5 51,737.0 74,235.2 88,572.7 106,033.6 127,081.3 142,647.2 171,691.0 221,483.4ICF-MR 161,161.4 178,843.9 178,213.3 177,479.8 184,609.6 191,252.4 202,856.3 208,167.5 233,812.4 225,591.1 248,752.2Total 165,186.7 211,056.4 226,484.8 229,216.8 258,844.8 279,825.1 308,889.9 335,248.8 376,459.6 208,389.5 470,235.7
KS HCBS 32,031.9 71,569.0 93,518.7 120,931.4 156,893.2 169,351.0 176,570.4 189,358.1 194,212.2 206,000.0 217,398.1ICF-MR 105,435.8 98,690.0 94,468.0 84,830.8 65,802.4 66,924.4 68,926.1 65,927.8 64,035.5 68,847.4 66,999.7Total 137,467.7 170,259.0 187,986.7 205,762.2 222,695.6 236,275.4 245,496.6 255,285.9 258,247.7 274,847.4 284,397.9
KY HCBS 25,165.3 25,722.0 29,429.6 40,639.8 42,191.8 60,431.9 76,424.1 91,755.9 92,622.6 121,821.8 156,788.2ICF-MR 71,528.6 58,064.8 75,690.6 79,354.7 85,576.5 83,523.7 94,311.9 97,888.5 113,264.2 106,755.7 107,747.1Total 96,693.9 83,786.8 105,120.2 119,994.5 127,768.3 143,955.6 170,736.0 189,644.4 205,886.8 228,577.5 264,535.3
LA HCBS 25,000.0 42,365.0 44,291.4 57,032.9 74,549.0 95,374.5 121,145.4 129,015.1 157,447.9 210,067.1 242,183.3
ICF-MR 299,878.7 312,379.8 422,009.4 323,914.8 342,418.1 347,438.5 355,268.2 359,384.8 368,831.1 419,201.8 425,679.5Total 324,878.7 354,744.8 466,300.8 380,947.7 416,967.1 442,813.0 476,413.7 488,399.9 526,279.0 629,268.8 667,862.7
ME HCBS 23,738.0 15,600.0 60,066.6 69,044.0 93,074.0 108,340.8 124,372.0 155,499.7 175,000.0 181,000.0 195,171.3ICF-MR 54,806.5 49,475.9 45,548.2 38,824.4 40,722.9 35,306.1 44,841.1 50,370.1 60,571.4 60,794.3 55,769.3Total 78,544.5 65,075.9 105,614.8 107,868.4 133,796.9 143,646.9 169,213.1 205,869.8 235,571.4 241,794.3 250,940.6
MD HCBS 119,236.5 130,701.6 140,673.4 154,174.0 169,663.2 181,153.0 200,724.5 251,357.0 297,236.6 312,912.3 371,692.8
ICF-MR 59,588.9 63,594.0 63,699.3 55,636.3 53,701.0 58,820.1 58,419.3 54,062.5 57,641.0 60,159.8 63,085.7Total 178,825.4 194,295.6 204,372.7 209,810.3 223,364.2 239,973.1 259,143.8 305,419.5 354,877.6 373,072.1 434,778.5
MA HCBS 204,300.0 248,400.0 280,000.0 377,346.7 408,875.2 423,921.9 454,624.8 483,391.2 540,113.6 564,725.7 619,925.5ICF-MR 295,029.0 276,184.6 254,061.8 252,869.4 224,951.6 210,037.5 211,838.8 198,048.9 220,310.8 228,172.9 213,106.3Total 499,329.0 524,584.6 534,061.8 630,216.1 633,826.8 633,959.3 666,463.6 681,440.1 760,424.4 792,898.6 833,031.7
MI HCBS 90,300.0 163,000.0 162,808.5 237,665.6 310,750.7 330,193.6 354,435.0 393,285.0 420,689.8 370,728.7 330,688.7
ICF-MR 157,233.5 192,726.0 268,275.1 242,896.2 55,437.0 27,883.6 31,213.7 26,913.1 23,541.2 19,101.4 20,779.0Total 247,533.5 355,726.0 431,083.6 480,561.8 366,187.7 358,077.2 385,648.7 420,198.1 444,231.0 389,830.1 351,467.7
MN HCBS 127,711.2 215,225.0 260,223.2 311,247.6 355,967.5 408,223.7 508,066.4 699,687.0 796,837.6 812,253.9 848,406.4ICF-MR 245,807.0 183,855.0 238,628.4 223,835.4 187,921.8 208,714.0 217,662.5 207,899.6 195,215.6 180,916.1 171,455.7Total 373,518.2 399,080.0 498,851.6 535,083.0 543,889.3 616,937.7 725,728.9 907,586.6 992,053.2 993,170.0 1,019,862.0
MS HCBS 0.0 25.8 631.0 1,526.4 2,640.9 4,421.9 10,414.4 20,699.3 28,348.3 30,200.0 36,500.0ICF-MR 84,960.6 101,925.1 119,386.0 131,470.6 144,188.7 158,201.5 170,211.7 178,043.0 184,000.1 186,534.9 209,110.1
Total 84,960.6 101,950.9 120,017.0 132,997.0 146,829.6 162,623.3 180,626.1 198,742.3 212,348.4 216,734.9 245,610.1MO HCBS 80,547.5 137,227.7 155,017.9 168,970.0 186,560.5 198,881.7 219,298.7 235,897.0 230,180.8 238,437.2 259,444.0
ICF-MR** 144,138.8 156,510.3 104,771.1 110,152.0 158,139.8 164,291.9 184,291.1 213,814.4 227,025.6 263,379.2 256,706.5Total 224,686.3 293,738.0 259,789.0 279,122.0 344,700.3 363,173.6 403,589.8 449,711.4 457,206.4 501,816.3 516,150.5
95
Table 3.17b Annual Expenditures in Thousands of Dollars for HCBS and ICF-MR, byState, in the Years 1994 - 2005
State Program 1994 1996 1997 1998 1999 2000 2001 2002 2003 2004 2005
MT HCBS 15,564.4 20,399.9 22,500.0 26,300.0 27,315.1 33,561.6 36,886.2 42,005.4 59,850.9 55,109.2 57,896.8ICF-MR 14,221.8 14,747.4 15,809.4 12,132.4 16,374.8 17,425.1 21,363.4 14,061.1 11,480.3 19,298.6 12,350.3Total 29,786.2 35,147.3 38,309.4 38,432.4 43,689.9 50,986.6 58,249.5 56,066.5 71,331.2 74,407.8 70,247.1
NE HCBS 32,271.4 45,063.0 58,901.0 67,147.9 75,600.5 82,541.5 87,763.0 108,402.2 109,030.3 129,734.1 118,702.9ICF-MR 34,234.1 36,497.9 36,895.8 42,975.9 45,105.3 48,861.9 47,765.8 47,952.6 49,171.0 60,806.6 59,443.8Total 66,505.5 81,560.9 95,796.8 110,123.8 120,705.8 131,403.3 135,528.8 156,354.8 158,201.3 190,540.7 178,146.7
NV HCBS 2,060.4 4,640.2 4,877.3 8,353.3 9,182.0 12,245.0 20,046.6 24,367.3 27,432.1 33,976.3 42,934.8ICF-MR 20,334.9 23,737.0 22,844.6 25,448.6 26,715.8 28,496.2 28,912.5 30,468.3 24,825.0 26,018.9 26,472.6Total 22,395.3 28,377.2 27,721.9 33,801.9 35,897.8 40,741.2 48,959.0 54,835.6 52,257.1 59,995.2 69,407.4
NH HCBS 64,005.4 80,460.1 89,427.2 97,407.3 102,433.8 99,742.7 113,414.4 117,921.6 118,532.8 122,893.4 127,314.0ICF-MR 5,979.8 3,290.8 1,299.2 1,502.3 1,593.0 1,660.4 2,146.9 1,952.8 1,865.9 2,290.0 2,348.3Total 69,985.2 83,750.9 90,726.4 98,909.6 104,026.8 101,403.1 115,561.4 119,874.4 120,398.7 125,183.5 129,662.3
NJ HCBS 130,063.5 154,968.0 180,066.0 199,366.0 284,536.0 296,254.0 360,838.0 402,988.0 363,752.0 380,018.0 399,258.0ICF-MR 357,321.4 359,085.3 373,077.5 347,216.5 377,878.9 380,579.7 421,459.4 462,968.8 426,296.0 512,838.2 565,546.6Total 487,384.9 514,053.3 553,143.5 546,582.5 662,414.9 676,833.7 782,297.4 865,956.8 790,048.0 892,856.2 964,804.6
NM HCBS 10,178.7 71,840.1 46,295.3 91,603.1 100,117.4 109,600.0 132,070.0 157,256.0 183,000.0 197,237.0 222,738.2ICF-MR 38,311.0 31,852.6 21,728.7 16,315.8 15,331.9 27,815.2 18,412.4 18,993.1 19,693.6 22,941.0 21,123.4Total 48,489.7 103,692.7 68,024.0 107,918.9 115,449.3 137,415.2 150,482.4 176,249.1 202,693.6 220,178.0 243,861.6
NY HCBS 403,370.9 728,613.8 1,114,422.8 1,343,414.4 1,561,068.4 1,694,409.8 1,701,780.2 2,125,806.3 2,120,120.2 2,517,127.5 3,159,343.8ICF-MR 2,011,018.2 2,112,557.2 2,010,005.6 2,047,529.2 2,126,786.3 2,129,387.5 2,159,385.1 2,201,916.5 2,439,086.4 2,575,882.3 2,719,055.8Total 2,414,389.1 2,841,171.0 3,124,428.4 3,390,943.6 3,687,854.7 3,823,797.3 3,861,165.3 4,327,722.8 4,559,206.6 5,093,009.8 5,878,399.6
NC HCBS 19,846.2 56,651.0 106,199.2 134,166.8 136,043.3 182,951.6 217,112.0 254,336.7 259,000.0 265,354.5 266,945.3ICF-MR 331,537.7 347,958.3 363,153.0 380,157.1 393,413.3 396,863.4 400,129.5 416,422.6 418,466.7 431,968.0 446,972.1Total 351,383.9 404,609.3 469,352.2 514,323.9 529,456.6 579,814.9 617,241.5 670,759.3 677,466.7 697,322.5 713,917.5
ND HCBS 23,270.0 28,924.5 30,176.0 33,850.1 37,634.4 41,961.9 44,856.2 47,531.2 49,235.2 53,906.8 57,488.5ICF-MR 38,746.8 41,528.3 43,652.9 44,306.1 45,057.3 49,980.5 48,135.0 53,136.7 51,650.8 54,839.1 65,278.8Total 62,016.8 70,452.8 73,828.9 78,156.2 82,691.7 91,942.4 92,991.2 100,667.9 100,886.0 108,745.9 122,767.4
OH HCBS 49,739.5 91,365.2 90,058.2 108,500.0 179,811.8 178,002.9 195,088.8 245,009.4 392,420.4 436,393.2 476,750.1ICF-MR 453,032.9 473,811.9 391,631.0 534,896.1 511,978.9 558,612.2 737,436.1 926,944.1 991,909.0 961,446.3 1,005,053.6Total 502,772.4 565,177.1 481,689.2 643,396.1 691,790.7 736,615.2 932,524.9 1,171,953.5 1,384,329.4 1,397,839.6 1,481,803.7
OK HCBS 57,848.6 104,988.4 93,593.0 119,327.7 134,251.3 147,633.0 177,065.3 222,356.1 205,536.7 216,911.2 211,693.6ICF-MR 91,297.6 92,345.1 100,899.6 106,414.2 101,701.8 103,178.3 114,124.0 108,821.8 111,600.2 120,545.1 121,544.0Total 149,146.2 197,333.5 194,492.6 225,741.9 235,953.1 250,811.4 291,189.3 331,177.9 317,136.9 337,456.3 333,237.6
OR HCBS 78,199.6 99,133.7 105,178.1 127,803.0 161,500.0 232,255.3 292,334.0 283,161.0 285,540.3 314,616.4 332,591.0ICF-MR 78,885.5 77,571.2 75,273.3 76,396.0 66,732.2 24,519.8 11,216.8 9,895.3 8,151.3 13,280.9 10,835.8Total 157,085.1 176,704.9 180,451.4 204,199.0 228,232.2 256,775.1 303,550.8 293,056.3 293,691.6 327,897.3 343,426.8
PA HCBS 247,511.0 340,698.9 415,399.5 446,453.6 532,018.0 677,863.1 789,398.9 977,487.2 1,044,794.1 1,075,805.8 1,040,866.2ICF-MR 501,094.4 554,620.6 544,000.0 554,600.9 518,343.0 496,918.6 486,148.8 497,866.5 509,008.0 501,747.7 577,222.9Total 748,605.4 895,319.5 959,399.5 1,001,054.5 1,050,361.0 1,174,781.7 1,275,547.7 1,475,353.7 1,553,802.1 1,577,553.4 1,618,089.1
RI HCBS 58,725.0 80,600.0 107,961.8 125,265.5 97,626.8 145,629.0 149,671.0 160,859.5 196,070.6 215,616.2 215,543.5ICF-MR 42,164.5 34,010.5 10,401.5 5,893.1 5,270.2 6,292.1 7,094.5 7,244.4 6,980.0 7,686.2 7,068.0Total 100,889.5 114,610.5 118,363.3 131,158.6 102,897.0 151,921.1 156,765.6 168,103.9 203,050.6 223,302.4 222,611.5
SC HCBS 18,000.0 32,600.0 51,300.0 70,200.0 92,203.0 111,100.0 132,300.0 142,500.0 146,580.0 150,252.9 157,040.1ICF-MR 172,312.3 184,919.2 174,750.1 172,453.5 167,756.4 171,931.8 169,106.5 174,843.2 167,696.1 174,884.2 161,433.5Total 190,312.3 217,519.2 226,050.1 242,653.5 259,959.4 283,031.8 301,406.5 317,343.2 314,276.1 325,137.1 318,473.6
SD HCBS 22,526.6 33,903.1 38,738.7 40,462.0 47,366.8 49,960.4 53,865.2 58,935.2 62,745.4 66,860.6 73,084.9ICF-MR 31,815.5 28,309.1 20,194.1 20,468.6 18,483.5 17,999.2 18,503.2 18,447.7 18,508.7 18,794.0 21,296.6Total 54,342.1 62,212.2 58,932.8 60,930.6 65,850.3 67,959.6 72,368.4 77,382.9 81,254.1 85,654.6 94,381.5
TN HCBS 16,031.0 71,431.4 72,738.5 96,592.9 135,111.0 159,937.1 201,248.8 205,313.6 277,187.6 285,820.1 356,432.5ICF-MR 135,559.6 201,502.7 212,774.0 243,620.0 237,723.1 234,719.4 232,818.1 253,862.7 255,674.6 227,494.1 289,361.5Total 151,590.6 272,934.1 285,512.5 340,212.9 372,834.1 394,656.5 434,066.9 459,176.3 532,862.2 513,314.2 645,794.0
TX HCBS 47,384.3 82,982.5 159,896.1 210,371.2 261,474.0 269,268.0 305,889.9 321,670.6 346,975.0 377,677.1 420,360.4ICF-MR 552,768.7 580,187.8 640,849.0 646,617.5 587,317.7 728,986.8 724,585.0 771,325.8 818,269.8 826,576.4 805,708.2Total 600,153.0 663,170.3 800,745.1 856,988.7 848,791.8 998,254.8 1,030,474.8 1,092,996.4 1,165,244.8 1,204,253.5 1,226,068.6
UT HCBS 31,114.3 40,827.0 50,793.7 58,316.4 65,767.7 74,301.9 82,351.4 88,991.0 94,610.1 98,482.0 102,906.1ICF-MR 38,094.7 46,127.9 45,047.1 43,954.8 51,317.7 53,199.5 54,230.2 54,883.1 54,664.4 53,977.4 57,513.5Total 69,209.0 86,954.9 95,840.8 102,271.2 117,085.4 127,501.4 136,581.5 143,874.1 149,274.5 152,459.4 160,419.6
VT HCBS 33,139.6 45,137.8 47,980.3 51,557.6 54,437.8 60,014.2 68,534.5 74,856.2 77,823.5 85,189.9 92,171.8ICF-MR 5,525.3 3,091.1 1,478.7 1,566.6 1,559.2 1,661.4 1,628.4 1,630.7 1,528.8 829.4 944.8Total 38,664.9 48,228.9 49,459.0 53,124.2 55,997.0 61,675.5 70,162.9 76,486.9 79,352.3 86,019.3 93,116.6
VA HCBS 26,129.7 50,479.1 67,429.9 88,557.3 113,354.5 144,547.9 174,353.9 198,911.2 228,194.2 231,967.0 291,600.0ICF-MR 153,543.5 153,656.3 159,667.0 160,216.7 169,784.4 183,139.8 187,412.0 211,837.7 215,350.8 201,974.3 228,819.7Total 179,673.2 204,135.4 227,096.9 248,774.0 283,138.9 327,687.7 361,765.9 410,748.9 443,545.0 433,941.3 520,419.7
WA HCBS 77,223.3 97,771.9 105,005.6 115,511.4 128,863.3 183,834.6 203,064.3 214,490.5 236,271.8 246,126.6 347,277.7ICF-MR 166,587.7 121,523.0 128,968.2 127,047.3 129,584.1 133,127.0 130,662.5 129,321.2 112,399.0 124,232.2 126,200.7Total 243,811.0 219,294.9 233,973.8 242,558.7 258,447.4 316,961.7 333,726.8 343,811.7 348,670.8 370,358.8 473,478.4
WV HCBS 19,923.4 36,075.3 43,659.5 57,750.7 66,636.0 87,636.0 97,574.5 120,217.7 141,395.8 143,430.6 173,425.8ICF-MR 14,288.2 53,704.3 52,705.2 48,655.6 45,810.8 47,088.5 47,763.2 47,513.2 53,018.6 54,248.9 55,100.6Total 34,211.6 89,779.6 96,364.7 106,406.3 112,446.8 134,724.5 145,337.7 167,730.9 194,414.4 197,679.5 228,526.4
WI HCBS 60,559.1 103,000.0 155,238.0 193,666.2 237,380.2 273,005.5 300,057.9 297,750.6 344,729.1 376,713.2 429,489.6ICF-MR 188,315.6 204,564.5 201,998.5 202,485.8 159,078.2 254,700.3 205,681.1 226,316.8 224,092.1 226,961.3 197,374.4Total 248,874.7 307,564.5 357,236.5 396,152.0 396,458.4 527,705.8 505,739.0 524,067.4 568,821.2 603,674.6 626,863.9
WY HCBS 23,986.8 29,157.6 33,428.0 38,222.2 40,983.4 44,143.5 46,598.1 56,956.5 61,657.6 67,460.7 75,441.7ICF-MR 6,829.1 10,483.6 17,777.8 16,630.2 14,385.5 16,054.3 14,856.4 11,662.1 15,807.9 16,908.4 18,335.2Total 30,815.9 39,641.2 51,205.8 54,852.4 55,368.9 60,197.8 61,454.5 68,618.6 77,465.5 84,369.1 93,776.9
US HCBS 2,971,625.1 4,714,394.1 5,965,273.4 7,133,408.6 8,364,718.5 9,663,900.7 11,277,419.5 12,979,622.3 14,122,912.5 15,505,753.7 17,158,367.3ICF-MR 9,222,257.5 9,733,572.7 9,996,224.0 9,833,092.1 9,594,717.6 9,902,142.7 10,235,442.1 10,867,404.1 11,473,216.1 11,929,750.1 12,133,200.8Total 12,193,882.6 14,447,966.8 15,961,497.4 16,966,500.7 17,959,436.2 19,566,043.4 21,512,861.6 23,847,026.4 25,596,128.6 27,435,503.8 29,291,568.1
*estimated for 2001 and 2002 **revised for 1999, 2000, 2001 and 2002
Section 4State Profiles of Selected Service
Indicators, 1977-2005
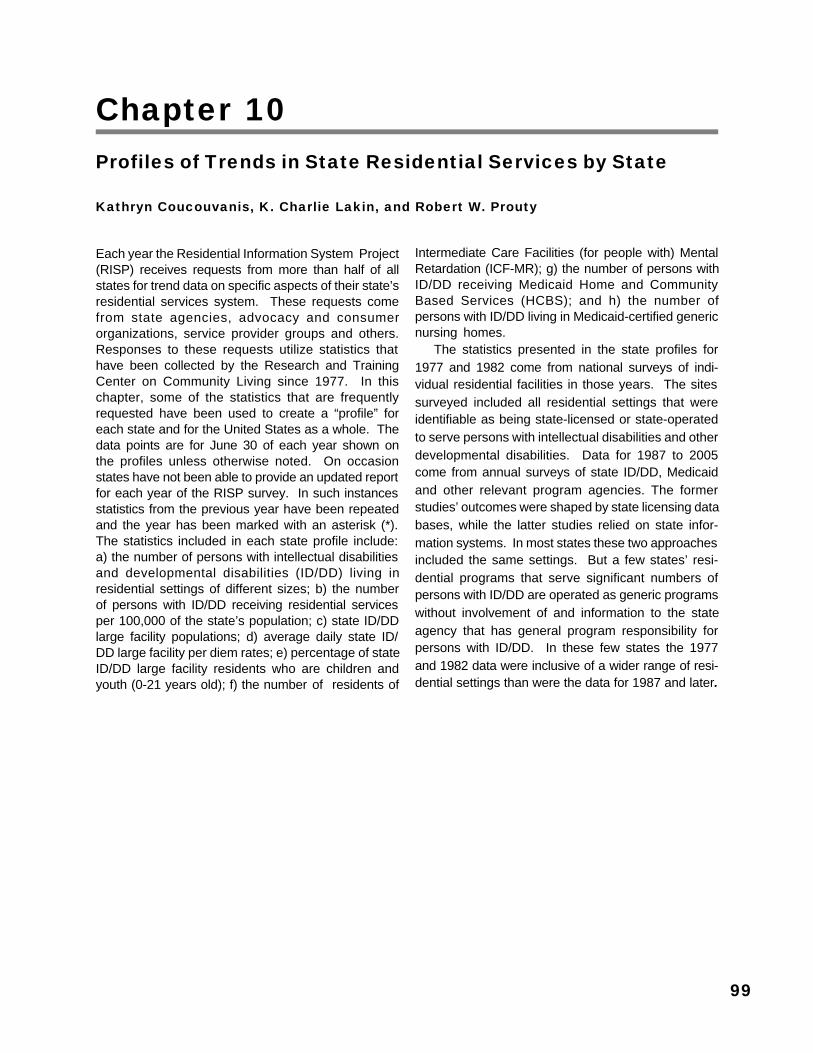
99
Chapter 10Profiles of Trends in State Residential Services by State
Kathryn Coucouvanis, K. Charlie Lakin, and Robert W. Prouty
Each year the Residential Information System Project(RISP) receives requests from more than half of allstates for trend data on specific aspects of their state’sresidential services system. These requests comefrom state agencies, advocacy and consumerorganizations, service provider groups and others.Responses to these requests utilize statistics thathave been collected by the Research and TrainingCenter on Community Living since 1977. In thischapter, some of the statistics that are frequentlyrequested have been used to create a “profile” foreach state and for the United States as a whole. Thedata points are for June 30 of each year shown onthe profiles unless otherwise noted. On occasionstates have not been able to provide an updated reportfor each year of the RISP survey. In such instancesstatistics from the previous year have been repeatedand the year has been marked with an asterisk (*).The statistics included in each state profile include:a) the number of persons with intellectual disabilitiesand developmental disabilities (ID/DD) living inresidential settings of different sizes; b) the numberof persons with ID/DD receiving residential servicesper 100,000 of the state’s population; c) state ID/DDlarge facility populations; d) average daily state ID/DD large facility per diem rates; e) percentage of stateID/DD large facility residents who are children andyouth (0-21 years old); f) the number of residents of
Intermediate Care Facilities (for people with) MentalRetardation (ICF-MR); g) the number of persons withID/DD receiving Medicaid Home and CommunityBased Services (HCBS); and h) the number ofpersons with ID/DD living in Medicaid-certified genericnursing homes.
The statistics presented in the state profiles for1977 and 1982 come from national surveys of indi-vidual residential facilities in those years. The sitessurveyed included all residential settings that wereidentifiable as being state-licensed or state-operatedto serve persons with intellectual disabilities and otherdevelopmental disabilities. Data for 1987 to 2005come from annual surveys of state ID/DD, Medicaidand other relevant program agencies. The formerstudies’ outcomes were shaped by state licensing databases, while the latter studies relied on state infor-mation systems. In most states these two approachesincluded the same settings. But a few states’ resi-dential programs that serve significant numbers ofpersons with ID/DD are operated as generic programswithout involvement of and information to the stateagency that has general program responsibility forpersons with ID/DD. In these few states the 1977and 1982 data were inclusive of a wider range of resi-dential settings than were the data for 1987 and later.
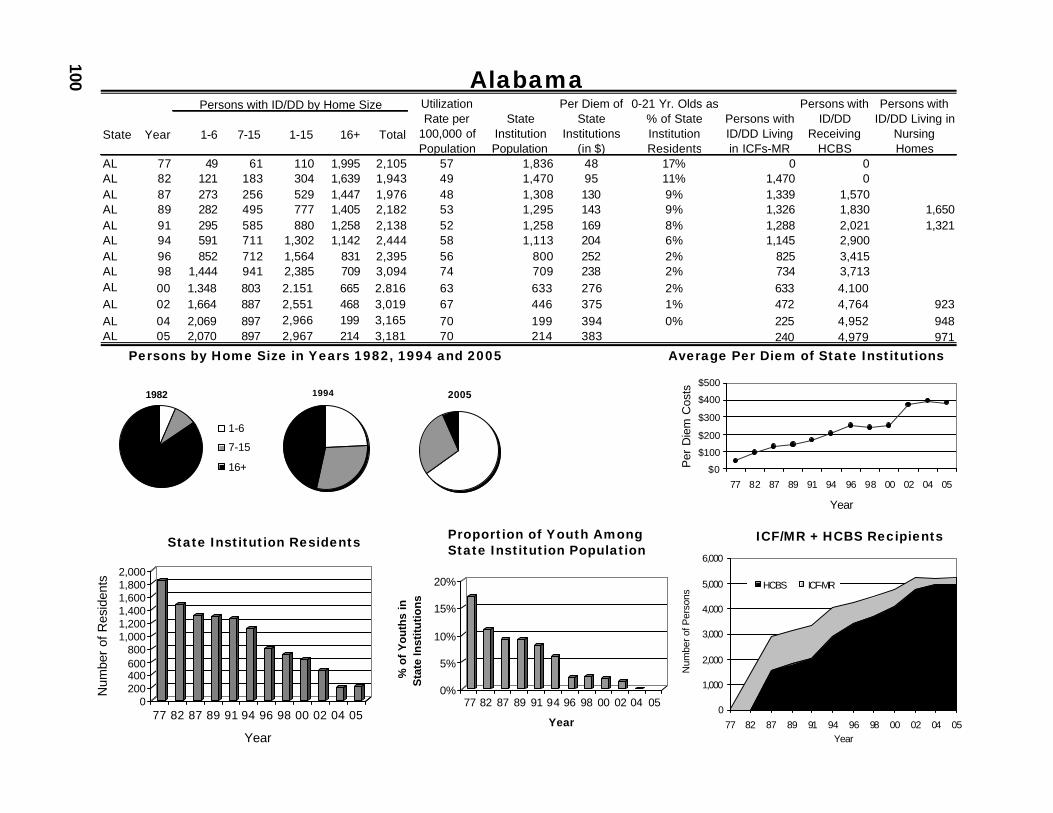
100 Alabama
Persons by Home Size in Years 1982, 1994 and 2005 Average Per Diem of State Institutions
State Institution Residents ICF/MR + HCBS RecipientsProportion of Youth AmongState Institution Population
State Year 1-6 7-15 1-15 16+ Total
AL 77 49 61 110 1,995 2,105 57 1,836 48 17% 0 0AL 82 121 183 304 1,639 1,943 49 1,470 95 11% 1,470 0AL 87 273 256 529 1,447 1,976 48 1,308 130 9% 1,339 1,570AL 89 282 495 777 1,405 2,182 53 1,295 143 9% 1,326 1,830 1,650AL 91 295 585 880 1,258 2,138 52 1,258 169 8% 1,288 2,021 1,321AL 94 591 711 1,302 1,142 2,444 58 1,113 204 6% 1,145 2,900AL 96 852 712 1,564 831 2,395 56 800 252 2% 825 3,415AL 98 1,444 941 2,385 709 3,094 74 709 238 2% 734 3,713AL 00 1,348 803 2,151 665 2,816 63 633 276 2% 633 4,100AL 02 1,664 887 2,551 468 3,019 67 446 375 1% 472 4,764 923AL 04 2,069 897 2,966 199 3,165 70 199 394 0% 225 4,952 948AL 05 2,070 897 2,967 214 3,181 70 214 383 240 4,979 971
Persons with ID/DD by Home Size Utilization Rate per
100,000 of Population
Persons with ID/DD
Receiving HCBS
Persons with ID/DD Living in
Nursing Homes
State Institution Population
Per Diem of State
Institutions (in $)
0-21 Yr. Olds as % of State Institution Residents
Persons with ID/DD Living in ICFs-MR
20051982
1-6
7-15
16+
1994
$0
$100
$200
$300
$400
$500
77 82 87 89 91 94 96 98 00 02 04 05
Year
Per
Die
m C
osts
0200400600800
1,0001,2001,4001,6001,8002,000
Num
ber
of R
esid
ents
77 82 87 89 91 94 96 98 00 02 04 05
Year
0%
5%
10%
15%
20%
% o
f Y
ou
ths
in
Sta
te In
stit
uti
on
s
77 82 87 89 91 94 96 98 00 02 04 05
Year0
1,000
2,000
3,000
4,000
5,000
6,000
77 82 87 89 91 94 96 98 00 02 04 05Year
Num
ber o
f Per
sons
HCBS ICF-MR
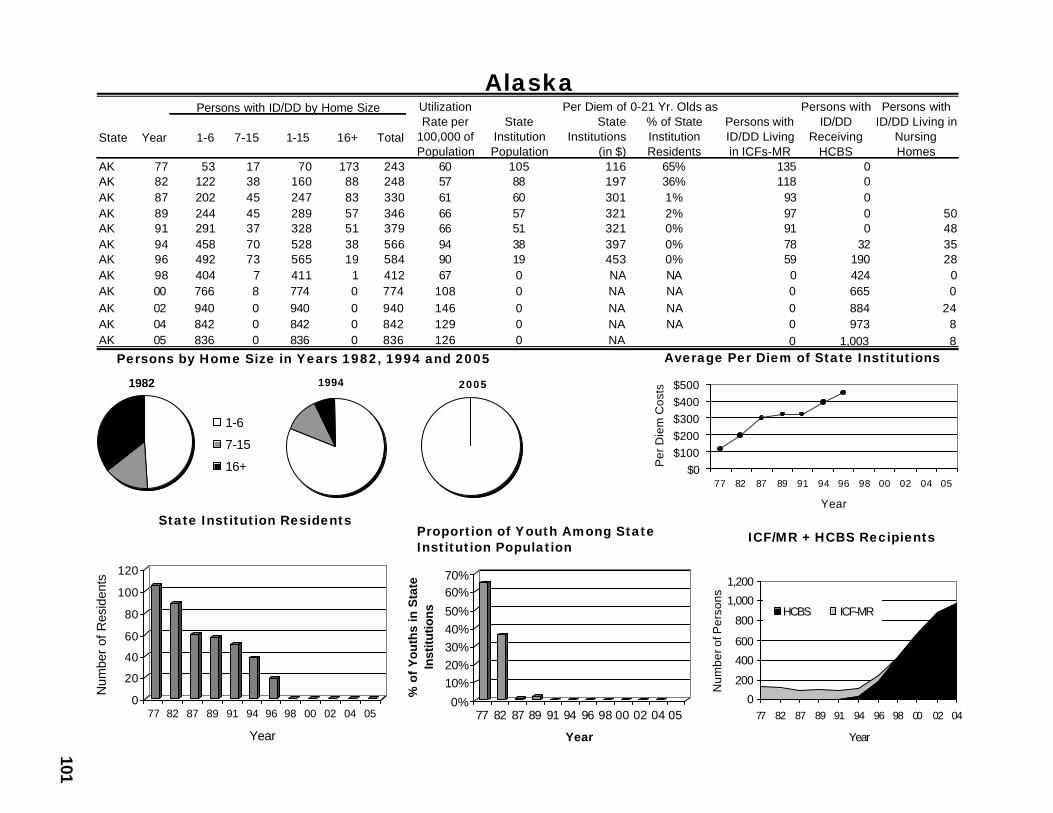
101
Alaska
Persons by Home Size in Years 1982, 1994 and 2005 Average Per Diem of State Institutions
State Institution ResidentsICF/MR + HCBS RecipientsProportion of Youth Among State
Institution Population
State Year 1-6 7-15 1-15 16+ Total
AK 77 53 17 70 173 243 60 105 116 65% 135 0AK 82 122 38 160 88 248 57 88 197 36% 118 0AK 87 202 45 247 83 330 61 60 301 1% 93 0AK 89 244 45 289 57 346 66 57 321 2% 97 0 50AK 91 291 37 328 51 379 66 51 321 0% 91 0 48AK 94 458 70 528 38 566 94 38 397 0% 78 32 35AK 96 492 73 565 19 584 90 19 453 0% 59 190 28AK 98 404 7 411 1 412 67 0 NA NA 0 424 0AK 00 766 8 774 0 774 108 0 NA NA 0 665 0AK 02 940 0 940 0 940 146 0 NA NA 0 884 24AK 04 842 0 842 0 842 129 0 NA NA 0 973 8AK 05 836 0 836 0 836 126 0 NA 0 1,003 8
Persons with ID/DD by Home Size Utilization Rate per
100,000 of Population
Persons with ID/DD
Receiving HCBS
Persons with ID/DD Living in
Nursing Homes
State Institution Population
Per Diem of State
Institutions (in $)
0-21 Yr. Olds as % of State Institution Residents
Persons with ID/DD Living in ICFs-MR
1982
1-6
7-15
16+
1994 2005
$0$100$200$300$400$500
77 82 87 89 91 94 96 98 00 02 04 05
Year
Per
Die
m C
osts
0
20
40
60
80
100
120
Num
ber
of R
esid
ents
77 82 87 89 91 94 96 98 00 02 04 05
Year
0%
10%20%30%40%50%
60%70%
% o
f Y
ou
ths
in S
tate
In
stitu
tions
77 82 87 89 91 94 96 98 00 02 04 05
Year
0
200
400
600
800
1,000
1,200
77 82 87 89 91 94 96 98 00 02 04
Year
Num
ber o
f Per
sons
HCBS ICF-MR
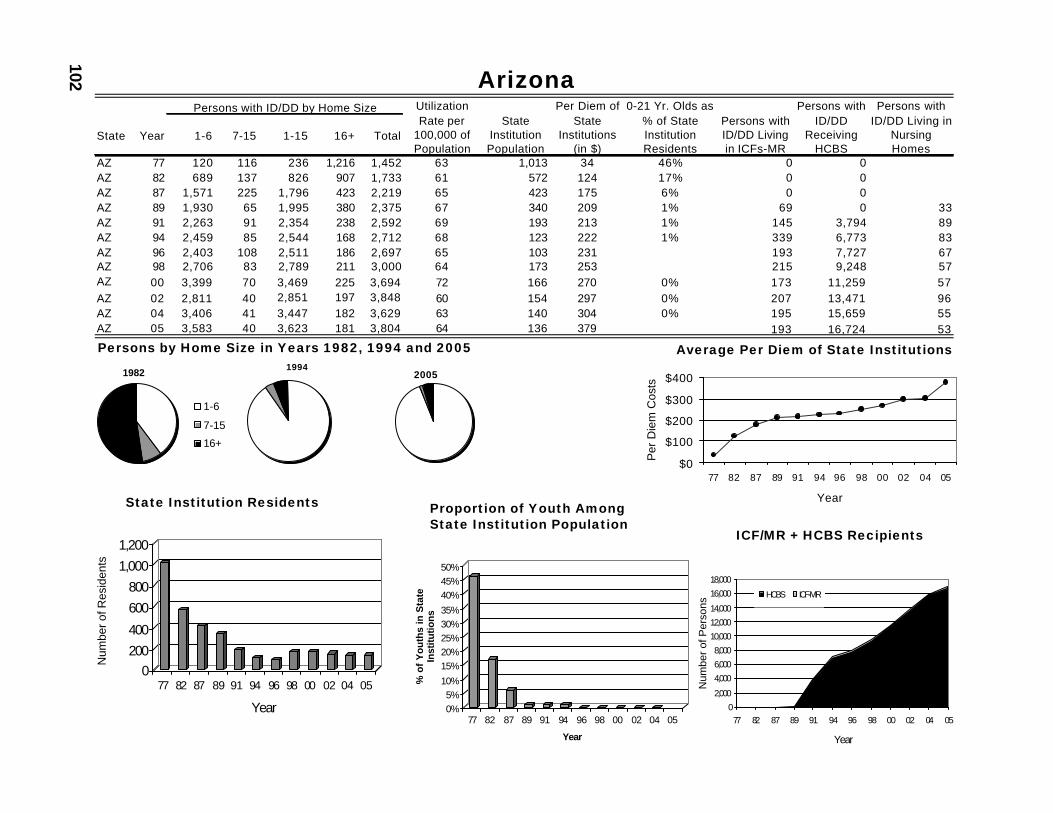
102 Arizona
Persons by Home Size in Years 1982, 1994 and 2005 Average Per Diem of State Institutions
State Institution Residents
ICF/MR + HCBS Recipients
Proportion of Youth AmongState Institution Population
State Year 1-6 7-15 1-15 16+ Total
AZ 77 120 116 236 1,216 1,452 63 1,013 34 46% 0 0AZ 82 689 137 826 907 1,733 61 572 124 17% 0 0AZ 87 1,571 225 1,796 423 2,219 65 423 175 6% 0 0AZ 89 1,930 65 1,995 380 2,375 67 340 209 1% 69 0 33AZ 91 2,263 91 2,354 238 2,592 69 193 213 1% 145 3,794 89AZ 94 2,459 85 2,544 168 2,712 68 123 222 1% 339 6,773 83AZ 96 2,403 108 2,511 186 2,697 65 103 231 193 7,727 67AZ 98 2,706 83 2,789 211 3,000 64 173 253 215 9,248 57AZ 00 3,399 70 3,469 225 3,694 72 166 270 0% 173 11,259 57AZ 02 2,811 40 2,851 197 3,848 60 154 297 0% 207 13,471 96AZ 04 3,406 41 3,447 182 3,629 63 140 304 0% 195 15,659 55AZ 05 3,583 40 3,623 181 3,804 64 136 379 193 16,724 53
Persons with ID/DD by Home Size Utilization Rate per
100,000 of Population
Persons with ID/DD
Receiving HCBS
Persons with ID/DD Living in
Nursing Homes
State Institution Population
Per Diem of State
Institutions (in $)
0-21 Yr. Olds as % of State Institution Residents
Persons with ID/DD Living in ICFs-MR
20051982
1-6
7-15
16+
1994
$0
$100
$200
$300
$400
77 82 87 89 91 94 96 98 00 02 04 05
Year
Per
Die
m C
osts
0200
400
600
800
1,000
1,200
Num
ber o
f Res
iden
ts
77 82 87 89 91 94 96 98 00 02 04 05
Year 0%5%
10%
15%20%25%30%35%
40%45%50%
% o
f Y
ou
ths
in S
tate
In
stitu
tions
77 82 87 89 91 94 96 98 00 02 04 05
Year
0
2,000
4,000
6,000
8,000
10,000
12,000
14,000
16,000
18,000
77 82 87 89 91 94 96 98 00 02 04 05
Year
Num
ber
of P
erso
ns
HCBS ICF-MR
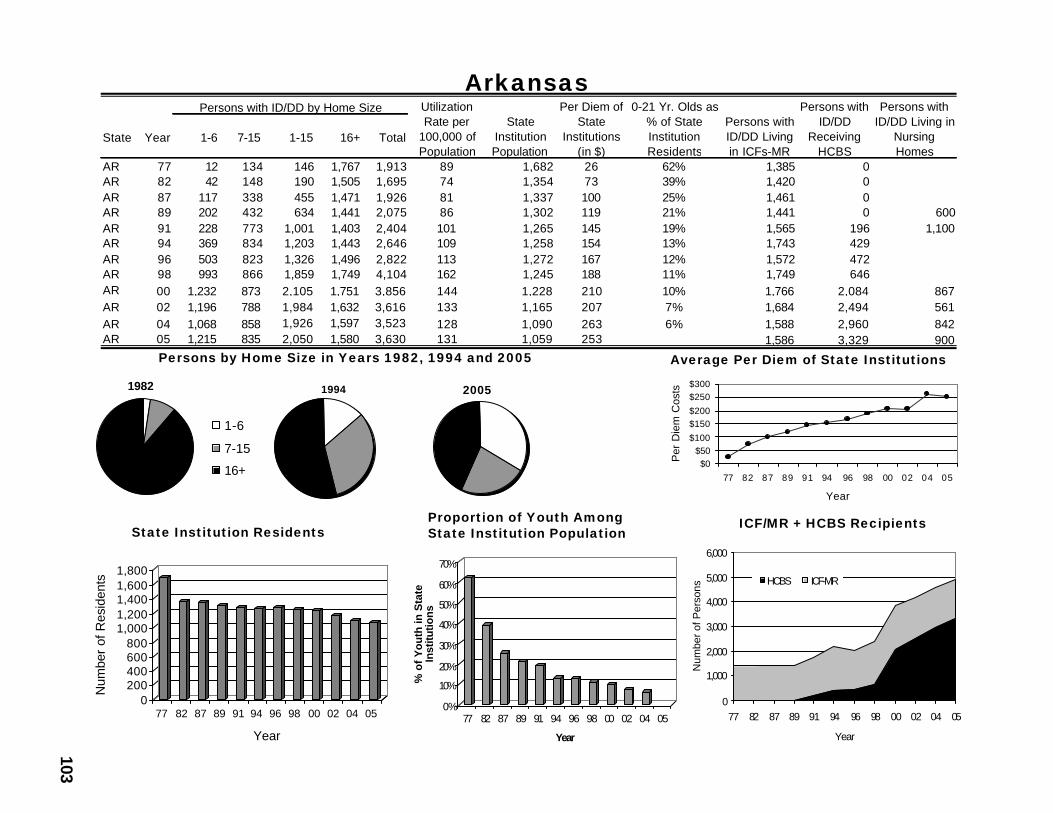
103
Arkansas
Persons by Home Size in Years 1982, 1994 and 2005 Average Per Diem of State Institutions
State Institution Residents ICF/MR + HCBS RecipientsProportion of Youth AmongState Institution Population
State Year 1-6 7-15 1-15 16+ Total
AR 77 12 134 146 1,767 1,913 89 1,682 26 62% 1,385 0AR 82 42 148 190 1,505 1,695 74 1,354 73 39% 1,420 0AR 87 117 338 455 1,471 1,926 81 1,337 100 25% 1,461 0AR 89 202 432 634 1,441 2,075 86 1,302 119 21% 1,441 0 600AR 91 228 773 1,001 1,403 2,404 101 1,265 145 19% 1,565 196 1,100AR 94 369 834 1,203 1,443 2,646 109 1,258 154 13% 1,743 429AR 96 503 823 1,326 1,496 2,822 113 1,272 167 12% 1,572 472AR 98 993 866 1,859 1,749 4,104 162 1,245 188 11% 1,749 646AR 00 1,232 873 2,105 1,751 3,856 144 1,228 210 10% 1,766 2,084 867AR 02 1,196 788 1,984 1,632 3,616 133 1,165 207 7% 1,684 2,494 561AR 04 1,068 858 1,926 1,597 3,523 128 1,090 263 6% 1,588 2,960 842AR 05 1,215 835 2,050 1,580 3,630 131 1,059 253 1,586 3,329 900
Persons with ID/DD by Home Size Utilization Rate per
100,000 of Population
Persons with ID/DD
Receiving HCBS
Persons with ID/DD Living in
Nursing Homes
State Institution Population
Per Diem of State
Institutions (in $)
0-21 Yr. Olds as % of State Institution Residents
Persons with ID/DD Living in ICFs-MR
20051982
1-6
7-15
16+
1994
$0$50
$100
$150$200
$250$300
77 82 87 89 91 94 96 98 00 02 04 05
Year
Per
Die
m C
osts
0200400600800
1,0001,2001,4001,6001,800
Num
ber
of R
esid
ents
77 82 87 89 91 94 96 98 00 02 04 05
Year
0%
10%
20%
30%
40%
50%
60%
70%
% o
f Y
ou
th in
Sta
te
Inst
itutio
ns
77 82 87 89 91 94 96 98 00 02 04 05
Year
0
1,000
2,000
3,000
4,000
5,000
6,000
77 82 87 89 91 94 96 98 00 02 04 05
Year
Num
ber
of P
erso
ns
HCBS ICF-MR
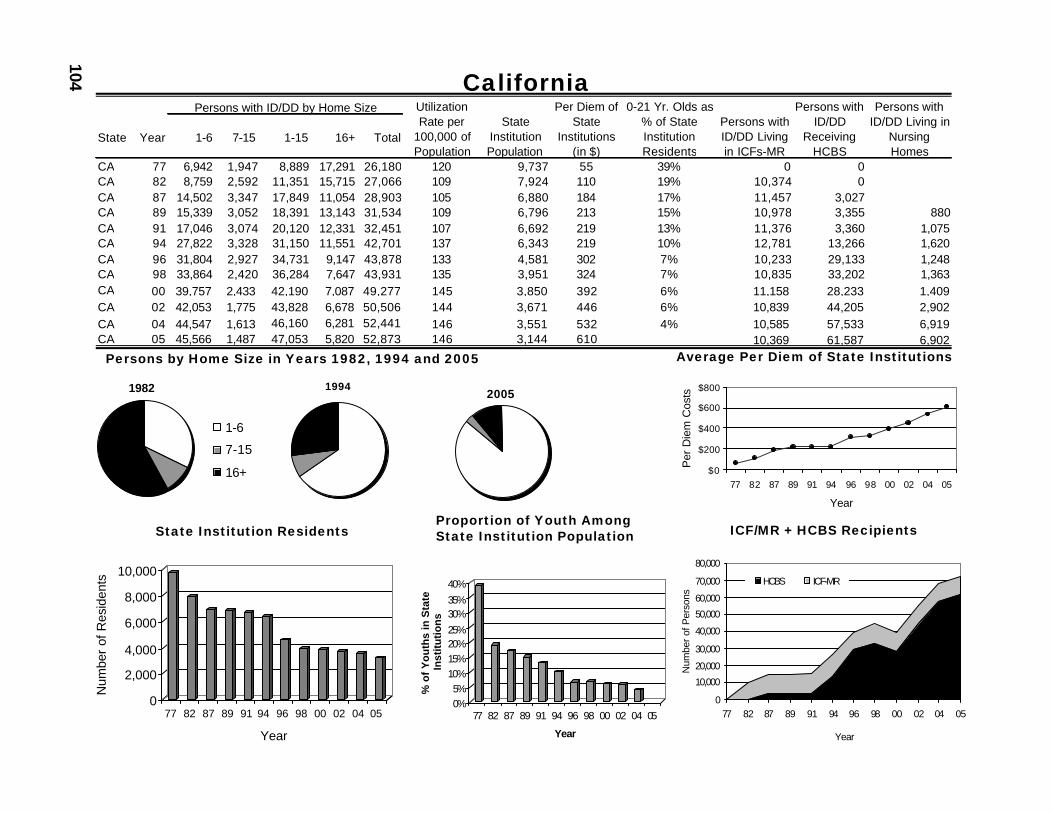
104 California
Average Per Diem of State Institutions
State Institution Residents ICF/MR + HCBS RecipientsProportion of Youth AmongState Institution Population
Persons by Home Size in Years 1982, 1994 and 2005
State Year 1-6 7-15 1-15 16+ Total
CA 77 6,942 1,947 8,889 17,291 26,180 120 9,737 55 39% 0 0CA 82 8,759 2,592 11,351 15,715 27,066 109 7,924 110 19% 10,374 0CA 87 14,502 3,347 17,849 11,054 28,903 105 6,880 184 17% 11,457 3,027CA 89 15,339 3,052 18,391 13,143 31,534 109 6,796 213 15% 10,978 3,355 880CA 91 17,046 3,074 20,120 12,331 32,451 107 6,692 219 13% 11,376 3,360 1,075CA 94 27,822 3,328 31,150 11,551 42,701 137 6,343 219 10% 12,781 13,266 1,620CA 96 31,804 2,927 34,731 9,147 43,878 133 4,581 302 7% 10,233 29,133 1,248CA 98 33,864 2,420 36,284 7,647 43,931 135 3,951 324 7% 10,835 33,202 1,363CA 00 39,757 2,433 42,190 7,087 49,277 145 3,850 392 6% 11,158 28,233 1,409CA 02 42,053 1,775 43,828 6,678 50,506 144 3,671 446 6% 10,839 44,205 2,902CA 04 44,547 1,613 46,160 6,281 52,441 146 3,551 532 4% 10,585 57,533 6,919CA 05 45,566 1,487 47,053 5,820 52,873 146 3,144 610 10,369 61,587 6,902
Persons with ID/DD by Home Size Utilization Rate per
100,000 of Population
Persons with ID/DD
Receiving HCBS
Persons with ID/DD Living in
Nursing Homes
State Institution Population
Per Diem of State
Institutions (in $)
0-21 Yr. Olds as % of State Institution Residents
Persons with ID/DD Living in ICFs-MR
20051982
1-6
7-15
16+
1994
$0
$200
$400
$600
$800
77 82 87 89 91 94 96 98 00 02 04 05
Year
Per
Die
m C
osts
0
2,000
4,000
6,000
8,000
10,000
Num
ber
of R
esid
ents
77 82 87 89 91 94 96 98 00 02 04 05
Year
0%5%
10%15%20%25%
30%35%
40%
% o
f Y
ou
ths
in S
tate
In
stit
uti
on
s
77 82 87 89 91 94 96 98 00 02 04 05
Year
0
10,000
20,000
30,000
40,000
50,000
60,000
70,000
80,000
77 82 87 89 91 94 96 98 00 02 04 05
Year
Num
ber
of P
erso
ns
HCBS ICF-MR

105
Colorado
Average Per Diem of State Institutions
State Institution Residents ICF/MR + HCBS RecipientsProportion of Youth AmongState Institution Population
Persons by Home Size in Years 1982, 1994 and 2005
State Year 1-6 7-15 1-15 16+ Total
CO 77 119 421 540 2,111 2,651 101 1,539 33 45% 4,537 0CO 82 199 670 869 1,960 2,829 93 1,264 78 38% 2,017 0CO 87 354 1,345 1,699 1,247 2,946 89 901 130 17% 1,247 1,389CO 89 664 1,581 2,245 839 3,084 93 493 141 13% 1,115 1,679 459CO 91 1,819 910 2,729 666 3,395 99 386 194 9% 927 1,993 428CO 94 2,814 642 3,456 420 3,876 109 248 235 420 2,684 339CO 96 2,929 593 3,522 233 3,755 99 197 290 8% 245 3,976 258CO 98 3,359 483 3,842 169 4,011 101 169 304 5% 185 4,928 278CO 00 3,616 456 4,072 122 4,194 98 122 387 6% 138 6,330 270CO 02 3,984 510 4,494 95 4,589 102 95 398 9% 111 6,516 277CO 04 4,346 498 4,844 97 4,941 107 97 497 3% 113 6,730 272CO 05 4,415 499 4,914 105 5,019 108 96 523 122 6,775 161
Persons with ID/DD by Home Size Utilization Rate per
100,000 of Population
Persons with ID/DD
Receiving HCBS
Persons with ID/DD Living in
Nursing Homes
State Institution Population
Per Diem of State
Institutions (in $)
0-21 Yr. Olds as % of State Institution Residents
Persons with ID/DD Living in ICFs-MR
20051982
1-6
7-15
16+
1994
$0$100$200$300$400$500$600
77 82 87 89 91 94 96 98 00 02 04 05
Year
Per
Die
m C
osts
0200
400600
8001,000
1,200
1,4001,600
Num
ber
of R
esid
ents
77 82 87 89 91 94 96 98 00 02 04 05
Year
0%5%
10%
15%20%25%30%
35%
40%45%
% o
f Y
ou
ths
in S
tate
In
stit
uti
on
77 82 87 89 91 94 96 98 00 02 04 05
Year
0
1,000
2,000
3,000
4,000
5,000
6,000
7,000
8,000
77 82 87 89 91 94 96 98 00 02 04 05
Year
Num
ber o
f Per
sons
HCBS ICF-MR

106 Connecticut
Average Per Diem of State Institutions
State Institution Residents ICF/MR + HCBS RecipientsProportion of Youth AmongState Institution Population
Persons by Home Size in Years 1982, 1994 and 2005
State Year 1-6 7-15 1-15 16+ Total
CT 77 251 364 615 3,881 4,496 145 3,374 33 28% 687 0CT 82 353 540 893 3,660 4,553 144 3,216 74 17% 1,598 0CT 87 1,630 806 2,436 2,384 4,820 150 2,298 191 12% 1,363 0CT 89 2,680 557 3,237 1,900 5,137 159 1,845 323 11% 2,335 1,127 436CT 91 3,113 570 3,683 1,652 5,335 162 1,652 333 6% 1,550 1,655 482CT 94 3,689 540 4,229 1,342 5,571 170 1,342 353 1% 1,276 2,361 419CT 96 4,154 400 4,554 1,209 5,763 176 1,209 357 1,298 2,999 394CT 98 4,086 383 4,469 1,070 5,539 169 1,070 470 1% 1,382 3,380 336CT 00 4,685 452 5,137 988 6,125 180 988 540 0% 1,276 5,076 358CT 02 4,846 496 5,342 883 6,225 180 883 544 1% 1,192 5,972 701CT 04 5,217 454 5,671 853 6,524 186 853 592 DNF 1,173 6,356 358CT 05 4,828 472 5,300 839 6,139 175 838 580 1,165 6,583 411
Persons with ID/DD by Home Size Utilization Rate per
100,000 of Population
Persons with ID/DD
Receiving HCBS
Persons with ID/DD Living in
Nursing Homes
State Institution Population
Per Diem of State
Institutions (in $)
0-21 Yr. Olds as % of State Institution Residents
Persons with ID/DD Living in ICFs-MR
20051982
1-6
7-15
16+
1994
$0
$200
$400
$600
$800
77 82 87 89 91 94 96 98 00 02 04 05
Year
Per
Die
m C
osts
0
500
1,000
1,500
2,000
2,500
3,000
3,500
Num
ber
of R
esid
ents
77 82 87 89 91 94 96 98 00 02 04 05
Year
0%
5%
10%
15%
20%
25%
30%
% o
f Y
outh
in S
tate
In
stit
uti
on
s
77 82 87 89 91 94 96 98 00 02 04 05
Year
0
1,000
2,000
3,000
4,000
5,000
6,000
7,000
8,000
9,000
77 82 87 89 91 94 96 98 00 02 04 05
Year
Num
ber
of P
erso
ns
HCBS ICF-MR
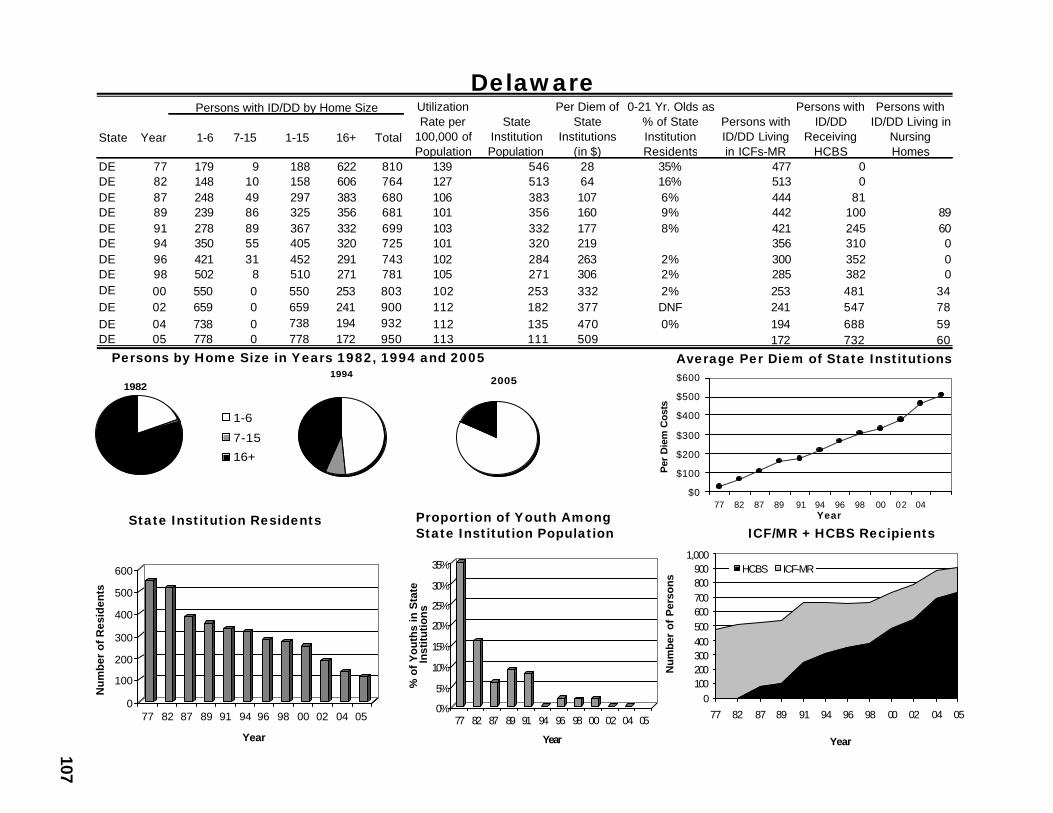
107
Delaware
Average Per Diem of State Institutions
State Institution ResidentsICF/MR + HCBS Recipients
Proportion of Youth AmongState Institution Population
Persons by Home Size in Years 1982, 1994 and 2005
State Year 1-6 7-15 1-15 16+ Total
DE 77 179 9 188 622 810 139 546 28 35% 477 0DE 82 148 10 158 606 764 127 513 64 16% 513 0DE 87 248 49 297 383 680 106 383 107 6% 444 81DE 89 239 86 325 356 681 101 356 160 9% 442 100 89DE 91 278 89 367 332 699 103 332 177 8% 421 245 60DE 94 350 55 405 320 725 101 320 219 356 310 0DE 96 421 31 452 291 743 102 284 263 2% 300 352 0DE 98 502 8 510 271 781 105 271 306 2% 285 382 0DE 00 550 0 550 253 803 102 253 332 2% 253 481 34DE 02 659 0 659 241 900 112 182 377 DNF 241 547 78DE 04 738 0 738 194 932 112 135 470 0% 194 688 59DE 05 778 0 778 172 950 113 111 509 172 732 60
Persons with ID/DD by Home Size Utilization Rate per
100,000 of Population
Persons with ID/DD
Receiving HCBS
Persons with ID/DD Living in
Nursing Homes
State Institution Population
Per Diem of State
Institutions (in $)
0-21 Yr. Olds as % of State Institution Residents
Persons with ID/DD Living in ICFs-MR
20051982
1-6
7-15
16+
1994
$0
$100
$200
$300
$400
$500
$600
77 82 87 89 91 94 96 98 00 02 04Year
Per
Die
m C
osts
0
100
200
300
400
500
600
Nu
mb
er o
f R
esid
ents
77 82 87 89 91 94 96 98 00 02 04 05
Year
0%
5%
10%
15%
20%
25%
30%
35%
% o
f Y
ou
ths
in S
tate
In
stitu
tion
s
77 82 87 89 91 94 96 98 00 02 04 05
Year
0100200300400500600700800900
1,000
77 82 87 89 91 94 96 98 00 02 04 05
Year
Nu
mb
er o
f P
erso
ns
HCBS ICF-MR
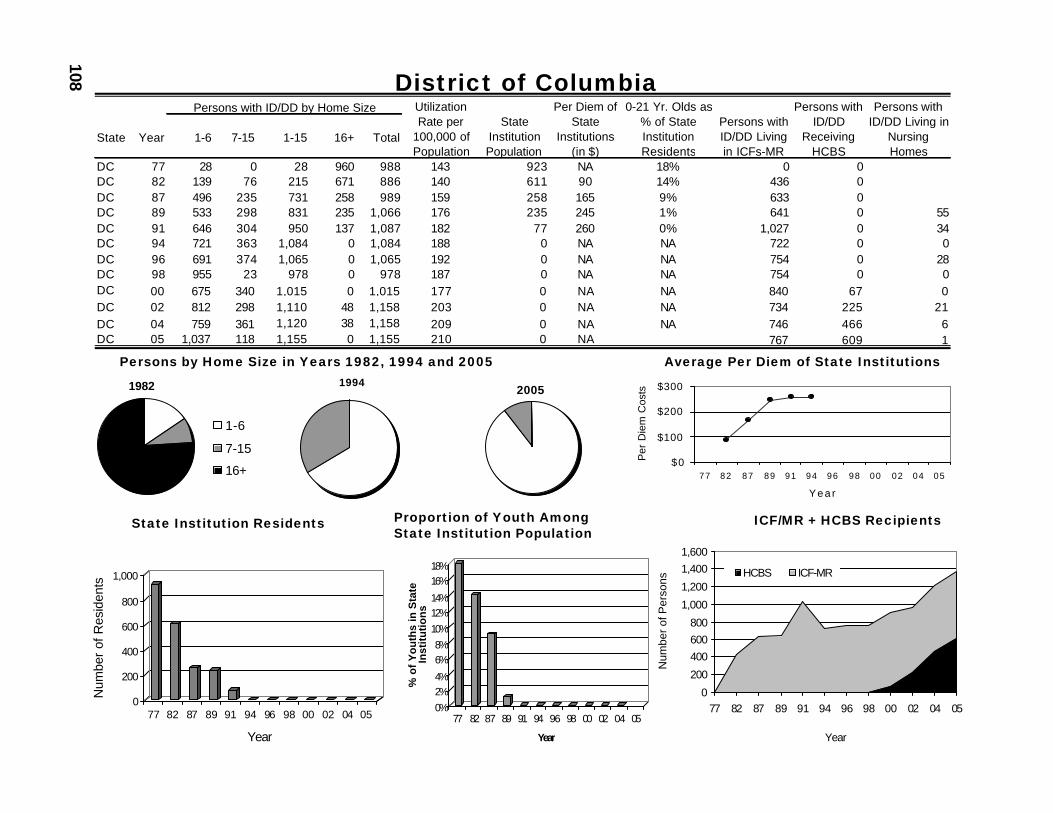
108 District of Columbia
Average Per Diem of State Institutions
State Institution Residents ICF/MR + HCBS RecipientsProportion of Youth AmongState Institution Population
Persons by Home Size in Years 1982, 1994 and 2005
State Year 1-6 7-15 1-15 16+ Total
DC 77 28 0 28 960 988 143 923 NA 18% 0 0DC 82 139 76 215 671 886 140 611 90 14% 436 0DC 87 496 235 731 258 989 159 258 165 9% 633 0DC 89 533 298 831 235 1,066 176 235 245 1% 641 0 55DC 91 646 304 950 137 1,087 182 77 260 0% 1,027 0 34DC 94 721 363 1,084 0 1,084 188 0 NA NA 722 0 0DC 96 691 374 1,065 0 1,065 192 0 NA NA 754 0 28DC 98 955 23 978 0 978 187 0 NA NA 754 0 0DC 00 675 340 1,015 0 1,015 177 0 NA NA 840 67 0DC 02 812 298 1,110 48 1,158 203 0 NA NA 734 225 21DC 04 759 361 1,120 38 1,158 209 0 NA NA 746 466 6DC 05 1,037 118 1,155 0 1,155 210 0 NA 767 609 1
Persons with ID/DD by Home Size Utilization Rate per
100,000 of Population
Persons with ID/DD
Receiving HCBS
Persons with ID/DD Living in
Nursing Homes
State Institution Population
Per Diem of State
Institutions (in $)
0-21 Yr. Olds as % of State Institution Residents
Persons with ID/DD Living in ICFs-MR
20051982
1-6
7-15
16+
1994
$0
$100
$200
$300
77 82 87 89 91 94 96 98 00 02 04 05
Yea r
Per
Die
m C
osts
0
200
400
600
800
1,000
Num
ber
of R
esid
ents
77 82 87 89 91 94 96 98 00 02 04 05
Year
0%2%4%
6%8%
10%12%14%
16%18%
% o
f Y
ou
ths
in S
tate
In
stit
uti
on
s
77 82 87 89 91 94 96 98 00 02 04 05
Year
0
200
400600800
1,000
1,200
1,4001,600
77 82 87 89 91 94 96 98 00 02 04 05
Year
Num
ber o
f Per
sons
HCBS ICF-MR
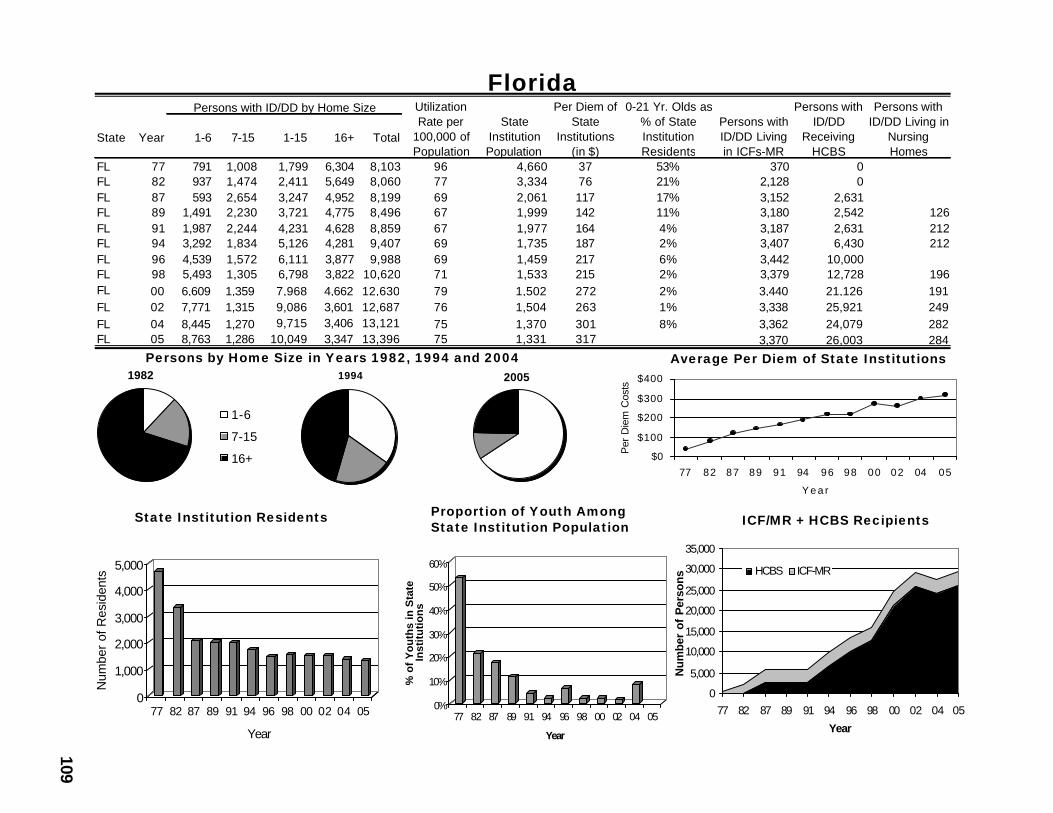
109
Florida
Average Per Diem of State Institutions
State Institution Residents ICF/MR + HCBS RecipientsProportion of Youth AmongState Institution Population
Persons by Home Size in Years 1982, 1994 and 2004
State Year 1-6 7-15 1-15 16+ Total
FL 77 791 1,008 1,799 6,304 8,103 96 4,660 37 53% 370 0FL 82 937 1,474 2,411 5,649 8,060 77 3,334 76 21% 2,128 0FL 87 593 2,654 3,247 4,952 8,199 69 2,061 117 17% 3,152 2,631FL 89 1,491 2,230 3,721 4,775 8,496 67 1,999 142 11% 3,180 2,542 126FL 91 1,987 2,244 4,231 4,628 8,859 67 1,977 164 4% 3,187 2,631 212FL 94 3,292 1,834 5,126 4,281 9,407 69 1,735 187 2% 3,407 6,430 212FL 96 4,539 1,572 6,111 3,877 9,988 69 1,459 217 6% 3,442 10,000FL 98 5,493 1,305 6,798 3,822 10,620 71 1,533 215 2% 3,379 12,728 196FL 00 6,609 1,359 7,968 4,662 12,630 79 1,502 272 2% 3,440 21,126 191FL 02 7,771 1,315 9,086 3,601 12,687 76 1,504 263 1% 3,338 25,921 249FL 04 8,445 1,270 9,715 3,406 13,121 75 1,370 301 8% 3,362 24,079 282FL 05 8,763 1,286 10,049 3,347 13,396 75 1,331 317 3,370 26,003 284
Persons with ID/DD by Home Size Utilization Rate per
100,000 of Population
Persons with ID/DD
Receiving HCBS
Persons with ID/DD Living in
Nursing Homes
State Institution Population
Per Diem of State
Institutions (in $)
0-21 Yr. Olds as % of State Institution Residents
Persons with ID/DD Living in ICFs-MR
20051982
1-6
7-15
16+
1994
$0
$100
$200
$300
$400
77 82 87 89 91 94 96 98 00 02 04 05
Y e a r
Per
Die
m C
osts
0
1,000
2,000
3,000
4,000
5,000
Num
ber
of R
esid
ents
77 82 87 89 91 94 96 98 00 02 04 05
Year
0%
10%
20%
30%
40%
50%
60%
% o
f Y
ou
ths
in S
tate
In
stit
uti
on
s
77 82 87 89 91 94 96 98 00 02 04 05
Year
0
5,000
10,000
15,000
20,000
25,000
30,000
35,000
77 82 87 89 91 94 96 98 00 02 04 05
Year
Num
ber
of P
erso
ns
HCBS ICF-MR
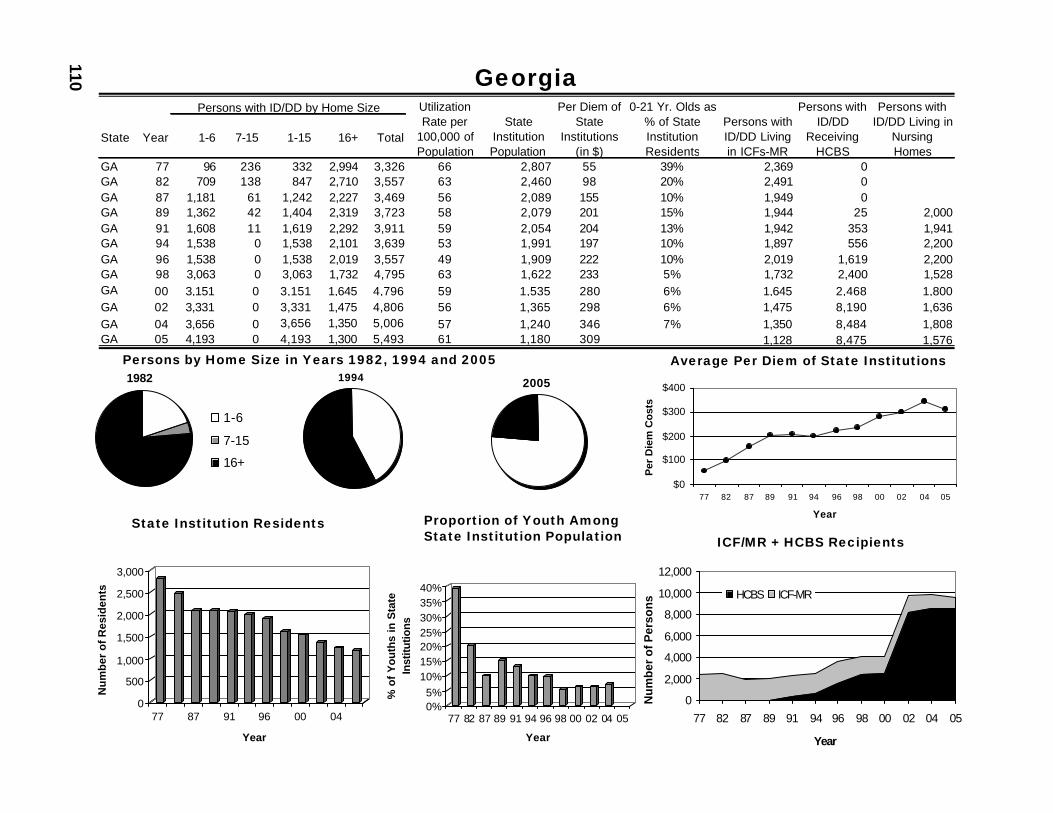
110 Georgia
Average Per Diem of State Institutions
State Institution Residents Proportion of Youth AmongState Institution Population ICF/MR + HCBS Recipients
Persons by Home Size in Years 1982, 1994 and 2005
State Year 1-6 7-15 1-15 16+ Total
GA 77 96 236 332 2,994 3,326 66 2,807 55 39% 2,369 0GA 82 709 138 847 2,710 3,557 63 2,460 98 20% 2,491 0GA 87 1,181 61 1,242 2,227 3,469 56 2,089 155 10% 1,949 0GA 89 1,362 42 1,404 2,319 3,723 58 2,079 201 15% 1,944 25 2,000GA 91 1,608 11 1,619 2,292 3,911 59 2,054 204 13% 1,942 353 1,941GA 94 1,538 0 1,538 2,101 3,639 53 1,991 197 10% 1,897 556 2,200GA 96 1,538 0 1,538 2,019 3,557 49 1,909 222 10% 2,019 1,619 2,200GA 98 3,063 0 3,063 1,732 4,795 63 1,622 233 5% 1,732 2,400 1,528GA 00 3,151 0 3,151 1,645 4,796 59 1,535 280 6% 1,645 2,468 1,800GA 02 3,331 0 3,331 1,475 4,806 56 1,365 298 6% 1,475 8,190 1,636GA 04 3,656 0 3,656 1,350 5,006 57 1,240 346 7% 1,350 8,484 1,808GA 05 4,193 0 4,193 1,300 5,493 61 1,180 309 1,128 8,475 1,576
Persons with ID/DD by Home Size Utilization Rate per
100,000 of Population
Persons with ID/DD
Receiving HCBS
Persons with ID/DD Living in
Nursing Homes
State Institution Population
Per Diem of State
Institutions (in $)
0-21 Yr. Olds as % of State Institution Residents
Persons with ID/DD Living in ICFs-MR
20051982
1-6
7-15
16+
1994
$0
$100
$200
$300
$400
77 82 87 89 91 94 96 98 00 02 04 05
Year
Per
Die
m C
ost
s
0
500
1,000
1,500
2,000
2,500
3,000
Nu
mb
er o
f R
esid
ents
77 87 91 96 00 04
Year
0%5%
10%15%20%25%30%35%40%
% o
f Y
ou
ths
in S
tate
In
stitu
tions
77 82 87 89 91 94 96 98 00 02 04 05
Year
0
2,000
4,000
6,000
8,000
10,000
12,000
77 82 87 89 91 94 96 98 00 02 04 05
Year
Nu
mb
er o
f Per
son
s HCBS ICF-MR

111
Hawaii
Average Per Diem of State Institutions
State Institution ResidentsICF/MR + HCBS Recipients
Proportion of Youth AmongState Institution Population
Persons by Home Size in Years 1982, 1994 and 2005
State Year 1-6 7-15 1-15 16+ Total
HI 77 366 18 384 543 927 101 524 44 524 0HI 82 445 12 457 400 857 86 379 91 33% 387 0HI 87 576 5 581 260 841 78 260 150 13% 297 56HI 89 917 8 925 173 1,098 99 173 199 13% 246 70 39HI 91 948 7 955 146 1,101 97 137 335 17% 386 189 138HI 94 915 7 922 96 1,018 84 84 365 9% 142 513 95HI 96 1,070 7 1,077 63 1,140 92 49 388 0% 127 517 87HI 98 1,216 7 1,223 34 1,257 105 24 467 0% 120 759 55HI 00 1,175 0 1,175 13 1,188 98 0 NA NA 96 1,089 97HI 02 1,068 7 1,075 10 1,111 89 0 NA NA 94 1,560 31HI 04 1,036 8 1,044 0 1,044 83 0 NA NA 70 1,987 103HI 05 1,057 8 1,065 0 1,065 84 0 NA 88 2,040 103
Persons with ID/DD by Home Size Utilization Rate per
100,000 of Population
Persons with ID/DD
Receiving HCBS
Persons with ID/DD Living in
Nursing Homes
State Institution Population
Per Diem of State
Institutions (in $)
0-21 Yr. Olds as % of State Institution Residents
Persons with ID/DD Living in ICFs-MR
20051982
1-6
7-15
16+
1994
$0$50
$100$150$200$250$300$350$400$450$500
77 82 87 89 91 94 96 98 00 02 04 05Year
Per
Die
m C
ost
s
0
100
200
300
400
500
600
Nu
mb
er o
f R
esid
ents
77 87 91 96 00 04
Year
0%5%
10%
15%20%
25%30%35%
% o
f Y
outh
s in
Sta
te
Inst
itutio
ns
82 87 89 91 94 96 98 00 02 04 05
Year
0
500
1,000
1,500
2,000
2,500
77 82 87 89 91 94 96 98 00 02 04 05Year
Nu
mb
er o
f P
erso
ns
HCBS ICF-MR

112 Idaho
Average Per Diem of State Institutions
State Institution Residents ICF/MR + HCBS RecipientsProportion of Youth AmongState Institution Population
Persons by Home Size in Years 1982, 1994 and 2005
State Year 1-6 7-15 1-15 16+ Total
ID 77 42 76 118 698 816 95 453 38 35% 583 0ID 82 41 180 221 639 860 89 350 91 29% 482 0ID 87 242 531 773 521 1,294 129 263 124 11% 445 55ID 89 300 494 794 345 1,339 132 221 220 9% 520 270 48ID 91 342 475 817 469 1,286 125 172 302 13% 535 165 83ID 94 779 505 1,284 336 1,620 147 143 351 9% 527 333 73ID 96 1,208 521 1,729 442 2,171 184 123 392 12% 538 415 39ID 98 1,618 469 2,087 381 2,468 201 108 428 17% 560 441 36ID 00 2,192 481 2,673 436 3,109 240 110 492 25% 592 801 28ID 02 2,161 535 2,696 227 2,923 218 106 544 25% 576 1,139 25ID 04 2,703 466 3,169 230 3,399 244 103 571 DNF 571 1,501 132ID 05 2,686 507 3,193 280 3,473 243 90 578 559 1,702 125
Persons with ID/DD by Home Size Utilization Rate per
100,000 of Population
Persons with ID/DD
Receiving HCBS
Persons with ID/DD Living in
Nursing Homes
State Institution Population
Per Diem of State
Institutions (in $)
0-21 Yr. Olds as % of State Institution Residents
Persons with ID/DD Living in ICFs-MR
20051982
1-6
7-15
16+
1994
$0$100$200$300$400$500$600$700
77 82 87 89 91 94 96 98 00 02 04 05Year
Per
Die
m C
osts
050
100150200250300350400450500
Nu
mb
er o
f R
esid
ents
77 87 91 96 00 04
Year0%
5%10%
15%
20%
25%
30%35%
% o
f Y
ou
ths
in S
tate
In
stit
uti
on
s
77 82 87 89 91 94 96 98 00 02 04 05
Year
0
500
1,000
1,500
2,000
2,500
77 82 87 89 91 94 96 98 00 02 04 05Year
Nu
mb
er o
f Per
son
s
HCBS ICF-MR
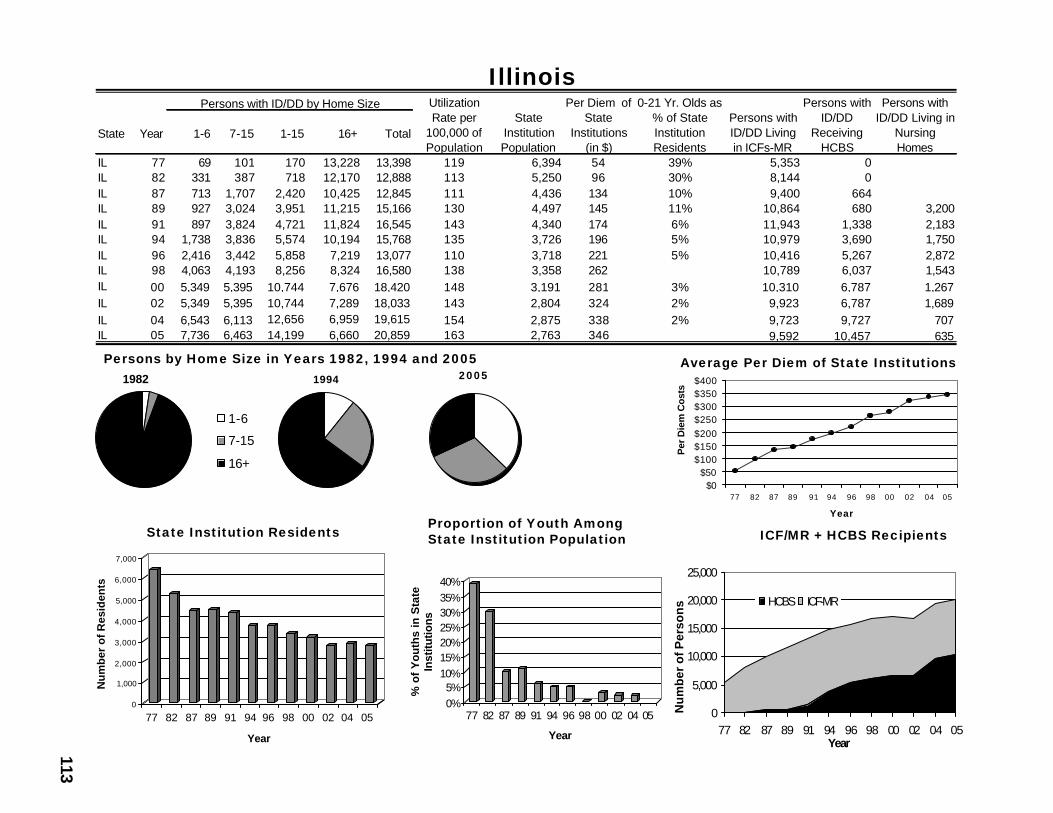
113
Illinois
Average Per Diem of State Institutions
State Institution Residents ICF/MR + HCBS RecipientsProportion of Youth AmongState Institution Population
Persons by Home Size in Years 1982, 1994 and 20052 0 0 51982
1-6
7-15
16+
1994
$0$50
$100$150$200$250$300$350$400
77 82 87 89 91 94 96 98 00 02 04 05
Year
Per
Die
m C
osts
0
1,000
2,000
3,000
4,000
5,000
6,000
7,000
Nu
mb
er o
f R
esid
ents
77 82 87 89 91 94 96 98 00 02 04 05
Year
0%5%
10%15%20%25%30%35%40%
% o
f Y
ou
ths
in S
tate
In
stitu
tions
77 82 87 89 91 94 96 98 00 02 04 05
Year
0
5,000
10,000
15,000
20,000
25,000
77 82 87 89 91 94 96 98 00 02 04 05Year
Nu
mb
er o
f Per
son
s HCBS ICF-MR
State Year 1-6 7-15 1-15 16+ Total
IL 77 69 101 170 13,228 13,398 119 6,394 54 39% 5,353 0IL 82 331 387 718 12,170 12,888 113 5,250 96 30% 8,144 0IL 87 713 1,707 2,420 10,425 12,845 111 4,436 134 10% 9,400 664IL 89 927 3,024 3,951 11,215 15,166 130 4,497 145 11% 10,864 680 3,200IL 91 897 3,824 4,721 11,824 16,545 143 4,340 174 6% 11,943 1,338 2,183IL 94 1,738 3,836 5,574 10,194 15,768 135 3,726 196 5% 10,979 3,690 1,750IL 96 2,416 3,442 5,858 7,219 13,077 110 3,718 221 5% 10,416 5,267 2,872IL 98 4,063 4,193 8,256 8,324 16,580 138 3,358 262 10,789 6,037 1,543IL 00 5,349 5,395 10,744 7,676 18,420 148 3,191 281 3% 10,310 6,787 1,267IL 02 5,349 5,395 10,744 7,289 18,033 143 2,804 324 2% 9,923 6,787 1,689IL 04 6,543 6,113 12,656 6,959 19,615 154 2,875 338 2% 9,723 9,727 707IL 05 7,736 6,463 14,199 6,660 20,859 163 2,763 346 9,592 10,457 635
Persons with ID/DD by Home Size Persons with ID/DD
Receiving HCBS
Persons with ID/DD Living in
Nursing Homes
State Institution Population
Per Diem of State
Institutions (in $)
0-21 Yr. Olds as % of State Institution Residents
Persons with ID/DD Living in ICFs-MR
Utilization Rate per
100,000 of Population
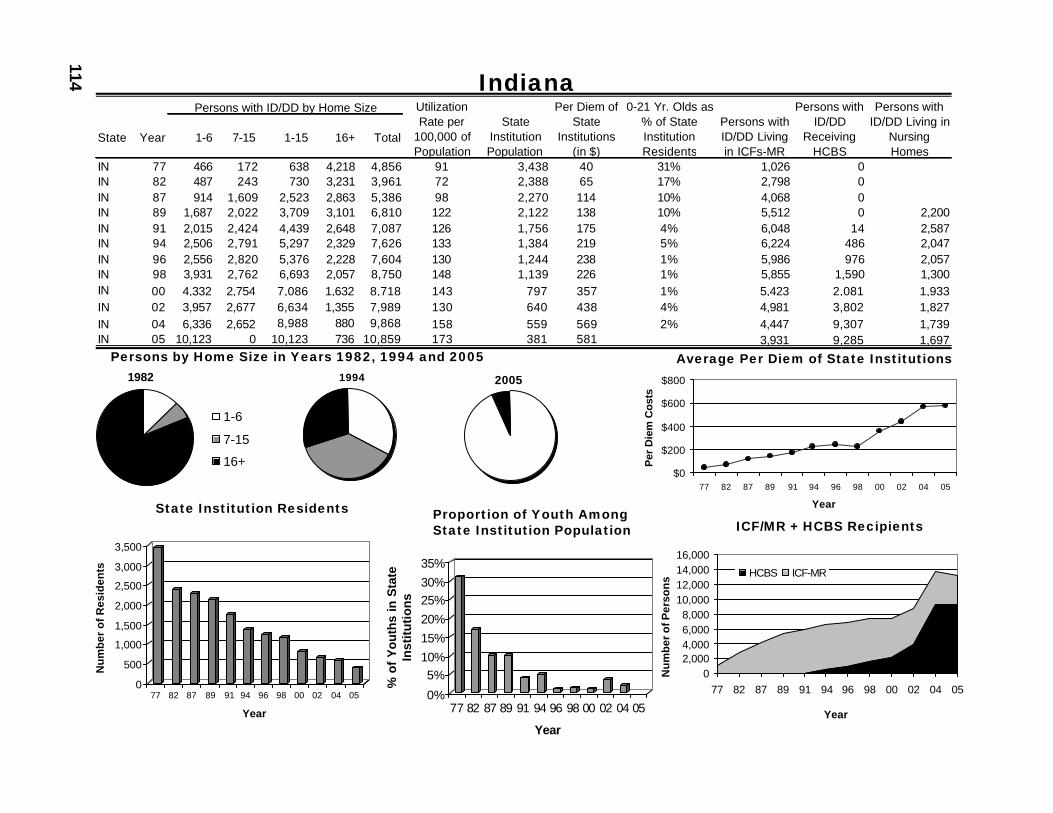
114 Indiana
Average Per Diem of State Institutions
State Institution ResidentsICF/MR + HCBS Recipients
Proportion of Youth AmongState Institution Population
Persons by Home Size in Years 1982, 1994 and 2005
State Year 1-6 7-15 1-15 16+ Total
IN 77 466 172 638 4,218 4,856 91 3,438 40 31% 1,026 0IN 82 487 243 730 3,231 3,961 72 2,388 65 17% 2,798 0IN 87 914 1,609 2,523 2,863 5,386 98 2,270 114 10% 4,068 0IN 89 1,687 2,022 3,709 3,101 6,810 122 2,122 138 10% 5,512 0 2,200IN 91 2,015 2,424 4,439 2,648 7,087 126 1,756 175 4% 6,048 14 2,587IN 94 2,506 2,791 5,297 2,329 7,626 133 1,384 219 5% 6,224 486 2,047IN 96 2,556 2,820 5,376 2,228 7,604 130 1,244 238 1% 5,986 976 2,057IN 98 3,931 2,762 6,693 2,057 8,750 148 1,139 226 1% 5,855 1,590 1,300IN 00 4,332 2,754 7,086 1,632 8,718 143 797 357 1% 5,423 2,081 1,933IN 02 3,957 2,677 6,634 1,355 7,989 130 640 438 4% 4,981 3,802 1,827IN 04 6,336 2,652 8,988 880 9,868 158 559 569 2% 4,447 9,307 1,739IN 05 10,123 0 10,123 736 10,859 173 381 581 3,931 9,285 1,697
Persons with ID/DD by Home Size Utilization Rate per
100,000 of Population
Persons with ID/DD
Receiving HCBS
Persons with ID/DD Living in
Nursing Homes
State Institution Population
Per Diem of State
Institutions (in $)
0-21 Yr. Olds as % of State Institution Residents
Persons with ID/DD Living in ICFs-MR
20051982
1-6
7-15
16+
1994
$0
$200
$400
$600
$800
77 82 87 89 91 94 96 98 00 02 04 05
Year
Per
Die
m C
ost
s
0
500
1,000
1,500
2,000
2,500
3,000
3,500
Nu
mb
er o
f R
esid
ents
77 82 87 89 91 94 96 98 00 02 04 05
Year
0%
5%10%
15%
20%
25%30%
35%
% o
f Y
outh
s in
Sta
te
Inst
itu
tio
ns
77 82 87 89 91 94 96 98 00 02 04 05
Year
02,0004,0006,0008,000
10,00012,00014,00016,000
77 82 87 89 91 94 96 98 00 02 04 05
Year
Nu
mb
er o
f Per
son
s HCBS ICF-MR
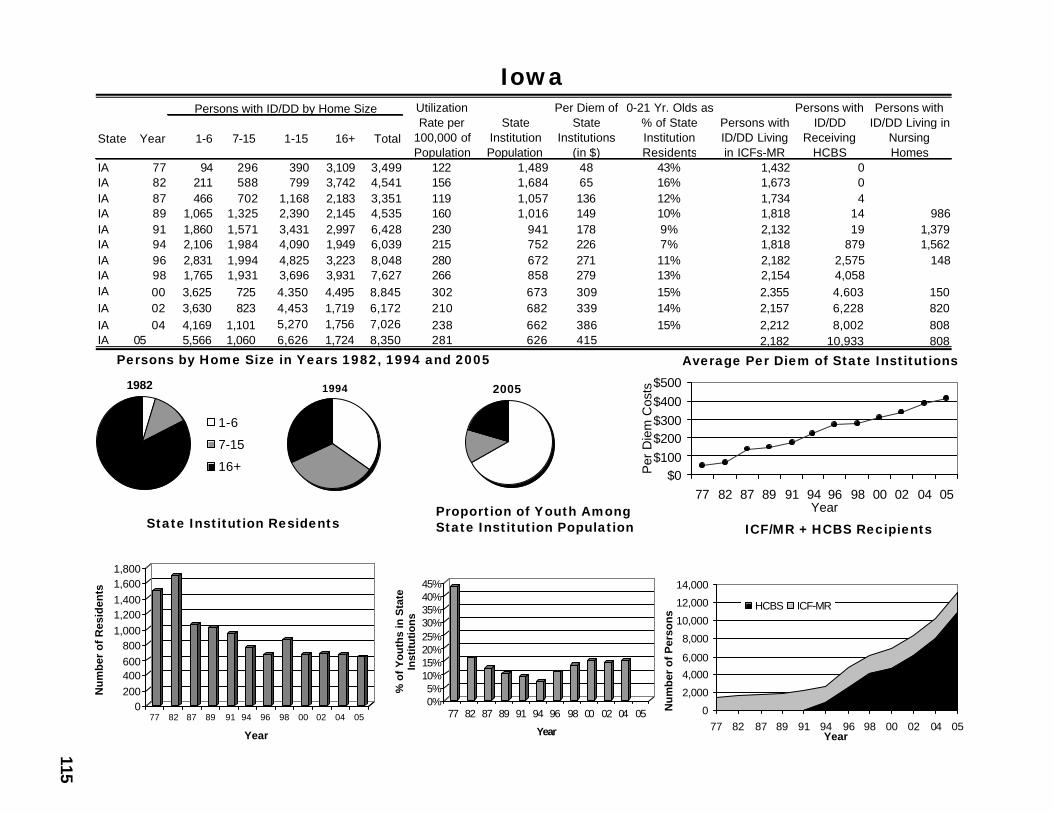
115
Iowa
Average Per Diem of State Institutions
State Institution Residents ICF/MR + HCBS RecipientsProportion of Youth AmongState Institution Population
Persons by Home Size in Years 1982, 1994 and 2005
State Year 1-6 7-15 1-15 16+ Total
IA 77 94 296 390 3,109 3,499 122 1,489 48 43% 1,432 0IA 82 211 588 799 3,742 4,541 156 1,684 65 16% 1,673 0IA 87 466 702 1,168 2,183 3,351 119 1,057 136 12% 1,734 4IA 89 1,065 1,325 2,390 2,145 4,535 160 1,016 149 10% 1,818 14 986IA 91 1,860 1,571 3,431 2,997 6,428 230 941 178 9% 2,132 19 1,379IA 94 2,106 1,984 4,090 1,949 6,039 215 752 226 7% 1,818 879 1,562IA 96 2,831 1,994 4,825 3,223 8,048 280 672 271 11% 2,182 2,575 148IA 98 1,765 1,931 3,696 3,931 7,627 266 858 279 13% 2,154 4,058IA 00 3,625 725 4,350 4,495 8,845 302 673 309 15% 2,355 4,603 150IA 02 3,630 823 4,453 1,719 6,172 210 682 339 14% 2,157 6,228 820IA 04 4,169 1,101 5,270 1,756 7,026 238 662 386 15% 2,212 8,002 808IA 05 5,566 1,060 6,626 1,724 8,350 281 626 415 2,182 10,933 808
Persons with ID/DD by Home Size Utilization Rate per
100,000 of Population
Persons with ID/DD
Receiving HCBS
Persons with ID/DD Living in
Nursing Homes
State Institution Population
Per Diem of State
Institutions (in $)
0-21 Yr. Olds as % of State Institution Residents
Persons with ID/DD Living in ICFs-MR
20051982
1-6
7-15
16+
1994
$0$100$200$300$400$500
77 82 87 89 91 94 96 98 00 02 04 05Year
Per
Die
m C
osts
0200400600800
1,0001,2001,4001,6001,800
Nu
mb
er o
f R
esid
ents
77 82 87 89 91 94 96 98 00 02 04 05
Year
0%5%
10%15%20%25%30%35%40%45%
% o
f Y
ou
ths
in S
tate
In
stitu
tion
s
77 82 87 89 91 94 96 98 00 02 04 05
Year
0
2,000
4,000
6,000
8,000
10,000
12,000
14,000
77 82 87 89 91 94 96 98 00 02 04 05Year
Nu
mb
er o
f P
erso
ns
HCBS ICF-MR

116 Kansas
Average Per Diem of State Institutions
State Institution ResidentsICF/MR + HCBS Recipients
Proportion of Youth AmongState Institution Population
Persons by Home Size in Years 1982, 1994 and 2005
State Year 1-6 7-15 1-15 16+ Total
KS 77 220 406 626 2,080 2,706 116 1,460 49 52% 1,810 0KS 82 184 482 666 2,209 2,875 119 1,371 78 46% 2,078 0KS 87 613 555 1,168 1,974 3,142 127 1,298 123 31% 2,161 135KS 89 885 1,019 1,904 1,710 2,974 118 1,070 148 25% 1,955 314 35KS 91 764 533 1,297 1,698 2,995 120 1,021 200 23% 2,015 497 31KS 94 584 941 1,525 1,477 3,002 119 806 232 17% 1,767 1,339 0KS 96 546 831 1,377 1,406 2,783 106 676 277 1,586 3,146 0KS 98 3,375 268 3,643 850 4,493 171 415 275 11% 1,098 4,891 0KS 00 3,798 229 4,027 590 4,674 174 389 320 9% 853 5,442 38KS 02 4,210 201 4,411 467 4,878 180 383 327 7% 688 6,239 511KS 04 4,860 442 5,302 441 5,743 210 363 339 6% 640 6,457 499KS 05 5,063 327 5,390 427 5,817 212 368 374 636 6,771 0
Persons with ID/DD by Home Size Utilization Rate per
100,000 of Population
Persons with ID/DD
Receiving HCBS
Persons with ID/DD Living in
Nursing Homes
State Institution Population
Per Diem of State
Institutions (in $)
0-21 Yr. Olds as % of State Institution Residents
Persons with ID/DD Living in ICFs-MR
20051982
1-6
7-15
16+
1994
$0
$100
$200
$300
$400
77 82 87 89 91 94 96 98 00 02 04 05Year
Per
Die
m C
osts
0
200400600
8001,000
1,2001,400
1,600
Nu
mb
er o
f R
esid
ents
77 82 87 89 91 94 96 98 00 02 04 05
Year0%
10%
20%
30%
40%
50%
60%
% o
f Y
ou
ths
in S
tate
In
stit
uti
on
s
77 82 87 89 91 94 96 98 00 02 04 05
Year
01,0002,0003,0004,0005,0006,0007,0008,000
77 82 87 89 91 94 96 98 00 02 04 05
Year
Nu
mb
er o
f P
erso
ns
HCBS ICF-MR

117
Kentucky
Average Per Diem of State Institutions
State Institution Residents ICF/MR + HCBS RecipientsProportion of Youth AmongState Institution Population
Persons by Home Size in Years 1982, 1994 and 2005
State Year 1-6 7-15 1-15 16+ Total
KY 77 44 29 73 1,585 1,658 48 789 69 56% 999 0KY 82 112 63 175 1,685 1,860 51 811 89 40% 1,250 0KY 87 327 103 430 1,199 1,629 44 786 131 24% 1,199 609KY 89 483 137 620 1,245 1,865 50 732 142 14% 1,179 728 400KY 91 747 150 897 1,244 2,141 58 731 200 11% 1,191 762 217KY 94 738 189 927 1,163 2,090 55 620 205 8% 1,133 887KY 96 1,002 234 1,236 1,173 2,409 62 644 227 5% 1,157 924KY 98 1,092 258 1,350 1,169 2,519 64 640 262 1,177 1,035KY 00 1,267 274 1,541 1,133 2,674 66 620 291 2% 1,120 1,279KY 02 2,462 204 2,666 852 3,518 86 601 384 2% 876 1,807 741KY 04 2,760 92 2,852 795 3,647 88 498 327 1% 793 2,432 302KY 05 3,176 129 3,305 703 4,008 96 495 448 727 2,654 450
Persons with ID/DD by Home Size Utilization Rate per
100,000 of Population
Persons with ID/DD
Receiving HCBS
Persons with ID/DD Living in
Nursing Homes
State Institution Population
Per Diem of State
Institutions (in $)
0-21 Yr. Olds as % of State Institution Residents
Persons with ID/DD Living in ICFs-MR
20051982
1-6
7-15
16+
1994
$0
$100
$200
$300
$400
$500
77 82 87 89 91 94 96 98 00 02 04 05
Year
Per
Die
m C
ost
s
0100200300400500600700800900
Nu
mb
er o
f R
esid
ents
77 82 87 89 91 94 96 98 00 02 04 05
Year
0%
10%
20%
30%
40%
50%
60%
% o
f Y
ou
ths
in S
tate
In
stit
uti
on
s
77 82 87 89 91 94 96 98 00 02 04 05
Year
0
500
1,0001,5002,000
2,500
3,000
3,500
4,000
77 82 87 89 91 94 96 98 00 02 04 05Year
Nu
mb
er o
f Per
son
s
HCBS ICF-MR
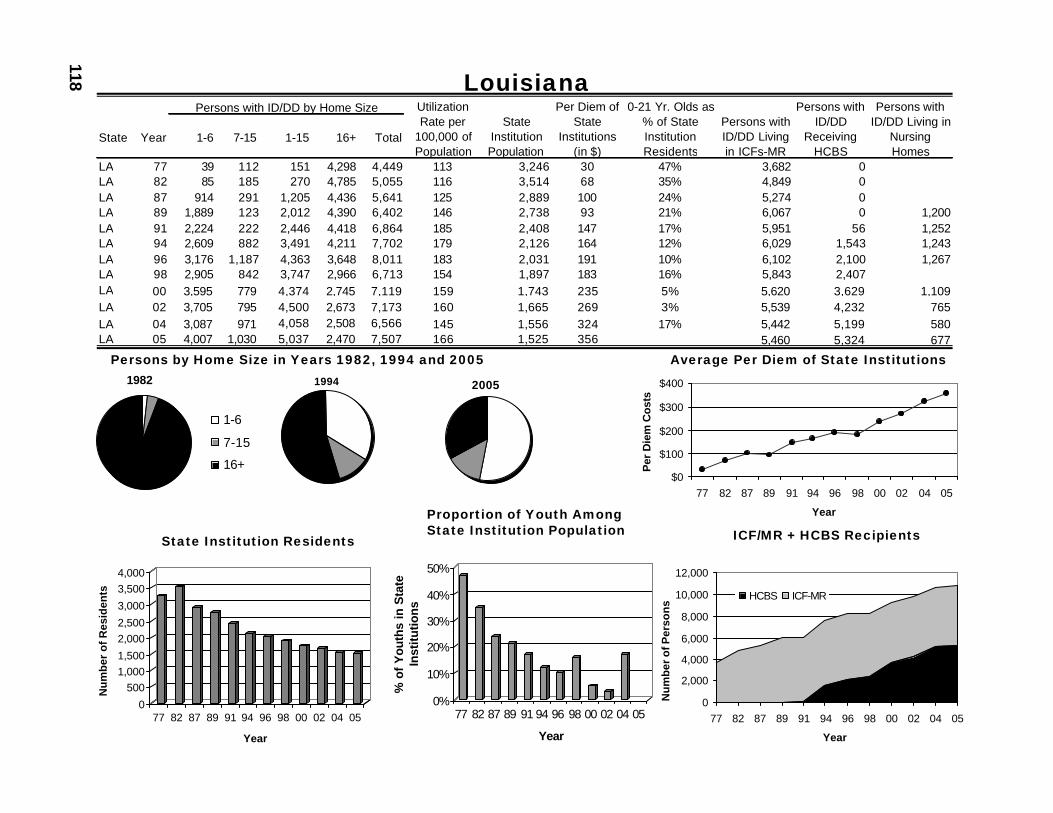
118
Average Per Diem of State Institutions
State Institution Residents ICF/MR + HCBS RecipientsProportion of Youth AmongState Institution Population
Louisiana
Persons by Home Size in Years 1982, 1994 and 2005
State Year 1-6 7-15 1-15 16+ Total
LA 77 39 112 151 4,298 4,449 113 3,246 30 47% 3,682 0LA 82 85 185 270 4,785 5,055 116 3,514 68 35% 4,849 0LA 87 914 291 1,205 4,436 5,641 125 2,889 100 24% 5,274 0LA 89 1,889 123 2,012 4,390 6,402 146 2,738 93 21% 6,067 0 1,200LA 91 2,224 222 2,446 4,418 6,864 185 2,408 147 17% 5,951 56 1,252LA 94 2,609 882 3,491 4,211 7,702 179 2,126 164 12% 6,029 1,543 1,243LA 96 3,176 1,187 4,363 3,648 8,011 183 2,031 191 10% 6,102 2,100 1,267LA 98 2,905 842 3,747 2,966 6,713 154 1,897 183 16% 5,843 2,407LA 00 3,595 779 4,374 2,745 7,119 159 1,743 235 5% 5,620 3,629 1,109LA 02 3,705 795 4,500 2,673 7,173 160 1,665 269 3% 5,539 4,232 765LA 04 3,087 971 4,058 2,508 6,566 145 1,556 324 17% 5,442 5,199 580LA 05 4,007 1,030 5,037 2,470 7,507 166 1,525 356 5,460 5,324 677
Persons with ID/DD by Home Size Utilization Rate per
100,000 of Population
Persons with ID/DD
Receiving HCBS
Persons with ID/DD Living in
Nursing Homes
State Institution Population
Per Diem of State
Institutions (in $)
0-21 Yr. Olds as % of State Institution Residents
Persons with ID/DD Living in ICFs-MR
20051982
1-6
7-15
16+
1994
$0
$100
$200
$300
$400
77 82 87 89 91 94 96 98 00 02 04 05
Year
Per
Die
m C
osts
0
5001,0001,500
2,0002,500
3,000
3,5004,000
Nu
mb
er o
f R
esid
ents
77 82 87 89 91 94 96 98 00 02 04 05
Year
0%
10%
20%
30%
40%
50%
% o
f Y
outh
s in
Sta
te
Inst
itutio
ns
77 82 87 89 91 94 96 98 00 02 04 05
Year
0
2,000
4,000
6,000
8,000
10,000
12,000
77 82 87 89 91 94 96 98 00 02 04 05
Year
Nu
mb
er o
f Per
son
s
HCBS ICF-MR
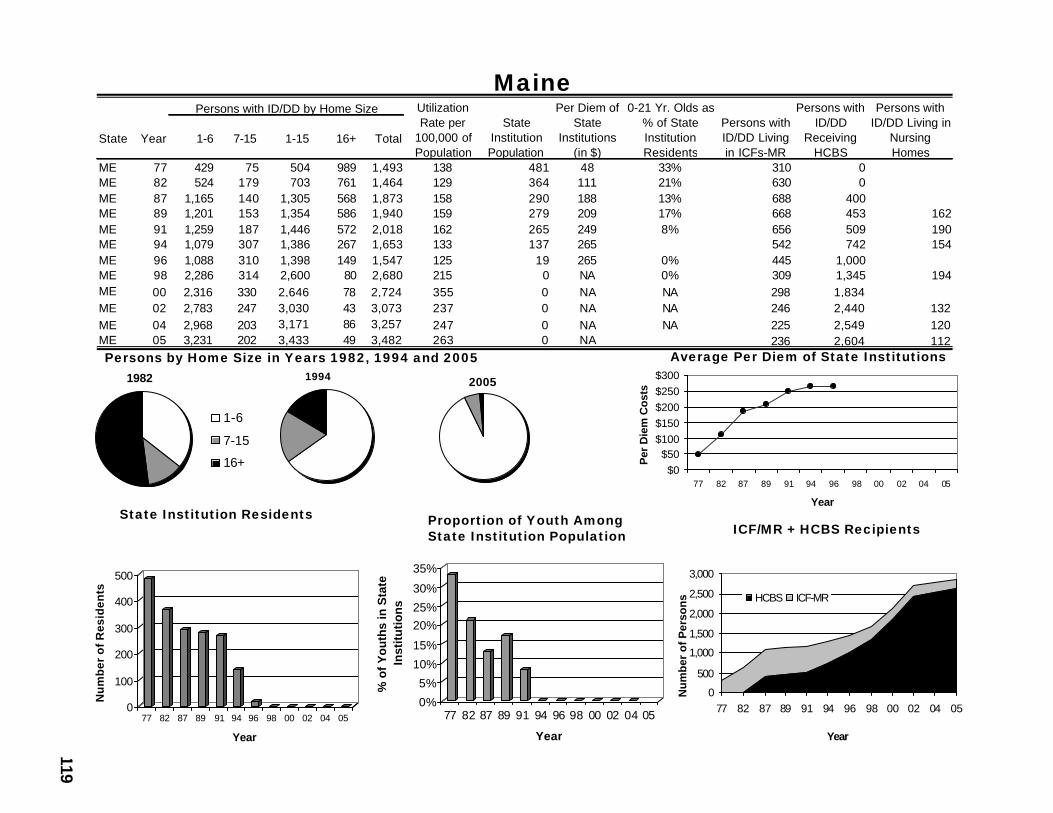
119
Maine
Average Per Diem of State Institutions
State Institution ResidentsICF/MR + HCBS RecipientsProportion of Youth Among
State Institution Population
Persons by Home Size in Years 1982, 1994 and 2005
State Year 1-6 7-15 1-15 16+ Total
ME 77 429 75 504 989 1,493 138 481 48 33% 310 0ME 82 524 179 703 761 1,464 129 364 111 21% 630 0ME 87 1,165 140 1,305 568 1,873 158 290 188 13% 688 400ME 89 1,201 153 1,354 586 1,940 159 279 209 17% 668 453 162ME 91 1,259 187 1,446 572 2,018 162 265 249 8% 656 509 190ME 94 1,079 307 1,386 267 1,653 133 137 265 542 742 154ME 96 1,088 310 1,398 149 1,547 125 19 265 0% 445 1,000ME 98 2,286 314 2,600 80 2,680 215 0 NA 0% 309 1,345 194ME 00 2,316 330 2,646 78 2,724 355 0 NA NA 298 1,834ME 02 2,783 247 3,030 43 3,073 237 0 NA NA 246 2,440 132ME 04 2,968 203 3,171 86 3,257 247 0 NA NA 225 2,549 120ME 05 3,231 202 3,433 49 3,482 263 0 NA 236 2,604 112
Persons with ID/DD by Home Size Utilization Rate per
100,000 of Population
Persons with ID/DD
Receiving HCBS
Persons with ID/DD Living in
Nursing Homes
State Institution Population
Per Diem of State
Institutions (in $)
0-21 Yr. Olds as % of State Institution Residents
Persons with ID/DD Living in ICFs-MR
20051982
1-6
7-15
16+
1994
$0$50
$100$150$200$250$300
77 82 87 89 91 94 96 98 00 02 04 05
Year
Per
Die
m C
osts
0
100
200
300
400
500
Nu
mb
er o
f R
esid
ents
77 82 87 89 91 94 96 98 00 02 04 05
Year
0%
5%
10%
15%
20%25%
30%
35%
% o
f Y
ou
ths
in S
tate
In
stit
uti
on
s
77 82 87 89 91 94 96 98 00 02 04 05
Year
0
500
1,000
1,500
2,000
2,500
3,000
77 82 87 89 91 94 96 98 00 02 04 05
Year
Nu
mb
er o
f Per
son
s HCBS ICF-MR
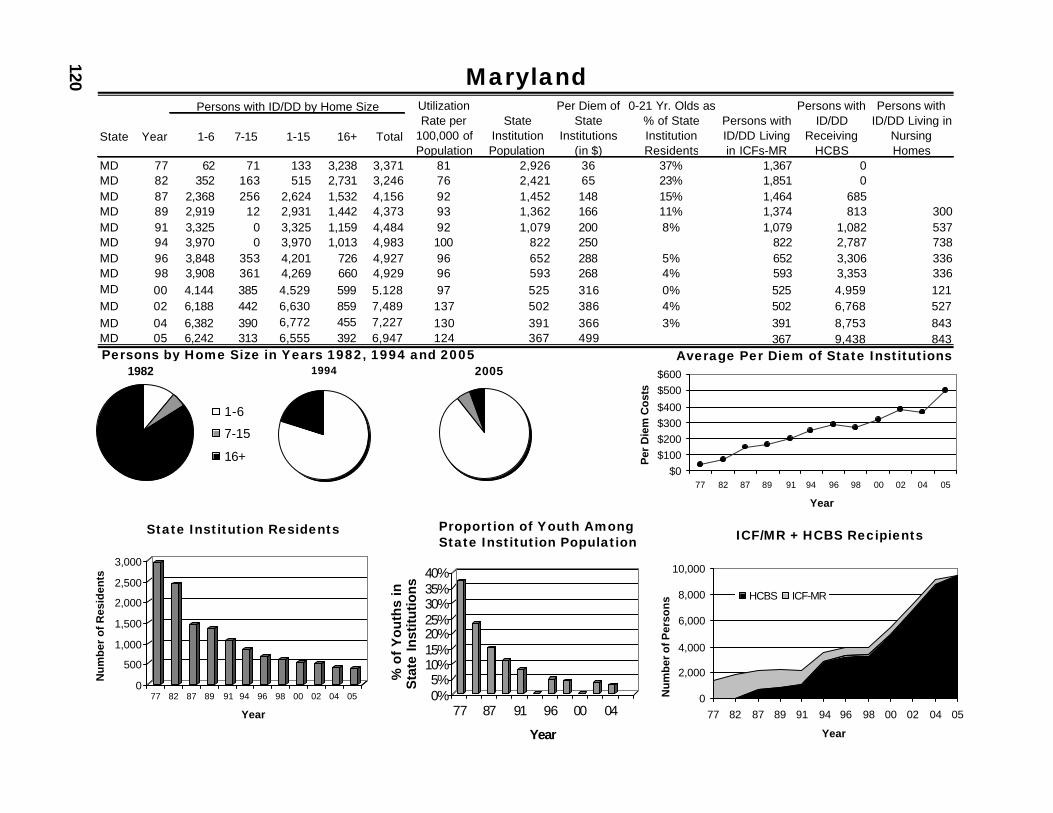
120 Maryland
Average Per Diem of State Institutions
State Institution Residents ICF/MR + HCBS RecipientsProportion of Youth AmongState Institution Population
Persons by Home Size in Years 1982, 1994 and 2005
State Year 1-6 7-15 1-15 16+ Total
MD 77 62 71 133 3,238 3,371 81 2,926 36 37% 1,367 0MD 82 352 163 515 2,731 3,246 76 2,421 65 23% 1,851 0MD 87 2,368 256 2,624 1,532 4,156 92 1,452 148 15% 1,464 685MD 89 2,919 12 2,931 1,442 4,373 93 1,362 166 11% 1,374 813 300MD 91 3,325 0 3,325 1,159 4,484 92 1,079 200 8% 1,079 1,082 537MD 94 3,970 0 3,970 1,013 4,983 100 822 250 822 2,787 738MD 96 3,848 353 4,201 726 4,927 96 652 288 5% 652 3,306 336MD 98 3,908 361 4,269 660 4,929 96 593 268 4% 593 3,353 336MD 00 4,144 385 4,529 599 5,128 97 525 316 0% 525 4,959 121MD 02 6,188 442 6,630 859 7,489 137 502 386 4% 502 6,768 527MD 04 6,382 390 6,772 455 7,227 130 391 366 3% 391 8,753 843MD 05 6,242 313 6,555 392 6,947 124 367 499 367 9,438 843
Persons with ID/DD by Home Size Utilization Rate per
100,000 of Population
Persons with ID/DD
Receiving HCBS
Persons with ID/DD Living in
Nursing Homes
State Institution Population
Per Diem of State
Institutions (in $)
0-21 Yr. Olds as % of State Institution Residents
Persons with ID/DD Living in ICFs-MR
20051982
1-6
7-15
16+
1994
$0$100$200$300$400
$500$600
77 82 87 89 91 94 96 98 00 02 04 05
Year
Per
Die
m C
osts
0
500
1,000
1,500
2,000
2,500
3,000
Nu
mb
er o
f R
esid
ents
77 82 87 89 91 94 96 98 00 02 04 05
Year
0%5%
10%15%20%25%30%35%40%
% o
f Y
ou
ths
in
Sta
te I
nst
itutio
ns
77 87 91 96 00 04
Year
0
2,000
4,000
6,000
8,000
10,000
77 82 87 89 91 94 96 98 00 02 04 05
Year
Nu
mb
er o
f Per
son
s HCBS ICF-MR
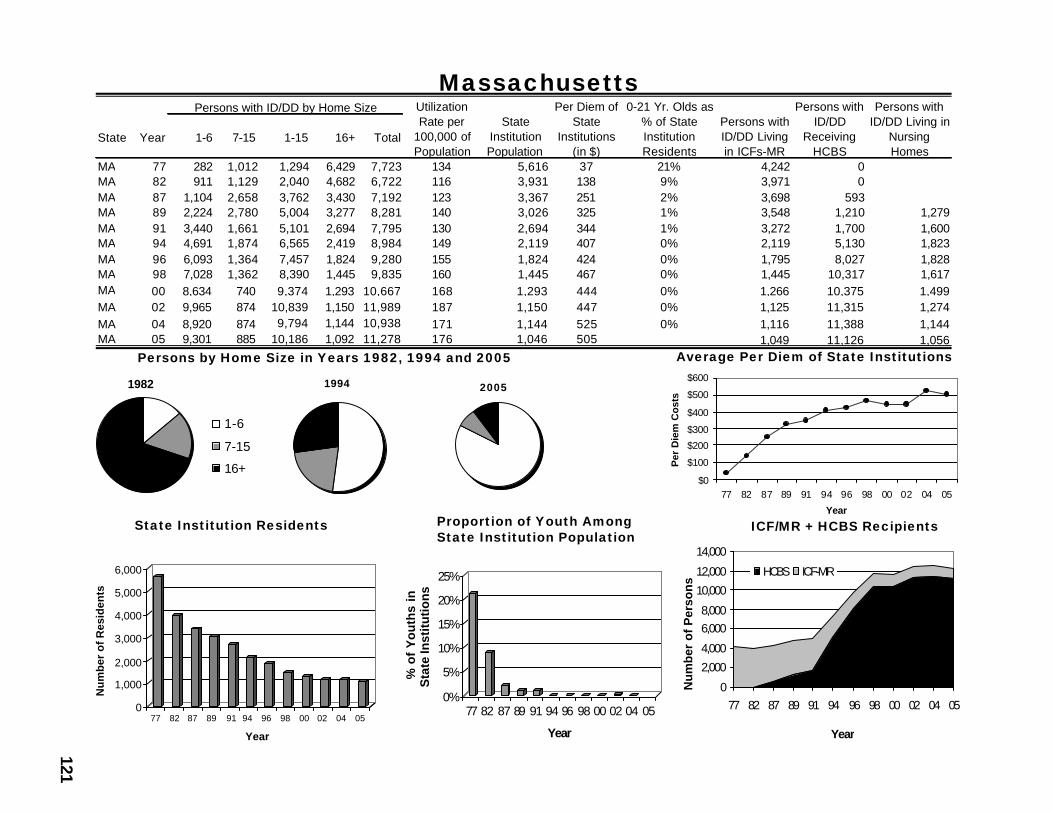
121
Massachusetts
Average Per Diem of State Institutions
State Institution Residents ICF/MR + HCBS RecipientsProportion of Youth AmongState Institution Population
Persons by Home Size in Years 1982, 1994 and 2005
State Year 1-6 7-15 1-15 16+ Total
MA 77 282 1,012 1,294 6,429 7,723 134 5,616 37 21% 4,242 0MA 82 911 1,129 2,040 4,682 6,722 116 3,931 138 9% 3,971 0MA 87 1,104 2,658 3,762 3,430 7,192 123 3,367 251 2% 3,698 593MA 89 2,224 2,780 5,004 3,277 8,281 140 3,026 325 1% 3,548 1,210 1,279MA 91 3,440 1,661 5,101 2,694 7,795 130 2,694 344 1% 3,272 1,700 1,600MA 94 4,691 1,874 6,565 2,419 8,984 149 2,119 407 0% 2,119 5,130 1,823MA 96 6,093 1,364 7,457 1,824 9,280 155 1,824 424 0% 1,795 8,027 1,828MA 98 7,028 1,362 8,390 1,445 9,835 160 1,445 467 0% 1,445 10,317 1,617MA 00 8,634 740 9,374 1,293 10,667 168 1,293 444 0% 1,266 10,375 1,499MA 02 9,965 874 10,839 1,150 11,989 187 1,150 447 0% 1,125 11,315 1,274MA 04 8,920 874 9,794 1,144 10,938 171 1,144 525 0% 1,116 11,388 1,144MA 05 9,301 885 10,186 1,092 11,278 176 1,046 505 1,049 11,126 1,056
Persons with ID/DD by Home Size Utilization Rate per
100,000 of Population
Persons with ID/DD
Receiving HCBS
Persons with ID/DD Living in
Nursing Homes
State Institution Population
Per Diem of State
Institutions (in $)
0-21 Yr. Olds as % of State Institution Residents
Persons with ID/DD Living in ICFs-MR
20051982
1-6
7-15
16+
1994
$0
$100
$200
$300
$400
$500
$600
77 82 87 89 91 94 96 98 00 02 04 05
Year
Per
Die
m C
ost
s
0
1,000
2,000
3,000
4,000
5,000
6,000
Nu
mb
er o
f R
esid
ents
77 82 87 89 91 94 96 98 00 02 04 05
Year
0%
5%
10%
15%
20%
25%
% o
f Y
ou
ths
in
Sta
te In
stit
uti
on
s
77 82 87 89 91 94 96 98 00 02 04 05
Year
0
2,000
4,000
6,0008,000
10,000
12,000
14,000
77 82 87 89 91 94 96 98 00 02 04 05
Year
Nu
mb
er o
f P
erso
ns
HCBS ICF-MR

122 Michigan
Average Per Diem of State Institutions
State Institution Residents ICF/MR + HCBS RecipientsProportion of Youth AmongState Institution Population
Persons by Home Size in Years 1982, 1994 and 2005
20051982
1-6
7-15
16+
1994
$0$100$200$300
$400$500
$600
77 82 87 89 91 94 96 98 00 02 04 05Year
Per
Die
m C
osts
01,0002,0003,0004,0005,0006,0007,000
Nu
mb
er o
f R
esid
ents
77 82 87 89 91 94 96 98 00 02 04 05
Year
0%5%
10%15%20%25%30%35%
% o
f Y
outh
s in
Sta
te
Inst
itutio
ns
77 82 87 89 91 94 96 98 00 02 04 05
Year
0
2,000
4,000
6,000
8,000
10,000
77 82 87 89 91 94 96 98 00 02 04 05
Year
Nu
mb
er o
f Per
son
s HCBS ICF-MR
State Year 1-6 7-15 1-15 16+ Total
MI 77 1,306 2,341 3,647 9,002 12,649 139 6,100 47 35% 5,760 0MI 82 3,529 1,868 5,397 5,705 11,102 122 3,173 132 16% 4,002 0MI 87 4,934 572 5,506 2,333 7,839 85 1,658 199 9% 3,425 3MI 89 6,012 0 6,012 1,780 7,792 84 1,237 238 7% 2,959 1,292 1,900MI 91 7,513 0 7,513 1,013 8,526 91 760 276 6% 2,850 2,122 1,800MI 94 8,719 0 8,719 411 9,130 96 411 304 7% 3,366 3,367MI 96 9,074 0 9,074 346 9,420 98 346 383 12% 3,185 5,207 748MI 98 9,425 0 9,425 283 9,708 99 283 375 9% 2,830 5,708 838MI 00 11,411 0 11,411 269 11,680 118 269 384 9% 269 8,024 902MI 02 13,397e 0 13,397e 173 13,570 135 173 405 10% 173 8,550 1,087MI 04 13,752 0 13,752 129 13,881 137 129 533 8% 129 8,256 589MI 05 14,107 0 14,107 190 15,675 155 190 522 190 8,601 357
Persons with ID/DD by Home Size Utilization Rate per
100,000 of Population
Persons with ID/DD
Receiving HCBS
Persons with ID/DD Living in
Nursing Homes
State Institution Population
Per Diem of State
Institutions (in $)
0-21 Yr. Olds as % of State Institution Residents
Persons with ID/DD Living in ICFs-MR
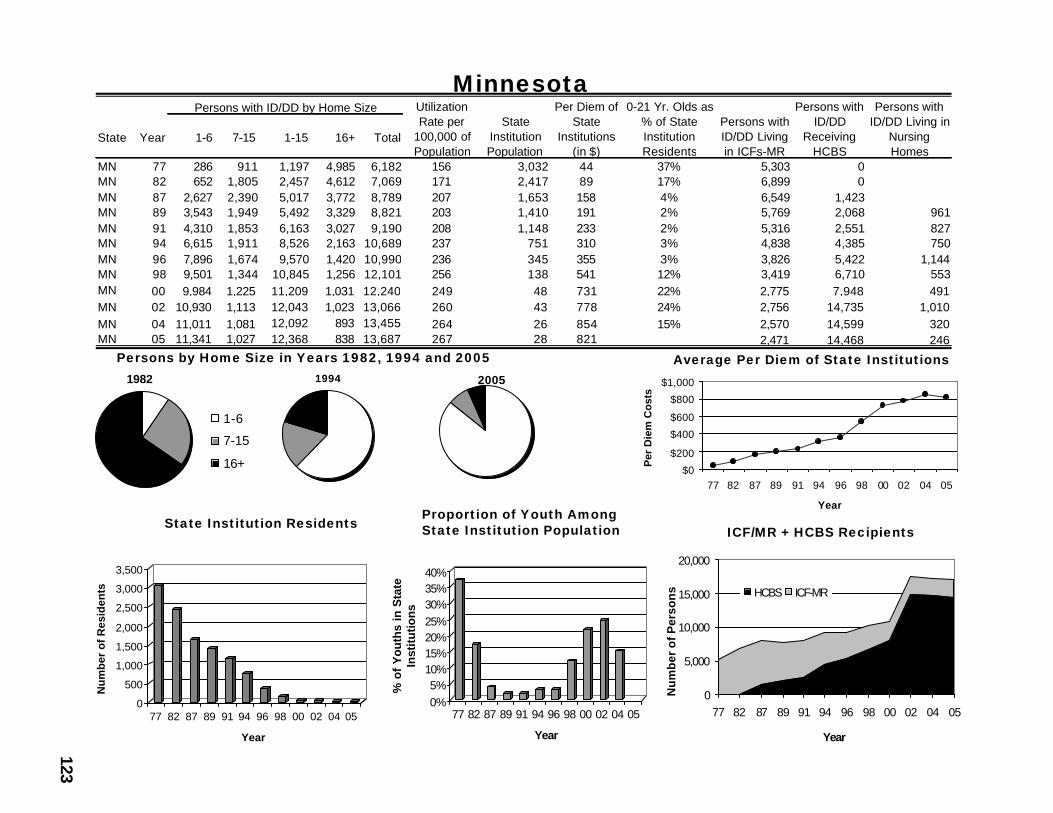
123
Minnesota
Average Per Diem of State Institutions
State Institution Residents ICF/MR + HCBS RecipientsProportion of Youth AmongState Institution Population
Persons by Home Size in Years 1982, 1994 and 2005
State Year 1-6 7-15 1-15 16+ Total
MN 77 286 911 1,197 4,985 6,182 156 3,032 44 37% 5,303 0MN 82 652 1,805 2,457 4,612 7,069 171 2,417 89 17% 6,899 0MN 87 2,627 2,390 5,017 3,772 8,789 207 1,653 158 4% 6,549 1,423MN 89 3,543 1,949 5,492 3,329 8,821 203 1,410 191 2% 5,769 2,068 961MN 91 4,310 1,853 6,163 3,027 9,190 208 1,148 233 2% 5,316 2,551 827MN 94 6,615 1,911 8,526 2,163 10,689 237 751 310 3% 4,838 4,385 750MN 96 7,896 1,674 9,570 1,420 10,990 236 345 355 3% 3,826 5,422 1,144MN 98 9,501 1,344 10,845 1,256 12,101 256 138 541 12% 3,419 6,710 553MN 00 9,984 1,225 11,209 1,031 12,240 249 48 731 22% 2,775 7,948 491MN 02 10,930 1,113 12,043 1,023 13,066 260 43 778 24% 2,756 14,735 1,010MN 04 11,011 1,081 12,092 893 13,455 264 26 854 15% 2,570 14,599 320MN 05 11,341 1,027 12,368 838 13,687 267 28 821 2,471 14,468 246
Persons with ID/DD by Home Size Utilization Rate per
100,000 of Population
Persons with ID/DD
Receiving HCBS
Persons with ID/DD Living in
Nursing Homes
State Institution Population
Per Diem of State
Institutions (in $)
0-21 Yr. Olds as % of State Institution Residents
Persons with ID/DD Living in ICFs-MR
20051982
1-6
7-15
16+
1994
$0
$200
$400
$600
$800
$1,000
77 82 87 89 91 94 96 98 00 02 04 05
Year
Per
Die
m C
ost
s
0
500
1,000
1,500
2,000
2,500
3,000
3,500
Nu
mb
er o
f R
esid
ents
77 82 87 89 91 94 96 98 00 02 04 05
Year
0%5%
10%15%20%25%30%35%40%
% o
f Y
ou
ths
in S
tate
In
stit
uti
on
s
77 82 87 89 91 94 96 98 00 02 04 05
Year
0
5,000
10,000
15,000
20,000
77 82 87 89 91 94 96 98 00 02 04 05
Year
Nu
mb
er o
f Per
son
s HCBS ICF-MR
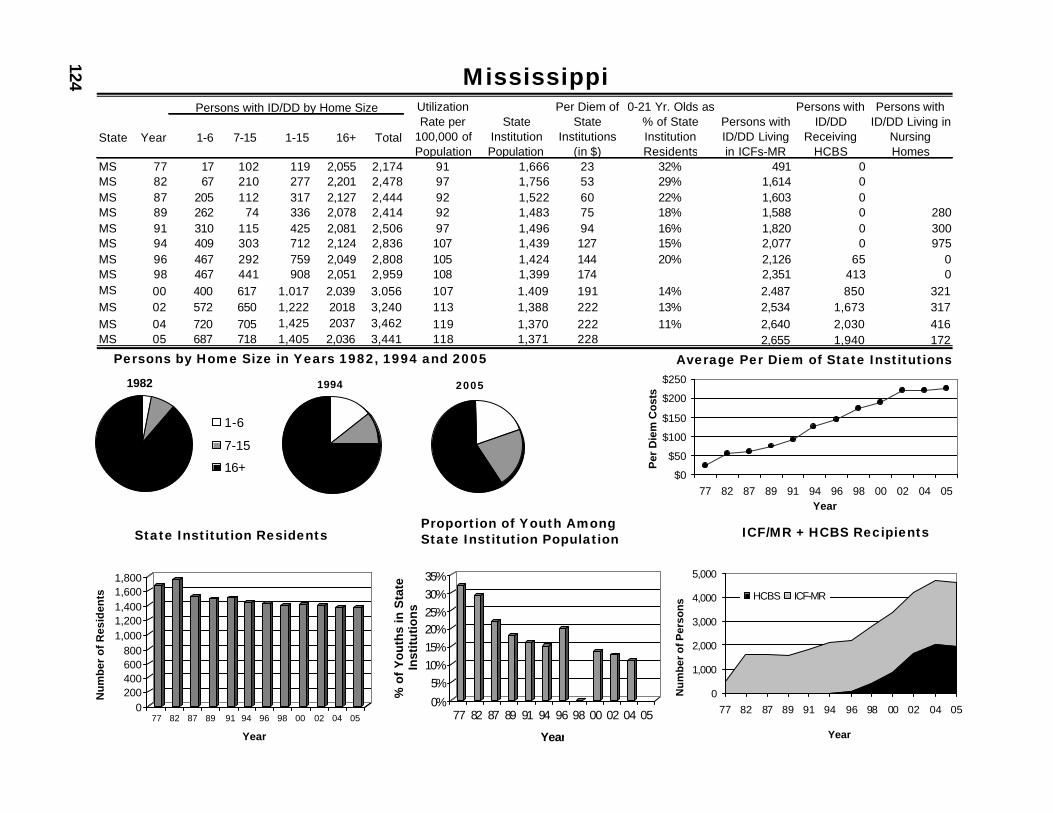
124 Mississippi
Average Per Diem of State Institutions
State Institution Residents ICF/MR + HCBS RecipientsProportion of Youth AmongState Institution Population
Persons by Home Size in Years 1982, 1994 and 2005
State Year 1-6 7-15 1-15 16+ Total
MS 77 17 102 119 2,055 2,174 91 1,666 23 32% 491 0MS 82 67 210 277 2,201 2,478 97 1,756 53 29% 1,614 0MS 87 205 112 317 2,127 2,444 92 1,522 60 22% 1,603 0MS 89 262 74 336 2,078 2,414 92 1,483 75 18% 1,588 0 280MS 91 310 115 425 2,081 2,506 97 1,496 94 16% 1,820 0 300MS 94 409 303 712 2,124 2,836 107 1,439 127 15% 2,077 0 975MS 96 467 292 759 2,049 2,808 105 1,424 144 20% 2,126 65 0MS 98 467 441 908 2,051 2,959 108 1,399 174 2,351 413 0MS 00 400 617 1,017 2,039 3,056 107 1,409 191 14% 2,487 850 321MS 02 572 650 1,222 2018 3,240 113 1,388 222 13% 2,534 1,673 317MS 04 720 705 1,425 2037 3,462 119 1,370 222 11% 2,640 2,030 416MS 05 687 718 1,405 2,036 3,441 118 1,371 228 2,655 1,940 172
Persons with ID/DD by Home Size Utilization Rate per
100,000 of Population
Persons with ID/DD
Receiving HCBS
Persons with ID/DD Living in
Nursing Homes
State Institution Population
Per Diem of State
Institutions (in $)
0-21 Yr. Olds as % of State Institution Residents
Persons with ID/DD Living in ICFs-MR
20051982
1-6
7-15
16+
1994
$0
$50
$100
$150
$200
$250
77 82 87 89 91 94 96 98 00 02 04 05Year
Per
Die
m C
osts
0200400600800
1,0001,2001,4001,6001,800
Nu
mb
er o
f R
esid
ents
77 82 87 89 91 94 96 98 00 02 04 05
Year
0%
5%10%15%20%25%30%35%
% o
f Y
ou
ths
in S
tate
In
stit
uti
on
s
77 82 87 89 91 94 96 98 00 02 04 05
Year
0
1,000
2,000
3,000
4,000
5,000
77 82 87 89 91 94 96 98 00 02 04 05
Year
Nu
mb
er o
f Per
son
s HCBS ICF-MR
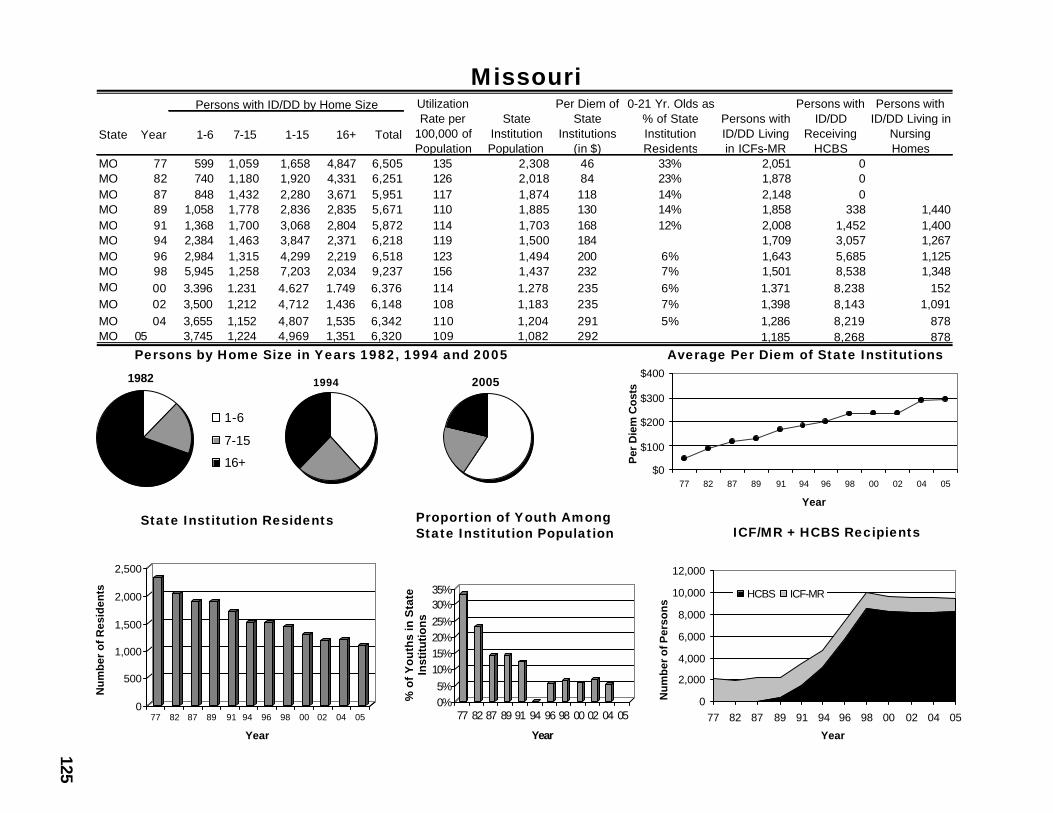
125
Missouri
Average Per Diem of State Institutions
State Institution ResidentsICF/MR + HCBS Recipients
Proportion of Youth AmongState Institution Population
Persons by Home Size in Years 1982, 1994 and 2005
State Year 1-6 7-15 1-15 16+ Total
MO 77 599 1,059 1,658 4,847 6,505 135 2,308 46 33% 2,051 0MO 82 740 1,180 1,920 4,331 6,251 126 2,018 84 23% 1,878 0MO 87 848 1,432 2,280 3,671 5,951 117 1,874 118 14% 2,148 0MO 89 1,058 1,778 2,836 2,835 5,671 110 1,885 130 14% 1,858 338 1,440MO 91 1,368 1,700 3,068 2,804 5,872 114 1,703 168 12% 2,008 1,452 1,400MO 94 2,384 1,463 3,847 2,371 6,218 119 1,500 184 1,709 3,057 1,267MO 96 2,984 1,315 4,299 2,219 6,518 123 1,494 200 6% 1,643 5,685 1,125MO 98 5,945 1,258 7,203 2,034 9,237 156 1,437 232 7% 1,501 8,538 1,348MO 00 3,396 1,231 4,627 1,749 6,376 114 1,278 235 6% 1,371 8,238 152MO 02 3,500 1,212 4,712 1,436 6,148 108 1,183 235 7% 1,398 8,143 1,091MO 04 3,655 1,152 4,807 1,535 6,342 110 1,204 291 5% 1,286 8,219 878MO 05 3,745 1,224 4,969 1,351 6,320 109 1,082 292 1,185 8,268 878
Persons with ID/DD by Home Size Utilization Rate per
100,000 of Population
Persons with ID/DD
Receiving HCBS
Persons with ID/DD Living in
Nursing Homes
State Institution Population
Per Diem of State
Institutions (in $)
0-21 Yr. Olds as % of State Institution Residents
Persons with ID/DD Living in ICFs-MR
20051982
1-6
7-15
16+
1994
$0
$100
$200
$300
$400
77 82 87 89 91 94 96 98 00 02 04 05
Year
Per
Die
m C
osts
0
500
1,000
1,500
2,000
2,500
Nu
mb
er o
f R
esid
ents
77 82 87 89 91 94 96 98 00 02 04 05
Year
0%5%
10%15%20%25%30%35%
% o
f Y
ou
ths
in S
tate
In
stitu
tion
s
77 82 87 89 91 94 96 98 00 02 04 05
Year
0
2,000
4,000
6,000
8,000
10,000
12,000
77 82 87 89 91 94 96 98 00 02 04 05
Year
Nu
mb
er o
f Per
son
s
HCBS ICF-MR

126 Montana
Average Per Diem of State Institutions
State Institution ResidentsICF/MR + HCBS RecipientsProportion of Youth Among
State Institution Population
Persons by Home Size in Years 1982, 1994 and 2005
State Year 1-6 7-15 1-15 16+ Total
MT 77 86 339 425 340 765 101 321 75 32% 0 0MT 82 93 415 508 273 781 98 273 119 19% 290 21MT 87 352 561 913 254 1,167 143 254 143 7% 264 210MT 89 513 559 1,072 240 1,312 163 240 164 5% 250 274 231MT 91 615 523 1,138 199 1,337 165 190 199 5% 197 355 232MT 94 778 531 1,309 163 1,472 175 163 233 171 546 158MT 96 839 501 1,340 157 1,497 171 157 256 3% 165 807 169MT 98 897 488 1,385 133 1,518 172 133 286 3% 141 931 163MT 00 1,018 488 1,506 130 1,636 181 130 348 5% 130 1,206 205MT 02 1,055 488 1,543 119 1,662 183 119 403 3% 119 1,452 149MT 04 1,204 429 1,633 93 1,726 186 93 559 9% 93 1,917 167MT 05 1,279 405 1,684 79 1,763 188 79 510 79 2,023 163
Persons with ID/DD by Home Size Utilization Rate per
100,000 of Population
Persons with ID/DD
Receiving HCBS
Persons with ID/DD Living in
Nursing Homes
State Institution Population
Per Diem of State
Institutions (in $)
0-21 Yr. Olds as % of State Institution Residents
Persons with ID/DD Living in ICFs-MR
20051982
1-6
7-15
16+
1994
$0$100$200$300$400$500$600
77 82 87 89 91 94 96 98 00 02 04 05Year
Per
Die
m C
osts
0
50
100
150
200
250
300
350
Nu
mb
er o
f R
esid
ents
77 82 87 89 91 94 96 98 00 02 04 05
Year0%
5%10%
15%20%
25%30%
35%
% o
f Y
outh
s in
Sta
te
Inst
itu
tio
ns
77 82 87 89 91 94 96 98 00 02 04 05
Year
0
500
1,000
1,500
2,000
2,500
77 82 87 89 91 94 96 98 00 02 04 05
Year
Nu
mb
er o
f Per
son
s HCBS ICF-MR
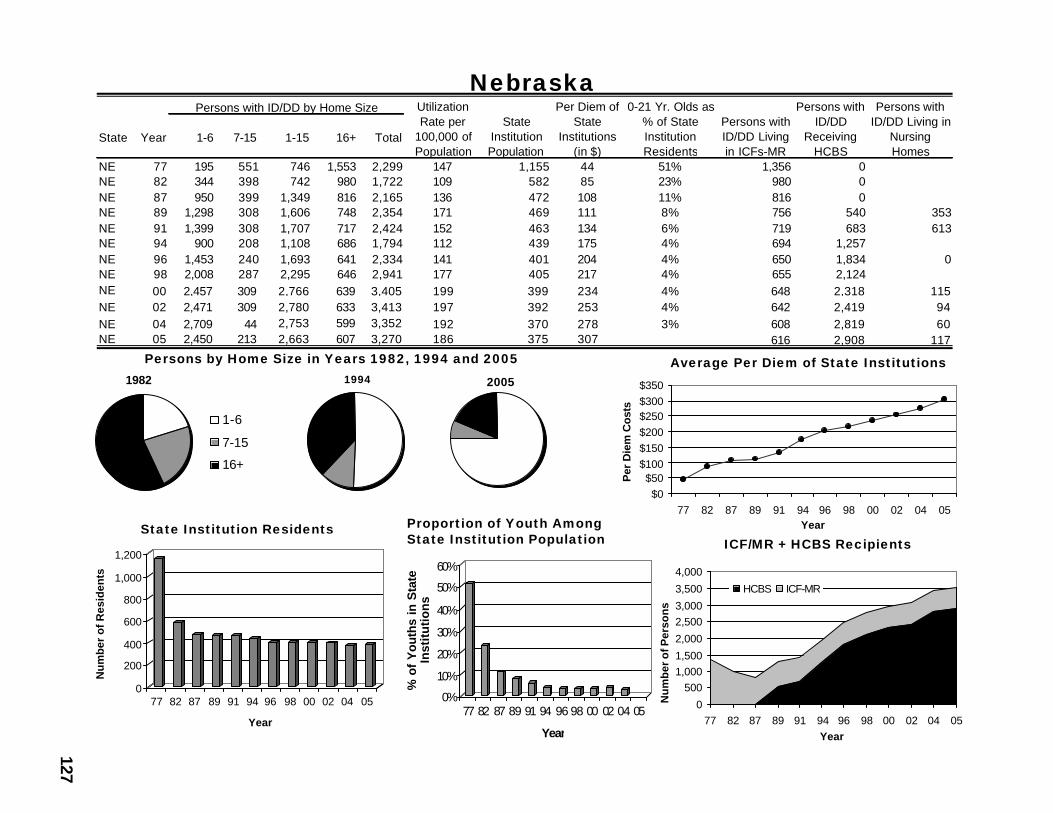
127
Nebraska
Average Per Diem of State Institutions
State Institution ResidentsICF/MR + HCBS Recipients
Proportion of Youth AmongState Institution Population
Persons by Home Size in Years 1982, 1994 and 2005
State Year 1-6 7-15 1-15 16+ Total
NE 77 195 551 746 1,553 2,299 147 1,155 44 51% 1,356 0NE 82 344 398 742 980 1,722 109 582 85 23% 980 0NE 87 950 399 1,349 816 2,165 136 472 108 11% 816 0NE 89 1,298 308 1,606 748 2,354 171 469 111 8% 756 540 353NE 91 1,399 308 1,707 717 2,424 152 463 134 6% 719 683 613NE 94 900 208 1,108 686 1,794 112 439 175 4% 694 1,257NE 96 1,453 240 1,693 641 2,334 141 401 204 4% 650 1,834 0NE 98 2,008 287 2,295 646 2,941 177 405 217 4% 655 2,124NE 00 2,457 309 2,766 639 3,405 199 399 234 4% 648 2,318 115NE 02 2,471 309 2,780 633 3,413 197 392 253 4% 642 2,419 94NE 04 2,709 44 2,753 599 3,352 192 370 278 3% 608 2,819 60NE 05 2,450 213 2,663 607 3,270 186 375 307 616 2,908 117
Persons with ID/DD by Home Size Utilization Rate per
100,000 of Population
Persons with ID/DD
Receiving HCBS
Persons with ID/DD Living in
Nursing Homes
State Institution Population
Per Diem of State
Institutions (in $)
0-21 Yr. Olds as % of State Institution Residents
Persons with ID/DD Living in ICFs-MR
20051982
1-6
7-15
16+
1994
$0$50
$100$150$200$250$300$350
77 82 87 89 91 94 96 98 00 02 04 05Year
Per
Die
m C
osts
0
200
400
600
800
1,000
1,200
Nu
mb
er o
f R
esid
ents
77 82 87 89 91 94 96 98 00 02 04 05
Year
0%
10%
20%
30%
40%
50%
60%
% o
f Y
outh
s in
Sta
te
Inst
itu
tio
ns
77 82 87 89 91 94 96 98 00 02 04 05
Year
0
5001,0001,500
2,000
2,5003,000
3,500
4,000
77 82 87 89 91 94 96 98 00 02 04 05Year
Nu
mb
er o
f Per
son
s
HCBS ICF-MR
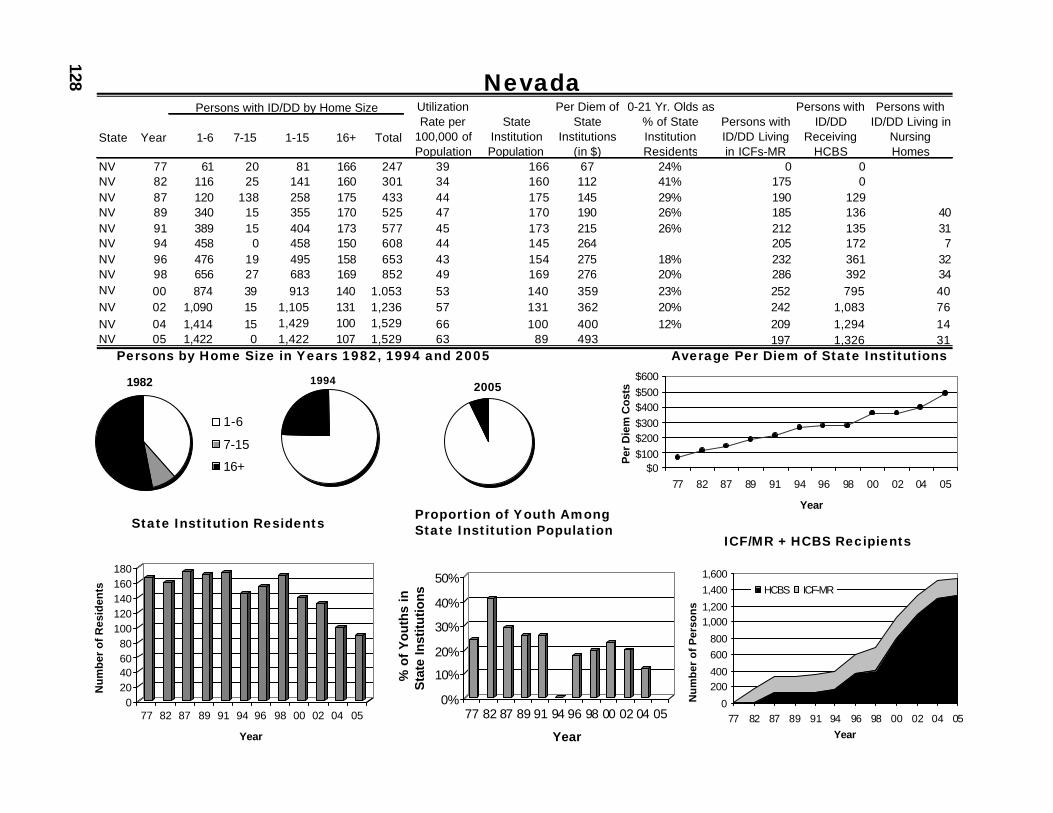
128 Nevada
Average Per Diem of State Institutions
State Institution ResidentsICF/MR + HCBS Recipients
Proportion of Youth AmongState Institution Population
Persons by Home Size in Years 1982, 1994 and 2005
State Year 1-6 7-15 1-15 16+ Total
NV 77 61 20 81 166 247 39 166 67 24% 0 0NV 82 116 25 141 160 301 34 160 112 41% 175 0NV 87 120 138 258 175 433 44 175 145 29% 190 129NV 89 340 15 355 170 525 47 170 190 26% 185 136 40NV 91 389 15 404 173 577 45 173 215 26% 212 135 31NV 94 458 0 458 150 608 44 145 264 205 172 7NV 96 476 19 495 158 653 43 154 275 18% 232 361 32NV 98 656 27 683 169 852 49 169 276 20% 286 392 34NV 00 874 39 913 140 1,053 53 140 359 23% 252 795 40NV 02 1,090 15 1,105 131 1,236 57 131 362 20% 242 1,083 76NV 04 1,414 15 1,429 100 1,529 66 100 400 12% 209 1,294 14NV 05 1,422 0 1,422 107 1,529 63 89 493 197 1,326 31
Persons with ID/DD by Home Size Utilization Rate per
100,000 of Population
Persons with ID/DD
Receiving HCBS
Persons with ID/DD Living in
Nursing Homes
State Institution Population
Per Diem of State
Institutions (in $)
0-21 Yr. Olds as % of State Institution Residents
Persons with ID/DD Living in ICFs-MR
200519941982
1-6
7-15
16+ $0$100$200$300$400$500$600
77 82 87 89 91 94 96 98 00 02 04 05
Year
Per
Die
m C
osts
020406080
100120140160180
Nu
mb
er o
f R
esid
ents
77 82 87 89 91 94 96 98 00 02 04 05
Year
0%
10%
20%
30%
40%
50%
% o
f Y
ou
ths
in
Sta
te In
stitu
tions
77 82 87 89 91 94 96 98 00 02 04 05
Year
0
200400
600800
1,0001,200
1,4001,600
77 82 87 89 91 94 96 98 00 02 04 05Year
Nu
mb
er o
f P
erso
ns
HCBS ICF-MR
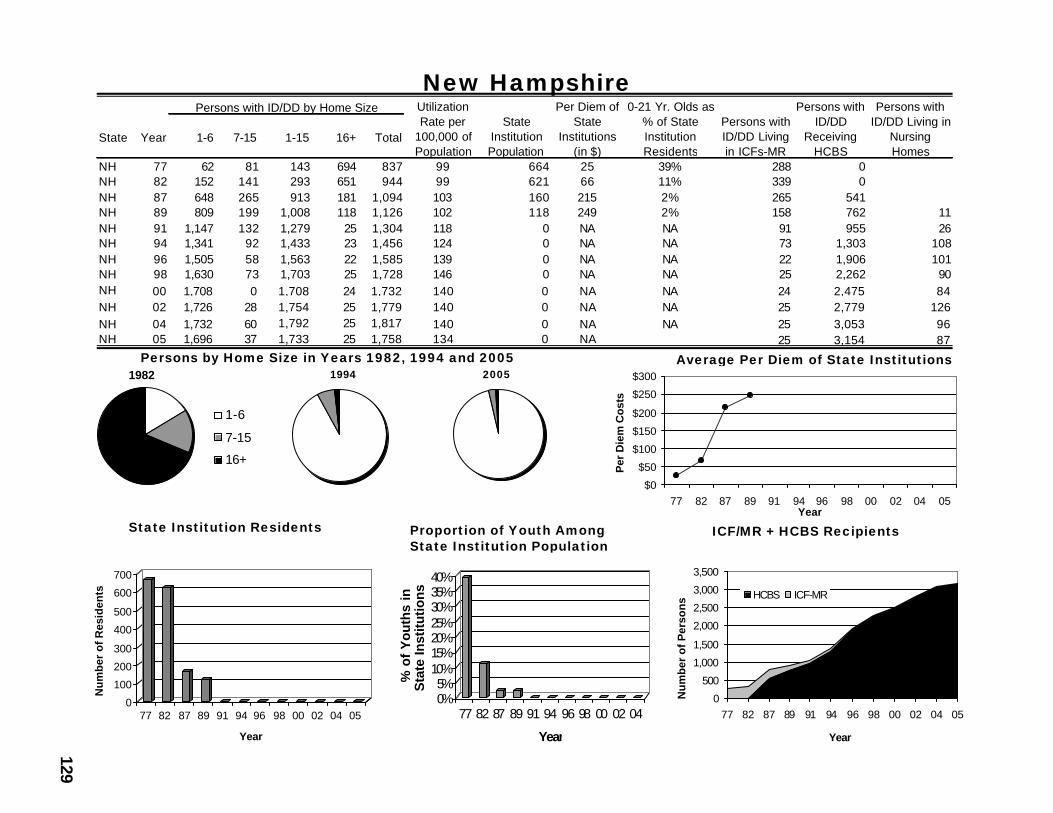
129
New Hampshire
Average Per Diem of State Institutions
State Institution Residents ICF/MR + HCBS RecipientsProportion of Youth AmongState Institution Population
Persons by Home Size in Years 1982, 1994 and 2005
State Year 1-6 7-15 1-15 16+ Total
NH 77 62 81 143 694 837 99 664 25 39% 288 0NH 82 152 141 293 651 944 99 621 66 11% 339 0NH 87 648 265 913 181 1,094 103 160 215 2% 265 541NH 89 809 199 1,008 118 1,126 102 118 249 2% 158 762 11NH 91 1,147 132 1,279 25 1,304 118 0 NA NA 91 955 26NH 94 1,341 92 1,433 23 1,456 124 0 NA NA 73 1,303 108NH 96 1,505 58 1,563 22 1,585 139 0 NA NA 22 1,906 101NH 98 1,630 73 1,703 25 1,728 146 0 NA NA 25 2,262 90NH 00 1,708 0 1,708 24 1,732 140 0 NA NA 24 2,475 84NH 02 1,726 28 1,754 25 1,779 140 0 NA NA 25 2,779 126NH 04 1,732 60 1,792 25 1,817 140 0 NA NA 25 3,053 96NH 05 1,696 37 1,733 25 1,758 134 0 NA 25 3,154 87
Persons with ID/DD by Home Size Utilization Rate per
100,000 of Population
Persons with ID/DD
Receiving HCBS
Persons with ID/DD Living in
Nursing Homes
State Institution Population
Per Diem of State
Institutions (in $)
0-21 Yr. Olds as % of State Institution Residents
Persons with ID/DD Living in ICFs-MR
20051982
1-6
7-15
16+
1994
$0
$50
$100
$150
$200
$250
$300
77 82 87 89 91 94 96 98 00 02 04 05Year
Per
Die
m C
osts
0
100
200
300
400
500
600
700
Nu
mb
er o
f R
esid
ents
77 82 87 89 91 94 96 98 00 02 04 05
Year
0%5%
10%15%20%25%30%35%40%
% o
f Y
ou
ths
in
Sta
te In
stitu
tions
77 82 87 89 91 94 96 98 00 02 04
Year
0
500
1,000
1,500
2,000
2,500
3,000
3,500
77 82 87 89 91 94 96 98 00 02 04 05
Year
Nu
mb
er o
f P
erso
ns HCBS ICF-MR
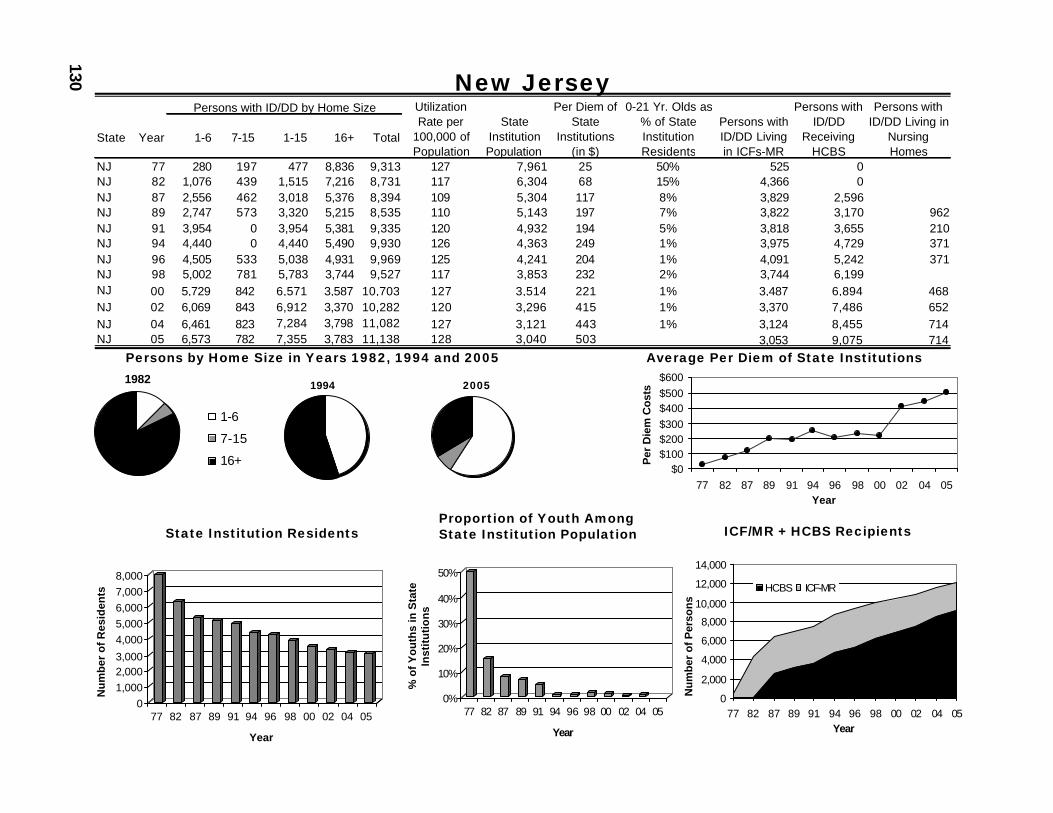
130 New Jersey
Average Per Diem of State Institutions
State Institution Residents ICF/MR + HCBS RecipientsProportion of Youth AmongState Institution Population
Persons by Home Size in Years 1982, 1994 and 2005
State Year 1-6 7-15 1-15 16+ Total
NJ 77 280 197 477 8,836 9,313 127 7,961 25 50% 525 0NJ 82 1,076 439 1,515 7,216 8,731 117 6,304 68 15% 4,366 0NJ 87 2,556 462 3,018 5,376 8,394 109 5,304 117 8% 3,829 2,596NJ 89 2,747 573 3,320 5,215 8,535 110 5,143 197 7% 3,822 3,170 962NJ 91 3,954 0 3,954 5,381 9,335 120 4,932 194 5% 3,818 3,655 210NJ 94 4,440 0 4,440 5,490 9,930 126 4,363 249 1% 3,975 4,729 371NJ 96 4,505 533 5,038 4,931 9,969 125 4,241 204 1% 4,091 5,242 371NJ 98 5,002 781 5,783 3,744 9,527 117 3,853 232 2% 3,744 6,199NJ 00 5,729 842 6,571 3,587 10,703 127 3,514 221 1% 3,487 6,894 468NJ 02 6,069 843 6,912 3,370 10,282 120 3,296 415 1% 3,370 7,486 652NJ 04 6,461 823 7,284 3,798 11,082 127 3,121 443 1% 3,124 8,455 714NJ 05 6,573 782 7,355 3,783 11,138 128 3,040 503 3,053 9,075 714
Persons with ID/DD by Home Size Utilization Rate per
100,000 of Population
Persons with ID/DD
Receiving HCBS
Persons with ID/DD Living in
Nursing Homes
State Institution Population
Per Diem of State
Institutions (in $)
0-21 Yr. Olds as % of State Institution Residents
Persons with ID/DD Living in ICFs-MR
20051982
1-6
7-15
16+
1994
$0$100$200$300$400$500$600
77 82 87 89 91 94 96 98 00 02 04 05Year
Per
Die
m C
osts
01,0002,0003,000
4,0005,0006,0007,0008,000
Nu
mb
er o
f R
esid
ents
77 82 87 89 91 94 96 98 00 02 04 05
Year
0%
10%
20%
30%
40%
50%
% o
f Y
ou
ths
in S
tate
In
stit
uti
on
s
77 82 87 89 91 94 96 98 00 02 04 05
Year
0
2,000
4,000
6,000
8,000
10,000
12,000
14,000
77 82 87 89 91 94 96 98 00 02 04 05Year
Nu
mb
er o
f P
erso
ns
HCBS ICF-MR
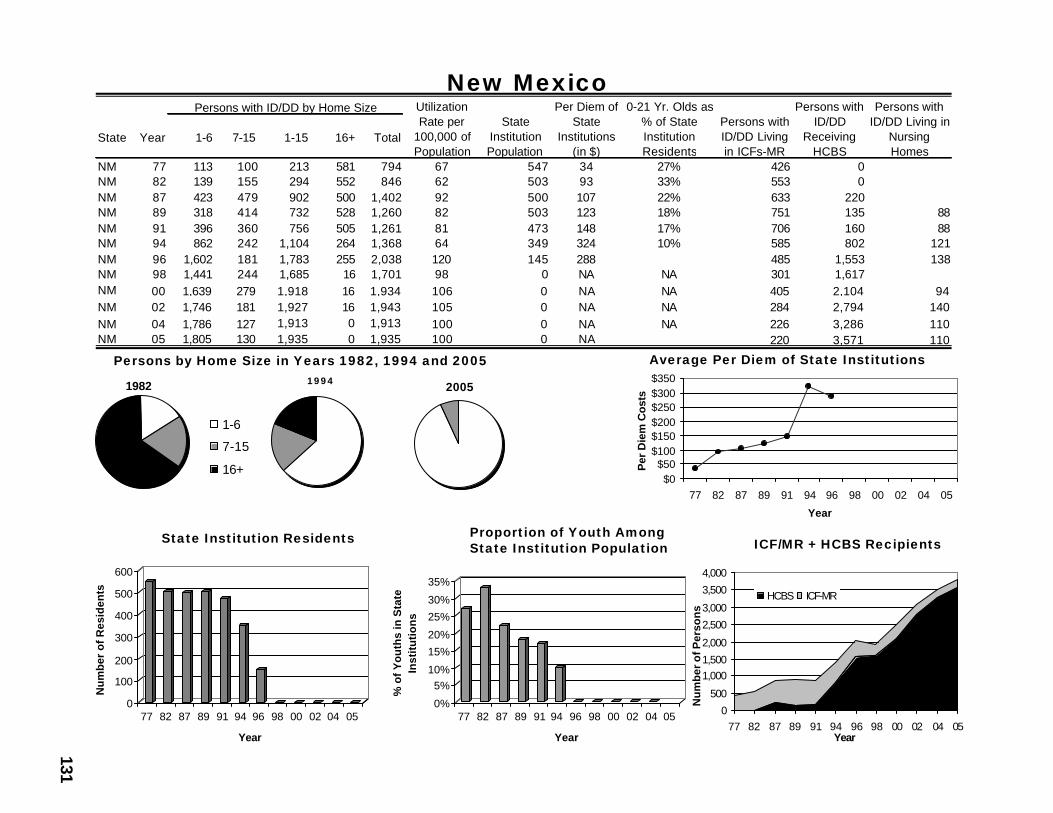
131
New Mexico
Average Per Diem of State Institutions
State Institution Residents ICF/MR + HCBS RecipientsProportion of Youth AmongState Institution Population
Persons by Home Size in Years 1982, 1994 and 2005
1982
1-6
7-15
16+
1 9 9 4 2005
$0$50
$100$150$200$250$300$350
77 82 87 89 91 94 96 98 00 02 04 05
Year
Per
Die
m C
osts
0
100
200
300
400
500
600
Nu
mb
er o
f R
esid
ents
77 82 87 89 91 94 96 98 00 02 04 05
Year
0%
5%10%
15%
20%
25%
30%
35%
% o
f Y
ou
ths
in S
tate
In
stit
uti
on
s
77 82 87 89 91 94 96 98 00 02 04 05
Year
0
500
1,0001,500
2,000
2,500
3,000
3,500
4,000
77 82 87 89 91 94 96 98 00 02 04 05Year
Nu
mb
er o
f Per
son
s
HCBS ICF-MR
State Year 1-6 7-15 1-15 16+ Total
NM 77 113 100 213 581 794 67 547 34 27% 426 0NM 82 139 155 294 552 846 62 503 93 33% 553 0NM 87 423 479 902 500 1,402 92 500 107 22% 633 220NM 89 318 414 732 528 1,260 82 503 123 18% 751 135 88NM 91 396 360 756 505 1,261 81 473 148 17% 706 160 88NM 94 862 242 1,104 264 1,368 64 349 324 10% 585 802 121NM 96 1,602 181 1,783 255 2,038 120 145 288 485 1,553 138NM 98 1,441 244 1,685 16 1,701 98 0 NA NA 301 1,617NM 00 1,639 279 1,918 16 1,934 106 0 NA NA 405 2,104 94NM 02 1,746 181 1,927 16 1,943 105 0 NA NA 284 2,794 140NM 04 1,786 127 1,913 0 1,913 100 0 NA NA 226 3,286 110NM 05 1,805 130 1,935 0 1,935 100 0 NA 220 3,571 110
Persons with ID/DD by Home Size Utilization Rate per
100,000 of Population
Persons with ID/DD
Receiving HCBS
Persons with ID/DD Living in
Nursing Homes
State Institution Population
Per Diem of State
Institutions (in $)
0-21 Yr. Olds as % of State Institution Residents
Persons with ID/DD Living in ICFs-MR
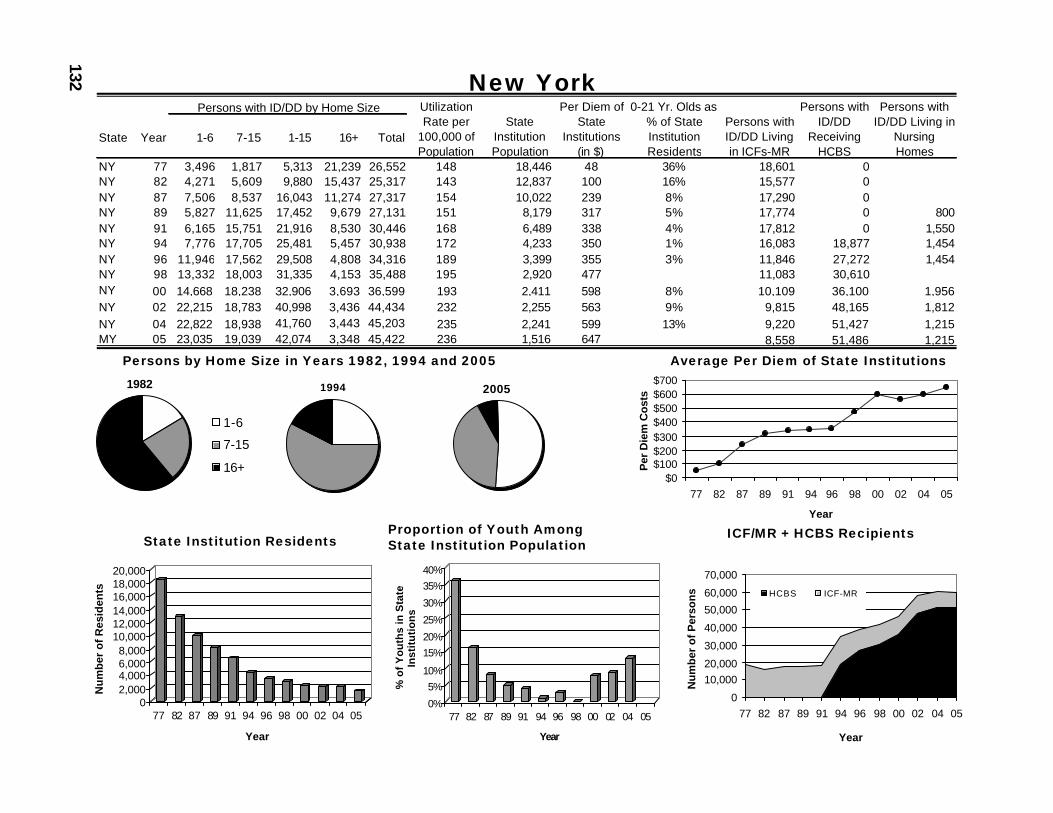
132 New York
Average Per Diem of State Institutions
State Institution Residents ICF/MR + HCBS RecipientsProportion of Youth AmongState Institution Population
Persons by Home Size in Years 1982, 1994 and 2005
State Year 1-6 7-15 1-15 16+ Total
NY 77 3,496 1,817 5,313 21,239 26,552 148 18,446 48 36% 18,601 0NY 82 4,271 5,609 9,880 15,437 25,317 143 12,837 100 16% 15,577 0NY 87 7,506 8,537 16,043 11,274 27,317 154 10,022 239 8% 17,290 0NY 89 5,827 11,625 17,452 9,679 27,131 151 8,179 317 5% 17,774 0 800NY 91 6,165 15,751 21,916 8,530 30,446 168 6,489 338 4% 17,812 0 1,550NY 94 7,776 17,705 25,481 5,457 30,938 172 4,233 350 1% 16,083 18,877 1,454NY 96 11,946 17,562 29,508 4,808 34,316 189 3,399 355 3% 11,846 27,272 1,454NY 98 13,332 18,003 31,335 4,153 35,488 195 2,920 477 11,083 30,610NY 00 14,668 18,238 32,906 3,693 36,599 193 2,411 598 8% 10,109 36,100 1,956NY 02 22,215 18,783 40,998 3,436 44,434 232 2,255 563 9% 9,815 48,165 1,812NY 04 22,822 18,938 41,760 3,443 45,203 235 2,241 599 13% 9,220 51,427 1,215MY 05 23,035 19,039 42,074 3,348 45,422 236 1,516 647 8,558 51,486 1,215
Persons with ID/DD by Home Size Utilization Rate per
100,000 of Population
Persons with ID/DD
Receiving HCBS
Persons with ID/DD Living in
Nursing Homes
State Institution Population
Per Diem of State
Institutions (in $)
0-21 Yr. Olds as % of State Institution Residents
Persons with ID/DD Living in ICFs-MR
20051982
1-6
7-15
16+
1994
$0$100$200$300$400$500$600$700
77 82 87 89 91 94 96 98 00 02 04 05
Year
Per
Die
m C
osts
02,0004,0006,0008,000
10,00012,00014,00016,00018,00020,000
Nu
mb
er o
f R
esid
ents
77 82 87 89 91 94 96 98 00 02 04 05
Year
0%
5%10%
15%20%
25%
30%
35%40%
% o
f Y
ou
ths
in S
tate
In
stit
uti
on
s
77 82 87 89 91 94 96 98 00 02 04 05
Year
0
10,00020,000
30,000
40,000
50,000
60,000
70,000
77 82 87 89 91 94 96 98 00 02 04 05
Year
Nu
mb
er o
f P
erso
ns HCBS ICF-MR
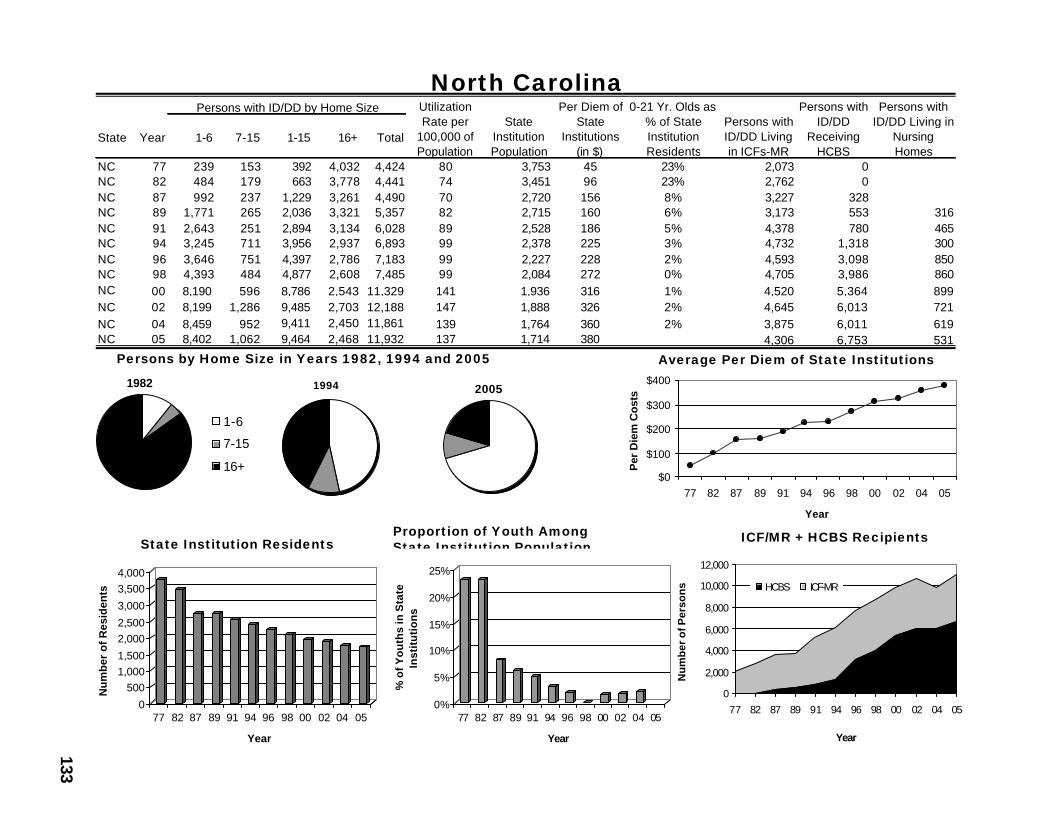
133
North Carolina
Average Per Diem of State Institutions
State Institution Residents ICF/MR + HCBS RecipientsProportion of Youth AmongState Institution Population
Persons by Home Size in Years 1982, 1994 and 2005
State Year 1-6 7-15 1-15 16+ Total
NC 77 239 153 392 4,032 4,424 80 3,753 45 23% 2,073 0NC 82 484 179 663 3,778 4,441 74 3,451 96 23% 2,762 0NC 87 992 237 1,229 3,261 4,490 70 2,720 156 8% 3,227 328NC 89 1,771 265 2,036 3,321 5,357 82 2,715 160 6% 3,173 553 316NC 91 2,643 251 2,894 3,134 6,028 89 2,528 186 5% 4,378 780 465NC 94 3,245 711 3,956 2,937 6,893 99 2,378 225 3% 4,732 1,318 300NC 96 3,646 751 4,397 2,786 7,183 99 2,227 228 2% 4,593 3,098 850NC 98 4,393 484 4,877 2,608 7,485 99 2,084 272 0% 4,705 3,986 860NC 00 8,190 596 8,786 2,543 11,329 141 1,936 316 1% 4,520 5,364 899NC 02 8,199 1,286 9,485 2,703 12,188 147 1,888 326 2% 4,645 6,013 721NC 04 8,459 952 9,411 2,450 11,861 139 1,764 360 2% 3,875 6,011 619NC 05 8,402 1,062 9,464 2,468 11,932 137 1,714 380 4,306 6,753 531
Persons with ID/DD by Home Size Utilization Rate per
100,000 of Population
Persons with ID/DD
Receiving HCBS
Persons with ID/DD Living in
Nursing Homes
State Institution Population
Per Diem of State
Institutions (in $)
0-21 Yr. Olds as % of State Institution Residents
Persons with ID/DD Living in ICFs-MR
20051982
1-6
7-15
16+
1994
$0
$100
$200
$300
$400
77 82 87 89 91 94 96 98 00 02 04 05
Year
Per
Die
m C
osts
0
5001,0001,500
2,0002,500
3,000
3,5004,000
Nu
mb
er o
f R
esid
ents
77 82 87 89 91 94 96 98 00 02 04 05
Year
0%
5%
10%
15%
20%
25%
% o
f Yo
uth
s in
Sta
te
Inst
itu
tio
ns
77 82 87 89 91 94 96 98 00 02 04 05
Year
0
2,000
4,000
6,000
8,000
10,000
12,000
77 82 87 89 91 94 96 98 00 02 04 05
Year
Nu
mb
er o
f Per
son
s HCBS ICF-MR
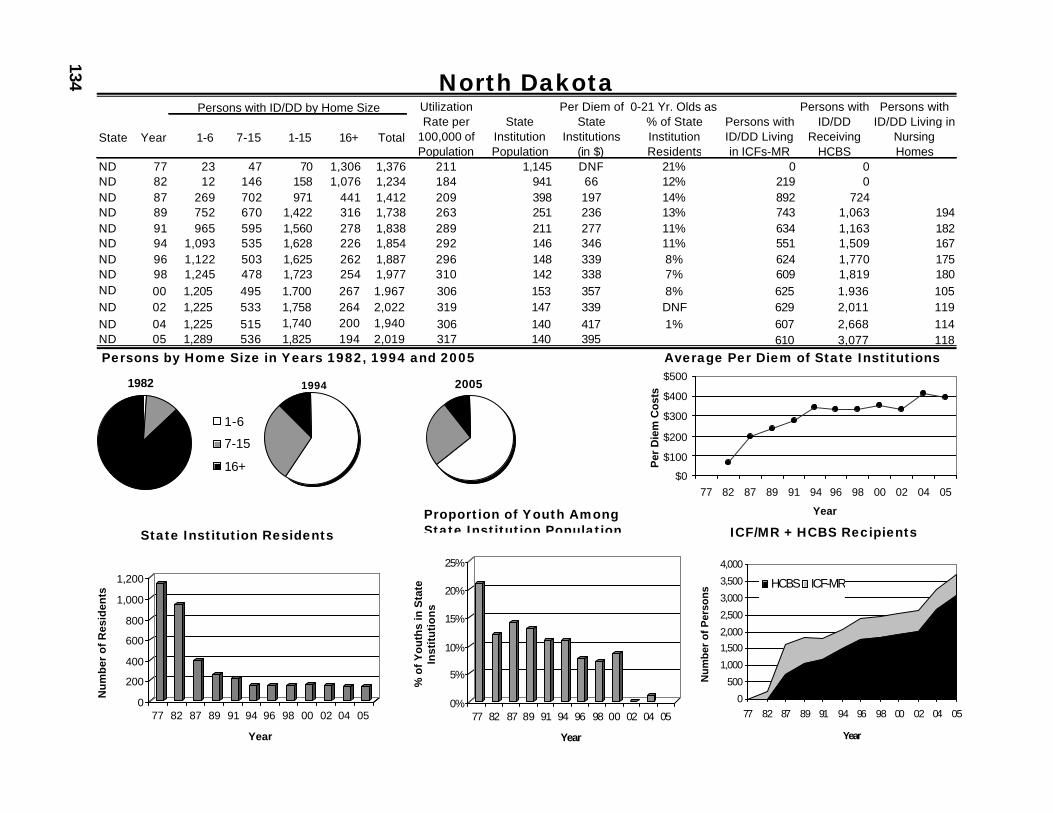
134 North Dakota
Average Per Diem of State Institutions
State Institution Residents ICF/MR + HCBS RecipientsProportion of Youth AmongState Institution Population
Persons by Home Size in Years 1982, 1994 and 2005
State Year 1-6 7-15 1-15 16+ Total
ND 77 23 47 70 1,306 1,376 211 1,145 DNF 21% 0 0ND 82 12 146 158 1,076 1,234 184 941 66 12% 219 0ND 87 269 702 971 441 1,412 209 398 197 14% 892 724ND 89 752 670 1,422 316 1,738 263 251 236 13% 743 1,063 194ND 91 965 595 1,560 278 1,838 289 211 277 11% 634 1,163 182ND 94 1,093 535 1,628 226 1,854 292 146 346 11% 551 1,509 167ND 96 1,122 503 1,625 262 1,887 296 148 339 8% 624 1,770 175ND 98 1,245 478 1,723 254 1,977 310 142 338 7% 609 1,819 180ND 00 1,205 495 1,700 267 1,967 306 153 357 8% 625 1,936 105ND 02 1,225 533 1,758 264 2,022 319 147 339 DNF 629 2,011 119ND 04 1,225 515 1,740 200 1,940 306 140 417 1% 607 2,668 114ND 05 1,289 536 1,825 194 2,019 317 140 395 610 3,077 118
Persons with ID/DD by Home Size Utilization Rate per
100,000 of Population
Persons with ID/DD
Receiving HCBS
Persons with ID/DD Living in
Nursing Homes
State Institution Population
Per Diem of State
Institutions (in $)
0-21 Yr. Olds as % of State Institution Residents
Persons with ID/DD Living in ICFs-MR
20051982
1-6
7-15
16+
1994
$0
$100
$200
$300
$400
$500
77 82 87 89 91 94 96 98 00 02 04 05
Year
Per
Die
m C
osts
0
200
400
600
800
1,000
1,200
Nu
mb
er o
f R
esid
ents
77 82 87 89 91 94 96 98 00 02 04 05
Year
0%
5%
10%
15%
20%
25%
% o
f Y
ou
ths
in S
tate
In
stit
uti
on
s
77 82 87 89 91 94 96 98 00 02 04 05
Year
0
500
1,000
1,500
2,000
2,500
3,000
3,500
4,000
77 82 87 89 91 94 96 98 00 02 04 05
Year
Num
ber
of P
erso
ns
HCBS ICF-MR
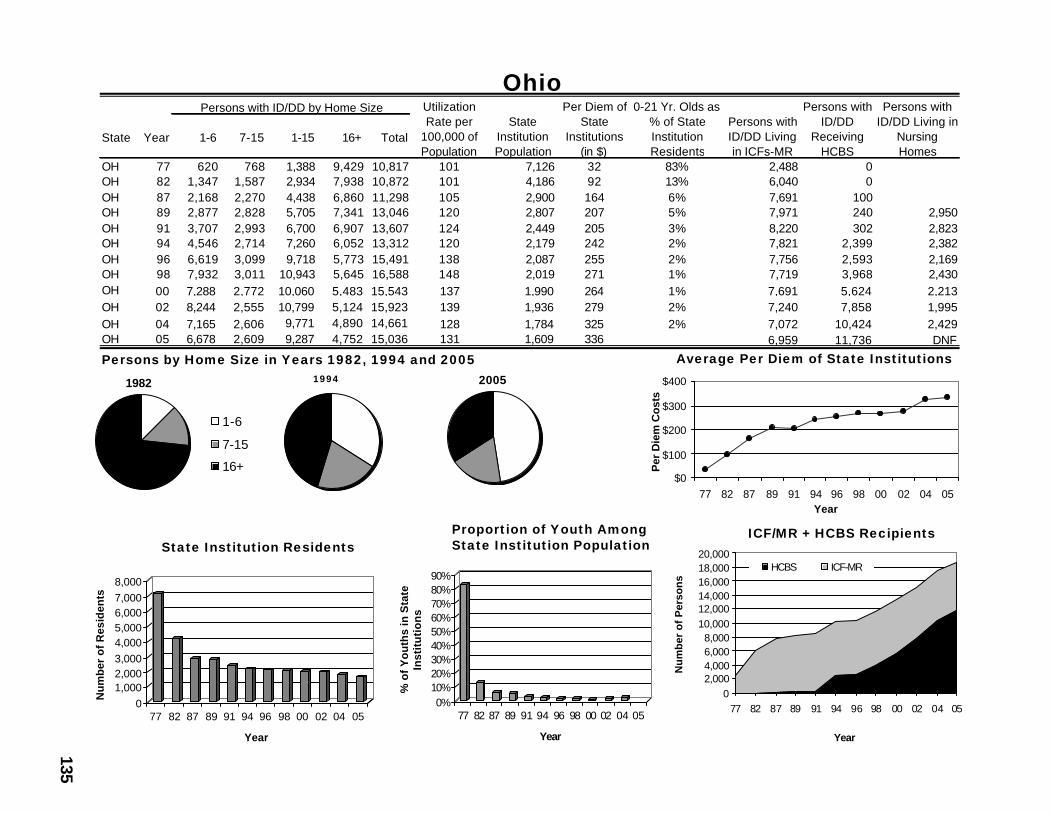
135
Ohio
Average Per Diem of State Institutions
State Institution ResidentsICF/MR + HCBS RecipientsProportion of Youth Among
State Institution Population
Persons by Home Size in Years 1982, 1994 and 2005
State Year 1-6 7-15 1-15 16+ Total
OH 77 620 768 1,388 9,429 10,817 101 7,126 32 83% 2,488 0OH 82 1,347 1,587 2,934 7,938 10,872 101 4,186 92 13% 6,040 0OH 87 2,168 2,270 4,438 6,860 11,298 105 2,900 164 6% 7,691 100OH 89 2,877 2,828 5,705 7,341 13,046 120 2,807 207 5% 7,971 240 2,950OH 91 3,707 2,993 6,700 6,907 13,607 124 2,449 205 3% 8,220 302 2,823OH 94 4,546 2,714 7,260 6,052 13,312 120 2,179 242 2% 7,821 2,399 2,382OH 96 6,619 3,099 9,718 5,773 15,491 138 2,087 255 2% 7,756 2,593 2,169OH 98 7,932 3,011 10,943 5,645 16,588 148 2,019 271 1% 7,719 3,968 2,430OH 00 7,288 2,772 10,060 5,483 15,543 137 1,990 264 1% 7,691 5,624 2,213OH 02 8,244 2,555 10,799 5,124 15,923 139 1,936 279 2% 7,240 7,858 1,995OH 04 7,165 2,606 9,771 4,890 14,661 128 1,784 325 2% 7,072 10,424 2,429OH 05 6,678 2,609 9,287 4,752 15,036 131 1,609 336 6,959 11,736 DNF
Persons with ID/DD by Home Size Utilization Rate per
100,000 of Population
Persons with ID/DD
Receiving HCBS
Persons with ID/DD Living in
Nursing Homes
State Institution Population
Per Diem of State
Institutions (in $)
0-21 Yr. Olds as % of State Institution Residents
Persons with ID/DD Living in ICFs-MR
20051982
1-6
7-15
16+
1994
$0
$100
$200
$300
$400
77 82 87 89 91 94 96 98 00 02 04 05Year
Per
Die
m C
osts
01,0002,0003,0004,0005,0006,0007,0008,000
Nu
mb
er o
f R
esid
ents
77 82 87 89 91 94 96 98 00 02 04 05
Year
0%10%20%30%40%50%60%70%80%90%
% o
f Y
ou
ths
in S
tate
In
stit
uti
on
s
77 82 87 89 91 94 96 98 00 02 04 05
Year
02,0004,0006,0008,000
10,00012,00014,00016,00018,00020,000
77 82 87 89 91 94 96 98 00 02 04 05
Year
Nu
mb
er o
f P
erso
ns
HCBS ICF-MR
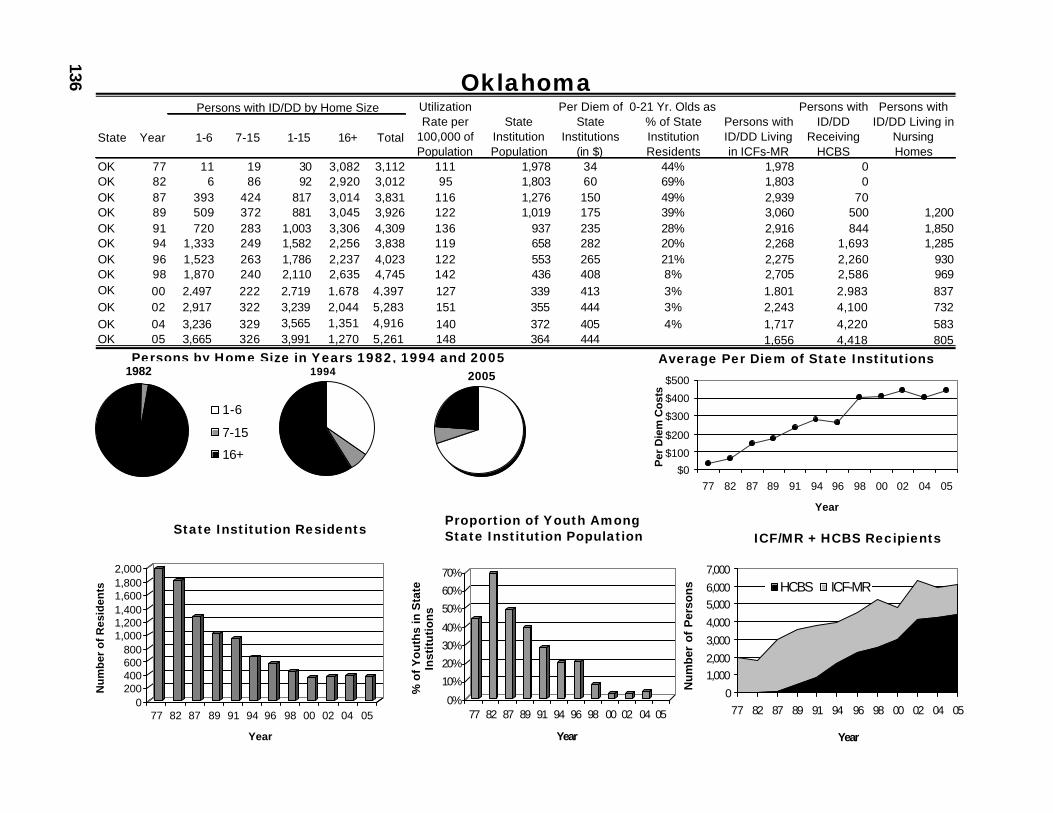
136 Oklahoma
Average Per Diem of State Institutions
State Institution Residents ICF/MR + HCBS RecipientsProportion of Youth AmongState Institution Population
Persons by Home Size in Years 1982, 1994 and 2005
State Year 1-6 7-15 1-15 16+ Total
OK 77 11 19 30 3,082 3,112 111 1,978 34 44% 1,978 0OK 82 6 86 92 2,920 3,012 95 1,803 60 69% 1,803 0OK 87 393 424 817 3,014 3,831 116 1,276 150 49% 2,939 70OK 89 509 372 881 3,045 3,926 122 1,019 175 39% 3,060 500 1,200OK 91 720 283 1,003 3,306 4,309 136 937 235 28% 2,916 844 1,850OK 94 1,333 249 1,582 2,256 3,838 119 658 282 20% 2,268 1,693 1,285OK 96 1,523 263 1,786 2,237 4,023 122 553 265 21% 2,275 2,260 930OK 98 1,870 240 2,110 2,635 4,745 142 436 408 8% 2,705 2,586 969OK 00 2,497 222 2,719 1,678 4,397 127 339 413 3% 1,801 2,983 837OK 02 2,917 322 3,239 2,044 5,283 151 355 444 3% 2,243 4,100 732OK 04 3,236 329 3,565 1,351 4,916 140 372 405 4% 1,717 4,220 583OK 05 3,665 326 3,991 1,270 5,261 148 364 444 1,656 4,418 805
Persons with ID/DD by Home Size Utilization Rate per
100,000 of Population
Persons with ID/DD
Receiving HCBS
Persons with ID/DD Living in
Nursing Homes
State Institution Population
Per Diem of State
Institutions (in $)
0-21 Yr. Olds as % of State Institution Residents
Persons with ID/DD Living in ICFs-MR
20051982
1-6
7-15
16+
1994
$0
$100
$200
$300
$400
$500
77 82 87 89 91 94 96 98 00 02 04 05
Year
Per
Die
m C
osts
0200400600800
1,0001,2001,4001,6001,8002,000
Nu
mb
er o
f R
esid
ents
77 82 87 89 91 94 96 98 00 02 04 05
Year
0%
10%
20%
30%
40%
50%
60%
70%
% o
f Y
ou
ths
in S
tate
In
stit
uti
on
s
77 82 87 89 91 94 96 98 00 02 04 05
Year
0
1,0002,000
3,000
4,000
5,0006,000
7,000
77 82 87 89 91 94 96 98 00 02 04 05
Year
Nu
mb
er o
f P
erso
ns HCBS ICF-MR
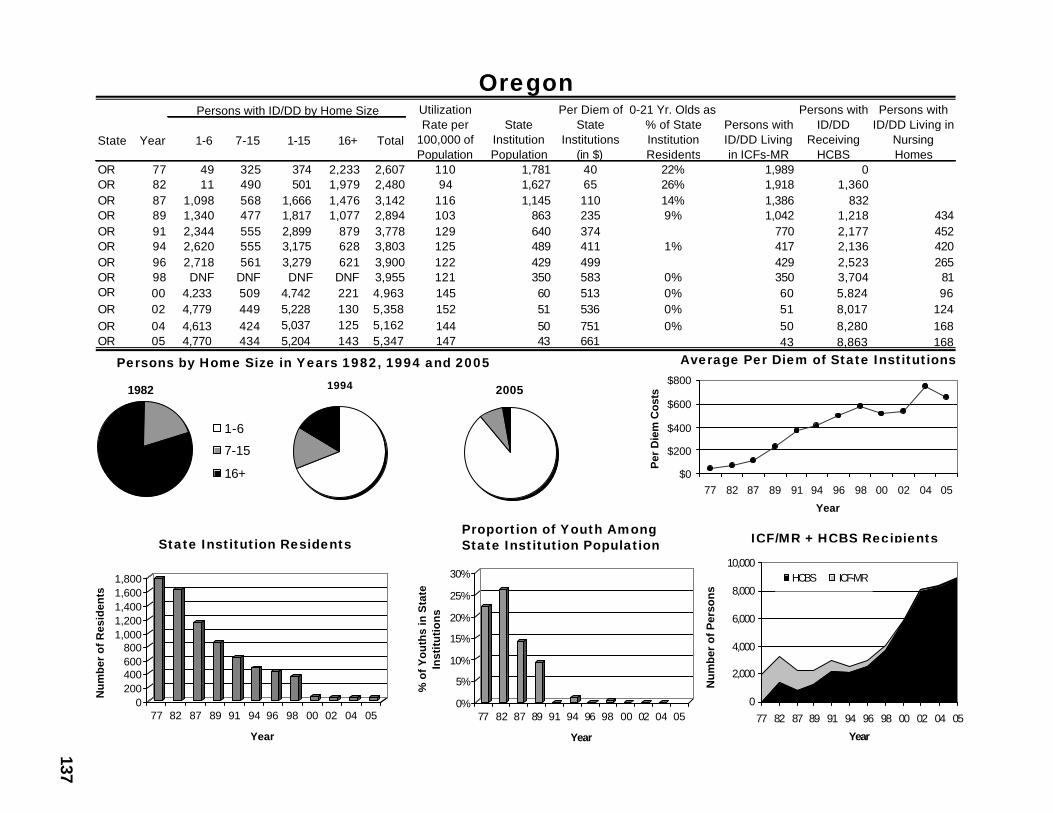
137
Oregon
Average Per Diem of State Institutions
State Institution Residents ICF/MR + HCBS RecipientsProportion of Youth AmongState Institution Population
Persons by Home Size in Years 1982, 1994 and 2005
20051982
1-6
7-15
16+
1994
$0
$200
$400
$600
$800
77 82 87 89 91 94 96 98 00 02 04 05
Year
Per
Die
m C
osts
0200400600800
1,0001,2001,4001,6001,800
Nu
mb
er o
f R
esid
ents
77 82 87 89 91 94 96 98 00 02 04 05
Year
0%
5%
10%
15%
20%
25%
30%
% o
f Y
ou
ths
in S
tate
In
stit
uti
on
s
77 82 87 89 91 94 96 98 00 02 04 05
Year
0
2,000
4,000
6,000
8,000
10,000
77 82 87 89 91 94 96 98 00 02 04 05
Year
Nu
mb
er o
f Per
son
s
HCBS ICF-MR
State Year 1-6 7-15 1-15 16+ Total
OR 77 49 325 374 2,233 2,607 110 1,781 40 22% 1,989 0OR 82 11 490 501 1,979 2,480 94 1,627 65 26% 1,918 1,360OR 87 1,098 568 1,666 1,476 3,142 116 1,145 110 14% 1,386 832OR 89 1,340 477 1,817 1,077 2,894 103 863 235 9% 1,042 1,218 434OR 91 2,344 555 2,899 879 3,778 129 640 374 770 2,177 452OR 94 2,620 555 3,175 628 3,803 125 489 411 1% 417 2,136 420OR 96 2,718 561 3,279 621 3,900 122 429 499 429 2,523 265OR 98 DNF DNF DNF DNF 3,955 121 350 583 0% 350 3,704 81OR 00 4,233 509 4,742 221 4,963 145 60 513 0% 60 5,824 96OR 02 4,779 449 5,228 130 5,358 152 51 536 0% 51 8,017 124OR 04 4,613 424 5,037 125 5,162 144 50 751 0% 50 8,280 168OR 05 4,770 434 5,204 143 5,347 147 43 661 43 8,863 168
Persons with ID/DD by Home Size Utilization Rate per
100,000 of Population
Persons with ID/DD
Receiving HCBS
Persons with ID/DD Living in
Nursing Homes
State Institution Population
Per Diem of State
Institutions (in $)
0-21 Yr. Olds as % of State Institution Residents
Persons with ID/DD Living in ICFs-MR
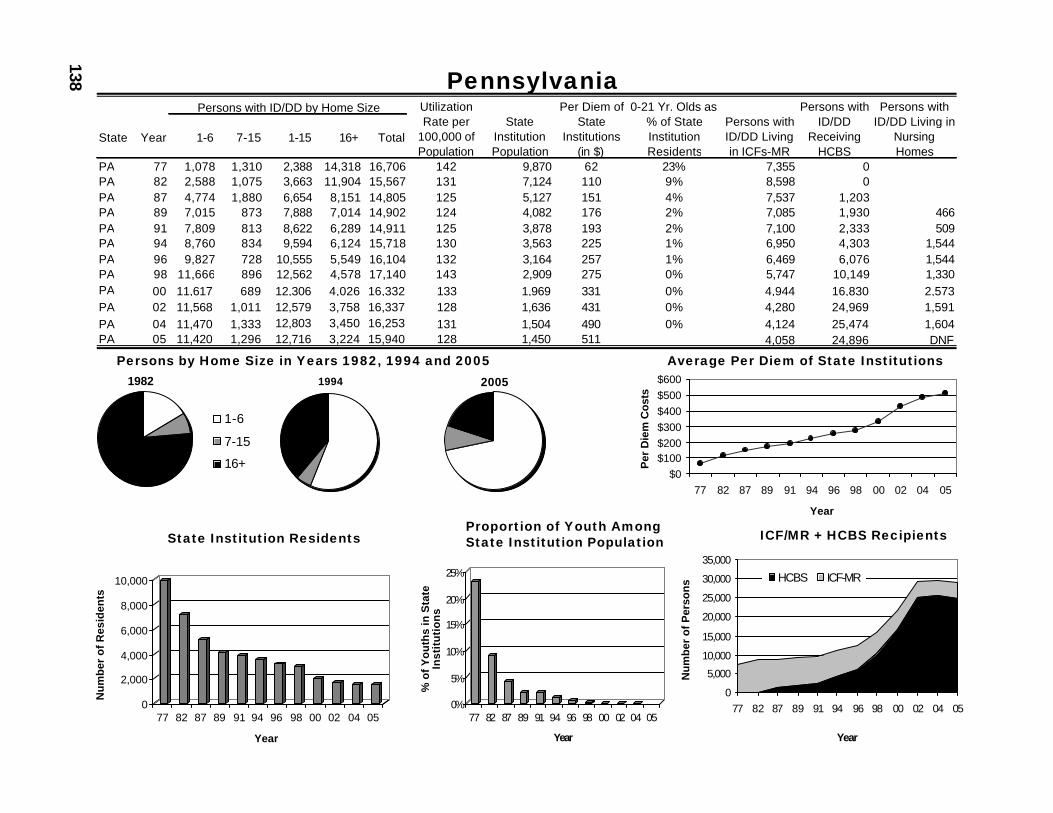
138 Pennsylvania
Average Per Diem of State Institutions
State Institution Residents ICF/MR + HCBS RecipientsProportion of Youth AmongState Institution Population
Persons by Home Size in Years 1982, 1994 and 200520051982
1-6
7-15
16+
1994
$0$100$200$300$400$500$600
77 82 87 89 91 94 96 98 00 02 04 05
Year
Per
Die
m C
osts
0
2,000
4,000
6,000
8,000
10,000
Nu
mb
er o
f R
esid
ents
77 82 87 89 91 94 96 98 00 02 04 05
Year
0%
5%
10%
15%
20%
25%
% o
f Y
ou
ths
in S
tate
In
stit
uti
on
s
77 82 87 89 91 94 96 98 00 02 04 05
Year
0
5,000
10,000
15,000
20,000
25,000
30,000
35,000
77 82 87 89 91 94 96 98 00 02 04 05
Year
Nu
mb
er o
f P
erso
ns HCBS ICF-MR
State Year 1-6 7-15 1-15 16+ Total
PA 77 1,078 1,310 2,388 14,318 16,706 142 9,870 62 23% 7,355 0PA 82 2,588 1,075 3,663 11,904 15,567 131 7,124 110 9% 8,598 0PA 87 4,774 1,880 6,654 8,151 14,805 125 5,127 151 4% 7,537 1,203PA 89 7,015 873 7,888 7,014 14,902 124 4,082 176 2% 7,085 1,930 466PA 91 7,809 813 8,622 6,289 14,911 125 3,878 193 2% 7,100 2,333 509PA 94 8,760 834 9,594 6,124 15,718 130 3,563 225 1% 6,950 4,303 1,544PA 96 9,827 728 10,555 5,549 16,104 132 3,164 257 1% 6,469 6,076 1,544PA 98 11,666 896 12,562 4,578 17,140 143 2,909 275 0% 5,747 10,149 1,330PA 00 11,617 689 12,306 4,026 16,332 133 1,969 331 0% 4,944 16,830 2,573PA 02 11,568 1,011 12,579 3,758 16,337 128 1,636 431 0% 4,280 24,969 1,591PA 04 11,470 1,333 12,803 3,450 16,253 131 1,504 490 0% 4,124 25,474 1,604PA 05 11,420 1,296 12,716 3,224 15,940 128 1,450 511 4,058 24,896 DNF
Persons with ID/DD by Home Size Utilization Rate per
100,000 of Population
Persons with ID/DD
Receiving HCBS
Persons with ID/DD Living in
Nursing Homes
State Institution Population
Per Diem of State
Institutions (in $)
0-21 Yr. Olds as % of State Institution Residents
Persons with ID/DD Living in ICFs-MR
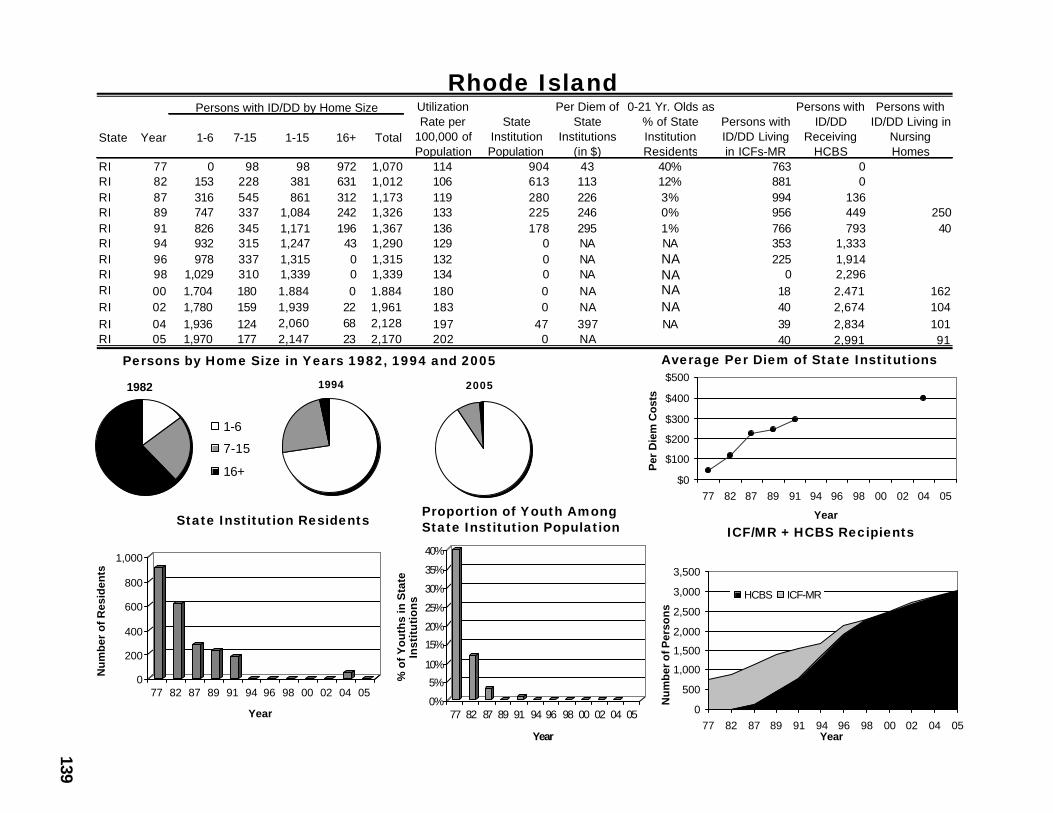
139
Rhode Island
Average Per Diem of State Institutions
State Institution ResidentsICF/MR + HCBS Recipients
Proportion of Youth AmongState Institution Population
Persons by Home Size in Years 1982, 1994 and 2005
State Year 1-6 7-15 1-15 16+ Total
RI 77 0 98 98 972 1,070 114 904 43 40% 763 0RI 82 153 228 381 631 1,012 106 613 113 12% 881 0RI 87 316 545 861 312 1,173 119 280 226 3% 994 136RI 89 747 337 1,084 242 1,326 133 225 246 0% 956 449 250RI 91 826 345 1,171 196 1,367 136 178 295 1% 766 793 40RI 94 932 315 1,247 43 1,290 129 0 NA NA 353 1,333RI 96 978 337 1,315 0 1,315 132 0 NA NA 225 1,914RI 98 1,029 310 1,339 0 1,339 134 0 NA NA 0 2,296RI 00 1,704 180 1,884 0 1,884 180 0 NA NA 18 2,471 162RI 02 1,780 159 1,939 22 1,961 183 0 NA NA 40 2,674 104RI 04 1,936 124 2,060 68 2,128 197 47 397 NA 39 2,834 101RI 05 1,970 177 2,147 23 2,170 202 0 NA 40 2,991 91
Persons with ID/DD by Home Size Utilization Rate per
100,000 of Population
Persons with ID/DD
Receiving HCBS
Persons with ID/DD Living in
Nursing Homes
State Institution Population
Per Diem of State
Institutions (in $)
0-21 Yr. Olds as % of State Institution Residents
Persons with ID/DD Living in ICFs-MR
20051982
1-6
7-15
16+
1994
$0
$100
$200
$300
$400
$500
77 82 87 89 91 94 96 98 00 02 04 05
Year
Per
Die
m C
osts
0
200
400
600
800
1,000
Nu
mb
er o
f R
esid
ents
77 82 87 89 91 94 96 98 00 02 04 05
Year0%
5%
10%
15%
20%
25%
30%
35%
40%
% o
f Y
ou
ths
in S
tate
In
stit
uti
on
s
77 82 87 89 91 94 96 98 00 02 04 05
Year
0
500
1,000
1,500
2,000
2,500
3,000
3,500
77 82 87 89 91 94 96 98 00 02 04 05Year
Nu
mb
er o
f Per
son
s
HCBS ICF-MR
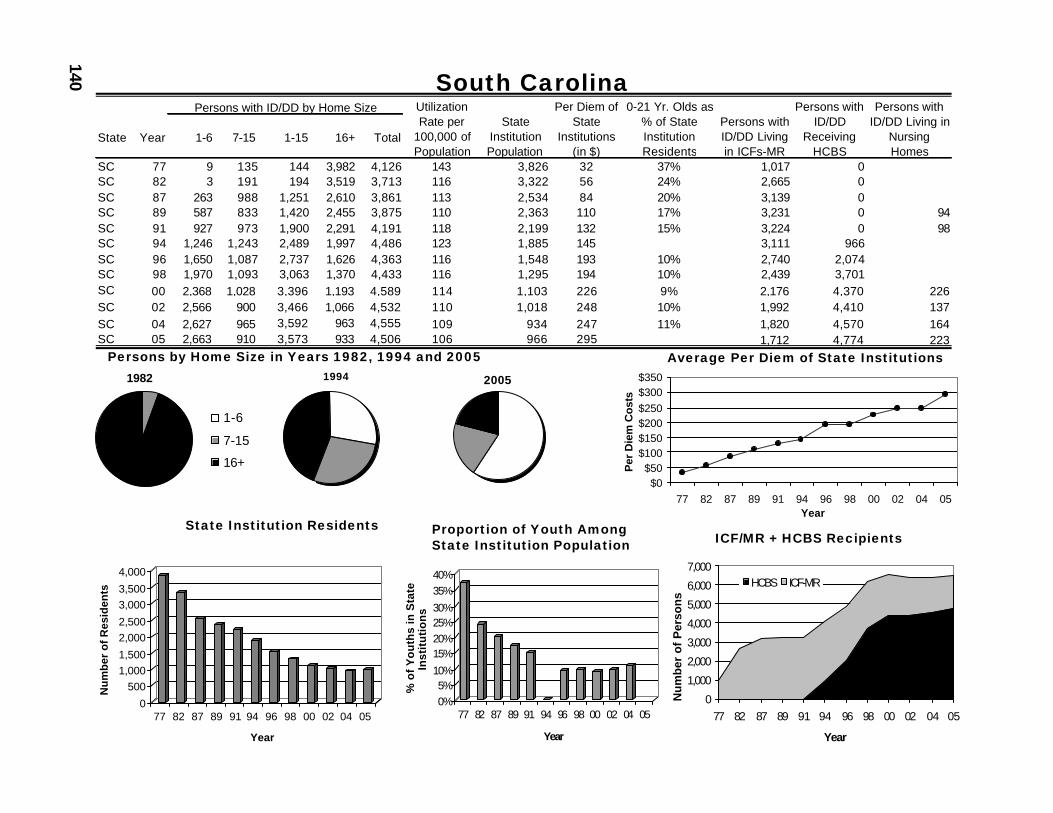
140 South Carolina
Average Per Diem of State Institutions
State Institution ResidentsICF/MR + HCBS RecipientsProportion of Youth Among
State Institution Population
Persons by Home Size in Years 1982, 1994 and 2005
State Year 1-6 7-15 1-15 16+ Total
SC 77 9 135 144 3,982 4,126 143 3,826 32 37% 1,017 0SC 82 3 191 194 3,519 3,713 116 3,322 56 24% 2,665 0SC 87 263 988 1,251 2,610 3,861 113 2,534 84 20% 3,139 0SC 89 587 833 1,420 2,455 3,875 110 2,363 110 17% 3,231 0 94SC 91 927 973 1,900 2,291 4,191 118 2,199 132 15% 3,224 0 98SC 94 1,246 1,243 2,489 1,997 4,486 123 1,885 145 3,111 966SC 96 1,650 1,087 2,737 1,626 4,363 116 1,548 193 10% 2,740 2,074SC 98 1,970 1,093 3,063 1,370 4,433 116 1,295 194 10% 2,439 3,701SC 00 2,368 1,028 3,396 1,193 4,589 114 1,103 226 9% 2,176 4,370 226SC 02 2,566 900 3,466 1,066 4,532 110 1,018 248 10% 1,992 4,410 137SC 04 2,627 965 3,592 963 4,555 109 934 247 11% 1,820 4,570 164SC 05 2,663 910 3,573 933 4,506 106 966 295 1,712 4,774 223
Persons with ID/DD by Home Size Utilization Rate per
100,000 of Population
Persons with ID/DD
Receiving HCBS
Persons with ID/DD Living in
Nursing Homes
State Institution Population
Per Diem of State
Institutions (in $)
0-21 Yr. Olds as % of State Institution Residents
Persons with ID/DD Living in ICFs-MR
20051982
1-6
7-15
16+
1994
$0$50
$100$150$200$250$300$350
77 82 87 89 91 94 96 98 00 02 04 05Year
Per
Die
m C
osts
0
5001,0001,500
2,0002,500
3,0003,500
4,000
Nu
mb
er o
f R
esid
ents
77 82 87 89 91 94 96 98 00 02 04 05
Year
0%5%
10%
15%20%25%30%
35%40%
% o
f Y
ou
ths
in S
tate
In
stit
uti
on
s
77 82 87 89 91 94 96 98 00 02 04 05
Year
0
1,000
2,000
3,000
4,000
5,000
6,000
7,000
77 82 87 89 91 94 96 98 00 02 04 05
Year
Nu
mb
er o
f P
erso
ns
HCBS ICF-MR
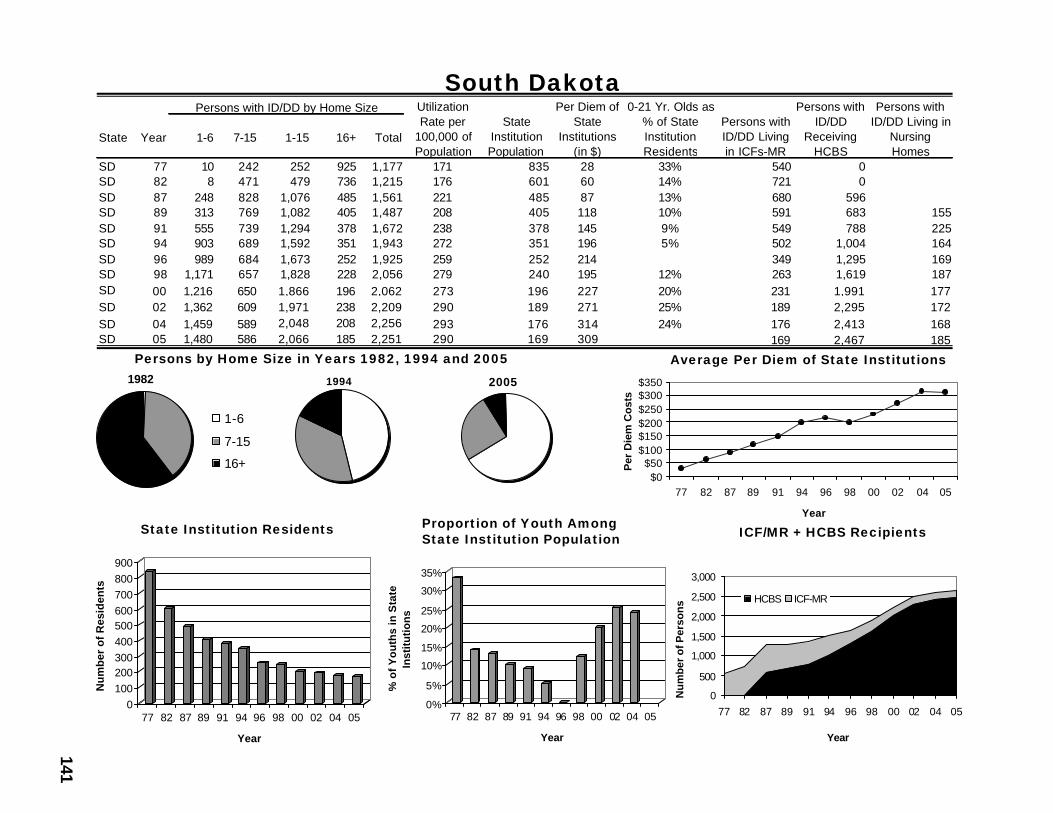
141
South Dakota
Average Per Diem of State Institutions
State Institution Residents ICF/MR + HCBS RecipientsProportion of Youth AmongState Institution Population
Persons by Home Size in Years 1982, 1994 and 2005
State Year 1-6 7-15 1-15 16+ Total
SD 77 10 242 252 925 1,177 171 835 28 33% 540 0SD 82 8 471 479 736 1,215 176 601 60 14% 721 0SD 87 248 828 1,076 485 1,561 221 485 87 13% 680 596SD 89 313 769 1,082 405 1,487 208 405 118 10% 591 683 155SD 91 555 739 1,294 378 1,672 238 378 145 9% 549 788 225SD 94 903 689 1,592 351 1,943 272 351 196 5% 502 1,004 164SD 96 989 684 1,673 252 1,925 259 252 214 349 1,295 169SD 98 1,171 657 1,828 228 2,056 279 240 195 12% 263 1,619 187SD 00 1,216 650 1,866 196 2,062 273 196 227 20% 231 1,991 177SD 02 1,362 609 1,971 238 2,209 290 189 271 25% 189 2,295 172SD 04 1,459 589 2,048 208 2,256 293 176 314 24% 176 2,413 168SD 05 1,480 586 2,066 185 2,251 290 169 309 169 2,467 185
Persons with ID/DD by Home Size Utilization Rate per
100,000 of Population
Persons with ID/DD
Receiving HCBS
Persons with ID/DD Living in
Nursing Homes
State Institution Population
Per Diem of State
Institutions (in $)
0-21 Yr. Olds as % of State Institution Residents
Persons with ID/DD Living in ICFs-MR
20051982
1-6
7-15
16+
1994
$0$50
$100$150$200$250$300$350
77 82 87 89 91 94 96 98 00 02 04 05
Year
Per
Die
m C
ost
s
0100200300400500600700800900
Nu
mb
er o
f R
esid
ents
77 82 87 89 91 94 96 98 00 02 04 05
Year
0%
5%
10%
15%
20%
25%
30%
35%
% o
f Y
ou
ths
in S
tate
In
stit
uti
on
s
77 82 87 89 91 94 96 98 00 02 04 05
Year
0
500
1,000
1,500
2,000
2,500
3,000
77 82 87 89 91 94 96 98 00 02 04 05
Year
Nu
mb
er o
f Per
son
s HCBS ICF-MR
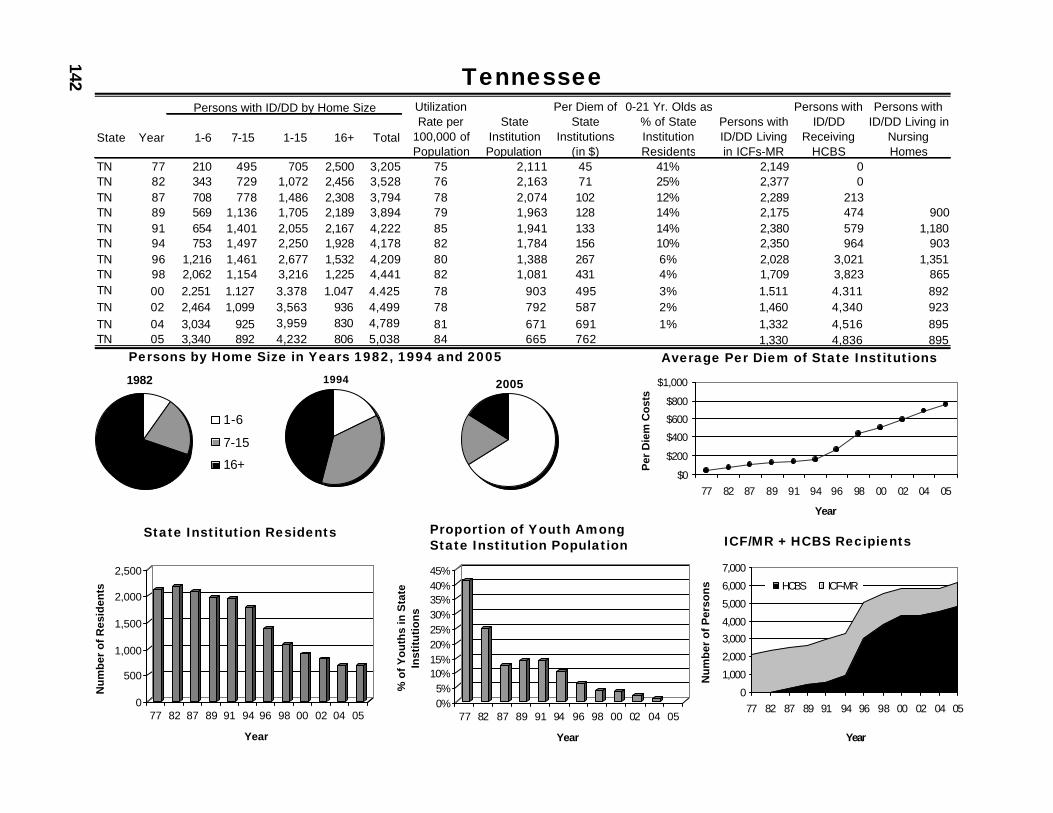
142 Tennessee
Average Per Diem of State Institutions
State Institution Residents ICF/MR + HCBS RecipientsProportion of Youth AmongState Institution Population
Persons by Home Size in Years 1982, 1994 and 2005
State Year 1-6 7-15 1-15 16+ Total
TN 77 210 495 705 2,500 3,205 75 2,111 45 41% 2,149 0TN 82 343 729 1,072 2,456 3,528 76 2,163 71 25% 2,377 0TN 87 708 778 1,486 2,308 3,794 78 2,074 102 12% 2,289 213TN 89 569 1,136 1,705 2,189 3,894 79 1,963 128 14% 2,175 474 900TN 91 654 1,401 2,055 2,167 4,222 85 1,941 133 14% 2,380 579 1,180TN 94 753 1,497 2,250 1,928 4,178 82 1,784 156 10% 2,350 964 903TN 96 1,216 1,461 2,677 1,532 4,209 80 1,388 267 6% 2,028 3,021 1,351TN 98 2,062 1,154 3,216 1,225 4,441 82 1,081 431 4% 1,709 3,823 865TN 00 2,251 1,127 3,378 1,047 4,425 78 903 495 3% 1,511 4,311 892TN 02 2,464 1,099 3,563 936 4,499 78 792 587 2% 1,460 4,340 923TN 04 3,034 925 3,959 830 4,789 81 671 691 1% 1,332 4,516 895TN 05 3,340 892 4,232 806 5,038 84 665 762 1,330 4,836 895
Persons with ID/DD by Home Size Utilization Rate per
100,000 of Population
Persons with ID/DD
Receiving HCBS
Persons with ID/DD Living in
Nursing Homes
State Institution Population
Per Diem of State
Institutions (in $)
0-21 Yr. Olds as % of State Institution Residents
Persons with ID/DD Living in ICFs-MR
20051982
1-6
7-15
16+
1994
$0
$200
$400
$600
$800
$1,000
77 82 87 89 91 94 96 98 00 02 04 05
Year
Per
Die
m C
ost
s
0
500
1,000
1,500
2,000
2,500
Nu
mb
er o
f R
esid
ents
77 82 87 89 91 94 96 98 00 02 04 05
Year
0%5%
10%15%20%25%30%35%40%45%
% o
f Y
ou
ths
in S
tate
In
stit
uti
on
s
77 82 87 89 91 94 96 98 00 02 04 05
Year
0
1,000
2,000
3,000
4,000
5,000
6,000
7,000
77 82 87 89 91 94 96 98 00 02 04 05
Year
Nu
mb
er o
f P
erso
ns HCBS ICF-MR
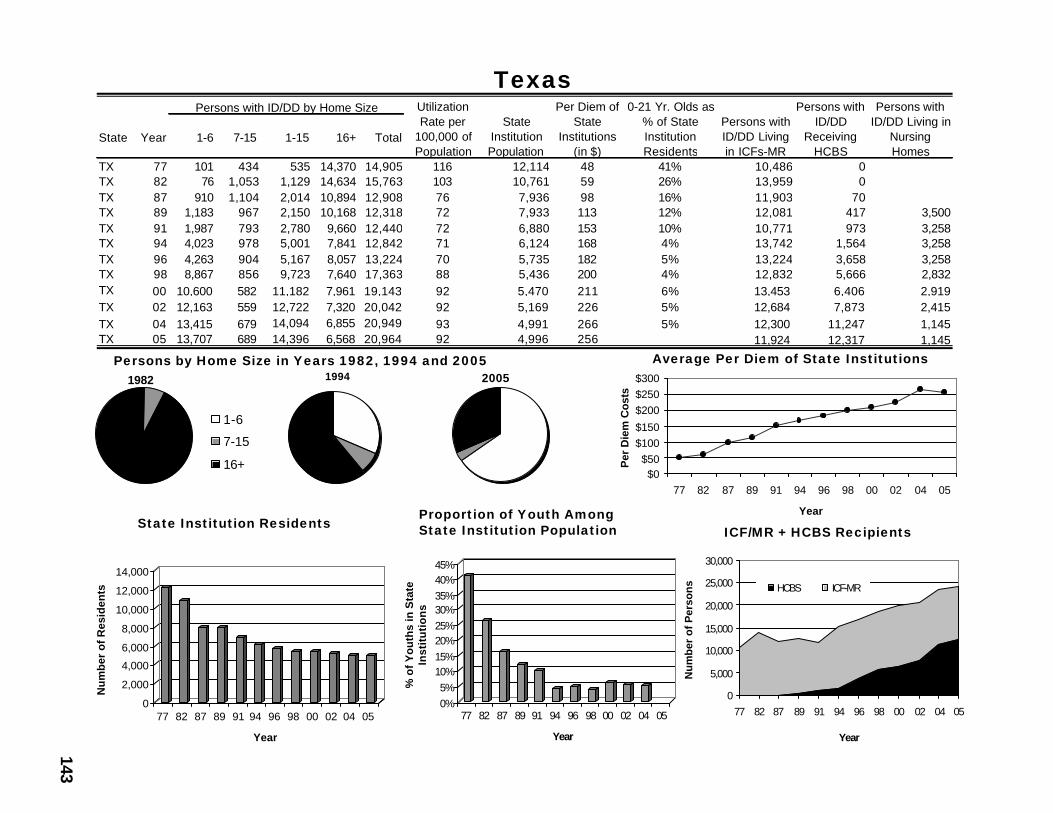
143
Texas
Average Per Diem of State Institutions
State Institution Residents ICF/MR + HCBS RecipientsProportion of Youth AmongState Institution Population
Persons by Home Size in Years 1982, 1994 and 2005
State Year 1-6 7-15 1-15 16+ Total
TX 77 101 434 535 14,370 14,905 116 12,114 48 41% 10,486 0TX 82 76 1,053 1,129 14,634 15,763 103 10,761 59 26% 13,959 0TX 87 910 1,104 2,014 10,894 12,908 76 7,936 98 16% 11,903 70TX 89 1,183 967 2,150 10,168 12,318 72 7,933 113 12% 12,081 417 3,500TX 91 1,987 793 2,780 9,660 12,440 72 6,880 153 10% 10,771 973 3,258TX 94 4,023 978 5,001 7,841 12,842 71 6,124 168 4% 13,742 1,564 3,258TX 96 4,263 904 5,167 8,057 13,224 70 5,735 182 5% 13,224 3,658 3,258TX 98 8,867 856 9,723 7,640 17,363 88 5,436 200 4% 12,832 5,666 2,832TX 00 10,600 582 11,182 7,961 19,143 92 5,470 211 6% 13,453 6,406 2,919TX 02 12,163 559 12,722 7,320 20,042 92 5,169 226 5% 12,684 7,873 2,415TX 04 13,415 679 14,094 6,855 20,949 93 4,991 266 5% 12,300 11,247 1,145TX 05 13,707 689 14,396 6,568 20,964 92 4,996 256 11,924 12,317 1,145
Persons with ID/DD by Home Size Utilization Rate per
100,000 of Population
Persons with ID/DD
Receiving HCBS
Persons with ID/DD Living in
Nursing Homes
State Institution Population
Per Diem of State
Institutions (in $)
0-21 Yr. Olds as % of State Institution Residents
Persons with ID/DD Living in ICFs-MR
20051982
1-6
7-15
16+
1994
$0$50
$100$150
$200$250$300
77 82 87 89 91 94 96 98 00 02 04 05
Year
Per
Die
m C
osts
0
2,000
4,000
6,000
8,000
10,000
12,000
14,000
Nu
mb
er o
f R
esid
ents
77 82 87 89 91 94 96 98 00 02 04 05
Year
0%5%
10%15%20%25%30%35%40%45%
% o
f Y
ou
ths
in S
tate
In
stit
uti
on
s
77 82 87 89 91 94 96 98 00 02 04 05
Year
0
5,000
10,000
15,000
20,000
25,000
30,000
77 82 87 89 91 94 96 98 00 02 04 05
Year
Nu
mb
er o
f P
erso
ns HCBS ICF-MR

144 Utah
Average Per Diem of State Institutions
State Institution ResidentsICF/MR + HCBS RecipientsProportion of Youth Among
State Institution Population
Persons by Home Size in Years 1982, 1994 and 2005
State Year 1-6 7-15 1-15 16+ Total
UT 77 68 95 163 1,217 1,380 113 849 33 45% 1,193 0UT 82 50 145 195 1,155 1,350 111 742 68 33% 1,199 0UT 87 349 211 560 1,135 1,695 100 554 120 22% 1,151 0UT 89 325 568 893 962 1,855 109 470 136 20% 1,005 1,124 360UT 91 782 340 1,122 948 2,070 117 423 174 14% 960 1,234 283UT 94 939 312 1,251 912 2,163 116 362 180 8% 924 1,590 241UT 96 1,241 276 1,517 854 2,371 119 311 230 5% 866 2,128 241UT 98 1,515 50 1,565 799 2,364 113 262 257 5% 811 2,647 191UT 00 1,613 160 1,773 748 2,521 113 236 300 2% 758 3,152 203UT 02 1,598 209 1,807 771 2,578 111 234 380 2% 783 3,589 265UT 04 1,800 196 1,996 752 2,748 115 230 396 2% 778 3,757 250UT 05 1,986 160 2,146 754 2,900 117 230 350 794 3,832 248
Persons with ID/DD by Home Size Utilization Rate per
100,000 of Population
Persons with ID/DD
Receiving HCBS
Persons with ID/DD Living in
Nursing Homes
State Institution Population
Per Diem of State
Institutions (in $)
0-21 Yr. Olds as % of State Institution Residents
Persons with ID/DD Living in ICFs-MR
20051982
1-6
7-15
16+
1994
$0
$100
$200
$300
$400
$500
77 82 87 89 91 94 96 98 00 02 04 05Year
Per
Die
m C
osts
0100200300400500600700800900
Nu
mb
er o
f R
esid
ents
77 82 87 89 91 94 96 98 00 02 04 05
Year
0%5%
10%15%
20%
25%30%
35%
40%45%
% o
f Y
ou
ths
in S
tate
In
stit
uti
on
s
77 82 87 89 91 94 96 98 00 02 04 05
Year
0500
1,0001,5002,0002,5003,0003,5004,0004,5005,000
77 82 87 89 91 94 96 98 00 02 04 05
Year
Nu
mb
er o
f Per
son
s HCBS ICF-MR
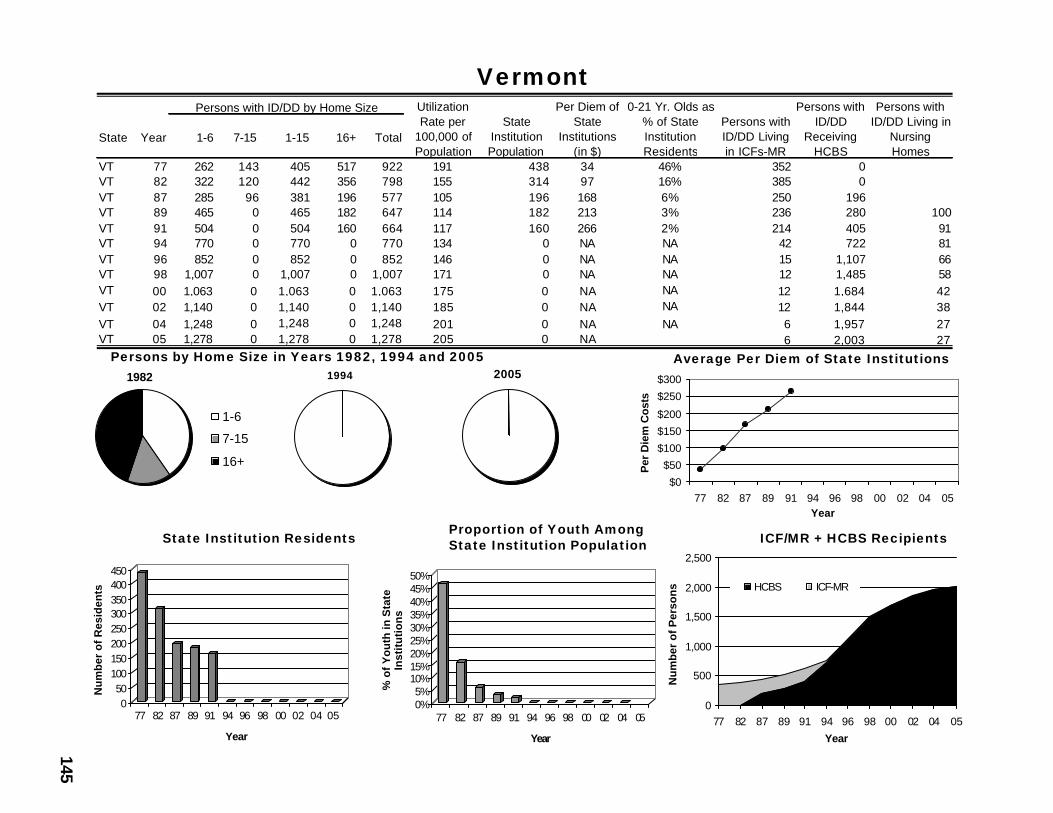
145
Vermont
Average Per Diem of State Institutions
State Institution Residents ICF/MR + HCBS RecipientsProportion of Youth AmongState Institution Population
Persons by Home Size in Years 1982, 1994 and 2005
State Year 1-6 7-15 1-15 16+ Total
VT 77 262 143 405 517 922 191 438 34 46% 352 0VT 82 322 120 442 356 798 155 314 97 16% 385 0VT 87 285 96 381 196 577 105 196 168 6% 250 196VT 89 465 0 465 182 647 114 182 213 3% 236 280 100VT 91 504 0 504 160 664 117 160 266 2% 214 405 91VT 94 770 0 770 0 770 134 0 NA NA 42 722 81VT 96 852 0 852 0 852 146 0 NA NA 15 1,107 66VT 98 1,007 0 1,007 0 1,007 171 0 NA NA 12 1,485 58VT 00 1,063 0 1,063 0 1,063 175 0 NA NA 12 1,684 42VT 02 1,140 0 1,140 0 1,140 185 0 NA NA 12 1,844 38VT 04 1,248 0 1,248 0 1,248 201 0 NA NA 6 1,957 27VT 05 1,278 0 1,278 0 1,278 205 0 NA 6 2,003 27
Persons with ID/DD by Home Size Utilization Rate per
100,000 of Population
Persons with ID/DD
Receiving HCBS
Persons with ID/DD Living in
Nursing Homes
State Institution Population
Per Diem of State
Institutions (in $)
0-21 Yr. Olds as % of State Institution Residents
Persons with ID/DD Living in ICFs-MR
20051982
1-6
7-15
16+
1994
$0
$50
$100
$150
$200
$250
$300
77 82 87 89 91 94 96 98 00 02 04 05Year
Per
Die
m C
osts
050
100150200250300350400450
Nu
mb
er o
f R
esid
ents
77 82 87 89 91 94 96 98 00 02 04 05
Year
0%5%
10%15%20%25%30%35%40%45%50%
% o
f Y
ou
th in
Sta
te
Inst
itu
tio
ns
77 82 87 89 91 94 96 98 00 02 04 05
Year
0
500
1,000
1,500
2,000
2,500
77 82 87 89 91 94 96 98 00 02 04 05
Year
Nu
mb
er o
f P
erso
ns HCBS ICF-MR
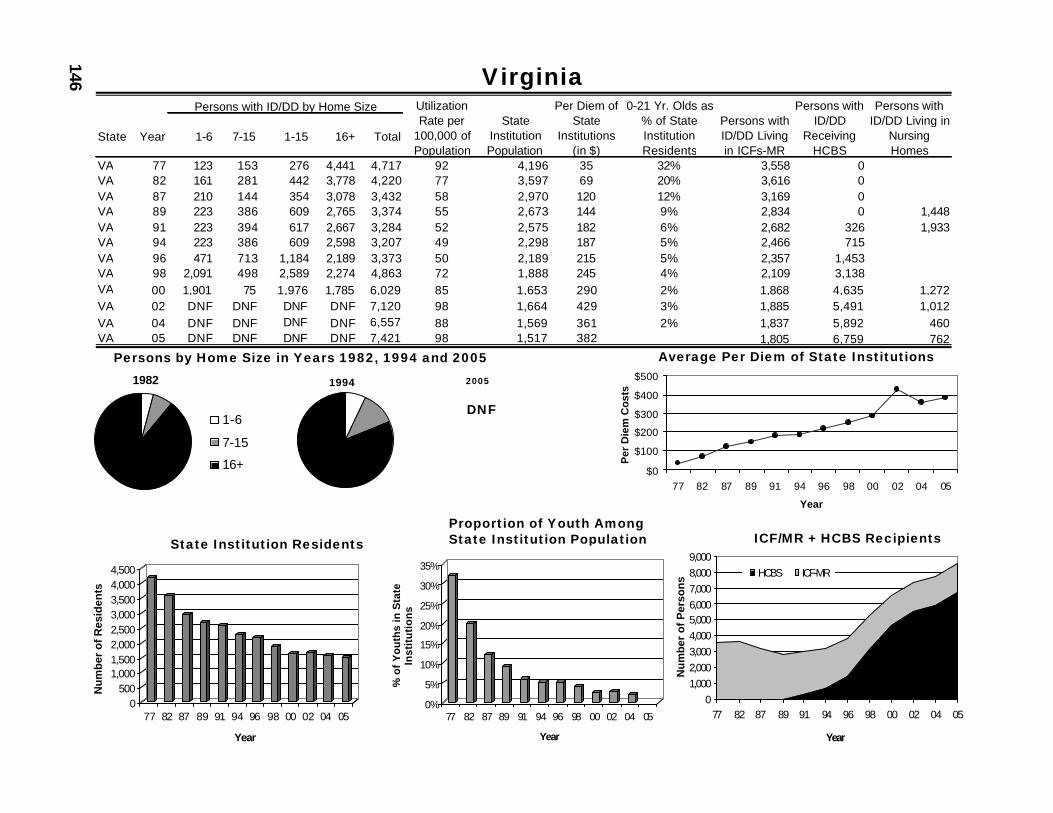
146 Virginia
Average Per Diem of State Institutions
State Institution Residents ICF/MR + HCBS RecipientsProportion of Youth AmongState Institution Population
Persons by Home Size in Years 1982, 1994 and 2005
State Year 1-6 7-15 1-15 16+ Total
VA 77 123 153 276 4,441 4,717 92 4,196 35 32% 3,558 0VA 82 161 281 442 3,778 4,220 77 3,597 69 20% 3,616 0VA 87 210 144 354 3,078 3,432 58 2,970 120 12% 3,169 0VA 89 223 386 609 2,765 3,374 55 2,673 144 9% 2,834 0 1,448VA 91 223 394 617 2,667 3,284 52 2,575 182 6% 2,682 326 1,933VA 94 223 386 609 2,598 3,207 49 2,298 187 5% 2,466 715VA 96 471 713 1,184 2,189 3,373 50 2,189 215 5% 2,357 1,453VA 98 2,091 498 2,589 2,274 4,863 72 1,888 245 4% 2,109 3,138VA 00 1,901 75 1,976 1,785 6,029 85 1,653 290 2% 1,868 4,635 1,272VA 02 DNF DNF DNF DNF 7,120 98 1,664 429 3% 1,885 5,491 1,012VA 04 DNF DNF DNF DNF 6,557 88 1,569 361 2% 1,837 5,892 460VA 05 DNF DNF DNF DNF 7,421 98 1,517 382 1,805 6,759 762
Persons with ID/DD by Home Size Utilization Rate per
100,000 of Population
Persons with ID/DD
Receiving HCBS
Persons with ID/DD Living in
Nursing Homes
State Institution Population
Per Diem of State
Institutions (in $)
0-21 Yr. Olds as % of State Institution Residents
Persons with ID/DD Living in ICFs-MR
1982
1-6
7-15
16+
1994 2005
DNF
$0
$100
$200
$300
$400
$500
77 82 87 89 91 94 96 98 00 02 04 05
Year
Per
Die
m C
ost
s
0500
1,0001,5002,0002,5003,0003,5004,0004,500
Nu
mb
er o
f R
esid
ents
77 82 87 89 91 94 96 98 00 02 04 05
Year
0%
5%
10%
15%
20%
25%
30%
35%
% o
f Y
ou
ths
in S
tate
In
stit
uti
on
s
77 82 87 89 91 94 96 98 00 02 04 05
Year
01,0002,0003,0004,0005,0006,0007,0008,0009,000
77 82 87 89 91 94 96 98 00 02 04 05
Year
Nu
mb
er o
f P
erso
ns HCBS ICF-MR
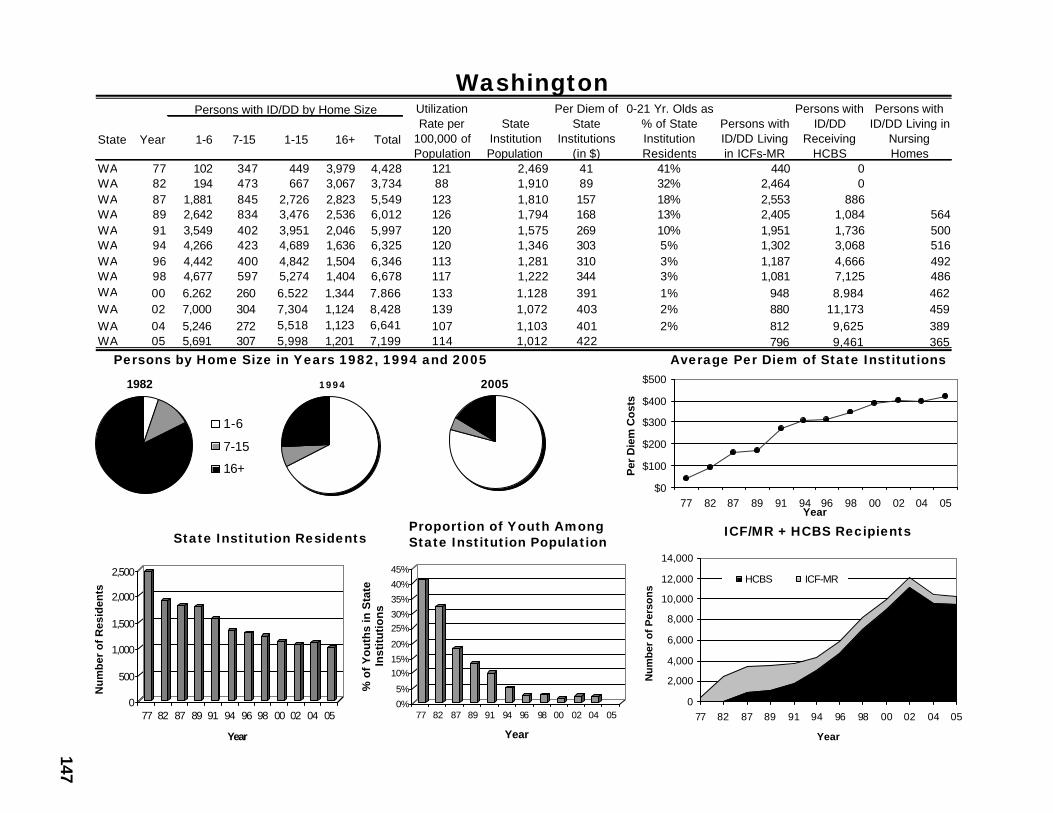
147
Washington
Average Per Diem of State Institutions
State Institution Residents ICF/MR + HCBS RecipientsProportion of Youth AmongState Institution Population
Persons by Home Size in Years 1982, 1994 and 2005
State Year 1-6 7-15 1-15 16+ Total
WA 77 102 347 449 3,979 4,428 121 2,469 41 41% 440 0WA 82 194 473 667 3,067 3,734 88 1,910 89 32% 2,464 0WA 87 1,881 845 2,726 2,823 5,549 123 1,810 157 18% 2,553 886WA 89 2,642 834 3,476 2,536 6,012 126 1,794 168 13% 2,405 1,084 564WA 91 3,549 402 3,951 2,046 5,997 120 1,575 269 10% 1,951 1,736 500WA 94 4,266 423 4,689 1,636 6,325 120 1,346 303 5% 1,302 3,068 516WA 96 4,442 400 4,842 1,504 6,346 113 1,281 310 3% 1,187 4,666 492WA 98 4,677 597 5,274 1,404 6,678 117 1,222 344 3% 1,081 7,125 486WA 00 6,262 260 6,522 1,344 7,866 133 1,128 391 1% 948 8,984 462WA 02 7,000 304 7,304 1,124 8,428 139 1,072 403 2% 880 11,173 459WA 04 5,246 272 5,518 1,123 6,641 107 1,103 401 2% 812 9,625 389WA 05 5,691 307 5,998 1,201 7,199 114 1,012 422 796 9,461 365
Persons with ID/DD by Home Size Utilization Rate per
100,000 of Population
Persons with ID/DD
Receiving HCBS
Persons with ID/DD Living in
Nursing Homes
State Institution Population
Per Diem of State
Institutions (in $)
0-21 Yr. Olds as % of State Institution Residents
Persons with ID/DD Living in ICFs-MR
20051982
1-6
7-15
16+
1 9 9 4
$0
$100
$200
$300
$400
$500
77 82 87 89 91 94 96 98 00 02 04 05Year
Per
Die
m C
ost
s
0
500
1,000
1,500
2,000
2,500
Nu
mb
er o
f R
esid
ents
77 82 87 89 91 94 96 98 00 02 04 05
Year
0%
5%
10%15%
20%
25%30%
35%
40%
45%
% o
f Y
ou
ths
in S
tate
In
stit
uti
on
s
77 82 87 89 91 94 96 98 00 02 04 05
Year
0
2,000
4,000
6,000
8,000
10,000
12,000
14,000
77 82 87 89 91 94 96 98 00 02 04 05
Year
Nu
mb
er o
f P
erso
ns
HCBS ICF-MR
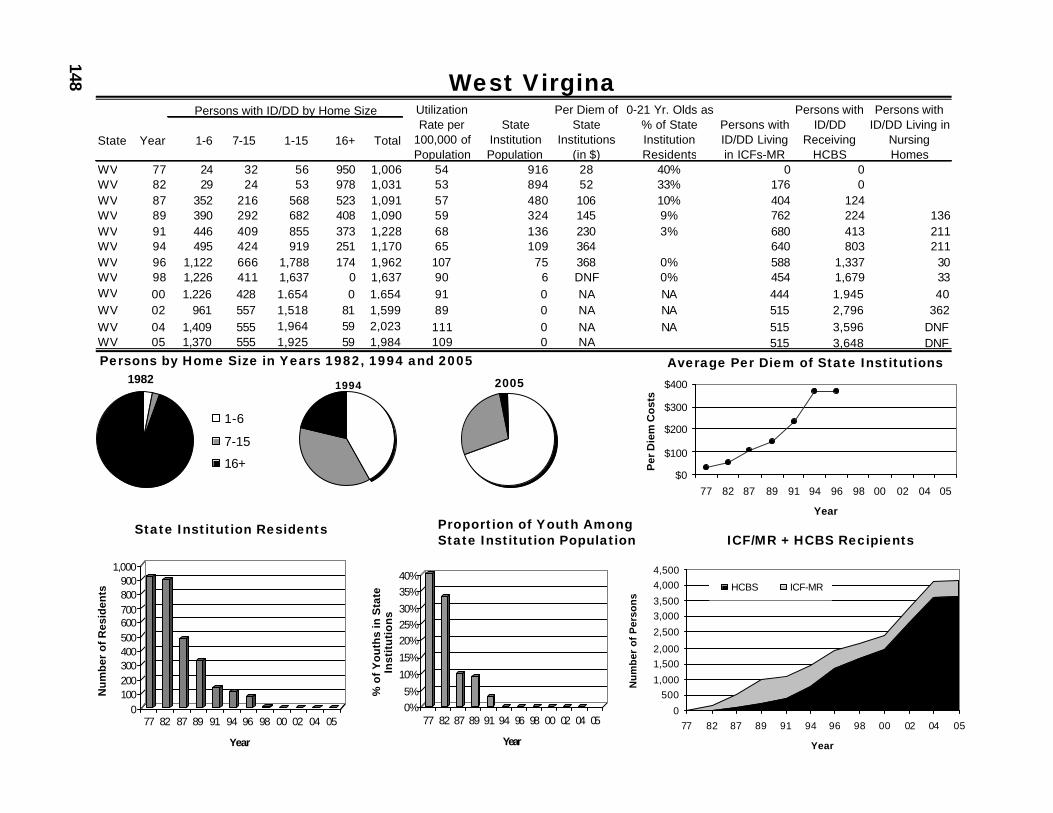
148 West Virgina
Average Per Diem of State Institutions
State Institution ResidentsICF/MR + HCBS Recipients
Proportion of Youth AmongState Institution Population
Persons by Home Size in Years 1982, 1994 and 2005
State Year 1-6 7-15 1-15 16+ Total
WV 77 24 32 56 950 1,006 54 916 28 40% 0 0WV 82 29 24 53 978 1,031 53 894 52 33% 176 0WV 87 352 216 568 523 1,091 57 480 106 10% 404 124WV 89 390 292 682 408 1,090 59 324 145 9% 762 224 136WV 91 446 409 855 373 1,228 68 136 230 3% 680 413 211WV 94 495 424 919 251 1,170 65 109 364 640 803 211WV 96 1,122 666 1,788 174 1,962 107 75 368 0% 588 1,337 30WV 98 1,226 411 1,637 0 1,637 90 6 DNF 0% 454 1,679 33WV 00 1,226 428 1,654 0 1,654 91 0 NA NA 444 1,945 40WV 02 961 557 1,518 81 1,599 89 0 NA NA 515 2,796 362WV 04 1,409 555 1,964 59 2,023 111 0 NA NA 515 3,596 DNFWV 05 1,370 555 1,925 59 1,984 109 0 NA 515 3,648 DNF
Persons with ID/DD by Home Size Utilization Rate per
100,000 of Population
Persons with ID/DD
Receiving HCBS
Persons with ID/DD Living in
Nursing Homes
State Institution Population
Per Diem of State
Institutions (in $)
0-21 Yr. Olds as % of State Institution Residents
Persons with ID/DD Living in ICFs-MR
20051982
1-6
7-15
16+
1994
$0
$100
$200
$300
$400
77 82 87 89 91 94 96 98 00 02 04 05
Year
Per
Die
m C
ost
s
0100200300400500600700800900
1,000
Nu
mb
er o
f R
esid
ents
77 82 87 89 91 94 96 98 00 02 04 05
Year
0%5%
10%
15%
20%25%30%
35%40%
% o
f Y
ou
ths
in S
tate
In
stit
uti
on
s
77 82 87 89 91 94 96 98 00 02 04 05
Year
0
5001,000
1,5002,000
2,500
3,0003,500
4,0004,500
77 82 87 89 91 94 96 98 00 02 04 05
Year
Nu
mb
er o
f P
erso
ns
HCBS ICF-MR
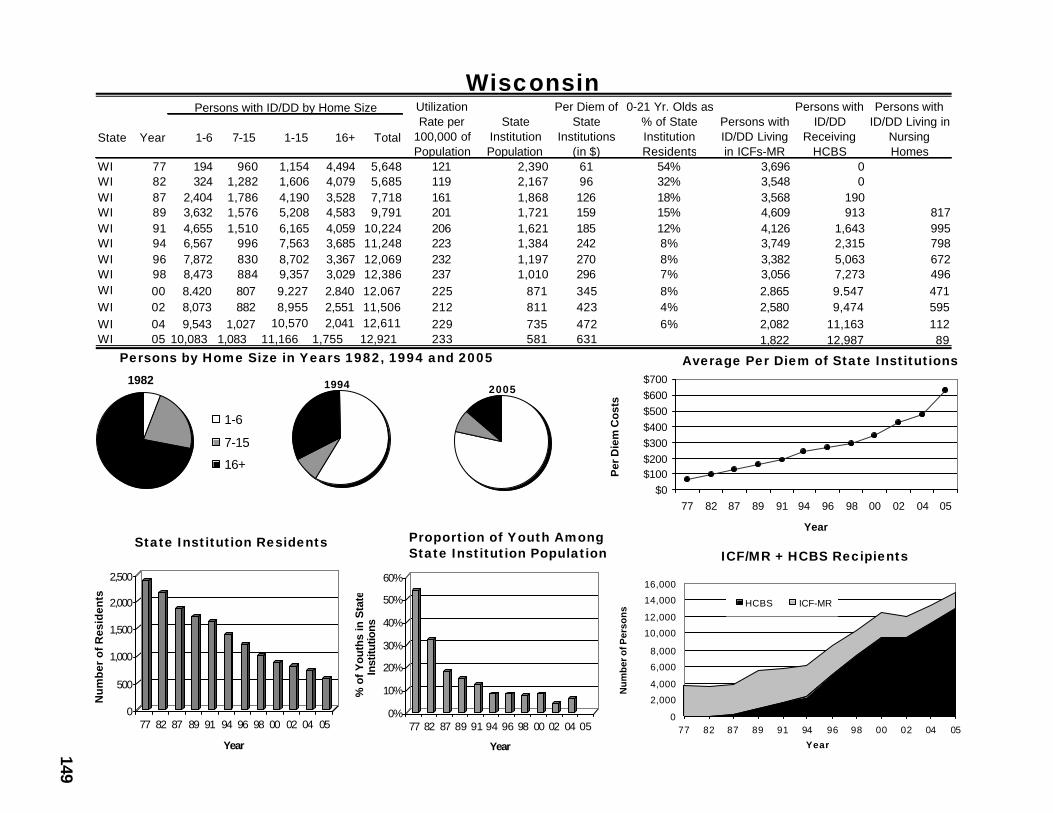
149
Wisconsin
Average Per Diem of State Institutions
State Institution ResidentsICF/MR + HCBS Recipients
Proportion of Youth AmongState Institution Population
Persons by Home Size in Years 1982, 1994 and 2005
State Year 1-6 7-15 1-15 16+ Total
WI 77 194 960 1,154 4,494 5,648 121 2,390 61 54% 3,696 0WI 82 324 1,282 1,606 4,079 5,685 119 2,167 96 32% 3,548 0WI 87 2,404 1,786 4,190 3,528 7,718 161 1,868 126 18% 3,568 190WI 89 3,632 1,576 5,208 4,583 9,791 201 1,721 159 15% 4,609 913 817WI 91 4,655 1,510 6,165 4,059 10,224 206 1,621 185 12% 4,126 1,643 995WI 94 6,567 996 7,563 3,685 11,248 223 1,384 242 8% 3,749 2,315 798WI 96 7,872 830 8,702 3,367 12,069 232 1,197 270 8% 3,382 5,063 672WI 98 8,473 884 9,357 3,029 12,386 237 1,010 296 7% 3,056 7,273 496WI 00 8,420 807 9,227 2,840 12,067 225 871 345 8% 2,865 9,547 471WI 02 8,073 882 8,955 2,551 11,506 212 811 423 4% 2,580 9,474 595WI 04 9,543 1,027 10,570 2,041 12,611 229 735 472 6% 2,082 11,163 112WI 05 10,083 1,083 11,166 1,755 12,921 233 581 631 1,822 12,987 89
Persons with ID/DD by Home Size Utilization Rate per
100,000 of Population
Persons with ID/DD
Receiving HCBS
Persons with ID/DD Living in
Nursing Homes
State Institution Population
Per Diem of State
Institutions (in $)
0-21 Yr. Olds as % of State Institution Residents
Persons with ID/DD Living in ICFs-MR
1982
1-6
7-15
16+
20051994
$0$100$200$300$400$500$600$700
77 82 87 89 91 94 96 98 00 02 04 05
Year
Per
Die
m C
ost
s
0
500
1,000
1,500
2,000
2,500
Nu
mb
er o
f R
esid
ents
77 82 87 89 91 94 96 98 00 02 04 05
Year
0%
10%
20%
30%
40%
50%
60%
% o
f Y
outh
s in
Sta
te
Inst
itutio
ns
77 82 87 89 91 94 96 98 00 02 04 05
Year
0
2,000
4,000
6,000
8,000
10,000
12,000
14,000
16,000
77 82 87 89 91 94 96 98 00 02 04 05
Year
Nu
mb
er o
f Per
son
s HCBS ICF-MR
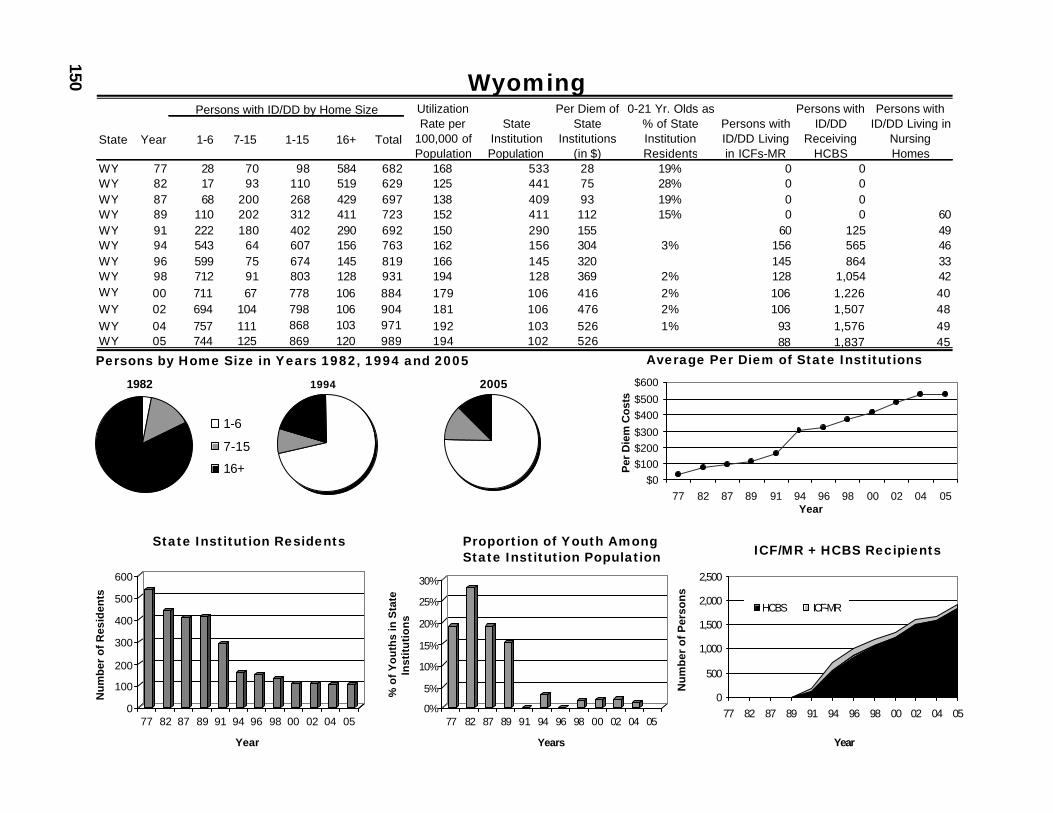
150 Wyoming
Average Per Diem of State Institutions
State Institution Residents ICF/MR + HCBS RecipientsProportion of Youth AmongState Institution Population
Persons by Home Size in Years 1982, 1994 and 2005
State Year 1-6 7-15 1-15 16+ Total
WY 77 28 70 98 584 682 168 533 28 19% 0 0WY 82 17 93 110 519 629 125 441 75 28% 0 0WY 87 68 200 268 429 697 138 409 93 19% 0 0WY 89 110 202 312 411 723 152 411 112 15% 0 0 60WY 91 222 180 402 290 692 150 290 155 60 125 49WY 94 543 64 607 156 763 162 156 304 3% 156 565 46WY 96 599 75 674 145 819 166 145 320 145 864 33WY 98 712 91 803 128 931 194 128 369 2% 128 1,054 42WY 00 711 67 778 106 884 179 106 416 2% 106 1,226 40WY 02 694 104 798 106 904 181 106 476 2% 106 1,507 48WY 04 757 111 868 103 971 192 103 526 1% 93 1,576 49WY 05 744 125 869 120 989 194 102 526 88 1,837 45
Persons with ID/DD by Home Size Utilization Rate per
100,000 of Population
Persons with ID/DD
Receiving HCBS
Persons with ID/DD Living in
Nursing Homes
State Institution Population
Per Diem of State
Institutions (in $)
0-21 Yr. Olds as % of State Institution Residents
Persons with ID/DD Living in ICFs-MR
20051982
1-6
7-15
16+
1994
$0$100$200$300
$400$500
$600
77 82 87 89 91 94 96 98 00 02 04 05Year
Per
Die
m C
osts
0
100
200
300
400
500
600
Nu
mb
er o
f R
esid
ents
77 82 87 89 91 94 96 98 00 02 04 05
Year
0%
5%
10%
15%
20%
25%
30%
% o
f Y
ou
ths
in S
tate
In
stit
uti
on
s
77 82 87 89 91 94 96 98 00 02 04 05
Years
0
500
1,000
1,500
2,000
2,500
77 82 87 89 91 94 96 98 00 02 04 05
Year
Nu
mb
er o
f P
erso
ns
HCBS ICF-MR
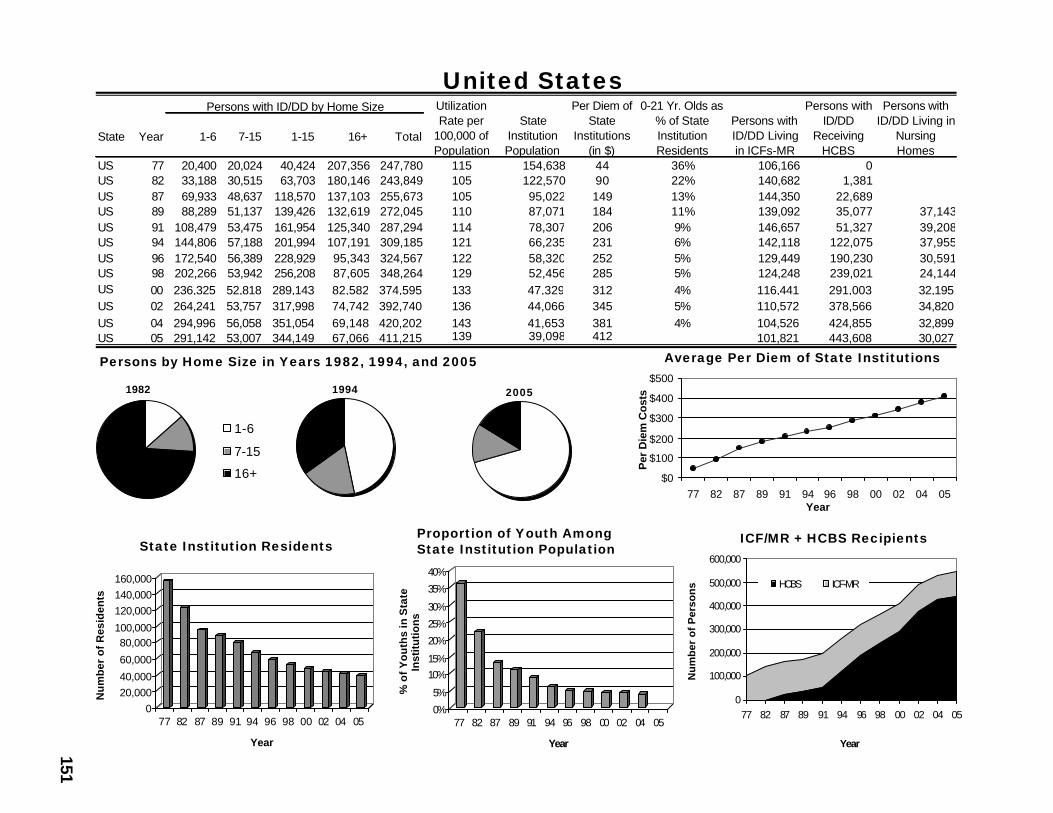
151
United States
Persons by Home Size in Years 1982, 1994, and 2005 Average Per Diem of State Institutions
State Institution Residents ICF/MR + HCBS RecipientsProportion of Youth AmongState Institution Population
State Year 1-6 7-15 1-15 16+ Total
US 77 20,400 20,024 40,424 207,356 247,780 115 154,638 44 36% 106,166 0US 82 33,188 30,515 63,703 180,146 243,849 105 122,570 90 22% 140,682 1,381US 87 69,933 48,637 118,570 137,103 255,673 105 95,022 149 13% 144,350 22,689US 89 88,289 51,137 139,426 132,619 272,045 110 87,071 184 11% 139,092 35,077 37,143US 91 108,479 53,475 161,954 125,340 287,294 114 78,307 206 9% 146,657 51,327 39,208US 94 144,806 57,188 201,994 107,191 309,185 121 66,235 231 6% 142,118 122,075 37,955US 96 172,540 56,389 228,929 95,343 324,567 122 58,320 252 5% 129,449 190,230 30,591US 98 202,266 53,942 256,208 87,605 348,264 129 52,456 285 5% 124,248 239,021 24,144US 00 236,325 52,818 289,143 82,582 374,595 133 47,329 312 4% 116,441 291,003 32,195US 02 264,241 53,757 317,998 74,742 392,740 136 44,066 345 5% 110,572 378,566 34,820US 04 294,996 56,058 351,054 69,148 420,202 143 41,653 381 4% 104,526 424,855 32,899US 05 291,142 53,007 344,149 67,066 411,215 139 39,098 412 101,821 443,608 30,027
Persons with ID/DD by Home Size Utilization Rate per
100,000 of Population
Persons with ID/DD
Receiving HCBS
Persons with ID/DD Living in
Nursing Homes
State Institution Population
Per Diem of State
Institutions (in $)
0-21 Yr. Olds as % of State Institution Residents
Persons with ID/DD Living in ICFs-MR
1994 20051982
1-6
7-15
16+ $0
$100
$200
$300
$400
$500
77 82 87 89 91 94 96 98 00 02 04 05Year
Per
Die
m C
osts
020,00040,000
60,000
80,000100,000
120,000140,000160,000
Nu
mb
er o
f R
esid
ents
77 82 87 89 91 94 96 98 00 02 04 05
Year
0%
5%
10%15%
20%
25%
30%
35%
40%
% o
f Y
ou
ths
in S
tate
In
stit
uti
on
s
77 82 87 89 91 94 96 98 00 02 04 05
Year
0
100,000
200,000
300,000
400,000
500,000
600,000
77 82 87 89 91 94 96 98 00 02 04 05
Year
Nu
mb
er o
f P
erso
ns HCBS ICF-MR

152
153
References and DataSources
Anderson, L.L., Prouty, R.W., & Lakin, K.C. (2000). Parallels in size of residential settings and use ofMedicaid-financed programs. Mental Retardation, 38(5), 468-471.
Boggs, E., Lakin, K.C., & Clauser, S. (1985). Medicaid coverage of residential service. In K.C.Lakin, B.K. Hill, & R.H. Bruininks (Eds.), An analysis of Medicaid’s Intermediate Care Facility for the MentallyRetarded (ICF/MR) Program (Report No. 20). Minneapolis: University of Minnesota, Department of EducationalPsychology.
Braddock, D., & Mitchell, D. (1992). Residential services and developmental disabilities in the UnitedStates: A national survey of staff compensation, turnover and related issues. Washington D.C.: AmericanAssociation on Mental Retardation.
Braddock, D., Hemp, R., Bacheldner, L., & Fujiura, G. (1995). The state of the states in developmentaldisabilities. Washington, D.C.: American Association on Mental Retardation.
Braddock, D., Hemp, R., Parish, S. & Westrich, J. (1998). State of the states in developmentaldisabilities. (5th ed.) Washington, DC : American Association on Mental Retardation.
Braddock, D. (2002). Disability at the Dawn of the 21st Century and the State of the States.Washington DC: American Association on Mental Retardation.
Coucouvanis, K., Polister, B., Prouty, R.W., & Lakin, K.C. (2003). Continuing reduction in populationsof large state residential facilities for persons with intellectual and developmental disabilities. MentalRetardation, 41(1), 67-70.
Davis, R., Silverstein, B., Uehara, E., & Sadden, L. (1987). Evaluation and service identification fordevelopmentally disabled residents of intermediate care and skilled nursing facilities. Chicago: Taylor Institute/UAP.
Gettings, R.M., & Mitchell, D. (1980). Trends in capital expenditures for mental retardation facilities:A state-by-state survey. Washington, DC: National Association of State Mental Retardation Program Directors.
Hauber, F.A., Bruininks, R.H., Hill, B.K., Lakin, K.C., & White, C.C. (1984). National census ofresidential facilities: Fiscal year 1982. Minneapolis: University of Minnesota, Center on Residential Servicesand Community Living, Institute on Community Integration/UAP.
Hill, B.K., & Lakin, K.C. (1984). Classification of residential facilities for mentally retarded people.Mental Retardation, 24, 107-115. Internal Revenue Service. (1992, Summer). Statistics of Income Bulletin.
Krantz, G.C., Bruininks, R.H., Clumpner, J.L. (1979). Mentally retarded people in state-operatedresidential facilities: Year ending June 30, 1978. Minneapolis: University of Minnesota, Center on ResidentialServices and Community Living, Institute on Community Integration/UAP.
154
Krantz, G.C., Bruininks, R.H., Clumpner, J.L. (1980). Mentally retarded people in state-operatedresidential facilities: Year ending June 30, 1979. Minneapolis: University of Minnesota, Center on ResidentialServices and Community Living, Institute on Community Integration/UAP.
Krantz, G.C., Bruininks, R.H., Clumpner, J.L. (1981). Mentally retarded people in state-operatedresidential facilities: Year ending June 30, 1980. Minneapolis: University of Minnesota, Center on ResidentialServices and Community Living, Institute on Community Integration/UAP.
Lakin, K.C. (1979). Demographic studies of residential facilities for mentally retarded people.Minneapolis: University of Minnesota, Center on Residential Services and Community Living, Institute onCommunity Integration/UAP.
Lakin, K.C., Anderson, L.L. & Prouty, R. (1998). Decreases continue in out-of-home residentialplacements of children and youth with mental retardation. Mental Retardation, 36(2), 165-168.
Lakin, K.C., Blake, E.M., Prouty, R.W., Mangan, T., & Bruininks, R.H. (1993). Residential servicesfor persons with developmental disabilities: Status and trends through 1991. Minneapolis: University ofMinnesota, Center on Residential Services and Community Living, Institute on Community Integration/UAP.
Lakin, K.C., Bruininks, R.H., Doth, D., Hill, B.K., & Hauber, F.A. (1982). Sourcebook on long-termcare for developmentally disabled people (Report No. 17). Minneapolis: University of Minnesota, Departmentof Educational Psychology.
Lakin, K.C., Hill, B.K., & Anderson, D.J. (1991). Persons with mental retardation in nursing homes in1977 and 1985. Mental Retardation, 29(1), 25-33.
Lakin, K.C., Hill, B.K., & Bruininks, R.H. (Eds.) (1985). An analysis of Medicaid’s Intermediate CareFacility for the Mentally Retarded (ICF-MR) program. Minneapolis: University of Minnesota, Center onResidential Services and Community Living, Institute on Community Integration/UAP.
Lakin, K.C., Hill, B.K., Chen, T. & Stephens, S.A. (1989). Persons with mental retardation and relatedconditions in mental retardation facilities: Selected findings from the 1987 National Medical ExpenditureSurvey. Minneapolis: University of Minnesota, Research and Training Center on Community Living/ Instituteon Community Integration/UAP.
Lakin, K.C., Hill, B.K., Hauber, F.A., Bruininks, R.H., & Heal, L.W. (1983). New admissions andreadmissions to a national sample of residential facilities. American Journal on Mental Deficiency, 88, 13-20.
Lakin, K.C., Hill, B.K., Street, H., & Bruininks, R.H. (1986). Persons with mental retardation in state-operated residential facilities: Years ending June 30, 1984 and June 30, 1985. Minneapolis: University ofMinnesota, Center on Residential Services and Community Living, Institute on Community Integration/UAP.
Lakin, K.C., Jaskulski, T.M., Hill, B.K., Bruininks, R.H., Menke, J.M., White, C.C., & Wright, E.A.(1989). Medicaid services for persons with mental retardation and related conditions. Minneapolis: Universityof Minnesota, Center for Residential Services and Community Living, Institute on Community Integration/UAP.
Lakin, K.C., White, C.C., Hill, B.K., Bruininks, R.H., & Wright, E.A. (1990). Longitudinal change andinterstate variability in residential services for persons with mental retardation. Mental Retardation, 28(6),343-351.
Lakin, K.C., Prouty, R.W., Polister, B., & Anderson, L.L. (2000). Over three quarters of all residentialservice recipients in community settings as of June 1999. Mental Retardation, 38(4), 378-379.
155
Lakin, K.C., Smith, J., Prouty, R.W., & Polister, B. (2001). State institutions during the 1990s: Changesin the number of facilities, average daily populations, and expenditures between fiscal years 1991 and 2000.Mental Retardation, 39(1), 72-75.
Lakin, K.C., Prouty, R.W., Coucouvanis, K. & Polister, B. (2004). States’ Initial Response to thePresident’s New Freedom Initiative: Slowest Rates of Deinstitutionalization. Mental Retardation, 42(3), 241-244.
Lakin, K.C., Prouty, R.W. & Coucouvanis, K. (2004). U.S. Residential Support Recipients with ID/DD Now Exceed 400,000 after 30% Increase in Past Decade; Increases Evident in All States. MentalRetardation, 42(6), 490-493.
Lakin, K.C., Prouty, R.W. & Coucouvanis, K. (2005). Long-Term Service and Support Expendituresfor Persons with ID/DD Within the Overall Medicaid Program. Mental Retardation, 43(1), 65-69.
Larson, S. A., Lakin, K.C., & Bruininks, R.H. (1998). Staff recruitment and retention: Study resultsand intervention strategies. Washington, DC: American Association on Mental Retardation.
Larson, S.A. & Lakin, K.C. (1995). Status and changes in Medicaid’s Intermediate Care Facility forthe Mentally Retarded (ICF-MR) program: Results from analysis of the Online Survey Certification andReporting System. Minneapolis: University of Minnesota, Center on Residential Services and CommunityLiving, Institute on Community Integration/UAP.
Larson, S.A., Lakin, K.C., Anderson, L., Kwak, N., Lee, J.H., Anderson, D. (2001). Prevalence onmental retardation and developmental disabilities: Estimates from the 1994/1995 National Health InterviewSurvey Disability Supplements. American Journal on Mental Retardation, 106(3), 231-252.
Larson, S.A., Lakin, L.C., Anderson, L.L., &Kwak, N. (2001). Age, race, gender and poverty status ofperson with MR/DD living in their own homes or with family members: NHIS-D analysis. MR/DD Data Brief,3(2). Minneapolis: University of Minnesota, Institute on Community Integration/UCEDD.
Mangan, T., Blake, E.M., Prouty, R.W., & Lakin, K.C. (1993). Residential services for persons withmental retardation and related conditions: Status and trends through 1992. Minneapolis: University ofMinnesota, Research and Training Center on Residential Services and Community Living, Institute onCommunity Integration/UAP.
Mangan, T., Blake, E.M., Prouty, R.W., & Lakin, K.C. (1994). Residential services for persons withmental retardation and related conditions: Status and trends through 1993. Minneapolis: University ofMinnesota, Research and Training Center on Residential Services and Community Living, Institute onCommunity Integration/UAP.
National Institute of Mental Health (1975). Changes in the age, sex, and diagnostic composition ofthe resident population of state and county mental hospitals, United States, 1964-1973. DHEW Pub. No.(ADM)75-158. Rockville, MD: Author.
National Institute of Mental Health (1979). Patients in state and county mental hospitals, 1977.Rockville, MD: Author. (microfiche)
National Institute of Mental Health. (1951). Patients in mental institutions, 1950. Washington, DC:U.S. Government Printing Office.
156
National Institute of Mental Health. (1956). Patients in mental institutions, 1955. Washington, DC:U.S. Government Printing Office.
National Institute of Mental Health. (1957). Patients in mental institutions, 1956. Washington, DC:U.S. Government Printing Office.
National Institute of Mental Health. (1961). Patients in mental institutions, 1960. Washington, DC:U.S. Government Printing Office.
National Institute of Mental Health. (1966). Patients in mental institutions, 1965. Washington, DC:U.S. Government Printing Office.
National Institute of Mental Health. (1967). Patients in mental institutions, 1966. Washington, DC:U.S. Government Printing Office.
National Institute of Mental Health. (1969). Patients in mental institutions, 1967. Washington, DC:U.S. Government Printing Office.
Office of Mental Retardation Coordination, Social and Rehabilitation Service. (1969). Residents inpublic institutions for the mentally retarded, 1968 (Current Facility Reports). Washington, DC: NationalClearinghouse for Mental Health Information.
Office of Mental Retardation Coordination, Social and Rehabilitation Service. (1970). Residents inpublic institutions for the mentally retarded, 1969 (Current Facility Reports). Washington, DC: NationalClearinghouse for Mental Health Information.
Prouty, R.W. & Lakin, K.C. (1992). A summary of states’ efforts to positively affect the quality ofMedicaid Home and Community-Based Services for persons with mental retardation and related conditions.Minneapolis: University of Minnesota, Center for Residential and Community Services/Institute on CommunityIntegration/UAP.
Prouty, R.W. & Lakin, K.C. (Eds.) (1995). Residential services for persons with developmentaldisabilities: Status and trends through 1994. Minneapolis: University of Minnesota, Research and TrainingCenter on Community Living, Institute on Community Integration/UAP.
Prouty, R.W. & Lakin, K.C. (Eds.) (1996). Residential services for persons with developmentaldisabilities: Status and trends through 1995. Minneapolis: University of Minnesota, Research and TrainingCenter on Community Living, Institute on Community Integration/UAP.
Prouty, R.W. & Lakin, K.C. (Eds.) (1997). Residential services for persons with developmentaldisabilities: Status and trends through 1996. Minneapolis: University of Minnesota, Research and TrainingCenter on Community Living, Institute on Community Integration/UAP.
Prouty, R.W. & Lakin, K.C. (Eds.) (1998). Residential services for persons with developmentaldisabilities: Status and trends through 1997. Minneapolis: University of Minnesota, Research and TrainingCenter on Community Living, Institute on Community Integration/UAP.
Prouty, R.W. & Lakin, K.C. (Eds.) (1999). Residential services for persons with developmentaldisabilities: Status and trends through 1998. Minneapolis: University of Minnesota, Research and TrainingCenter on Community Living/ Institute on Community Integration/UAP.
Prouty, R.W., Lakin, K.C., & Anderson, L.L. (2000). Five-year trends in Medicaid institutional (ICF/MR) populations, Home and Community Based Services reflect major changes. Mental Retardation, 38(3),294-296.

157
Prouty, R.W., Smith, G. & Lakin, K.C. (Eds.) (2000). Residential services for persons withdevelopmental disabilities: Status and trends through 1999. Minneapolis: University of Minnesota, Researchand Training Center on Community Living, Institute on Community Integration/UAP.
Prouty, R.W., Smith, G. & Lakin, K.C. (Eds.) (2001). Residential services for persons withdevelopmental disabilities: Status and trends through 2000. Minneapolis: University of Minnesota, Researchand Training Center on Community Living, Institute on Community Integration/UCEDD.
Prouty, R.W., Smith, G. & Lakin, K.C. (Eds.) (2002). Residential services for persons withdevelopmental disabilities: Status and trends through 2001. Minneapolis: University of Minnesota, Researchand Training Center on Community Living, Institute on Community Integration/UCEDD.
Prouty, R.W., Smith, G. & Lakin, K.C. (Eds.) (2003). Residential services for persons withdevelopmental disabilities: Status and trends through 2002. Minneapolis: University of Minnesota, Researchand Training Center on Community Living, Institute on Community Integration/UCEDD.
Prouty, R.W., Smith, G. & Lakin, K.C. (Eds.) (2004). Residential services for persons withdevelopmental disabilities: Status and trends through 2003. Minneapolis: University of Minnesota, Researchand Training Center on Community Living, Institute on Community Integration/UCEDD.
Prouty, R.W., Smith, G. & Lakin, K.C. (Eds.) (2005). Residential services for persons withdevelopmental disabilities: Status and trends through 2004. Minneapolis: University of Minnesota, Researchand Training Center on Community Living, Institute on Community Integration/UCEDD.
Rotegard, L.L., & Bruininks, R.H. (1983). Mentally retarded people in state-operated residentialfacilities: Year ending June 30, 1981 and 1982. Minneapolis: University of Minnesota, Center on ResidentialServices and Community Living, Institute on Community Integration/UAP.
Scheerenberger, R.C. (1965). A current census (1964) of state institutions for the mentally retarded.Mental Retardation, 3, 3-4.
Scheerenberger, R.C. (1975). Current trends and status of public residential services for the mentallyretarded, 1974. Madison, WI: National Association of Superintendents of Public Residential Facilities for theMentally Retarded.
Scheerenberger, R.C. (1977). Public residential services for the mentally retarded, 1976. Madison,WI: National Association of Superintendents of Public Residential Facilities for the Mentally Retarded.
Sigford, B.B., Bruininks, R.H., Lakin, K.C., Hill, B.K., & Heal, L.W. (1982). Resident release patternsin a national sample of public residential facilities. American Journal on Mental Deficiency, 87(2), 130-140.
Smith, G., & Gettings, R. (1989). Medicaid Home and Community Based Services for persons withdevelopmental disabilities. Alexandria, VA: National Association of State Mental Retardation Program Directors.
Social Security Administration Office, Office of Disability (1998). Review of SSA’s implementation ofnew SSI childhood disability legislation (SSA Pub. No 64-070). Baltimore: Author
Soloman-Fears, C. (1996, August). Supplemental Security Income (SSI) children: Welfare reform inthe 104th Congress (CRS report for Congress 95-402 EPW). Washington, DC: Library of Congress,Congressional Research Service.
Stancliff, R.J., Lakin, K.C., Shea, J.R., Prouty, R.W. & Coucouvanis, K. (2004). The Economics ofDeinstitutionalization. Costs and Outcomes of Community Services for People with Intellectual Disabilities.Baltimore, MD: Paul H. Brookes Publishing Co.
158
U.S. Bureau of the Census. (1990). Projections of the population of states, by age, sex, and race:1989 to 2010, Current Population Reports, Series P-25, No. 1053. U.S. Government Printing Office:Washington, DC.
White, C.C., Lakin, K.C., & Bruininks, R.H. (1989). Persons with mental retardation and relatedconditions in state-operated residential facilities: Year ending June 30, 1988. Minneapolis: University ofMinnesota, Research and Training Center on Residential Services and Community Living, Institute onCommunity Integration/UAP.
White, C.C., Lakin, K.C., Bruininks, R.H., & Li, X. (1991). Persons with mental retardation andrelated conditions in state-operated residential facilities: Year ending June 30, 1989. Minneapolis: Universityof Minnesota, Center on Residential Services and Community Living, Institute on Community Integration/UAP.
White, C.C., Lakin, K.C., Hill, B.K., Wright, E.A., Bruininks, R.H. (1987). Persons with mentalretardation in state-operated residential facilities: Year ending June 30, 1986 with longitudinal trends from1950 to 1986. Minneapolis: University of Minnesota, Department of Educational Psychology.
White, C.C., Lakin, K.C., Hill, B.K., Wright, E.A., & Bruininks, R.H. (1988). Persons with mentalretardation in state-operated residential facilities: Year ending June 30, 1987 with longitudinal trends from1950 to 1987. Minneapolis: University of Minnesota, Center for Residential Services and Community Living,Institute on Community Integration/UAP.
White, C.C., Prouty, R.W., Lakin, K.C., & Blake, E.M. (1992). Persons with mental retardation andrelated conditions in state-operated residential facilities: Year ending June 30, 1990. Minneapolis: Universityof Minnesota, Center on Residential Services and Community Living, Institute on Community Integration/UAP.
Zappolo, A., Lakin, K.C., & Hill, B.K. (1990). Persons in institutions and special residential settings.In I. Fitzgerald & S. Thompson-Hoffman (Eds.), Disability in the United States. New York: Springer PublishingCo.
158