Embed Size (px)
Citation preview

RESIDENTIAL RESEARCH
OverviewThe more widespread growth in house prices since mid-2013 has prompted a further step up in interest in funding residential development schemes among lenders. There are now many types of funding on offer, with those offering senior debt now competing against those offering mezzanine finance and equity finance. The increased competition in the market goes some way to explaining how, after several years of rising, the cost of finance is now expected to level off in the short-term, as shown by Knight Frank’s annual survey of lenders.
Against a global backdrop of low yields, residential development can offer attractive returns for lenders, which now range from banks to private equity and investment houses. The large-scale and long-term undersupply of new housing in
areas where it is most needed across the UK means that funders are planning to pick up their activity levels in the next 12-24 months, expanding their geographical reach as well as looking at a wider range of development opportunities.
To investigate the lending trends in more detail, we have surveyed more than 45 major operators in the development finance market. The key findings highlight how the market is set to evolve over 2016 and 2017.
Expanding reachAs can be seen in figure 1, which shows the regions where development finance is currently deployed, the focus is still largely on London. However, as shown in figure 2, our survey indicates that this picture is set to change over the coming years, with more than nine in ten respondents
FIGURE 2
…And in which locations will you consider over the next 12-24 months? % of respondents
Source: Knight Frank Residential ResearchSource: Knight Frank Residential Research
FIGURE 1
In which locations have you arranged development finance in the last 12 months…? % of respondents
Knight Frank’s survey of more than 45 key operators in the development finance market* found:
Balance sheet allocations for residential development will rise in the 12 months
There will be more lending in regional markets over the next two years
The cost of funding will remain broadly unchanged in the coming months
More than three-quarters of respondents are planning to increase lending to SMEs
“ Funders are planning to pick up their activity levels in the next 12-24 months, expanding their geographical reach as well as looking at a wider range of development opportunities.”Follow Gráinne at @ggilmorekf
For the latest news, views and analysis on the world of prime property, visit Global Briefing or @kfglobalbrief
GRÁINNE GILMORE Head of UK Residential Research
RESIDENTIAL DEVELOPMENT FINANCE REPORT 2015/2016
DEVELOPMENT FINANCE SURVEY
RESULTS
*conducted in Q3 2015

2
Aberdeen
Edinburgh
Leeds
Manchester
BirminghamCambridge
Oxford
ReadingBristol Bath
Exeter
GuildfordSouthampton
Glasgow
13
911
8
7
42
1
53
12
146
10
FIGURE 3
Top cities in which funders will consider deals in next 12-24 months
Source: Knight Frank Research
Source: Knight Frank Research
FIGURE 5
If you were funding a central London scheme, which price bracket would you consider? (prices psf)
indicating they will lend for schemes in the South East, up from 58% who say they currently finance schemes in the region. There is also a notable rise in the number who will look to lend on developments in the Midlands and the North, reflecting the improving economic conditions in these areas. Some 60% said they would consider a scheme in the Midlands, up from 38% who gave such a response in last year’s survey, and 28% in 2013.
Even within London, this “ripple effect” is also evident, with a greater number of respondents saying they will fund schemes further out from the centre of the city. While developments in zones 2 to 3 are likely to attract the most attention from funders, with nearly all respondents saying they would lend here, this is not to say that this is drawing the desire to fund away from central London. Some 91% say they will lend on schemes in zone 1 over the next 12-24 months.
In terms of city markets outside London, figure 3 shows a selection of the large urban areas in which lenders are most interested. This is not an exhaustive list, and it is important to note that funders will certainly consider schemes elsewhere – but it gives an indication of the spread of interest across these major conurbations.
Overall the market for residential development finance is expanding –
some 71% of respondents said that balance sheet allocation for residential schemes rose over the last year, and 77% expect it to rise in the year to come.
There is good news for smaller housebuilders and developers, a sector which has been identified by
FIGURE 4
Housebuilding in England (quarterly figures)
Source: Knight Frank Research / DCLG
FIGURE 6
If you were funding a development in outer London or the rest of the UK, what price brackets would you consider? (prices psf)
Source: Knight Frank Research
up to£200psf
£200-£400psf
£200-£400psf
£200-£400psf
£200-£400psf
£200-£400psf
£2000psf+
80% 80% 76%
64%
58%
27%
4%
£1,000-£2,000
£800-£1,000
£200-£400
£400-£600
£600-£800
up to£200 £2,000+
0
10,000
20,000
30,000
40,000
50,000
60,000
2000
2001
2002
2003
2004
2005
2006
2007
2008
2009
2010
2011
2012
2013
2014
2015
Housing CompletionsHousing Starts
0
20
40
60
80
100
£1,000-£2,000psf
£2,000-£3,000psf
£3,000psf+up to£1,000psf
29%£3,000+psf
44%£3,000+psf
89%£1,000-£2,000psf
87%up to £1,000psf
£3,0
00ps
f+
£2,0
00-£
3,00
0psf
£1,0
00-2
,000
psf
up t
o £1
,000
psf
£1,000-£2,000
£2,000-£3,000
£3,000+up to£1,000
£200-£400psf£401-£600psf£601-£800psf£801-£1,000psf£1,001-£2,000psf£2,000+
87% 89%
44%
29%
58% 27% 4%
Please refer to the important notice at the end of this report
“ The results of the survey are a good reflection of the current development finance market which indicates that the cost of funding seems to be levelling off. With the return of the clearing banks combined with the new foreign entrants, the cost of senior debt at 65% loan-to-cost is between 5-7% when calculated on an internal rate of return basis. The private and institutional equity houses are not able to compete in the sub-10% IRR senior debt space particularly when it comes to bigger tickets (£30m+). These equity houses remain focused on plugging any gaps higher up the capital stack with returns that will give them higher multiples on their capital deployed.”
PETER MACALLAN Head of Structured Development Finance
VIEWPOINT
3
0%
10%
20%
30%
40%
50%
60%
70%
80%
90%
100%
Block of apartments
Scheme with multiple houses
Build to rent
Single house
Single apartment
Max GDV per scheme:
Under £10m£10m - £20m£20m - £30m£40m - £50m
£50m - £60m£90m - £100m£100m+
FIGURE 7
Type and value of schemes lenders will consider
Source: Knight Frank Research
policymakers as being crucial if the UK is to deliver the levels of housing needed. More than two-thirds of respondents said that they had lent more to SME developers over the last year, with only 10% reporting a decline. Over the next year, some 70% said they would increase their lending to SMEs.
When it comes to what funders will invest in, the chart below shows that the preference is for multi-unit schemes, with blocks of apartments most likely to attract finance. The burgeoning PRS sector is also becoming a popular choice, with three-quarters of respondents saying they would consider such an investment. Tellingly, a similar proportion of respondents would be willing to invest in large-scale multi-unit projects, with 27% saying they would invest in schemes with GDV of £100 million or more for Build-to-Rent and multi-house units, and 29% saying the same for apartment blocks.
The largest proportion of respondents said they would fund schemes outside London with units priced at between £200 and £600 per square foot (psf). In the capital, schemes priced at up to £2000 psf will attract the most attention. Only 29% would consider schemes at more than £3000 psf in London.
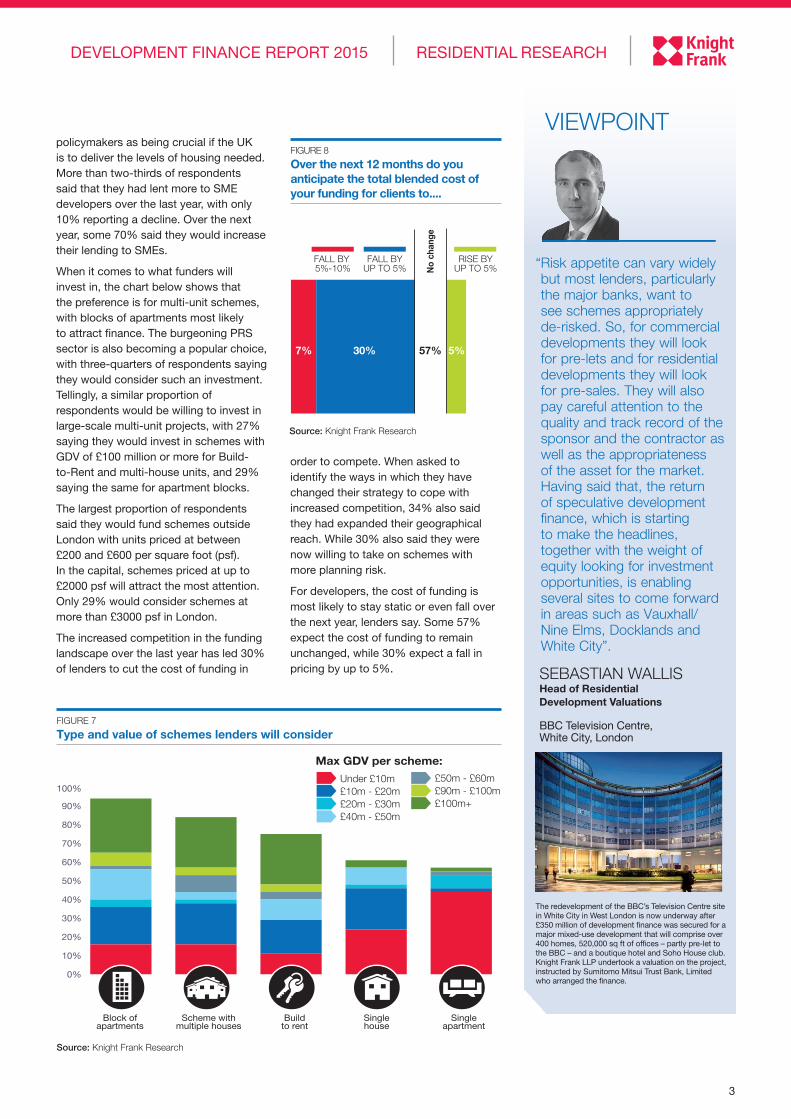
The increased competition in the funding landscape over the last year has led 30% of lenders to cut the cost of funding in
FIGURE 8
Over the next 12 months do you anticipate the total blended cost of your funding for clients to....
Source: Knight Frank Research
0%
57%
RISE BYUP TO 5%
FALL BYUP TO 5%
FALL BY 5%-10%
10%
20%
30%
40%
50%
60%
30%7% 5%
7%
30%
57%
5%
Rise by up to 5%
Remained unchanged
Fall by up to 5%
Fall by 5%-10%
No
chan
ge
order to compete. When asked to identify the ways in which they have changed their strategy to cope with increased competition, 34% also said they had expanded their geographical reach. While 30% also said they were now willing to take on schemes with more planning risk.
For developers, the cost of funding is most likely to stay static or even fall over the next year, lenders say. Some 57% expect the cost of funding to remain unchanged, while 30% expect a fall in pricing by up to 5%.
RESIDENTIAL RESEARCHDEVELOPMENT FINANCE REPORT 2015
“ Risk appetite can vary widely but most lenders, particularly the major banks, want to see schemes appropriately de-risked. So, for commercial developments they will look for pre-lets and for residential developments they will look for pre-sales. They will also pay careful attention to the quality and track record of the sponsor and the contractor as well as the appropriateness of the asset for the market. Having said that, the return of speculative development finance, which is starting to make the headlines, together with the weight of equity looking for investment opportunities, is enabling several sites to come forward in areas such as Vauxhall/ Nine Elms, Docklands and White City”.
SEBASTIAN WALLIS Head of Residential Development Valuations
BBC Television Centre, White City, London
The redevelopment of the BBC’s Television Centre site in White City in West London is now underway after £350 million of development finance was secured for a major mixed-use development that will comprise over 400 homes, 520,000 sq ft of offices – partly pre-let to the BBC – and a boutique hotel and Soho House club. Knight Frank LLP undertook a valuation on the project, instructed by Sumitomo Mitsui Trust Bank, Limited who arranged the finance.
VIEWPOINT

For the latest news, views and analysison the world of prime property, visit
KnightFrankblog.com/global-briefing
GLOBAL BRIEFING
RESIDENTIAL RESEARCH
Gráinne Gilmore Head of UK Residential Research +44 20 7861 5102 [email protected]
KNIGHT FRANK FINANCE
Peter MacAllan Head of Structured Development Finance +44 20 7861 5490 [email protected]
RESIDENTIAL DEVELOPMENT
Sebastian Wallis Head of Residential Development Valuations +44 20 7861 5415 [email protected]
House price growth has eased since the start of 2015, and while activity levels have recuperated after the slowdown in the run-up to the election, the stock of housing available for sale across the country is at near record lows.
The market is being supported by more positive economic news and low mortgage rates, but there are also factors weighing
FIGURE 10
Regional house price growth Year to July 2015
Source: Knight Frank Research
FIGURE 9
Market trends Prices and activity
Source: Macrobond
2009 2010 2011 2012 2013 2014 20152009 2010 2011 2012 2013 2014 2015
UK real estate transactions (RHS)UK house price change (%) (LHS)
UK real estate transactions (RHS)UK house price change (%) (LHS)
-20%
-15%
-10%
-5%
0%
5%
10%
15%
Mon
thly
tra
nsac
tions
-20%
-15%
-10%
-5%
0%
5%
10%
15%M
onth
ly t
rans
actio
ns
60000
65000
70000
75000
80000
85000
90000
95000
100000
105000
110000
60000
65000
70000
75000
80000
85000
90000
95000
100000
105000
110000
FIGURE 11
Prime country price change Annual rate of growth %
Source: Macrobond / Knight Frank Research
Bath Bristol CheltenhamExeter Oxford WinchesterPrime Country House Index
0.0%
2.5%
5.0%
7.5%
10.0%
12.5%
15.0%
Q2 2015Q1 2015Q4 2014Q3 2014
UK RESIDENTIAL MARKET UPDATEon the market, such as the increased difficulty in accessing mortgages for those who do not have a sizeable deposit, and the more onerous process of getting a homeloan due to new rules introduced in April 2014. There is also the prospect of interest rate rises, which, along with the affordability issues that are already evident in some parts of the market, could also serve to weigh on any future price growth.
Looking at specific markets in more detail, prime country house prices rose by 2.3% in the year to the end of Q2. However several city markets have outperformed, most notably Cheltenham and Bristol where prices are up 9.2% and 5.1% on the year respectively.
Annual price growth in prime central London was 1.7% on an annual basis in August, while values remained unchanged on the month, as December’s stamp duty changes continued to be felt in the capital. The weight of the stamp duty burden being borne by London was revealed as Knight Frank research showed that while around 13% of transactions happened in the capital in the first quarter of the year, these made up 47% of stamp duty revenues.
Knight Frank’s forecasts show that average prices across the UK will climb by 18.5% by the end of 2019, with some local outperformance, especially in key urban locations.
Important Notice © Knight Frank LLP 2015 – This report is published for general information only and not to be relied upon in any way. Although high standards have been used in the preparation of the information, analysis, views and projections presented in this report, no responsibility or liability whatsoever can be accepted by Knight Frank LLP for any loss or damage resultant from any use of, reliance on or reference to the contents of this document. As a general report, this material does not necessarily represent the view of Knight Frank LLP in relation to particular properties or projects. Reproduction of this report in whole or in part is not allowed without prior written approval of Knight Frank LLP to the form and content within which it appears. Knight Frank LLP is a limited liability partnership registered in England with registered number OC305934. Our registered office is 55 Baker Street, London, W1U 8AN, where you may look at a list of members’ names.