Embed Size (px)
Citation preview
The University of Manchester Research
Residential occupant density distributions derived fromEnglish Housing Survey dataDOI:10.1016/j.firesaf.2019.01.010
Document VersionAccepted author manuscript
Link to publication record in Manchester Research Explorer
Citation for published version (APA):Hopkin, C., Spearpoint, M., Hopkin, D., & Wang, Y. (2019). Residential occupant density distributions derived fromEnglish Housing Survey data. Fire Safety Journal. https://doi.org/10.1016/j.firesaf.2019.01.010
Published in:Fire Safety Journal
Citing this paperPlease note that where the full-text provided on Manchester Research Explorer is the Author Accepted Manuscriptor Proof version this may differ from the final Published version. If citing, it is advised that you check and use thepublisher's definitive version.
General rightsCopyright and moral rights for the publications made accessible in the Research Explorer are retained by theauthors and/or other copyright owners and it is a condition of accessing publications that users recognise andabide by the legal requirements associated with these rights.
Takedown policyIf you believe that this document breaches copyright please refer to the University of Manchester’s TakedownProcedures [http://man.ac.uk/04Y6Bo] or contact [email protected] providingrelevant details, so we can investigate your claim.
Download date:13. Mar. 2022
Accepted manuscript: Hopkin, C., Spearpoint, M., Hopkin, D., Wang, Y. “Residential occupant density distributions derived from English Housing Survey data”, Fire Safety Journal, 2019. DOI: https://doi.org/10.1016/j.firesaf.2019.01.010
1
RESIDENTIAL OCCUPANT DENSITY DISTRIBUTIONS DERIVED FROM ENGLISH HOUSING SURVEY DATA
Charlie HOPKIN1, 2, Michael SPEARPOINT1, Danny HOPKIN1,3 and Yong WANG2
1 OFR Consultants 2 The University of Manchester
3 University of Sheffield
The University of Manchester
School of Mechanical, Aerospace and Civil Engineering
Manchester M13 9PL
United Kingdom
Abstract
Assessing the evacuation of residential buildings in the event of a fire requires the number of occupants
in the building to be determined. The English Housing Survey (EHS) provides a means of determining
occupant density by including data on the number of residents and the total floor area of dwellings.
From this it has been found that occupant density can be approximated as being lognormally distributed,
with a mean for all dwellings of 44.6 m2/person and a standard deviation of 29.5 m2/person. When
considering apartments separately from houses, it is found that apartments were in general more
densely occupied with a mean of 38.7 m2/person and a standard deviation of 20.9 m2/person. The
occupancy has also been determined with respect to the number of bedrooms per dwelling, with an
overall mean of 0.97 occupants per bedroom and a standard deviation of 0.49 occupants. When
considering the EHS occupant density distributions in the context of exemplar single-stair residential
buildings, it has been found that the design capacity of the stair is unlikely to be exceeded, where for a
typical 10-storey residential building the stair design capacity is 580 while the equivalent EHS 99.9th
percentile is 165 or 528, depending on whether distributions are applied to each apartment
independently or consistently across the full building.
Keywords
Residential; Dwelling; Apartment; Occupant density; Occupant load.
Accepted manuscript: Hopkin, C., Spearpoint, M., Hopkin, D., Wang, Y. “Residential occupant density distributions derived from English Housing Survey data”, Fire Safety Journal, 2019. DOI: https://doi.org/10.1016/j.firesaf.2019.01.010
2
1 INTRODUCTION
Occupant load can be broadly defined as the number and spatial distribution of occupants in a
building [1], with NFPA 101 [2] describing it as “the total number of persons that might occupy a building
or a portion thereof”. In fire safety design, the occupant load of a building can play an important role for
several reasons, such as when performing evacuation calculations, or when determining the number of
occupants who may be affected by a fire event. A common approach of determining occupant load is
to apply an occupant load factor (also commonly referred to as a floor space factor) based on a building
typology and applicable floor area. Recommended values for occupant load factors are incorporated
into many guidance and deemed-to-satisfy documents around the world, including Approved Document
B Volume 2: Buildings other than dwellinghouses [3] (ADB) in England and Wales and the Technical
Handbook – Non-domestic for fire [4] in Scotland.
As is previously discussed in Spearpoint and Hopkin [5], it could be postulated that occupant load
factors recommended in guidance documents are based on historical data from measured occupant
densities. Although the work of Spearpoint and Hopkin was specifically concerned with occupancy
numbers for mercantile buildings, it identified a gap in knowledge as to what might represent a
‘reasonable’ design value for occupant load factors and points to a general lack of information on the
origins of many recommended values. The occupant load factors within common guidance are also
deterministic. Therefore, they do not provide a representation of the range of potential occupancies
which may occur within a building, with this potential range being significant and of interest when
undertaking probabilistic-based assessments.
With respect to residential design in the UK, the importance of defining appropriate residential occupant
loads has become more apparent with the unfolding of recent events, not only in defining the potential
consequences a fire may have on a building but also due to a potential shift in evacuation strategies for
many buildings. The National Fire Chiefs Council (NFCC) ‘Guidance on supporting temporary changes
to a simultaneous evacuation in purpose-built blocks of flats’ [6], issued in May 2018, provides advice
for apartment buildings where it may be believed that a ‘stay put’ evacuation policy is “no longer
considered appropriate owing to significant risk issues such as combustible external facades” and that
“where such issues exist a temporary change to a simultaneous evacuation strategy is likely to be
necessary until the failings have been rectified” [6].
Under UK guidance, it is common to adopt the aforementioned stay put evacuation strategy, otherwise
referred to as ‘defend-in-place’. BS 9991 [7], a British Standard guidance document for the fire safety
design, management and use of residential buildings, describes a stay put strategy as one that is
normally adopted in blocks of apartments whereby, when a fire occurs in an apartment, the occupants
of that apartment evacuate, but occupants of all other apartments can safely remain unless directly
impacted or directed to leave by the fire and rescue service (FRS). When such an evacuation strategy
is adopted, the exit capacity of the design, such as the sizing of stairs, corridors and doors, is typically
only required to be able to accommodate the evacuation of a small quantity of occupants (e.g. those
evacuating a single apartment) and therefore the occupant load of the building is rarely calculated. With
the potential for greater prevalence of simultaneous evacuation in residential buildings, the
determination of an appropriate occupant load becomes more significant and may subsequently affect
decisions relating to the availability and sizing of exits and stairs. However, even with the adoption of a
stay put evacuation policy, the determination of appropriate occupant loads remains important for use
in fire safety assessments, such as probabilistic risk assessments and cost-benefit analyses, as it
provides an indication of the number of occupants within a building who may be affected by a fire
incident.
This paper provides a review of residential occupant load factors and distributions from fire engineering
design guidance available across several jurisdictions, where two typical methods of determining
residential occupancy are identified; either applying a factor using floor area or by number of bedrooms.
Data available from the English Housing Survey (EHS) is discussed and analysed for the two methods
and from this residential occupant density distributions are calculated and applied to a series of
exemplar buildings. These distributions represent a statistical distribution for the number of occupants
within a space that could be used in future probabilistic assessments.
Accepted manuscript: Hopkin, C., Spearpoint, M., Hopkin, D., Wang, Y. “Residential occupant density distributions derived from English Housing Survey data”, Fire Safety Journal, 2019. DOI: https://doi.org/10.1016/j.firesaf.2019.01.010
3
1.1 Residential occupant load factors in standard guidance
It may be expected that occupant load factors for residential design are specific to the jurisdiction in
which they are being applied, where the occupant load factor will differ depending on the housing
characteristics (such as arrangement and size), cultural practices and the levels of acceptability within
jurisdictions [5]. The work herein focusses on occupancies and residential design in England. However,
comparisons to guidance documents from other jurisdictions have been made throughout. These
comparisons have been made because many guidance documents adopt similar design approaches
and recommendations, and in certain instances guidance documents are adopted across multiple
countries and jurisdictions. In addition, where floor space factors for residential design are lacking within
certain jurisdictions, designers may be inclined to adopt values from elsewhere.
Neither ADB volume 1 [8] nor volume 2 [3] explicitly state an occupant load factor for residential design,
but ADB volume 2 recommends 8 m2/person for bedrooms or study-bedrooms and 13 m2/person for
bed-sitting rooms. The Scottish Non-Domestic Technical Handbook [4] provides values consistent with
ADB, while the Domestic Technical Handbook [9] does not provide occupant load factors. Similarly, BS
9991 [7] and BS 9999 [10] do not specify an occupant load factor for residential design occupancies.
This lack of guidance on occupant loads in residential design is in part influenced by the stay put
evacuation strategy used for many UK residential buildings, discussed at the outset of this paper.
In North America NFPA 1 [11] and NFPA 101 [2] propose an occupant load factor of 18.6 m2/person
(200 ft2/person) for hotels and dormitories, apartment buildings, and large board and care. The same
figure is recommended in the IBC [12] for residential buildings. These values are based on the ‘gross
leasable area’, which is described as the “total floor area designed for tenant occupancy and exclusive
use” [12]. The National Building Code of Canada (NBC) recommends an occupant load factor of
4.6 m2/person for dormitories and for dwellings recommends that two persons per sleeping room
(bedroom) be adopted [13].
Elsewhere, both the Qatar Civil Defence Regulation [14] and Saudi Building Code (SBC) [15] applies a
value of 18.6 m2/person for residential occupancies, consistent with NFPA 101 and IBC. The Hong
Kong code of practice (HK COP) [16] states occupant load factors of 3 m2/person for tenement houses,
4.5 m2/person for “self-contained flats with corridor or balcony access having five or more flats on each
floor served by each stair case” and 9 m2/person for other types of flats. Work by Wong [17], which
considered occupant load in high-rise residential buildings in Hong Kong, determined a mean occupant
load factor of 0.1 persons/m2 (equivalent to 10 m2/person) with a standard deviation of
0.041 persons/m2 (4.1 m2/person) for a sample of 126 apartments. It was also found that 99.75% of the
apartments surveyed had occupant loads within the HK COP specified values.
C/VM2 [18], the verification method for fire safety design in New Zealand, proposes that bedrooms /
bunkrooms / dormitories / hostels apply an occupancy using the number of bed spaces and “staff when
appropriate”. In contrast, C/AS2 [19], the acceptable solution in New Zealand for buildings with sleeping
occupancy, does not specify occupant load factors for calculating occupant loads of residential
buildings.
1.2 Probabilistic assessments using occupancy distributions
In 2009, the National House Building Council (NHBC) in the UK published a study undertaken by the
Building Research Establishment (BRE) which investigated the risk from fires associated with open-
plan apartment arrangements (NF 19) [20]. NF 19 applied the Monte Carlo method to generate
simulation results based on selected probabilistic inputs, including a distribution for the number of
agents simulated within the apartments. Outputs for NF 19 are provided for the simulated number of
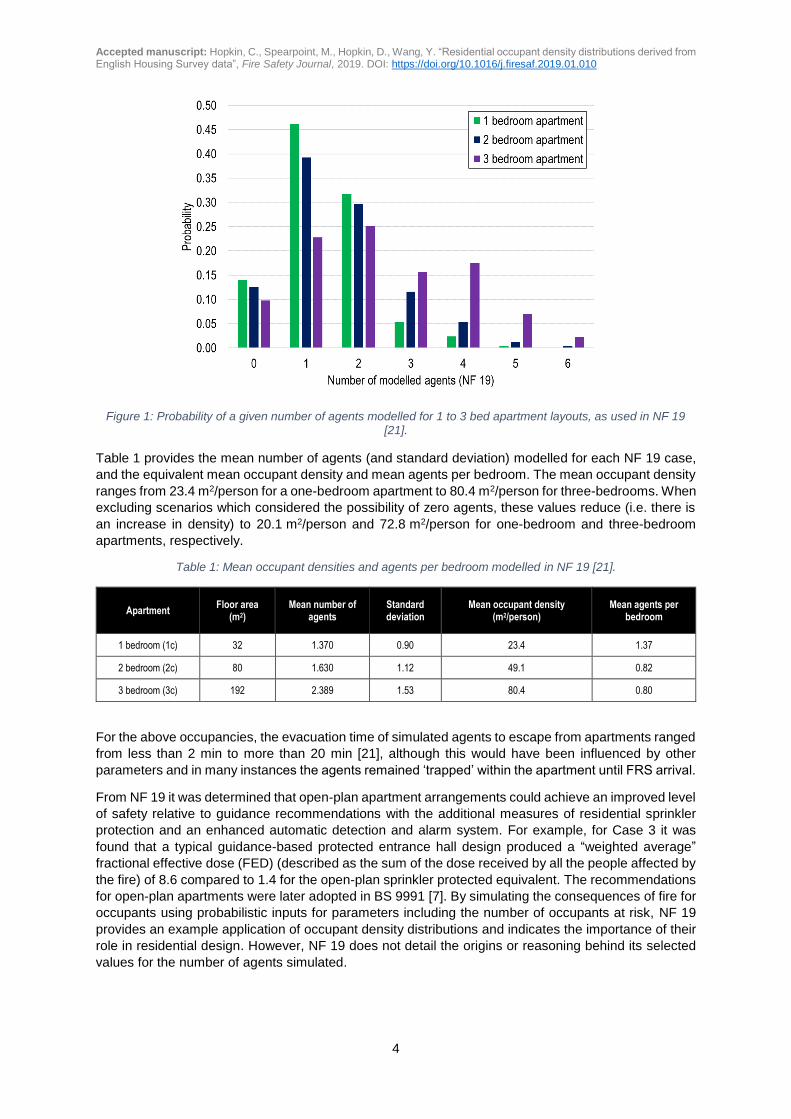
“people at risk” [21]. The number of simulated agents per case ranges from zero to ‘more than 6’,
indicating that NF 19 considered the possibility that no occupants were present during a fire. Figure 1
provides the probability distribution for one to three-bedroom arrangements, where it can be seen that
for both a one-bedroom and two-bedroom apartment the most common number of simulated agents is
1, and 2 agents for a three-bedroom arrangement.
Accepted manuscript: Hopkin, C., Spearpoint, M., Hopkin, D., Wang, Y. “Residential occupant density distributions derived from English Housing Survey data”, Fire Safety Journal, 2019. DOI: https://doi.org/10.1016/j.firesaf.2019.01.010
4
Figure 1: Probability of a given number of agents modelled for 1 to 3 bed apartment layouts, as used in NF 19 [21].
Table 1 provides the mean number of agents (and standard deviation) modelled for each NF 19 case,
and the equivalent mean occupant density and mean agents per bedroom. The mean occupant density
ranges from 23.4 m2/person for a one-bedroom apartment to 80.4 m2/person for three-bedrooms. When
excluding scenarios which considered the possibility of zero agents, these values reduce (i.e. there is
an increase in density) to 20.1 m2/person and 72.8 m2/person for one-bedroom and three-bedroom
apartments, respectively.
Table 1: Mean occupant densities and agents per bedroom modelled in NF 19 [21].
Apartment Floor area
(m2) Mean number of
agents Standard deviation
Mean occupant density (m2/person)
Mean agents per bedroom
1 bedroom (1c) 32 1.370 0.90 23.4 1.37
2 bedroom (2c) 80 1.630 1.12 49.1 0.82
3 bedroom (3c) 192 2.389 1.53 80.4 0.80
For the above occupancies, the evacuation time of simulated agents to escape from apartments ranged
from less than 2 min to more than 20 min [21], although this would have been influenced by other
parameters and in many instances the agents remained ‘trapped’ within the apartment until FRS arrival.
From NF 19 it was determined that open-plan apartment arrangements could achieve an improved level
of safety relative to guidance recommendations with the additional measures of residential sprinkler
protection and an enhanced automatic detection and alarm system. For example, for Case 3 it was
found that a typical guidance-based protected entrance hall design produced a “weighted average”
fractional effective dose (FED) (described as the sum of the dose received by all the people affected by
the fire) of 8.6 compared to 1.4 for the open-plan sprinkler protected equivalent. The recommendations
for open-plan apartments were later adopted in BS 9991 [7]. By simulating the consequences of fire for
occupants using probabilistic inputs for parameters including the number of occupants at risk, NF 19
provides an example application of occupant density distributions and indicates the importance of their
role in residential design. However, NF 19 does not detail the origins or reasoning behind its selected
values for the number of agents simulated.
Accepted manuscript: Hopkin, C., Spearpoint, M., Hopkin, D., Wang, Y. “Residential occupant density distributions derived from English Housing Survey data”, Fire Safety Journal, 2019. DOI: https://doi.org/10.1016/j.firesaf.2019.01.010
5
2 ENGLISH HOUSING SURVEY
As reviewed in Section 1, residential occupant density distributions or occupant load factors are not
specified in several commonly adopted design references. In addition, it is difficult to source the origins
of the occupant load factors which are available, such as those described in NFPA 101 and the IBC.
The absence of such information highlights the importance in determining appropriate occupant density
distributions for confident application in modern design.
The research study presented herein is based on recent data from the EHS. This is a continuous
national survey commissioned by the Ministry of Housing, Communities and Local Government
(MHCLG). For the survey, a sample of addresses is drawn randomly from a list of private addresses
held by the Royal Mail, where householders are invited to participate. The survey itself consists of a
household interview and a physical inspection of a sub-sample of the properties, undertaken by a
qualified surveyor [22]. Each two-year rolling sample consists of approximately 12,000 properties, with
the full contents of each survey made available yearly online via the UK Data Service. As each yearly
presentation of data consists of two-years of data of a rolling sample, to avoid the ‘double counting’ it is
recommended that datasets only be considered in two-year intervals. Therefore, the analyses herein
consider the years 2008 [23], 2010 [24], 2012 [25], 2014 [26] and 2016 [27]. The references given ( [23]
- [27]) provide the Statistical Package for the Social Sciences (SPSS) data given by the UK Data
Service, where the full dataset across all years has been adopted for the analyses unless otherwise
specified. The raw data for each year includes separate datasets, where one dataset involves the
physical inspection of the property and another includes interview data – which includes the details of
occupants residing in the property. Within these separate datasets, specific properties can be
recognised by a unique identifier number and therefore datasets can be combined. For the purposes of
this paper, instances have been excluded where both physical inspection and interview data are not
available for a property.
The survey contains information on up to 154 variables, including building typology, building age,
useable floor area (using the definition given in the Building Regulations of England and Wales,
discussed later), number of bedrooms, number of floors and household composition including total
number of occupants. For the analyses described herein, the variables of interest have been reduced
to building typology (also referred to as dwelling type), number of bedrooms and number of occupants
in the property. While the survey specifies building typology for eight different types (e.g. end-terrace,
mid-terrace, detached etc.), this has been condensed to just three: (1) ‘High-rise apartments’, (2) ‘low-
rise apartments’ and (3) ‘Houses or bungalows’. These three building types have been considered as
fire engineers and consultants are more typically involved in the design of blocks of apartments (both
high-rise and low-rise) while detailed analyses of single family houses, such as terraced and detached,
is uncommon. The three typologies have been simplified and referred to herein as ‘high-rise’, ‘low-rise’
and ‘houses’, respectively. When all combined, they are referred to as ‘all dwellings’ and high-rise and
low-rise apartments combined are referred to simply as ‘apartments’. The EHS refers to any purpose-
built block of apartments of six or more storeys (approximately 18 m or taller) as high-rise, and any
below six storeys as low-rise. This definition aligns with UK guidance-based recommendations, where
a building greater than 18 m in height is recommended by ADB to include a firefighting shaft, which is
discussed later in the calculation of occupant load for exemplar buildings (Table 7).
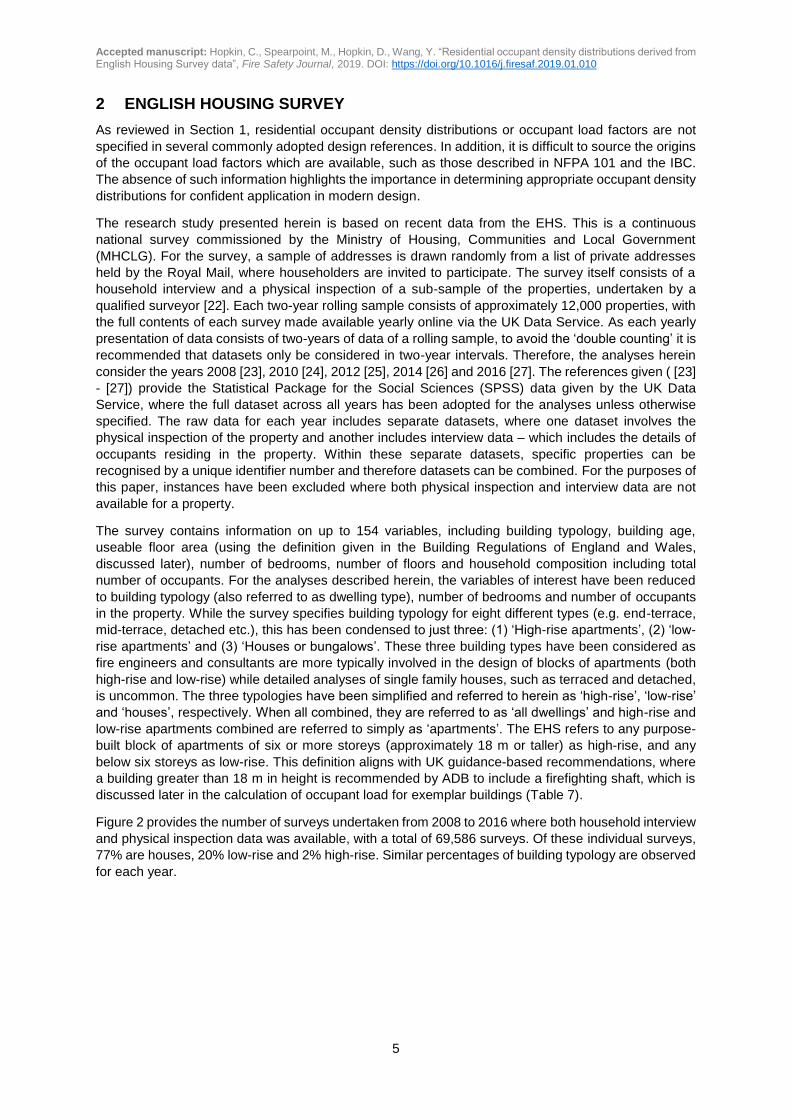
Figure 2 provides the number of surveys undertaken from 2008 to 2016 where both household interview
and physical inspection data was available, with a total of 69,586 surveys. Of these individual surveys,
77% are houses, 20% low-rise and 2% high-rise. Similar percentages of building typology are observed
for each year.
Accepted manuscript: Hopkin, C., Spearpoint, M., Hopkin, D., Wang, Y. “Residential occupant density distributions derived from English Housing Survey data”, Fire Safety Journal, 2019. DOI: https://doi.org/10.1016/j.firesaf.2019.01.010
6
Figure 2: Types of property surveyed in EHS (2008-2016).
3 GROSS FLOOR AREA
A commonly adopted approach in fire engineering design is to calculate the occupant load of a building
based on the floor area, with guidance documents providing an occupant load factor typically using
units of m2/person or person/m2. This approach is used for a wide range of building types.
The EHS provides the gross floor area for each surveyed property. The floor area is measured based
on the Building Regulations definition for total floor area (TFA), consistent with the Royal Institution of
Chartered Surveyors (RICS) for gross internal floor area. The floor area therefore represents the total
area of all enclosed spaces measured to the internal face of the external walls at each floor level [28]
of an individual dwelling or apartment. The floor areas given in the EHS therefore do not represent a
building in its entirety unless the building itself is a single dwelling.
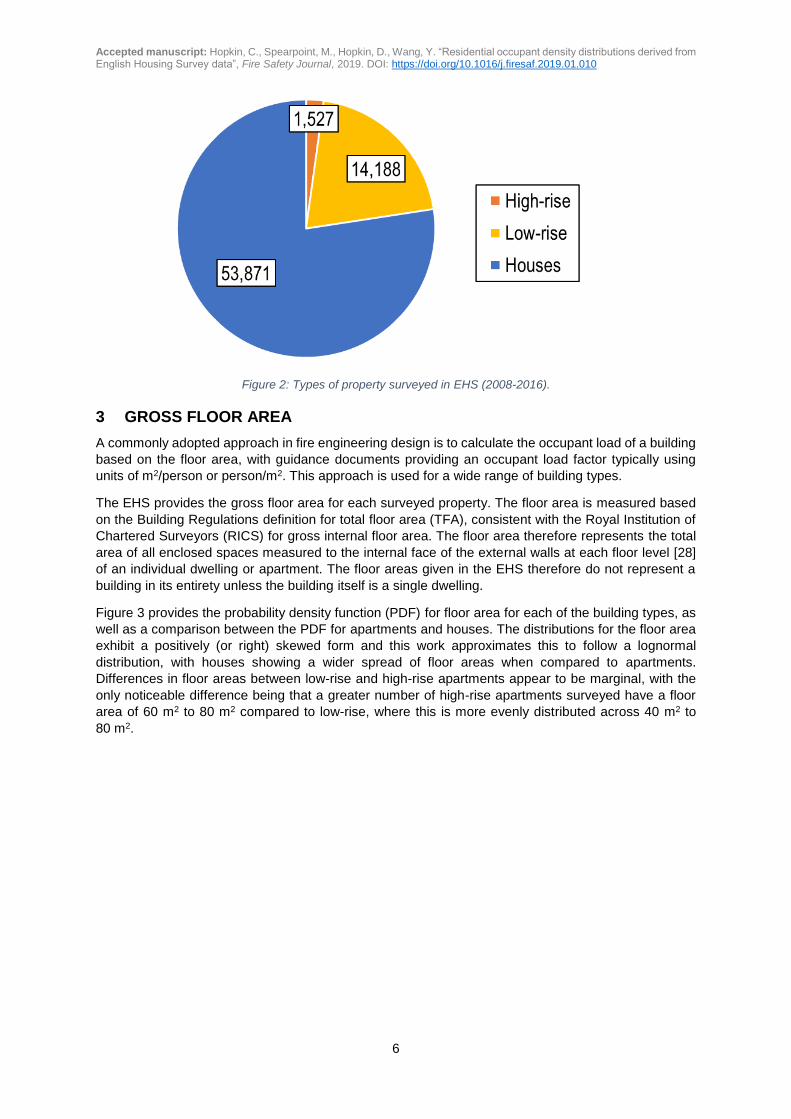
Figure 3 provides the probability density function (PDF) for floor area for each of the building types, as
well as a comparison between the PDF for apartments and houses. The distributions for the floor area
exhibit a positively (or right) skewed form and this work approximates this to follow a lognormal
distribution, with houses showing a wider spread of floor areas when compared to apartments.
Differences in floor areas between low-rise and high-rise apartments appear to be marginal, with the
only noticeable difference being that a greater number of high-rise apartments surveyed have a floor
area of 60 m2 to 80 m2 compared to low-rise, where this is more evenly distributed across 40 m2 to
80 m2.
Accepted manuscript: Hopkin, C., Spearpoint, M., Hopkin, D., Wang, Y. “Residential occupant density distributions derived from English Housing Survey data”, Fire Safety Journal, 2019. DOI: https://doi.org/10.1016/j.firesaf.2019.01.010
7
a) All dwellings
b) Apartments
c) High-rise
d) Low-rise
e) Houses
f) Apartments vs. houses
Figure 3: PDF for floor area based on building type.
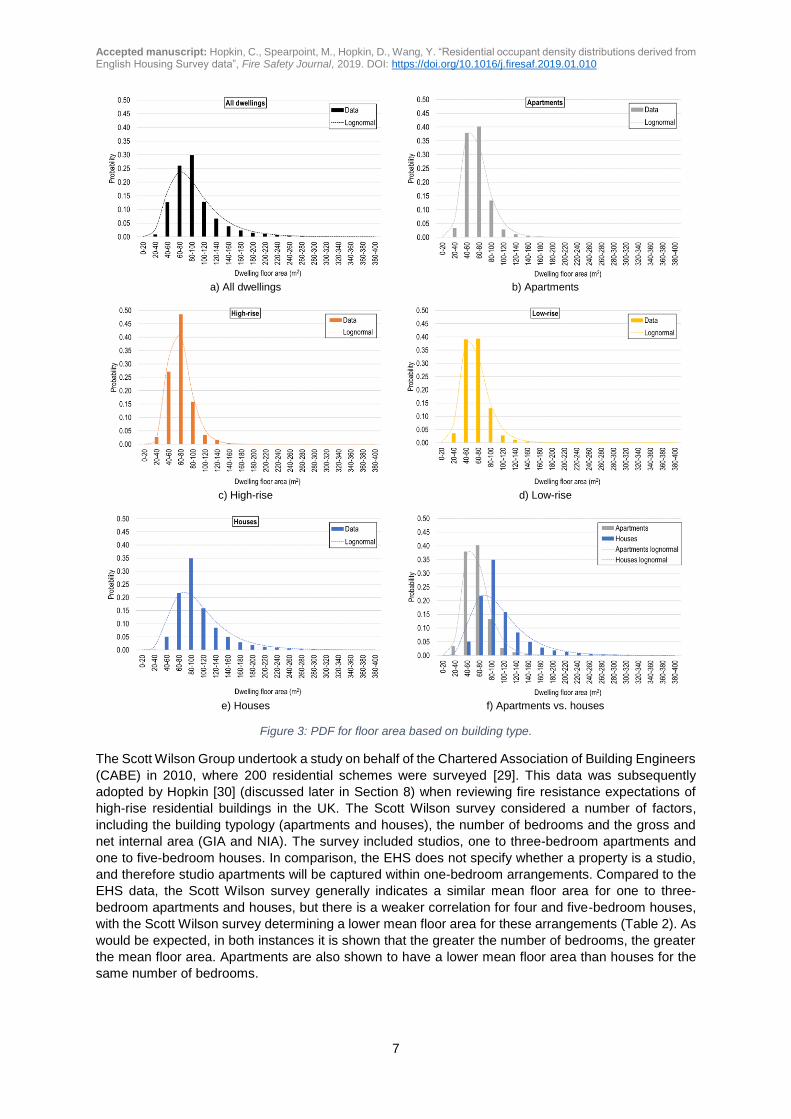
The Scott Wilson Group undertook a study on behalf of the Chartered Association of Building Engineers
(CABE) in 2010, where 200 residential schemes were surveyed [29]. This data was subsequently
adopted by Hopkin [30] (discussed later in Section 8) when reviewing fire resistance expectations of
high-rise residential buildings in the UK. The Scott Wilson survey considered a number of factors,
including the building typology (apartments and houses), the number of bedrooms and the gross and
net internal area (GIA and NIA). The survey included studios, one to three-bedroom apartments and
one to five-bedroom houses. In comparison, the EHS does not specify whether a property is a studio,
and therefore studio apartments will be captured within one-bedroom arrangements. Compared to the
EHS data, the Scott Wilson survey generally indicates a similar mean floor area for one to three-
bedroom apartments and houses, but there is a weaker correlation for four and five-bedroom houses,
with the Scott Wilson survey determining a lower mean floor area for these arrangements (Table 2). As
would be expected, in both instances it is shown that the greater the number of bedrooms, the greater
the mean floor area. Apartments are also shown to have a lower mean floor area than houses for the
same number of bedrooms.
Accepted manuscript: Hopkin, C., Spearpoint, M., Hopkin, D., Wang, Y. “Residential occupant density distributions derived from English Housing Survey data”, Fire Safety Journal, 2019. DOI: https://doi.org/10.1016/j.firesaf.2019.01.010
8
Table 2: Comparison of mean floor areas, Scott Wilson survey [29] against EHS.
Typology
Scott Wilson EHS
Number of samples
Mean floor area (m2)
Number of samples
Mean floor area (m2)
Std. dev. (m2)
Studio 4 32.1 Not specified
One-bedroom apartment 30 46.6 7,099 44.9 16.6
Two-bedroom apartment 29 60.7 7,061 62.9 14.6
Three-bedroom apartment 11 86.5 1,309 81.9 24.5
One-bedroom house 8 64.3 2,227 50.1 26.6
Two-bedroom house 31 71.2 12,751 68.7 18.6
Three-bedroom house 32 95.6 26,578 88.7 24.4
Four-bedroom house 30 120.6 8,144 136.6 47.8
Five-bedroom house 25 163.5 1,942 198.2 80.4
4 NUMBER OF BEDROOMS
The occupant load for residential design may also be determined by assessing the number of occupants
from the number of available bedrooms. In many instances the designer will be aware of the number of
bedrooms to be included in a residential building, although this cannot be guaranteed in all cases, such
as where the design might require greater flexibility for future changes in internal apartment
arrangements.
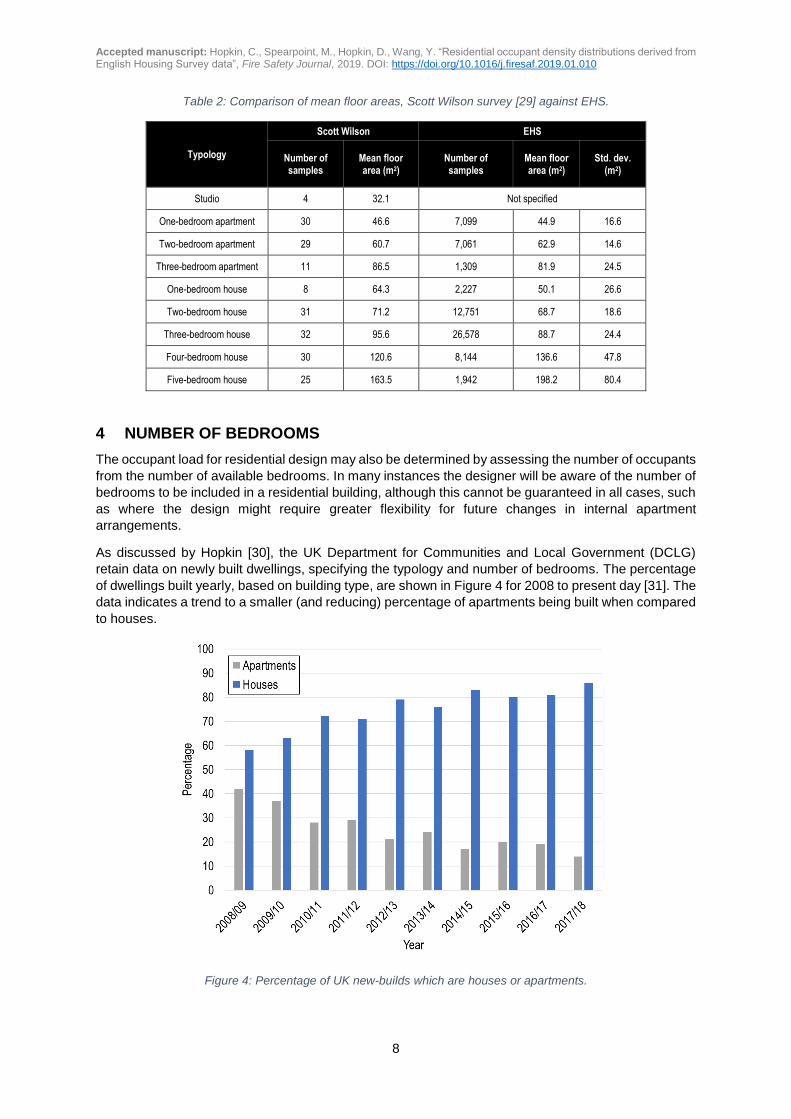
As discussed by Hopkin [30], the UK Department for Communities and Local Government (DCLG)
retain data on newly built dwellings, specifying the typology and number of bedrooms. The percentage
of dwellings built yearly, based on building type, are shown in Figure 4 for 2008 to present day [31]. The
data indicates a trend to a smaller (and reducing) percentage of apartments being built when compared
to houses.
Figure 4: Percentage of UK new-builds which are houses or apartments.
Accepted manuscript: Hopkin, C., Spearpoint, M., Hopkin, D., Wang, Y. “Residential occupant density distributions derived from English Housing Survey data”, Fire Safety Journal, 2019. DOI: https://doi.org/10.1016/j.firesaf.2019.01.010
9
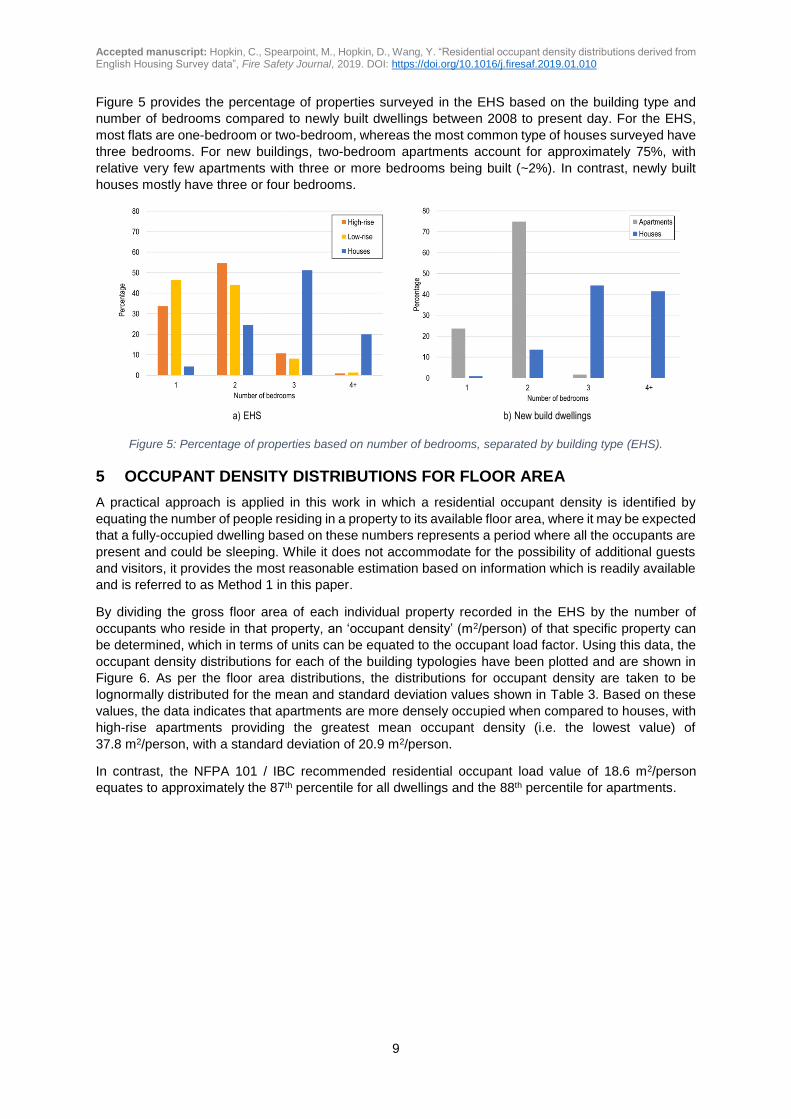
Figure 5 provides the percentage of properties surveyed in the EHS based on the building type and
number of bedrooms compared to newly built dwellings between 2008 to present day. For the EHS,
most flats are one-bedroom or two-bedroom, whereas the most common type of houses surveyed have
three bedrooms. For new buildings, two-bedroom apartments account for approximately 75%, with
relative very few apartments with three or more bedrooms being built (~2%). In contrast, newly built
houses mostly have three or four bedrooms.
a) EHS
b) New build dwellings
Figure 5: Percentage of properties based on number of bedrooms, separated by building type (EHS).
5 OCCUPANT DENSITY DISTRIBUTIONS FOR FLOOR AREA
A practical approach is applied in this work in which a residential occupant density is identified by
equating the number of people residing in a property to its available floor area, where it may be expected
that a fully-occupied dwelling based on these numbers represents a period where all the occupants are
present and could be sleeping. While it does not accommodate for the possibility of additional guests
and visitors, it provides the most reasonable estimation based on information which is readily available
and is referred to as Method 1 in this paper.
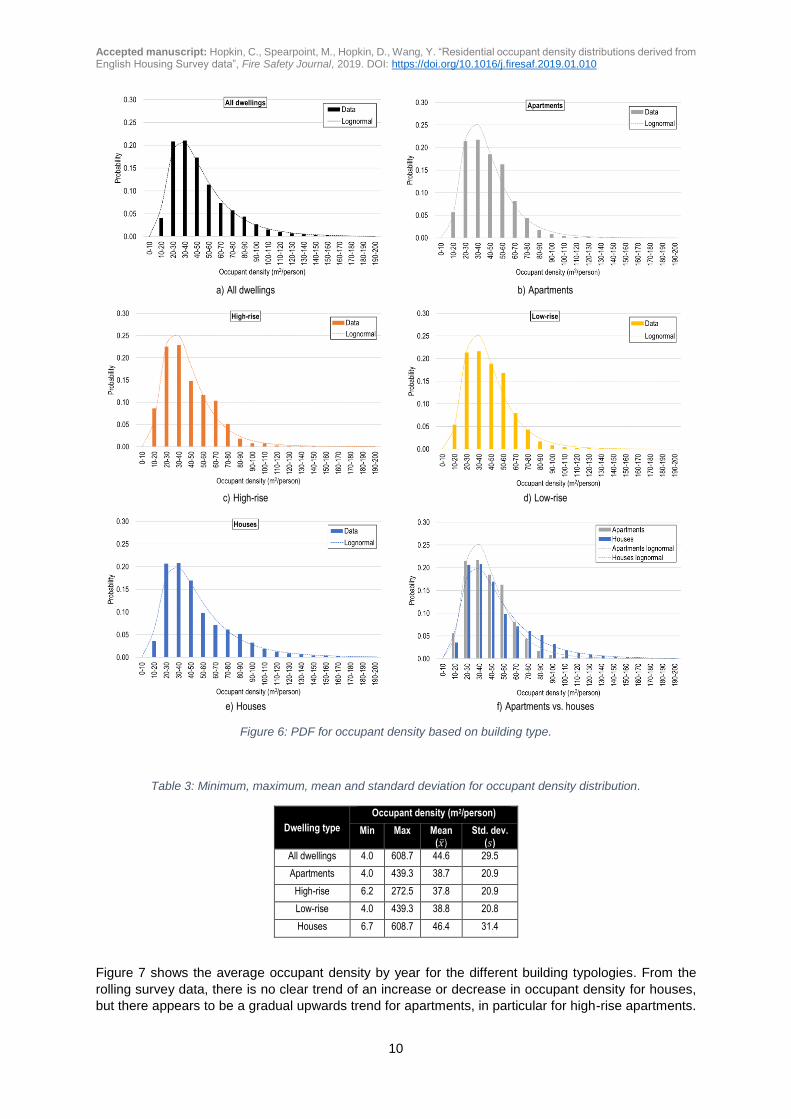
By dividing the gross floor area of each individual property recorded in the EHS by the number of
occupants who reside in that property, an ‘occupant density’ (m2/person) of that specific property can
be determined, which in terms of units can be equated to the occupant load factor. Using this data, the
occupant density distributions for each of the building typologies have been plotted and are shown in
Figure 6. As per the floor area distributions, the distributions for occupant density are taken to be
lognormally distributed for the mean and standard deviation values shown in Table 3. Based on these
values, the data indicates that apartments are more densely occupied when compared to houses, with
high-rise apartments providing the greatest mean occupant density (i.e. the lowest value) of
37.8 m2/person, with a standard deviation of 20.9 m2/person.
In contrast, the NFPA 101 / IBC recommended residential occupant load value of 18.6 m2/person
equates to approximately the 87th percentile for all dwellings and the 88th percentile for apartments.
Accepted manuscript: Hopkin, C., Spearpoint, M., Hopkin, D., Wang, Y. “Residential occupant density distributions derived from English Housing Survey data”, Fire Safety Journal, 2019. DOI: https://doi.org/10.1016/j.firesaf.2019.01.010
10
a) All dwellings
b) Apartments
c) High-rise
d) Low-rise
e) Houses
f) Apartments vs. houses
Figure 6: PDF for occupant density based on building type.
Table 3: Minimum, maximum, mean and standard deviation for occupant density distribution.
Dwelling type
Occupant density (m2/person)
Min Max Mean (�̅�)
Std. dev. (𝑠)
All dwellings 4.0 608.7 44.6 29.5
Apartments 4.0 439.3 38.7 20.9
High-rise 6.2 272.5 37.8 20.9
Low-rise 4.0 439.3 38.8 20.8
Houses 6.7 608.7 46.4 31.4
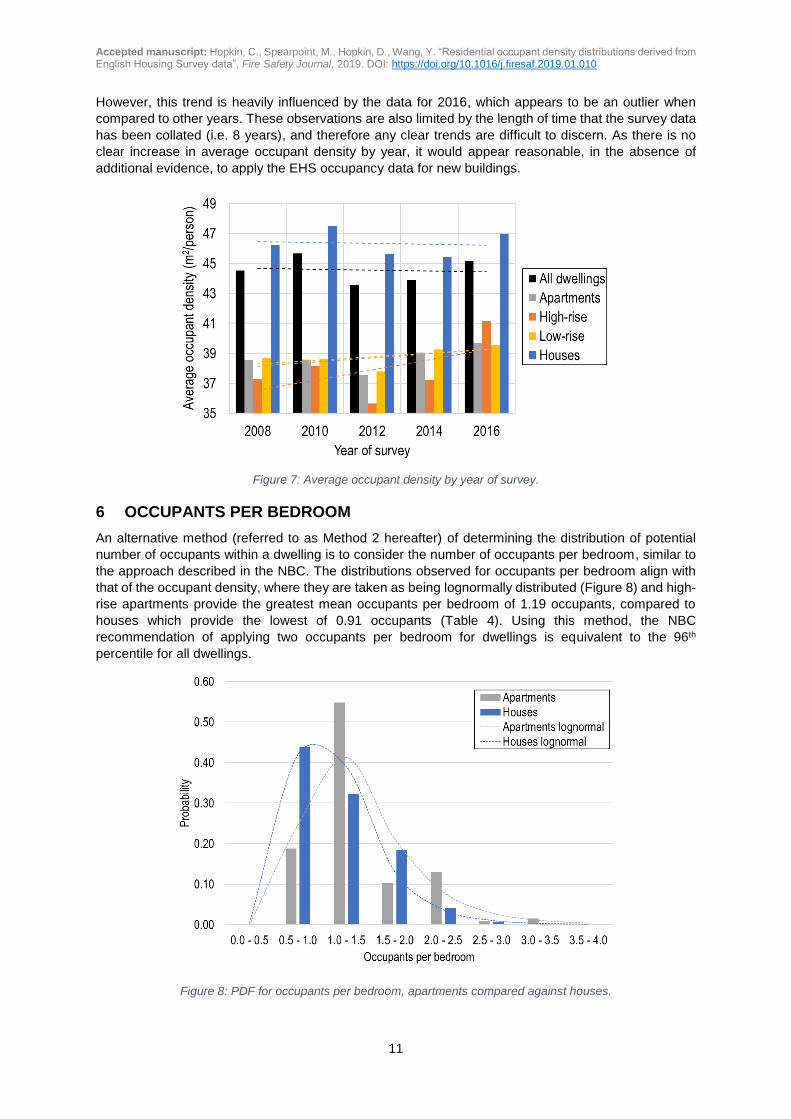
Figure 7 shows the average occupant density by year for the different building typologies. From the
rolling survey data, there is no clear trend of an increase or decrease in occupant density for houses,
but there appears to be a gradual upwards trend for apartments, in particular for high-rise apartments.
Accepted manuscript: Hopkin, C., Spearpoint, M., Hopkin, D., Wang, Y. “Residential occupant density distributions derived from English Housing Survey data”, Fire Safety Journal, 2019. DOI: https://doi.org/10.1016/j.firesaf.2019.01.010
11
However, this trend is heavily influenced by the data for 2016, which appears to be an outlier when
compared to other years. These observations are also limited by the length of time that the survey data
has been collated (i.e. 8 years), and therefore any clear trends are difficult to discern. As there is no
clear increase in average occupant density by year, it would appear reasonable, in the absence of
additional evidence, to apply the EHS occupancy data for new buildings.
Figure 7: Average occupant density by year of survey.
6 OCCUPANTS PER BEDROOM
An alternative method (referred to as Method 2 hereafter) of determining the distribution of potential
number of occupants within a dwelling is to consider the number of occupants per bedroom, similar to
the approach described in the NBC. The distributions observed for occupants per bedroom align with
that of the occupant density, where they are taken as being lognormally distributed (Figure 8) and high-
rise apartments provide the greatest mean occupants per bedroom of 1.19 occupants, compared to
houses which provide the lowest of 0.91 occupants (Table 4). Using this method, the NBC
recommendation of applying two occupants per bedroom for dwellings is equivalent to the 96th
percentile for all dwellings.
Figure 8: PDF for occupants per bedroom, apartments compared against houses.
Accepted manuscript: Hopkin, C., Spearpoint, M., Hopkin, D., Wang, Y. “Residential occupant density distributions derived from English Housing Survey data”, Fire Safety Journal, 2019. DOI: https://doi.org/10.1016/j.firesaf.2019.01.010
12
Table 4: Minimum, maximum, mean and standard deviation for occupants per bedroom.
Dwelling type
Occupants per bedroom
Min Max Mean (�̅�)
Std. dev. (𝑠)
All dwellings 0.1 7.0 0.97 0.49
Apartments 0.2 7.0 1.15 0.57
High-rise 0.3 7.0 1.19 0.67
Low-rise 0.2 7.0 1.14 0.55
Houses 0.1 5.0 0.91 0.45
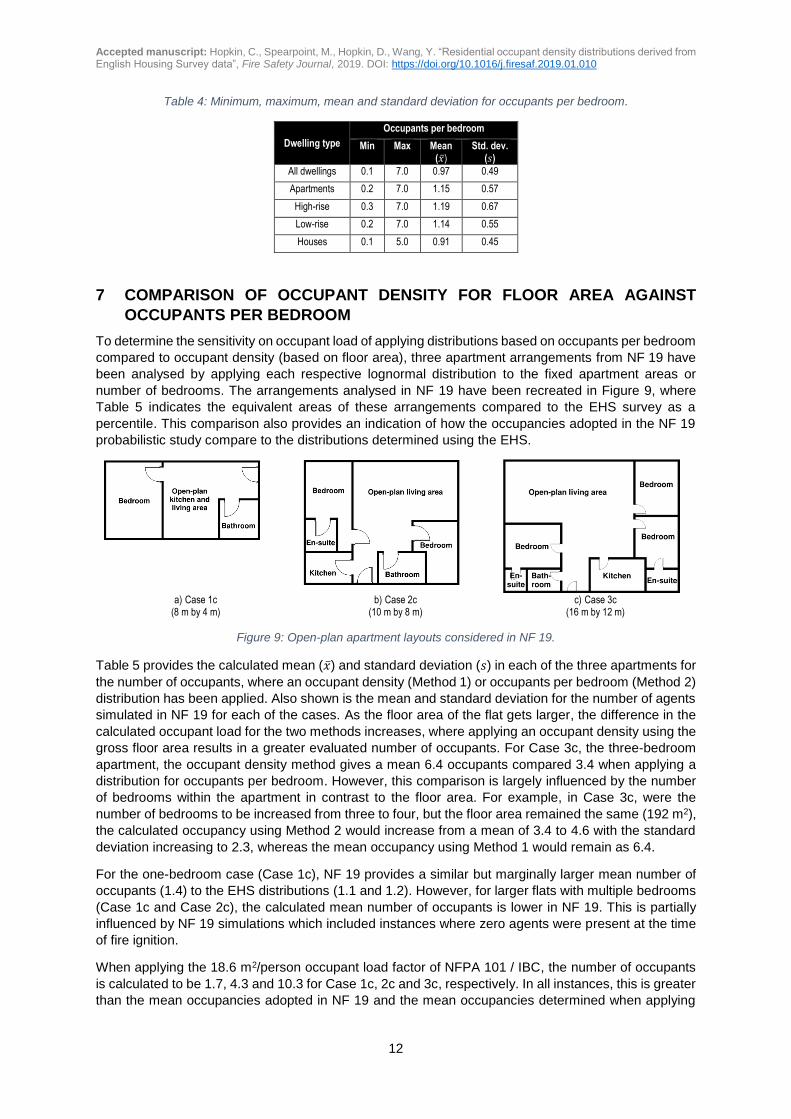
7 COMPARISON OF OCCUPANT DENSITY FOR FLOOR AREA AGAINST
OCCUPANTS PER BEDROOM
To determine the sensitivity on occupant load of applying distributions based on occupants per bedroom
compared to occupant density (based on floor area), three apartment arrangements from NF 19 have
been analysed by applying each respective lognormal distribution to the fixed apartment areas or
number of bedrooms. The arrangements analysed in NF 19 have been recreated in Figure 9, where
Table 5 indicates the equivalent areas of these arrangements compared to the EHS survey as a
percentile. This comparison also provides an indication of how the occupancies adopted in the NF 19
probabilistic study compare to the distributions determined using the EHS.
a) Case 1c (8 m by 4 m)
b) Case 2c (10 m by 8 m)
c) Case 3c (16 m by 12 m)
Figure 9: Open-plan apartment layouts considered in NF 19.
Table 5 provides the calculated mean (�̅�) and standard deviation (𝑠) in each of the three apartments for
the number of occupants, where an occupant density (Method 1) or occupants per bedroom (Method 2)
distribution has been applied. Also shown is the mean and standard deviation for the number of agents
simulated in NF 19 for each of the cases. As the floor area of the flat gets larger, the difference in the
calculated occupant load for the two methods increases, where applying an occupant density using the
gross floor area results in a greater evaluated number of occupants. For Case 3c, the three-bedroom
apartment, the occupant density method gives a mean 6.4 occupants compared 3.4 when applying a
distribution for occupants per bedroom. However, this comparison is largely influenced by the number
of bedrooms within the apartment in contrast to the floor area. For example, in Case 3c, were the
number of bedrooms to be increased from three to four, but the floor area remained the same (192 m2),
the calculated occupancy using Method 2 would increase from a mean of 3.4 to 4.6 with the standard
deviation increasing to 2.3, whereas the mean occupancy using Method 1 would remain as 6.4.
For the one-bedroom case (Case 1c), NF 19 provides a similar but marginally larger mean number of
occupants (1.4) to the EHS distributions (1.1 and 1.2). However, for larger flats with multiple bedrooms
(Case 1c and Case 2c), the calculated mean number of occupants is lower in NF 19. This is partially
influenced by NF 19 simulations which included instances where zero agents were present at the time
of fire ignition.
When applying the 18.6 m2/person occupant load factor of NFPA 101 / IBC, the number of occupants
is calculated to be 1.7, 4.3 and 10.3 for Case 1c, 2c and 3c, respectively. In all instances, this is greater
than the mean occupancies adopted in NF 19 and the mean occupancies determined when applying
Accepted manuscript: Hopkin, C., Spearpoint, M., Hopkin, D., Wang, Y. “Residential occupant density distributions derived from English Housing Survey data”, Fire Safety Journal, 2019. DOI: https://doi.org/10.1016/j.firesaf.2019.01.010
13
the EHS-based methods. The same is also true when applying the NBC two occupants per bedroom
approach, except for in Case 3c, where applying Method 1 results in a marginally greater mean
occupancy.
Table 5: Calculated mean and standard deviation for number of occupants in three NF 19 apartments.
Case Dimensions Area Equivalent EHS apartment floor area percentile
Bedrooms NF 19 Applying
occupant density (Method 1)
Applying occupants per bedroom (Method 2)
Case 1c 8 m by 4 m 32 m2 4th percentile 1 �̅�: 1.4 𝑠: 0.9
�̅�: 1.1 𝑠: 0.6
�̅�: 1.2 𝑠: 0.6
Case 2c 10 m by 8 m 80 m2 54th percentile 2 �̅�: 1.6 𝑠: 1.1
�̅�: 2.7 𝑠: 1.5
�̅�: 2.3 𝑠: 1.2
Case 3c 16 m by 12 m 192 m2 97th percentile 3 �̅�: 2.4 𝑠: 1.5
�̅�: 6.4 𝑠: 3.5
�̅�: 3.4 𝑠: 1.7
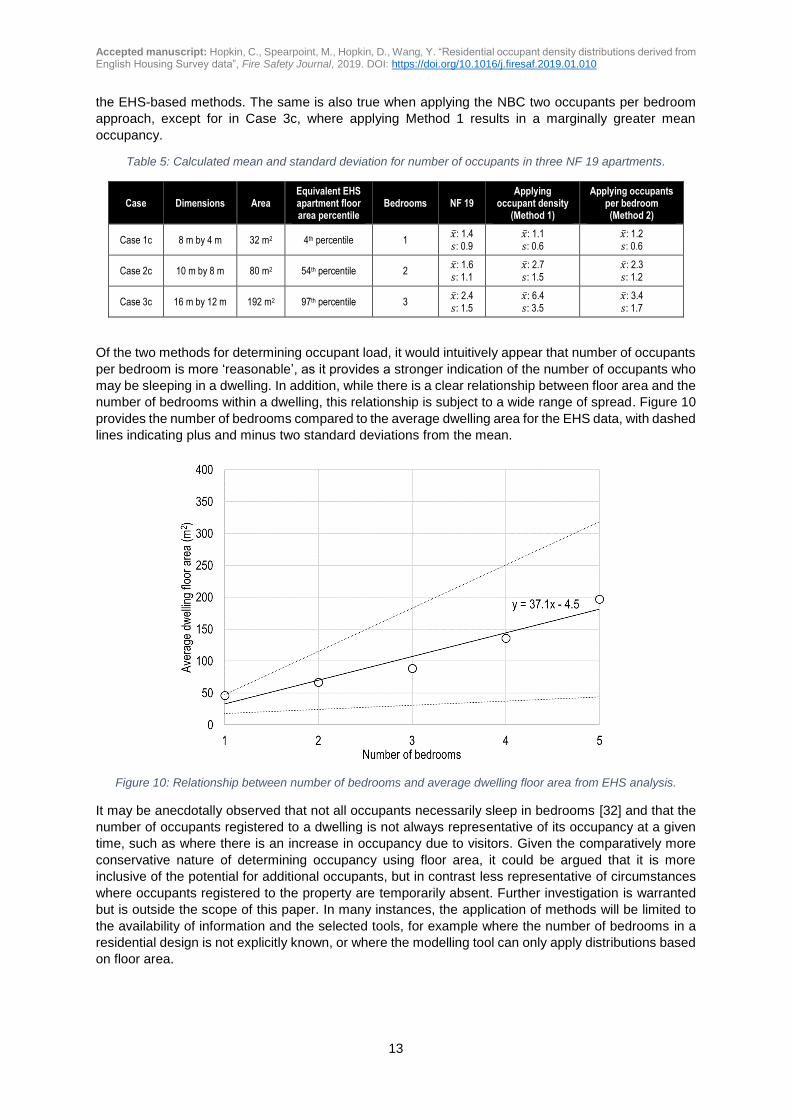
Of the two methods for determining occupant load, it would intuitively appear that number of occupants
per bedroom is more ‘reasonable’, as it provides a stronger indication of the number of occupants who
may be sleeping in a dwelling. In addition, while there is a clear relationship between floor area and the
number of bedrooms within a dwelling, this relationship is subject to a wide range of spread. Figure 10
provides the number of bedrooms compared to the average dwelling area for the EHS data, with dashed
lines indicating plus and minus two standard deviations from the mean.
Figure 10: Relationship between number of bedrooms and average dwelling floor area from EHS analysis.
It may be anecdotally observed that not all occupants necessarily sleep in bedrooms [32] and that the
number of occupants registered to a dwelling is not always representative of its occupancy at a given
time, such as where there is an increase in occupancy due to visitors. Given the comparatively more
conservative nature of determining occupancy using floor area, it could be argued that it is more
inclusive of the potential for additional occupants, but in contrast less representative of circumstances
where occupants registered to the property are temporarily absent. Further investigation is warranted
but is outside the scope of this paper. In many instances, the application of methods will be limited to
the availability of information and the selected tools, for example where the number of bedrooms in a
residential design is not explicitly known, or where the modelling tool can only apply distributions based
on floor area.
Accepted manuscript: Hopkin, C., Spearpoint, M., Hopkin, D., Wang, Y. “Residential occupant density distributions derived from English Housing Survey data”, Fire Safety Journal, 2019. DOI: https://doi.org/10.1016/j.firesaf.2019.01.010
14
8 OCCUPANT LOAD OF EXEMPLAR RESIDENTIAL BUILDINGS
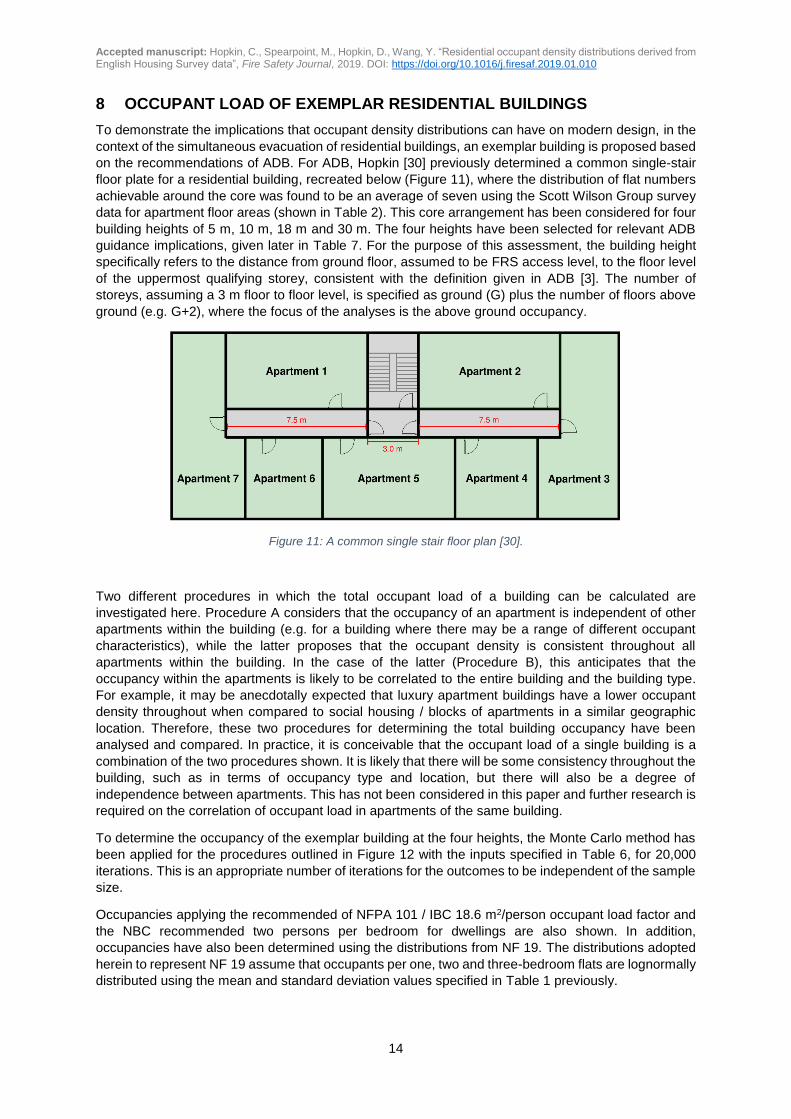
To demonstrate the implications that occupant density distributions can have on modern design, in the
context of the simultaneous evacuation of residential buildings, an exemplar building is proposed based
on the recommendations of ADB. For ADB, Hopkin [30] previously determined a common single-stair
floor plate for a residential building, recreated below (Figure 11), where the distribution of flat numbers
achievable around the core was found to be an average of seven using the Scott Wilson Group survey
data for apartment floor areas (shown in Table 2). This core arrangement has been considered for four
building heights of 5 m, 10 m, 18 m and 30 m. The four heights have been selected for relevant ADB
guidance implications, given later in Table 7. For the purpose of this assessment, the building height
specifically refers to the distance from ground floor, assumed to be FRS access level, to the floor level
of the uppermost qualifying storey, consistent with the definition given in ADB [3]. The number of
storeys, assuming a 3 m floor to floor level, is specified as ground (G) plus the number of floors above
ground (e.g. G+2), where the focus of the analyses is the above ground occupancy.
Figure 11: A common single stair floor plan [30].
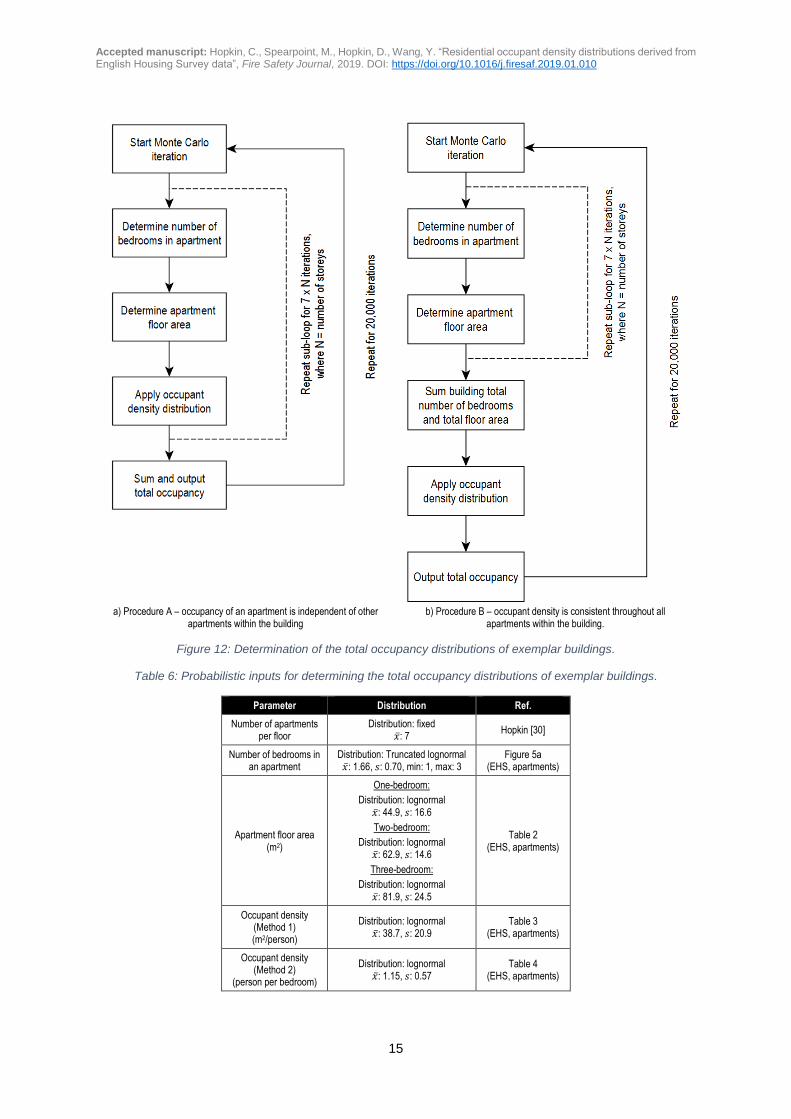
Two different procedures in which the total occupant load of a building can be calculated are
investigated here. Procedure A considers that the occupancy of an apartment is independent of other
apartments within the building (e.g. for a building where there may be a range of different occupant
characteristics), while the latter proposes that the occupant density is consistent throughout all
apartments within the building. In the case of the latter (Procedure B), this anticipates that the
occupancy within the apartments is likely to be correlated to the entire building and the building type.
For example, it may be anecdotally expected that luxury apartment buildings have a lower occupant
density throughout when compared to social housing / blocks of apartments in a similar geographic
location. Therefore, these two procedures for determining the total building occupancy have been
analysed and compared. In practice, it is conceivable that the occupant load of a single building is a
combination of the two procedures shown. It is likely that there will be some consistency throughout the
building, such as in terms of occupancy type and location, but there will also be a degree of
independence between apartments. This has not been considered in this paper and further research is
required on the correlation of occupant load in apartments of the same building.
To determine the occupancy of the exemplar building at the four heights, the Monte Carlo method has
been applied for the procedures outlined in Figure 12 with the inputs specified in Table 6, for 20,000
iterations. This is an appropriate number of iterations for the outcomes to be independent of the sample
size.
Occupancies applying the recommended of NFPA 101 / IBC 18.6 m2/person occupant load factor and
the NBC recommended two persons per bedroom for dwellings are also shown. In addition,
occupancies have also been determined using the distributions from NF 19. The distributions adopted
herein to represent NF 19 assume that occupants per one, two and three-bedroom flats are lognormally
distributed using the mean and standard deviation values specified in Table 1 previously.
Accepted manuscript: Hopkin, C., Spearpoint, M., Hopkin, D., Wang, Y. “Residential occupant density distributions derived from English Housing Survey data”, Fire Safety Journal, 2019. DOI: https://doi.org/10.1016/j.firesaf.2019.01.010
15
a) Procedure A – occupancy of an apartment is independent of other
apartments within the building
b) Procedure B – occupant density is consistent throughout all apartments within the building.
Figure 12: Determination of the total occupancy distributions of exemplar buildings.
Table 6: Probabilistic inputs for determining the total occupancy distributions of exemplar buildings.
Parameter Distribution Ref.
Number of apartments per floor
Distribution: fixed �̅�: 7
Hopkin [30]
Number of bedrooms in an apartment
Distribution: Truncated lognormal �̅�: 1.66, 𝑠: 0.70, min: 1, max: 3
Figure 5a (EHS, apartments)
Apartment floor area (m2)
One-bedroom:
Distribution: lognormal �̅�: 44.9, 𝑠: 16.6
Two-bedroom:
Distribution: lognormal �̅�: 62.9, 𝑠: 14.6
Three-bedroom:
Distribution: lognormal �̅�: 81.9, 𝑠: 24.5
Table 2 (EHS, apartments)
Occupant density (Method 1) (m2/person)
Distribution: lognormal �̅�: 38.7, 𝑠: 20.9
Table 3 (EHS, apartments)
Occupant density (Method 2)
(person per bedroom)
Distribution: lognormal �̅�: 1.15, 𝑠: 0.57
Table 4 (EHS, apartments)
Accepted manuscript: Hopkin, C., Spearpoint, M., Hopkin, D., Wang, Y. “Residential occupant density distributions derived from English Housing Survey data”, Fire Safety Journal, 2019. DOI: https://doi.org/10.1016/j.firesaf.2019.01.010
16
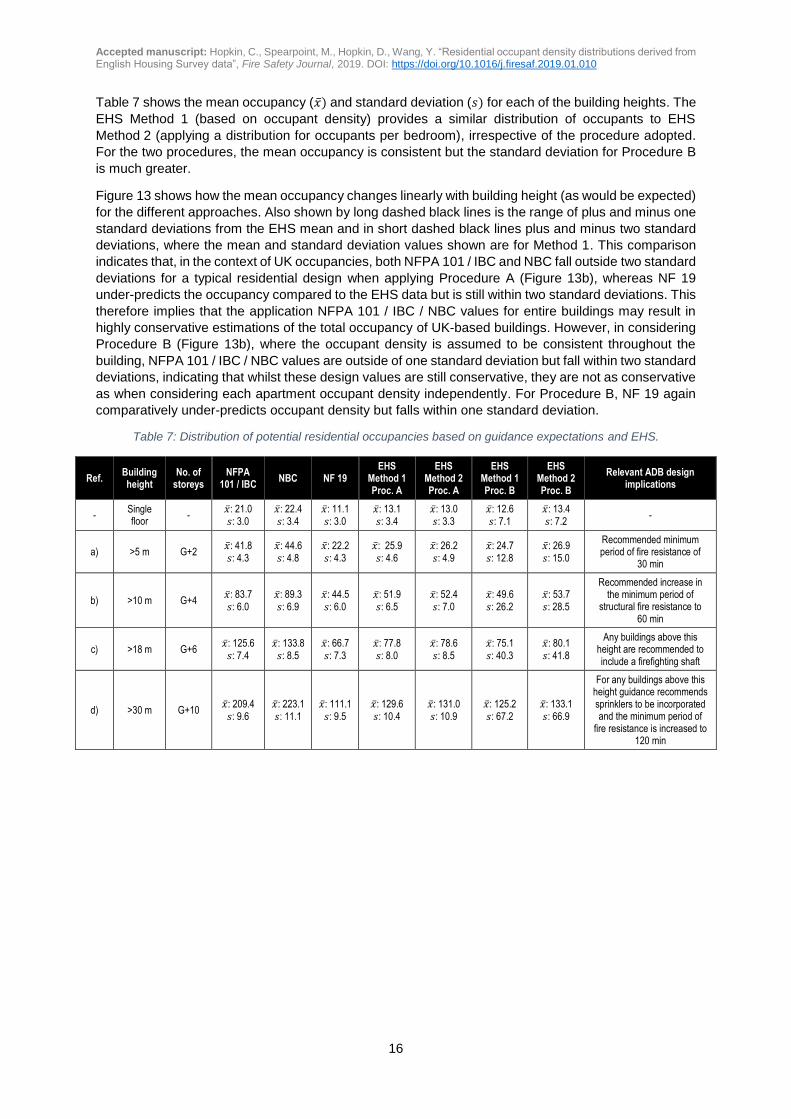
Table 7 shows the mean occupancy (�̅�) and standard deviation (𝑠) for each of the building heights. The
EHS Method 1 (based on occupant density) provides a similar distribution of occupants to EHS
Method 2 (applying a distribution for occupants per bedroom), irrespective of the procedure adopted.
For the two procedures, the mean occupancy is consistent but the standard deviation for Procedure B
is much greater.
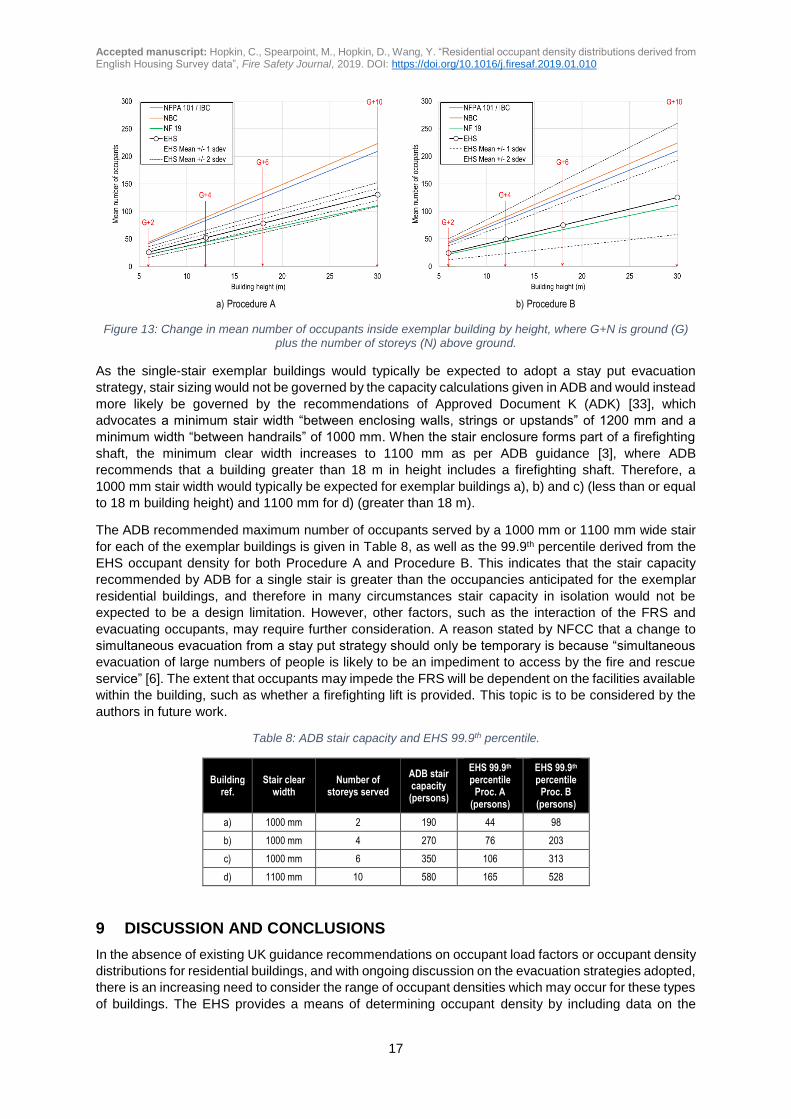
Figure 13 shows how the mean occupancy changes linearly with building height (as would be expected)
for the different approaches. Also shown by long dashed black lines is the range of plus and minus one
standard deviations from the EHS mean and in short dashed black lines plus and minus two standard
deviations, where the mean and standard deviation values shown are for Method 1. This comparison
indicates that, in the context of UK occupancies, both NFPA 101 / IBC and NBC fall outside two standard
deviations for a typical residential design when applying Procedure A (Figure 13b), whereas NF 19
under-predicts the occupancy compared to the EHS data but is still within two standard deviations. This
therefore implies that the application NFPA 101 / IBC / NBC values for entire buildings may result in
highly conservative estimations of the total occupancy of UK-based buildings. However, in considering
Procedure B (Figure 13b), where the occupant density is assumed to be consistent throughout the
building, NFPA 101 / IBC / NBC values are outside of one standard deviation but fall within two standard
deviations, indicating that whilst these design values are still conservative, they are not as conservative
as when considering each apartment occupant density independently. For Procedure B, NF 19 again
comparatively under-predicts occupant density but falls within one standard deviation.
Table 7: Distribution of potential residential occupancies based on guidance expectations and EHS.
Ref. Building height
No. of storeys
NFPA 101 / IBC
NBC NF 19 EHS
Method 1 Proc. A
EHS Method 2 Proc. A
EHS Method 1 Proc. B
EHS Method 2 Proc. B
Relevant ADB design implications
- Single floor
- �̅�: 21.0 𝑠: 3.0
�̅�: 22.4 𝑠: 3.4
�̅�: 11.1 𝑠: 3.0
�̅�: 13.1 𝑠: 3.4
�̅�: 13.0 𝑠: 3.3
�̅�: 12.6 𝑠: 7.1
�̅�: 13.4 𝑠: 7.2
-
a) >5 m G+2 �̅�: 41.8 𝑠: 4.3
�̅�: 44.6 𝑠: 4.8
�̅�: 22.2 𝑠: 4.3
�̅�: 25.9 𝑠: 4.6
�̅�: 26.2 𝑠: 4.9
�̅�: 24.7 𝑠: 12.8
�̅�: 26.9 𝑠: 15.0
Recommended minimum period of fire resistance of
30 min
b) >10 m G+4 �̅�: 83.7 𝑠: 6.0
�̅�: 89.3 𝑠: 6.9
�̅�: 44.5 𝑠: 6.0
�̅�: 51.9 𝑠: 6.5
�̅�: 52.4 𝑠: 7.0
�̅�: 49.6 𝑠: 26.2
�̅�: 53.7 𝑠: 28.5
Recommended increase in the minimum period of
structural fire resistance to 60 min
c) >18 m G+6 �̅�: 125.6 𝑠: 7.4
�̅�: 133.8 𝑠: 8.5
�̅�: 66.7 𝑠: 7.3
�̅�: 77.8 𝑠: 8.0
�̅�: 78.6 𝑠: 8.5
�̅�: 75.1 𝑠: 40.3
�̅�: 80.1 𝑠: 41.8
Any buildings above this height are recommended to include a firefighting shaft
d) >30 m G+10 �̅�: 209.4 𝑠: 9.6
�̅�: 223.1 𝑠: 11.1
�̅�: 111.1 𝑠: 9.5
�̅�: 129.6 𝑠: 10.4
�̅�: 131.0 𝑠: 10.9
�̅�: 125.2 𝑠: 67.2
�̅�: 133.1 𝑠: 66.9
For any buildings above this height guidance recommends sprinklers to be incorporated and the minimum period of
fire resistance is increased to 120 min
Accepted manuscript: Hopkin, C., Spearpoint, M., Hopkin, D., Wang, Y. “Residential occupant density distributions derived from English Housing Survey data”, Fire Safety Journal, 2019. DOI: https://doi.org/10.1016/j.firesaf.2019.01.010
17
a) Procedure A
b) Procedure B
Figure 13: Change in mean number of occupants inside exemplar building by height, where G+N is ground (G) plus the number of storeys (N) above ground.
As the single-stair exemplar buildings would typically be expected to adopt a stay put evacuation
strategy, stair sizing would not be governed by the capacity calculations given in ADB and would instead
more likely be governed by the recommendations of Approved Document K (ADK) [33], which
advocates a minimum stair width “between enclosing walls, strings or upstands” of 1200 mm and a
minimum width “between handrails” of 1000 mm. When the stair enclosure forms part of a firefighting
shaft, the minimum clear width increases to 1100 mm as per ADB guidance [3], where ADB
recommends that a building greater than 18 m in height includes a firefighting shaft. Therefore, a
1000 mm stair width would typically be expected for exemplar buildings a), b) and c) (less than or equal
to 18 m building height) and 1100 mm for d) (greater than 18 m).
The ADB recommended maximum number of occupants served by a 1000 mm or 1100 mm wide stair
for each of the exemplar buildings is given in Table 8, as well as the 99.9th percentile derived from the
EHS occupant density for both Procedure A and Procedure B. This indicates that the stair capacity
recommended by ADB for a single stair is greater than the occupancies anticipated for the exemplar
residential buildings, and therefore in many circumstances stair capacity in isolation would not be
expected to be a design limitation. However, other factors, such as the interaction of the FRS and
evacuating occupants, may require further consideration. A reason stated by NFCC that a change to
simultaneous evacuation from a stay put strategy should only be temporary is because “simultaneous
evacuation of large numbers of people is likely to be an impediment to access by the fire and rescue
service” [6]. The extent that occupants may impede the FRS will be dependent on the facilities available
within the building, such as whether a firefighting lift is provided. This topic is to be considered by the
authors in future work.
Table 8: ADB stair capacity and EHS 99.9th percentile.
Building ref.
Stair clear width
Number of storeys served
ADB stair capacity (persons)
EHS 99.9th percentile
Proc. A (persons)
EHS 99.9th percentile
Proc. B (persons)
a) 1000 mm 2 190 44 98
b) 1000 mm 4 270 76 203
c) 1000 mm 6 350 106 313
d) 1100 mm 10 580 165 528
9 DISCUSSION AND CONCLUSIONS
In the absence of existing UK guidance recommendations on occupant load factors or occupant density
distributions for residential buildings, and with ongoing discussion on the evacuation strategies adopted,
there is an increasing need to consider the range of occupant densities which may occur for these types
of buildings. The EHS provides a means of determining occupant density by including data on the
Accepted manuscript: Hopkin, C., Spearpoint, M., Hopkin, D., Wang, Y. “Residential occupant density distributions derived from English Housing Survey data”, Fire Safety Journal, 2019. DOI: https://doi.org/10.1016/j.firesaf.2019.01.010
18
number of occupants residing in a dwelling, the number of bedrooms and the total floor area of the
dwelling, with approximately 70,000 surveys undertaken between 2008 and 2016. When deriving
distributions from this data, it has been found that occupant density of dwellings can be approximated
by a lognormal distribution, with a mean occupant density for all dwellings of 44.6 m2/person and a
standard deviation of 29.5 m2/person. The occupancy has also been analysed and determined with
respect to the number of bedrooms per dwelling, where for all dwellings this resulted in a mean of 0.97
occupants per bedroom. When considering apartments separately from houses, it is found that
apartments were in general more densely occupied with less spread in occupant density values, with a
mean occupant density of 38.7 m2/person and a standard deviation of 20.9 m2/person.
When considering the two methods of calculating occupancy for example apartment arrangements,
either by using floor area or the number of bedrooms, there is a difference in the calculated values for
occupancy. This difference becomes more prominent for increasing apartment floor area. Applying the
method based on floor area generally results in a comparatively more conservative occupancy, while
determining the occupancy based on number of bedrooms appears more intuitively representative of
what could be expected in reality. The decision between which of these two methods to adopt will be
dependent on the availability of design information, the degree of required conservatism and the
selected analytical tools. Thus, in the absence of information relating to number of bedrooms, an
occupant density distribution using floor area is realistically more likely to provide a conservative
evaluation of occupancy, although this cannot be stated definitively as it is dependent on the floor area
relative to the number of bedrooms.
Spearpoint and Hopkin [5] noted previously, when considering mercantile occupancies, that it is difficult
to discern what percentile UK guidance occupant load factors are intended to represent, and therefore
the recommended residential design values, derived from the EHS, cannot be explicitly stated. De
Sanctis et al. [34] indicated that ADB occupant load factors represent the 99.5 to 99.99th percentiles
(i.e. a probability of exceedance of 0.5% to 0.01%), but these percentiles only considered mercantile
occupancies based on data for shops in Switzerland. In the context of the EHS survey data, these
percentiles equate to an occupant load factor for residential design in the range of 8 m2/person to
4 m2/person, which broadly aligns with the occupant load factors adopted in Hong Kong [16].
When considering the EHS occupant density distributions in the context of exemplar single-stair
residential buildings designed to the recommendations of ADB, the difference in the calculated total
number of occupants when applying a distribution based on the floor area or the number bedrooms
appears to be marginal. A greater impact on the total occupancy is whether the distribution is applied
independently for each apartment or consistently across the full building, in particular for the resultant
standard deviation, although the mean number of occupants is again consistent. It has also been found
that the ADB design capacity of the single stair is unlikely to be exceeded, where for a typical 10-storey
residential building the stair design capacity is shown to be 580 occupants while the equivalent EHS
99.9th percentile is 165 or 528 occupants, depending on whether distributions are applied to apartments
independently or are consistent for the entire building.
This paper provides an example of data informed, transparent residential occupant density distributions
and their impact on occupant load. The distributions determined herein can be used in the future for
other types of probabilistic analyses, which consider the potential likelihood, consequences and risks
associated with fire events on the occupants of residential buildings. One such example is to revisit the
work of Hopkin et al. [35], considering time-dependent failure probability of fire safety systems in
contrast to the expected number of fatalities, for residential design using the revised occupancy data.
Further research is ongoing, using the findings from this paper, in which the extent evacuating
occupants could impede the FRS in the event of a simultaneous evacuation.
REFERENCES
[1] G. V. Hadjisophocleous and J. R. Mehaffey, “Fire Scenarios,” in SFPE Handbook of Fire
Protection Engineering, 5th Edition, Springer, 2015, pp. 1262-1288.
Accepted manuscript: Hopkin, C., Spearpoint, M., Hopkin, D., Wang, Y. “Residential occupant density distributions derived from English Housing Survey data”, Fire Safety Journal, 2019. DOI: https://doi.org/10.1016/j.firesaf.2019.01.010
19
[2] National Fire Protection Association, NFPA 101, Life Safety Code, 2018 Edition, 2017.
[3] HM Government, The Building Regulations 2010, Approved Document B (fire safety) volume 2:
buildings other than dwellinghouses (2006 edition incorporating the 2010 and 2013 amendments),
2013.
[4] Scottish Government, Technical Handbook - Non-Domestic - Fire, 2017.
[5] M. Spearpoint and C. Hopkin, “A Review of Current and Historical Occupant Load Factors for
Mercantile Occupancies,” in European Symposium on Fire Safety Science, Nancy, France, 2018.
[6] National Fire Chiefs Council, “Guidance to support a temporary change to a simultaneous
evacuation strategy in a purpose-built block of flats,” 2018.
[7] British Standard, BS 9991:2015, Fire safety in the design, management and use of residential
buildings: Code of practice, BSI Standards Publication, 2015.
[8] HM Government, The Building Regulations 2010, Approved Document B (fire safety) volume 1:
dwellinghouses (2006 edition incorporating the 2010 and 2013 amendments), 2013.
[9] Scottish Government, Technical Handbook - Domestic - Fire, 2017.
[10] British Standard, BS 9999:2017. Fire safety in the design, management and use of buildings:
Code of practice, BSI Standards Publication, 2017.
[11] National Fire Protection Association, NFPA 1, Fire Code, 2018 Edition, 2017.
[12] International Code Council, 2015 International Building Code, 2014.
[13] Canadian Commission on Building and Fire Codes, National Building Code of Canada Volume 2,
Ottawa: National Research Council of Canada, 2010.
[14] Fire Prevention Department, Civil Defence Regulation, State of Qatar, 2012.
[15] Saudi Building Code SBC 801, The Kingdom of Saudi Arabia, 2007.
[16] Hong Kong Building Authority, “Code of practice for the provisions of means of escape in case of
fire,” 1996.
[17] L. T. Wong, “Occupant Load Assessment for Old Residential High-Rise Buildings,” Architectural
Science Review, vol. 46, no. 3, pp. 273-277, 2003.
[18] Ministry of Business, Innovation & Employment, C/VM2, Verification Method: Framework for Fire
Safety Design, For New Zealand Building Code Clauses C1-C6 Protection from Fire, 2014: New
Zealand Government.
[19] Ministry of Business, Innovation & Employment, C/AS2, Acceptable Solution for Buildings with
Sleeping (non institutional), For New Zealand Building Code Clauses C1-C6 Protection from Fire,
New Zealand Government, 2016.
[20] J. Fraser-Mitchell and C. Williams, Open plan flat layouts - Assessing life safety in the event of
fire, IHS BRE Press on behalf of the NHBC Foundation, 2009.
[21] J. Fraser-Mitchell and C. Williams, “Open plan flat layouts - Assessing life safety in the event of
fire, NF 19 CD-Rom,” IHS BRE Press on behalf of the NHBC Foundation, 2009.
Accepted manuscript: Hopkin, C., Spearpoint, M., Hopkin, D., Wang, Y. “Residential occupant density distributions derived from English Housing Survey data”, Fire Safety Journal, 2019. DOI: https://doi.org/10.1016/j.firesaf.2019.01.010
20
[22] Ministry of Housing, Communities & Local Government, “English Housing Survey, Information and
publications on the English Housing Survey,” [Online]. Available:
https://www.gov.uk/government/collections/english-housing-survey. [Accessed August 2018].
[23] Department for Communities and Local Government, English Housing Survey, 2008: Housing
Stock Data. [data collection]. 4th Edition. UK Data Service. SN: 6612,
http://doi.org/10.5255/UKDA-SN-6612-4, 2017.
[24] Department for Communities and Local Government, English Housing Survey, 2010: Housing
Stock Data. [data collection]. 6th Edition. UK Data Service. SN: 7039,
http://doi.org/10.5255/UKDA-SN-7039-6, 2017.
[25] Department for Communities and Local Government, English Housing Survey, 2012: Housing
Stock Data. [data collection]. 4th Edition. UK Data Service. SN: 7511,
http://doi.org/10.5255/UKDA-SN-7511-4, 2017.
[26] Department for Communities and Local Government, English Housing Survey, 2014: Housing
Stock Data. [data collection]. 4th Edition. UK Data Service. SN: 8010,
http://doi.org/10.5255/UKDA-SN-8010-4, 2017.
[27] Ministry of Housing, Communities and Local Government, English Housing Survey, 2016: Housing
Stock Data. [data collection]. UK Data Service. SN: 8350, http://doi.org/10.5255/UKDA-SN-8350-
1, 2018.
[28] Royal Institution of Chartered Surveyors, “Gross Internal Floor Area (GIFA) and International
Property Measurement Standard (IPMS) for Offices,” [Online]. Available:
http://www.rics.org/uk/knowledge/bcis/about-bcis/forms-and-documents/gross-internal-floor-
area-gifa-and-ipms-for-offices/. [Accessed August 2018].
[29] Scott Wilson, “Dwelling size survey. Housing standards: evidence and research,” CABE, 2010.
[30] D. Hopkin, “A Review of Fire Resistance Expectations for High-Rise UK Apartment Buildings,”
Fire Technology, vol. 53, no. 1, pp. 87-106, 2017.
[31] Department for Communities and Local Government, “Statistical data set, Live tables on house
building: new build dwellings,” June 2018. [Online]. Available:
https://www.gov.uk/government/statistical-data-sets/live-tables-on-house-building. [Accessed
August 2018].
[32] A. Clarke, “The Prevalence of Rough Sleeping and Sofa Surfing Amongst Young People in the
UK,” Social Inclusion, vol. 4, no. 4, pp. 60-72, 2016.
[33] HM Government, The Building Regulations 2010, Approved Document K (Protecting from falling,
collision and impact), 2013 edition - for use in England, 2013.
[34] G. De Sanctis, J. Kohler and M. Fontana, “Probabilistic assessment of the occupant load density
in retail buildings,” Fire Safety Journal, no. 69, pp. 1-11, 2014.
[35] D. Hopkin, R. V. Coile, C. Hopkin, I. Fu and M. Spearpoint, “Transient reliability evaluation of a
stochastic structural system in fire,” in International Probabilistic Workshop, Vienna, 2018.