Embed Size (px)
Citation preview

1 Residential Market Viewpoints PAN India Q3 2020
anarock.com
ResidentialMarketViewpointsPA N I N D I A Q3
2020

2 Residential Market Viewpoints PAN India Q3 2020
Note: PAN India refers to Top 7 cities of India only*Q3 2020 vs Q1 2020
Key Highlights
New LaunchesLaunches across the top 7 cities recovered 79% from the pre-COVID-19 levels of Q1 2020. Typically, the third quarter is known to record the lowest launches due to the onset of monsoon and the inauspicious ‘shradh’ period. But this time, it seems to have bucked the trend.
Hyderabad, Kolkata and NCR have exceeded the launches during Q3 2020 from pre-COVID-19 level of Q1 2020. MMR and Bengaluru have recovered nearly 75% and 68%, respectively in the third quarter compared to Q1 2020.
The mid segment dominated Q3 2020 launches and accounted for nearly 41% of the total supply. This is a notable shift in the market which was dominated by affordable segment launches for the past several years.
32,530Units
79%Recovered*
29,520Units
65%Recovered*
SalesSales across the top 7 cities have recovered in the range of 62% to 73% compared to the pre-COVID-19 levels of Q1 2020. Chennai recorded the highest recovery of 73% while the recovery rate for other cities was in the range of 63% to 67%.
Projects nearing completion and those offering ready to move in inventory were seen to have the highest traction during the quarter as buyers looked to mitigate execution risks arising due to delays.
Unsold InventorySupply exceeded the sales after 14 quarters resulting in a minor increase in unsold inventory in Q3 2020. Nonetheless, the unsold inventory levels are less than that of Q1 2020.
6,36,080Units
-1%Changed*
Budget Segmentation: Affordable (< INR 40 Lakh)
Mid-end (INR 40 Lakh - INR 80 Lakh) High-end (INR 80 Lakh - INR 1.5 Cr)
Luxury (INR 1.5 Cr - INR 2.5 Cr) Ultra-luxury (> INR 2.5 Cr)

3 Residential Market Viewpoints PAN India Q3 2020 3 Residential Market Viewpoints PAN India Q3 2020
6,810New Launch Units
5,200Sold Units
1,72,630Unsold Units
INR 4,580/sfAverage Price
Top 7 Cities
MMR
NCR
7,890New Launch Units
9,200Sold Units
2,08,250Unsold Units
INR 10,610/sfAverage Price
5,840New Launch Units
5,400Sold Units
60,820Unsold Units
INR 4,975/sfAverage Price
Bengaluru
Note: Average price quoted on BSP on BUA

4 Residential Market Viewpoints PAN India Q3 2020 4 Residential Market Viewpoints PAN India Q3 2020
4,900New Launch Units
1,650Sold Units
27,510Unsold Units
INR 4,195/sfAverage Price
Pune
Hyderabad
4,180New Launch Units
4,850Sold Units
91,240Unsold Units
INR 5,510/sfAverage Price
Note: Average price quoted on BSP on BUA

5 Residential Market Viewpoints PAN India Q3 2020 5 Residential Market Viewpoints PAN India Q3 2020
1,560New Launch Units
1,600Sold Units
32,980Unsold Units
INR 4,935/sfAverage Price
Chennai
Kolkata1,350New Launch Units
1,620Sold Units
42,650Unsold Units
INR 4,385/sfAverage Price
Note: Average price quoted on BSP on BUA

6 Residential Market Viewpoints PAN India Q3 2020 6 Residential Market Viewpoints PAN India Q3 2020
New LaunchSupplyTrend
Q32020
6

7 Residential Market Viewpoints PAN India Q3 2020
New Launch Supply TrendQ3 2020
32,530
0
10000
20000
30000
40000
50000
60000
70000
0
10,000
20,000
30,000
40,000
50,000
60,000
70,000
80,000
90,000
100,000
Q12017
Q22017
Q32017
Q42017
Q12018
Q22018
Q32018
Q42018
Q12019
Q22019
Q32019
Q42019
Q12020
Q22020
Q32020
No
. of
Uni
ts
No
. of
Uni
ts
Launches 4 quarter moving average
• Launches across the top 7 cities recovered 79% from the pre-COVID-19 levels of Q1 2020.
• In Q3 2020, the four-quarter moving average of new launches was down by 9% from the previous trough in Q1 2018.
• Bengaluru, Pune, NCR and Hyderabad have already exceeded their current four-quarter moving average compared to Q1 2018.
-9%
CO
VID
-19
New Launches

8 Residential Market Viewpoints PAN India Q3 2020
City-wise Supply Q3 2020As a % of Q1 2020
Note: Map not to scale, for representation purpose onlySize of the circle with picture represents supply in Q3 2020, and size of the dotted circle represents supply in Q1 2020
NCR
6,810 units110% of Q1 2020
KOLKATA
1,350 units124% of Q1 2020
HYDERABAD
4,900 units145% of Q1 2020
CHENNAI
1,560 units42% of Q1 2020
MMR
7,890 units75% of Q1 2020
PUNE
4,180 units54% of Q1 2020
BENGALURU
5,840 units68% of Q1 2020

9 Residential Market Viewpoints PAN India Q3 2020
New Launch Supply TrendQ3 2020
38%45%
39% 35% 33%44% 42% 38%
44%34%
41% 41% 38%30%
46% 32%33%
30%41%
31% 33% 40% 32%
32%
36% 32% 36%
25%
41%
10%14%
19%
20%
20% 15% 16% 13% 15%
20%
16%15% 17%
67%
19%
3% 6% 6%12%
4%4% 5% 6% 5%
9%4%
8% 6% 8%7%
3% 3% 3% 3% 2% 6% 4% 3% 4% 5% 3% 4% 3% 3%
Q12017
Q22017
Q32017
Q42017
Q12018
Q22018
Q32018
Q42018
Q12019
Q22019
Q32019
Q42019
Q12020
Q22020
Q32020
< INR 40 Lakh INR 40 Lakh - INR 80 Lakh INR 80 Lakh - 1.5 Cr INR 1.5 Cr - 2.5 Cr > INR 2.5 Cr
• The share of affordable housing has dropped to 30% in Q3 2020 which is the lowest in the last 15 quarters.
• The mid segment witnessed some traction and accounted for nearly 41% share of the supply.
Budget Segmentation of Supply
Budget Segmentation: Affordable (< INR 40 Lakh)
Mid-end (INR 40 Lakh - INR 80 Lakh) High-end (INR 80 Lakh - INR 1.5 Cr)
Luxury (INR 1.5 Cr - INR 2.5 Cr) Ultra-luxury (> INR 2.5 Cr)

10 Residential Market Viewpoints PAN India Q3 2020
New Launch Supply TrendQ3 2020
11%
10%
27%
55%
30%
54%
27%
66%
37%
61%
26%
48%
22%
26%
19%
46%
12%
8%
17%
10%
28%
3%
7%
8%
4%
8%
14%
1%
3%
1%
6%
5%
Bengaluru
Chennai
Hyderabad
Kolkata
Pune
NCR
MMR
< INR 40 Lakh INR 40 Lakh - INR 80 Lakh INR 80 Lakh - 1.5 Cr INR 1.5 Cr - 2.5 Cr > INR 2.5 Cr
• Hyderabad, which always had a limited affordable housing supply, witnessed significant addition during Q3 2020. This has been the highest supply in the sub INR 40 Lakh segment since Q1 2019.
• Bengaluru and Pune focus more on the mid-end segment. The diverse employment base in these cities create the demand for the mid segment.
• Q3 2020 supply in MMR appears to be evenly spread out across the segments unlike previously when it was dominated by the affordable and mid-segment.
City-wise Budget Segmentation of Supply (Q3 2020)
Budget Segmentation: Affordable (< INR 40 Lakh); Mid-end (INR 40 Lakh - INR 80 Lakh); High-end (INR 80 Lakh - INR 1.5 Cr); Luxury (INR 1.5 Cr - INR 2.5 Cr); Ultra-luxury (> INR 2.5 Cr)
11 Residential Market Viewpoints PAN India Q3 2020 11 Residential Market Viewpoints PAN India Q3 2020
SalesTrend
Q32020
12 Residential Market Viewpoints PAN India Q3 2020
Q3 2020
SalesTrend
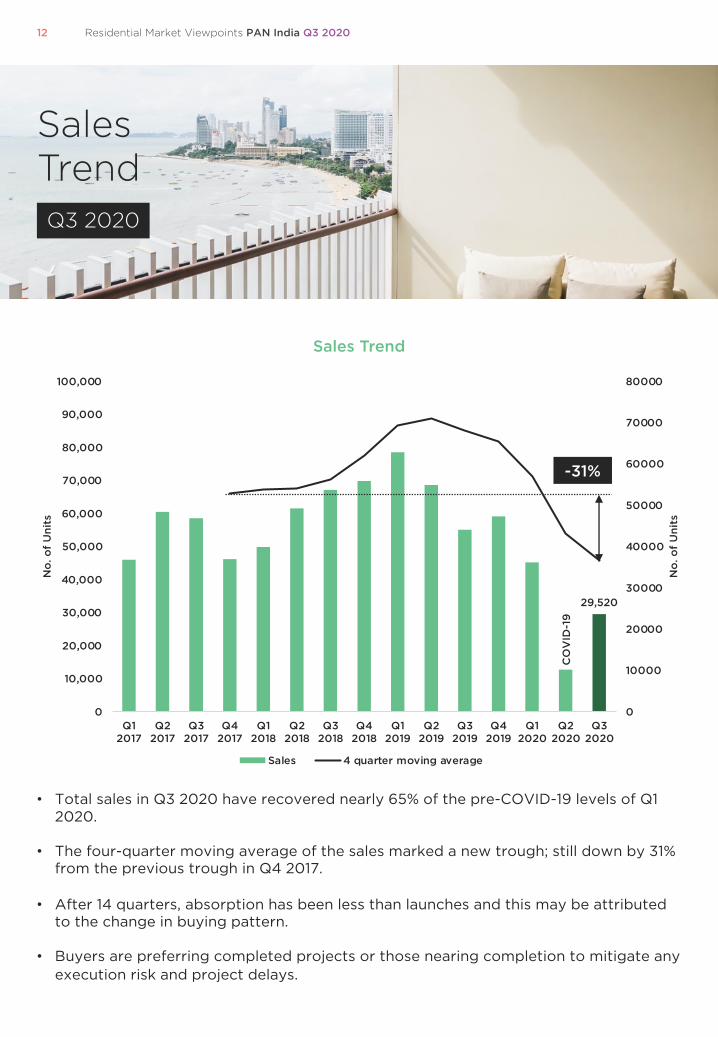
• Total sales in Q3 2020 have recovered nearly 65% of the pre-COVID-19 levels of Q1 2020.
• The four-quarter moving average of the sales marked a new trough; still down by 31% from the previous trough in Q4 2017.
• After 14 quarters, absorption has been less than launches and this may be attributed to the change in buying pattern.
• Buyers are preferring completed projects or those nearing completion to mitigate any execution risk and project delays.
29,520
0
10000
20000
30000
40000
50000
60000
70000
80000
0
10,000
20,000
30,000
40,000
50,000
60,000
70,000
80,000
90,000
100,000
Q12017
Q22017
Q32017
Q42017
Q12018
Q22018
Q32018
Q42018
Q12019
Q22019
Q32019
Q42019
Q12020
Q22020
Q32020
No
. of
Uni
ts
No
. of
Uni
ts
Sales 4 quarter moving average
-31%
CO
VID
-19
Sales Trend

13 Residential Market Viewpoints PAN India Q3 2020
NCR
5,200 units64% of Q1 2020
City-wise Sales Q3 2020As a % of Q1 2020
Note: Map not to scale, for representation purpose onlySize of the circle with picture represents sales in Q3 2020, and size of the dotted circle represents sales in Q1 2020
KOLKATA
1,620 units66% of Q1 2020
HYDERABAD
1,650 units62% of Q1 2020
CHENNAI
1,600 units73% of Q1 2020
BENGALURU
5,400 units63% of Q1 2020
MMR
9,200 units66% of Q1 2020
PUNE
4,850 units67% of Q1 2020

14 Residential Market Viewpoints PAN India Q3 2020
UnsoldInventoryTrend
Q32020
14 Residential Market Viewpoints PAN India Q3 2020
14

15 Residential Market Viewpoints PAN India Q3 2020
Unsold InventoryTrendQ3 2020
636,080
600,000
620,000
640,000
660,000
680,000
700,000
720,000
740,000
760,000
780,000
800,000
Q1 2017
Q2 2017
Q3 2017
Q4 2017
Q1 2018
Q2 2018
Q3 2018
Q4 2018
Q1 2019
Q2 2019
Q3 2019
Q4 2019
Q1 2020
Q2 2020
Q3 2020
No
. of
Uni
ts
• Unsold inventory marginally decreased by 1% compared to Q1 2020.
• All the cities registered a decline in the range on 1% to 3% during the same period. However, NCR remained unchanged and Hyderabad recorded an increase in unsold inventory during the quarter.
Unsold Inventory
16 Residential Market Viewpoints PAN India Q3 2020
Unsold InventoryTrendQ3 2020
City Q3 2020 Q1 2020 Q3 2019Q3 2020
vsQ1 2020
Q3 2020vs
Q3 2019
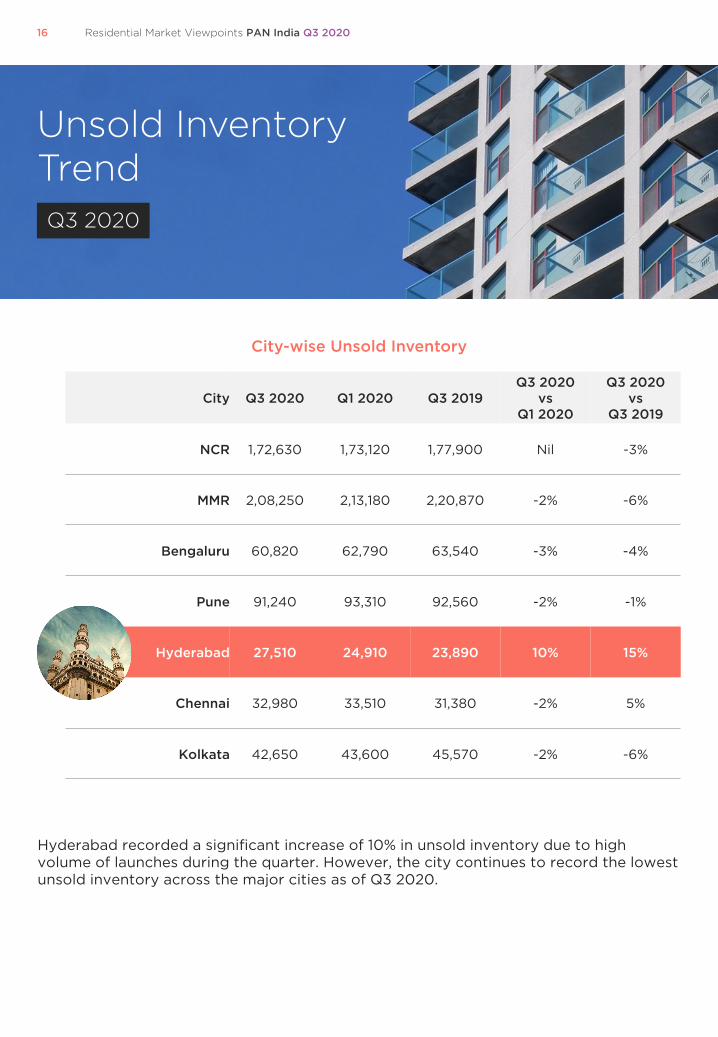
NCR 1,72,630 1,73,120 1,77,900 Nil -3%
MMR 2,08,250 2,13,180 2,20,870 -2% -6%
Bengaluru 60,820 62,790 63,540 -3% -4%
Pune 91,240 93,310 92,560 -2% -1%
Hyderabad 27,510 24,910 23,890 10% 15%
Chennai 32,980 33,510 31,380 -2% 5%
Kolkata 42,650 43,600 45,570 -2% -6%
Hyderabad recorded a significant increase of 10% in unsold inventory due to high volume of launches during the quarter. However, the city continues to record the lowest unsold inventory across the major cities as of Q3 2020.
City-wise Unsold Inventory

17 Residential Market Viewpoints PAN India Q3 2020
Unsold InventoryTrendQ3 2020
37%
32%
23%
49%
15%
25%
62%
36%
22%
39%
34%
32%
41%
23%
16%
23%
26%
12%
35%
22%
10%
7%
12%
6%
3%
12%
7%
2%
4%
11%
6%
2%
6%
5%
3%
NCR
MMR
Bengaluru
Pune
Hyderabad
Chennai
Kolkata
< INR 40 Lakh INR 40 Lakh - INR 80 Lakh INR 80 Lakh - 1.5 Cr INR 1.5 Cr - 2.5 Cr > INR 2.5 Cr
• The affordable and mid segment accounts for the highest share (66%) of total unsold inventory across the top 7 cities.
• Pune has the highest unsold inventory in the affordable segment due to an incessant supply addition.
City-wise Budget Segmentation of Unsold Inventory (Q3 2020)
Budget Segmentation: Affordable (< INR 40 Lakh)
Mid-end (INR 40 Lakh - INR 80 Lakh) High-end (INR 80 Lakh - INR 1.5 Cr)
Luxury (INR 1.5 Cr - INR 2.5 Cr) Ultra-luxury (> INR 2.5 Cr)

18 Residential Market Viewpoints PAN India Q3 2020
Unsold InventoryTrendQ3 2020
CityAvg. Base
Selling Price(INR/sf)
Q3 2020 vs Q1 2020
(% change)
Q3 2020 vs Q3 2019
(% change)
Inventory Overhang (months)
Q3 2020 vs Q1 2020 (months)
Q3 2020 vs Q3 2019 (months)
NCR 4,580 Nil Nil 79 +29 +35
MMR 10,610 Nil Nil 55 +19 +21
Bengaluru 4,975 Nil Nil 26 +09 +11
Pune 5,510 Nil Nil 46 +15 +19
Hyderabad 4,195 Nil Nil 39 +17 +23
Chennai 4,935 Nil Nil 56 +18 +25
Kolkata 4,385 Nil Nil 64 +22 +26
• Prices remained range bound in all the cities during Q3 2020. Developers launching new projects seemed to adhere to the prevailing prices.
• PAN India inventory overhang increased by 18 months owing to subdued sales during the quarter.
Capital Values & Inventory Overhang

19 Residential Market Viewpoints PAN India Q3 2020
Residential Market Overview
Q32020
19 Residential Market Viewpoints PAN India Q3 2020

20 Residential Market Viewpoints PAN India Q3 2020
NCR
MMR
Bengaluru
Pune
Hyderabad
ChennaiKolkata
0
1,000
2,000
3,000
4,000
5,000
6,000
7,000
8,000
9,000
10,000
20 30 40 50 60 70 80 90
Laun
ches
(N
o. o
f U
nits
)
Inventory Overhang (Months)
Multivariate AnalysisInventory Overhang - New Launch Supply - Unsold Inventory
Inventory overhang increased in all cities due to sluggish sales in Q3 2020 compared to Q1 2020.
Note:Size of the circle represents unsold inventory as of Q3 2020

21 Residential Market Viewpoints PAN India Q3 2020
India ResidentialKey Emerging Trends
Source: HDFC, SBI, Jefferies, ANAROCK Research
Need for larger or functional homes
With the forced lockdown and continued WFH and online schooling, people are now eyeing larger homes or functional and flexible homes that can accommodate working spaces.
A rise in demand for plotted developments, weekend homes and farmhouses
Self-owned homes (villas or row houses) provide better social distancing compared to the apartments. As a result, demand for plotted developments, weekend homes and farmhouses are on a rise.
Townships may gain higher interest
There is a rising preference to live, work, and play in controlled environments. As a result, we may witness a rising interest in townships in the years to come.
36%
56%58%
53%50%
44%
38%
27%
0%
10%
20%
30%
40%
50%
60%
70%
FY01
FY02
FY03
FY04
FY05
FY06
FY07
FY08
FY09
FY10
FY11
FY12
FY13
FY14
FY15
FY16
FY17
FY18
FY19
FY20
FY21
Aff
ord
abili
ty R
atio
Affordability Ratio(Home Loan Payment / Income Ratio)
RTM in demand
Homebuyers are looking to purchase units that can be seen, views that can be assessed, and homes that are readily available. As a result, there’s a huge demand for ready-to-move-in units.
Homebuyers prefer to deal with the large corporates and branded developers
It provides them a feeling of comfort that their investments will not go in vain and the houses will be delivered as promised.
Improved affordability
The ratio of the home loan payment to income has been reducing over the years. According to industry estimates, affordability for a mid-income apartment in Indian city will be at 27% in FY21, which is the best in the last two decades.
22 Residential Market Viewpoints PAN India Q3 2020
Learnings from COVID-19Success mantras for real estate developers to thrive and flourish
Embrace digital
Homebuyers are finding it convenient to do virtual site visits and discussions and come in close contact with the real estate developers only during the final stages. As per estimates, out of 10 virtual site visits done for prospecting, homebuyers are now physically visiting only the top 3 shortlisted projects.
End-user driven market
It is important to provide lucrative deals and offers as per the homebuyers’ requirements. Nearly 80% of the demand comes in from the end-users.
NRIs are actively looking to buy houses
Depreciating rupee and homecoming have made property purchases extremely lucrative for the NRIs.
Focus on affordable-to-mid-segment
Affordable-to-mid-segment housing will continue to remain in demand as homebuyers having an appetite for new property purchases will look to rationalize their quantum of investments. Nearly 70% - 75% supply has been in this segment across the top 7 cities of India and that is where the demand lies as well.
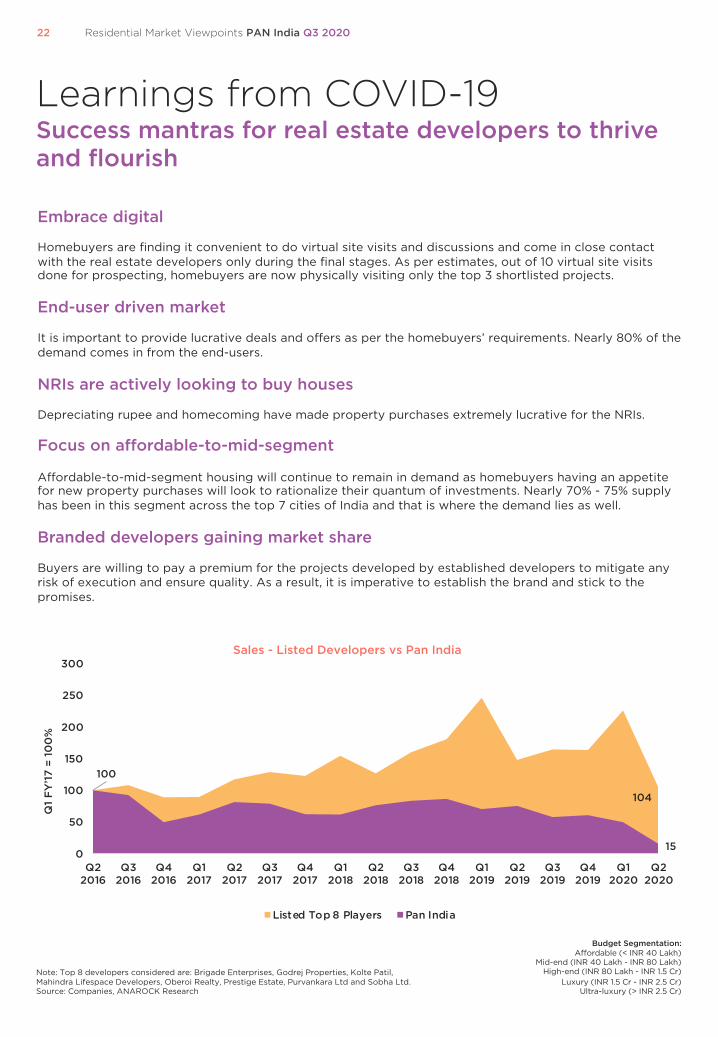
Branded developers gaining market share
Buyers are willing to pay a premium for the projects developed by established developers to mitigate any risk of execution and ensure quality. As a result, it is imperative to establish the brand and stick to the promises.
104
100
150
50
100
150
200
250
300
Q22016
Q32016
Q42016
Q12017
Q22017
Q32017
Q42017
Q12018
Q22018
Q32018
Q42018
Q12019
Q22019
Q32019
Q42019
Q12020
Q22020
Q1
FY
’17
= 10
0%
Sales - Listed Developers vs Pan India
Listed Top 8 Players Pan India
Note: Top 8 developers considered are: Brigade Enterprises, Godrej Properties, Kolte Patil, Mahindra Lifespace Developers, Oberoi Realty, Prestige Estate, Purvankara Ltd and Sobha Ltd.Source: Companies, ANAROCK Research
Budget Segmentation: Affordable (< INR 40 Lakh)
Mid-end (INR 40 Lakh - INR 80 Lakh) High-end (INR 80 Lakh - INR 1.5 Cr)
Luxury (INR 1.5 Cr - INR 2.5 Cr) Ultra-luxury (> INR 2.5 Cr)

23 Residential Market Viewpoints PAN India Q3 2020
5 Key Takeaways
1. Improved affordability due to low interest rates and range-bound prices may attract fence sitters.
2. WFH and online schooling is likely to remain for some more time which may create the need for flexible and functional homes.
3. Ready-to-move-in units are going to be the first preference for buyers to mitigate the execution risk and construction delays.
4. The share of branded developers in overall sales is likely to increase as buyers are looking at timely delivery and quality of built houses.
5. Affordable and mid segment to remain in focus as buyers may remain price sensitive even though the certainty of employment may improve in the future.
Conclusion
As the country and the economy makes efforts to return to normalcy by gradually unlocking the commercial activities, all sectors are witnessing a renewed traction. The residential real estate sector is also benefitting from the renewed confidence of all the stakeholders including buyers, developers and property consultants.
Sales and launches during the third quarter have shown signs of revival. It is anticipated that the momentum will continue in the coming quarter. The last quarter may witness a significant recovery which will be driven by the pent-up demand and kick-off of the festive season.
Low interest rates have helped to better the affordability of the buyers. As the dark clouds of unemployment clear, the buyers may actively look for houses during the auspicious days and close deals as prices may continue to remain range bound for some more time.
As work from home may continue in the near future and may even be allowed forever to a particular segment of employees, the buyers may be keen to explore more functional homes that can provide workspaces as well. To alleviate the risk of project delays, end-users may prefer to associate with the branded developers and be keen to purchase ready to move in units.

24 Residential Market Viewpoints PAN India Q3 2020
anarock.com
© 2020 ANAROCK Property Consultants Pvt Ltd.All rights reserved.
All information in this report is provided solely for internal circulation and reference purposes. ANAROCK makes no statement, representation, warranty or guarantee as to the accuracy, reliability or timeliness of the information provided. No part of this report may be reproduced, distributed, or transmitted in any form or by any means, including photocopying, recording, or other electronic or mechanical methods.
ANAROCK is India’s leading independent real estate services company with a presence across India and the Middle East. The Chairman, Mr. Anuj Puri, is a highly respected industry veteran and India’s most prominent real estate thought leader.
The Company has diversified interests across the real estate lifecycle and deploys its proprietary technology platform to accelerate marketing and sales. ANAROCK’s services include Residential Broking & Technology, Retail (in partnership with Vindico), Commercial, Investment Banking, Hospitality (via HVS ANAROCK), Land Services, Industrial and Logistics (in partnership with Binswanger), Investment Management, Research, Strategic Advisory & Valuations and Project Management Services (in partnership with Mace).The Company has a unique business model, which is an amalgamation of traditional product sales supported by a modern technology platform with automated analytical and reporting tools. This offers timely solutions to its clients, while delivering financially favourable and efficient results.
ANAROCK has a team of over 1,800 certified and experienced real estate professionals who operate across all major Indian (Mumbai, Navi Mumbai, Pune, Ahmedabad, NCR – Delhi, Gurugram, Noida, Chennai, Bangalore, Hyderabad, Kolkata, Lucknow) and Middle East markets, and within a period of two years, has successfully completed over 400 exclusive project mandates. ANAROCK also manages over 80,000 established channel partners to ensure global business coverage.
Our assurance of consistent ethical dealing with clients and partners reflects our motto -Values Over Value.
Please visit www.anarock.com
For research services, please contact:
Prashant ThakurDirector & Head of [email protected]
ANAROCK Property Consultants Pvt. Ltd.1002, 10th Floor, B WingONE BKC, Plot No. C-66, G BlockBandra Kurla ComplexBandra East, Mumbai 400 051
MahaRERA Registration No. A51900000108 available athttp://maharera.mahaonline.gov.in