Embed Size (px)
Citation preview

RESIDENTIAL LENDING ASSESSMENT REPORT
JULY 2008 THROUGH JANUARY 2009
REBECCA SEIBNATIONAL INITIATIVES AND APPLIED RESEARCH
NEIGHBORWORKS® AMERICA
Earnings
NetInterestIncome
Other Income
OtherRevenue
FeeIncome
Asset Quality(Del & Def)
LLR & BadDebt Exp
RLF Capital
Market
UnrestrictedNet Asset
Staff &BD
Capacity
Loan Sales
Lending Cycle
Operating and AdminExpenses
Borrowed Funds
Capital Grants
Loans

2
ACKNOWLEDGMENTS
I would like to thank the ten participating NeighborWorks® organizations for allowing me to diveinto their organizational records to prepare this Residential Lending Assessment report. A specialacknowledgement goes to the leaders of those ten participating organizations Ludy Biddle, NWWestern Vermont; Al Gold, Colorado Rural Housing; Kim Bumber, NW Rochester; DebeMahoney, NW Anchorage; Ron Miller, Reading, NHS; Tim Bolding, United Housing, Inc;Lauren Anderson, NHS New Orleans; Rodney Fernandez, Cabrillo EDC; Michael Loftin,Homewise; and Holly Olsen, Neighborhood Finance Corporation for their continued support andguidance throughout this process. Special thanks to Lauren Anderson for hosting a beautifulconvening venue in her home community of New Orleans and enlightening us on the post-Katrinaprogress in the community. In addition, the staff of these remarkable organizations were veryhelpful, friendly and cooperative when I or the consultants would interrupt their daily routinesand request additional information. I really appreciated the efforts you put forth for thesuccessful completion of this project.
In addition, I would like to thank Michael Schaaf, Andrew Loubert, and Robert Stearns for theirprofessionalism and who, as consultants, conducted many of the assessments while working withme to standardize the reports for the final analysis.
There are a host of others within NeighborWorks® that have been very helpful in the assessmentprocess. Special thanks to Leon Gray, Michael Williams, and Enayat Oliver for their assistanceat the NWO convening in New Orleans. In addition, thank you to the members of theNeighborWorks Affordable Financing Products Development Committee that provided assistancein identifying the NWOS and other critical components of the study methodology.
Last but not least, I would like to thank David Dangler, Director of the Rural Initiative andCommunity Economic Development, for his mentorship and his great support throughout thisendeavor, and for serving as a peer reviewer during the final stages of report preparation. Inaddition, David stepped up to the plate at the NWO convening when I was called away onpersonal affairs. As always thank you David for your support and assistance.
REBECCA SEIBNEIGHBORWORKS® AMERICA
APRIL 2009

3
TABLE OF CONTENTS
INTRODUCTION............................................................................................................. 4
EXECUTIVE SUMMARY .............................................................................................. 4
METHODOLOGY ........................................................................................................... 8
LENDING CYCLE........................................................................................................... 9
RLF BUSINESS MODELS............................................................................................ 10
RLF LOAN PRODUCTS............................................................................................... 11
PRODUCTION ANALYSIS.......................................................................................... 12
PERFORMANCE ANALYSIS...................................................................................... 13
CAPITAL (CAPACITY MEASURE) ....................................................................................... 14ASSET QUALITY (PERFORMANCE MEASURE)..................................................................... 16MANAGEMENT AND MARKETING (CAPACITY MEASUREMENT) ........................................... 18EARNINGS (PERFORMANCE MEASURE)............................................................................. 20LIQUIDITY (CAPACITY MEASURE) .................................................................................... 23
ADDENDUM “A”........................................................................................................... 26
ADDENDUM “B” ........................................................................................................... 27
ADDENDUM “C”........................................................................................................... 29
ADDENDUM “D”........................................................................................................... 30

4
NEIGHBORWORKS® AMERICARESIDENTIAL LENDING ASSESSMENT
REPORT
INTRODUCTIONNeighborWorks® America, a government sponsored enterprise, grew out of the anti-redliningmovement in the 1970s. Created as a nonprofit organization by Congress in 1978,NeighborWorks® America supported local community-based organizations in their neighborhoodrevitalization strategies involving public-private partnerships with strong resident involvement.Core programs in the Network’s first decade were owner-occupied rehab affordably financed bylocal revolving loan funds.
Today, NeighborWorks® HomeOwnership Centers and full cycle lending, inclusive of homebuyereducation and residential loans, are the foundation of NeighborWorks® America and itsapproximately 248 chartered organizations. In the 2007 annual survey 159 NeighborWorks®
organizations (NWO) reported some level of direct residential lending, totaling an outstandingloan balance of $648,702,000. Little information is known, however, about how the residentiallending line of business operates across the Network at the organization level.
The purpose of the Residential Lending Assessment was to assess a cross-section ofNeighborWorks® organizations and perform a “deep-dive” into the residential lending line ofbusiness. The “deep-dive” was also to include a greater understanding of how a variety of homepurchase and improvement products are being financed using first and second mortgages. Thestudy’s objectives were as follows:
o Understand more fully how these residential lending lines of business operate andperform.
o Assess the financial strength and operational performance of the residential loan fund(RLF) line of business.
o Test proposed lending standards.
EXECUTIVE SUMMARYThe following report contains a production and performance deep-dive assessment of residentiallending line of business of ten NeighborWorks® organizations (NWO). Since the sampleorganizations were carefully selected and not randomly chosen, the study findings can not begeneralized to the entire network. However, the findings reveal certain capacity and performanceindicators that warrant further discussion in relation to organizational underwriting, data pointcollection for the quarterly and annual surveys, and the organizational assessment performanceobjectives that are now employed. It is hoped that through these discussions that standardizedlending indicators will be developed and used interdepartmentally throughout theNeighborWorks® system.
Two socio-economic goals drive the residential loan fund (RLF) line of business –(1) Access to residential capital for low-income, underserved and disadvantagedcommunities to access affordable housing and home preservation, and(2) Generation of unrestricted income to lessen the organization’s dependency on outsidefunding.
These two intertwined and co-dependent goals are essential if the lending line of business is tosupport the organization’s mission over time.

5
From 159 NWOs claiming residential lending as a line of business, ten NWOs wererecommended by the NeighborWorks® Affordable Financing Products Development Committee(Loan Products Committee) to participate in the assessment. These ten NWOs represent eightdistricts, various geographies and market types (rural and urban), and have a current OHTS ratingof strong or exemplary,
The NWOs participating in the assessment were -
NWO DistrictGeographicDistribution
1- United Housing, Inc. Great Lakes Mixed Rural2- NHS of Reading Mid-Atlantic Mixed Urban3- NW of Western Vermont New England Rural4- Neighborhood Finance Corp North Central Urban5- NW Rochester North East Urban6- Cabrillo EDC Pacific Mixed Markets7- NW Anchorage Pacific Mixed Urban8- Colorado Rural Housing Rocky Mt. Rural9- Homewise Rocky Mt. Mixed Urban10- NHS of New Orleans Southern Urban
During the assessment process three distinct lending business models surfaced – Just Lending,Lending Plus, and Loan Sales. As will be seen, these business models become important whenanalyzing the relative performance of the various RLFs. Two primary loan categories surfaced –Home Buyer Assistance and Home Improvement Loans. Within these categories a variety of loanproducts were identified including - home mortgages, down payment and closing costs,purchase/rehab, owner/rehab and minor repair loans. Insufficient and inconsistent loan productdata limited the depth and scope of the analysis.
PRODUCTION ANALYSISAn annual production analysis was conducted utilizing nine NWOs borrower databases forcalendar years 2005 through 2007. The analysis was conducted in three sections – RLF loan poolaggregate totals, RLF mortgage instrument analysis, and RLF loan payment structure analysis.
During a three-year period (2005-2007), an aggregate total of 2,998 individual loans comprisedover $375.4 million in total project values from all sources, of which $114.3 million were RLFloans. When looking at the entire RLF loan pool for the three-year span the following statisticsrevealed that
o 88% were amortizedo 9% were deferred ando 3% were forgivable
The aggregate RLF loan pools demonstrated the following stats on mortgage instruments typeso 67% first mortgageso 27% second mortgageso 4% other mortgageso 2% unsecured loans
The mortgage instrument analysis indicated that 94 percent of all RLF loans were secured by firstor second mortgages.

6
The loan payment structure analysis revealed thato First mortgages -- 99% amortized, 1% deferred,o Second mortgages --70% amortized, 26% deferred, and 3% forgivableo Other mortgages -- 24% amortized, 43% deferred, and 33% forgivableo Unsecured loans -- 82% amortized, and 18% forgivable.
The loan payment structure analysis indicated that the majority of deferred and forgivable loanswere secured by second and other mortgage instruments and 99 percent of first mortgages and 70percent of second mortgages were amortized.
These statistics reveal that only 12% of all RLF loans for this sample were either deferred orforgivable which is less than previously suspected. In addition, 94 percent of all RLF loans,whether housing assistance or home improvement, were secured by a first or a second mortgageposition, whereby reducing the RLF investment risk.
PERFORMANCE ANALYSISThe deep-dive performance analysis was based in CAMEL – Capitalization, Asset Quality,Management/Marketing, Earnings, and Liquidity. The following is a glance at the deep-divefindings.
Capitalization:NWOs leveraged NeighborWorks® America capital by attracting borrowed funds from traditionallenders and/or receipt of other capital grants as well as through loan sales to secondary markets(NHSA, banks, and Fannie Mae). In addition the RLF leveraged outside resources through loandeal participation with lending partners
1) NWA capital leveraged at a 2:1 ratio to capitalize the RLF loan pool2) NWA capital leveraged loan sales to secondary markets to capitalize RLF, and3) RLF leveraged loan participation with other lenders to make loan deals happen at a 2:1
ratio (one dollar of RLF funds with two dollars of other lenders funds).
Asset QualityThe aggregate total RLF loan pool asset quality was better than the CDFI standard of sevenpercent. 1 The RLF loan pool demonstrated a three percent 90+ day delinquency ratio and a netloss ratio of below one percent. However, three out of six Lending Plus models individuallyshowed an average delinquency ratio greater than the national CDFI delinquency standard whilethe other business models fell below the national delinquency standard. Further researchconcerning relationship of asset quality to portfolio management and homeownership counselingshould be explored.
Management/MarketingThe NWOs retained qualified staff to originate, service, and foreclose on residential loans. Stafftended to have either mortgage lending, banking or mortgage origination experience prior tobeing employed by the NWO. All the RLFs had Loan Fund Policies and Procedures in some formto guide the lending process. However, many policies did not address write-offs, portfolio qualitycontrol, risk rating, the role of the loan committee, and/or other aspects of loan processing,management, and oversight.
Annual production projections were not uniform among the RLFs analyzed. For example, JustLending and Loan Sales business models tended to project RLF annual revenue and expenses,and FTEs dedicated to lending functions. However, the Lending Plus business model tended to
1 The CDFI Fund’s MPS governing delinquencies exceeding 90 days (a.k.a. “portfolio at risk”) is 7% forCDFIs providing first mortgage loans.

7
project the number of loans only and not the annual revenue and expenses associated with thelending LOB.
In addition, Just Lending and Loan Sales tracked their lending FTEs time and expenses separatelyfrom Homeownership Counseling and therefore, could demonstrate 26 loans per FTE per loanand between $4,000 and $7,000 operating expense per loan. Lending Plus, on the other hand, didnot track lending FTEs and operating expenses separate from the Housing Counseling functionand could not calculate FTE per loan or the operating expense per loan.
All lending models prepared an annual budget and reported a budget to actual, loan fund activityand loan fund performance to management and boards, but few reported cash available forlending, and none reported deployment information.
In relation to the lending business models these findings -- annual production projections, FTEper loan, and capitalization requirements -- raise issues around asking the right questions duringthe organizational underwriting process, quarterly report and annual survey data collection, andthe organizational assessment performance measures. It also raises a concern on how to determinethe cost of doing business for the Lending Plus model if the lending expenses are not segregatedfrom other programmatic activities.
EarningsThe Earnings section was examined by two primary performance analyses – the relationshipbetween cost of funds and price of loans, and whether the loan fund earned sufficient revenues tomeet operation expenses.
The relationship between the cost of funds (interest expense) and the price of RLF loans (interestearned) varied between the business’ models employed.
o Loan Sales demonstrated a 7:1 ratio.o Lending Plus demonstrated a 2:1 ratioo Loans Sales and Just Lending hybrid model demonstrated a 3:1 ratio (for every
dollar owed three were earned).
RLF earnings were calculated on revenue minus expenses model. The analysis looked at theoperational ratio and the sustainability ratio.
Operational RatioAn operational ratio (earned income/operation expense) determines whether there is sufficientearned income to cover operation expenses. The hybrid Loan Sales and Just Lending businessmodel had an operational ratio over 100 percent. Lending Plus and Loan Sales models did notgenerate sufficient net interest income, fees and investment fees to cover operational expense.
Sustainability RatioA sustainability ratio (revenue/operation expense) determines whether there is sufficient revenueto cover operation expenses. Lending Plus models were able to generate sufficient revenue tocover all operational expenses. This indicates that other revenue sources such as administrativegrants and fundraising activities were generated to cover the costs of doing business. However,Loan Sales did not generate sufficient revenue, through grants and donations, to cover operationexpenses but had to rely on internal subsidies to cover some of the operation expenses.
In summary, Loan Sales and Just Lending hybrid business model showed a 3:1 ratio between costof funds and the price of RLF loans as well as a greater than 100 percent Operational Ratio.While these figures can not be generalized throughout the network, they indicate that the price of

8
the RLF loan may exceed the cost of funds by 3-4% to fully cover the operation expenses. Theexception to this would be the Loan Sales model with a 7:1 ratio between the cost of funds andthe price of the RLF loan. The Loan Sales model as seen in the body of the report did not reachinterest earnings scale and had low interest expense therefore would not be able to cover itsoperation expenses without subsidies from the parent organization.
LiquidityLiquidity measure, in this study, refers to the deployment of cash available for lending in relationto outstanding loan balance. The deployment ratio is generally a management tool used todetermine whether to seek additional funds to capitalize the loan pool. It must be noted that agood business practice is not to deploy all available funds but retain approximately 25 percent forliquidity purposes. The benchmarks used in this study were 65% and 75% -- if the deploymentratio was 75% or higher the RLF needed to secure more capital for lending; if the deploymentratio was below 65% the RLF had sufficient capital for lending. The study found that thedeployment ratio was not dependent on the type of business model employed but was unique toeach RLF.
The following Residential Lending Assessment report is divided into 6 sections - methodology,lending cycle, RLF business models, RLF loan products, production analysis, and performanceanalysis with recommended RLF capacity and performance standards. The performance analysisis sub-divided into capitalization, asset quality, management and market, earnings, and liquidity(the so-called CAMEL).
METHODOLOGYTo assess the capacity and performance of NWOs’ residential lending line of business, aformative residential loan fund (RLF) assessment study, a qualitative research methodology, wasconducted in three phases -initial research, data collection and analysis, and reporting.
1. Initial Research—the Loan Products Committee approved the recommended NWOs andcoordinated with Field Operations, Organizational Assessment Division, and NHSA to securerequested discovery and other NeighborWorks® in-house documentation.
Through this process, ten NWOs were recruited to participate in the study. The NWO selectioncriteria included:
a. Representation of all eight districts;b. Geographic distribution among rural and urban organizations;c. Representation of low to high RLF loan volume as reported on the 2007 annual survey;d. OHTS rating of Exemplary or Strong as of April 2008; ande. Agreements with District Directors and the NWOs to participate in study.
Upon obtaining participation agreements with the District Directors and the NWO ExecutiveDirectors, RLF discovery and site-visit phases were initiated. The discovery phase utilizedexisting sources of information, such as three-year audits and management prepared documents,to:
o Conduct a preliminary assessment of the financial strength and organizationalcapacity;
o Identify residential loan products and the magnitude of use; ando Identify sources of capital and leveraged resources.
Three experienced lending research consultants were retained to conduct three RLF assessmentseach. The principal researcher conducted one RLF assessment. The research consultants, in turn,

9
were trained by the principal researcher on how to conduct the RLF assessment according to apre-designed CAMEL methodology and the development of a structured report.
2. Data Collection and Analysis — Data was collected in three venues – structured RLFassessments, borrower databases, and NWO convening.
Upon completion of the initial research phase, research consultants conducted site visits andinterviewed key personnel. Each NWO’s RLF was assessed independently from the over-allorganization’s performance and capacity concerns, based on the proposed lending standardsfound in Addendum “A”. The proposed lending standards were integrated into a CAMELmethodology comprising a standardized set of thirty questions to be used during the assessments(Addendum “B”). CAMEL stands for -
a. Capitalb. Asset Qualityc. Managementd. Earningse. Liquidity
The ten individual NWO standardized assessment report findings were aggregated and analyzed.
In addition, the NWOs were asked to submit annual lending production data for the period ofJanuary 1, 2005 through December 31, 2007. Utilizing pre-described data points and incooperation with NeighborWorks® IM Department, an NStep crystal report template wasprepared and distributed to the individual NWOs. Nine NWOs provided borrower databases forthe proscribed time frame (see Addendum “C” for data points). The borrower databases wereexported into an excel spreadsheet and submitted to the principal researcher. The principalresearcher subsequently “scrubbed” and sorted the data according to year of loan origination,fund source, source of funds, and type of loans.
An NWO convening was held in January 2009 in New Orleans, LA. Executive staff from nineNWOs attended the two-day convening culminating in recommended CAMEL standardsincluding key indicators, measurements and benchmarks (Addendum “D”).
3. Reporting — Research consultants were required to prepare, in cooperation with theirrespective NWO Executive Directors and the principal researcher, individual NWO RLFAssessment Reports. The reports were distributed to the NWO Executive Directors and theprincipal researcher for comments and edits. At this time each NWO was able to submitadditional data to clarify capacity and performance information in the draft assessment report.Subsequently, ten NWO RLF Assessment Reports were finalized and distributed to the NWOsand the appropriate NeighborWorks® district personnel.
In addition, this report contains the analysis of the aggregated borrower databases (annualproduction), an analysis of the standardized RLF questions (performance analysis), and other keyobservations derived from the RLF assessment. The report was prepared and distributed by theprincipal researcher to the 10 NWOs and the Loan Products Committee for comments and edits,prior to finalization.
LENDING CYCLEThe RLF line of business is driven by two socio-economic goals – 1) access to residential capitalto low and moderate-income individuals, underserved and disadvantaged communities andindividuals, and 2) organizational income generation to lessen dependency on outside funding.These two goals intertwine and are dependent upon one another to achieve sustainablecommunity revitalization. The lending cycle provides an illustration of the relationship between

10
various components of the lending line of business – capitalization, asset quality, management &market, earnings, and liquidity -- and how they inter-relate.
As seen in the diagram above, capitalization of the RLF loan pool can be obtained in four primaryareas – borrowed funds, capital grants, loan sales and unrestricted net assets. However, loan poolcapitalization is influenced by the prevailing market conditions. Once capitalization andorganizational capacity is addressed, the RLF can provide residential loans to the community.The amount of funds available for lending in relation to the outstanding loans (liquidity)determines how much capital is needed to be secured for lending purposes. The performance ofthe loan pool, or asset quality, is dependent on the capacity of management, staff and theoversight of the loan pool through the board of directors and/or loan committee. Soundperforming loan pools can generate income and other revenue to cover the costs of borrowedfunds, programmatic, and operating expenses. The ultimate goal is to have positive earnings (netincome or net assets) that can be transferred to the parent organization or revolved back into RLF.Positive earnings ensure that the social mission of providing access to mortgage capital for low-income individuals and communities will continue.
RLF BUSINESS MODELSThree primary Residential Lending Business Models surfaced as the RLF assessment reportswere developed.
1) Just Lending – This business model pertains to just the RLF lending line of business. Itis usually found in a subsidiary organization (such as a CDFI) or is segregated as aseparate program free from other programmatic components such as Homeownershiptechnical assistance and training. It tends to have multi-layered loan pool capitalizationincluding borrowed funds, capital grants, and loan sales. This model allows for financialtransparency of all revenues and expenses associated with the RLF.
Earnings
NetInterestIncome
Other Income
OtherRevenue
FeeIncome
Asset Quality(Del & Def)
LLR & BadDebt Exp
RLF Capital
Market
UnrestrictedNet Asset
Staff &BD
Capacity
Loan Sales
Lending Cycle
Operating and AdminExpenses
Borrowed Funds
Capital Grants
Loans

11
2) Lending Plus – This business model integrates RLF lending with HomeownershipPromotion and Homeowner Preservation programs. The model integrates programmaticand lending revenues and expenses and therefore does not allow for financialtransparency for the lending component alone. The model primarily tends to capitalizethe RLF loan pool with equity funds, such as grants and contributions.
3) Loan Sales – This business model capitalizes the RLF loan pool primarily with loan salesto outside concerns, such as Fannie Mae, NHSA and/or banks. These loan sales can bewith recourse or without recourse. When sold with recourse, a high restricted cash loanloss reserve can appear on the financial statement. This model may allow for financialtransparency for the lending component alone and leverages the RLF through the sale ofloans with 1st and 2nd mortgages.
These are “pure” RLF business models. NWOs have a tendency to incorporate a hybrid of JustLending and Lending Plus with Loan Sales to fit their mission and programmatic structure. LoanSales tends to be a capitalization strategy but it can stand alone as a business model as well.
The ten RLFs in the study represented the following business models: Six were Lending Plus;
One Lending Plus & Loan Sales;
Two Just Lending & Loan Sales; and
One Loan Sales
The business models will be further explored and become important when looking at the loanfund capacity and performance indicators throughout CAMEL.
RLF LOAN PRODUCTSAs evidenced in the RLF assessment there were two primary loan product categories – homebuyer assistance and home improvement. Key personnel interviews revealed a variety of loanproducts in each category, but between the review of the RLF assessments and scrutiny of theborrower databases, it was impossible to consistently discern these loan products for analysis.
The Home Buyer Assistance loan product has two basic loan products – Home Mortgages,and Down Payment/Closing Costs loans.
Home Mortgage loans are amortized and can be leveraged with other loan providersthat offer the 1st mortgage. NWOs also offer Home Mortgages with no outside lenderparticipation that is amortized with 1st mortgage.
Residential Loan Products
Home Buyer Assistance Home Improvement
Home Mortgages Down Payment andClosing Costs
Purchase / Rehab Owner Rehab Minor Repair

12
Down Payment/Closing Cost loans are provided by the NWO or leveraged with otherloan providers. These loans can be secured through a first, second or other mortgage,and are amortized, deferred, forgivable, or grants.
Home Improvement loan product has three loan products – Purchase/Rehab, Owner/Rehaband Minor Repairs ($2,000 or less).
Purchase/Rehab loans can be combined with Home Buyer Assistance loans whereasthe 1st mortgage can be captured by a lending partner. A lending partner or the NWOcan provide the rehab and down payment/closing loan costs which can be anamortized loan, a deferred loan, a forgivable loan or a grant. These loans tend to besecured by a second or other mortgage.
Owner/Rehab loans can be amortized, deferred, forgivable, or grants. They also canbe secured by a second or other mortgage.
Minor Repair loans are less than $2,000. These loans are not usually secured. Theyare provided as loans only and can be amortized, deferred or forgivable.
In addition to the above described loan products, the assessments also discovered that some of theNWOs are providing Foreclosure Prevention Loans with no discernable pattern in amortizing vs.non-amortizing loans.
PRODUCTION ANALYSISNine of the ten NWOs provided borrower databases from January 1, 2005 through December 31,2007 representing annual loan production incorporating any loans that may have been sold at alater time (see Addendum “C” for loan production data points). During the three-year periodanalyzed there were 2,998 individual loans in the aggregate database comprising over $375.4million in total project value including RLF funds, leveraged funds and owner’s contributions.
Aggregate Annual Production VolumeRLF Funds, Leveraged Funds and Owner’s Contributions
2005-2007
2005 2006 2007 3-yr Totals
Total Annual Principal Amt 104,510,841 128,927,238 142,010,706 375,448,785# of Annual Loans 879 987 1,132 2,998
RLF Funds 31,418,294 40,512,880 42,329,138 114,260,313%RLF to Loan Principal 30.06% 31.42% 29.81% 30.43%
Leveraged 67,212,161 80,975,081 91,992,545 240,179,787%Leveraged to Loan Principal 64.31% 62.81% 64.78% 63.97%
Owner's Contribution 5,880,386 7,439,277 7,689,024 21,008,686% Owner's Contribtuion to Loan Principal 5.63% 5.77% 5.41% 5.60%
9 NWOs
RLF funds comprised over 30 percent of the total principal amount2 in the 3-year totals realizingalmost a 2:1 ratio – for every RLF dollar and additional two dollars were leveraged to make thedeal flow.
Part of the production analysis was to look at two key questions:1) Of the total RLF loan volume what percentage are 1st, 2nd, other mortgages, and
unsecured loans?
2 Total principal amount is the total cost of the loan deal. It includes all contributions to make the loan dealhappen.

13
3- Year RLF Loan Production & Mortgage Analysis 2005-2007
RLF Loan Amt % of RLF
1st Mortgage 76,055,630 67%2nd Mortgage 30,839,876 27%
Other Mortgage 4,555,990 4%Loans 2,808,816 2%
Total RLF Loans 114,260,312
Of the total RLF loan volume 67% were 1st mortgages, 27% were second mortgages and 4% wereother mortgages. In addition, only 2% of the total RLF loans were unsecured loans.
2) Of all RLF mortgages and unsecured loans what percentage are amortized, deferred,
or forgivable?
3-Year Total RLF Loan Amt, Terms and Mortgage Analysis 2005-2007
Total RLF
Loan Amt
RLF
Amortized
Loans
% of RLF
Amortized
Loans
RLF
Deferred
Loans
% of RLF
Deferred
Loans
RLF
Forgivable
Loans
% of RLF
Forgivable
Loans1st Mortgage 76,055,630 75,537,292 99% 442,800 1% 75,538 0%2nd Mortgage 30,839,876 21,695,076 70% 8,104,168 26% 1,040,633 3%
Other Mortgage 4,555,990 1,079,485 24% 1,971,954 43% 1,504,551 33%Loans 2,808,816 2,304,244 82% - 504,572 18%
All RLF Loans 114,260,312 100,616,096 88% 10,518,922 9% 3,125,294 3%
As illustrated in the chart above, 99% of all RLF 1st mortgages were amortized, and 70% of RLFsecond mortgages were amortized. Of RLF other mortgages 43% were deferred and 33% wereforgivable. As for the unsecured loans 82% were amortized.
In summary, one area of concern has been the degree to which NWOs utilize deferred loans andother non-amortizing loan structures, thus possibly weakening the overall RLF performance.The annual loan production analysis revealed that non-amortizing loan structures were not a largecomponent of residential loans with first and second mortgages, and when used as an othermortgage type tended to strengthen first and second mortgage lending types. The productionanalysis demonstrated that the RLF–
o Grew over the 3 years analyzed
o Contained 88% amortized, 9% deferred, and 2% forgivable loans
o Could be further broken out as 67% in 1st mortgages, 27% in 2nd mortgages
o Showed better than a 2:1 leverage ratio of RLF capital to external sources of funding to
make the loan deal happen
PERFORMANCE ANALYSISThe following segment is an in-depth analysis of ten NeighborWorks® organizations’ residentiallending line of business. This segment divides into five sections presenting each component ofCAMEL – Capital, Asset quality, Management and Marketing, Earnings, and Liquidity. Withineach section there are a series of questions focusing on the aggregate analysis of key capacity andperformance indicators of the ten NWOs (see Addendum “C” for a list of the questions).

14
Following each section, observations are noted along with a recommended CAMEL standard.The CAMEL standards were devised and recommended by the nine NWOs attending a conveningheld January 28-30, 2008 in New Orleans, LA. During this first and only meeting, NWOexecutive staff were understandably reluctant to indicate benchmarks for some of the standards.These are noted throughout this section.
Capital (Capacity Measure)Capital refers to capitalization of the loan fund. The individual NWO assessments reviewed threeyears of audits, other internal financial documents and conducted key personnel interviews. Theaudits revealed that each organization had multiple sources of secured funding for re-lendingactivities. Some of these funds were borrowed from public and private sources such as CDFI andbanks. In addition to borrowed funds, the NWOs also capitalized their RLFs with equity fundssuch as capital grants and contributions, as well as sold loans to a secondary market. Thefollowing analysis explores the three avenues of loan pool capitalization and the leveraging ofRLF funds.
1) RLF CapitalizationAudits between 2005 and 2007 and other internal financial documents revealed thatNeighborWorks® America capital comprised approximately 31percent of total funds in the RLFfor re-lending, for slightly better than a 2:1 capitalization leveraging ratio.
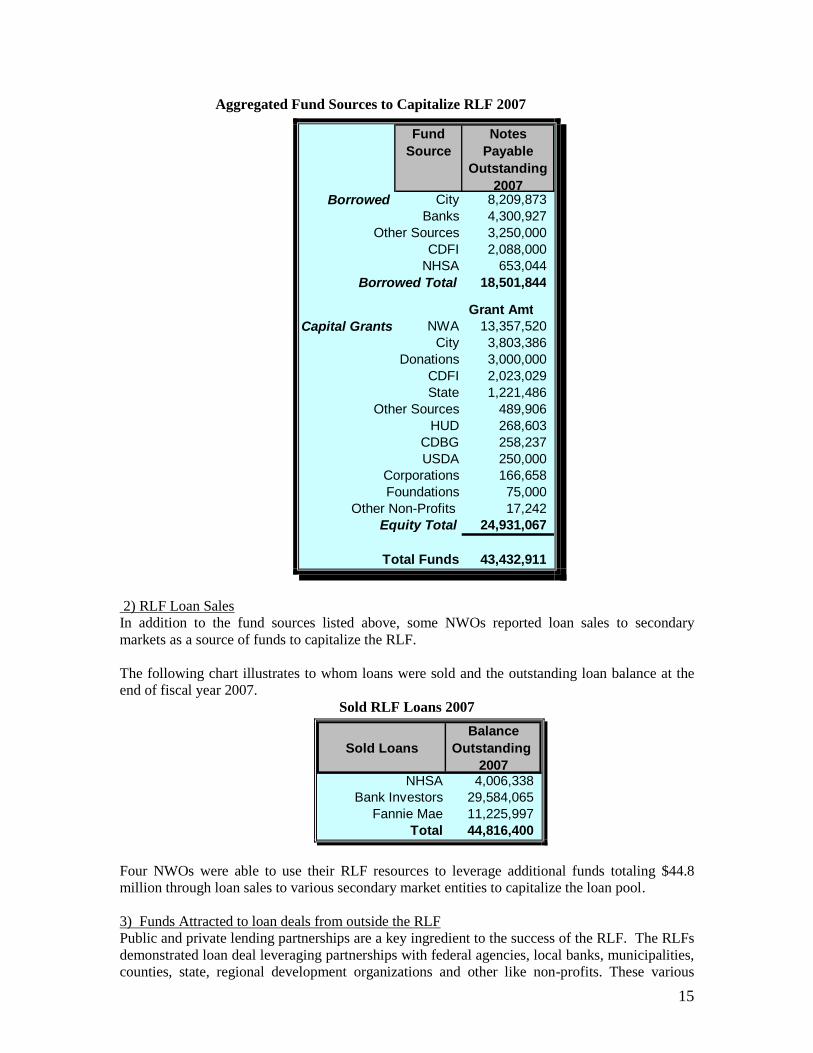
The following table shows the aggregated fund sources, notes payable as borrowed funds, andcapital grants awarded at the end of fiscal year 2007. Capital grants function as revolving fundsand are considered equity3.
3 For the purposes of this analysis only, it must be noted that NWA capital in practice functions more like“near equity” due to restrictions in our grant agreement language.
15
Aggregated Fund Sources to Capitalize RLF 2007
Fund
Source
Notes
Payable
Outstanding
2007Borrowed City 8,209,873
Banks 4,300,927Other Sources 3,250,000
CDFI 2,088,000NHSA 653,044
Borrowed Total 18,501,844
Grant Amt
Capital Grants NWA 13,357,520City 3,803,386
Donations 3,000,000CDFI 2,023,029State 1,221,486
Other Sources 489,906HUD 268,603
CDBG 258,237USDA 250,000
Corporations 166,658Foundations 75,000
Other Non-Profits 17,242Equity Total 24,931,067
Total Funds 43,432,911
2) RLF Loan SalesIn addition to the fund sources listed above, some NWOs reported loan sales to secondarymarkets as a source of funds to capitalize the RLF.
The following chart illustrates to whom loans were sold and the outstanding loan balance at theend of fiscal year 2007.
Sold RLF Loans 2007
Sold Loans
Balance
Outstanding
2007NHSA 4,006,338
Bank Investors 29,584,065Fannie Mae 11,225,997
Total 44,816,400
Four NWOs were able to use their RLF resources to leverage additional funds totaling $44.8million through loan sales to various secondary market entities to capitalize the loan pool.
3) Funds Attracted to loan deals from outside the RLFPublic and private lending partnerships are a key ingredient to the success of the RLF. The RLFsdemonstrated loan deal leveraging partnerships with federal agencies, local banks, municipalities,counties, state, regional development organizations and other like non-profits. These various

16
partners provided direct loans, deferred loans, forgivable loans and/or grants to the borrower. Allof these loan types were considered as leveraged sources. In addition, the borrower andsometimes the seller would contribute to make the loan deal happen.
The best source of data for this leveraging ratio appears in the production data as discussed in theprevious report section. As discussed previously, the production data illustrated an RLF 2:1capitalization leveraging ratio; for every RLF dollar, there were $2 of leveraged funds to makethe loan deal happen.
In summary, the NWOs demonstrated that the RLF was comprised of 31 percent ofNeighborWorks capital and was able to leverage the RLF in three fundamental ways: 1) loan poolcapitalization with a NeighborWorks® capital 2:1 ratio, 2) selling loans to outside secondarymarkets, and 3) partnering with outside entities to make a loan deals happen which also showed aRLF 2:1 ratio.
Another important aspect of capitalization is minimization of the loan pool risk. This isaccomplished through the development of a loan loss reserve (LLR). Some RLF loan poolinvestors, including buyers of loans, require a certain amount of restricted cash reserves to be setaside to protect their principal investments. On the whole, investor’s LLR requirements were metby all NWOs; however, only four NWOs had a written LLR policy. Five had no written LLRpolicy which caused auditors and management to calculate the LLR and adjust the loanreceivables at the time of the annual audit.
As an outcome of the New Orleans convening held in January 2008, participating NWOsrecommended the following capital standard, key capacity indicators, measurements andbenchmarks.
Capital StandardThe NWO has a credible capitalization plan to support its lending activities.
Key Capacity Indictors :
Indicator Measurement Benchmark
Sources of Funds NWO has adequate sources offunds (public and/or private) to allowcontinuity of lending.
Projected cash available =projected loan volume
Leverage NWO leverages resourcesconsistent with operating plans.
Loan Loss Reserve NWO has a Loan Loss Reservepolicy to determine the LLR amountfor all loan products offered.
Asset Quality (Performance Measure)Loan fund managers are concerned about the quality of their loans (assets) since loan interestincome provides earnings to the RLF. Two indicators are examined in this area - 90+ daydelinquency ratio and the net loan loss ratio.
Management tracks 30, 60, and 90+ day delinquencies, however, 90+ day delinquent loans serveas a better indicator to inform the risk of the entire RLF portfolio. The chart below illustrates theaggregate 3-year total outstanding loan balances and the aggregate 3-year total 90+ day

17
delinquency loan balances for 9 NWOs.4 The Loan Sales model does not hold loans on a long-term basis and therefore no delinquencies were reported in 2005, 2006 and 2007.
Aggregate and Business Models 90+ Days Delinquency Ratio 2005-2007
Outstanding
Loan Balance 90+ Day DelAvg Del
RatioLending Plus 5,290,056 24,111 0.46%
Lending Plus 15,165,254 278,909 1.84%Lending Plus 29,382,144 831,101 2.83%
Lending Plus 5,813,491 436,000 7.50%Lending Plus 6,272,458 1,238,988 19.75%
Lending Plus 7,398,465 3,516,428 47.53%Lending Plus & Loan Sales 6,317,914 183,076 2.90%Just Lending & Loan Sales 118,814,211 375,593 0.32%Just Lending & Loan Sales 27,057,883 250,389 0.93%
Aggregate 3-year Totals 221,511,876 7,134,595 3.22%
3-Yr Aggregate Totals
According to CDFI Fund the national average delinquency ratio for loan funds providing firstmortgages is 7percent. The nine RLF demonstrated an aggregate 3-year average delinquencyratio at 3.22% , well below the CDFI average delinquency ratio. However, three out of sixLending Plus models showed an average delinquency ratio greater than the national standard,while the other hybrid models were below. This raises a question concerning the correlation ofthe asset quality to homeownership counseling and portfolio management.
Delinquent and defaulted loans do not create income for the RLF and therefore are non-performing loans. Loans in default are also called bad debt, bad loans, or “toxic” assets. Whenwriting-off bad debt, adjustments can be made to either the LLR or expensed on the Statement ofActivities. But in all cases the outstanding loan balance is adjusted. Some bad debt values arerecovered either through foreclosure and asset liquidation or borrower repayment. Therefore, thisanalysis looks at the net loan loss (bad debt write-offs minus bad debt recovery) as opposed tojust bad debt write-offs.
Several of the NWOs have a policy to foreclose and liquidate the asset prior to write-offs. Thispractice allows for a low or zero net loan loss ratio and lessens the risk of the portfolio. Five ofthe RLFs reported zero bad debt write-offs or bad debt recovery between 2005 and 2007. Thefollowing chart illustrates the remaining five RLFs 3-year aggregate outstanding loan balancesand write-offs in relation to the business model.
4 One NWO, (Loan Sales) did not demonstrate any delinquency or loan loss information since they selltheir loans upon closing.

18
Aggregate Business Models Net Loan Loss Ratio 2005-2007
Outstanding
Loan Balance
Net Write
Offs
Avg
Loan
Loss
RatioLending Plus 5,290,056 (8,373) -0.16%
Lending Plus 15,165,254 9,694 0.06%
Lending Plus 6,272,458 173,067 2.76%
Lending Plus & Loan Sales 6,317,914 45,300 0.72%Just Lending & Loan Sales 27,057,883 94,897 0.35%
3-yr Totals 60,103,565 314,585 0.52%
3-Yr Aggregate Totals
As can be seen, the 3-yr total net loan loss ratio averaged below one percent. This net loan lossratio is low in comparison to national standards of greater than 2%.
As an outcome of the New Orleans convening, the participating 9 NWOs recommended thefollowing asset quality standard, key capacity indicators, measurements and benchmarks.
Asset Quality StandardThe NWO originates and manages sound performing loans consistent with the mission.
Key Performance Indicators:
Indicator Measurement Benchmark
Homebuyer assistance Tied to local private sector mortgageperformance (i.e. market specific) or,<5%.
Home Improvement < 10% of outstanding loan balance
Home Purchase- FirstMortgage Lien
andHomebuyer assistance
Home Improvement
Home Purchase- FirstMortgage Lien
Net Loan Loss (Write Offs
minus bad debt recovery)
Net Loan Loss isdetermined by loansexpensed as a bad debt orcredited to the restrictedLLR cash reserve plus anybad debt recovered asrevenue.
3 year trend analysis
Default rate < 2%
3 year trend analysis
90+ days Delinquency
Delinquencies aredetermined by 90+daysdelinquent of outstandingloan balance minus non-amortized loans.
Management and Marketing (Capacity Measurement)All of the NWOs in the assessment have qualified staff in place to manage and operate the loanfund, and sometimes make loan decisions. Staff have mortgage origination or loan experience,and/or portfolio management and loan origination training. The Executive Directors felt havingstaff experienced in the mortgage field was essential to operating and maintaining a sound

19
residential loan fund. In addition, when a loan committee was utilized to make loan decisions, theassessment found that the committee and/or board members were highly qualified.
All NWOs were in compliance with current mortgage origination state and federal licensingrequirements. One NWO, a mortgage banker, had a Nationwide Mortgage License System(NMLS) license as required by federal and state governments. In August 2009, all mortgageoriginators will be required to have an NMLS license. This includes all non-profits nation-wide.Prior to August of 2009, the NWOs will have to obtain the NMLS license to originate mortgageloans. Upon a random review of the loan files, all NWOs were in compliance with all requiredlegal documents for mortgage loans.
All the NWOs had loan fund policies and procedures in some form. However, four of the ten didnot address loan loss reserve in their policies. Also, many of the policies did not address write-offs, portfolio quality control, risk rating, the role of the loan committee or other aspects of loanprocessing, management, and oversight. Loan fund policies on the whole were not boardapproved within the last year.
NWOs varied in the planning aspects of the RLF. The Just Lending and Loan Sales businessmodels tended to project RLF annual loan volume, revenue and expenses (proforma), track FTEdedicated to lending functions and provided a budget to actual. They demonstrated around 26loans to FTE and between $4,000 and $7,000 operating expenses per loan.
The Lending Plus business model tended not to project lending volume, revenue and expenses butrather projected the number of annual loans. Also the number of annual loans to FTE andoperating expenses to loan were difficult to calculate since this function is so integrally tied to thehomeownership training and technical assistance components of the program. However, theseorganizations prepare annual budgets and report budget to actual to management and boards.
The NWO Board of Directors provided oversight to the RLF. Management prepared andpresented loan fund information to the board of directors and/or the loan committee on a pre-described schedule. All NWOs reported loan fund activity and loan fund performance, but fewreported cash available for lending and none report deployment information.
As an outcome of the New Orleans convening, nine NWOs executive staff recommended thefollowing management and marketing standard, key capacity indicators, measurements andbenchmarks.

20
Management and Marketing Standard
Key Capacity Indicators:
Indicator Measurement Benchmark
Loan Policies andProcedures
Defined processes for loan approval,underwriting, collateralization,licensing, monitoring and qualitycontrol, portfolio mgmt, loan lossreserve, write-offs, and borrowereligibility.
Ratified by Board every year.
Staff and BoardCapacity
Dedicated staff and board membershave the professional experienceand/or education and licensing inrelated field(s).
Dedicated staff are qualified to originate,underwrite, monitor, and service loanproducts offered by the NWO (i.e. qualitycontrol plan in place).
Market The NWO operates with a clearunderstanding of the market trends andhas developed loan products to meetthe market demand.
A market study or market analysis hasbeen developed and is described inorganization’s underwriting proposal.
PerformanceMeasures
NWO projects next year’s lendingactivity, including the number andamount of loans, earned income andassociated expenses.
Has a cost accounting system for thelending line of business and prepares areport comparing the projected lendingactivities with actual.
Loan PerformanceData
NWO has financial systems in placeto report loan fund performance toboard and management
Write-offs and delinquency reports perloan fund, individual loan fund outstandingloan balances, new loans approved andloan closure reports, principal repayments,available cash for lending in each loanfund, and interest earned.
The NWO has the staff and board capacity, partnerships developed, and the policies and financialsystems in place to operate the RLF in a defined market and be in compliance with all applicablerequirements.
Earnings (Performance Measure)Earnings are calculated on the revenue minus expenses model. One of the questions guiding thissection of the report relates to the cost of funds and the price of RLF loans.
What is the relationship between the cost of funds and the price of RLF loans?
Interest income is dependent upon having performing loans on the books, and interest expense isderived from cost of funds borrowed. These two indicators represent the cost of funds and theprice of loans.
Depending on the RLF business model employed, interest income and interest expense variesbetween organizations. The Loans Sales business model is based on selling loans to recapitalizethe loan pool. This may not allow for a high volume of interest income or interest expense.Lending Plus relies heavily on capital grants to capitalize the loan pool and therefore may notdemonstrate a significant interest expense. However, Just Lending business model can showinterest income and interest expense in the financial documents.
The following chart calculates the three-year sum of interest income and interest expense toillustrate the spread between interest income and interest expense for the various RLF businessmodels. As illustrated, only 5 of the NWOs are represented in the chart; 4 NWOs (Lending Plus

21
models) did not borrow funds, and the Loan Sales & Lending Plus model could not discern loaninterest income from other interest income in their audits and financial documents. Therefore,these five RLFs were omitted from this analysis.
Interest Expense to Interest Income 2005-2007
Business Model
3-yr Interest
Income
3-yr Interest
Expense RatioLending Plus (2) 1,026,747 425,646 2:01
Just Lending & Loan Sales (2) 2,290,662 828,525 3:01Loan Sales (1) 57,604 7,881 7:01
Totals 2,348,266 836,406 3:01
As seen above, the Loans Sales model’s interest income and interest expense values were low incomparison to the other business models. This model, however, earns some interest while waiting30-45 days for the loan sale transaction to take place. The ratio shows that for every dollar owed,this RLF business model earned almost $7 to every dollar owed. The risk associated with thisapproach is that if the RLF were unable to sell their mortgages shortly after funding, then theywould sustain a negative arbitrage on interest expense as well as potential higher cost of capitaldue to the need to convert the borrowed capital form short-term to longer-term notes.
The Just Lending & Loan Sales business models earned between three dollars for every dollarowed while Lending Plus earned two dollars. It must be noted that the five NWOs analyzedabove is a very small number and can not be generalized to the whole population. However, itmay indicate that the business model type employed may influence the potential spread betweenprice of loans and cost of funds. This is an area for further research.
Another question surfaces when analyzing earnings.Do certain RLF business models generate sufficient earned income to cover all expenses?
Earned Income comprises Net Interest Income, Fee Income, and Investment Income. Thequestion above is directly related to the loan fund’s ability to sustain its operations through earnedincome. The following chart looks at the operational ratio – Earned Income to Total Expenses –of the various RLF business models.
3-Year Total Operational Ratio 2005-20075
Earned Income
Oper & Admin
Exp Net Income Opr Ratio
Lending Plus (5) 2,675,814 5,499,794 (2,823,980) 48.65%
Loan Sales & Lending Plus (1) 359,689 1,063,182 (703,493) 33.83%Loan Sales & Just Lending (2) 4,616,958 3,452,759 1,164,199 133.72%
Loan Sales (1) 435,465 2,215,326 (1,779,861) 19.66%Totals 8,087,926 12,231,061 (4,143,135) 66.13%
5Nine NWOs were included in this analysis. One NWO’s earned income, except for interest income, and all expenses were
attributed to the organization’s general fund.

22
As illustrated, the Loan Sales & Just Lending hybrid model earned sufficient income, during the3-years analyzed, to cover expenses while the other models did not. This suggests that LendingPlus and Loan Sales may require other types of revenues to sustain lending and programmaticexpenses.
The chart below looks at the sustainability ratio – total Revenue to Expenses - of the various RLFbusiness models.
3-Year Sustainability Ratio 2005-2007
Total Revenue
Oper & Admin
Exp Net Income
Sustainability
Ratio
Lending Plus (5) 7,119,672 5,499,794 1,619,878 129%Loan Sales & Lending Plus (1) 1,158,123 1,063,182 94,941 109%Loan Sales & Just Lending (2) 4,805,419 3,452,759 1,352,660 139%
Loan Sales (1) 1,922,333 2,215,326 (292,993) 87%Total 15,005,547 12,231,061 2,774,486 123%
Nine RLFs were included in this analysis. One RLF’s total Earned Income and Expenses wereattributed to the organization’s general fund, therefore omitted from the analysis.
As shown above, Lending Plus models were sustainable over 100 percent with additionalRevenue. Other Revenue may include administrative grants, and donations & contributions. Itmust be noted that the Loan Sales business model above has been in operation for three years andits dependency on the parent organization’s subsidies has been declining throughout the timeframe analyzed.
In summary, Loan Sales and Just Lending hybrid business model showed a 3:1 ratio between costof funds and the price of RLF loans as well as a greater than 100 percent Operational Ratio.While these figures can not be generalized throughout the network, it indicates that the price ofthe RLF loan may exceed the cost of funds by 3-4% to cover the operation expenses. Theexception to this would be the Loan Sales model with a 7:1 ratio between the cost of funds andthe price of the RLF loan. The Loan Sales model as seen above did not reach scale of interestearnings and had low interest expense nor did it secure additional revenues to cover its operationexpenses without subsidies from the parent organization.
As an outcome of the New Orleans convening, 9 NWOs executive staff recommended thefollowing earnings standard, key performance indicators, measurements and benchmarks.

23
Earnings Standard
Key Performance Indicators:
Indicator Measurement Benchmark
3-year trend analysis -- Income minus Expense
formula:
Revenue:
Interest Income(Interest Expense)
Investment Income
Fee Income
Bad Debt RecoveryExternal source contributions (grants, fundraising,etc)
Total RevenueExpenses:Bad Debt ExpensesLoan Loss Reserve ExpensesOperating Expenses
Total Expenses
Net Operating Income
Loan Fund Sustainability Ratio _______
(Total Revenue/Total Expenses)
Net InterestIncome Ratio
Interest expense/interest income Should exceed 1:1
Loan Fund SustainabilityRatio should remain the sameor increase during the three-
year trend.
Loan FundSustainability
Ratio
The RLF contributes to the NWO's unrestricted income on a continuous basis by earning fees forservice, and a positive net income. The NWO has financial strength in the line of business in away that is appropriate to its mission, risk, sources of funds and market conditions.
Liquidity (Capacity Measure)Liquidity ratios usually refer to Current Ratio, Quick Ratio, and Days Cash Available. However,most RLFs do not create a balance sheet but are consolidated with the over-all organization’sFinancial Position Statement. Therefore, the standard liquidity ratios could not be calculated.
RLF liquidity measures, in this study, refer to the deployment of cash available for lending. Thedeployment ratio is a management tool that can be used to determine whether to secure additionalloan pool funds. It must be noted that a good business practice is to retain approximately 25percent of cash for re-lending thereby providing a liquidity cushion. The benchmark in theindustry for seeking additional cash for lending is equal to or greater than 75 percent. As well, thebenchmark that determines whether a loan fund has sufficient cash for relending is below 65percent.
The deployment formula used in this analysis wasOutstanding Loan Balance/ (Outstanding Loan Balance + Cash Available for Lending)
The following chart shows the aggregate total of outstanding loan balances, cash available forlending, and the deployment ratio for eight RLFs in the study. One RLF (Loan Sales) utilized ashort-term line of credit for relending along with loan sales to capitalize the loan fund, andtherefore had no cash for relending. Once the loans were sold, the capital was immediately turnedover into new loans, or the line of credit was repaid. Another RLF’s cash available for lending

24
was held in the parent organization’s general fund and could not be discerned from other forms ofcash. Those two RLFs were omitted from the following analysis.
3-Year Average Deployment Ratio 2005-2007
2005 2006 2007 3-YR Average
20,345,304 22,982,035 27,978,352 23,768,564
16,862,710 18,833,378 19,294,193 18,330,094
Cash and Balances Total 37,208,014 41,815,413 47,272,545 42,098,657Deployment Ratio 54.68% 54.96% 59.19% 56.46%
Total Loan Balances
Total Cash Available
AggregateDeployment Ratio
As shown in the aggregate, the RLF loan pool had below 65 percent deployment ratio whichindicates sufficient cash for relending. But when looking deeper into the individual RLF businessmodels a clearer picture surfaces.
RLF Business Models 3-Year Average Deployment Ratio 2005-2007
2005 2006 2007
3-YR
Average
Lending Plus 59.29% 55.37% 59.03% 58.02%Lending Plus 70.98% 75.75% 80.58% 75.77%Lending Plus 91.91% 89.39% 83.62% 87.90%Lending Plus 44.80% 76.19% 69.75% 60.42%Lending Plus 67.95% 31.08% 48.78% 45.77%
Loan Sales & Lending Plus 77.97% 83.41% 80.76%Loan Sales & Just Lending 41.40% 51.63% 56.65% 50.23%Loan Sales & Just Lending 43.91% 46.09% 46.60% 45.54%
As shown Loan Sales & Just Lending business models had sufficient cash for lending throughoutthe three year period. The Lending Plus business model varied throughout the time frame.However, two Lending Plus models and the Loan Sales & Lending Plus model suggested theneed for additional capital for lending.
In summary, liquidity measures such as deployment ratios are most useful as management toolsto determine whether to seek additional funds to capitalize the loan pool. This varies among theRLF business models, suggesting that, the deployment ratio may be a useful tool to determine theamount of capital grant awards as well as a reliable indicator in determining the financial strengthof the RFL.
As an outcome of the New Orleans convening, 9 NWOs executive staff recommended thefollowing liquidity standard, key performance indicators, measurements and benchmarks.

25
Liquidity Standard
Key Capacity Indicators:
Indicator Measurement Benchmark
Cash ManagementPlan
Cash management planinclusive of cash flowprojections for all loanproducts.
projection for 90 days or a clearplan to address any anticipatedcash short-fall.
Deployment Ratio NWO generates internaldocuments indicating theavailable cash for re-lendingand outstanding loan balancefor each funding source.
The NWO's lending line of business has sufficient liquid assets to fund operations,short-term liabilities and unexpected short-falls. The NWO's lending line of businesshas sufficient cash available for lending or a plan to secure the funds to meet theannual lending projections.

26
ADDENDUM “A”
Indicators Lending Standards
3 year trend Annual Loan volume including annual principal recaptured per loan fund
Loan Volume Projection to Actual
Creates an annual lending proforma projecting earned revenues and Operating Expenses
Comparison of 3 yr trend average to future volume projection
Annual Direct Loan, Participation, and Equity investment 3-yr trend analysis
#of loans/FTE
Cost/ # of loans
Lending Policy and procedures
operating expenses/ # loans
total days loan intake to closing/ # Loans
Staff and board capacity
Appropriate lender or broker licenses
All necessary documents in loan files
Periodic financial and loan performance reporting to board and management
Leveraging Annual Direct Loan, Participation, and Equity investment 3-yr trend analysis
# of loans managed/ # of FTE managing loans
Loan management operating expenses/ # of managed loans
Managed Portfolio Earnings/ # of Managed loans
# & % of loans to underserved individuals
# & % of loans to underserved communities
3- yr trend Operating Ratio (Earned Income/Operating Expenses)
3 -yr trend Sustainability Ratio (Total Revenue/Operating Expenses)
Lending Net Income/Org Net Income
InterestExpense/ Interest Income
Lending Net Cash Flow/Org Net Cash Flow
Lending Net Asset Change/Org Net Asset Change
Each Loan Fund Deployment Ratio (Outstanding Loan Bal/Cash Available for Lending plus outstanding loan bal)
Loan Loss Reserve meets investors requirements or Org's Policy and Procedures
Amount of Loan Loss Reserve/ Amount of Loan Portfolio
90+days loan bal delinquent/Outstanding Loan Balance per loan fund
Write off amount/outstanding loan balance per loan fundAsset Quality
Risk
Proposed Lending Standards
For the
NWO Residential Lenders
Production
Operating
Managed Loans
Mission
Financial
Liquidity

27
ADDENDUM “B”CAMEL Questions
CAPITAL:1) What are the sources of funds to capitalize the loan fund? List borrowed funds, Pmt
term, and maturity date in a three year trend. List capitalization grants, funder andaward date for the last three years?
2) What is the annual direct loan volume, participation and equity investment 3-year trendanalysis?
3) Is the Loan Loss Reserve adequate to meet investor's requirements or Organization'sPolicies and Procedures?
4) What is the ratio of each loan fund's loan loss reserve to the outstanding loan fundportfolio?
ASSET QUALITY:5) What are the 90+ day delinquency ratios for each loan fund/product and the entire loan
portfolio (do not include managed funds)?
6) What is the write-off ration for each loan fund and the entire loan portfolio (do notinclude managed funds)?
7) What are the 90+ day delinquency ratios for each managed fund?
8) What are the write-off ratios for each managed fund?
MANGEMENT/MARKETING:9) Does the NWO compare a 3-year average production to future volume Projection?
10) Does the NWO create an annual lending proforma projecting earned revenues andoperating expenses associated with the residential lending line of business?
11) Does the NWO project loan volume annually and provide a projection to actual report?
12) What is the number of annual loans to FTE?
13) What is the annual operating expense to the number of loans produced annually?
14) Does the NWO have a current Lending Policy and Procedure that depicts borrowereligibility, underwriting, criteria, loan products, loan loss reserve, write-offs,rewrites/restructured, loan approval process and authority, portfolio risk rating, portfoliomanagement, loan fund committee/board, and other aspects of the lending process?
15) Does NWO staff have the capacity to originate and underwrite loans?
16) Do NWO Board members have the capacity to make loan action decisions?
17) In a random selection of 4 loan files are all required legal documents contained in thefiles?

28
18) Does the residential landing line of business periodically report financial and loanperformance to the board and management, inclusive of delinquencies, defaults, cashavailable for lending and deployment ratios?
19) Does the NWO have the required and necessary state lender and broker licenses toconduct a residential lending line of business?
EARNINGS:20) Does the NWO sell package or service loans? If so, provide descriptions, inclusive of
loan owners, dollar volume, number of loans and fees earned in a three-year trend.
21) In a three-year trend what are the operating expenses to sell packaged or services loansoutside of the direct lending operations?
22) In a three-year trend what is the net income per managed loan? (Ratio = net income/#ofloans)?
23) For the direct lending line of business, what is the operating ratio in a three-year trend(Earned Income/operating Expenses)?
24) What is the sustainability ratio in a 3-year trend (Total Revenue/Operating Expenses)?
25) How much net income is the residential lending line of business contributing to the over-all organization's net income (Lending net income/org net income)
26) What is the contribution of the lending net asset change to the over-all organization's netasset change?
27) What is the ratio of interest expense to interest income in a three-year trend? (Interestexpense/interest income)
28) In a three-year trend what is the annual loan volume and annual principal recaptured perloan fund?
LIQUIDITY:29) What is the deployment ratio of each loan fund and the aggregate loan pool?
(Outstanding loan bal/cash available for lending plus outstanding loan balance)
SOCIAL IMPACT:30) In a three-year trend what is the total # and % of loans going to underserved individuals
and underserved communities?

29
ADDENDUM “C”Borrower Data Points
Collected UsingNStep Crystal Reports
2005-2007
Client ID Client name Zip Code Census Tract Closing Date Purchase Price Amount Rate Term Fund Source Fund Type Source of Funds

30
ADDENDUM “D”
Recommended RLF Capacity and Performance Standards
The RLF assessment was based on in-house proposed performance standards and a CAMELmethodology (Addendum “A” and Addendum “B”). Upon completion of the individual RLFassessments, each participating NWO received an individual RLF Assessment Report. NWOsrecommended RLF capacity and performance standards at a convening held January 28, 2008 inNew Orleans, Louisiana. Nine of the ten NWOs attended along with key NeighborWorks® staff.At the culmination of the convening, the NWOs firmly suggested that this process be thebeginning of the lending project and not the end. In addition, it must be noted that the NWOs atthe convening and during their deliberations engaged in limited discussions on benchmarks forsome of the performance standards.
The following are the recommended capacity and performance standards as the nine NWOexecutive staff recommended.
Capital StandardThe NWO has a credible capitalization plan to support its lending activities.
Key Capacity Indictors :
Indicator Measurement Benchmark
Sources of Funds NWO has adequate sources offunds (public and/or private) to allowcontinuity of lending.
Projected cash available =projected loan volume
Leverage NWO leverages resourcesconsistent with operating plans.
Loan Loss Reserve NWO has a Loan Loss Reservepolicy to determine the LLR amountfor all loan products offered.

31
Asset Quality StandardThe NWO originates and manages sound performing loans consistent with the mission.
Key Performance Indicators:
Indicator Measurement Benchmark
Homebuyer assistance Tied to local private sector mortgageperformance (i.e. market specific) or,<5%.
Home Improvement < 10% of outstanding loan balance
Home Purchase- FirstMortgage Lien
andHomebuyer assistance
Home Improvement
Home Purchase- FirstMortgage Lien
Net Loan Loss (Write Offs
minus bad debt recovery)
Net Loan Loss isdetermined by loansexpensed as a bad debt orcredited to the restrictedLLR cash reserve plus anybad debt recovered asrevenue.
3 year trend analysis
Default rate < 2%
3 year trend analysis
90+ days Delinquency
Delinquencies aredetermined by 90+daysdelinquent of outstandingloan balance minus non-amortized loans.

32
Management and Marketing Standard
Key Capacity Indicators:
Indicator Measurement Benchmark
Loan Policies andProcedures
Defined processes for loan approval,underwriting, collateralization,licensing, monitoring and qualitycontrol, portfolio mgmt, loan lossreserve, write-offs, and borrowereligibility.
Ratified by Board every year.
Staff and BoardCapacity
Dedicated staff and board membershave the professional experienceand/or education and licensing inrelated field(s).
Dedicated staff are qualified to originate,underwrite, monitor, and service loanproducts offered by the NWO (i.e. qualitycontrol plan in place).
Market The NWO operates with a clearunderstanding of the market trends andhas developed loan products to meetthe market demand.
A market study or market analysis hasbeen developed and is described inorganization’s underwriting proposal.
PerformanceMeasures
NWO projects next year’s lendingactivity, including the number andamount of loans, earned income andassociated expenses.
Has a cost accounting system for thelending line of business and prepares areport comparing the projected lendingactivities with actual.
Loan PerformanceData
NWO has financial systems in placeto report loan fund performance toboard and management
Write-offs and delinquency reports perloan fund, individual loan fund outstandingloan balances, new loans approved andloan closure reports, principal repayments,available cash for lending in each loanfund, and interest earned.
The NWO has the staff and board capacity, partnerships developed, and the policies and financialsystems in place to operate the RLF in a defined market and be in compliance with all applicablerequirements.

33
Earnings Standard
Key Performance Indicators:
Indicator Measurement Benchmark
3-year trend analysis -- Income minus Expense
formula:
Revenue:
Interest Income(Interest Expense)
Investment Income
Fee Income
Bad Debt RecoveryExternal source contributions (grants, fundraising,etc)
Total RevenueExpenses:Bad Debt ExpensesLoan Loss Reserve ExpensesOperating Expenses
Total Expenses
Net Operating Income
Loan Fund Sustainability Ratio _______
(Total Revenue/Total Expenses)
Net InterestIncome Ratio
Interest expense/interest income Should exceed 1:1
Loan Fund SustainabilityRatio should remain the sameor increase during the three-
year trend.
Loan FundSustainability
Ratio
The RLF contributes to the NWO's unrestricted income on a continuous basis by earning fees forservice, and a positive net income. The NWO has financial strength in the line of business in away that is appropriate to its mission, risk, sources of funds and market conditions.
Liquidity Standard
Key Capacity Indicators:
Indicator Measurement Benchmark
Cash ManagementPlan
Cash management planinclusive of cash flowprojections for all loanproducts.
projection for 90 days or a clearplan to address any anticipatedcash short-fall.
Deployment Ratio NWO generates internaldocuments indicating theavailable cash for re-lendingand outstanding loan balancefor each funding source.
The NWO's lending line of business has sufficient liquid assets to fund operations,short-term liabilities and unexpected short-falls. The NWO's lending line of businesshas sufficient cash available for lending or a plan to secure the funds to meet theannual lending projections.