Embed Size (px)
Citation preview
KRT APPRAISAL
Portsmouth, NH
Residential Assessment
Information
2
TABLE OF CONTENTS
TableofContents
Property Assessments Explained ............................................................................................................................................ 3
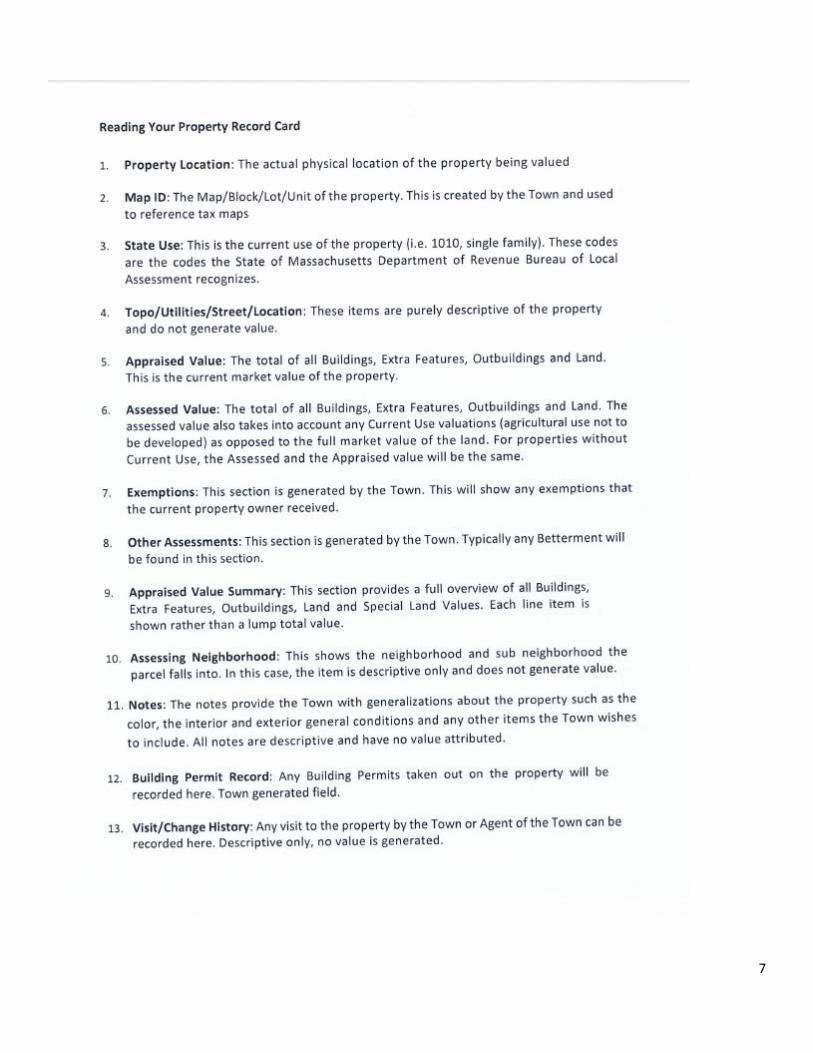
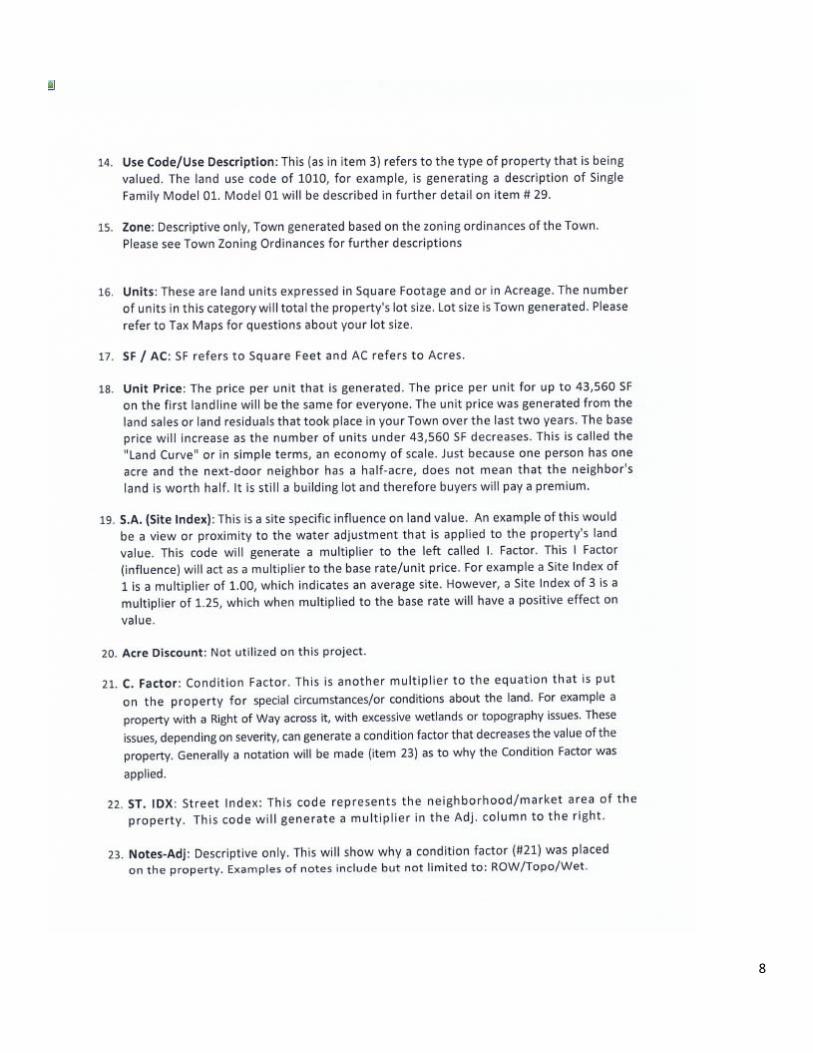
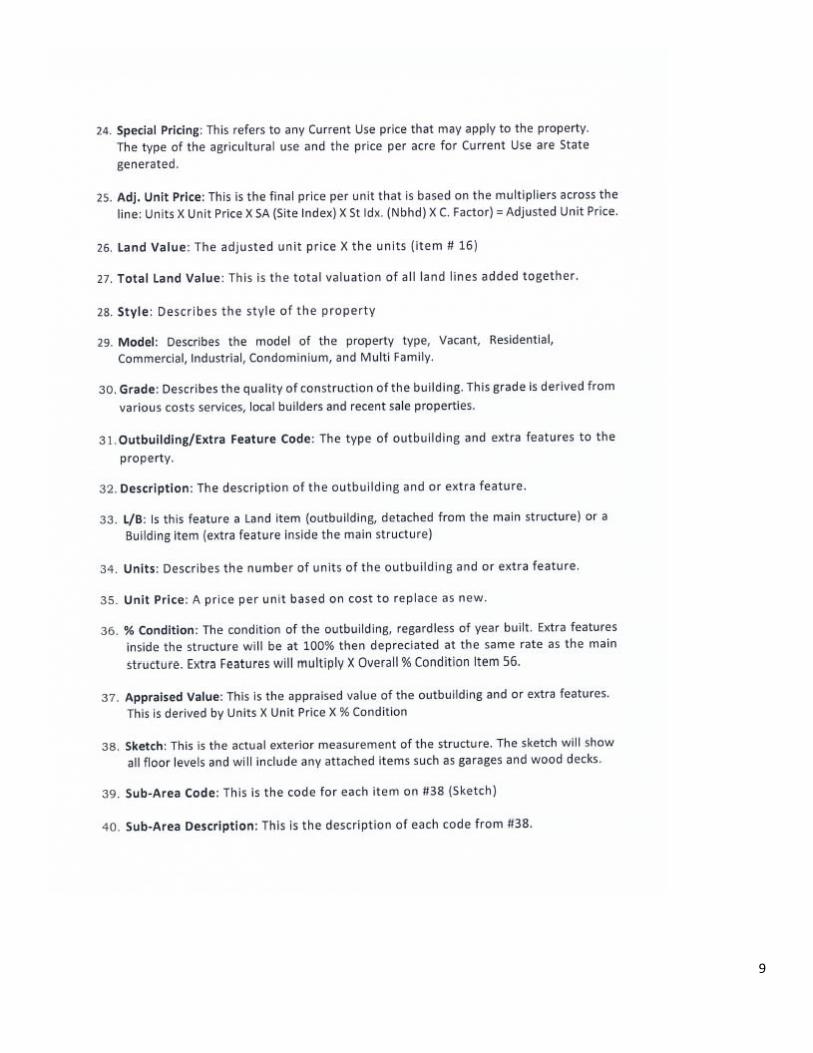
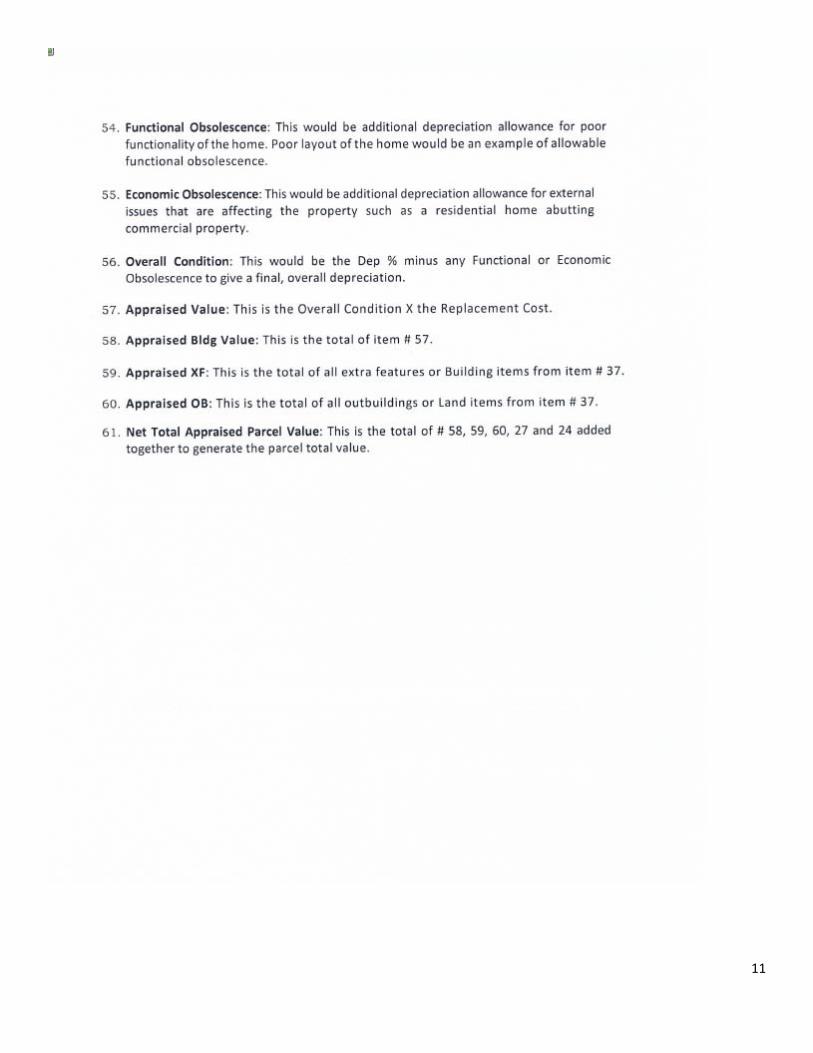
How to Read Your Property Record Card ............................................................................................................................... 7
Sample Property Record Card ............................................................................................................................................... 12
Residential Land Valuation.................................................................................................................................................... 14
Residential Land Valuation Model………………………………………………………………………………………………………….19
Residential Building Rates ..................................................................................................................................................... 20
Residential Styles .................................................................................................................................................................. 22
Residential Grading Examples………………………………………………………………………………………………………………..23
Residential Building Model……………………………………………………………………………………………………………….……28
Residential Valuation Tables and Schedules………………………………………………………………………………………..…29
Residential Analysis……………………………………………………………………………………………………………………………....36

3
Property Assessments Explained
All cities and towns in the State of New Hampshire assess the value of property using a Mass Appraisal system. This
system is a broad approach to predicting the value of properties that did not sell using the information collected about the
properties that did sell. It is the application of a small database of information (the sold properties) to a large database of
properties (the unsold properties).
As defined by the New Hampshire Department of Revenue Administration, Mass Appraisal is the use of standardized
procedures for collecting data and appraising property to ensure that all properties within a municipality are valued
uniformly and equitably. Mass Appraisal is the processes of valuing a universe of properties as of a given valuation date
using common data, a standardized procedure, and statistical testing. Unlike individual fee appraisal, which is intended to
derive the market value of a single property, the goal of Mass Appraisal is to bring all properties to their full and fair
market value, whether properties have sold recently or not, and thus to achieve equity among all property values.
The Department of Revenue Administration requires cities and towns to revalue all properties every five years for
certification according to specific requirements set by the Assessing Standards Board. The results of the revaluation
process must meet statistical standards defined by the Assessing Standards Board.
In Mass Appraisal, the universe of properties is defined as all properties in a city or town including single family homes,
two-family homes, three-family homes, condominiums, apartments, vacant land, commercial properties, industrial
properties, and mixed-use properties. The process described in this document only addresses the mass appraisal of
residential property.
The given valuation date for an assessment is April 1st and the revaluation reflects market values for the year prior to the
valuation date. For example, the assessment date for 2015 is April 1, 2015, and the sales analyzed are those occurring
between April 1, 2014 and March 31, 2015. The common data for residential property are the actual sales of property that
occurred during April 1st through March 31st prior to the valuation date.
The standardized procedure followed for determining full and fair market value involves using a model, defining
parameters, and performing iterations of statistical analysis to validate the model results. To accomplish this, a sales
database is created containing information about the sales that occurred in the 2 years prior to the valuation date. This
is the small database of information (the sold properties) which will be applied to the large database of properties (the
unsold properties). The sales database is used to establish the criteria for applying the characteristics of sold properties
to the unsold properties. The standardized procedures used are the following:
4
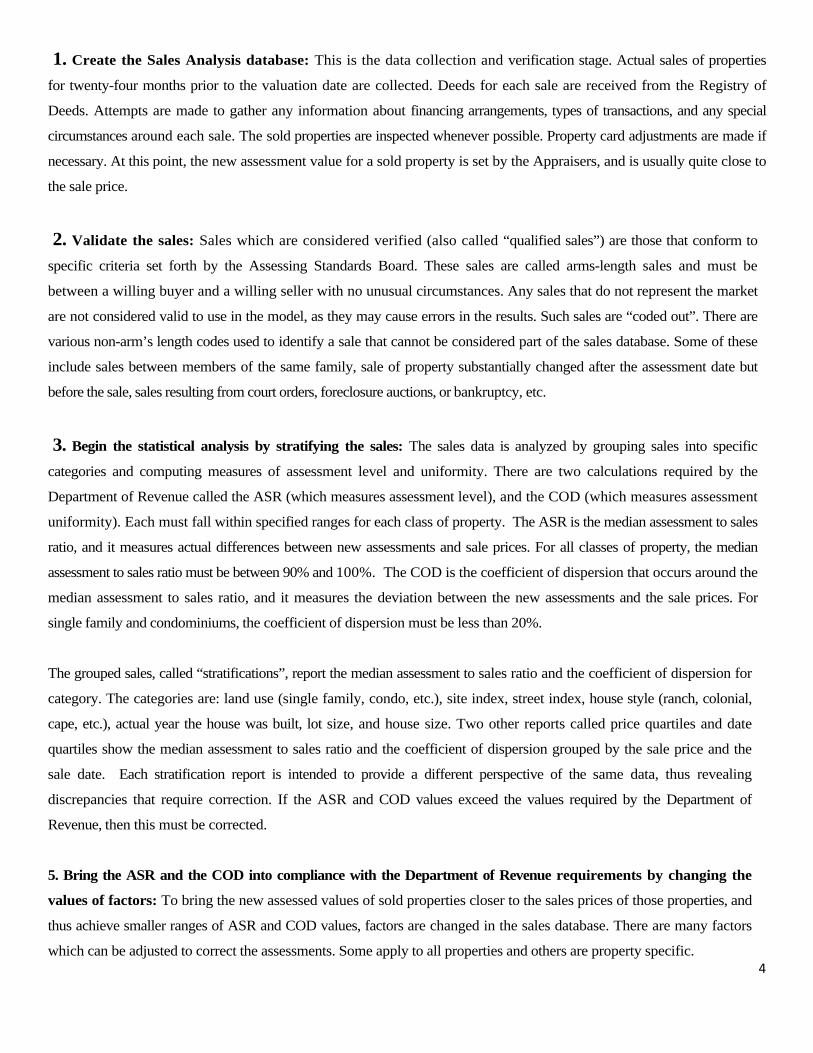
1. Create the Sales Analysis database: This is the data collection and verification stage. Actual sales of properties
for twenty-four months prior to the valuation date are collected. Deeds for each sale are received from the Registry of
Deeds. Attempts are made to gather any information about financing arrangements, types of transactions, and any special
circumstances around each sale. The sold properties are inspected whenever possible. Property card adjustments are made if
necessary. At this point, the new assessment value for a sold property is set by the Appraisers, and is usually quite close to
the sale price.
2. Validate the sales: Sales which are considered verified (also called “qualified sales”) are those that conform to
specific criteria set forth by the Assessing Standards Board. These sales are called arms-length sales and must be
between a willing buyer and a willing seller with no unusual circumstances. Any sales that do not represent the market
are not considered valid to use in the model, as they may cause errors in the results. Such sales are “coded out”. There are
various non-arm’s length codes used to identify a sale that cannot be considered part of the sales database. Some of these
include sales between members of the same family, sale of property substantially changed after the assessment date but
before the sale, sales resulting from court orders, foreclosure auctions, or bankruptcy, etc.
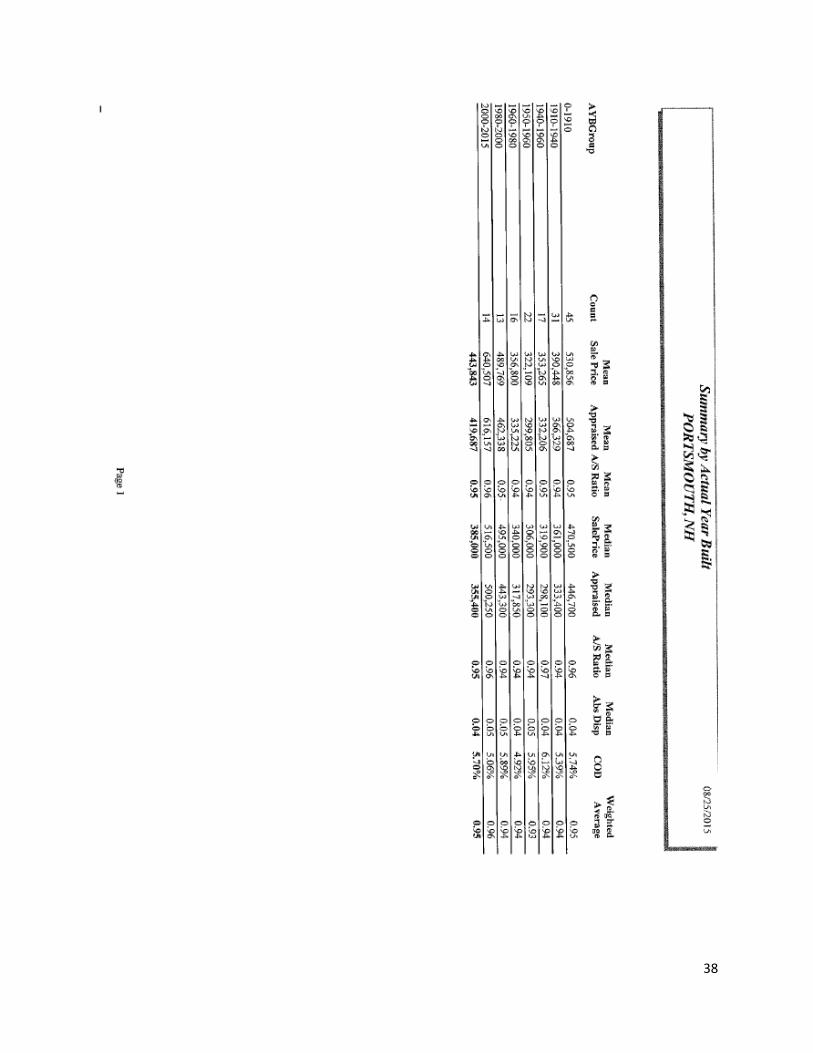
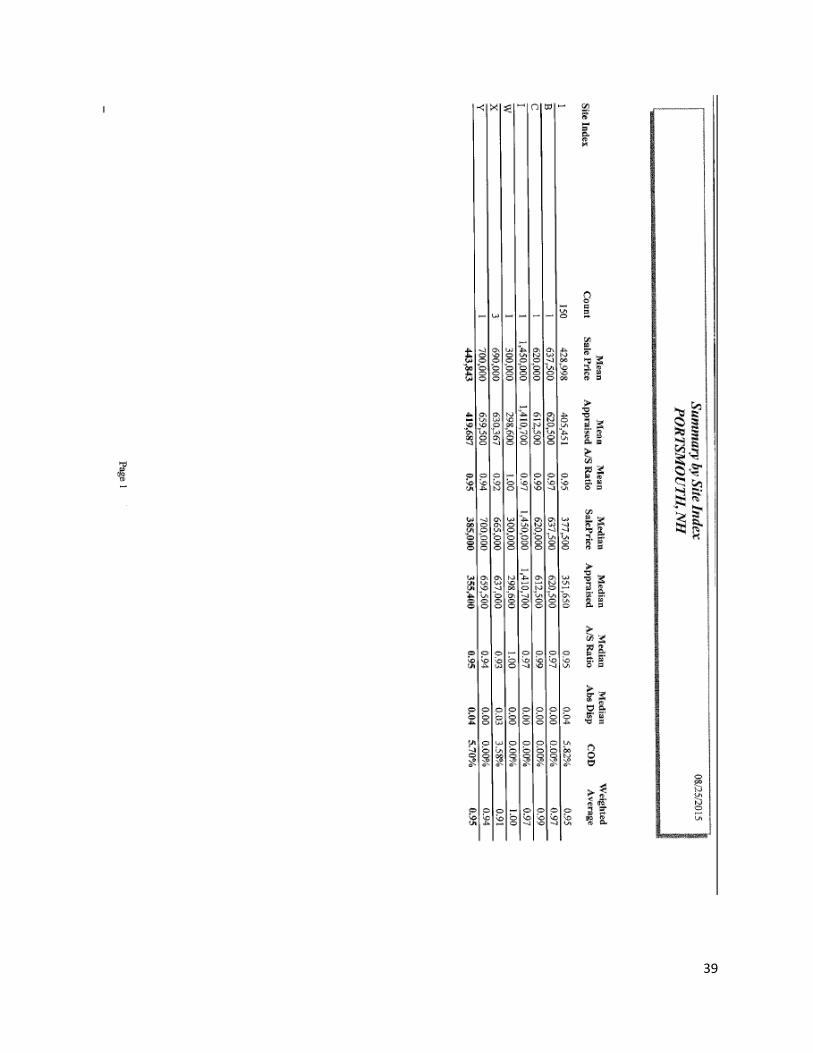
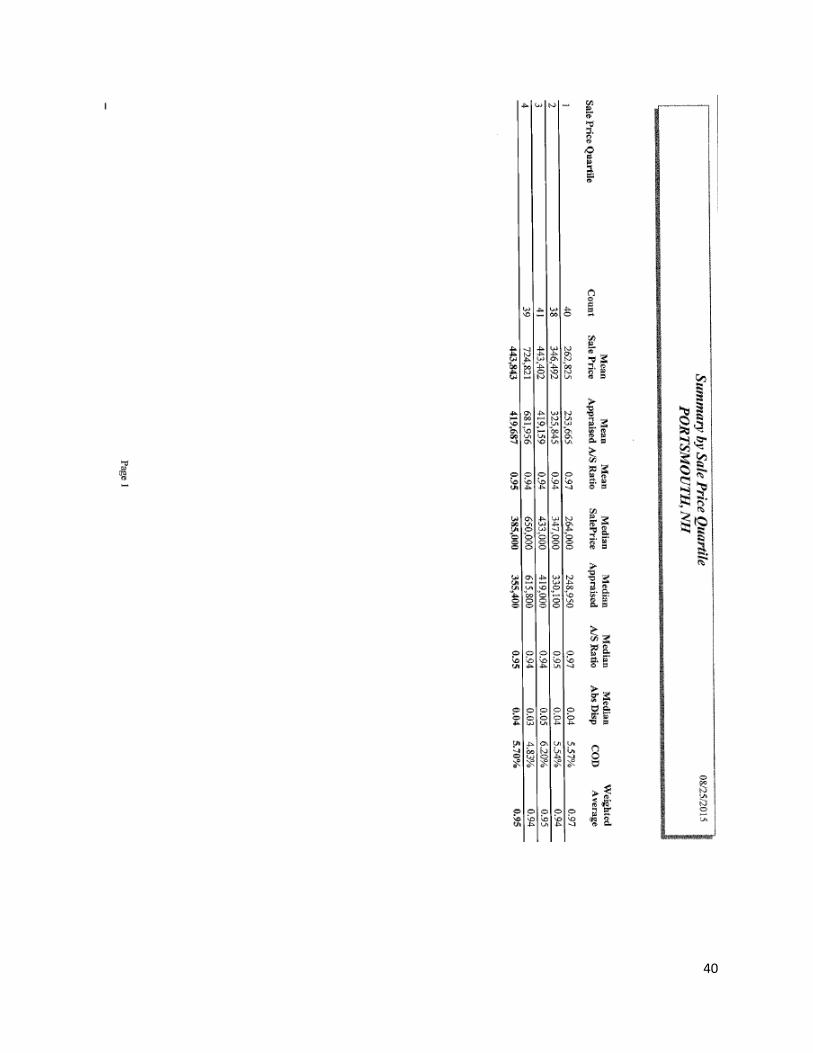
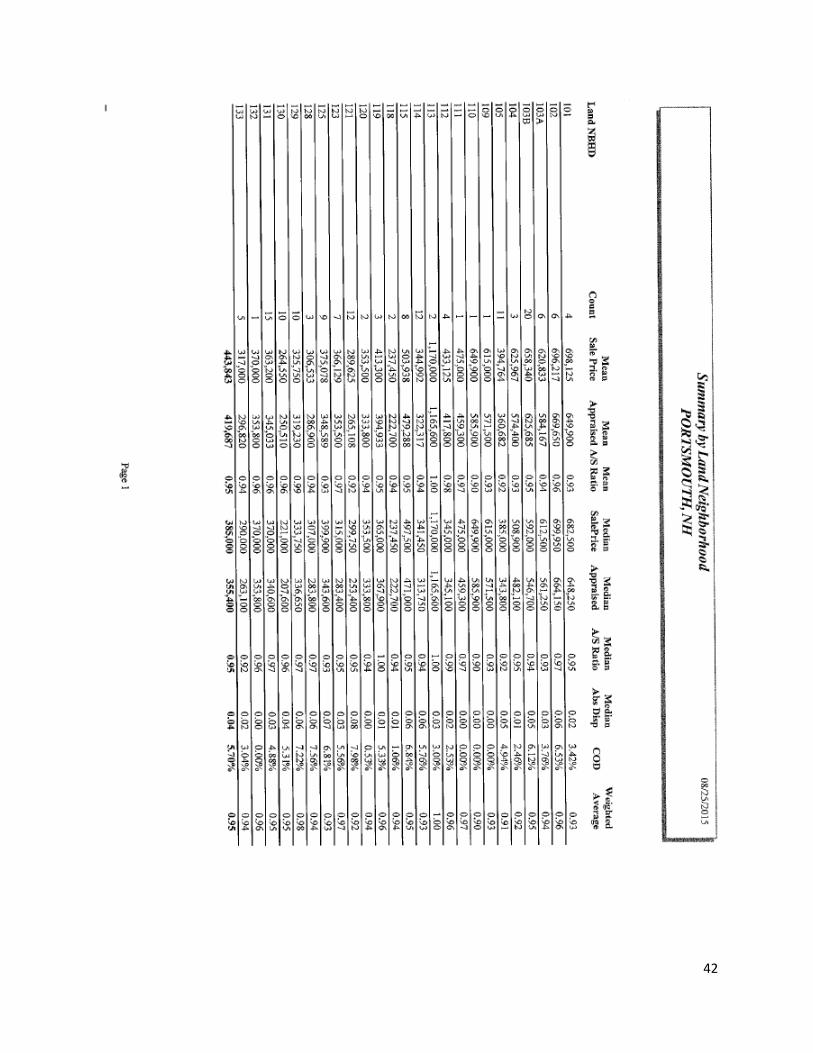
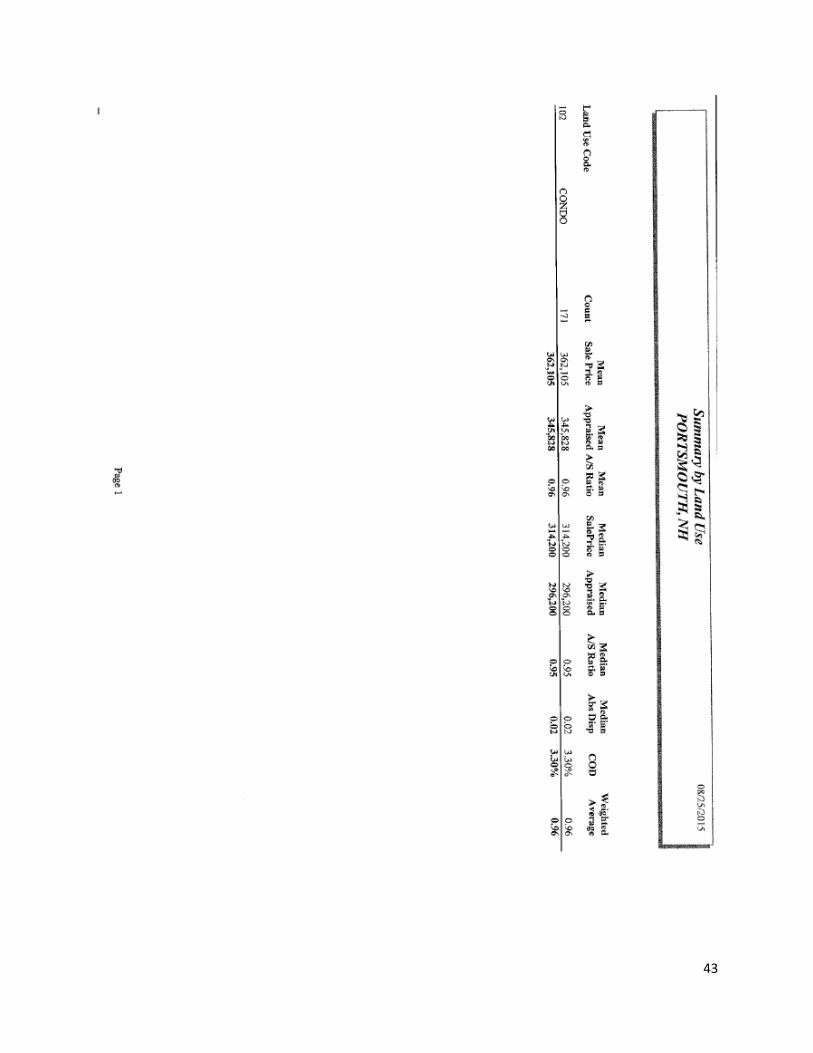
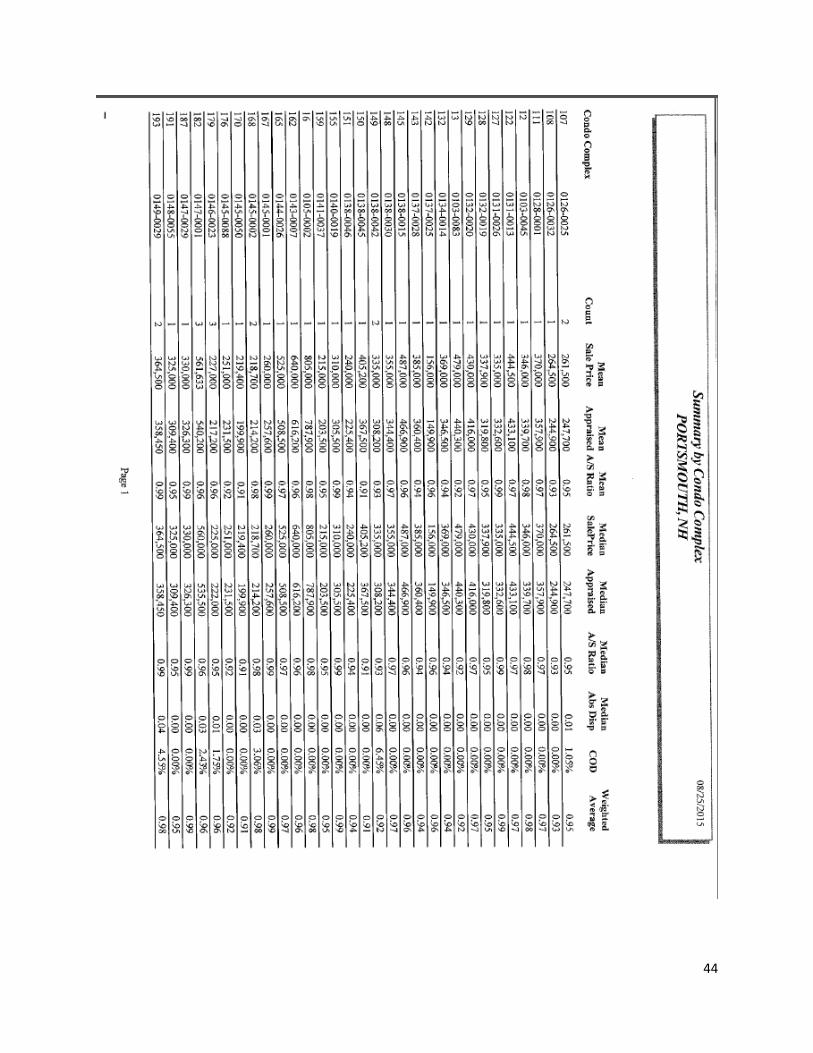
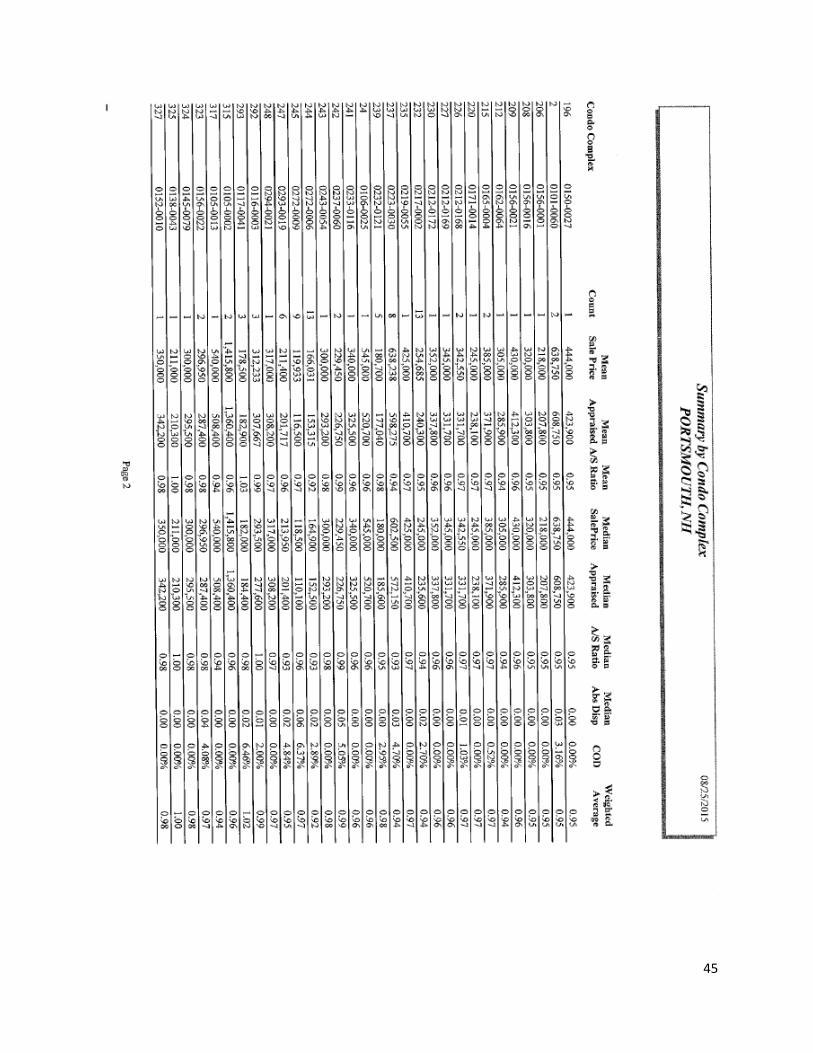
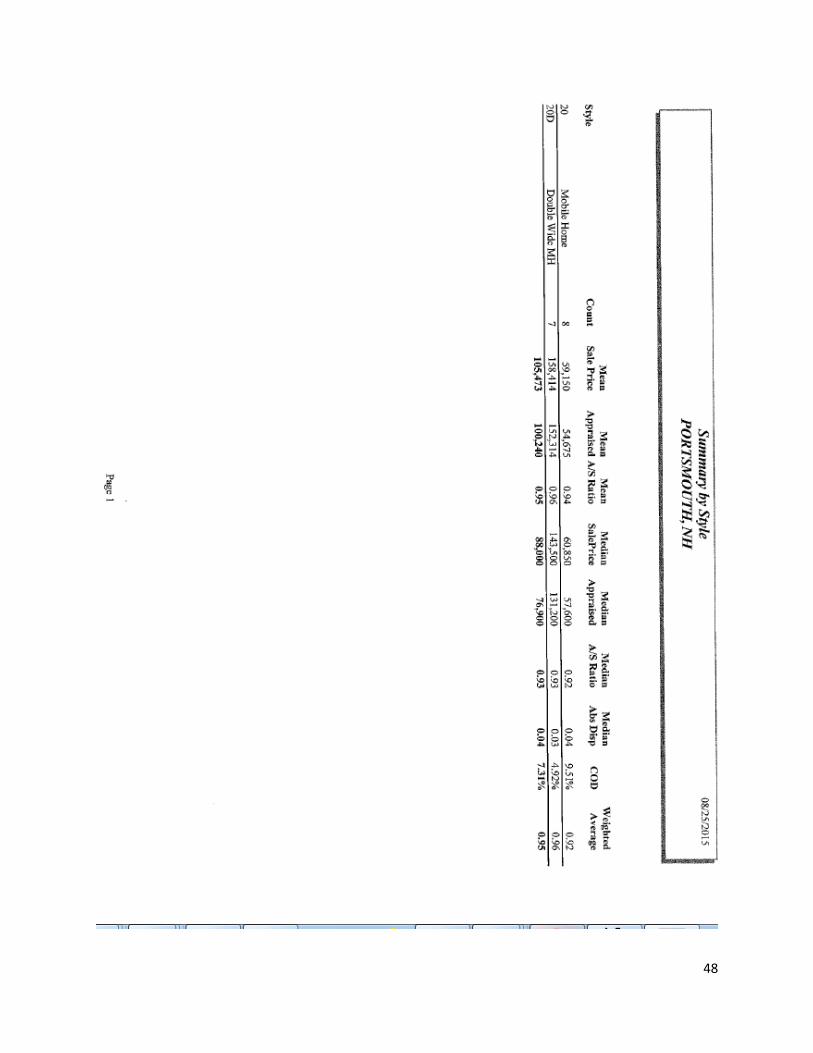
3. Begin the statistical analysis by stratifying the sales: The sales data is analyzed by grouping sales into specific
categories and computing measures of assessment level and uniformity. There are two calculations required by the
Department of Revenue called the ASR (which measures assessment level), and the COD (which measures assessment
uniformity). Each must fall within specified ranges for each class of property. The ASR is the median assessment to sales
ratio, and it measures actual differences between new assessments and sale prices. For all classes of property, the median
assessment to sales ratio must be between 90% and 100%. The COD is the coefficient of dispersion that occurs around the
median assessment to sales ratio, and it measures the deviation between the new assessments and the sale prices. For
single family and condominiums, the coefficient of dispersion must be less than 20%.
The grouped sales, called “stratifications”, report the median assessment to sales ratio and the coefficient of dispersion for
category. The categories are: land use (single family, condo, etc.), site index, street index, house style (ranch, colonial,
cape, etc.), actual year the house was built, lot size, and house size. Two other reports called price quartiles and date
quartiles show the median assessment to sales ratio and the coefficient of dispersion grouped by the sale price and the
sale date. Each stratification report is intended to provide a different perspective of the same data, thus revealing
discrepancies that require correction. If the ASR and COD values exceed the values required by the Department of
Revenue, then this must be corrected.
5. Bring the ASR and the COD into compliance with the Department of Revenue requirements by changing the
values of factors: To bring the new assessed values of sold properties closer to the sales prices of those properties, and
thus achieve smaller ranges of ASR and COD values, factors are changed in the sales database. There are many factors
which can be adjusted to correct the assessments. Some apply to all properties and others are property specific.
5
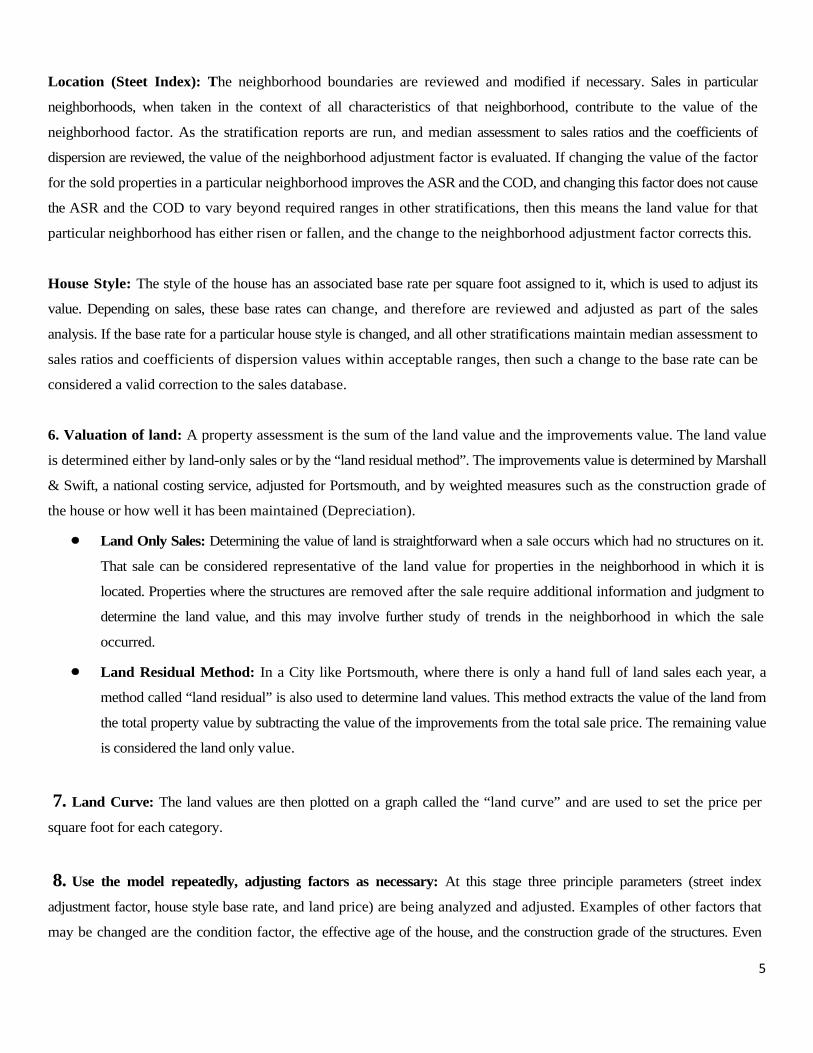
Location (Steet Index): The neighborhood boundaries are reviewed and modified if necessary. Sales in particular
neighborhoods, when taken in the context of all characteristics of that neighborhood, contribute to the value of the
neighborhood factor. As the stratification reports are run, and median assessment to sales ratios and the coefficients of
dispersion are reviewed, the value of the neighborhood adjustment factor is evaluated. If changing the value of the factor
for the sold properties in a particular neighborhood improves the ASR and the COD, and changing this factor does not cause
the ASR and the COD to vary beyond required ranges in other stratifications, then this means the land value for that
particular neighborhood has either risen or fallen, and the change to the neighborhood adjustment factor corrects this.
House Style: The style of the house has an associated base rate per square foot assigned to it, which is used to adjust its
value. Depending on sales, these base rates can change, and therefore are reviewed and adjusted as part of the sales
analysis. If the base rate for a particular house style is changed, and all other stratifications maintain median assessment to
sales ratios and coefficients of dispersion values within acceptable ranges, then such a change to the base rate can be
considered a valid correction to the sales database.
6. Valuation of land: A property assessment is the sum of the land value and the improvements value. The land value
is determined either by land-only sales or by the “land residual method”. The improvements value is determined by Marshall
& Swift, a national costing service, adjusted for Portsmouth, and by weighted measures such as the construction grade of
the house or how well it has been maintained (Depreciation).
Land Only Sales: Determining the value of land is straightforward when a sale occurs which had no structures on it.
That sale can be considered representative of the land value for properties in the neighborhood in which it is
located. Properties where the structures are removed after the sale require additional information and judgment to
determine the land value, and this may involve further study of trends in the neighborhood in which the sale
occurred.
Land Residual Method: In a City like Portsmouth, where there is only a hand full of land sales each year, a
method called “land residual” is also used to determine land values. This method extracts the value of the land from
the total property value by subtracting the value of the improvements from the total sale price. The remaining value
is considered the land only value.
7. Land Curve: The land values are then plotted on a graph called the “land curve” and are used to set the price per
square foot for each category.
8. Use the model repeatedly, adjusting factors as necessary: At this stage three principle parameters (street index
adjustment factor, house style base rate, and land price) are being analyzed and adjusted. Examples of other factors that
may be changed are the condition factor, the effective age of the house, and the construction grade of the structures. Even
6
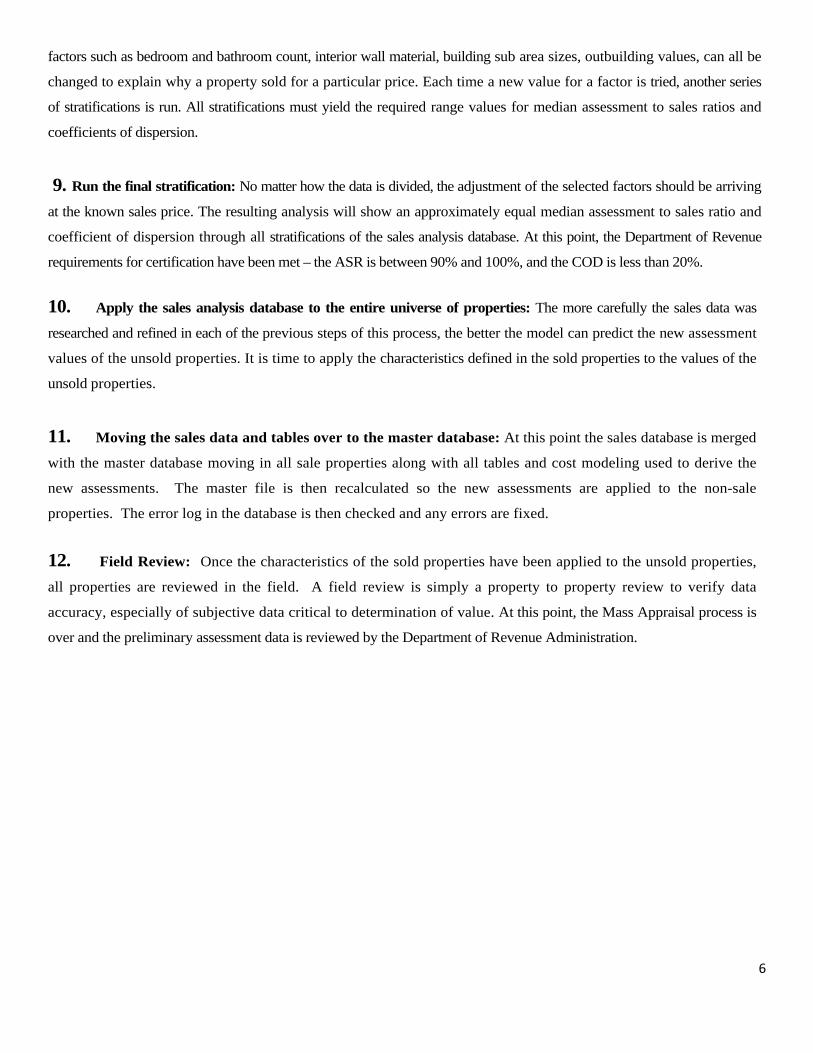
factors such as bedroom and bathroom count, interior wall material, building sub area sizes, outbuilding values, can all be
changed to explain why a property sold for a particular price. Each time a new value for a factor is tried, another series
of stratifications is run. All stratifications must yield the required range values for median assessment to sales ratios and
coefficients of dispersion.
9. Run the final stratification: No matter how the data is divided, the adjustment of the selected factors should be arriving
at the known sales price. The resulting analysis will show an approximately equal median assessment to sales ratio and
coefficient of dispersion through all stratifications of the sales analysis database. At this point, the Department of Revenue
requirements for certification have been met – the ASR is between 90% and 100%, and the COD is less than 20%.
10. Apply the sales analysis database to the entire universe of properties: The more carefully the sales data was
researched and refined in each of the previous steps of this process, the better the model can predict the new assessment
values of the unsold properties. It is time to apply the characteristics defined in the sold properties to the values of the
unsold properties.
11. Moving the sales data and tables over to the master database: At this point the sales database is merged
with the master database moving in all sale properties along with all tables and cost modeling used to derive the
new assessments. The master file is then recalculated so the new assessments are applied to the non-sale
properties. The error log in the database is then checked and any errors are fixed.
12. Field Review: Once the characteristics of the sold properties have been applied to the unsold properties,
all properties are reviewed in the field. A field review is simply a property to property review to verify data
accuracy, especially of subjective data critical to determination of value. At this point, the Mass Appraisal process is
over and the preliminary assessment data is reviewed by the Department of Revenue Administration.
7
8
9

10
11

12

13
14
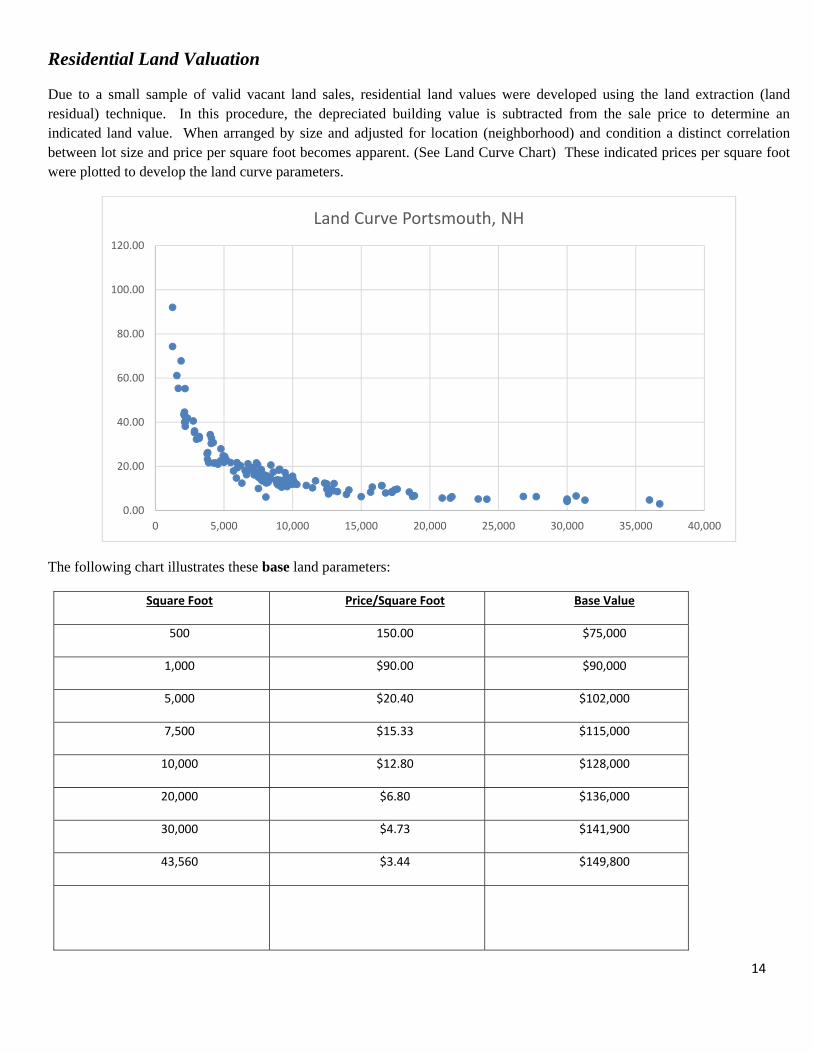
Residential Land Valuation
Due to a small sample of valid vacant land sales, residential land values were developed using the land extraction (land residual) technique. In this procedure, the depreciated building value is subtracted from the sale price to determine an indicated land value. When arranged by size and adjusted for location (neighborhood) and condition a distinct correlation between lot size and price per square foot becomes apparent. (See Land Curve Chart) These indicated prices per square foot were plotted to develop the land curve parameters.
The following chart illustrates these base land parameters:
Square Foot Price/Square Foot Base Value
500 150.00 $75,000
1,000 $90.00 $90,000
5,000 $20.40 $102,000
7,500 $15.33 $115,000
10,000 $12.80 $128,000
20,000 $6.80 $136,000
30,000 $4.73 $141,900
43,560 $3.44 $149,800
0.00
20.00
40.00
60.00
80.00
100.00
120.00
0 5,000 10,000 15,000 20,000 25,000 30,000 35,000 40,000
Land Curve Portsmouth, NH

15
Market areas are delineated by the use of Street Indexes or Neighborhoods. The neighborhoods account for the varying desirability within the City of Portsmouth. The statistical requirements for land residuals are a median ratio between 90% and 100% and a COD under 20%. The neighborhood adjustments were developed through the land residual analysis. Below is the overall land residual analysis and neighborhood analysis. Neighborhoods with 5 or fewer sales have been omitted as a land residual analysis with a small sample yields skewed results. All residential sales are included in the overall analysis.
Land Residual Analysis The land residual analysis is calculated by subtracting the total improvement value by the sale price leaving an indicated land value. The analysis is a ratio study between the appraised land and the indicated land below is the land residual analysis within all residential neighborhoods having five or more sales.
-Overall Analysis- Median 95% COD 17.72%
-Street Index (5 or more sales) 101 Median 95% COD 6.53% 102 Median 97% COD 12.63% 103A Median 92% COD 6.16% 103B Median 94% COD 17.07% 105 Median 90% COD 10.69% 114 Median 94% COD 11.82% 115 Median 92% COD 13.72% 121 Median 96% COD 16.27% 123 Median 94% COD 6.64% 125 Median 92% COD 17.74% 129 Median 100% COD 17.37% 130 Median 97% COD 11.97% 131 Median 98% COD 9.25% 135 Median 96% COD 7.44%
PORTSMOUTH, NH LAND PRICING INSTRUCTIONS
Site Improvements:
Utility improvements to the site such as well, septic, and/or public utilities are included in the building rate pricing schedule. All lots are valued based upon the use of vacant land sales and land residuals.
Landline #1
Landline #1 represents the prime site in square footage up to 43,560 square feet. In addition, ROW, topography, or traffic adjustments can be found in the condition factor section. The Street index code is utilized to distinguish the different types of locations within the market area of Portsmouth. Site indexes were utilized for views and waterfront.
Landline #2
Any excess acreage over 43,560 square feet will be priced at $15,000/acre. In addition, any applicable topography, wetlands, or any other detrimental factors can be found in the condition factor. Excess acreage is factored by both street index, but not the site index.
16
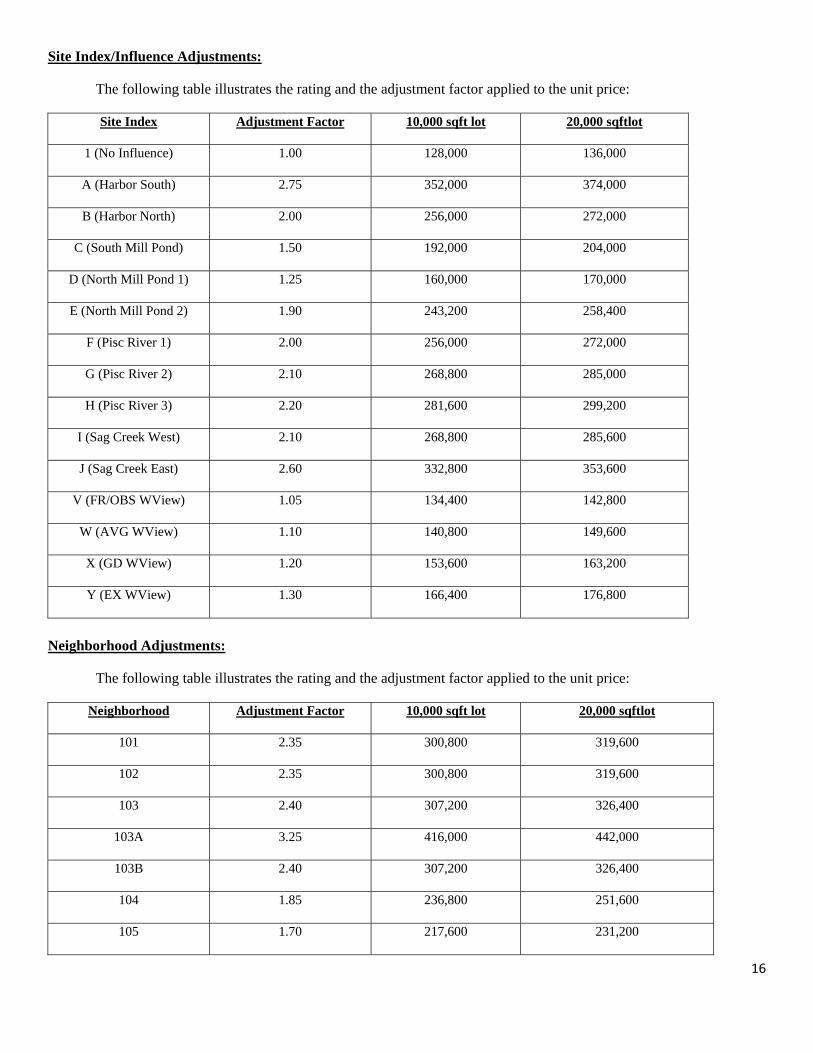
Site Index/Influence Adjustments:
The following table illustrates the rating and the adjustment factor applied to the unit price:
Site Index Adjustment Factor 10,000 sqft lot 20,000 sqftlot
1 (No Influence) 1.00 128,000 136,000
A (Harbor South) 2.75 352,000 374,000
B (Harbor North) 2.00 256,000 272,000
C (South Mill Pond) 1.50 192,000 204,000
D (North Mill Pond 1) 1.25 160,000 170,000
E (North Mill Pond 2) 1.90 243,200 258,400
F (Pisc River 1) 2.00 256,000 272,000
G (Pisc River 2) 2.10 268,800 285,000
H (Pisc River 3) 2.20 281,600 299,200
I (Sag Creek West) 2.10 268,800 285,600
J (Sag Creek East) 2.60 332,800 353,600
V (FR/OBS WView) 1.05 134,400 142,800
W (AVG WView) 1.10 140,800 149,600
X (GD WView) 1.20 153,600 163,200
Y (EX WView) 1.30 166,400 176,800
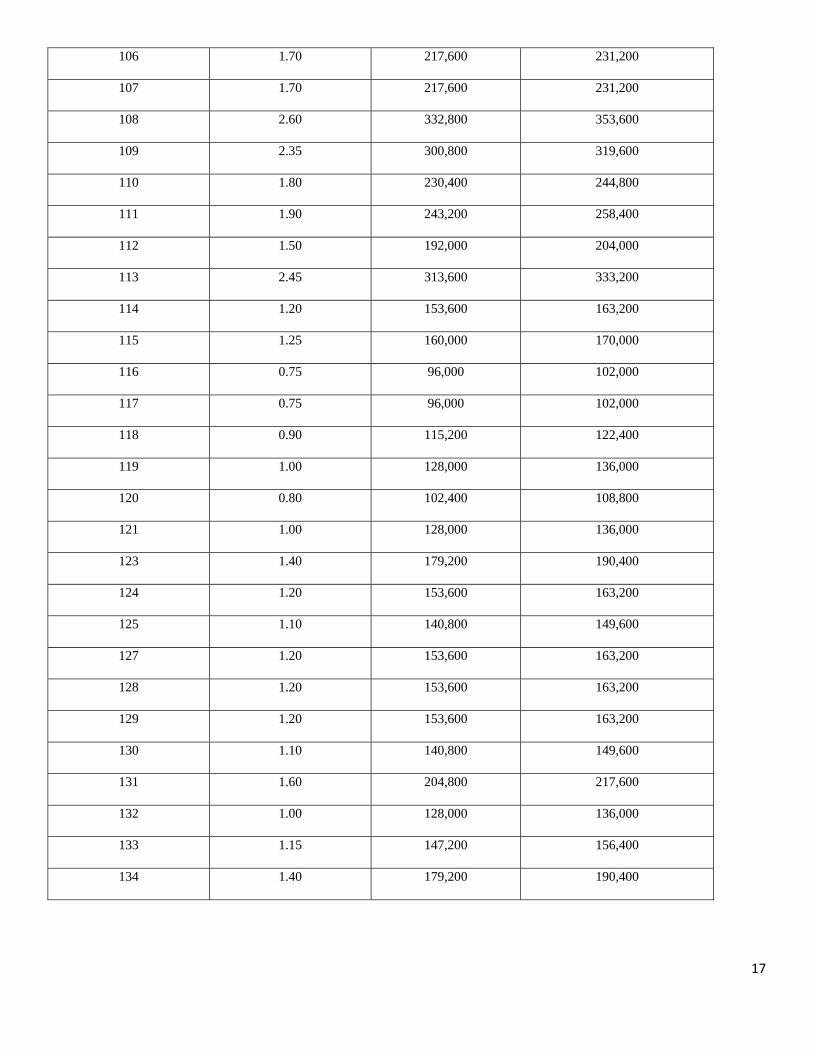
Neighborhood Adjustments:
The following table illustrates the rating and the adjustment factor applied to the unit price:
Neighborhood Adjustment Factor 10,000 sqft lot 20,000 sqftlot
101 2.35 300,800 319,600
102 2.35 300,800 319,600
103 2.40 307,200 326,400
103A 3.25 416,000 442,000
103B 2.40 307,200 326,400
104 1.85 236,800 251,600
105 1.70 217,600 231,200
17
106 1.70 217,600 231,200
107 1.70 217,600 231,200
108 2.60 332,800 353,600
109 2.35 300,800 319,600
110 1.80 230,400 244,800
111 1.90 243,200 258,400
112 1.50 192,000 204,000
113 2.45 313,600 333,200
114 1.20 153,600 163,200
115 1.25 160,000 170,000
116 0.75 96,000 102,000
117 0.75 96,000 102,000
118 0.90 115,200 122,400
119 1.00 128,000 136,000
120 0.80 102,400 108,800
121 1.00 128,000 136,000
123 1.40 179,200 190,400
124 1.20 153,600 163,200
125 1.10 140,800 149,600
127 1.20 153,600 163,200
128 1.20 153,600 163,200
129 1.20 153,600 163,200
130 1.10 140,800 149,600
131 1.60 204,800 217,600
132 1.00 128,000 136,000
133 1.15 147,200 156,400
134 1.40 179,200 190,400
18
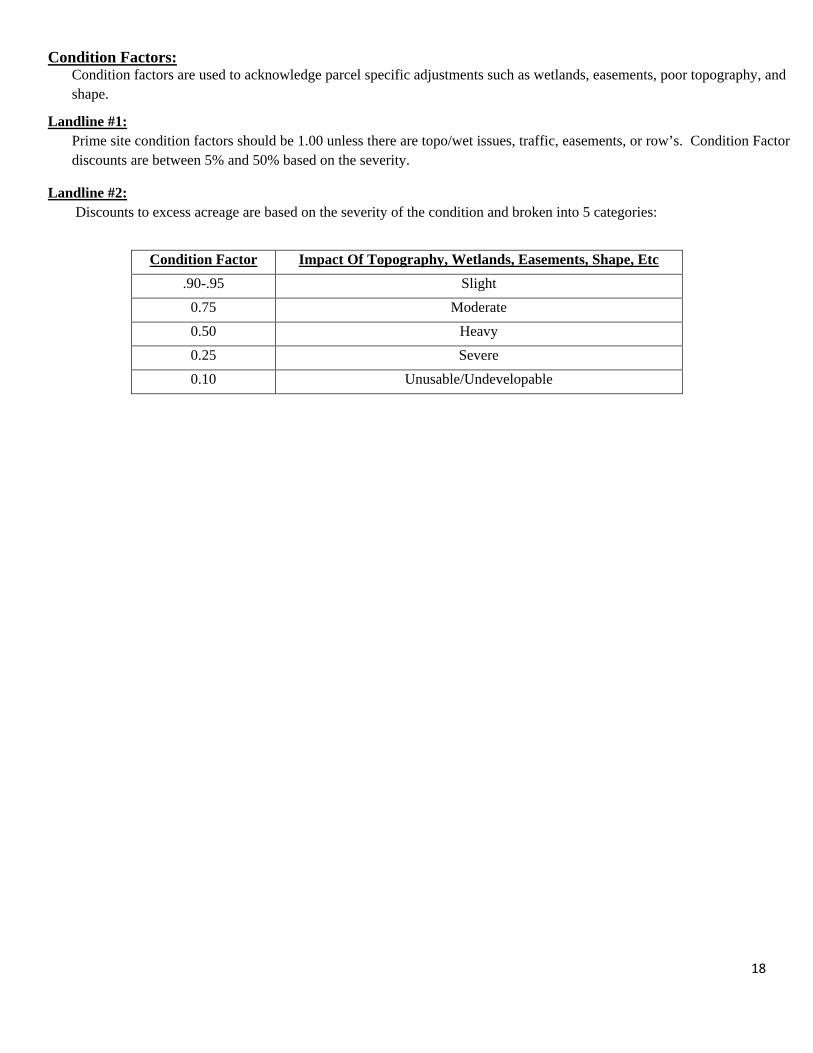
Condition Factors: Condition factors are used to acknowledge parcel specific adjustments such as wetlands, easements, poor topography, and
shape.
Landline #1: Prime site condition factors should be 1.00 unless there are topo/wet issues, traffic, easements, or row’s. Condition Factor discounts are between 5% and 50% based on the severity.
Landline #2: Discounts to excess acreage are based on the severity of the condition and broken into 5 categories:
Condition Factor Impact Of Topography, Wetlands, Easements, Shape, Etc
.90-.95 Slight
0.75 Moderate
0.50 Heavy
0.25 Severe
0.10 Unusable/Undevelopable

19
LAND VALUATION MODEL
Unit Price (Size Adjustment from land curve) X Site Index (Influence Factor) X Condition Factor X Nbhd Factor (St Index) X Square Footage of Lot Land Value
EXAMPLE using the Sample Field Card on pages 13‐14
5,680 SF Lot 23.13 per Sqft Site Index 1 (factor 1.00) Condition Factor (1.00) ST Index NBHD R8 Factor (1.35)
Below is the algorithm from the Appraisal Vision® software: for the land pricing:
Entered Units: 5,680 find 1st record on the land curve greater than our units Get High Units High Units: 7500 High Unit Price: 18 Find 2nd Record on the Land Curve Lower Than the First Low Units: 5000 Low Unit Price: 26 New Unit Price = ((5000 * 26) + (((18 * 7500) - (26 * 5000)) * (5680 - 5000) / (7500 - 5000))) / 5680 New Unit Price = 23.12676056338028169014084507042253521127 TotalAdj_a = (Site Index) 1.00 *(Condition Factor) 1.00 *(N/A) 1.00 *(Street Index) 1.35 TotalAdj_a = 1.35 LandVal = 31.22112676056338028169014084507042253521 * 5680 LandVal(Rounded) = 177,300
20
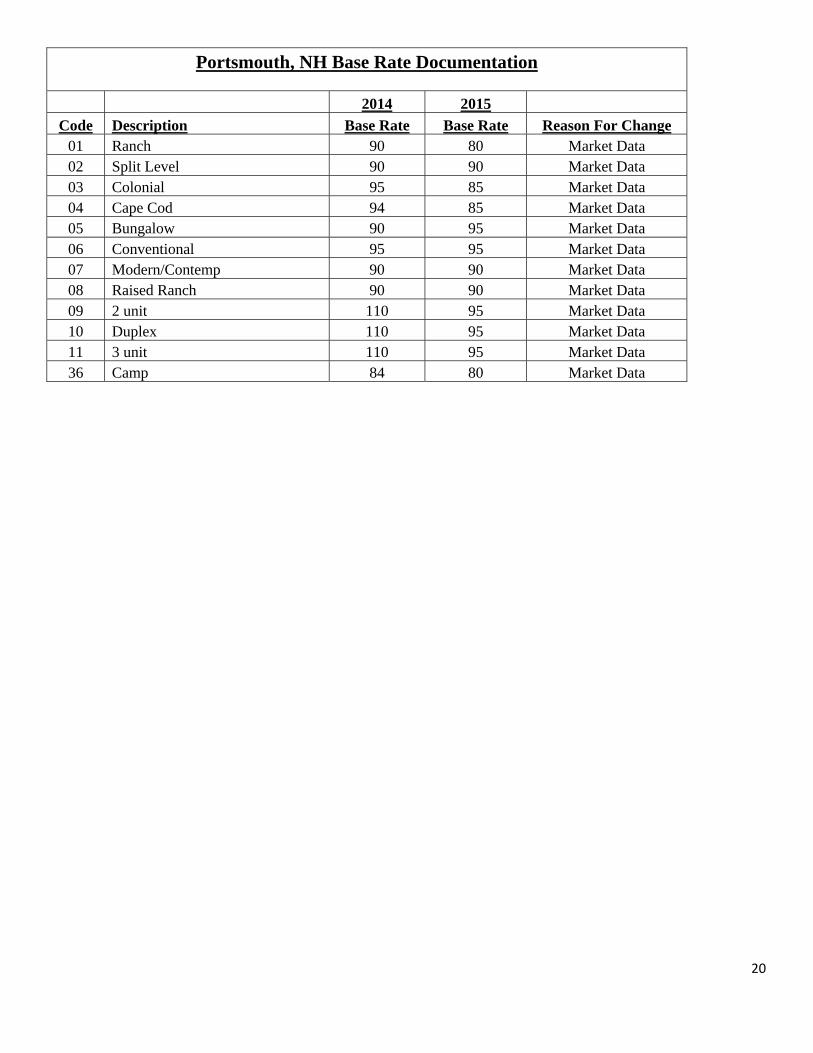
Portsmouth, NH Base Rate Documentation 2014 2015
Code Description Base Rate Base Rate Reason For Change 01 Ranch 90 80 Market Data 02 Split Level 90 90 Market Data 03 Colonial 95 85 Market Data 04 Cape Cod 94 85 Market Data 05 Bungalow 90 95 Market Data 06 Conventional 95 95 Market Data 07 Modern/Contemp 90 90 Market Data 08 Raised Ranch 90 90 Market Data 09 2 unit 110 95 Market Data 10 Duplex 110 95 Market Data 11 3 unit 110 95 Market Data 36 Camp 84 80 Market Data

21
Brief Narrative
We began the process of creating our building rate tables by extensively researching building costs published by Marshall & Swift, a building valuation service well regarded in the industry and used by appraisers, insurance companies and banks nationally. These rates were then fine tuned based upon further analysis to better reflect the current market in Portsmouth. Once set, we analyzed all of our rate calculations versus actual sales data to make sure that we were arriving at a proper estimate of value for all buildings. After they have been fully tested against the sales data, the building rates became our starting point for assessing building costs across the City. Because all properties are valued using a computer model, we need to adjust the cost per square foot figure so that we can properly assess houses on all ends of the value scale. In order to arrive at value rates that are seen in the local construction market, our adjustment tables are applied to the starting rates to increase or decrease this rate based on quality of construction, size, amenities, interior finish, etc.
22
BUILDING STYLES
Below are descriptions of typical styles of single-family and small apartment residential houses. RANCH A rambling one story house that is low to the ground and has a low pitched gable roof or roofs. SPLIT - LEVEL The living area is on two or more levels with each level having a single story height, generally seen on uneven terrain lots. It can be a front/rear or side/rear split or a combination of the two.
COLONIAL Generally 2 or 2 ½ stories with balanced openings along the main façade. Second floor overhangs are common. Newer colonials attempt to imitate this classic New England design. Cape Cod Built “close to the ground” with simple lines. A high roof ridge often supplemented with full or partial dormers may provide a second level of living area, but not a full upper story. Generally a gable roof. Bungalow A small, one-story design often seen with an expansion attic area and/or dormers. Usually with an open or enclosed front porch. Narrow across the front and deep from front to back. Conventional An older type of house with no particular architectural design. Story heights generally range from 1.5 to 2.5 stories. Modern or Contemporary One-story, two-stories or split-level. Characterized by large windows, open planning, horizontal lines, cathedral ceilings and simple details. Raised Ranch A combination of the ranch and tri-level designs. The basement area sets on or slightly below the ground level and is usually partially or totally finished. Basement garages are common. Multi-Family This dwelling is typically 2 to 2.5 stories in height consisting of 2-3 living units.
23
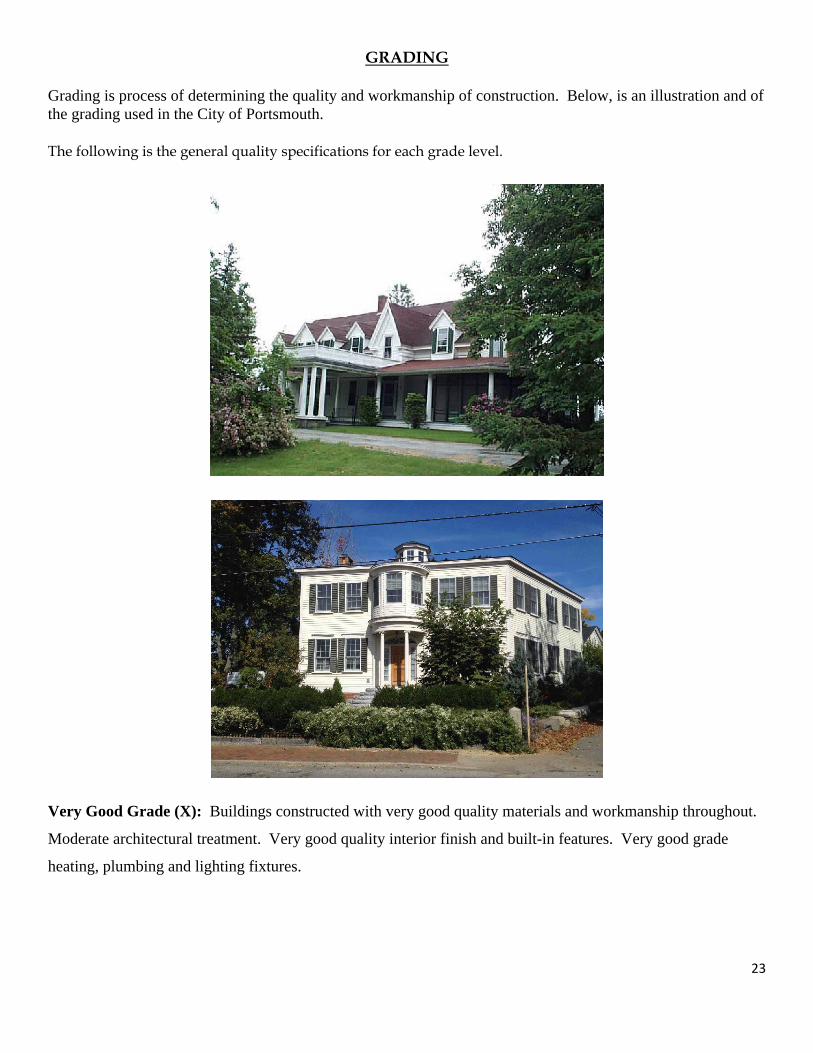
GRADING
Grading is process of determining the quality and workmanship of construction. Below, is an illustration and of the grading used in the City of Portsmouth.
The following is the general quality specifications for each grade level.
Very Good Grade (X): Buildings constructed with very good quality materials and workmanship throughout.
Moderate architectural treatment. Very good quality interior finish and built-in features. Very good grade
heating, plumbing and lighting fixtures.
24
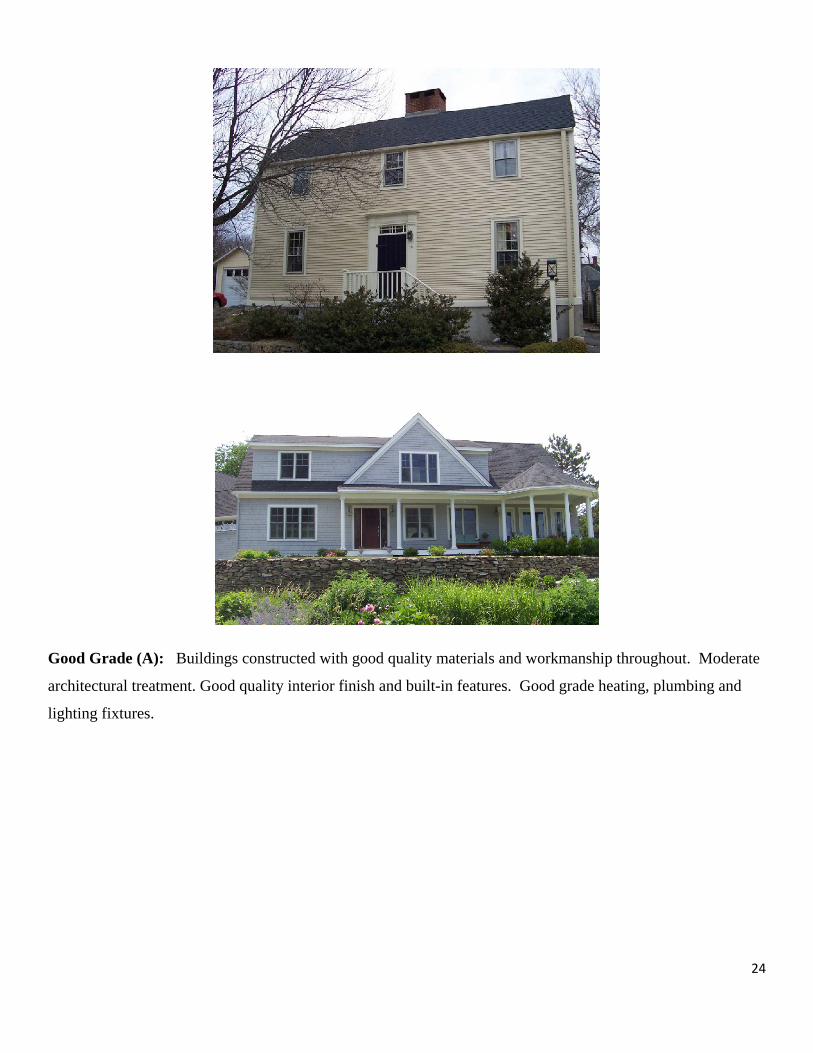
Good Grade (A): Buildings constructed with good quality materials and workmanship throughout. Moderate
architectural treatment. Good quality interior finish and built-in features. Good grade heating, plumbing and
lighting fixtures.

25
Above Average Grade (B): Buildings constructed with above average quality materials and workmanship
throughout. Above average architectural treatment. Above average quality interior finish and built-in features.
Above average plumbing and heating fixtures.
26
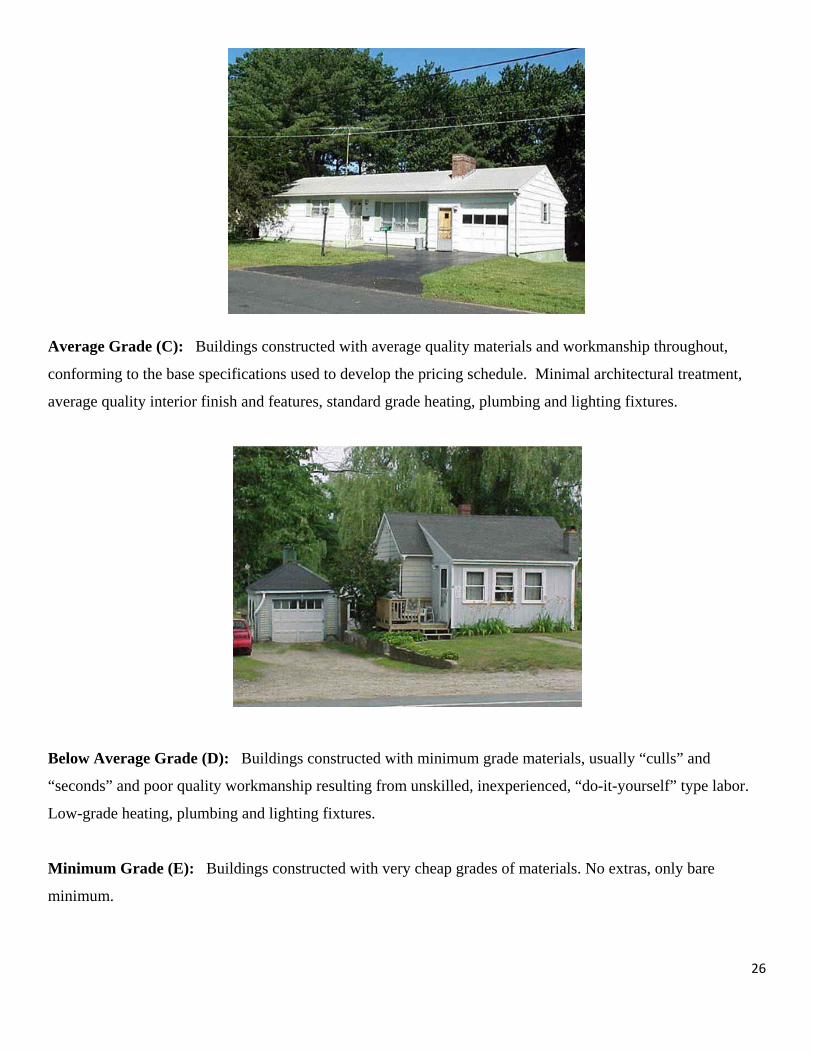
Average Grade (C): Buildings constructed with average quality materials and workmanship throughout,
conforming to the base specifications used to develop the pricing schedule. Minimal architectural treatment,
average quality interior finish and features, standard grade heating, plumbing and lighting fixtures.
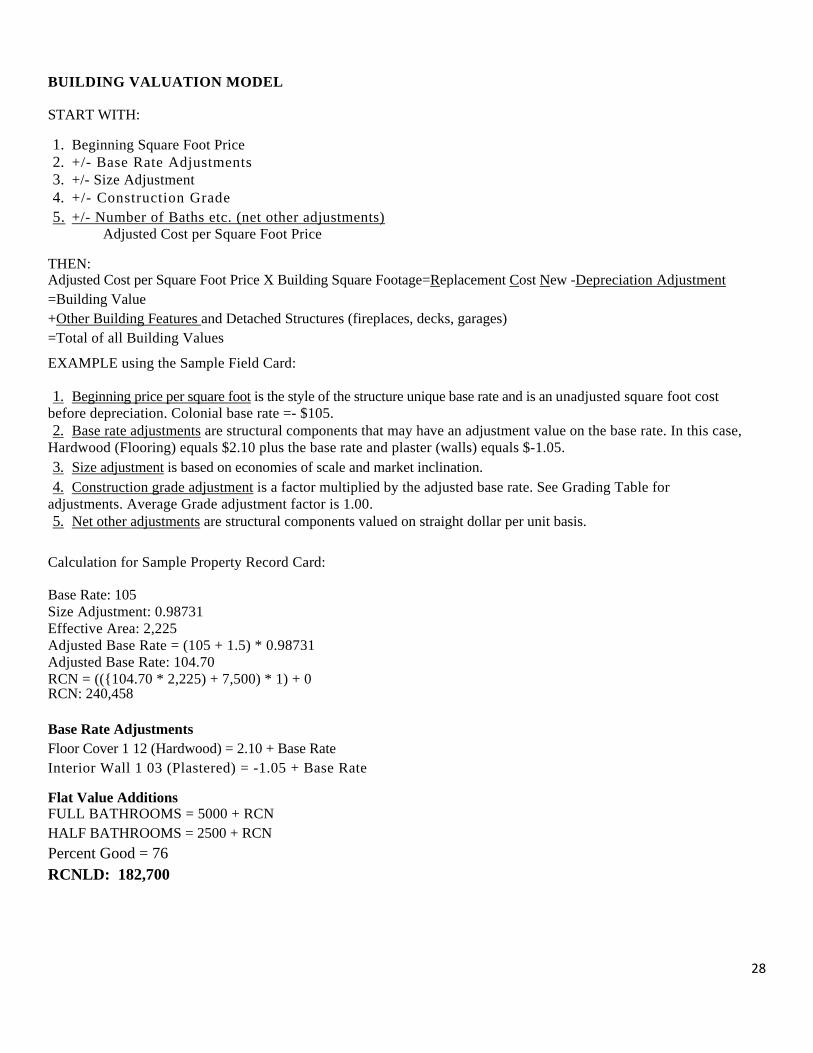
Below Average Grade (D): Buildings constructed with minimum grade materials, usually “culls” and
“seconds” and poor quality workmanship resulting from unskilled, inexperienced, “do-it-yourself” type labor.
Low-grade heating, plumbing and lighting fixtures.
Minimum Grade (E): Buildings constructed with very cheap grades of materials. No extras, only bare
minimum.

27
Mobile Home Quality Grading Guidelines
Grade A&B: Custom and Semi-Custom -type mobile homes, built of high quality materials and workmanship
throughout, having an abundance of special features, and exhibiting distinguished and attractive exterior wall
and roof treatment, with conventional residential doors and windows, including bay windows in select areas,
and 8’ceilings in the living, dining, and kitchen areas.
Grade C: Standard-type mobile homes, built of average quality material and workmanship throughout, having
a moderate amount of special features, and exhibiting a moderate exterior wall and roof treatment, with a
conventional entrance door, louvered and picture windows, a raise roof, 8’ ceiling in the living room.
Grade D: Economy-type mobile homes, built of low cost quality materials and workmanship throughout, have
no special features and exhibiting conventional, but scant mobile home exterior treat in doors and windows.
28
BUILDING VALUATION MODEL
START WITH:
1. Beginning Square Foot Price 2. +/- Base Rate Adjustments 3. +/- Size Adjustment 4. +/- Construction Grade 5. +/- Number of Baths etc. (net other adjustments) Adjusted Cost per Square Foot Price
THEN: Adjusted Cost per Square Foot Price X Building Square Footage=Replacement Cost New -Depreciation Adjustment =Building Value +Other Building Features and Detached Structures (fireplaces, decks, garages) =Total of all Building Values
EXAMPLE using the Sample Field Card:
1. Beginning price per square foot is the style of the structure unique base rate and is an unadjusted square foot cost before depreciation. Colonial base rate =- $105. 2. Base rate adjustments are structural components that may have an adjustment value on the base rate. In this case,
Hardwood (Flooring) equals $2.10 plus the base rate and plaster (walls) equals $-1.05. 3. Size adjustment is based on economies of scale and market inclination. 4. Construction grade adjustment is a factor multiplied by the adjusted base rate. See Grading Table for
adjustments. Average Grade adjustment factor is 1.00. 5. Net other adjustments are structural components valued on straight dollar per unit basis.
Calculation for Sample Property Record Card:
Base Rate: 105 Size Adjustment: 0.98731 Effective Area: 2,225 Adjusted Base Rate = (105 + 1.5) * 0.98731 Adjusted Base Rate: 104.70 RCN = (({104.70 * 2,225) + 7,500) * 1) + 0 RCN: 240,458 Base Rate Adjustments Floor Cover 1 12 (Hardwood) = 2.10 + Base Rate Interior Wall 1 03 (Plastered) = -1.05 + Base Rate Flat Value Additions FULL BATHROOMS = 5000 + RCN HALF BATHROOMS = 2500 + RCN
Percent Good = 76 RCNLD: 182,700

29
Residential Base Rates
Residential Condominium
Description Base Rate Description Base Rate
Ranch 80.00$ House Conv 1FL 165.00$
Split‐Level 90.00$ House Conv 1FL+ 165.00$
Colonial 85.00$ Townhouse End 165.00$
Cape Cod 85.00$ Garden End 165.00$
Bungalow 95.00$ Townhouse Int 165.00$
Conventional 95.00$ Garden Int 165.00$
Modern/Contemp 90.00$ Townhouse/Row 200.00$
Raised Ranch 90.00$ Hanger Condo 52.00$
2 Unit 95.00$ COMM CONDO 82.00$
Duplex 95.00$ Condominium 200.00$
Townhouse/Row 95.00$ Condo Office 123.00$
Gambrel 95.00$ Condo Bank 168.00$
Garrison 85.00$ Retail Condo 88.00$
Saltbox 90.00$ Indust Condo 55.00$
Log 100.00$
3 Unit 95.00$
Mobile Home 62.00$
Double Wide MH 73.00$
Camp 80.00$
Old Style Colonial 126.00$
Condominium 208.00$
Condo Office 123.00$
Federalist 100.00$
Antique 100.00$
Mortuary/Cemet 113.00$
Other Municip 151.00$
Retail Condo 88.00$
Outbuildings ‐$
Garage/Office 76.00$
Indust Condo 55.00$
Vacant Land ‐$
___________________________________________ ____________
30
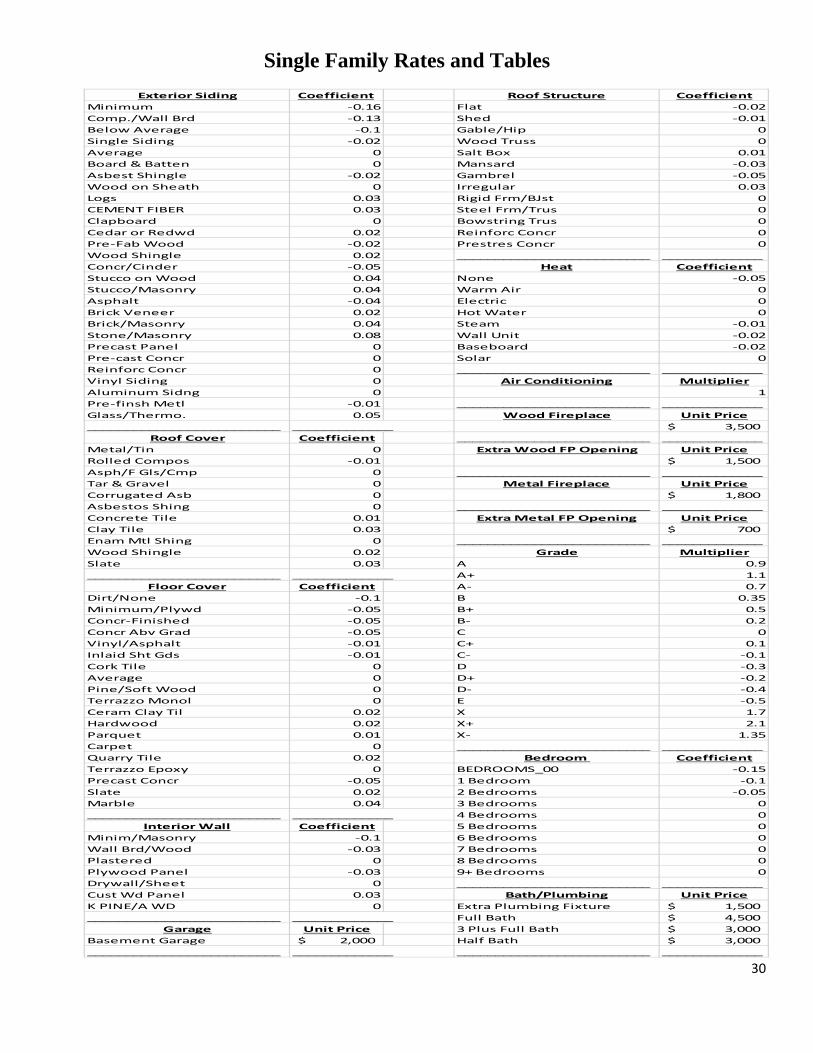
Single Family Rates and Tables
Exterior Siding Coefficient Roof Structure Coefficient
Minimum ‐0.16 Flat ‐0.02
Comp./Wall Brd ‐0.13 Shed ‐0.01
Below Average ‐0.1 Gable/Hip 0
Single Siding ‐0.02 Wood Truss 0
Average 0 Salt Box 0.01
Board & Batten 0 Mansard ‐0.03
Asbest Shingle ‐0.02 Gambrel ‐0.05
Wood on Sheath 0 Irregular 0.03
Logs 0.03 Rigid Frm/BJst 0
CEMENT FIBER 0.03 Steel Frm/Trus 0
Clapboard 0 Bowstring Trus 0
Cedar or Redwd 0.02 Reinforc Concr 0
Pre‐Fab Wood ‐0.02 Prestres Concr 0
Wood Shingle 0.02 _________________________ _____________
Concr/Cinder ‐0.05 Heat Coefficient
Stucco on Wood 0.04 None ‐0.05
Stucco/Masonry 0.04 Warm Air 0
Asphalt ‐0.04 Electric 0
Brick Veneer 0.02 Hot Water 0
Brick/Masonry 0.04 Steam ‐0.01
Stone/Masonry 0.08 Wall Unit ‐0.02
Precast Panel 0 Baseboard ‐0.02
Pre‐cast Concr 0 Solar 0
Reinforc Concr 0 _________________________ _____________
Vinyl Siding 0 Air Conditioning Multiplier
Aluminum Sidng 0 1
Pre‐finsh Metl ‐0.01 _________________________ _____________
Glass/Thermo. 0.05 Wood Fireplace Unit Price
_________________________ _____________ 3,500$
Roof Cover Coefficient _________________________ _____________
Metal/Tin 0 Extra Wood FP Opening Unit Price
Rolled Compos ‐0.01 1,500$
Asph/F Gls/Cmp 0 _________________________ _____________
Tar & Gravel 0 Metal Fireplace Unit Price
Corrugated Asb 0 1,800$
Asbestos Shing 0 _________________________ _____________
Concrete Tile 0.01 Extra Metal FP Opening Unit Price
Clay Tile 0.03 700$
Enam Mtl Shing 0 _________________________ _____________
Wood Shingle 0.02 Grade Multiplier
Slate 0.03 A 0.9
_________________________ _____________ A+ 1.1
Floor Cover Coefficient A‐ 0.7
Dirt/None ‐0.1 B 0.35
Minimum/Plywd ‐0.05 B+ 0.5
Concr‐Finished ‐0.05 B‐ 0.2
Concr Abv Grad ‐0.05 C 0
Vinyl/Asphalt ‐0.01 C+ 0.1
Inlaid Sht Gds ‐0.01 C‐ ‐0.1
Cork Tile 0 D ‐0.3
Average 0 D+ ‐0.2
Pine/Soft Wood 0 D‐ ‐0.4
Terrazzo Monol 0 E ‐0.5
Ceram Clay Til 0.02 X 1.7
Hardwood 0.02 X+ 2.1
Parquet 0.01 X‐ 1.35
Carpet 0 _________________________ _____________
Quarry Tile 0.02 Bedroom Coefficient
Terrazzo Epoxy 0 BEDROOMS_00 ‐0.15
Precast Concr ‐0.05 1 Bedroom ‐0.1
Slate 0.02 2 Bedrooms ‐0.05
Marble 0.04 3 Bedrooms 0
_________________________ _____________ 4 Bedrooms 0
Interior Wall Coefficient 5 Bedrooms 0
Minim/Masonry ‐0.1 6 Bedrooms 0
Wall Brd/Wood ‐0.03 7 Bedrooms 0
Plastered 0 8 Bedrooms 0
Plywood Panel ‐0.03 9+ Bedrooms 0
Drywall/Sheet 0 _________________________ _____________
Cust Wd Panel 0.03 Bath/Plumbing Unit Price
K PINE/A WD 0 Extra Plumbing Fixture 1,500$
_________________________ _____________ Full Bath 4,500$
Garage Unit Price 3 Plus Full Bath 3,000$
Basement Garage 2,000$ Half Bath 3,000$
_________________________ _____________ _________________________ _____________
31
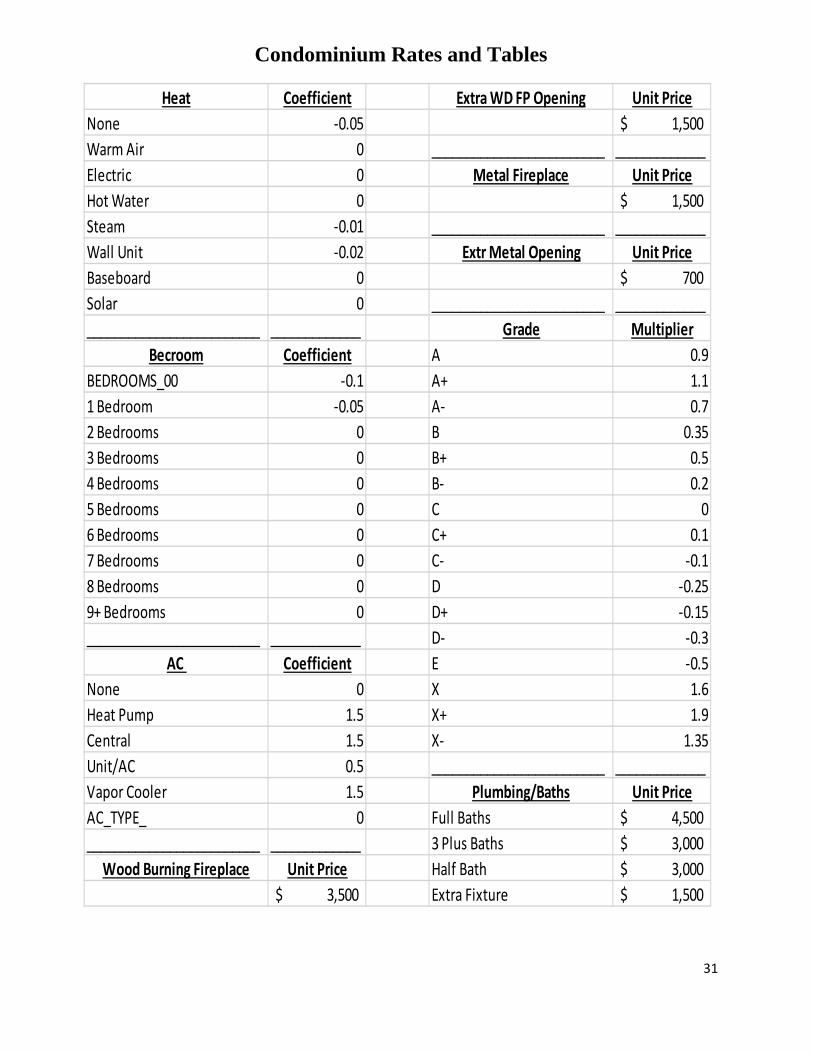
Condominium Rates and Tables
Heat Coefficient Extra WD FP Opening Unit Price
None ‐0.05 1,500$
Warm Air 0 _________________________ _____________
Electric 0 Metal Fireplace Unit Price
Hot Water 0 1,500$
Steam ‐0.01 _________________________ _____________
Wall Unit ‐0.02 Extr Metal Opening Unit Price
Baseboard 0 700$
Solar 0 _________________________ _____________
_________________________ _____________ Grade Multiplier
Becroom Coefficient A 0.9
BEDROOMS_00 ‐0.1 A+ 1.1
1 Bedroom ‐0.05 A‐ 0.7
2 Bedrooms 0 B 0.35
3 Bedrooms 0 B+ 0.5
4 Bedrooms 0 B‐ 0.2
5 Bedrooms 0 C 0
6 Bedrooms 0 C+ 0.1
7 Bedrooms 0 C‐ ‐0.1
8 Bedrooms 0 D ‐0.25
9+ Bedrooms 0 D+ ‐0.15
_________________________ _____________ D‐ ‐0.3
AC Coefficient E ‐0.5
None 0 X 1.6
Heat Pump 1.5 X+ 1.9
Central 1.5 X‐ 1.35
Unit/AC 0.5 _________________________ _____________
Vapor Cooler 1.5 Plumbing/Baths Unit Price
AC_TYPE_ 0 Full Baths 4,500$
_________________________ _____________ 3 Plus Baths 3,000$
Wood Burning Fireplace Unit Price Half Bath 3,000$
3,500$ Extra Fixture 1,500$
32
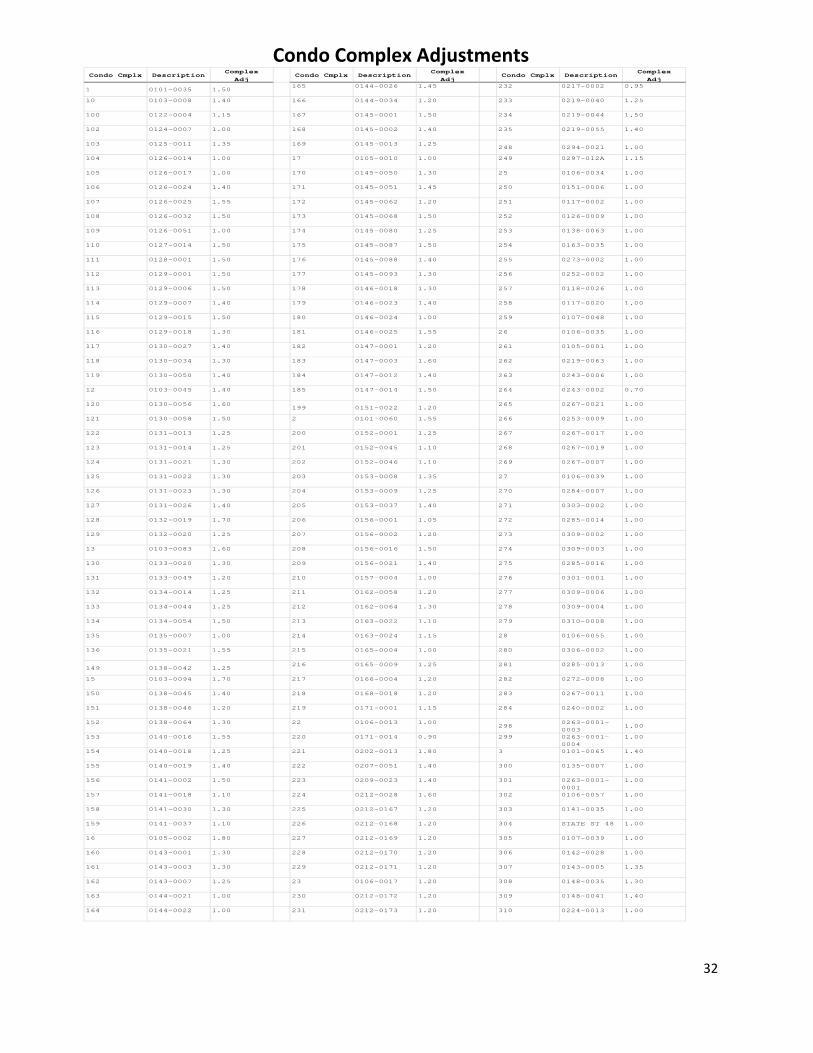
Condo Complex Adjustments
Condo Cmplx DescriptionComplex
AdjCondo Cmplx Description
ComplexAdj
Condo Cmplx DescriptionComplex
Adj
1 0101-0035 1.50165 0144-0026 1.45 232 0217-0002 0.95
10 0103-0008 1.40 166 0144-0034 1.20 233 0219-0040 1.25
100 0122-0004 1.15 167 0145-0001 1.50 234 0219-0044 1.50
102 0124-0007 1.00 168 0145-0002 1.40 235 0219-0055 1.40
103 0125-0011 1.35 169 0145-0013 1.25248 0294-0021 1.00
104 0126-0014 1.00 17 0105-0010 1.00 249 0297-012A 1.15
105 0126-0017 1.00 170 0145-0050 1.30 25 0106-0034 1.00
106 0126-0024 1.40 171 0145-0051 1.45 250 0151-0006 1.00
107 0126-0025 1.55 172 0145-0062 1.20 251 0117-0002 1.00
108 0126-0032 1.50 173 0145-0068 1.50 252 0126-0009 1.00
109 0126-0051 1.00 174 0145-0080 1.25 253 0138-0063 1.00
110 0127-0014 1.50 175 0145-0087 1.50 254 0163-0035 1.00
111 0128-0001 1.50 176 0145-0088 1.40 255 0273-0002 1.00
112 0129-0001 1.50 177 0145-0093 1.30 256 0252-0002 1.00
113 0129-0006 1.50 178 0146-0018 1.30 257 0118-0026 1.00
114 0129-0007 1.40 179 0146-0023 1.40 258 0117-0020 1.00
115 0129-0015 1.50 180 0146-0024 1.00 259 0107-0048 1.00
116 0129-0018 1.30 181 0146-0025 1.55 26 0106-0035 1.00
117 0130-0027 1.40 182 0147-0001 1.20 261 0105-0001 1.00
118 0130-0034 1.30 183 0147-0003 1.60 262 0219-0063 1.00
119 0130-0050 1.40 184 0147-0012 1.40 263 0243-0006 1.00
12 0103-0045 1.40 185 0147-0014 1.50 264 0243-0002 0.70
120 0130-0056 1.60199 0151-0022 1.20
265 0267-0021 1.00
121 0130-0058 1.50 2 0101-0060 1.55 266 0253-0009 1.00
122 0131-0013 1.25 200 0152-0001 1.25 267 0267-0017 1.00
123 0131-0014 1.25 201 0152-0045 1.10 268 0267-0019 1.00
124 0131-0021 1.30 202 0152-0046 1.10 269 0267-0007 1.00
125 0131-0022 1.30 203 0153-0008 1.35 27 0106-0039 1.00
126 0131-0023 1.30 204 0153-0009 1.25 270 0284-0007 1.00
127 0131-0026 1.40 205 0153-0037 1.40 271 0303-0002 1.00
128 0132-0019 1.70 206 0156-0001 1.05 272 0285-0014 1.00
129 0132-0020 1.25 207 0156-0002 1.20 273 0309-0002 1.00
13 0103-0083 1.60 208 0156-0016 1.50 274 0309-0003 1.00
130 0133-0020 1.30 209 0156-0021 1.40 275 0285-0016 1.00
131 0133-0049 1.20 210 0157-0004 1.00 276 0301-0001 1.00
132 0134-0014 1.25 211 0162-0058 1.20 277 0309-0006 1.00
133 0134-0044 1.25 212 0162-0064 1.30 278 0309-0004 1.00
134 0134-0054 1.50 213 0163-0022 1.10 279 0310-0008 1.00
135 0135-0007 1.00 214 0163-0024 1.15 28 0106-0055 1.00
136 0135-0021 1.55 215 0165-0004 1.00 280 0306-0002 1.00
149 0138-0042 1.25216 0165-0009 1.25 281 0285-0013 1.00
15 0103-0094 1.70 217 0166-0004 1.20 282 0272-0008 1.00
150 0138-0045 1.40 218 0168-0018 1.20 283 0267-0011 1.00
151 0138-0046 1.20 219 0171-0001 1.15 284 0240-0002 1.00
152 0138-0064 1.30 22 0106-0013 1.00298
0263-0001-0003
1.00
153 0140-0016 1.55 220 0171-0014 0.90 299 0263-0001-0004
1.00
154 0140-0018 1.25 221 0202-0013 1.80 3 0101-0065 1.40
155 0140-0019 1.40 222 0207-0051 1.40 300 0135-0007 1.00
156 0141-0002 1.50 223 0209-0023 1.40 301 0263-0001-0001
1.00
157 0141-0018 1.10 224 0212-0028 1.60 302 0106-0057 1.00
158 0141-0030 1.30 225 0212-0167 1.20 303 0141-0035 1.00
159 0141-0037 1.10 226 0212-0168 1.20 304 STATE ST 48 1.00
16 0105-0002 1.80 227 0212-0169 1.20 305 0107-0039 1.00
160 0143-0001 1.30 228 0212-0170 1.20 306 0142-0028 1.00
161 0143-0003 1.30 229 0212-0171 1.20 307 0143-0005 1.35
162 0143-0007 1.25 23 0106-0017 1.20 308 0148-0035 1.30
163 0144-0021 1.00 230 0212-0172 1.20 309 0148-0041 1.40
164 0144-0022 1.00 231 0212-0173 1.20 310 0224-0013 1.00
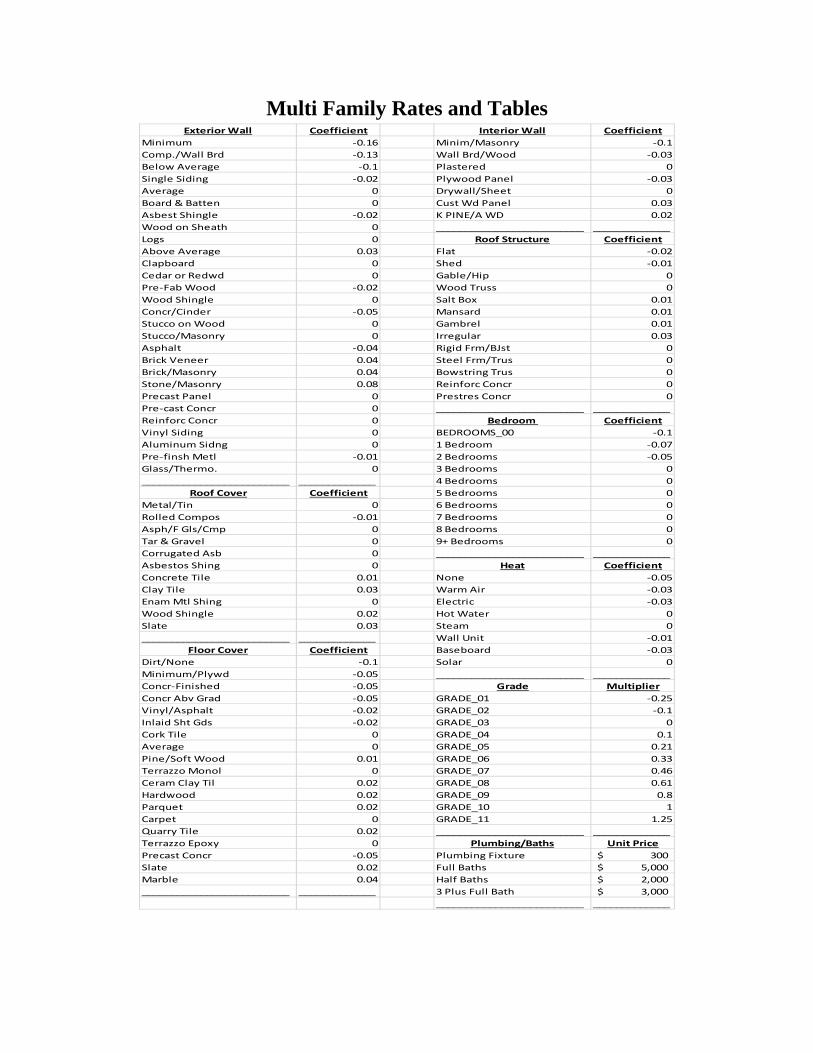
Multi Family Rates and Tables
Exterior Wall Coefficient Interior Wall Coefficient
Minimum ‐0.16 Minim/Masonry ‐0.1
Comp./Wall Brd ‐0.13 Wall Brd/Wood ‐0.03
Below Average ‐0.1 Plastered 0
Single Siding ‐0.02 Plywood Panel ‐0.03
Average 0 Drywall/Sheet 0
Board & Batten 0 Cust Wd Panel 0.03
Asbest Shingle ‐0.02 K PINE/A WD 0.02
Wood on Sheath 0 _________________________ _____________
Logs 0 Roof Structure Coefficient
Above Average 0.03 Flat ‐0.02
Clapboard 0 Shed ‐0.01
Cedar or Redwd 0 Gable/Hip 0
Pre‐Fab Wood ‐0.02 Wood Truss 0
Wood Shingle 0 Salt Box 0.01
Concr/Cinder ‐0.05 Mansard 0.01
Stucco on Wood 0 Gambrel 0.01
Stucco/Masonry 0 Irregular 0.03
Asphalt ‐0.04 Rigid Frm/BJst 0
Brick Veneer 0.04 Steel Frm/Trus 0
Brick/Masonry 0.04 Bowstring Trus 0
Stone/Masonry 0.08 Reinforc Concr 0
Precast Panel 0 Prestres Concr 0
Pre‐cast Concr 0 _________________________ _____________
Reinforc Concr 0 Bedroom Coefficient
Vinyl Siding 0 BEDROOMS_00 ‐0.1
Aluminum Sidng 0 1 Bedroom ‐0.07
Pre‐finsh Metl ‐0.01 2 Bedrooms ‐0.05
Glass/Thermo. 0 3 Bedrooms 0
_________________________ _____________ 4 Bedrooms 0
Roof Cover Coefficient 5 Bedrooms 0
Metal/Tin 0 6 Bedrooms 0
Rolled Compos ‐0.01 7 Bedrooms 0
Asph/F Gls/Cmp 0 8 Bedrooms 0
Tar & Gravel 0 9+ Bedrooms 0
Corrugated Asb 0 _________________________ _____________
Asbestos Shing 0 Heat Coefficient
Concrete Tile 0.01 None ‐0.05
Clay Tile 0.03 Warm Air ‐0.03
Enam Mtl Shing 0 Electric ‐0.03
Wood Shingle 0.02 Hot Water 0
Slate 0.03 Steam 0
_________________________ _____________ Wall Unit ‐0.01
Floor Cover Coefficient Baseboard ‐0.03
Dirt/None ‐0.1 Solar 0
Minimum/Plywd ‐0.05 _________________________ _____________
Concr‐Finished ‐0.05 Grade Multiplier
Concr Abv Grad ‐0.05 GRADE_01 ‐0.25
Vinyl/Asphalt ‐0.02 GRADE_02 ‐0.1
Inlaid Sht Gds ‐0.02 GRADE_03 0
Cork Tile 0 GRADE_04 0.1
Average 0 GRADE_05 0.21
Pine/Soft Wood 0.01 GRADE_06 0.33
Terrazzo Monol 0 GRADE_07 0.46
Ceram Clay Til 0.02 GRADE_08 0.61
Hardwood 0.02 GRADE_09 0.8
Parquet 0.02 GRADE_10 1
Carpet 0 GRADE_11 1.25
Quarry Tile 0.02 _________________________ _____________
Terrazzo Epoxy 0 Plumbing/Baths Unit Price
Precast Concr ‐0.05 Plumbing Fixture 300$
Slate 0.02 Full Baths 5,000$
Marble 0.04 Half Baths 2,000$
_________________________ _____________ 3 Plus Full Bath 3,000$
_________________________ _____________
34
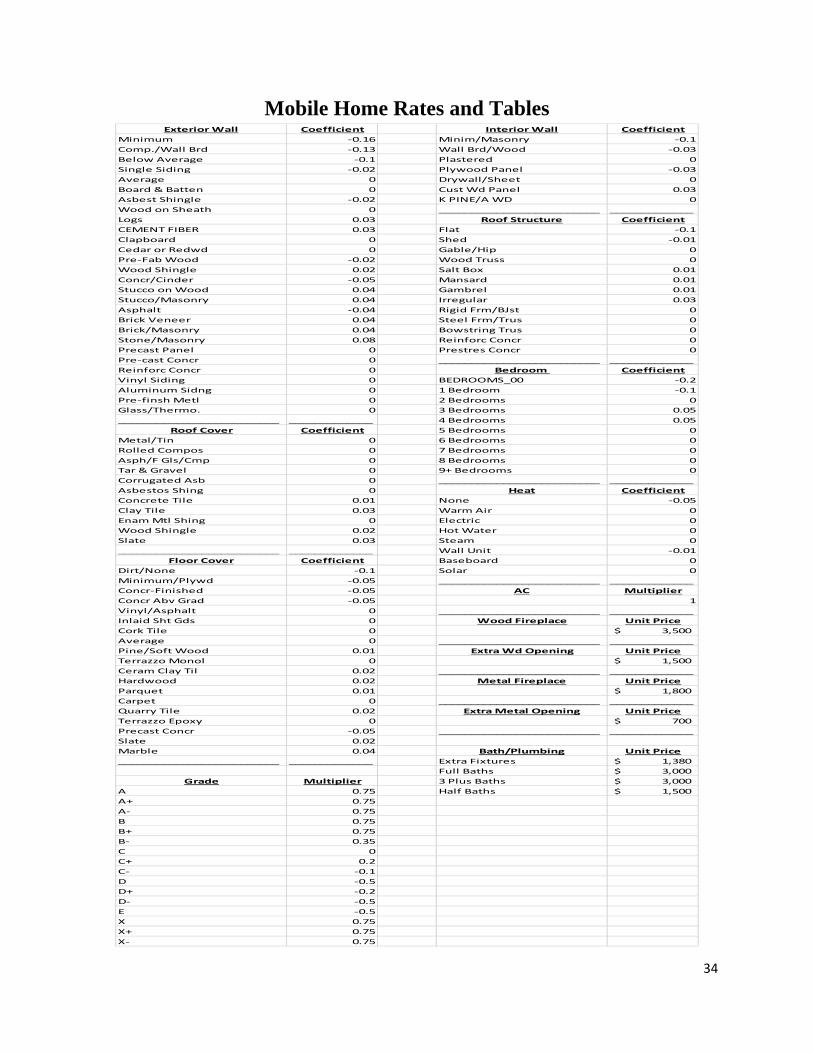
Mobile Home Rates and Tables
Exterior Wall Coefficient Interior Wall Coefficient
Minimum ‐0.16 Minim/Masonry ‐0.1
Comp./Wall Brd ‐0.13 Wall Brd/Wood ‐0.03
Below Average ‐0.1 Plastered 0
Single Siding ‐0.02 Plywood Panel ‐0.03
Average 0 Drywall/Sheet 0
Board & Batten 0 Cust Wd Panel 0.03
Asbest Shingle ‐0.02 K PINE/A WD 0
Wood on Sheath 0 _________________________ _____________
Logs 0.03 Roof Structure Coefficient
CEMENT FIBER 0.03 Flat ‐0.1
Clapboard 0 Shed ‐0.01
Cedar or Redwd 0 Gable/Hip 0
Pre‐Fab Wood ‐0.02 Wood Truss 0
Wood Shingle 0.02 Salt Box 0.01
Concr/Cinder ‐0.05 Mansard 0.01
Stucco on Wood 0.04 Gambrel 0.01
Stucco/Masonry 0.04 Irregular 0.03
Asphalt ‐0.04 Rigid Frm/BJst 0
Brick Veneer 0.04 Steel Frm/Trus 0
Brick/Masonry 0.04 Bowstring Trus 0
Stone/Masonry 0.08 Reinforc Concr 0
Precast Panel 0 Prestres Concr 0
Pre‐cast Concr 0 _________________________ _____________
Reinforc Concr 0 Bedroom Coefficient
Vinyl Siding 0 BEDROOMS_00 ‐0.2
Aluminum Sidng 0 1 Bedroom ‐0.1
Pre‐finsh Metl 0 2 Bedrooms 0
Glass/Thermo. 0 3 Bedrooms 0.05
_________________________ _____________ 4 Bedrooms 0.05
Roof Cover Coefficient 5 Bedrooms 0
Metal/Tin 0 6 Bedrooms 0
Rolled Compos 0 7 Bedrooms 0
Asph/F Gls/Cmp 0 8 Bedrooms 0
Tar & Gravel 0 9+ Bedrooms 0
Corrugated Asb 0 _________________________ _____________
Asbestos Shing 0 Heat Coefficient
Concrete Tile 0.01 None ‐0.05
Clay Tile 0.03 Warm Air 0
Enam Mtl Shing 0 Electric 0
Wood Shingle 0.02 Hot Water 0
Slate 0.03 Steam 0
_________________________ _____________ Wall Unit ‐0.01
Floor Cover Coefficient Baseboard 0
Dirt/None ‐0.1 Solar 0
Minimum/Plywd ‐0.05 _________________________ _____________
Concr‐Finished ‐0.05 AC Multiplier
Concr Abv Grad ‐0.05 1
Vinyl/Asphalt 0 _________________________ _____________
Inlaid Sht Gds 0 Wood Fireplace Unit Price
Cork Tile 0 3,500$
Average 0 _________________________ _____________
Pine/Soft Wood 0.01 Extra Wd Opening Unit Price
Terrazzo Monol 0 1,500$
Ceram Clay Til 0.02 _________________________ _____________
Hardwood 0.02 Metal Fireplace Unit Price
Parquet 0.01 1,800$
Carpet 0 _________________________ _____________
Quarry Tile 0.02 Extra Metal Opening Unit Price
Terrazzo Epoxy 0 700$
Precast Concr ‐0.05 _________________________ _____________
Slate 0.02
Marble 0.04 Bath/Plumbing Unit Price
_________________________ _____________ Extra Fixtures 1,380$
Full Baths 3,000$
Grade Multiplier 3 Plus Baths 3,000$
A 0.75 Half Baths 1,500$
A+ 0.75
A‐ 0.75
B 0.75
B+ 0.75
B‐ 0.35
C 0
C+ 0.2
C‐ ‐0.1
D ‐0.5
D+ ‐0.2
D‐ ‐0.5
E ‐0.5
X 0.75
X+ 0.75
X‐ 0.75
35
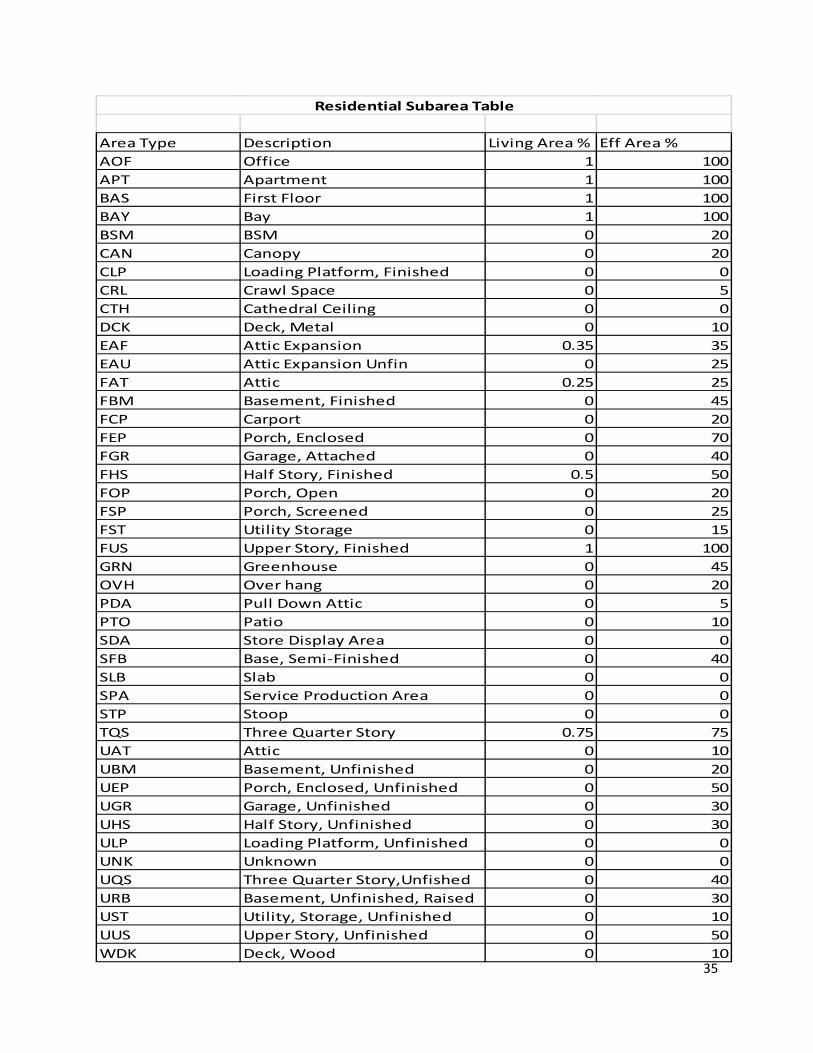
Area Type Description Living Area % Eff Area %
AOF Office 1 100
APT Apartment 1 100
BAS First Floor 1 100
BAY Bay 1 100
BSM BSM 0 20
CAN Canopy 0 20
CLP Loading Platform, Finished 0 0
CRL Crawl Space 0 5
CTH Cathedral Ceiling 0 0
DCK Deck, Metal 0 10
EAF Attic Expansion 0.35 35
EAU Attic Expansion Unfin 0 25
FAT Attic 0.25 25
FBM Basement, Finished 0 45
FCP Carport 0 20
FEP Porch, Enclosed 0 70
FGR Garage, Attached 0 40
FHS Half Story, Finished 0.5 50
FOP Porch, Open 0 20
FSP Porch, Screened 0 25
FST Utility Storage 0 15
FUS Upper Story, Finished 1 100
GRN Greenhouse 0 45
OVH Over hang 0 20
PDA Pull Down Attic 0 5
PTO Patio 0 10
SDA Store Display Area 0 0
SFB Base, Semi‐Finished 0 40
SLB Slab 0 0
SPA Service Production Area 0 0
STP Stoop 0 0
TQS Three Quarter Story 0.75 75
UAT Attic 0 10
UBM Basement, Unfinished 0 20
UEP Porch, Enclosed, Unfinished 0 50
UGR Garage, Unfinished 0 30
UHS Half Story, Unfinished 0 30
ULP Loading Platform, Unfinished 0 0
UNK Unknown 0 0
UQS Three Quarter Story,Unfished 0 40
URB Basement, Unfinished, Raised 0 30
UST Utility, Storage, Unfinished 0 10
UUS Upper Story, Unfinished 0 50
WDK Deck, Wood 0 10
Residential Subarea Table

36

37
38
39
40

41
42
43
44
45

46

47
48

49