Embed Size (px)
Citation preview
Reservoir rock properties of coal measure strata of the Lower Monongahela Group,Greene County (Southwestern Pennsylvania), from methane control andproduction perspectives
C.Özgen Karacan ⁎CDC/NIOSH Pittsburgh Research Laboratory, Disaster Prevention and Response Branch, 626 Cochrans Mill Road, PO Box 18070, Pittsburgh PA, 15236, United States
⁎ Tel.: +1 412 386 4008; fax: +1 412 386 6595.E-mail address: [email protected].
a b s t r a c t
Themethaneemission rate into anundergroundmineenvironment fromoverburden strataduring longwallminingis impacted by reservoir and geomechanical characteristics of the coalmeasure rocks in the overlying strata, aswellas the presence of anycoal seam. The reservoir characteristics andhow theychangeduringmining potentially affectthe performance of gob gas ventholes, which consequently impacts the efficiency ofmethane control in theminingenvironment.This study presents reservoir and elastic properties of coal measure rocks in the Lower Monongahela Group inGreene County, southwestern Pennsylvania, of the Northern Appalachian Basin. Since the source ofmethane in thisregion fromundergroundmining is located between the Sewickley coal and the Pittsburgh coal, a specific emphasiswas given to this interval. Core analyses were performed in the laboratory to determine rock porosity andpermeability. Geophysical loggingdata (gamma, density, sonic) obtained fromtwoexplorationboreholeswereusedfor evaluating formation boundaries, shale contents, log porosities, and geomechanical properties of formations.Permeability was also calculated using density-log data and empirical equations and compared with laboratorymeasurements and slug tests performed in isolated intervals of boreholes. The results presented in this study can beused as data sources for reservoir studies related to the production and control of methane.
1. Introduction
Methane inflow into mines from overburden strata during longwallmining and the production potentials of the surface methane degasifica-tion systems, mainly gob gas ventholes (GGV), are impacted by reservoirand geomechanical characteristics of the overlying strata. Core analysesand geophysical logging techniques are two of the important data sourcesfor characterizing the geological formations. Determinations of reservoirand strength properties of the formations are important since they affectfluidflowand storage in the overburdenbefore andafter coal extraction asthe stress and strain states change as a result of longwall operations.
Available coalbedmethane (CBM) production literature oftenprovidesmore detail on the reservoir and mechanical properties of the coal bedthan on the properties of the adjacent coal measure rocks. For instance,Vaziri et al. (1997) discuss a back analysis method for strength propertiesof the coal seam from field measurements of wellbore cavitations andmethane production. Deisman et al. (2008) give results of someunconventional geomechanical testing for coal bed reservoir well designfor the Alberta foothills and plains. Beamish and Crosdale (1998) describethe relationship between coal strength and coal composition and their
effects on outburst potential. Simulation studies for CBM production andcoal seam degasification also are concernedmainly with the properties ofthe coal bed (King et al., 1986; Remner et al., 1986; Diamond et al., 1989;King and Ertekin, 1994).
Despite their lack of attention in the literature, the reservoir andstrength properties of coal measure rocks are as important as the minedcoal seam itself, since their properties determine gas flow paths.Lunarzewski (1998) and Noack (1998) emphasized that the influence ofthe deformation processes on the mechanical properties of the rock massoccurs in a micro to macro scale. During mining-induced deformations,existing and mining-induced fractures may open further. The generationand propagation of the fractures depend on the type and composition ofthe rocks overlying the seam. Mining processes can thus create suddenand unstable gas releases leading to potentially dangerous undergroundconditions which must be prevented by using a properly designedventilation system or by employing gob gas ventholes effectively. Forinstance,Whittleset al. (2006) reported the resultsof a simulation study topredict the source and flow path of methane emissions in a UK longwall.They concluded that the geology of coal measure strata is important todetermine the caving and control ofmethane. Palchik (2003) conducted aseries of field measurements in gob gas ventholes in Torezko-Snezh-nyanskaya (Ukraine) longwall mines to determine the formation offractured zones during mining. His study showed that the location of
fractures and gas emissions are closely related to the geology of coalmeasure rocks and their distances from mining activity.
In addition to the overall reservoir and strength properties, the typesand thicknesses of coal measure rocks at the roof of a mined coal seamcause borehole stability problems during mining. Whittles et al. (2007)described the application of a computational model (FLAC2D) to simulatethe geomechanical disturbances created due to the mining of a longwallpanel at the Thoresby mine, Nottinghamshire, UK. The roof geology wasconsidered a significant feature because it was known from previousexperience that the amount of roof movement within the roadway in theregion behind the coal face greatly influenced the stability and hence thegas drainage efficiency of the boreholes. An analysis of the simulationresults provided a method of quantifying the effects of the geologicalconditions on determination of the optimum borehole spacing for thedifferent regions of the panel.
Gas emissions and thedesignandstabilityof gobgasventholesdependon the reservoir rockproperties, the types and thicknessof different layers,and the degree of their deformation dictated by their rock-strengthproperties. The knowledge of these rock properties is important forpredicting gas emissions, sudden gas releases and changes in emissionrates, as well as designing surface methane control systems. Thus,laboratory analyses of available core materials from boreholes andaccurate borehole logs of coal measure rocks are important for anyemission prediction and gob gas venthole design method.
This paperpresents analyseson coalmeasure rocks recovered fromtheLower Monongahela Group from exploration boreholes drilled in GreeneCounty, SouthwesternPennsylvania (Fig.1).Gammaray, density, andsoniclog analyses are presented to determine formation boundaries, in-situporosities, existing fractures, and geomechanical properties (shear,Young's, and bulk moduli, and Poisson's ratio). Permeabilities calculatedusing log data and empirical relationships are also presented andcompared with laboratory measurements and slug test permeabilities.The results of this paper are intended to serve as basic properties of coalmeasure rocks for site evaluations, gob gas venthole designs, and fordevelopment of numerical models for reservoir or geomechanicalsimulations.
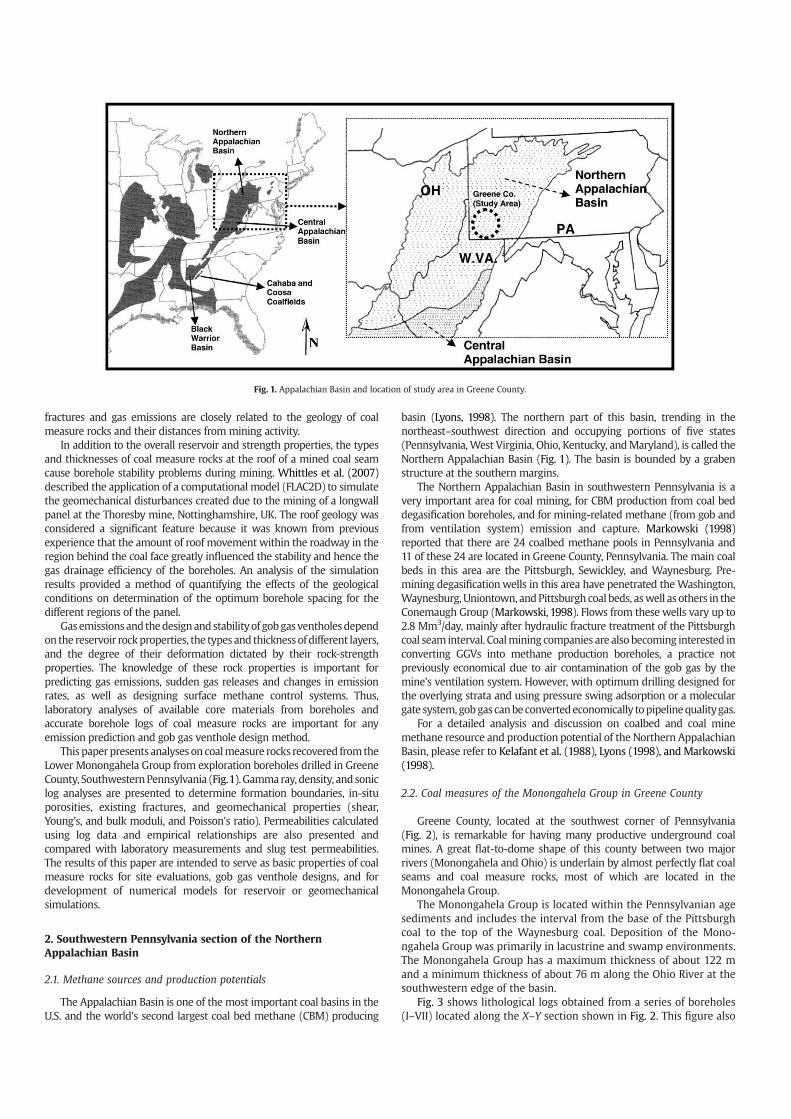
Fig. 1. Appalachian Basin and location of study area in Greene County.
2. Southwestern Pennsylvania section of the NorthernA
2.1. Methane sources and production potentials
The Appalachian Basin is one of the most important coal basins in theU.S. and the world's second largest coal bed methane (CBM) producing
basin (Lyons, 1998). The northern part of this basin, trending in thenortheast–southwest direction and occupying portions of five states(Pennsylvania,West Virginia, Ohio, Kentucky, andMaryland), is called theNorthern Appalachian Basin (Fig. 1). The basin is bounded by a grabenstructure at the southern margins.
The Northern Appalachian Basin in southwestern Pennsylvania is avery important area for coal mining, for CBM production from coal beddegasification boreholes, and for mining-related methane (from gob andfrom ventilation system) emission and capture. Markowski (1998)reported that there are 24 coalbed methane pools in Pennsylvania and11 of these 24 are located in Greene County, Pennsylvania. The main coalbeds in this area are the Pittsburgh, Sewickley, and Waynesburg. Pre-mining degasificationwells in this area have penetrated theWashington,Waynesburg, Uniontown, andPittsburgh coal beds, aswell as others in theConemaugh Group (Markowski, 1998). Flows from these wells vary up to2.8 Mm3/day, mainly after hydraulic fracture treatment of the Pittsburghcoal seam interval. Coalmining companies are also becoming interested inconverting GGVs into methane production boreholes, a practice notpreviously economical due to air contamination of the gob gas by themine's ventilation system. However, with optimum drilling designed forthe overlying strata and using pressure swing adsorption or a moleculargate system,gobgas canbeconvertedeconomically topipelinequalitygas.
For a detailed analysis and discussion on coalbed and coal minemethane resource and production potential of the Northern AppalachianBasin, please refer to Kelafant et al. (1988), Lyons (1998), and Markowski(1998).
2.2. Coal measures of the Monongahela Group in Greene County
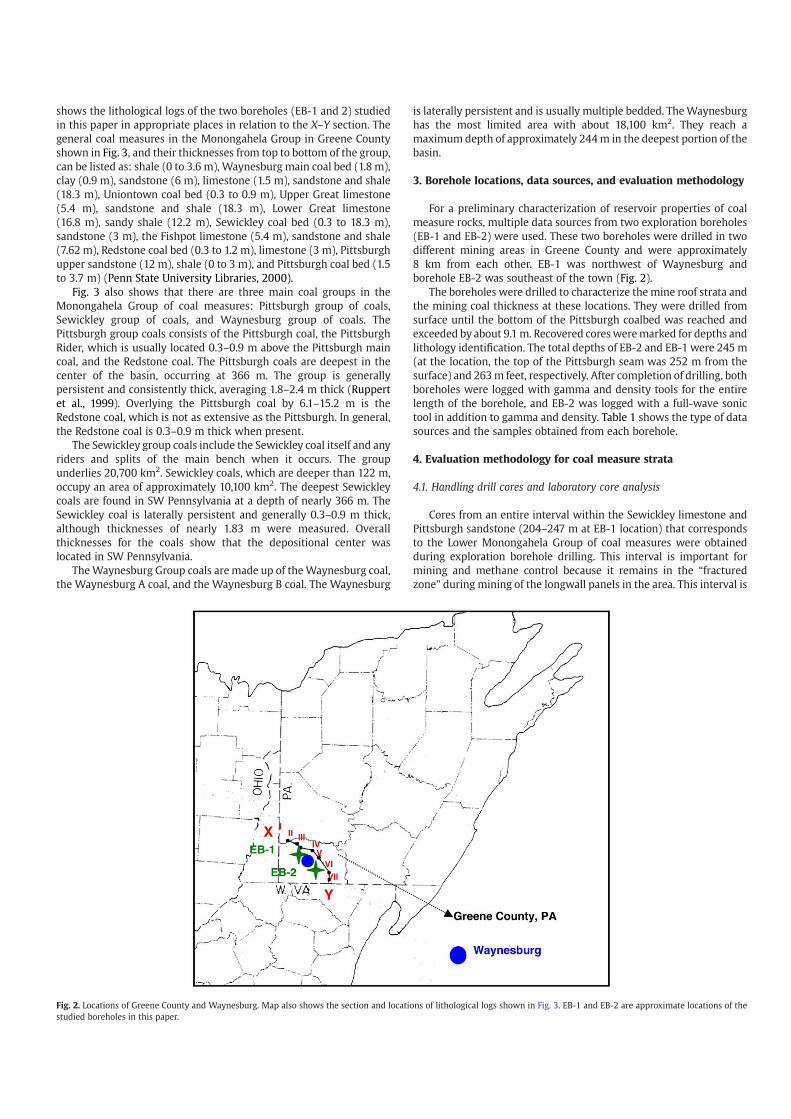
Greene County, located at the southwest corner of Pennsylvania(Fig. 2), is remarkable for having many productive underground coalmines. A great flat-to-dome shape of this county between two majorrivers (Monongahela and Ohio) is underlain by almost perfectly flat coalseams and coal measure rocks, most of which are located in theMonongahela Group.
The Monongahela Group is located within the Pennsylvanian agesediments and includes the interval from the base of the Pittsburghcoal to the top of the Waynesburg coal. Deposition of the Mono-ngahela Group was primarily in lacustrine and swamp environments.The Monongahela Group has a maximum thickness of about 122 mand a minimum thickness of about 76 m along the Ohio River at thesouthwestern edge of the basin.
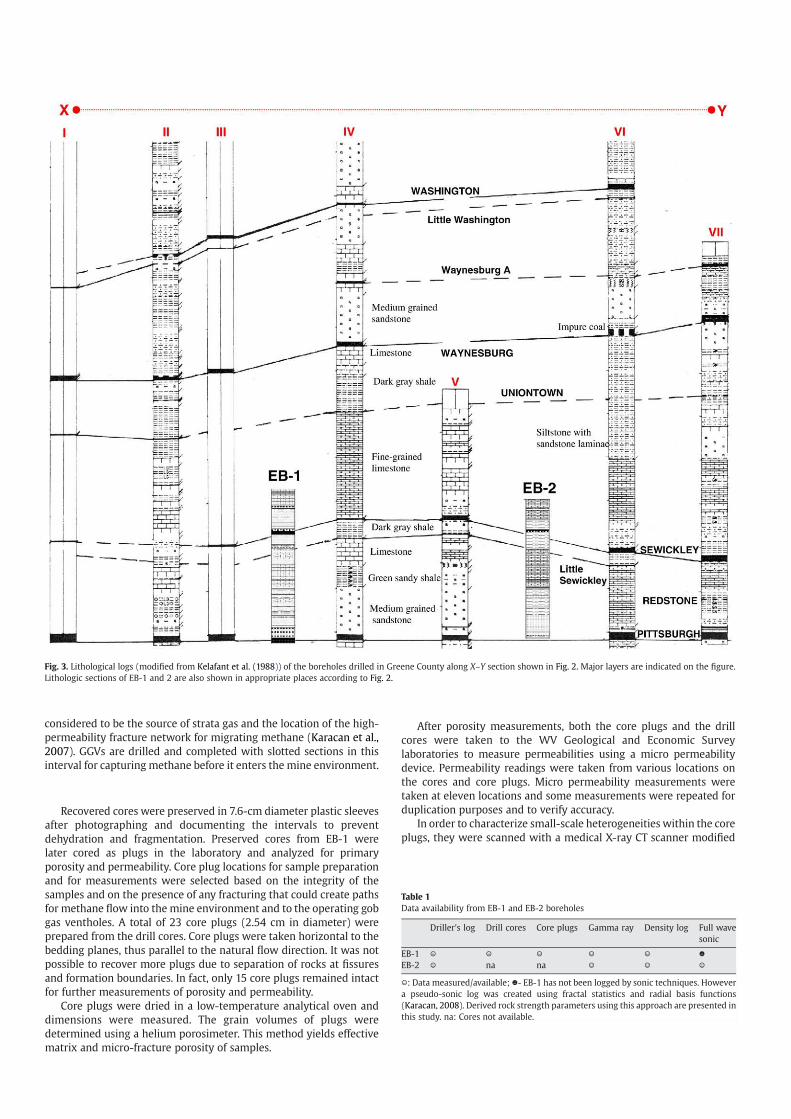
Fig. 3 shows lithological logs obtained from a series of boreholes(I–VII) located along the X–Y section shown in Fig. 2. This figure also
ppalachian Basin
shows the lithological logs of the two boreholes (EB-1 and 2) studiedin this paper in appropriate places in relation to the X–Y section. Thegeneral coal measures in the Monongahela Group in Greene Countyshown in Fig. 3, and their thicknesses from top to bottom of the group,can be listed as: shale (0 to 3.6 m), Waynesburg main coal bed (1.8 m),clay (0.9 m), sandstone (6 m), limestone (1.5 m), sandstone and shale(18.3 m), Uniontown coal bed (0.3 to 0.9 m), Upper Great limestone(5.4 m), sandstone and shale (18.3 m), Lower Great limestone(16.8 m), sandy shale (12.2 m), Sewickley coal bed (0.3 to 18.3 m),sandstone (3 m), the Fishpot limestone (5.4 m), sandstone and shale(7.62 m), Redstone coal bed (0.3 to 1.2 m), limestone (3 m), Pittsburghupper sandstone (12 m), shale (0 to 3 m), and Pittsburgh coal bed (1.5to 3.7 m) (Penn State University Libraries, 2000).
Fig. 2. Locations of Greene County and Waynesburg. Map also shows the section and locations of lithological logs shown in Fig. 3. EB-1 and EB-2 are approximate locations of thestudied boreholes in this paper.
Fig. 3 also shows that there are three main coal groups in theMonongahela Group of coal measures: Pittsburgh group of coals,Sewickley group of coals, and Waynesburg group of coals. ThePittsburgh group coals consists of the Pittsburgh coal, the PittsburghRider, which is usually located 0.3–0.9 m above the Pittsburgh maincoal, and the Redstone coal. The Pittsburgh coals are deepest in thecenter of the basin, occurring at 366 m. The group is generallypersistent and consistently thick, averaging 1.8–2.4 m thick (Ruppertet al., 1999). Overlying the Pittsburgh coal by 6.1–15.2 m is theRedstone coal, which is not as extensive as the Pittsburgh. In general,the Redstone coal is 0.3–0.9 m thick when present.
The Sewickley group coals include the Sewickley coal itself and anyriders and splits of the main bench when it occurs. The groupunderlies 20,700 km2. Sewickley coals, which are deeper than 122 m,occupy an area of approximately 10,100 km2. The deepest Sewickleycoals are found in SW Pennsylvania at a depth of nearly 366 m. TheSewickley coal is laterally persistent and generally 0.3–0.9 m thick,although thicknesses of nearly 1.83 m were measured. Overallthicknesses for the coals show that the depositional center waslocated in SW Pennsylvania.
TheWaynesburg Group coals aremade up of theWaynesburg coal,the Waynesburg A coal, and the Waynesburg B coal. The Waynesburg
is laterally persistent and is usually multiple bedded. TheWaynesburghas the most limited area with about 18,100 km2. They reach amaximum depth of approximately 244m in the deepest portion of thebasin.
3. Borehole locations, data sources, and evaluation methodology
For a preliminary characterization of reservoir properties of coalmeasure rocks, multiple data sources from two exploration boreholes(EB-1 and EB-2) were used. These two boreholes were drilled in twodifferent mining areas in Greene County and were approximately8 km from each other. EB-1 was northwest of Waynesburg andborehole EB-2 was southeast of the town (Fig. 2).
The boreholes were drilled to characterize the mine roof strata andthe mining coal thickness at these locations. They were drilled fromsurface until the bottom of the Pittsburgh coalbed was reached andexceeded by about 9.1m. Recovered cores weremarked for depths andlithology identification. The total depths of EB-2 and EB-1 were 245 m(at the location, the top of the Pittsburgh seam was 252 m from thesurface) and 263m feet, respectively. After completion of drilling, bothboreholes were logged with gamma and density tools for the entirelength of the borehole, and EB-2 was logged with a full-wave sonictool in addition to gamma and density. Table 1 shows the type of datasources and the samples obtained from each borehole.
4. Evaluation methodology for coal measure strata
4.1. Handling drill cores and laboratory core analysis
Cores from an entire interval within the Sewickley limestone andPittsburgh sandstone (204–247 m at EB-1 location) that correspondsto the Lower Monongahela Group of coal measures were obtainedduring exploration borehole drilling. This interval is important formining and methane control because it remains in the “fracturedzone” during mining of the longwall panels in the area. This interval is
considered to be the source of strata gas and the location of the high-permeability fracture network for migrating methane (Karacan et al.,2007). GGVs are drilled and completed with slotted sections in thisinterval for capturing methane before it enters the mine environment.
Table 1Data availability from EB-1 and EB-2 boreholes
Driller's log Drill cores Core plugs Gamma ray Density log Full wavesonic
EB-1 ☺ ☺ ☺ ☺ ☺ ☻EB-2 ☺ na na ☺ ☺ ☺
☺: Data measured/available; ☻- EB-1 has not been logged by sonic techniques. Howevera pseudo-sonic log was created using fractal statistics and radial basis functions(Karacan, 2008). Derived rock strength parameters using this approach are presented inthis study. na: Cores not available.
Fig. 3. Lithological logs (modified from Kelafant et al. (1988)) of the boreholes drilled in Greene County along X–Y section shown in Fig. 2. Major layers are indicated on the figure.Lithologic sections of EB-1 and 2 are also shown in appropriate places according to Fig. 2.
Recovered cores were preserved in 7.6-cm diameter plastic sleevesafter photographing and documenting the intervals to preventdehydration and fragmentation. Preserved cores from EB-1 werelater cored as plugs in the laboratory and analyzed for primaryporosity and permeability. Core plug locations for sample preparationand for measurements were selected based on the integrity of thesamples and on the presence of any fracturing that could create pathsfor methane flow into the mine environment and to the operating gobgas ventholes. A total of 23 core plugs (2.54 cm in diameter) wereprepared from the drill cores. Core plugs were taken horizontal to thebedding planes, thus parallel to the natural flow direction. It was notpossible to recover more plugs due to separation of rocks at fissuresand formation boundaries. In fact, only 15 core plugs remained intactfor further measurements of porosity and permeability.
Core plugs were dried in a low-temperature analytical oven anddimensions were measured. The grain volumes of plugs weredetermined using a helium porosimeter. This method yields effectivematrix and micro-fracture porosity of samples.
After porosity measurements, both the core plugs and the drillcores were taken to the WV Geological and Economic Surveylaboratories to measure permeabilities using a micro permeabilitydevice. Permeability readings were taken from various locations onthe cores and core plugs. Micro permeability measurements weretaken at eleven locations and some measurements were repeated forduplication purposes and to verify accuracy.
In order to characterize small-scale heterogeneities within the coreplugs, they were scanned with a medical X-ray CT scanner modified
for petrophysical studies at the DOE-NETL Morgantown facility. Coreplugs were scanned with a 1-mm beam thickness along their entirelengths. Thus, each core had 30–40 images taken at 120 KeV withwater-phantom calibration. These images were evaluated visually andby determining the average CT number and its statistics within acircular region of interest.
4.2. Evaluation of gamma ray (GR) logs for formation boundaries andshale volume
The GR is a record of a formation's radioactivity. The GR is usuallyused to identify boundaries, primarily shale units from other lowerradioactivity formations (limestones, sandstones and dolomites) andto quantify shale volume. In fractured formations, an increase in thegamma ray reading without concurrently higher formation shalinesscan be observed. This increase has been explained by deposition ofuranium salts along the discontinuity surfaces of a fracture or within
the crack itself. Also, it is not uncommon to find as much as 0.01%uranium or thorium in dark bituminous shale units, which increasesthe gamma ray reading (Dresser Atlas, 1974).
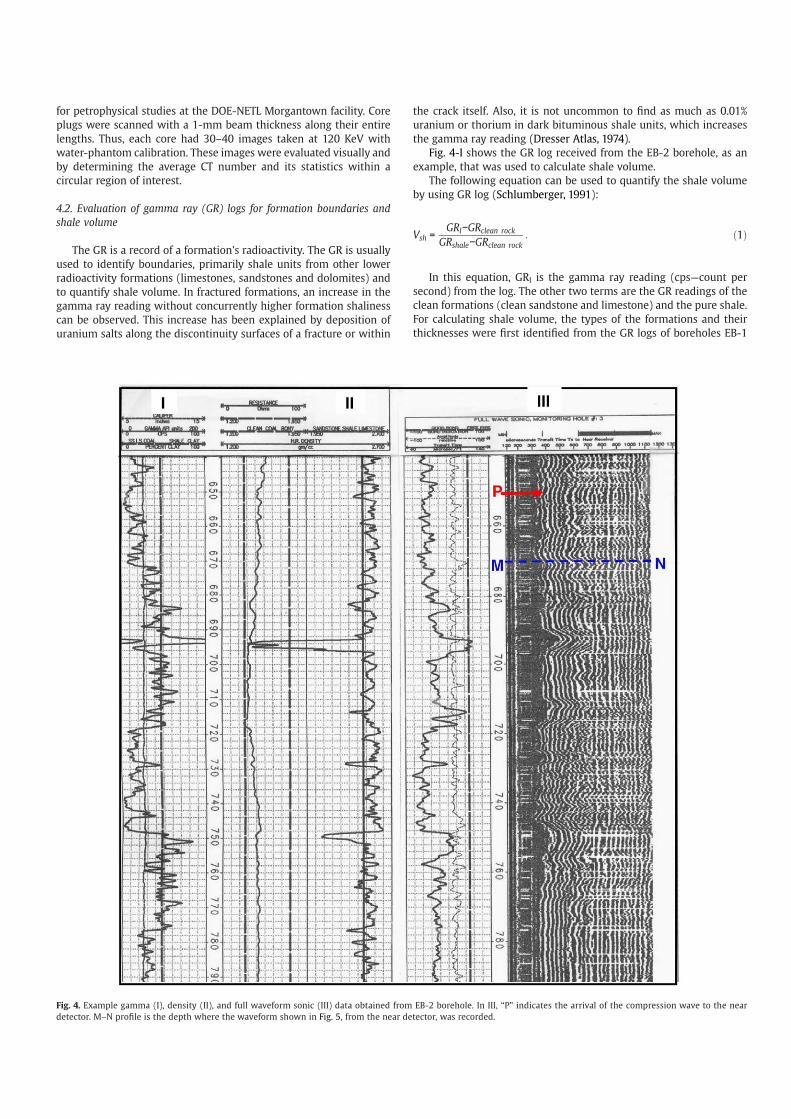
Fig. 4-I shows the GR log received from the EB-2 borehole, as anexample, that was used to calculate shale volume.
The following equation can be used to quantify the shale volumeby using GR log (Schlumberger, 1991):
GRVsh =
l−GRclean rock :GRshale−GRclean rock
ð1Þ
Fig. 4. Example gamma (I), density (II), and full waveform sonic (III) data obtained from EB-2 borehole. In III, “P” indicates the arrival of the compression wave to the neardetector. M–N profile is the depth where the waveform shown in Fig. 5, from the near detector, was recorded.
In this equation, GRl is the gamma ray reading (cps—count persecond) from the log. The other two terms are the GR readings of theclean formations (clean sandstone and limestone) and the pure shale.For calculating shale volume, the types of the formations and theirthicknesses were first identified from the GR logs of boreholes EB-1
and EB-2. The clean-formation readings of the tool were determinedby locating the clean sandstone and limestone units in the log.Pittsburgh sandstone and limestone intervals were deemed suitablefor this purpose. For the shale reading, the average reading of the shaleintervals was determined and used in the calculation (Table 2).
In shale volume calculations, each interval was calculatedseparately using the respective clean-formation reading. The aimwas to minimize errors from using a single formation GR value for theentire interval.
4.3. Evaluation of density log (DL) for porosity calculation
High-energy gamma rays from a natural radioactive material aredirected at the formation to interact with the rockmaterial tomeasurebulk density of the formation (Schlumberger, 1991). Fig. 4-II shows thedensity log along with resistivity log for the EB-2 borehole that wasused to calculate bulk density. Once the bulk density (ρb) isdetermined, one can calculate the porosity. However, before porositycan be determined, the lithology of the formation, the matrix density,and the fluid density filling the pore space must be known. For a cleanformation of known matrix density, ρma, with a fluid of averagedensity, ρf, the linear sum of the contributions can be used to calculateporosity (ϕ):
ρb = �ρf + 1ð Þ−� ρma: ð2Þ
There are a variety of factors affecting bulk density measurements.One of the most important ones is the shaliness of the formation. Thisaffects the measurement by the amount of its contribution to the totalsignal. A correction should be made to density by the volume of shale(Vshale) to obtain a shale-corrected density measurement, as follows:
ρb = ρbsh:free ð Þ1−Vshale + ρshaleVshale: ð3Þ
In Eqs. (2) and (3), and throughout the calculation of porosity, thedensity values listed in Table 3 were used for individual strataintervals to minimize the errors that may arise from using a singledensity value for the entire interval. Shale volume is determined fromthe GR log.
4.4. Calculation of Young's, shear, and bulk moduli, Poisson's ratio,porosity from sonic log (SL)
Borehole EB-2 was also logged with the full wave sonic tool. Thefull wave sonic signature of this borehole received by the near detectorwithin 201–241 m (660–790 ft) depth is shown in Fig. 4-III. In soniclogging, ultrasonic frequencies that create particle motions indifferent directions in and around the borehole are employed.
A full wave sonic tool generates three types of waves in theformation and in the borehole. In the case of a compressional wave,the acoustic wave alternately compresses the surroundingmedium ona forward movement and rarifies it on a backward movement. Theshear wave is a transverse wave in which the direction of propagationis perpendicular to the direction of particle displacement. Solids havea tendency to oppose shearing forces which cause particles to sliderelative to each other. Shear waves cannot travel through them. On theother hand, the Stoneley wave is a type of large-amplitude surfacewave generated by a sonic tool in a borehole. Stoneley waves canpropagate along the walls of a fluid-filled borehole. When theborehole crosses permeable zones or fractures, some fluid movement
occurs between these locations and the borehole. This results in someenergy loss of the wave (Endo, 2006). Thus, analysis of Stoneley wavescan define the locations of fractures and estimate the permeability ofthe formation.
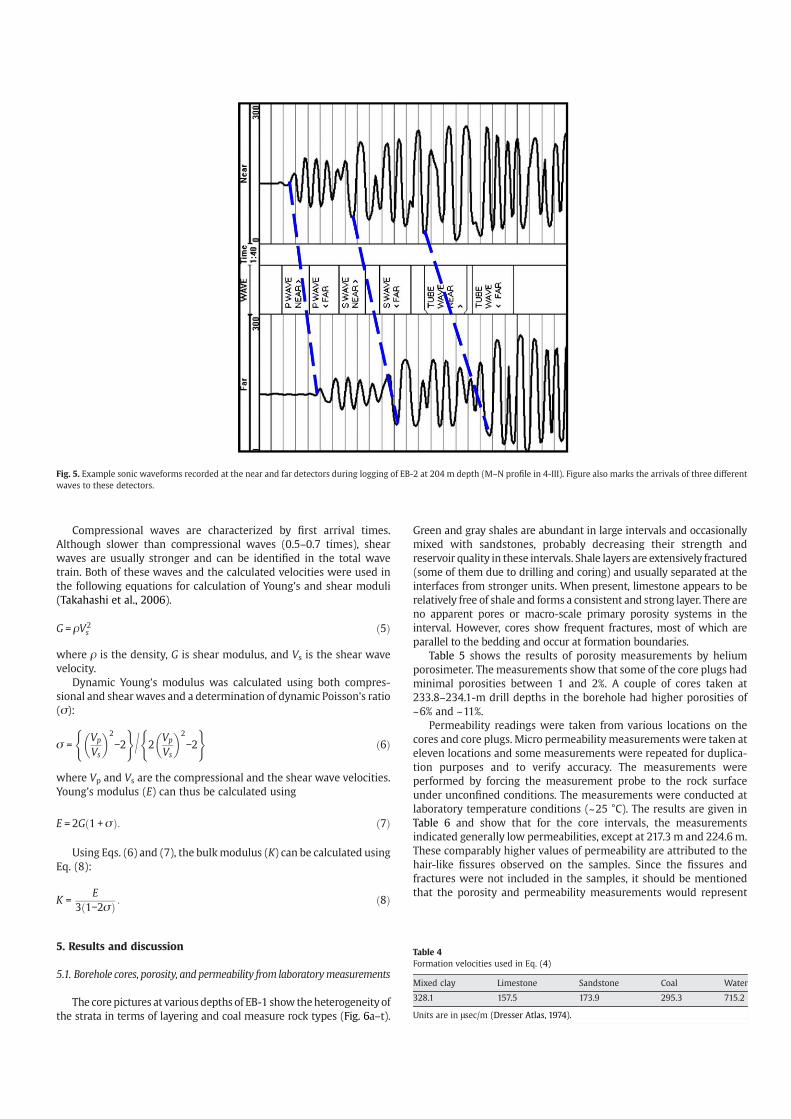
Fig. 4-III displays the full waveform, transit time, and amplitudereceived at the near detector for EB-2 within 201–241 m. In thereceiver, the P waves arrive first, the shear wave arrives next, and thetube wave traveling up the borehole water column arrives third. Shearwave and tube wave (Stoneley wave) transit times can be determinedby analyzing each of the individual wave forms for second and thirdarrivals. Long transit times for the first break, compressional wave (Pwave) arrivals, indicate slow formations, while small transit timesindicate fast formations. Only the arrival of the compression waveshows up in the full waveform clearly (P in Fig. 4-III). The shear andtube wave arrivals are read from the individual wave forms, 10 ofwhich were collected for each 30.5 cm of the borehole. Thus, for the201–241 m interval, 1300 wave forms were analyzed. The full waveform in Fig. 4-III is a plot of the individual wave forms stacked side byside, with the peaks as white and the troughs as black. A sampleindividual waveform from the near (along theM–N profile in Fig. 4-III)and the far detectors is given in Fig. 5. In this figure, the intervals showwhere compression, shear, and tubewaves arrive at a particular depth.
Acoustic travel time measurements of subsurface formations canbe interpreted in terms of formation porosity. A unit volume of rockthrough which the acoustic wave travels is influenced by the totalmake-up of that rock. The measurement recorded on the log is thesum of the effects of the solid part of the rock and the fluid-filled porespace.
In this study, the following relationships were used to calculateporosity of the formations with shale correction:
Δt−Δt= matrix Δt
� −V sh−Δtmatrix
Δtfluid−Δtsh 4
matrix Δtfluid−Δtmatrixð Þ
where Δt is the interval travel time of the compressional wave, whichwas determined from the full wave sonic record (Figs. 4-III and 5)based on the first arrival wave, and Vsh is the shale volume obtainedfrom GR-log analysis (Eq. (1)). Since the compressional wave travelsalmost twice the velocity of other waves, its arrival is undistorted bylater arriving waves.
Before using this equation for calculating porosity, it is necessary tohave values for the rockmatrix (Δtmatrix) and the formation fluid (Δtfluid).In this case, the formation fluid was assumed to be water. The intervaltransit time in the rock matrix will vary considerably depending on theformation type. To be more specific, Δtmatrix changes with variations inthe chemical composition of the rock and also its compaction (Castagnaet al.,1985; Bemer et al., 2004). The selection of propermatrix velocity tobeused in theporosity calculation requires knowledgeof the lithologyofthe sections being investigated. This informationwas gathered from thedriller's log and the lithological log of EB-2. In Eq. (4), the velocity valuesfor different strata given in Table 4 were used along with the intervaltransit times to calculate sonic porosity.
Besides porosity, velocities obtained from full wave sonic logs(Fig. 4-III) can be used as the fundamental information for rockclassification and geotechnical evaluation. Acoustic travel time of anytype of ultrasonic disturbance is explicitly tied to the density and theelasticity of the medium. In this work, shear modulus and Young'smodulus were calculated using the velocities of compressional andshear waves determined from the sonic log.
Table 3Bulk density readings for individual minerals
Mixed clay Limestone anddolomite
Sandstone Coal Water
2.5 2.8 2.65 1.35 1.0
Units are in g/cc.
Table 2GR readings for isolated formations
Carb. Shale Shale Limestone Sandstone Coal
150 100 5 40 20
Units are in cps.
Compressional waves are characterized by first arrival times.Although slower than compressional waves (0.5–0.7 times), shearwaves are usually stronger and can be identified in the total wavetrain. Both of these waves and the calculated velocities were used inthe following equations for calculation of Young's and shear moduli(Takahashi et al., 2006).
G = ρV2s ð5Þ
where ρ is the density, G is shear modulus, and Vs is the shear wavevelocity.
Dynamic Young's modulus was calculated using both compres-sional and shearwaves and a determination of dynamic Poisson's ratio(σ):
( )� �V 2
σ = p −2V
= V2 p
s
( )� �2
−2Vs
ð6Þ
where Vp and Vs are the compressional and the shear wave velocities.Young's modulus (E) can thus be calculated using
E = 2Gð Þ1 + σ : ð7Þ
Using Eqs. (6) and (7), the bulkmodulus (K) can be calculated usingEq. (8):
EK = :
3 1ð Þ−2σð8Þ
Fig. 5. Example sonic waveforms recorded at the near and far detectors during logging of EB-2 at 204 m depth (M–N profile in 4-III). Figure also marks the arrivals of three differentwaves to these detectors.
5. Results and discussion
5.1. Borehole cores, porosity, and permeability from laboratorymeasurements
The corepictures at variousdepths of EB-1 show theheterogeneityofhe strata in terms of layering and coal measure rock types (Fig. 6a–t).t
Green and gray shales are abundant in large intervals and occasionallymixed with sandstones, probably decreasing their strength andreservoir quality in these intervals. Shale layers are extensively fractured(some of them due to drilling and coring) and usually separated at theinterfaces from stronger units. When present, limestone appears to berelatively free of shale and forms a consistent and strong layer. There areno apparent pores or macro-scale primary porosity systems in theinterval. However, cores show frequent fractures, most of which areparallel to the bedding and occur at formation boundaries.
Table 5 shows the results of porosity measurements by heliumporosimeter. The measurements show that some of the core plugs hadminimal porosities between 1 and 2%. A couple of cores taken at233.8–234.1-m drill depths in the borehole had higher porosities of~6% and ~11%.
Permeability readings were taken from various locations on thecores and core plugs. Micro permeability measurements were taken ateleven locations and some measurements were repeated for duplica-tion purposes and to verify accuracy. The measurements wereperformed by forcing the measurement probe to the rock surfaceunder unconfined conditions. The measurements were conducted atlaboratory temperature conditions (~25 °C). The results are given inTable 6 and show that for the core intervals, the measurementsindicated generally low permeabilities, except at 217.3 m and 224.6 m.These comparably higher values of permeability are attributed to thehair-like fissures observed on the samples. Since the fissures andfractures were not included in the samples, it should be mentionedthat the porosity and permeability measurements would represent
Table 4Formation velocities used in Eq. (4)
Mixed clay Limestone Sandstone Coal Water
328.1 157.5 173.9 295.3 715.2
Units are in μsec/m (Dresser Atlas, 1974).
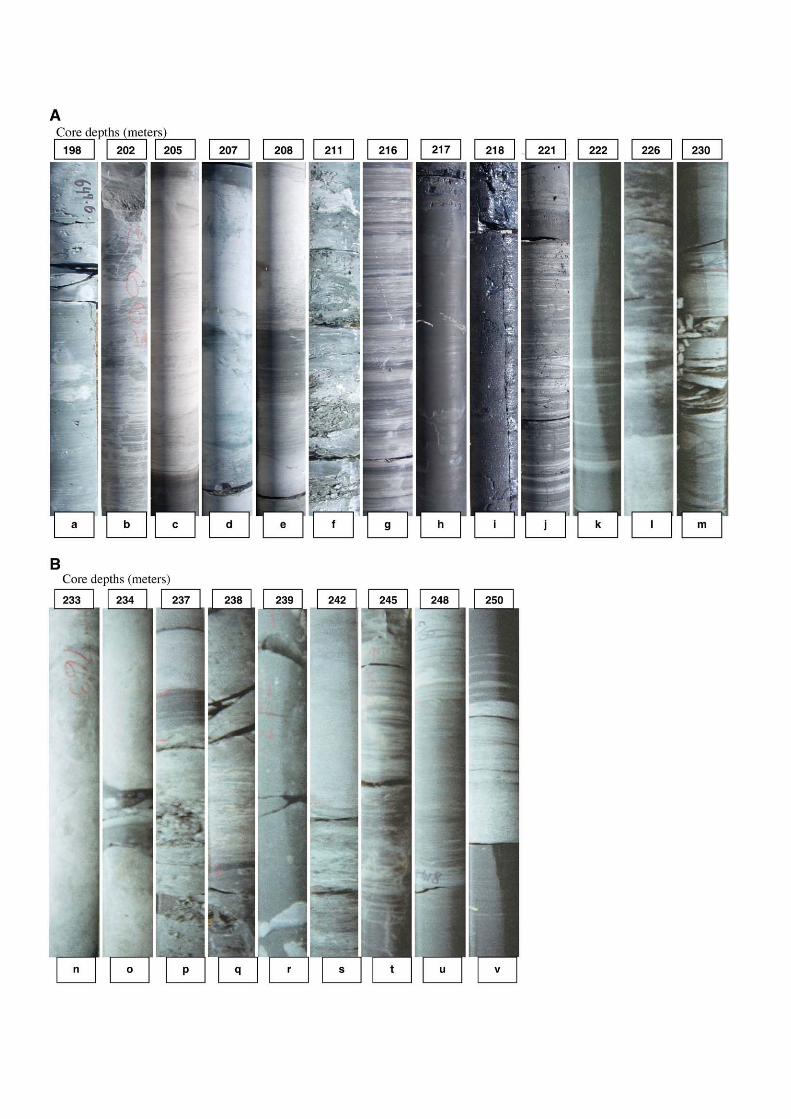
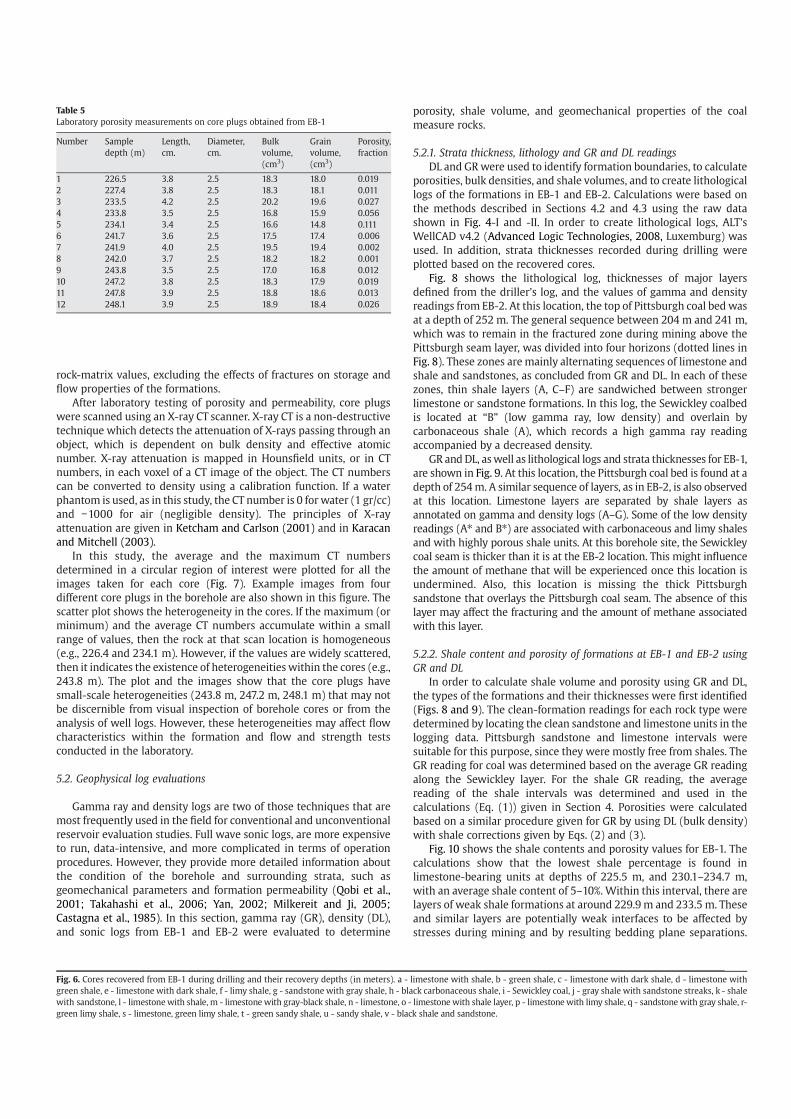
Fig. 6. Cores recovered from EB-1 during drilling and their recovery depths (in meters). a - limestone with shale, b - green shale, c - limestone with dark shale, d - limestone withgreen shale, e - limestone with dark shale, f - limy shale, g - sandstone with gray shale, h - black carbonaceous shale, i - Sewickley coal, j - gray shale with sandstone streaks, k - shalewith sandstone, l - limestonewith shale, m - limestone with gray-black shale, n - limestone, o - limestone with shale layer, p - limestone with limy shale, q - sandstone with gray shale, r-green limy shale, s - limestone, green limy shale, t - green sandy shale, u - sandy shale, v - black shale and sandstone.
rock-matrix values, excluding the effects of fractures on storage andflow properties of the formations.
After laboratory testing of porosity and permeability, core plugswere scanned using an X-ray CT scanner. X-ray CT is a non-destructivetechnique which detects the attenuation of X-rays passing through anobject, which is dependent on bulk density and effective atomicnumber. X-ray attenuation is mapped in Hounsfield units, or in CTnumbers, in each voxel of a CT image of the object. The CT numberscan be converted to density using a calibration function. If a waterphantom is used, as in this study, the CT number is 0 for water (1 gr/cc)and −1000 for air (negligible density). The principles of X-rayattenuation are given in Ketcham and Carlson (2001) and in Karacanand Mitchell (2003).
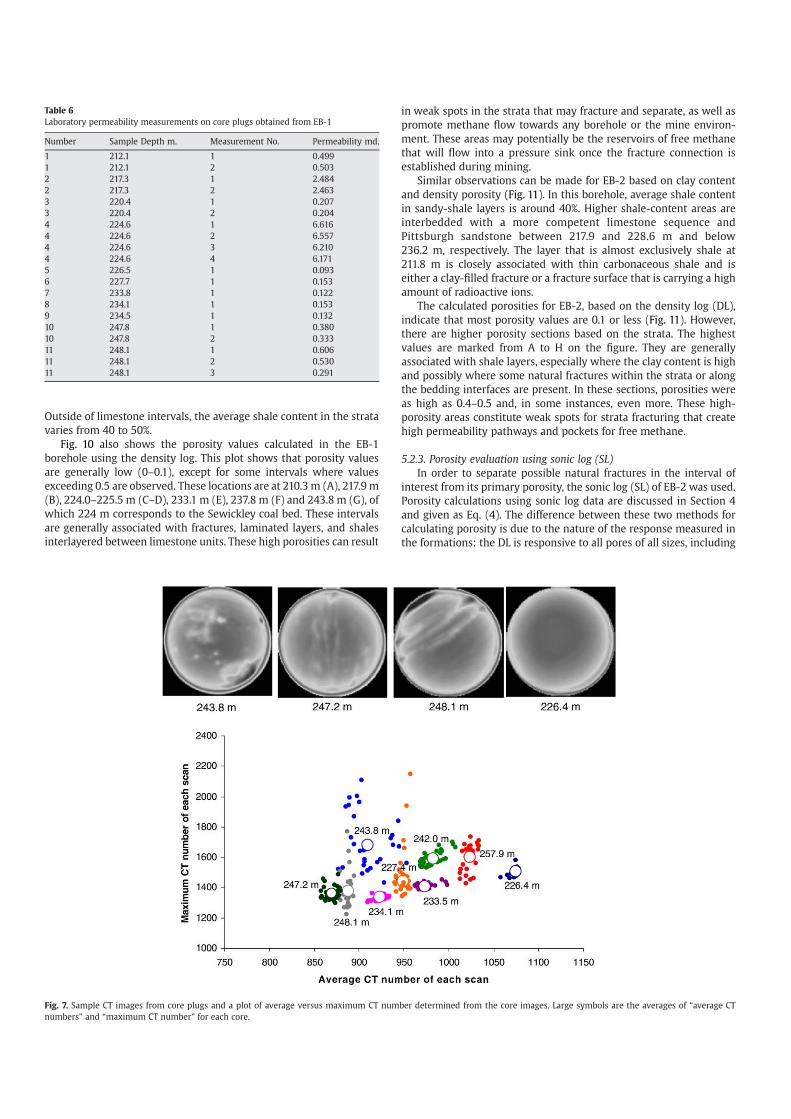
In this study, the average and the maximum CT numbersdetermined in a circular region of interest were plotted for all theimages taken for each core (Fig. 7). Example images from fourdifferent core plugs in the borehole are also shown in this figure. Thescatter plot shows the heterogeneity in the cores. If the maximum (orminimum) and the average CT numbers accumulate within a smallrange of values, then the rock at that scan location is homogeneous(e.g., 226.4 and 234.1 m). However, if the values are widely scattered,then it indicates the existence of heterogeneities within the cores (e.g.,243.8 m). The plot and the images show that the core plugs havesmall-scale heterogeneities (243.8 m, 247.2 m, 248.1 m) that may notbe discernible from visual inspection of borehole cores or from theanalysis of well logs. However, these heterogeneities may affect flowcharacteristics within the formation and flow and strength testsconducted in the laboratory.
5.2. Geophysical log evaluations
Gamma ray and density logs are two of those techniques that aremost frequently used in the field for conventional and unconventionalreservoir evaluation studies. Full wave sonic logs, are more expensiveto run, data-intensive, and more complicated in terms of operationprocedures. However, they provide more detailed information aboutthe condition of the borehole and surrounding strata, such asgeomechanical parameters and formation permeability (Qobi et al.,2001; Takahashi et al., 2006; Yan, 2002; Milkereit and Ji, 2005;Castagna et al., 1985). In this section, gamma ray (GR), density (DL),and sonic logs from EB-1 and EB-2 were evaluated to determine
porosity, shale volume, and geomechanical properties of the coalmeasure rocks.
5.2.1. Strata thickness, lithology and GR and DL readingsDL and GRwere used to identify formation boundaries, to calculate
porosities, bulk densities, and shale volumes, and to create lithologicallogs of the formations in EB-1 and EB-2. Calculations were based onthe methods described in Sections 4.2 and 4.3 using the raw datashown in Fig. 4-I and -II. In order to create lithological logs, ALT'sWellCAD v4.2 (Advanced Logic Technologies, 2008, Luxemburg) wasused. In addition, strata thicknesses recorded during drilling wereplotted based on the recovered cores.
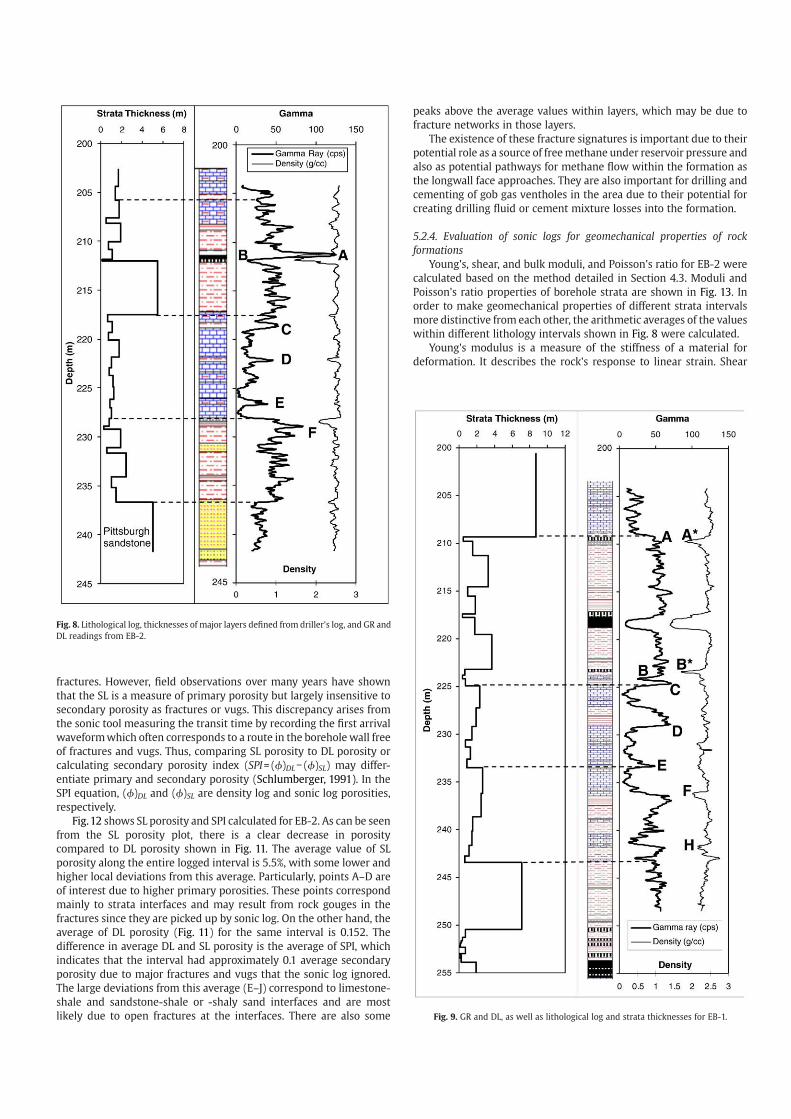
Fig. 8 shows the lithological log, thicknesses of major layersdefined from the driller's log, and the values of gamma and densityreadings from EB-2. At this location, the top of Pittsburgh coal bed wasat a depth of 252 m. The general sequence between 204 m and 241 m,which was to remain in the fractured zone during mining above thePittsburgh seam layer, was divided into four horizons (dotted lines inFig. 8). These zones are mainly alternating sequences of limestone andshale and sandstones, as concluded from GR and DL. In each of thesezones, thin shale layers (A, C–F) are sandwiched between strongerlimestone or sandstone formations. In this log, the Sewickley coalbedis located at “B” (low gamma ray, low density) and overlain bycarbonaceous shale (A), which records a high gamma ray readingaccompanied by a decreased density.
GR and DL, aswell as lithological logs and strata thicknesses for EB-1,are shown in Fig. 9. At this location, the Pittsburgh coal bed is found at adepth of 254m. A similar sequence of layers, as in EB-2, is also observedat this location. Limestone layers are separated by shale layers asannotated on gamma and density logs (A–G). Some of the low densityreadings (A⁎ and B⁎) are associated with carbonaceous and limy shalesand with highly porous shale units. At this borehole site, the Sewickleycoal seam is thicker than it is at the EB-2 location. This might influencethe amount of methane that will be experienced once this location isundermined. Also, this location is missing the thick Pittsburghsandstone that overlays the Pittsburgh coal seam. The absence of thislayer may affect the fracturing and the amount of methane associatedwith this layer.
5.2.2. Shale content and porosity of formations at EB-1 and EB-2 usingGR and DL
In order to calculate shale volume and porosity using GR and DL,the types of the formations and their thicknesses were first identified(Figs. 8 and 9). The clean-formation readings for each rock type weredetermined by locating the clean sandstone and limestone units in thelogging data. Pittsburgh sandstone and limestone intervals weresuitable for this purpose, since they were mostly free from shales. TheGR reading for coal was determined based on the average GR readingalong the Sewickley layer. For the shale GR reading, the averagereading of the shale intervals was determined and used in thecalculations (Eq. (1)) given in Section 4. Porosities were calculatedbased on a similar procedure given for GR by using DL (bulk density)with shale corrections given by Eqs. (2) and (3).
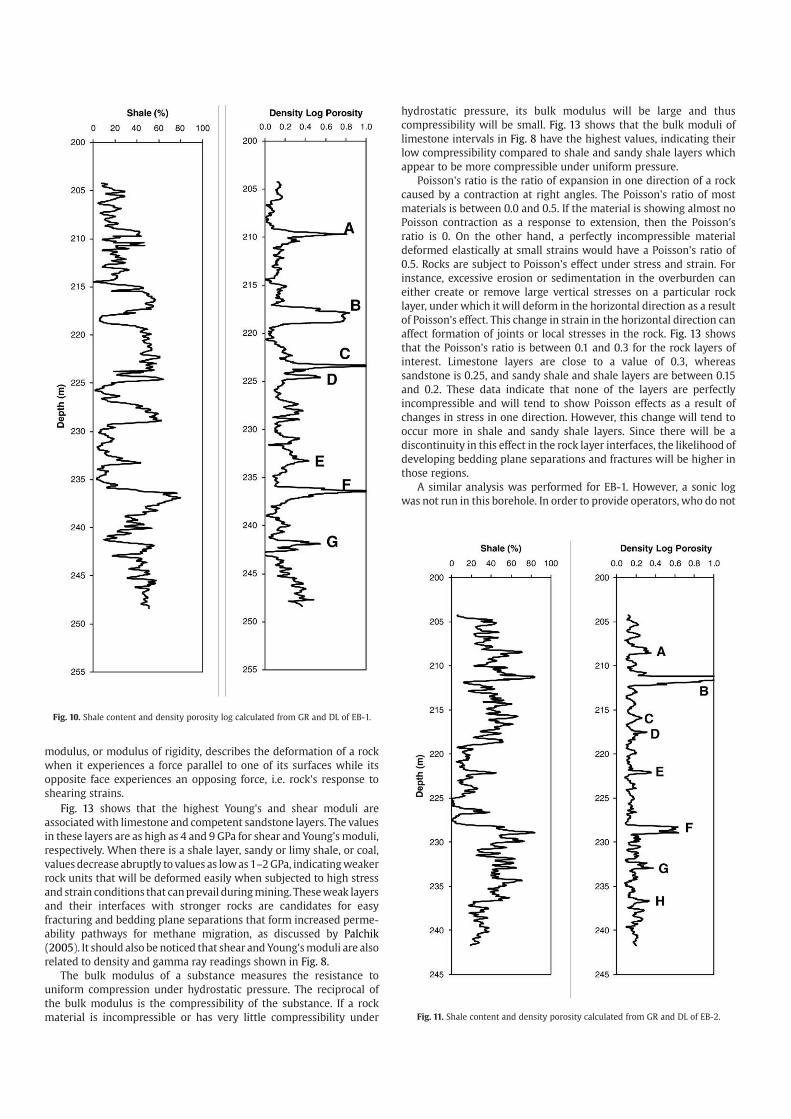
Fig. 10 shows the shale contents and porosity values for EB-1. Thecalculations show that the lowest shale percentage is found inlimestone-bearing units at depths of 225.5 m, and 230.1–234.7 m,with an average shale content of 5–10%. Within this interval, there arelayers of weak shale formations at around 229.9 m and 233.5 m. Theseand similar layers are potentially weak interfaces to be affected bystresses during mining and by resulting bedding plane separations.
Table 5Laboratory porosity measurements on core plugs obtained from EB-1
Number Sampledepth (m)
Length,cm.
Diameter,cm.
Bulkvolume,(cm3)
Grainvolume,(cm3)
Porosity,fraction
1 226.5 3.8 2.5 18.3 18.0 0.0192 227.4 3.8 2.5 18.3 18.1 0.0113 233.5 4.2 2.5 20.2 19.6 0.0274 233.8 3.5 2.5 16.8 15.9 0.0565 234.1 3.4 2.5 16.6 14.8 0.1116 241.7 3.6 2.5 17.5 17.4 0.0067 241.9 4.0 2.5 19.5 19.4 0.0028 242.0 3.7 2.5 18.2 18.2 0.0019 243.8 3.5 2.5 17.0 16.8 0.01210 247.2 3.8 2.5 18.3 17.9 0.01911 247.8 3.9 2.5 18.8 18.6 0.01312 248.1 3.9 2.5 18.9 18.4 0.026
Outside of limestone intervals, the average shale content in the stratavaries from 40 to 50%.
Fig. 7. Sample CT images from core plugs and a plot of average versus maximum CT number determined from the core images. Large symbols are the averages of “average CTnumbers” and “maximum CT number” for each core.
Fig. 10 also shows the porosity values calculated in the EB-1borehole using the density log. This plot shows that porosity valuesare generally low (0–0.1), except for some intervals where valuesexceeding 0.5 are observed. These locations are at 210.3 m (A), 217.9 m(B), 224.0–225.5 m (C–D), 233.1 m (E), 237.8 m (F) and 243.8 m (G), ofwhich 224 m corresponds to the Sewickley coal bed. These intervalsare generally associated with fractures, laminated layers, and shalesinterlayered between limestone units. These high porosities can result
in weak spots in the strata that may fracture and separate, as well aspromote methane flow towards any borehole or the mine environ-ment. These areas may potentially be the reservoirs of free methanethat will flow into a pressure sink once the fracture connection isestablished during mining.
Similar observations can be made for EB-2 based on clay contentand density porosity (Fig. 11). In this borehole, average shale contentin sandy-shale layers is around 40%. Higher shale-content areas areinterbedded with a more competent limestone sequence andPittsburgh sandstone between 217.9 and 228.6 m and below236.2 m, respectively. The layer that is almost exclusively shale at211.8 m is closely associated with thin carbonaceous shale and iseither a clay-filled fracture or a fracture surface that is carrying a highamount of radioactive ions.
The calculated porosities for EB-2, based on the density log (DL),indicate that most porosity values are 0.1 or less (Fig. 11). However,there are higher porosity sections based on the strata. The highestvalues are marked from A to H on the figure. They are generallyassociated with shale layers, especially where the clay content is highand possibly where some natural fractures within the strata or alongthe bedding interfaces are present. In these sections, porosities wereas high as 0.4–0.5 and, in some instances, even more. These high-porosity areas constitute weak spots for strata fracturing that createhigh permeability pathways and pockets for free methane.
5.2.3. Porosity evaluation using sonic log (SL)In order to separate possible natural fractures in the interval of
interest from its primary porosity, the sonic log (SL) of EB-2 was used.Porosity calculations using sonic log data are discussed in Section 4and given as Eq. (4). The difference between these two methods forcalculating porosity is due to the nature of the response measured inthe formations: the DL is responsive to all pores of all sizes, including
Table 6Laboratory permeability measurements on core plugs obtained from EB-1
Number Sample Depth m. Measurement No. Permeability md.
1 212.1 1 0.4991 212.1 2 0.5032 217.3 1 2.4842 217.3 2 2.4633 220.4 1 0.2073 220.4 2 0.2044 224.6 1 6.6164 224.6 2 6.5574 224.6 3 6.2104 224.6 4 6.1715 226.5 1 0.0936 227.7 1 0.1537 233.8 1 0.1228 234.1 1 0.1539 234.5 1 0.13210 247.8 1 0.38010 247.8 2 0.33311 248.1 1 0.60611 248.1 2 0.53011 248.1 3 0.291
fractures. However, field observations over many years have shownthat the SL is a measure of primary porosity but largely insensitive tosecondary porosity as fractures or vugs. This discrepancy arises fromthe sonic tool measuring the transit time by recording the first arrivalwaveformwhich often corresponds to a route in the borehole wall freeof fractures and vugs. Thus, comparing SL porosity to DL porosity orcalculating secondary porosity index (SPI=(ϕ)DL−(ϕ)SL) may differ-entiate primary and secondary porosity (Schlumberger, 1991). In theSPI equation, (ϕ)DL and (ϕ)SL are density log and sonic log porosities,respectively.
Fig. 8. Lithological log, thicknesses of major layers defined from driller's log, and GR andDL readings from EB-2.
Fig. 9. GR and DL, as well as lithological log and strata thicknesses for EB-1.
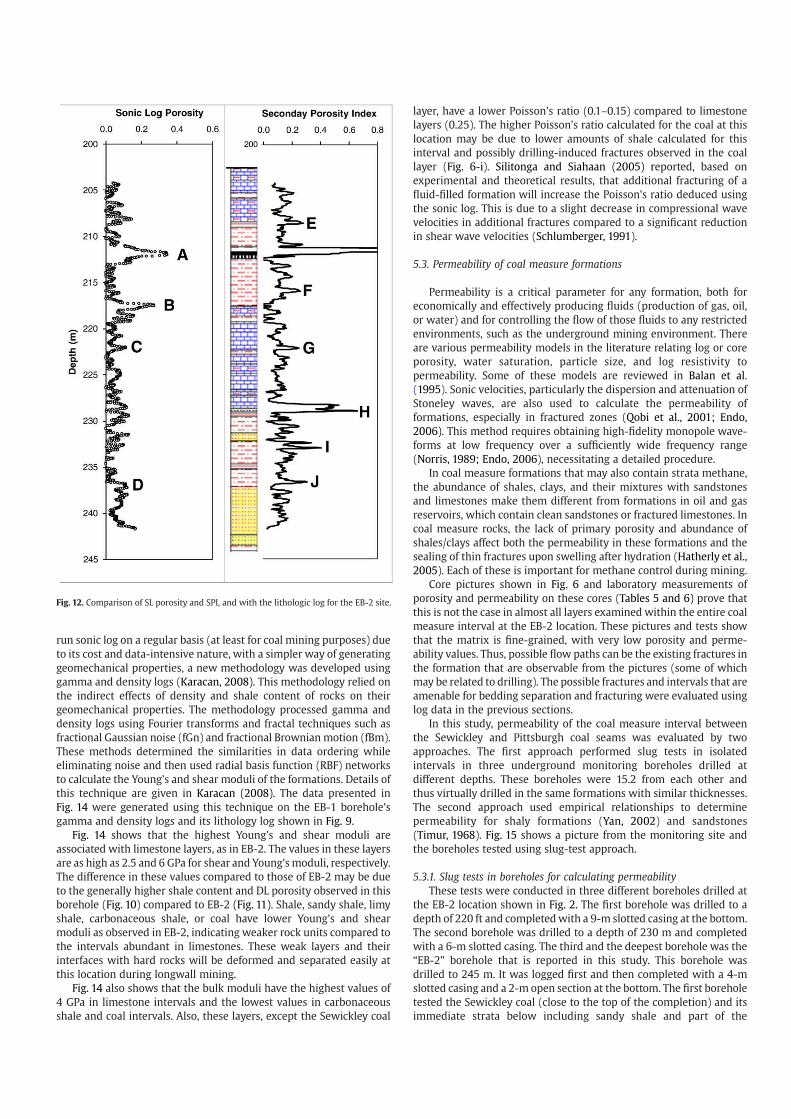
Fig.12 shows SL porosity and SPI calculated for EB-2. As can be seenfrom the SL porosity plot, there is a clear decrease in porositycompared to DL porosity shown in Fig. 11. The average value of SLporosity along the entire logged interval is 5.5%, with some lower andhigher local deviations from this average. Particularly, points A–D areof interest due to higher primary porosities. These points correspondmainly to strata interfaces and may result from rock gouges in thefractures since they are picked up by sonic log. On the other hand, theaverage of DL porosity (Fig. 11) for the same interval is 0.152. Thedifference in average DL and SL porosity is the average of SPI, whichindicates that the interval had approximately 0.1 average secondaryporosity due to major fractures and vugs that the sonic log ignored.The large deviations from this average (E–J) correspond to limestone-shale and sandstone-shale or -shaly sand interfaces and are mostlikely due to open fractures at the interfaces. There are also some
peaks above the average values within layers, which may be due tofracture networks in those layers.
The existence of these fracture signatures is important due to theirpotential role as a source of freemethane under reservoir pressure andalso as potential pathways for methane flow within the formation asthe longwall face approaches. They are also important for drilling andcementing of gob gas ventholes in the area due to their potential forcreating drilling fluid or cement mixture losses into the formation.
5.2.4. Evaluation of sonic logs for geomechanical properties of rockformations
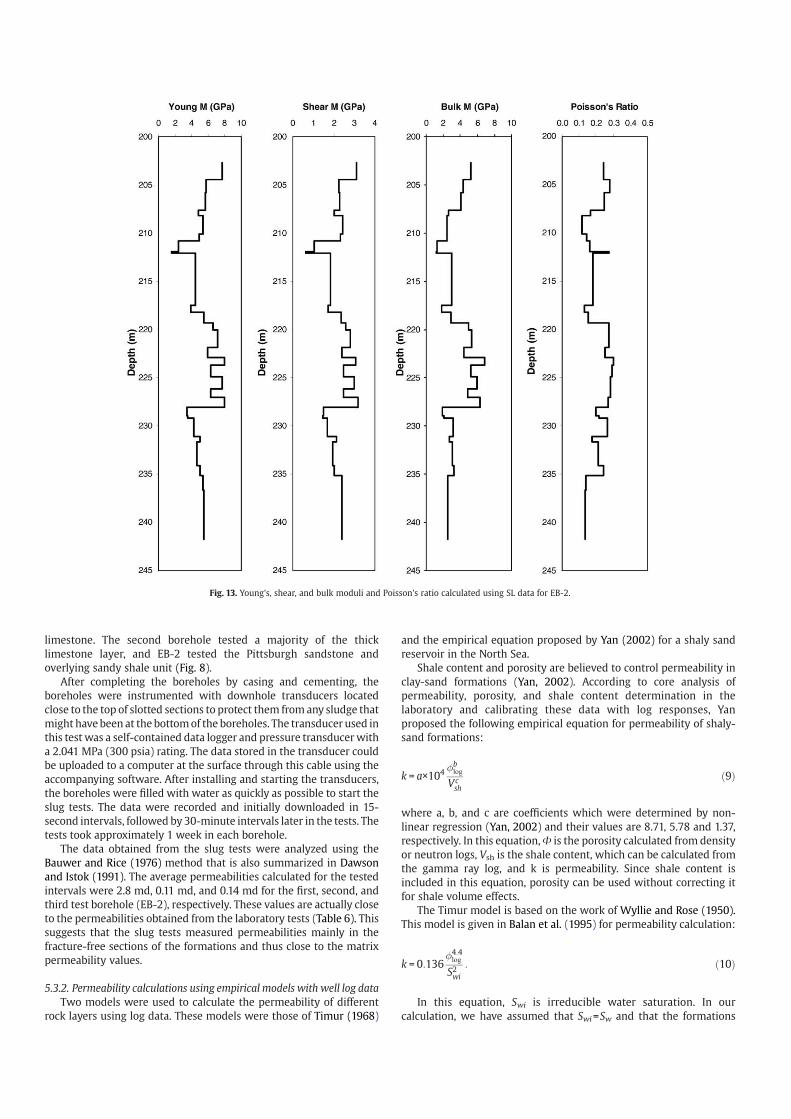
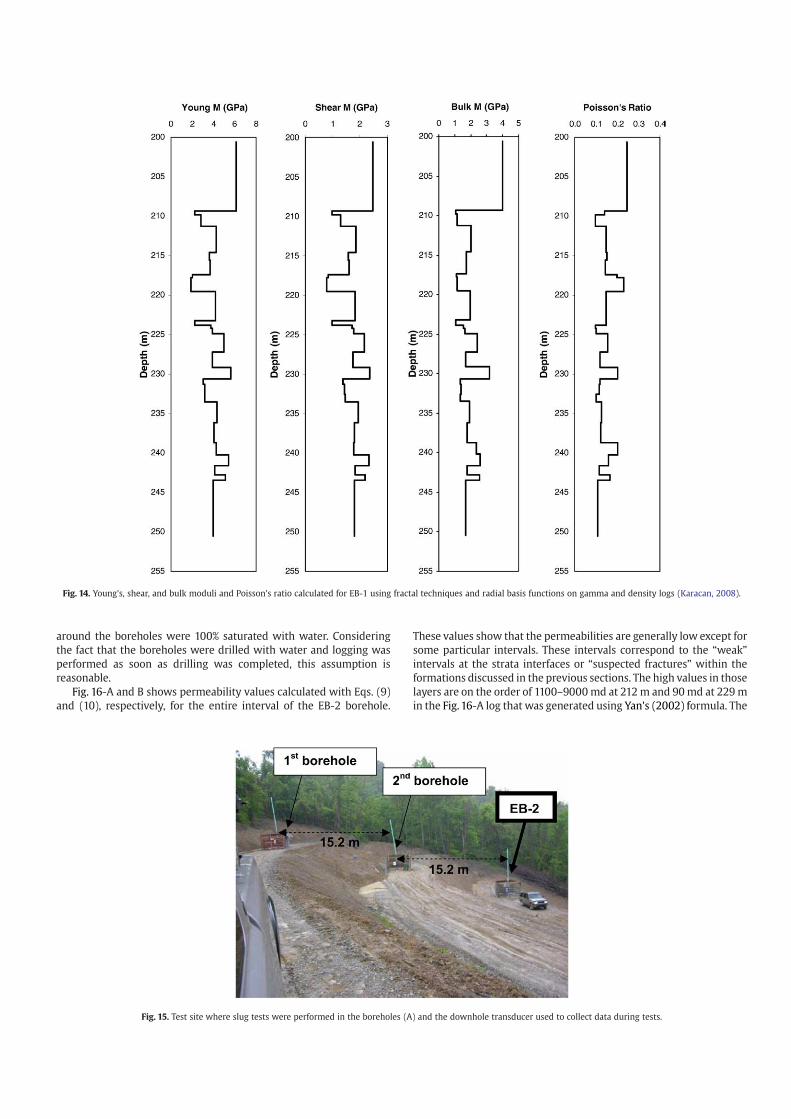
Young's, shear, and bulk moduli, and Poisson's ratio for EB-2 werecalculated based on the method detailed in Section 4.3. Moduli andPoisson's ratio properties of borehole strata are shown in Fig. 13. Inorder to make geomechanical properties of different strata intervalsmore distinctive from each other, the arithmetic averages of the valueswithin different lithology intervals shown in Fig. 8 were calculated.
Young's modulus is a measure of the stiffness of a material fordeformation. It describes the rock's response to linear strain. Shear
modulus, or modulus of rigidity, describes the deformation of a rockwhen it experiences a force parallel to one of its surfaces while itsopposite face experiences an opposing force, i.e. rock's response toshearing strains.
Fig. 10. Shale content and density porosity log calculated from GR and DL of EB-1.
Fig. 11. Shale content and density porosity calculated from GR and DL of EB-2.
Fig. 13 shows that the highest Young's and shear moduli areassociatedwith limestone and competent sandstone layers. The valuesin these layers are as high as 4 and 9 GPa for shear and Young'smoduli,respectively. When there is a shale layer, sandy or limy shale, or coal,values decrease abruptly to values as lowas 1–2GPa, indicatingweakerrock units that will be deformed easily when subjected to high stressand strain conditions that canprevail duringmining. Theseweak layersand their interfaces with stronger rocks are candidates for easyfracturing and bedding plane separations that form increased perme-ability pathways for methane migration, as discussed by Palchik(2005). It should also be noticed that shear and Young'smoduli are alsorelated to density and gamma ray readings shown in Fig. 8.
The bulk modulus of a substance measures the resistance touniform compression under hydrostatic pressure. The reciprocal ofthe bulk modulus is the compressibility of the substance. If a rockmaterial is incompressible or has very little compressibility under
hydrostatic pressure, its bulk modulus will be large and thuscompressibility will be small. Fig. 13 shows that the bulk moduli oflimestone intervals in Fig. 8 have the highest values, indicating theirlow compressibility compared to shale and sandy shale layers whichappear to be more compressible under uniform pressure.
Poisson's ratio is the ratio of expansion in one direction of a rockcaused by a contraction at right angles. The Poisson's ratio of mostmaterials is between 0.0 and 0.5. If the material is showing almost noPoisson contraction as a response to extension, then the Poisson'sratio is 0. On the other hand, a perfectly incompressible materialdeformed elastically at small strains would have a Poisson's ratio of0.5. Rocks are subject to Poisson's effect under stress and strain. Forinstance, excessive erosion or sedimentation in the overburden caneither create or remove large vertical stresses on a particular rocklayer, under which it will deform in the horizontal direction as a resultof Poisson's effect. This change in strain in the horizontal direction canaffect formation of joints or local stresses in the rock. Fig. 13 showsthat the Poisson's ratio is between 0.1 and 0.3 for the rock layers ofinterest. Limestone layers are close to a value of 0.3, whereassandstone is 0.25, and sandy shale and shale layers are between 0.15and 0.2. These data indicate that none of the layers are perfectlyincompressible and will tend to show Poisson effects as a result ofchanges in stress in one direction. However, this change will tend tooccur more in shale and sandy shale layers. Since there will be adiscontinuity in this effect in the rock layer interfaces, the likelihood ofdeveloping bedding plane separations and fractures will be higher inthose regions.
A similar analysis was performed for EB-1. However, a sonic logwas not run in this borehole. In order to provide operators, who do not
run sonic log on a regular basis (at least for coal mining purposes) dueto its cost and data-intensive nature, with a simpler way of generatinggeomechanical properties, a new methodology was developed usinggamma and density logs (Karacan, 2008). This methodology relied onthe indirect effects of density and shale content of rocks on theirgeomechanical properties. The methodology processed gamma anddensity logs using Fourier transforms and fractal techniques such asfractional Gaussian noise (fGn) and fractional Brownian motion (fBm).These methods determined the similarities in data ordering whileeliminating noise and then used radial basis function (RBF) networksto calculate the Young's and shear moduli of the formations. Details ofthis technique are given in Karacan (2008). The data presented inFig. 14 were generated using this technique on the EB-1 borehole'sgamma and density logs and its lithology log shown in Fig. 9.
Fig. 12. Comparison of SL porosity and SPI, and with the lithologic log for the EB-2 site.
Fig. 14 shows that the highest Young's and shear moduli areassociated with limestone layers, as in EB-2. The values in these layersare as high as 2.5 and 6 GPa for shear and Young'smoduli, respectively.The difference in these values compared to those of EB-2 may be dueto the generally higher shale content and DL porosity observed in thisborehole (Fig. 10) compared to EB-2 (Fig. 11). Shale, sandy shale, limyshale, carbonaceous shale, or coal have lower Young's and shearmoduli as observed in EB-2, indicating weaker rock units compared tothe intervals abundant in limestones. These weak layers and theirinterfaces with hard rocks will be deformed and separated easily atthis location during longwall mining.
Fig. 14 also shows that the bulk moduli have the highest values of4 GPa in limestone intervals and the lowest values in carbonaceousshale and coal intervals. Also, these layers, except the Sewickley coal
layer, have a lower Poisson's ratio (0.1–0.15) compared to limestonelayers (0.25). The higher Poisson's ratio calculated for the coal at thislocation may be due to lower amounts of shale calculated for thisinterval and possibly drilling-induced fractures observed in the coallayer (Fig. 6-i). Silitonga and Siahaan (2005) reported, based onexperimental and theoretical results, that additional fracturing of afluid-filled formation will increase the Poisson's ratio deduced usingthe sonic log. This is due to a slight decrease in compressional wavevelocities in additional fractures compared to a significant reductionin shear wave velocities (Schlumberger, 1991).
5.3. Permeability of coal measure formations
Permeability is a critical parameter for any formation, both foreconomically and effectively producing fluids (production of gas, oil,or water) and for controlling the flow of those fluids to any restrictedenvironments, such as the underground mining environment. Thereare various permeability models in the literature relating log or coreporosity, water saturation, particle size, and log resistivity topermeability. Some of these models are reviewed in Balan et al.(1995). Sonic velocities, particularly the dispersion and attenuation ofStoneley waves, are also used to calculate the permeability offormations, especially in fractured zones (Qobi et al., 2001; Endo,2006). This method requires obtaining high-fidelity monopole wave-forms at low frequency over a sufficiently wide frequency range(Norris, 1989; Endo, 2006), necessitating a detailed procedure.
In coal measure formations that may also contain strata methane,the abundance of shales, clays, and their mixtures with sandstonesand limestones make them different from formations in oil and gasreservoirs, which contain clean sandstones or fractured limestones. Incoal measure rocks, the lack of primary porosity and abundance ofshales/clays affect both the permeability in these formations and thesealing of thin fractures upon swelling after hydration (Hatherly et al.,2005). Each of these is important for methane control during mining.
Core pictures shown in Fig. 6 and laboratory measurements ofporosity and permeability on these cores (Tables 5 and 6) prove thatthis is not the case in almost all layers examined within the entire coalmeasure interval at the EB-2 location. These pictures and tests showthat the matrix is fine-grained, with very low porosity and perme-ability values. Thus, possible flow paths can be the existing fractures inthe formation that are observable from the pictures (some of whichmay be related to drilling). The possible fractures and intervals that areamenable for bedding separation and fracturing were evaluated usinglog data in the previous sections.
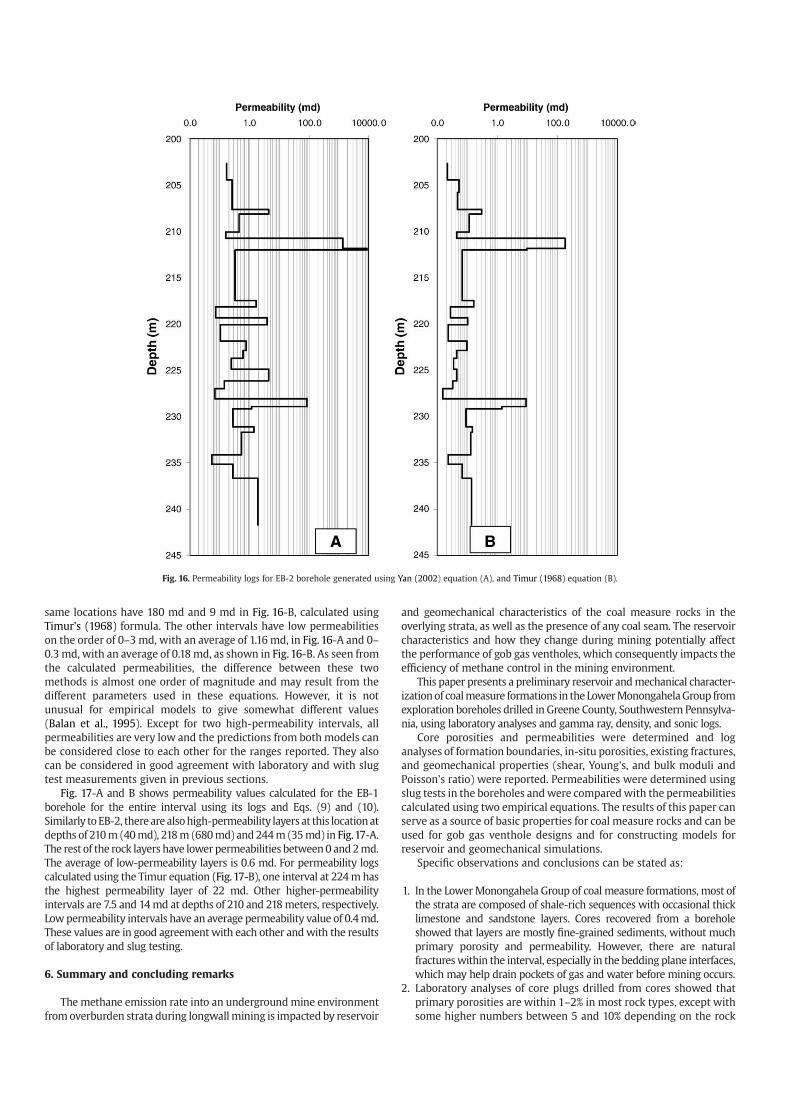
In this study, permeability of the coal measure interval betweenthe Sewickley and Pittsburgh coal seams was evaluated by twoapproaches. The first approach performed slug tests in isolatedintervals in three underground monitoring boreholes drilled atdifferent depths. These boreholes were 15.2 from each other andthus virtually drilled in the same formations with similar thicknesses.The second approach used empirical relationships to determinepermeability for shaly formations (Yan, 2002) and sandstones(Timur, 1968). Fig. 15 shows a picture from the monitoring site andthe boreholes tested using slug-test approach.
5.3.1. Slug tests in boreholes for calculating permeabilityThese tests were conducted in three different boreholes drilled at
the EB-2 location shown in Fig. 2. The first borehole was drilled to adepth of 220 ft and completedwith a 9-m slotted casing at the bottom.The second borehole was drilled to a depth of 230 m and completedwith a 6-m slotted casing. The third and the deepest borehole was the“EB-2” borehole that is reported in this study. This borehole wasdrilled to 245 m. It was logged first and then completed with a 4-mslotted casing and a 2-m open section at the bottom. The first boreholetested the Sewickley coal (close to the top of the completion) and itsimmediate strata below including sandy shale and part of the
limestone. The second borehole tested a majority of the thicklimestone layer, and EB-2 tested the Pittsburgh sandstone andoverlying sandy shale unit (Fig. 8).
Fig. 13. Young's, shear, and bulk moduli and Poisson's ratio calculated using SL data for EB-2.
After completing the boreholes by casing and cementing, theboreholes were instrumented with downhole transducers locatedclose to the top of slotted sections to protect them from any sludge thatmight havebeen at the bottomof the boreholes. The transducer used inthis test was a self-contained data logger and pressure transducerwitha 2.041 MPa (300 psia) rating. The data stored in the transducer couldbe uploaded to a computer at the surface through this cable using theaccompanying software. After installing and starting the transducers,the boreholes were filled with water as quickly as possible to start theslug tests. The data were recorded and initially downloaded in 15-second intervals, followed by 30-minute intervals later in the tests. Thetests took approximately 1 week in each borehole.
The data obtained from the slug tests were analyzed using theBauwer and Rice (1976) method that is also summarized in Dawsonand Istok (1991). The average permeabilities calculated for the testedintervals were 2.8 md, 0.11 md, and 0.14 md for the first, second, andthird test borehole (EB-2), respectively. These values are actually closeto the permeabilities obtained from the laboratory tests (Table 6). Thissuggests that the slug tests measured permeabilities mainly in thefracture-free sections of the formations and thus close to the matrixpermeability values.
5.3.2. Permeability calculations using empirical models with well log dataTwo models were used to calculate the permeability of different
rock layers using log data. These models were those of Timur (1968)
and the empirical equation proposed by Yan (2002) for a shaly sandreservoir in the North Sea.
Shale content and porosity are believed to control permeability inclay-sand formations (Yan, 2002). According to core analysis ofpermeability, porosity, and shale content determination in thelaboratory and calibrating these data with log responses, Yanproposed the following empirical equation for permeability of shaly-sand formations:
b�k = a×104 log
Vcsh
ð9Þ
where a, b, and c are coefficients which were determined by non-linear regression (Yan, 2002) and their values are 8.71, 5.78 and 1.37,respectively. In this equation,Φ is the porosity calculated from densityor neutron logs, Vsh is the shale content, which can be calculated fromthe gamma ray log, and k is permeability. Since shale content isincluded in this equation, porosity can be used without correcting itfor shale volume effects.
The Timur model is based on the work of Wyllie and Rose (1950).This model is given in Balan et al. (1995) for permeability calculation:
4� :4
k = 0:136 log:
S2wi
ð10Þ
In this equation, Swi is irreducible water saturation. In ourcalculation, we have assumed that Swi=Sw and that the formations
around the boreholes were 100% saturated with water. Consideringthe fact that the boreholes were drilled with water and logging wasperformed as soon as drilling was completed, this assumption isreasonable.
Fig. 14. Young's, shear, and bulk moduli and Poisson's ratio calculated for EB-1 using fractal techniques and radial basis functions on gamma and density logs (Karacan, 2008).
Fig. 15. Test site where slug tests were performed in the boreholes (A) and the downhole transducer used to collect data during tests.
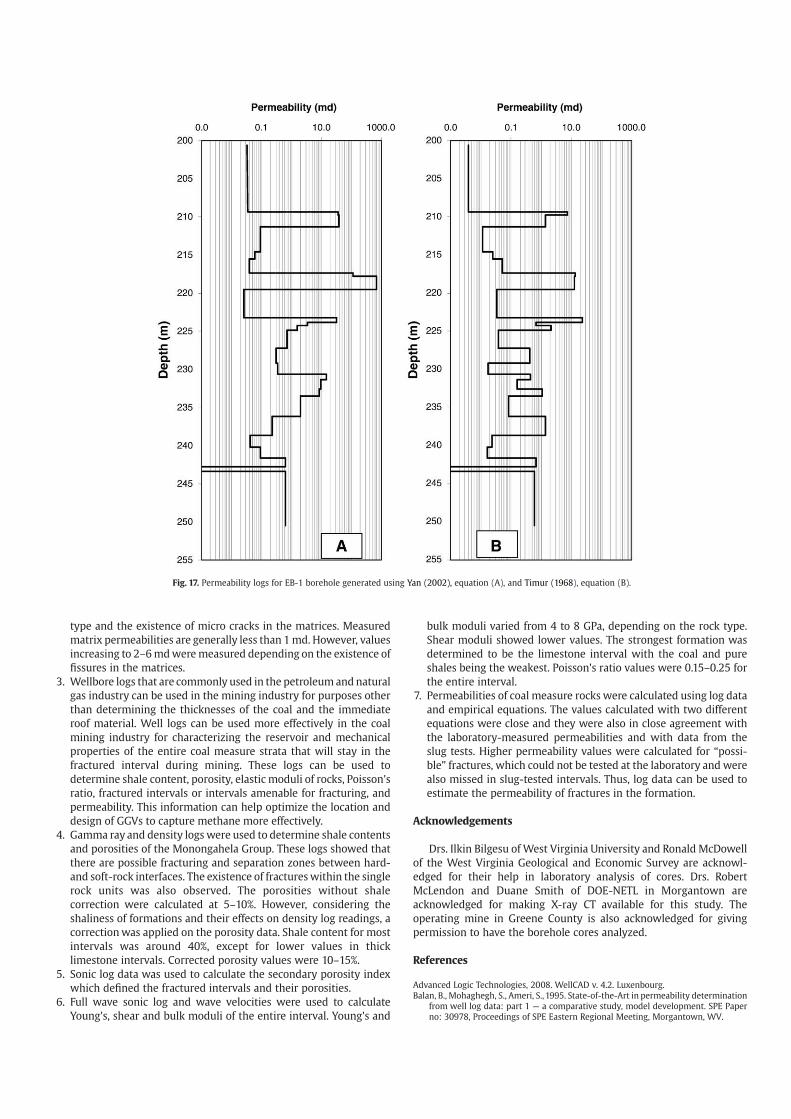
Fig. 16-A and B shows permeability values calculated with Eqs. (9)and (10), respectively, for the entire interval of the EB-2 borehole.
These values show that the permeabilities are generally low except forsome particular intervals. These intervals correspond to the “weak”intervals at the strata interfaces or “suspected fractures” within theformations discussed in the previous sections. The high values in thoselayers are on the order of 1100–9000 md at 212m and 90md at 229 min the Fig. 16-A log that was generated using Yan's (2002) formula. The
same locations have 180 md and 9 md in Fig. 16-B, calculated usingTimur's (1968) formula. The other intervals have low permeabilitieson the order of 0–3 md, with an average of 1.16 md, in Fig. 16-A and 0–0.3 md, with an average of 0.18 md, as shown in Fig. 16-B. As seen fromthe calculated permeabilities, the difference between these twomethods is almost one order of magnitude and may result from thedifferent parameters used in these equations. However, it is notunusual for empirical models to give somewhat different values(Balan et al., 1995). Except for two high-permeability intervals, allpermeabilities are very low and the predictions from both models canbe considered close to each other for the ranges reported. They alsocan be considered in good agreement with laboratory and with slugtest measurements given in previous sections.
Fig. 16. Permeability logs for EB-2 borehole generated using Yan (2002) equation (A), and Timur (1968) equation (B).
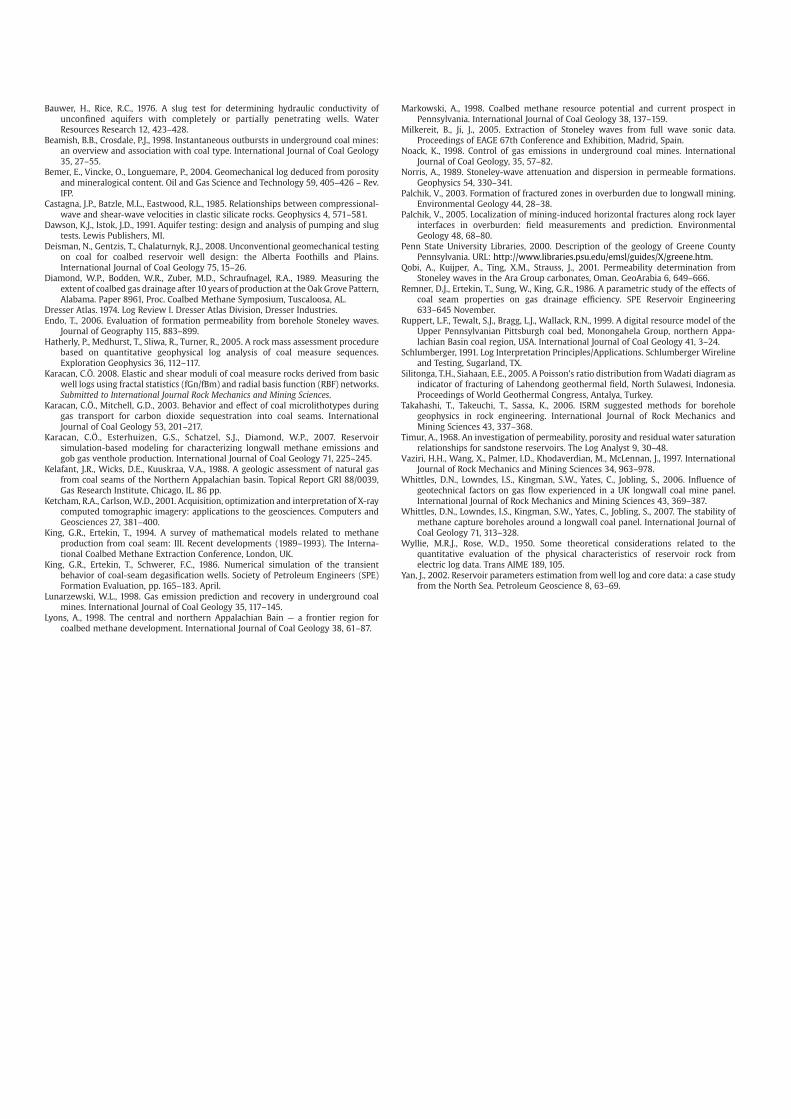
Fig. 17-A and B shows permeability values calculated for the EB-1borehole for the entire interval using its logs and Eqs. (9) and (10).Similarly toEB-2, therearealsohigh-permeability layers at this locationatdepths of 210m (40md), 218m (680md) and 244m (35md) in Fig.17-A.The rest of the rock layers have lower permeabilities between0 and2md.The average of low-permeability layers is 0.6 md. For permeability logscalculated using the Timur equation (Fig.17-B), one interval at 224m hasthe highest permeability layer of 22 md. Other higher-permeabilityintervals are 7.5 and 14md at depths of 210 and 218meters, respectively.Low permeability intervals have an average permeability value of 0.4md.These values are in good agreement with each other andwith the resultsof laboratory and slug testing.
6. Summary and concluding remarks
The methane emission rate into an undergroundmine environmentfromoverburden strata during longwall mining is impacted by reservoir
and geomechanical characteristics of the coal measure rocks in theoverlying strata, as well as the presence of any coal seam. The reservoircharacteristics and how they change during mining potentially affectthe performance of gob gas ventholes, which consequently impacts theefficiency of methane control in the mining environment.
This paper presents a preliminary reservoir andmechanical character-izationof coalmeasure formations in the LowerMonongahelaGroup fromexploration boreholes drilled in Greene County, Southwestern Pennsylva-nia, using laboratory analyses and gamma ray, density, and sonic logs.
Core porosities and permeabilities were determined and loganalyses of formation boundaries, in-situ porosities, existing fractures,and geomechanical properties (shear, Young's, and bulk moduli andPoisson's ratio) were reported. Permeabilities were determined usingslug tests in the boreholes andwere comparedwith the permeabilitiescalculated using two empirical equations. The results of this paper canserve as a source of basic properties for coal measure rocks and can beused for gob gas venthole designs and for constructing models forreservoir and geomechanical simulations.
Specific observations and conclusions can be stated as:
1. In the LowerMonongahela Group of coal measure formations, most ofthe strata are composed of shale-rich sequences with occasional thicklimestone and sandstone layers. Cores recovered from a boreholeshowed that layers are mostly fine-grained sediments, without muchprimary porosity and permeability. However, there are naturalfractureswithin the interval, especially in the bedding plane interfaces,which may help drain pockets of gas and water before mining occurs.
2. Laboratory analyses of core plugs drilled from cores showed thatprimary porosities are within 1–2% in most rock types, except withsome higher numbers between 5 and 10% depending on the rock
type and the existence of micro cracks in the matrices. Measuredmatrix permeabilities are generally less than 1md. However, valuesincreasing to 2–6mdweremeasured depending on the existence offissures in the matrices.
3. Wellbore logs that are commonly used in the petroleum and naturalgas industry can be used in the mining industry for purposes otherthan determining the thicknesses of the coal and the immediateroof material. Well logs can be used more effectively in the coalmining industry for characterizing the reservoir and mechanicalproperties of the entire coal measure strata that will stay in thefractured interval during mining. These logs can be used todetermine shale content, porosity, elastic moduli of rocks, Poisson'sratio, fractured intervals or intervals amenable for fracturing, andpermeability. This information can help optimize the location anddesign of GGVs to capture methane more effectively.
4. Gamma ray and density logs were used to determine shale contentsand porosities of the Monongahela Group. These logs showed thatthere are possible fracturing and separation zones between hard-and soft-rock interfaces. The existence of fractureswithin the singlerock units was also observed. The porosities without shalecorrection were calculated at 5–10%. However, considering theshaliness of formations and their effects on density log readings, acorrectionwas applied on the porosity data. Shale content for mostintervals was around 40%, except for lower values in thicklimestone intervals. Corrected porosity values were 10–15%.
5. Sonic log data was used to calculate the secondary porosity indexwhich defined the fractured intervals and their porosities.
6. Full wave sonic log and wave velocities were used to calculateYoung's, shear and bulk moduli of the entire interval. Young's and
bulk moduli varied from 4 to 8 GPa, depending on the rock type.Shear moduli showed lower values. The strongest formation wasdetermined to be the limestone interval with the coal and pureshales being the weakest. Poisson's ratio values were 0.15–0.25 forthe entire interval.
7. Permeabilities of coal measure rocks were calculated using log dataand empirical equations. The values calculated with two differentequations were close and they were also in close agreement withthe laboratory-measured permeabilities and with data from theslug tests. Higher permeability values were calculated for “possi-ble” fractures, which could not be tested at the laboratory and werealso missed in slug-tested intervals. Thus, log data can be used toestimate the permeability of fractures in the formation.
Fig. 17. Permeability logs for EB-1 borehole generated using Yan (2002), equation (A), and Timur (1968), equation (B).
Acknowledgements
Drs. Ilkin Bilgesu of West Virginia University and Ronald McDowellof the West Virginia Geological and Economic Survey are acknowl-edged for their help in laboratory analysis of cores. Drs. RobertMcLendon and Duane Smith of DOE-NETL in Morgantown areacknowledged for making X-ray CT available for this study. Theoperating mine in Greene County is also acknowledged for givingpermission to have the borehole cores analyzed.
References
Advanced Logic Technologies, 2008. WellCAD v. 4.2. Luxenbourg.Balan, B., Mohaghegh, S., Ameri, S., 1995. State-of-the-Art in permeability determination
from well log data: part 1 — a comparative study, model development. SPE Paperno: 30978, Proceedings of SPE Eastern Regional Meeting, Morgantown, WV.
Bauwer, H., Rice, R.C., 1976. A slug test for determining hydraulic conductivity ofunconfined aquifers with completely or partially penetrating wells. WaterResources Research 12, 423–428.
Beamish, B.B., Crosdale, P.J., 1998. Instantaneous outbursts in underground coal mines:an overview and association with coal type. International Journal of Coal Geology35, 27–55.
Bemer, E., Vincke, O., Longuemare, P., 2004. Geomechanical log deduced from porosityand mineralogical content. Oil and Gas Science and Technology 59, 405–426 – Rev.IFP.
Castagna, J.P., Batzle, M.L., Eastwood, R.L., 1985. Relationships between compressional-wave and shear-wave velocities in clastic silicate rocks. Geophysics 4, 571–581.
Dawson, K.J., Istok, J.D., 1991. Aquifer testing: design and analysis of pumping and slugtests. Lewis Publishers, MI.
Deisman, N., Gentzis, T., Chalaturnyk, R.J., 2008. Unconventional geomechanical testingon coal for coalbed reservoir well design: the Alberta Foothills and Plains.International Journal of Coal Geology 75, 15–26.
Diamond, W.P., Bodden, W.R., Zuber, M.D., Schraufnagel, R.A., 1989. Measuring theextent of coalbed gas drainage after 10 years of production at the Oak Grove Pattern,Alabama. Paper 8961, Proc. Coalbed Methane Symposium, Tuscaloosa, AL.
Dresser Atlas. 1974. Log Review I. Dresser Atlas Division, Dresser Industries.Endo, T., 2006. Evaluation of formation permeability from borehole Stoneley waves.
Journal of Geography 115, 883–899.Hatherly, P., Medhurst, T., Sliwa, R., Turner, R., 2005. A rock mass assessment procedure
based on quantitative geophysical log analysis of coal measure sequences.Exploration Geophysics 36, 112–117.
Karacan, C.Ö. 2008. Elastic and shear moduli of coal measure rocks derived from basicwell logs using fractal statistics (fGn/fBm) and radial basis function (RBF) networks.Submitted to International Journal Rock Mechanics and Mining Sciences.
Karacan, C.Ö., Mitchell, G.D., 2003. Behavior and effect of coal microlithotypes duringgas transport for carbon dioxide sequestration into coal seams. InternationalJournal of Coal Geology 53, 201–217.
Karacan, C.Ö., Esterhuizen, G.S., Schatzel, S.J., Diamond, W.P., 2007. Reservoirsimulation-based modeling for characterizing longwall methane emissions andgob gas venthole production. International Journal of Coal Geology 71, 225–245.
Kelafant, J.R., Wicks, D.E., Kuuskraa, V.A., 1988. A geologic assessment of natural gasfrom coal seams of the Northern Appalachian basin. Topical Report GRI 88/0039,Gas Research Institute, Chicago, IL. 86 pp.
Ketcham, R.A., Carlson,W.D., 2001. Acquisition, optimization and interpretation of X-raycomputed tomographic imagery: applications to the geosciences. Computers andGeosciences 27, 381–400.
King, G.R., Ertekin, T., 1994. A survey of mathematical models related to methaneproduction from coal seam: III. Recent developments (1989–1993). The Interna-tional Coalbed Methane Extraction Conference, London, UK.
King, G.R., Ertekin, T., Schwerer, F.C., 1986. Numerical simulation of the transientbehavior of coal-seam degasification wells. Society of Petroleum Engineers (SPE)Formation Evaluation, pp. 165–183. April.
Lunarzewski, W.L., 1998. Gas emission prediction and recovery in underground coalmines. International Journal of Coal Geology 35, 117–145.
Lyons, A., 1998. The central and northern Appalachian Bain — a frontier region forcoalbed methane development. International Journal of Coal Geology 38, 61–87.
Markowski, A., 1998. Coalbed methane resource potential and current prospect inPennsylvania. International Journal of Coal Geology 38, 137–159.
Milkereit, B., Ji, J., 2005. Extraction of Stoneley waves from full wave sonic data.Proceedings of EAGE 67th Conference and Exhibition, Madrid, Spain.
Noack, K., 1998. Control of gas emissions in underground coal mines. InternationalJournal of Coal Geology, 35, 57–82.
Norris, A., 1989. Stoneley-wave attenuation and dispersion in permeable formations.Geophysics 54, 330–341.
Palchik, V., 2003. Formation of fractured zones in overburden due to longwall mining.Environmental Geology 44, 28–38.
Palchik, V., 2005. Localization of mining-induced horizontal fractures along rock layerinterfaces in overburden: field measurements and prediction. EnvironmentalGeology 48, 68–80.
Penn State University Libraries, 2000. Description of the geology of Greene CountyPennsylvania. URL: http://www.libraries.psu.edu/emsl/guides/X/greene.htm.
Qobi, A., Kuijper, A., Ting, X.M., Strauss, J., 2001. Permeability determination fromStoneley waves in the Ara Group carbonates, Oman. GeoArabia 6, 649–666.
Remner, D.J., Ertekin, T., Sung, W., King, G.R., 1986. A parametric study of the effects ofcoal seam properties on gas drainage efficiency. SPE Reservoir Engineering633–645 November.
Ruppert, L.F., Tewalt, S.J., Bragg, L.J., Wallack, R.N., 1999. A digital resource model of theUpper Pennsylvanian Pittsburgh coal bed, Monongahela Group, northern Appa-lachian Basin coal region, USA. International Journal of Coal Geology 41, 3–24.
Schlumberger, 1991. Log Interpretation Principles/Applications. Schlumberger Wirelineand Testing, Sugarland, TX.
Silitonga, T.H., Siahaan, E.E., 2005. A Poisson's ratio distribution fromWadati diagram asindicator of fracturing of Lahendong geothermal field, North Sulawesi, Indonesia.Proceedings of World Geothermal Congress, Antalya, Turkey.
Takahashi, T., Takeuchi, T., Sassa, K., 2006. ISRM suggested methods for boreholegeophysics in rock engineering. International Journal of Rock Mechanics andMining Sciences 43, 337–368.
Timur, A., 1968. An investigation of permeability, porosity and residual water saturationrelationships for sandstone reservoirs. The Log Analyst 9, 30–48.
Vaziri, H.H., Wang, X., Palmer, I.D., Khodaverdian, M., McLennan, J., 1997. InternationalJournal of Rock Mechanics and Mining Sciences 34, 963–978.
Whittles, D.N., Lowndes, I.S., Kingman, S.W., Yates, C., Jobling, S., 2006. Influence ofgeotechnical factors on gas flow experienced in a UK longwall coal mine panel.International Journal of Rock Mechanics and Mining Sciences 43, 369–387.
Whittles, D.N., Lowndes, I.S., Kingman, S.W., Yates, C., Jobling, S., 2007. The stability ofmethane capture boreholes around a longwall coal panel. International Journal ofCoal Geology 71, 313–328.
Wyllie, M.R.J., Rose, W.D., 1950. Some theoretical considerations related to thequantitative evaluation of the physical characteristics of reservoir rock fromelectric log data. Trans AIME 189, 105.
Yan, J., 2002. Reservoir parameters estimation fromwell log and core data: a case studyfrom the North Sea. Petroleum Geoscience 8, 63–69.