Embed Size (px)
Citation preview

University of North DakotaUND Scholarly Commons
Undergraduate Theses and Senior Projects Theses, Dissertations, and Senior Projects
2007
Reservoir Characterization of the Broom CreekFormation For Carbon Dioxide SequestrationJustin J. Kringstad
Follow this and additional works at: https://commons.und.edu/senior-projects
This Senior Project is brought to you for free and open access by the Theses, Dissertations, and Senior Projects at UND Scholarly Commons. It hasbeen accepted for inclusion in Undergraduate Theses and Senior Projects by an authorized administrator of UND Scholarly Commons. For moreinformation, please contact [email protected].
Recommended CitationKringstad, Justin J., "Reservoir Characterization of the Broom Creek Formation For Carbon Dioxide Sequestration" (2007).Undergraduate Theses and Senior Projects. 92.https://commons.und.edu/senior-projects/92

RESERVOIR CHARACTERIZATION
OF THE BROOM CREEK
FORMATION FOR CARBON
DIOXIDE SEQUESTRATION
Prepared by:
Justin J. Kringstad
As a Geological Engineering Design Project
Geology & Geological Engineering Department University of North Dakota
May 2007

TABLE OF CONTENTS List of Figures iii List of Tables v Acknowledgments vi Executive Summary 1 Introduction and Objectives 1 Problem Definition 4 Preliminary Analysis 5 Design Constraints 11 Alternative Designs 12 Final Design Selection 13 Plans and Specifications 13 Budget 15 Schedule 16 Simulation Parameters 17 Injection Wells 19 Simulation Results 21 CO2 Plume Migration 25 Simulation Limitations 26 Conclusions 27 Appendix A 29 Appendix B 33 Appendix C 35
i

Appendix D 39 References 43
ii

LIST OF FIGURES Figure 1. Location of Williston Basin and major geologic structures 2 Figure 2. Location of Bowman County in southwest North Dakota 3 Figure 3. State of North Dakota proposed CO2 injection site 5 Figure 4. Broom Creek Sandstone 6 Figure 5. Three-dimensional image of the Broom Creek and surrounding
formations 7
Figure 6. Hydrostatic pressure of the Broom Creek 9 Figure 7. Broom Creek Formation temperature distribution 10 Figure 8. Vertical injection well connection 19 Figure 9. Horizontal injection well, 500 ft leg 20 Figure 10. Horizontal injection well, 5,280 ft leg 20 Figure 11. Vertical well simulation results 22 Figure 12. Horizontal well simulation results, 500 ft leg 23 Figure 13. Horizontal well simulation results, 5,280 ft leg 24 Figure 14. Overhead view of CO2 plume migration for the three injection scenarios
25
Figure A-1. CO2 PVT properties generated by Calsep’s PVTsim 30 Figure A-2. CO2 PVT properties generated by Calsep’s PVTsim 30 Figure C-1. Vertical injection well bottom hole pressure 36 Figure C-2. 500 ft horizontal injection well bottom hole pressure 37 Figure C-3. 5,280 ft horizontal injection well bottom hole pressure 38 Figure D-1. Vertical injection well field pressure results 40 Figure D-2. 500 ft horizontal injection well field pressure results 41
iii

Figure D-3. 5,280 ft horizontal injection well field pressure results 42
iv

LIST OF TABLES Table 1. Budget proposal for design completion 16 Table 2. Proposed schedule for task completion 16 Table 3. ECLIPSE simulation parameters 18 Table A-1. PVT properties for CO2 at reservoir conditions 31
v

ACKNOWLEDGMENTS
I would like to offer a most sincere thank you to the group of people who made
this senior design possible. First, to my design advisor, Dr. Zheng-Wen Zeng of the
Geology and Geological Engineering Department, University of North Dakota, for
getting me started in the department’s Petroleum Engineering Laboratory and pushing me
to a level of academic performance that would have otherwise been unknown.
Next, I would like to thank the Plains CO2 Reduction Partnership (PCOR) at the
Energy and Environmental Research Center (EERC). The PCOR team, in particular
Steven A. Smith, Dr. Anastasia A. Dobroskok, James A. Sorensen, and Wesley D. Peck,
played a vital role in providing me with data, reports, and feedback throughout all stages
of my senior design. The PCOR team is one of the world’s leading research groups
working on CO2 sequestration, and I am very proud to have had the opportunity to work
so closely with them.
vi

EXECUTIVE SUMMARY
This engineering design is aimed at providing a thorough investigation on the
potential of carbon dioxide (CO2) sequestration in the Williston Basin’s Broom Creek
Formation. The objective of the design is to characterize the Broom Creek’s reservoir
properties and provide detailed results of CO2 sequestration capacity, plume migration,
and safety level. The methodology used to obtain results is an incorporation of geology,
reservoir engineering, and injection operations. The reservoir simulation operations were
conducted using Schlumberger’s ECLIPSE (Schlumberger, 2006).
INTRODUCTION AND OBJECTIVES
Since the beginning of the industrial revolution, the concentration of CO2 in
Earth’s atmosphere has been continually rising. This rise in CO2 concentration can be
partly attributed to the combustion of fossil fuels for energy production. Scientists
strongly believe that concentrations of CO2 in the atmosphere are directly related to a
pattern of global warming (Bennaceur et al., 2004). However, the industrialized nations
of the world are dependent on fossil fuels to meet their energy and industrial needs
economically.
Due to their relative abundance and low cost, fossil fuels, such as coal, oil, and
natural gas, will continue to dominate the United States’ energy supply in the foreseeable
future. In order to limit the adverse effects on Earth’s climate, methods must be
implemented to eliminate most or all of the CO2 emissions associated with using fossil
fuels.
There exist two types of sequestration techniques: indirect and direct (EERC,
2006). Indirect sequestration involves capturing previously released CO2 from the
1
atmosphere by means of plants and soil (EERC, 2006). Direct sequestration involves the
capture and long-term storage of CO2 in a safe and secured location. Four main methods
of direct sequestration include deep ocean sequestration, geologic storage in oil and gas
reservoirs, sequestration in uneconomic coal seams, and hydrodynamic trapping in deep
saline aquifers (DOE, 1999).
The state of North Dakota, located in north central United States, contains a great
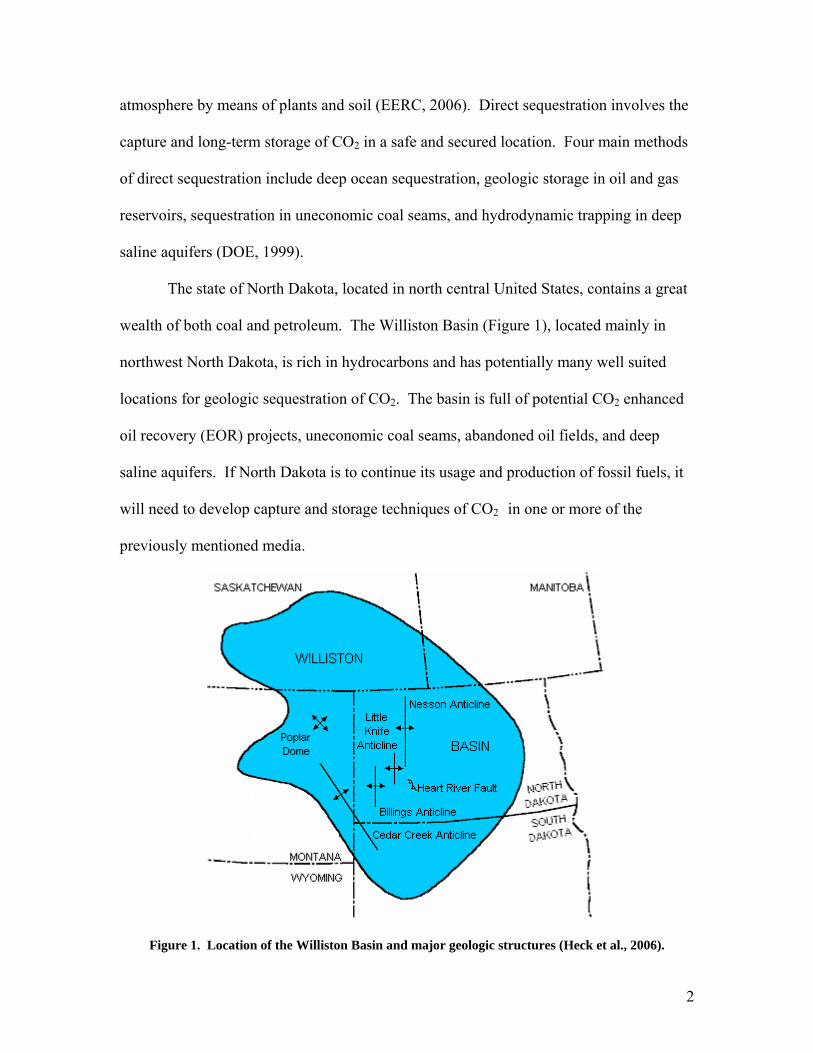
wealth of both coal and petroleum. The Williston Basin (Figure 1), located mainly in
northwest North Dakota, is rich in hydrocarbons and has potentially many well suited
locations for geologic sequestration of CO2. The basin is full of potential CO2 enhanced
oil recovery (EOR) projects, uneconomic coal seams, abandoned oil fields, and deep
saline aquifers. If North Dakota is to continue its usage and production of fossil fuels, it
will need to develop capture and storage techniques of CO2 in one or more of the
previously mentioned media.
Figure 1. Location of the Williston Basin and major geologic structures (Heck et al., 2006).
2

One emerging technology could drastically change the way North Dakota and the
United States produce and consume energy. The technology is known as “Clean Coal” or
“Zero Emissions Coal.” The United States Department of Energy (DOE) has started a
zero emissions coal project called FutureGen. FutureGen utilizes coal gasification for
electricity and hydrogen production, while capturing and sequestering the waste CO2 in a
safe geologic location (DOE, 2006).
The objective of this engineering design is to evaluate the Broom Creek
Formation (Permian) for its effectiveness as a long-term storage location for CO2
sequestration. The location of the study will take place in Bowman County, North
Dakota (Figure 2). The design utilizes state-of-the-art reservoir simulation models to
determine CO2 storage capacities, reservoir characteristics, and safe rates of CO2
injection.
Figure 2. Location of Bowman County in southwest North Dakota (www.epodunk.com).
3

PROBLEM DEFINITION
The CO2 emissions from United States power plants are largely unregulated.
Scientists, environmentalists, and politicians alike would like to formulate a safe and
secure system of eliminating the waste CO2. DOE has a $1 billion dollar FutureGen
project started, aiming at creating the world’s first CO2 emission free fossil fuel power
plant. In 2006, The Plains CO2 Reduction (PCOR) Partnership, a program at the Energy
and Environmental Research Center (EERC) of the University of North Dakota in Grand
Forks, proposed a location for the construction of a FutureGen site in Bowman County,
North Dakota (State of ND, 2006). During the final stages of site selection, DOE decided
not to chose the Bowman County site for its prototype power plant.
Despite DOE’s final location decision, it is necessary for North Dakota’s energy
producers to establish possible locations for future CO2 sequestration of power plant
emissions. The site in Bowman County, proposed by PCOR’s Team North Dakota, can
be seen in Figure 3 (State of ND, 2006). The CO2 sequestration, as proposed by the
PCOR team, would take place in the saline aquifer found in the Broom Creek Formation
(Permian).
4

Figure 3. State of North Dakota proposed CO2 injection site (Google Earth image).
PRELIMINARY ANALYSIS
The Broom Creek Formation exists as the upper unit of the Minnelusa Group and
extends throughout much of southwest North Dakota (Rygh, 1990). The Broom Creek
(Figure 4), is composed of reddish-brown to pink quartzarenite, with some thin beds of
dolostone (Rygh, 1990). Unconformably overlying the Broom Creek is the Opeche
Formation (Permian). The Opeche Formation consists of thick shale beds, averaging 113
feet in the design region, extending throughout much of southwest North Dakota and the
Williston Basin (State of ND, 2006). The saline aquifer targeted for the CO2
sequestration is confined by the overlying Opeche and the underlying Amsden and Tyler
Formations (Rygh, 1990). The Broom Creek aquifer makes an excellent candidate for
CO2 injection due to its high porosity and permeability, wide lateral extent, good seals on
top and bottom, and its distance from any significant faults (State of ND, 2006). Rygh
(1990) gave further testimony to the formation’s sealing competency by describing the
large nitrogen accumulations found throughout the Broom Creek Formation.
5

Figure 4. Broom Creek Sandstone (www.dmr.nd.gov/oilgas/feeservice/getscoutticket.asp)
In the proposed injection region, the depth to the top of the Broom Creek
Formation ranges from 5,600 to 6,600 feet (State of ND, 2006). The average thickness of
the Broom Creek in the study region is 150 feet. Figure 4 is a three dimensional image
created in ECLIPSE’s GridSim application. Figure 4 is a thirteen mile wide by eight mile
6

long block surrounding the proposed injection site. The Opeche Formation is the top
layer, the Broom Creek Formation is the middle layer, and the Amsden Formation is the
lower layer. The view is from the southwest direction with the depths indicated by the
colors shown on the key. The three surrounding wells were used to construct the
geological model. As shown by elevation in Figure 5, the Broom Creek Formation dips
slightly to the northwest at an angle of approximately 0.35 degrees (State of ND, 2006).
Figure 5. Three-dimensional image of the Broom Creek and surrounding formations.
Rygh (1990) determined the Broom Creek Formation is characterized by three
primary lithofacies. The lithofacies are as follows: 1) nearshore marine sandstone
lithofacies, 2) marine carbonate lithofacies, and 3) eolian sandstone lithofacies. It will be
determined through the current design which region of the Broom Creek will be used for
7

injection, since each of the Broom Creek’s lithofacies will have a different affect on the
CO2 plume after injection.
Relatively little research has been conducted on the Broom Creek Formation in
the proposed injection region. Basic reservoir characteristics, such as porosity and
permeability, have been estimated by the PCOR research team from surrounding well
wireline logs and a Broom Creek saltwater injection well. The effective porosity of the
Broom Creek is estimated to be 14% (State of ND, 2006). Initial laboratory analysis
found an average permeability value 350 millidarcy (mD) for the Broom Creek
sandstone. Further lab analysis of three Broom Creek core samples will reveal the
accuracy of these initial results, and should provide a much better understanding of the
formation properties. It should be mentioned that the Broom Creek is not a homogeneous
formation. Each of the three Broom Creek lithofacies, nearshore marine sandstone,
marine carbonate, and eolian sandstone, will have its own reservoir properties.
The in situ hydrostatic pressure of the Broom Creek Formation is between 2,600
psi and 2,800 psi in the proposed injection study area (State of ND, 2006). Figure 6
shows the Broom Creek hydrostatic pressure distribution throughout much of the
Williston Basin. The proposed injection region is indicated by the red dot. The
temperature of the Broom Creek Formation in the study area ranges from 162°F to 174°F
(State of ND, 2006). A map showing the Broom Creek temperature distribution can be
seen in Figure 7, with the proposed injection site indicated by the red dot.
8

Figure 6. Hydrostatic pressure of the Broom Creek (Modified from State of ND, 2006).
9
Miles ------0 25 50

Figure 7. Broom Creek Formation temperature (°F) distribution (Modified from State of ND, 2006).
Groundwater flow and chemistry are two very important considerations before
beginning any injection project. The horizontal flow of groundwater in the Minnelusa
Group occurs in the northeast direction (Hoda, 1977). The total dissolved solids (TDS)
values of the Broom Creek Formation range from 10,000 to 15,000 ppm in the area of
proposed injection (Rygh, 1990). The TDS values continue to increase towards the
center of the Williston Basin, where values approach 300,000 ppm (Rygh, 1990).
10
0 25

DESIGN CONSTRAINTS
Legal
The North Dakota Department of Mineral Resources Oil & Gas Division has set
an injection fracture gradient of 0.7 psi/ft. At an injection depth of 6,500 ft, the
maximum allowed bottom hole injection pressure is 4,550 psi (Sorensen et al., 2006).
Geology
Due to the lack of hydrocarbons, relatively few studies have been conducted on
the Broom Creek Formation in southwest North Dakota. In fact, only three core samples
exist at the North Dakota Geological Survey Core Library, none of which are less than 45
miles from the proposed injection site. Some simple formation properties are available,
such as formation tops, thicknesses, and TDS of the formation water. The remaining
reservoir characteristics, including porosity of each section of the Broom Creek, the
strength of the formation, and the vertical and horizontal permeability, will need to be
interpreted from wireline logs and lab tests of the three core samples from wells scattered
across western North Dakota.
Social/Political
While most members of society and government agree on incorporating measures
to limit CO2 emissions into the atmosphere, many may not want a pilot program
disposing high amounts CO2 around their homes and businesses. This attitude may be
alleviated by educating the people in the surrounding communities and by ensuring all
aspects of the disposal have been deemed completely safe.
Economic
The added costs associated with carbon sequestration may cause business and
political leaders to avoid using this technique. The added cost has been estimated by
11

David and Herzog (2000) to be an additional 1.5-2 cents/kWh of electricity. David and
Herzog (2000) later predicted that within the next decade, the cost could be lowered to 1
cent/kWh. However, if electric customers were originally charged 6 cents/kWh and the
rate went up to 7.5 cents/kWh, this would represent a 25% increase in their electric bill.
One way to minimize the customer’s initial cost would be through proper legislation and
tax incentives for the new CO2 free electricity.
Safety
Safety is the main concern for everyone involved with the CO2 sequestration
project. One industry safety concern is for the drill operators when they reach the Broom
Creek Formation. The Broom Creek Formation is notorious for blowouts in the Williston
Basin, due to the high pressure nitrogen gases trapped in the formation; however there is
no indication of nitrogen accumulation in the design area. Proper mud weight and
drilling procedures should greatly reduce the risk of a blowout. The largest safety factor
facing this project is the CO2 plume generated by the injection. Every possible angle for
CO2 escape must be considered, and if there is any doubt about the security of the plume
gases, the proper corrections must take place or a new design must be implemented.
ALTERNATIVE DESIGNS
One alternative to sequestering the CO2 in deep saline aquifers is transporting the
CO2 by pipeline to the nearby Cedar Creek and Nesson anticlines for enhanced oil
recovery utilization. Through CO2 enhanced oil recovery techniques, the Williston Basin
could contain an additional 277 million barrels of possibly recoverable oil (Nelms and
Burke, 2004). Another method involves piping the CO2 to areas of uneconomic coal
seams for sequestration. The estimated storage capacity in North Dakota’s uneconomic
12

lignite coal is 598.7 million short tons (Nelson et al., 2005). The technique of
sequestration in coal seams also offers the possibility of producing natural gas, which
may otherwise be uneconomical to produce (Nelson et al., 2005). Finally, one other
technique would be to create a national network of pipes to allow for deep ocean
sequestration along the coasts of the United States.
FINAL DESIGN SELECTION
Deep saline aquifer sequestration in Bowman County was chosen as the final
design due to its large storage capacity and the ideal reservoir characteristics of the
Broom Creek Formation. The final design utilizes a reservoir simulation model from
Schlumberger’s ECLIPSE and three separate injection plans. The reservoir simulation
model for studying the CO2 movement in the aquifer is constructed using the ECLIPSE
black-oil reservoir simulator. In order to use the black-oil simulator, a two-phase
simulation was utilized. Water exists in the liquid phase and the CO2 exists in the gas
phase. The data used to create the geologic model is a combination of core, wireline log,
and laboratory data.
PLANS AND SPECIFICATIONS
The following is a basic overview of the tasks required to build and run the
reservoir simulation model (Modified from Zeng(2006)).
(1) Data collection and analysis
a. Geologic data
b. Well log data (permeability, porosity, depths, thickness)
c. Laboratory permeability test data
13

d. Reservoir fluid data (PVT, fluid properties)
e. Reservoir rock properties (relative permeability, capillary pressure,
compressibility)
(2) Geologic model development
a. Structural model
b. Geometry of formations
(3) Reservoir model establishment
a. Initial reservoir pressure distribution
b. Initial reservoir temperature distribution
c. Reservoir porosity distribution
d. Reservoir permeability distribution
e. Fluid saturation distribution
f. Relative permeability
g. Capillary pressure
h. PVT tables and data for water and CO2
i. Injection well design
j. Operational conditions
(4) Forecasting Simulation
a. Planning three different injection cases
b. Preparing input data for each case
c. Review and analysis of predicted performance
These tasks were completed using a variety of approaches. The following is a
summary of the approaches (Modified from Zeng (2006)).
14

(1) Collection of data from:
a. Existing public and private records
b. Analog data from similar design projects
c. New data from laboratory testing
(2) Models was constructed based upon generally accepted techniques:
a. Geologic model includes geologic data and well log data
b. Reservoir model was generated using drilling, well log, and laboratory
results
(3) Reservoir simulation was conducted using the leading edge industrial
software: Schlumberger’s ECLIPSE
BUDGET
The following budget is designed to provide a rough estimate of costs that may be
incurred while the proposed sequestration operation is being designed and researched.
Labor costs are based on the average entry level wages for a petroleum engineer (U.S.
Department of Labor, 2006). The labor hours allotted for the design are assumed to be
adequate to finish the required tasks. No costs are represented for the actual well drilling
or injection of CO2.
15

Table 1. Budget proposal for design completion
Broom Creek Reservoir Characterization Budget
Category Estimated Quantity
Estimated Cost per Unit
Estimated Subtotal
Research
Initial Subject Research (80 hrs @ $25/hr) 80 $25.00 $2,000.00 Lab Analysis Work (120 hrs @ $25/hr) 120 $25.00 $3,000.00 Geologic Model Creation (80 hrs @ $25/hr) 80 $25.00 $2,000.00 Reservoir Simulation Exercises (80 hrs @ $25/hr) 80 $25.00 $2,000.00 Presentation and Analysis of Results (40 hrs @ $25/hr) 40 $25.00 $1,000.00 Research Costs Total $10,000.00
Software ECLIPSE Lease ($4,000/Month) 2 $4,000.00 $8,000.00 Software Costs Total $8,000.00
Hardware Computer 1 $1,500.00 $1,500.00 Printer 1 $100.00 $100.00 Core Flooding System Maintenance 1 $1,000.00 $1,000.00 Lab Supplies 1 $1,000.00 $1,000.00 Misc. Supplies and Publications 1 $200.00 $200.00 Hardware Costs Total $3,800.00
ESTIMATED CHARACTERIZATION GRAND TOTAL $21,800.00
SCHEDULE
The proposed time schedule assumes one qualified petroleum engineer is
performing the required tasks and is working on the design for forty hours per week.
Table 2. Proposed schedule for task completion Time (Week, since the start of design) 1 2 3 4 5 6 7 8 9 10 Initial data collection and analysis ------------ Lab analysis -------------------- Geologic model creation ------------- Reservoir model creation ------------- Reservoir simulation exercises -------------- Presentation and analysis of results ------
16

Simulation Parameters
The Broom Creek CO2 injection simulation was performed using Schlumberger’s
ECLIPSE software. Several initial assumptions needed to be made in order to conduct
the simulation exercises. First, the simulation assumes a homogeneous and isotropic
reservoir. Next, it is assumed that CO2 does not go into solution with the formation water
and exists only in the gas phase. The simulation also assumes that the overlying Opeche
Fm. has zero vertical permeability and rock strength characteristics adequate for CO2
injection. Also, due to poor well control in the injection region, a constant thickness and
dip is used to build the geologic model. Table 1 describes the initial simulation
parameters used to characterize the Broom Creek Fm. APPENDIX A provides the CO2
PVT properties imported to ECLIPSE for simulation calculations. APPENDIX B
provides formulas and calculations for: Residual Gas Saturation (Sgr), Irreducible Water
Saturation (Swir), and Critical Water Saturation (Scr).
17

Table 3. ECLIPSE simulation parameters INPUT VALUES FOR BROOM CREEK SIMULATION
Simulation Run Time, years 1,000 Simulation Time Step, days 1,500 Model Length, ft 100,000 Model Width, ft 100,000 Model Thickness, ft 150 Depth at top of fm. at injection well, ft 6,500 Formation Temperature, °F 169 Initial Formation Pressure, psi at 6,500ft 2,814 Formation Dip, degree 0.35 Aquifer Salinity, ppm 10,000 Formation Horizontal Permeability, md 350 Formation Vertical Permeability, md 350 Formation Porosity, φ 0.14 Residual Gas Saturation, Sgr 0.41 Irreducible Water Saturation, Swir 0.056 Critical Water Saturation, Scr 0.295 Grid 34x39x9 Injection Rate, Mscf/day 78,500 Injection Period, years 30
The proposed FutureGen power plant would need to sequester at least one million
metric tons of CO2 per year, for at least 30 years (State of ND, 2006). The simulations
performed in this design inject 78,500 Mscf of CO2 per day for 30 years, totaling
approximately 50 million metric tons of CO2 over 30 years. The value of 50 million
metric tons exceeds the FuturGen requirements and should be considered adequate at
proving the Bowman County region as a possible sequestration target.
The simulation exercises start with ten years of no injection actions. Starting at
year ten CO2 injections begin at 78,500 Mscf/day and continues for 30 years. Following
the 30 years of injection, the wells are shut-in and injection stops. The simulations are
allowed to run for a total of 1,000 years, during which the injected CO2 is allowed to
migrate and become trapped in the pore space of the Broom Creek Fm.
18

Injection Wells
Three different injection well cases were modeled to observe the effect on CO2
plume shape and migration. The first injection case uses a vertical injection well, Figure
8, which is perforated in the bottom 75 feet of the Broom Creek Fm. The second case,
Figure 9, is a short, 500 foot, horizontal well, fifteen feet off the bottom of the formation
and running perpendicular to the dip direction. The third case, Figure 10, is similar to the
second, but the horizontal segment extends for 5,280 feet.
Figure 8. Vertical injection well connection (vertical exaggeration added for detail).
19

Figure 9. Horizontal injection well, 500 ft leg (vertical exaggeration added for detail).
Figure 10. Horizontal injection well, 5,280 ft leg (vertical exaggeration added for detail).
20
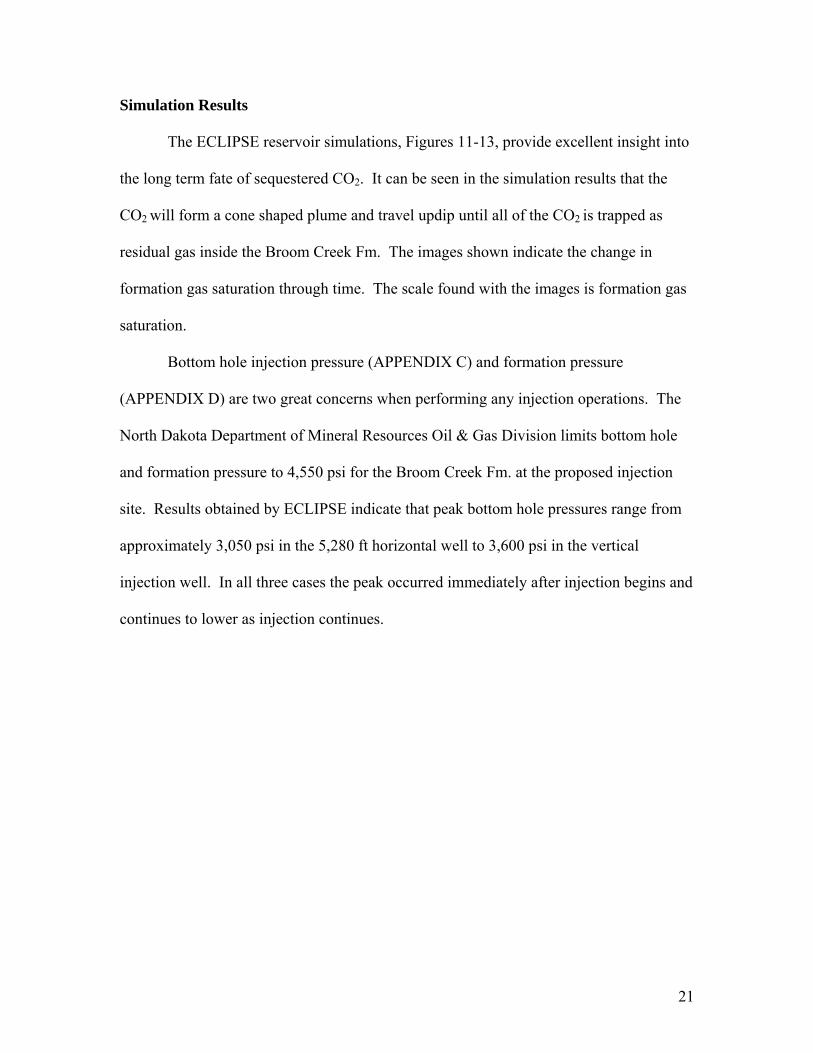
Simulation Results
The ECLIPSE reservoir simulations, Figures 11-13, provide excellent insight into
the long term fate of sequestered CO2. It can be seen in the simulation results that the
CO2 will form a cone shaped plume and travel updip until all of the CO2 is trapped as
residual gas inside the Broom Creek Fm. The images shown indicate the change in
formation gas saturation through time. The scale found with the images is formation gas
saturation.
Bottom hole injection pressure (APPENDIX C) and formation pressure
(APPENDIX D) are two great concerns when performing any injection operations. The
North Dakota Department of Mineral Resources Oil & Gas Division limits bottom hole
and formation pressure to 4,550 psi for the Broom Creek Fm. at the proposed injection
site. Results obtained by ECLIPSE indicate that peak bottom hole pressures range from
approximately 3,050 psi in the 5,280 ft horizontal well to 3,600 psi in the vertical
injection well. In all three cases the peak occurred immediately after injection begins and
continues to lower as injection continues.
21

0.279
0.139
0.558
0.419
0.698
0.000
Figure 11. Vertical well simulation results (vertical exaggeration added for detail).
22

0.419
0.279
0.139
0.558
0.698
0.000
Figure 12. Horizontal well simulation results, 500 ft leg (vertical exaggeration added for detail).
23

0.139
0.279
0.419
0.558
0.698
0.000
Figure 13. Horizontal well simulation results, 5,280 ft leg (vertical exaggeration added for detail).
24

CO2 Plume Migration
Due to the density difference between the Broom Creek Fm. water and the
injected CO2, the CO2 migrates upward and collects under the Opeche shale. This
collection of CO2 begins lateral updip travel while continuing to be subjected to buoyancy
forces. Lateral plume migrations experienced in during the reservoir simulations ranged
from 10.6-12.1 miles updip from the injection well.
The results obtained from the reservoir simulation, Figure 14, show that CO2
plume shape and migration differ greatly from the original FutureGen calculations
proposed by Sorensen et al., 2006. Original FutureGen calculations assumed a
cylindrical plume with no horizontal migration. Simulations results show a very distinct
cone shaped plume and significant updip travel of the CO2 plume. This updip plume
migration only becomes a concern when the plume travels into regions with an
inadequate cap rock or improperly cemented wells.
25

Vertical Well
12.1 Miles
500 ft Horizontal Well
10.6 Miles
5,280 ft Horizontal Well
10.6 Miles
Figure 14. Overhead view of CO2 plume migration for the three injection scenarios.
26

SIMULATION LIMITATIONS
The reservoir simulations presented in this design project are limited by several
factors. The first thing to consider is that reservoir simulation exercises are only as good
as the data provided and the engineering operating the system. In the simulation
presented in this design, the data was very limited and many large assumptions needed to
be made in order to execute the simulation. Another limitation to the simulation was the
inability to model CO2 entering into solution with the aquifer. If CO2 solution was
modeled, it can be assumed that the CO2 plume size would be reduced and the safety
level increased. Finally, the ECLIPSE program used for the simulation was unable to
model any chemical reaction between the CO2 and reservoir rock.
CONCLUSION
Geologic sequestration in saline aquifers has been suggested to be a suitable
technique for the permanent storage of large volumes of CO2 collected from industrial
sources. The Williston Basin’s Broom Creek Formation appears to have adequate
reservoir properties to characterize it as a safe and secure storage location for many years
of CO2 injection operations. Through the proposed reservoir characterization and
simulation, it shall be determined how the CO2 plume will migrate and interact with the
Broom Creek and surrounding formations. These simulation exercises are designed to
help engineers and scientists design future CO2 injection programs in the Williston Basin
and around the world.
Plume shape and migration distances can be altered slightly depending upon the
style of injection well. It was shown through the simulation exercises that a horizontal
well in the Broom Creek Fm. would produce shorter CO2 plume migration. However, the
27

added costs of drilling horizontal injections wells may be too high to justify their usage in
CO2 sequestration.
Future work on the Broom Creek Fm. should include simulations exercises
utilizing CO2 dissolution, mineral trapping, and pore trapping. Also, as more structural
data is collected on the Broom Creek Fm., more detailed geologic models can be built
and will provide researchers with an even more accurate portrayal of the injected CO2’s
fate. Finally, this engineering design was aimed only at the reservoir engineering portion
of CO2 sequestration, and many drilling and injection engineering issues would need to
be solved before any proposed operations could take place.
28

APPENDIX A
CO2 PVT Properties generated by Calsep’s PVTsim (Calsep, 2005) for simulation
29

PVTsim CO2 FVF and Visc at 169o F
0
50
100
150
200
0 1000 2000 3000 4000 5000 6000 7000Pressure (psia)
FVF
(RB
/Msc
f)
0
0.01
0.02
0.03
0.04
0.05
0.06
0.07
0.08
0.09
0.1
Visc
(cP)
FVF (RB/Mscf)Visc (cP)
Figure A-1. CO2 PVT properties generated by Calsep’s PVTsim.
PVTsim CO2 Z-factor & Visc. at 169o F
0
0.2
0.4
0.6
0.8
1
1.2
0 1000 2000 3000 4000 5000 6000 7000Pressure (psia)
Z-Fa
ctor
0
0.01
0.02
0.03
0.04
0.05
0.06
0.07
0.08
0.09
0.1
Visc
(cP)
Z-FactorVisc (cP)
Figure A-2. CO2 PVT properties generated by Calsep’s PVTsim.
30

Table A-1. PVT properties for CO2 at reservoir conditions CO2 properties at 169 °F from PVTsim
Pressure psia
Visc cP
Z factor
BBg (RB/scf)
BBg (RB/Mscf)
14.7 0.0178 0.997 0.21475922 214.7592197 157.26 0.0181 0.9674 0.019478782 19.47878237 299.81 0.0184 0.9371 0.009897234 9.897233518 442.37 0.0188 0.9061 0.006485814 6.485813513 584.93 0.0192 0.8744 0.004733477 4.733476732 727.49 0.0197 0.8419 0.003664439 3.664438821 870.04 0.0203 0.8087 0.002943217 2.943216552 1012.6 0.021 0.7748 0.002422845 2.422845287 1155.16 0.0219 0.7403 0.002029269 2.029268907 1297.71 0.0229 0.7056 0.00172169 1.721689832 1440.27 0.0243 0.6712 0.001475645 1.475645463 1582.83 0.0262 0.638 0.001276322 1.276322424 1725.39 0.0289 0.6074 0.001114709 1.114708993 1867.94 0.0326 0.5809 0.000984719 0.984719296 2010.5 0.0369 0.5599 0.000881821 0.881820892 2153.06 0.0414 0.5449 0.000801373 0.801372932 2295.61 0.0455 0.5356 0.000738782 0.738782253 2438.17 0.0492 0.5309 0.000689482 0.689481687 2580.73 0.0524 0.53 0.00065029 0.650290326 2723.29 0.0553 0.5319 0.000618458 0.618457831 2865.84 0.0579 0.5359 0.000592115 0.592114656 3008.4 0.0603 0.5416 0.000570055 0.570055407 3150.96 0.0625 0.5485 0.000551198 0.55119813 3293.51 0.0645 0.5563 0.00053484 0.53484023 3436.07 0.0665 0.5648 0.000520483 0.520483156 3578.63 0.0683 0.5739 0.000507801 0.507800846 3721.19 0.07 0.5835 0.000496516 0.496515727 3863.74 0.0717 0.5935 0.000486392 0.486392448 4006.3 0.0733 0.6037 0.000477146 0.477146456 4148.86 0.0748 0.6142 0.000468765 0.468764836 4291.41 0.0763 0.6248 0.000461015 0.461014946 4433.97 0.0777 0.6356 0.000453905 0.453905173 4576.53 0.0791 0.6466 0.000447377 0.447376719 4719.09 0.0804 0.6576 0.000441243 0.441242705 4861.64 0.0817 0.6688 0.0004356 0.435599589 5004.2 0.083 0.68 0.000430277 0.430277115 5146.76 0.0842 0.6912 0.000425249 0.425249495 5289.31 0.0854 0.7025 0.000420554 0.420553548 5431.87 0.0866 0.7138 0.000416103 0.416103309 5574.43 0.0878 0.7252 0.000411937 0.411937494 5716.99 0.0889 0.7366 0.000407979 0.407979438 5859.54 0.09 0.7479 0.000404161 0.404160628 6002.1 0.0911 0.7593 0.000400575 0.4005753 6144.66 0.0922 0.7707 0.000397156 0.397156336 6287.21 0.0932 0.7821 0.000393893 0.393893046
31

6429.77 0.0943 0.7936 0.000390823 0.390823091 6572.33 0.0953 0.805 0.000387838 0.387838138 6714.89 0.0963 0.8164 0.00038498 0.384979928 6857.44 0.0973 0.8277 0.000382195 0.38219494
7000 0.0983 0.8391 0.000379568 0.379568073
Calculations for formation volume factor (Bg), as found in Towler (2002)
⎟⎟⎠
⎞⎜⎜⎝
⎛=⎟⎟
⎠
⎞⎜⎜⎝
⎛pTz
scfRBBg
*00503676.0 (A1)
( ) 67.459+°= FRT (A2)
Sample calculation at 14.7 psia
scfRB
scfRBBg 21476.0
7.14)67.459169(*997.000503676.0 =⎟⎠⎞
⎜⎝⎛ +
=⎟⎟⎠
⎞⎜⎜⎝
⎛
⎟⎟⎠
⎞⎜⎜⎝
⎛=⎟⎟
⎠
⎞⎜⎜⎝
⎛MscfRBB
scfRBB gg 000,1*
MscfRB
scfRB 76.214000,1*21476.0 =
32

APPENDIX B
Broom Creek reservoir calculations
33

Residual gas saturation (Sgr), as found in Holtz (2002)
5473.09696.0 +−= φMAX
grS (B1)
14.0=φ
%414116.05473.0)14.0(*9696.0 ≈=+−=MAXgrS
Irreducible water saturation (Swir), as found in Holtz (2002)
559.1)log(159.5
−
⎟⎟⎠
⎞⎜⎜⎝
⎛=
φkSwir (B2)
mDk 35014.0
==φ
%6.5056.014.0
)350log(159.5559.1
==⎟⎠⎞
⎜⎝⎛=
−
wirS
Critical water saturation (Swc), as found in Byrnes (2005)
)log(*053.16.0 kSwc += (B3)
mDk 350=
%5.292948.0)350log(*053.16.0 ==+=wcS
34

APPENDIX C
Simulation bottomhole pressure results
35

Figure C-1. Vertical injection well bottom hole pressure.
36
Well INJ1 Bottom Hole Pressure
--INJECTION BOTIOM HOLE PRESSURE vs. TIME
4000 - T T T
- + + + + - + + + - +
- + + ,. + - + ,.
- + + + + - - +
- r-= - - -I
3000 - - I -
- + +
- -- + +
- -- + +
< 2000
I in
l l I a.
1' -=> ~ " ci:
- + +
" - -- ,. + 0 I
E -
T r I $ 0 1000
I 00
- + + + + - + + + +
_,_ + + + - ,.
- -- + + + + - + + + +
- . ,. ~ - . ,.
0 I I I I I I I I I I I I I I I I I I I I
0 200 400 600 800 1000
TIME YEARS

Figure C-2. 500 ft horizontal injection well bottomhole pressure.
37
-- INJECTION BOTIOM HOLE PRESSURE vs. TIME
4000 - r r r r r--
- I- .. + .. t--
- I- .. .. .. t--
- .. .. .. .. t--
-
}-= + .. + .. t--
3000 -
- .. +
- .. - I- +
- I- +
2000 I
l l l 3 -(/) Q_
- I-
' ;;; a: - I-I co -cs
I 1000
I - ~
- .. .. .. .. ~
- .. .. .. .. ~
- ~ L ~ L
0 I I I I I I I I I I I I I I I I I I I I I I
Q 200 4QQ 6DO 800 100 0
TIME YEARS

Figure C-3. 5,280 ft horizontal injection well bottomhole pressure.
38
Well INJ1 Bottom Hole Pressure
--INJECTION BOTIOM HOLE PRESSURE vs. TIME
4000 - T T T
- + + + + - + + + - +
- + + ,. + - + ,.
- + + + + - - +
- - -
3000 -s I I
-
- + +
- -- + +
- -- + +
< 2000
I in
l l I a.
1' -=> ~ " ci:
- + +
" - -- ,. + 0 I
E -
T r I $ 0 1000
I 00
- + + + + - + + + +
_,_ + + + - ,.
- -- + + + + - + + + +
- . ,. ~ - . ,.
0 I I I I I I I I I I I I I I I I I I I I
0 200 400 600 800 1000
TIME YEARS

APPENDIX D
Broom Creek simulation field pressure results
39

Figure D-1. Vertical injection well field pressure results.
40
--FIELD PRESSURE vs. TIME
3100 - r r r
- + + + + - + + + - +
- + + ,. + - + ,.
- + + + + - - +
- - -I
3000 - - I -
- + +
- I\ ,.
- - +
I 2900
l l I - -
<l'. if) - + + + + - - + a.
(t - ,. + - + ,. + - ,. a.
o-±:E .....
- -
1 - r I
2800 -I
- + + + + - + + + +
- + ,. + - ,.
- + + + + - + + + +
- + . ,. + - . ,.
2700 I I I I I I I I I I I I I I I I I I I I I
0 200 400 600 600 1000
TIME YEARS

Figure D-2. 500 ft horizontal injection well field pressure results.
41
--FIELD PRESSURE vs. TIME
3100 - r r r r r--
- I- ,. + ,. t--
- I- ,. ,. ,. t--
- ,. ,. ,. ,. t--
- + + + + + t--
3000 -
- + +
- +
- +
- +
2900 I
l l l - f--
< (;; 0..
- I- + I-
er - + ,. f--0.. ~ ,_
- r - ,. f--
e- T --2800
l l l l l l l I - ~
- ,. ,. ,. ,. ~
- .. ,. ,. .. ~
- L L L L L
2700 I I I I I I I I I I I I I I I I I I I I I I I
Q 200 4QQ 6DO 8 00 1000
TIME YEARS

Figure D-3. 5,280 ft horizontal injection well field pressure results.
42
--FIELD PRESSURE vs. TIME
3100 - r r r
- + + + + - + + + - +
- + + ,. + - + ,.
- + + + + - - +
- - -I
3000 - - I -
- + +
- I\ ,.
- - +
I 2900
l l I - -
<l'. if) - + + + + - - + a.
(t - ,. + - + ,. + - ,. a. .....
I - r ----t n T - r- I T 2800 -
I - + + + + - + + + +
- + ,. + - ,.
- + + + + - + + + +
- + . ,. + - . ,.
2700 I I I I I I I I I I I I I I I I I I I I I
0 200 400 600 600 1000
TIME YEARS

REFERENCES
Bachu, S. and J.J. Adams. 2003. Sequestration of CO2 in Geologic Media in Response to Climate Change: Capacity of Deep Saline Aquifers to Sequester CO2 in Solution. Energy Conversion and Management. Vol. 44: 3151-75.
Bennaceur, K., N. Gupta, M Monea, T.S. Ramalrishman, T. Randen, S. Sakurai, and S.
Whittaker. 2004. CO2 Capture and Storage-A Solution Within. Oilfield Review. Vol. 16, No. 3: 44-61.
Byrnes, A.P. 2005. Issues With Gas And Water Relative Permeability In Low-
Permeability Sandstones. Kansas Geological Survey. Calsep. 2005. Methodology Documentation of PVTsim15. Copenhagen, Denmark. David, J. and H.J.Herzog. 2000. The Cost of Carbon Capture. Proceedings of the Fifth
International Conference on Greenhouse Gas Control Technologies: Cairns, Australia, August 13 - 16. 985-990.
DOE. 1999. Carbon Sequestration Research and Development. Office of Science and
Office of Fossil Energy, US Department of Energy. DOE. Fossil Energy. July 2006. http://www.fossil.energy.gov/programs/
powersystems/futuregen/. EERC. The Plains CO2 Reduction Partnership. July 2006. http://www.undeerc.org/
pcor/sequestration.asp. Hassanzadeh, H. 2006. Mathematical Modeling of Convective Mixing in Porous Media
for Geologic CO2 Storage. Doctoral Thesis. University of Calgary, Calgary, Alberta.
Heck, T.J., R. D. LeFever, D.W. Fischer, and J. LeFever. Overview of the Petroleum
Geology of the North Dakota Williston Basin. July 2006. http://www.state.nd.us/ndgs/resources/ wbpetroleum_h.htm.
Hoda, B. 1977. Feasibility of Subsurface Waste Disposal in the Newcastle Formation,
Lower Dakota Group (Cret.) and Minnelusa Formation (Penn.), Western North Dakota. Master’s Thesis. Wayne State University, Detroit, Michigan.
Holtz, M.H., 2002: “Residual Gas Saturation to Aquifer Influx: A Calculation Method for
3-D Computer Reservoir Model Construction,” paper SPE 75502, SPE Gas Technology Symposium, Calgary, Alberta, Canada, April 30–May 2.
Mo, S. and Akervoll I., 2005: “Modeling Long-Term CO2 Storage in Aquifer with a
Black-Oil Reservoir Simulator,” paper SPE 93951, SPE/EPA/DOE Exploration and Production Environmental Conference, Galveston, Texas, USA, March 7-9.
43

Nelms, R.L. and R.B. Burke. 2004. Evaluation of Oil Reservoir Characteristics to Access
North Dakota Carbon Dioxide Miscible Flooding Potential. 12th Williston Basin Horizontal Well and Petroleum Conference.
Nelson, C.R., E.N. Steadman, and J.A. Harju. 2005. Geologic CO2 Sequestration
Potential of the Lignite Coal in the U.S. Portion of the Williston Basin. The Plains CO2 Reduction Partnership, EERC, UND.
Rygh, M.E. 1990. The Broom Creek Formation (Permian), in Southwestern North
Dakota: Depositional Environments and Nitrogen Occurrence. Master’s Thesis. University of North Dakota, Grand Forks, North Dakota.
Schlumberger. 2006. Simulation Software Manuals. Schlumberger. Sugar Land, Texas. Sorensen, J.A., S.A. Smith, A.A. Dobroskok, M.L. Belobraydic, W.D. Peck, J.J.
Kringstad, and Z. Zeng. 2006. Carbon Dioxide Storage Potential of the Broom Creek Formation in North Dakota: A Case Study in Site Characterization for Large Scale Sequestration. The Plains CO2 Reduction Partnership, EERC, UND.
State of ND. 2006. Proposal to FutureGen Industrial Alliance Inc. Towler, B.F. 2005. Fundamental Principals of Reservoir Engineering. Society of
Petroleum Engineers Textbook Series. Vol. 8: 232 p. U. S. Department of Labor. Bureau of Labor Statistics. August 2006.
http://www.bls.gov/oes/current/oes172171.htm Zeng, Z. 2006. Potentials of CO2 Sequestration in Mature Petroleum Fields in Williston
Basin, North Dakota. Unpublished.
44


![Guntersville Reservoir Polygon [Converted] Spring Creek Buck Island Area Claysville Area Columbus City Area South Sauty Creek Mink Creek North Sauty Creek Roseberry Creek Polecat Hollow](https://img.pdfslide.us/doc/110x75/5ae3c5a07f8b9a5d648e655d/guntersville-reservoir-polygon-converted-spring-creek-buck-island-area-claysville.jpg)