Embed Size (px)
Citation preview
VOLUMETRIC SURVEYOF
HUBBARD CREEKRESERVOIR
Prepared for:
WEST CENTRAL TEXAS MUNICIPAL WATER DISTRICT
Prepared by:
The Texas Water Development Board
March 10, 2003

Texas Water Development Board
Craig D. Pedersen, Executive Administrator
Texas Water Development Board
William B. Madden, Chairman Noe Fernandez, Vice-ChairmanCharles W. Jenness Charles L. GerenLynwood Sanders Elaine M. Barrón, M.D.
Authorization for use or reproduction of any original material contained in this publication, i.e.not obtained from other sources, is freely granted. The Board would appreciate acknowledgment.
This report was prepared by the Hydrographic Survey group:
Scot Sullivan, P.E.Duane ThomasSteve HuttonWayne ElliottPriscilla Hays
For more information, please call (512) 936-0848
Published and Distributedby the
Texas Water Development BoardP.O. Box 13231
Austin, Texas 78711-3231

TABLE OF CONTENTS
INTRODUCTION ............................................................................................................................1
HISTORY AND GENERAL INFORMATION OF THE RESERVOIR ...........................................1
HYDROGRAPHIC SURVEYING TECHNOLOGY ........................................................................3GPS Information...................................................................................................................3Equipment and Methodology ................................................................................................5Previous Survey Procedures.................................................................................................6
PRE-SURVEY PROCEDURES .......................................................................................................7
SURVEY PROCEDURES................................................................................................................8Equipment Calibration and Operation..................................................................................8Field Survey.........................................................................................................................9Data Processing..................................................................................................................10
RESULTS.......................................................................................................................................12
SUMMARY....................................................................................................................................12
APPENDICES
APPENDIX A - DEPTH SOUNDER ACCURACYAPPENDIX B - RESERVOIR VOLUME TABLEAPPENDIX C - RESERVOIR AREA TABLEAPPENDIX D - AREA-ELEVATION-CAPACITY GRAPHAPPENDIX E - CROSS-SECTION PLOTS
LIST OF FIGURES
FIGURE 1 - LOCATION MAPFIGURE 2 - LOCATION OF SURVEY DATAFIGURE 3 - SHADED RELIEFFIGURE 4 - DEPTH CONTOURSFIGURE 5 - 2-D CONTOUR MAP
1
HUBBARD CREEK RESERVOIRHYDROGRAPHIC SURVEY REPORT
INTRODUCTION
Staff of the Hydrographic Survey Unit of the Texas Water Development Board (TWDB)
conducted a hydrographic survey of Hubbard Creek Reservoir during the period February 3 - 21,
1997. The purpose of the survey was to determine the capacity of the lake up to the top of the
conservation pool. From this information, future surveys will be able to determine the location and
rates of sediment deposition in the conservation pool over time. Survey results are presented in the
following pages in both graphical and tabular form. All elevations presented in this report will be
reported in feet above mean sea level based on the National Geodetic Vertical Datum of 1929 (NGVD
'29) unless noted otherwise. The conservation pool elevation for Hubbard Creek Reservoir is 1,183.0
feet. At this elevation, the original estimate for the surface area of the lake in 1962 was 15,250 acres
and the estimated volume was 317,800 acre-feet of water.
HISTORY AND GENERAL INFORMATION OF THE RESERVOIR
Hubbard Creek Reservoir and the dam facility are owned by the West Central Texas
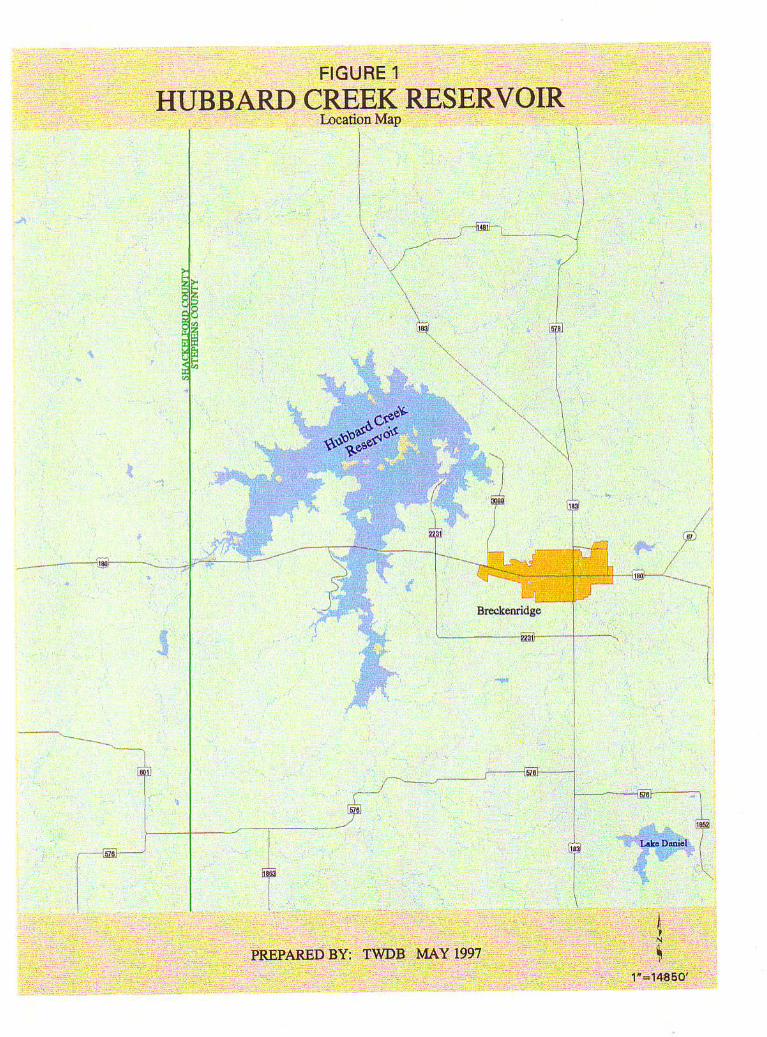
Municipal Water District. The reservoir is located on Hubbard Creek in Stephens County,
approximately six miles northwest of Breckenridge, Texas (see Figure 1). Records indicate the
drainage area is approximately 1,107 square miles. At the conservation pool elevation, the lake is
approximately ten miles long. The widest point of the reservoir (located two and one-half miles
upstream of the dam) is approximately four miles.
The State Board of Water Engineers issued Permit No. 1890 to the West Central Texas
Municipal Water District on August 9, 1957 for Hubbard Creek Reservoir and subsequently amended
the permit on June 23, 1959. The amended permit authorized the owner to construct a dam on Hubbard
Creek and to impound, not to exceed, 320,000 acre-feet of water. The permit allowed the owner to
divert 44,800 acre-feet of water annually for municipal use, 5,600 acre-feet of water annually for

2
mining and the same amount, 5,600 acre-feet annually for industrial use. On September 18, 1972,
Permit No. 1890A was again amended to change the allocation to 1,200 acre-feet of water annually
for industrial purposes, and 10,000 acre-feet of water annually for mining purposes. The water rights
to Hubbard Creek Reservoir were adjudicated under Certificate of Adjudication No. 12-4213, issued
by the Texas Water Commission on April 1, 1986. The conditions and terms of the certificate stated
that the owner, West Central Texas Municipal Water District, maintain an existing dam and reservoir
(known as Hubbard Creek Lake) and to impound, not to exceed, 317,750 acre-feet of water. The uses
for the impounded water as stated in the certificate are as follows:
A. Owner is authorized to divert and use not to exceed 44,800 acre-feet of water per
annum for municipal purposes.
B. Owner is authorized to divert and use not to exceed 1,200 acre-feet of water per annum for
industrial purposes.
C. Owner is authorized to divert and use not to exceed 2,000 acre-feet of water per
annum for irrigational purposes.
D. Owner is authorized to divert and use not to exceed 6,000 acre-feet of water per
annum for mining purposes.
E. Owner is authorized to divert and use not to exceed 2,000 acre-feet of water per
annum for domestic and livestock purposes.
Due to clerical errors, the original certificate of adjudication was amended on March 6, 1991. The
most recent amended Certificate (No. 12 - 4213B) reflects that all conditions and terms of the original
certificate regarding the impoundment and uses remained the same. It was in the "Special Conditions"
section that the following changes were made to the amended certificate: SPECIAL CONDITION B.
of Certificate 12-4213, as amended is hereby deleted.
A. The authorization to use 2,000 acre-feet of water per annum for irrigation purposes shall
automatically revert back to mining purposes after December 31, 2000.
B. The authorization to use 2,000 acre-feet of water per annum for domestic and livestock
purposes shall automatically revert back to mining purposes after December 31, 2000.

3
According to the Texas Water Development Board’s Report 126, dam construction started
March 1, 1961 and was completed November 26, 1962. Deliberate impoundment began December
18, 1962. The engineer for the project was Freese, Nichols and Endress. The general contractor was
Wm. A. Smith Construction Company. The total cost of the project was $7,697,089.
The dam and appurtenant structures consist of an earthfill embankment 15,150 feet in length
(including levees) with a maximum height of 112 feet or elevation 1,208.0 feet. The service spillway
is a circular concrete drop inlet structure that is gate controlled. The crest elevation of the drop inlet
is 1,176.5 feet and the top of the gates is at elevation is 1,185.0 feet. All water that enters the drop
inlet is discharged through the embankment and exits downstream via a 22 feet diameter conduit. The
low-flow outlet consist of a 48-inch diameter valve-controlled pipe with an invert elevation of
1,136.0 feet. The emergency spillway is a excavated broad-crested weir located near the left end of
the dam. The 2,000 feet long weir is at elevation 1,194.0 feet. Also, incorporated in the emergency
spillway is a 4,000 feet long fuse plug with a crest elevation of 1,197.0 feet.
HYDROGRAPHIC SURVEYING TECHNOLOGY
The following sections will describe the theory behind Global Positioning System (GPS)
technology and its accuracy. Equipment and methodology used to conduct the subject survey and
previous hydrographic surveys are also addressed.
GPS Information
The following is a brief and simple description of Global Positioning System (GPS)
technology. GPS is a relatively new technology that uses a network of satellites, maintained in precise
orbits around the earth, to determine locations on the surface of the earth. GPS receivers continuously
monitor the broadcasts from the satellites to determine the position of the receiver. With only one
satellite being monitored, the point in question could be located anywhere on a sphere surrounding the
satellite with a radius of the distance measured. The observation of two satellites decreases the
possible location to a finite number of points on a circle where the two spheres intersect. With a third
4
satellite observation, the unknown location is reduced to two points where all three spheres intersect.
One of these points is obviously in error because its location is in space, and it is ignored. Although
three satellite measurements can fairly accurately locate a point on the earth, the minimum number of
satellites required to determine a three dimensional position within the required accuracy is four. The
fourth measurement compensates for any time discrepancies between the clock on board the satellites
and the clock within the GPS receiver.
GPS technology was developed in the 1960's by the United States Air Force and the defense
establishment. After program funding in the early 1970's, the initial satellite was launched on
February 22, 1978. A four year delay in the launching program occurred after the Challenger space
shuttle disaster. In 1989, the launch schedule was resumed. Full operational capability was reached
on April 27, 1995 when the NAVSTAR (NAVigation System with Time And Ranging) satellite
constellation was composed of 24 Block II satellites. Initial operational capability, a full
constellation of 24 satellites, in a combination of Block I (prototype) and Block II satellites, was
achieved December 8, 1993. The NAVSTAR satellites provide data based on the World Geodetic
System (WGS '84) spherical datum. WGS '84 is essentially identical to NAD '83.
The United States Department of Defense (DOD) is currently responsible for implementing
and maintaining the satellite constellation. In an attempt to discourage the use of these survey units
as a guidance tool by hostile forces, the DOD has implemented means of false signal projection called
Selective Availability (S/A). Positions determined by a single receiver when S/A is active result in
errors to the actual position of up to 100 meters. These errors can be reduced to centimeters by
performing a static survey with two GPS receivers, one of which is set over a point with known
coordinates. The errors induced by S/A are time-constant. By monitoring the movements of the
satellites over time (one to three hours), the errors can be minimized during post processing of the
collected data and the unknown position computed accurately.
Differential GPS (DGPS) can determine positions of moving objects in real-time or "on-the-
fly." In the early stages of this program, one GPS receiver was set up over a benchmark with known
coordinates established by the hydrographic survey crew. This receiver remained stationary during
the survey and monitored the movements of the satellites overhead. Position corrections were
5
determined and transmitted via a radio link once per second to a second GPS receiver located on the
moving boat. The boat receiver used these corrections, or differences, in combination with the
satellite information it received to determine its differential location. The large positional errors
experienced by a single receiver when S/A is active are greatly reduced by utilizing DGPS. The
reference receiver calculates satellite corrections based on its known fixed position, which results
in positional accuracies within three meters for the moving receiver. DGPS was used to determine
horizontal position only. Vertical information was supplied by the depth sounder.
The need for setting up a stationary shore receiver for current surveys has been eliminated
with the development of fee-based reference position networks. These networks use a small network
of GPS receivers to create differential corrections for a large network of transmitting stations, Wide
Area Differential GPS (WADGPS). The TWDB receives this service from ACCQPOINT, a
WADGPS correction network over a FM radio broadcast. A small radio receiver purchased from
ACCQPOINT, collects positional correction information from the closest broadcast station and
provides the data to the GPS receiver on board the hydrographic surveying boat to allow the position
to be differentially corrected.
Equipment and Methodology
The equipment used in the performance of the hydrographic survey consisted of a 23-foot
aluminum tri-hull SeaArk craft with cabin, equipped with twin 90-Horsepower Johnson outboard
motors. Installed within the enclosed cabin are an Innerspace Helmsman Display (for navigation), an
Innerspace Technology Model 449 Depth Sounder and Model 443 Velocity Profiler, a Trimble
Navigation, Inc. 4000SE GPS receiver, an ACCQPOINT FM receiver, and an on-board 486 computer.
Power was provided by a water-cooled generator through an in-line uninterruptible power supply.
Reference to brand names does not imply endorsement by the TWDB.
The GPS equipment, survey vessel, and depth sounder combine together to provide an efficient
hydrographic survey system. As the boat travels across the lake surface, the depth sounder gathers
approximately ten readings of the lake bottom each second. The depth readings are stored on the
survey vessel's on-board computer along with the corrected positional data generated by the boat's
6
GPS receiver. The daily data files collected are downloaded from the computer and brought to the
office for editing after the survey is completed. During editing, bad data is removed or corrected,
multiple data points are averaged to get one data point per second, and average depths are converted
to elevation readings based on the daily recorded lake elevation on the day the survey was performed.
Accurate estimates of the lake volume can be quickly determined by building a 3-D model of the
reservoir from the collected data. The level of accuracy is equivalent to or better than previous
methods used to determine lake volumes, some of which are discussed below.
Previous Survey Procedures
Originally, reservoir surveys were conducted with a rope stretched across the reservoir along
pre-determined range lines. A small boat would manually pole the depth at selected intervals along
the rope. Over time, aircraft cable replaced the rope and electronic depth sounders replaced the pole.
The boat was hooked to the cable, and depths were again recorded at selected intervals. This
method, used mainly by the Soil Conservation Service, worked well for small reservoirs.
Larger bodies of water required more involved means to accomplish the survey, mainly due
to increased size. Cables could not be stretched across the body of water, so surveying instruments
were utilized to determine the path of the boat. Monumentation was set for the end points of each line
so the same lines could be used on subsequent surveys. Prior to a survey, each end point had to be
located (and sometimes reestablished) in the field and vegetation cleared so that line of sight could
be maintained. One surveyor monitored the path of the boat and issued commands via radio to insure
that it remained on line while a second surveyor determined depth measurement locations by turning
angles. Since it took a major effort to determine each of the points along the line, the depth readings
were spaced quite a distance apart. Another major cost was the land surveying required prior to the
reservoir survey to locate the range line monuments and clear vegetation.
Electronic positioning systems were the next improvement. If triangulation could determine
the boat location by electronic means, then the boat could take continuous depth soundings. A set of
microwave transmitters positioned around the lake at known coordinates would allow the boat to

7
receive data and calculate its position. Line of site was required, and the configuration of the
transmitters had to be such that the boat remained within the angles of 30 and 150 degrees in respect
to the shore stations. The maximum range of most of these systems was about 20 miles. Each shore
station had to be accurately located by survey, and the location monumented for future use. Any errors
in the land surveying resulted in significant errors that were difficult to detect. Large reservoirs
required multiple shore stations and a crew to move the shore stations to the next location as the
survey progressed. Land surveying was still a major cost.
Another method used mainly prior to construction utilized aerial photography to generate
elevation contours which could then be used to calculate the volume of the reservoir. Fairly accurate
results could be obtained, although the vertical accuracy of the aerial topography was generally one-
half of the contour interval or + five feet for a ten-foot contour interval. This method could be quite
costly and was only applicable in areas that were not inundated.
PRE-SURVEY PROCEDURES
The reservoir's surface area was determined prior to the survey by digitizing with AutoCAD
software the lake's pool boundary (elevation 1,183.0) from USGS quad sheets. The name of the quad
sheets are as follows: BRECKENRIDGE, TX (Photo-revised 1981), EDWARDS BRANCH, TX
(Photo-revised 1981), EOLIAN, TX (Photo-revised 1987), and BUCK MOUNTAIN, TX (Photo-
revised 1982. The graphic boundary file created was then transformed into the proper datum, from
NAD '27 datum to NAD '83, using Environmental Systems Research Institutes's (ESRI) Arc/Info
PROJECT command with the NADCON parameters. The area of the lake boundary was checked to
verify that the area was the same in both datums.
The survey layout was designed by placing survey track lines at 500 foot intervals across the
lake. The survey design for this lake required approximately 186 survey lines to be placed along the
length of the lake. Survey setup files were created using Coastal Oceangraphics, Inc. Hypack software
for each group of track lines that represented a specific section of the lake. The setup files were
copied onto diskettes for use during the field survey.
8
SURVEY PROCEDURES
The following procedures were followed during the hydrographic survey of Hubbard Creek
Reservoir performed by the TWDB. Information regarding equipment calibration and operation, the
field survey, and data processing is presented.
Equipment Calibration and Operation
At the beginning of each surveying day, the depth sounder was calibrated with the Innerspace
Velocity Profiler. The Velocity Profiler calculates an average speed of sound through the water
column of interest for a designated draft value of the boat (draft is the vertical distance that the boat
penetrates the water surface). The draft of the boat was previously determined to average 1.2 ft. The
velocity profiler probe is placed in the water to moisten and acclimate the probe. The probe is then
raised to the water surface where the depth is zeroed. The probe is lowered on a cable to just below
the maximum depth set for the water column, and then raised to the surface. The unit displays an
average speed of sound for a given water depth and draft, which is entered into the depth sounder.
The depth value on the depth sounder was then checked manually with a measuring tape to ensure that
the depth sounder was properly calibrated and operating correctly. During the survey of Hubbard
Creek Reservoir, the speed of sound in the water column varied daily between 4717 and 4749 feet
per second. Based on the measured speed of sound for various depths, and the average speed of sound
calculated for the entire water column, the depth sounder is accurate to within +0.2 feet, plus an
estimated error of +0.3 feet due to the plane of the boat for a total accuracy of +0.5 feet for any
instantaneous reading. These errors tend to be minimized over the entire survey, since some are
positive readings and some are negative readings. Further information on these calculations is
presented in Appendix A.
During the survey, the onboard GPS receiver was set to a horizontal mask of 10° and a PDOP
(Position Dilution of Precision) limit of 7 to maximize the accuracy of horizontal positions. An
internal alarm sounds if the PDOP rises above seven to advise the field crew that the horizontal
9
position has degraded to an unacceptable level. The lake’s initialization file used by the Hypack data
collection program was setup to convert the collected DGPS positions on-the-fly to state plane
coordinates. Both sets of coordinates were then stored in the survey data file.
Field Survey
Data was collected on Hubbard Creek Reservoir during the period February 3 -21, 1997.
Temperatures during the survey ranged from the 30's to the 70's and at times, high winds caused data
collection to be suspended due to rough waters. Approximately 183,452 data points were collected
over the 455 miles traveled along the pre-planned survey lines and the random data-collection lines.
These points were stored digitally on the boat's computer in 326 data files. Data were not collected
in areas of shallow water (depths less than 3.0 feet) or with significant obstructions unless these areas
represented a large amount of water. Some random data lines were also collected, perpendicular to
the survey layout, by the field crew during the survey. Figure 2 shows the actual location of all data
collection points.
TWDB staff observed the lake bottom to be fairly uniform with a gentle slope from the
shoreline to the center of the lake. The bathemetry of the lake reflected similar characteristics of
the terrain or topography surrounding the lake. Several creek channels could be distinguished on the
depth sounder’s analog charts. The majority of the lake was clear of navigational hazards such as
standing timber, submerged trees, and stumps. These hazards as well as sediment deposits (sand bars)
were observed in the upper reaches of Hubbard and Big Sandy Creeks in the vicinity and upstream
of the Highway 180 bridge.
Data collection in the headwaters was discontinued when the boat could no longer make
transects across the lake due to shallow water, islands, and extensive vegetation. Deep water could
still be found in the river channel. The collected data were stored in individual data files for each
pre-plotted range line or random data collection event. These files were downloaded to diskettes at
the end of each day for future processing.
Data Processing

10
The collected data were down-loaded from diskettes onto the TWDB's computer network.
Tape backups were made for future reference as needed. To process the data, the EDIT routine in the
Hypack Program was run on each raw data file. Data points such as depth spikes or data with missing
depth or positional information were deleted from the file. The depth information collected every 0.1
seconds was averaged to get one reading for each second of data collection. A correction for the lake
elevation at the time of data collection was also applied to each file during the EDIT routine. During
the survey, the water surface ranged daily from 1182.66 to 1183.5 feet. After all changes had been
made to the raw data file, the edited file was saved with a different extension. After all the files were
edited, the edited files were combined into a single data file, representative of the lake, to be used
with the GIS software to develop a model of the lake's bottom surface.
The resulting DOS data file was imported into the UNIX operating system used to run
Environmental System Research Institutes's (ESRI) Arc/Info GIS software and converted to a MASS
points file. The MASS points and the boundary file were then used to create a Digital Terrain Model
(DTM) of the reservoir's bottom surface using Arc/Info's TIN module. The module builds an irregular
triangulated network from the data points and the boundary file. This software uses a method known
as Delauney's criteria for triangulation. A triangle is formed between three non-uniformly spaced
points, including all points along the boundary. If there is another point within the triangle, additional
triangles are created until all points lie on the vertex of a triangle. All of the data points are preserved
for use in determining the solution of the model by using this method. The generated network of three-
dimensional triangular planes represents the actual bottom surface. Once the triangulated irregular
network (TIN) is formed, the software then calculates elevations along the triangle surface plane by
solving the equations for elevation along each leg of the triangle. Information for the entire reservoir
area can be determined from the triangulated irregular network created using this method of
interpolation.
If data points were collected outside the boundary file, the boundary was modified to include
the data points. The boundary file in areas of significant sedimentation was also down-sized as
deemed necessary based on the data points and the observations of the field crew. The resulting
boundary shape was used to develop each of the map presentations of the lake in this report.

11
There were still some areas where volume and area values could not be calculated by
interpolation because of a lack of information along the 1,183.0 contour line of the reservoir. "Flat
triangles" were drawn at these locations. Arc/Info does not use flat triangle areas in the volume or
contouring features of the model. Approximately 248 additional points were required for interpolation
and contouring of the entire lake surface at elevation 1,183.0 feet. Volumes and areas were then
calculated from this modified TIN for the entire reservoir at one-tenth of a foot intervals. From
elevation 1,178.0 feet, the surface area and volume values for the lake were mathematically estimated
up to elevation 1183.0 feet because of the errors generated by the software in relation to interpolation
procedures along the border. This was done by first distributing uniformly across each contour
interval, the difference in surface area from the last TIN value, elevation 1,178.0 and the area of the
modified boundary at elevation 1,183.0. Volumes for each 0.1 interval were calculated by adding to
the existing volume, 0.1 of the existing area, and 0.5 of the difference between the existing area and
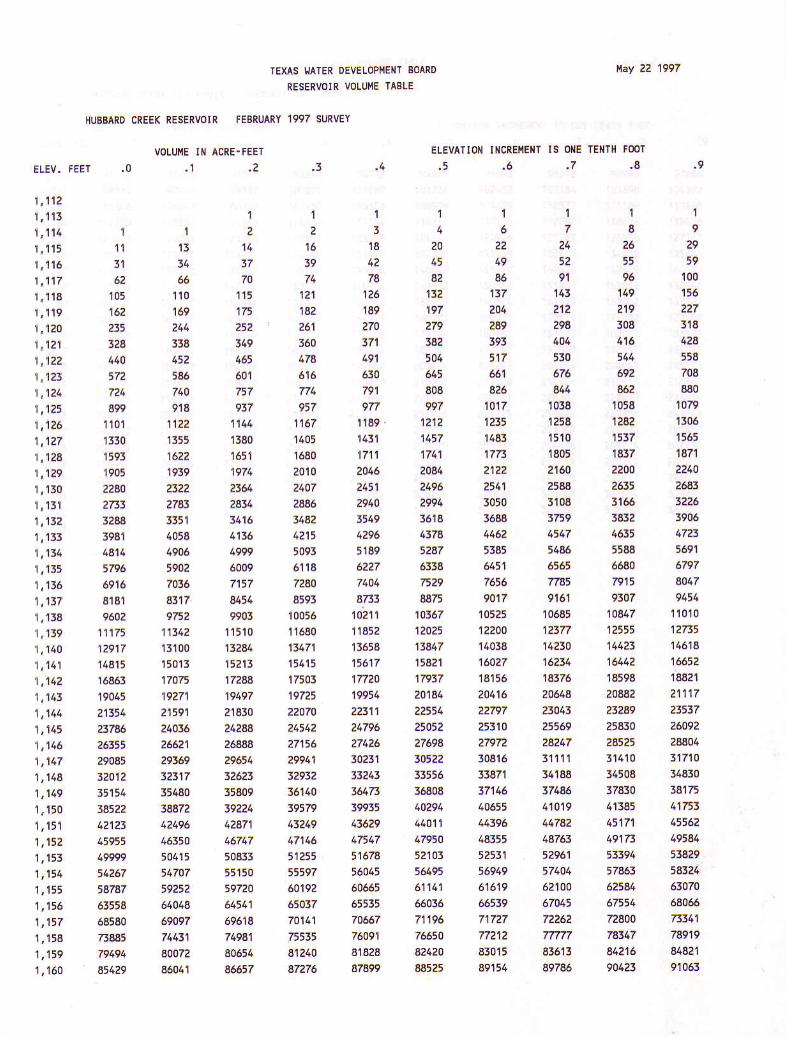
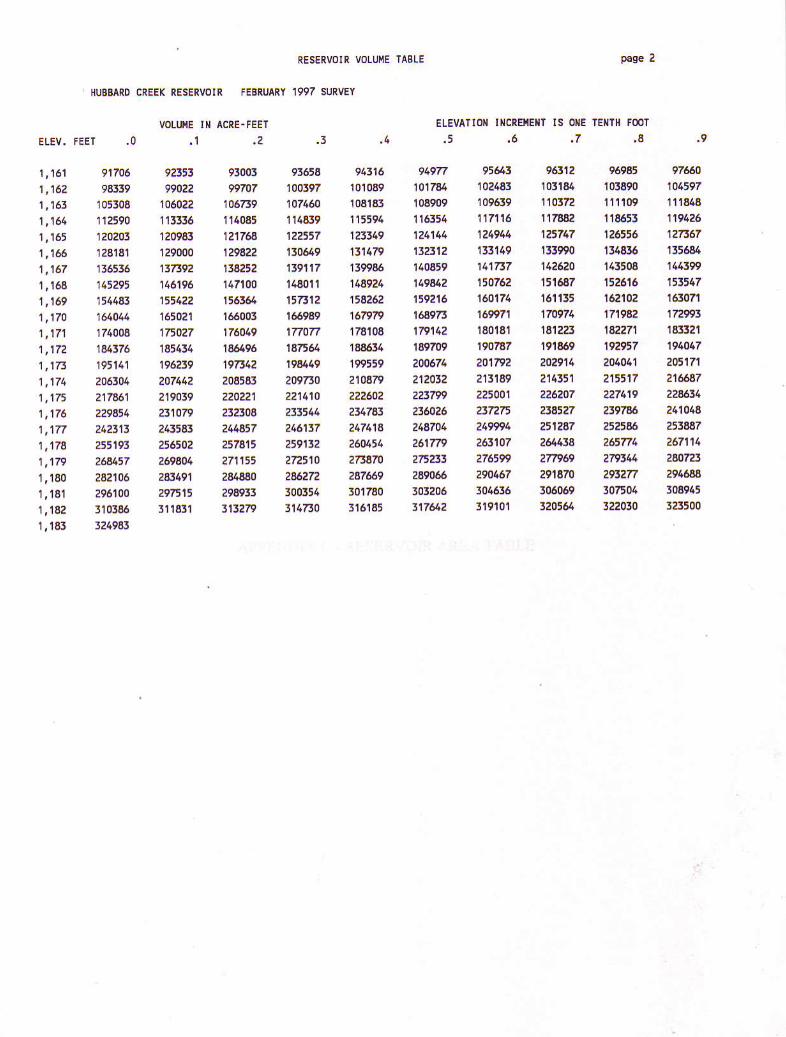
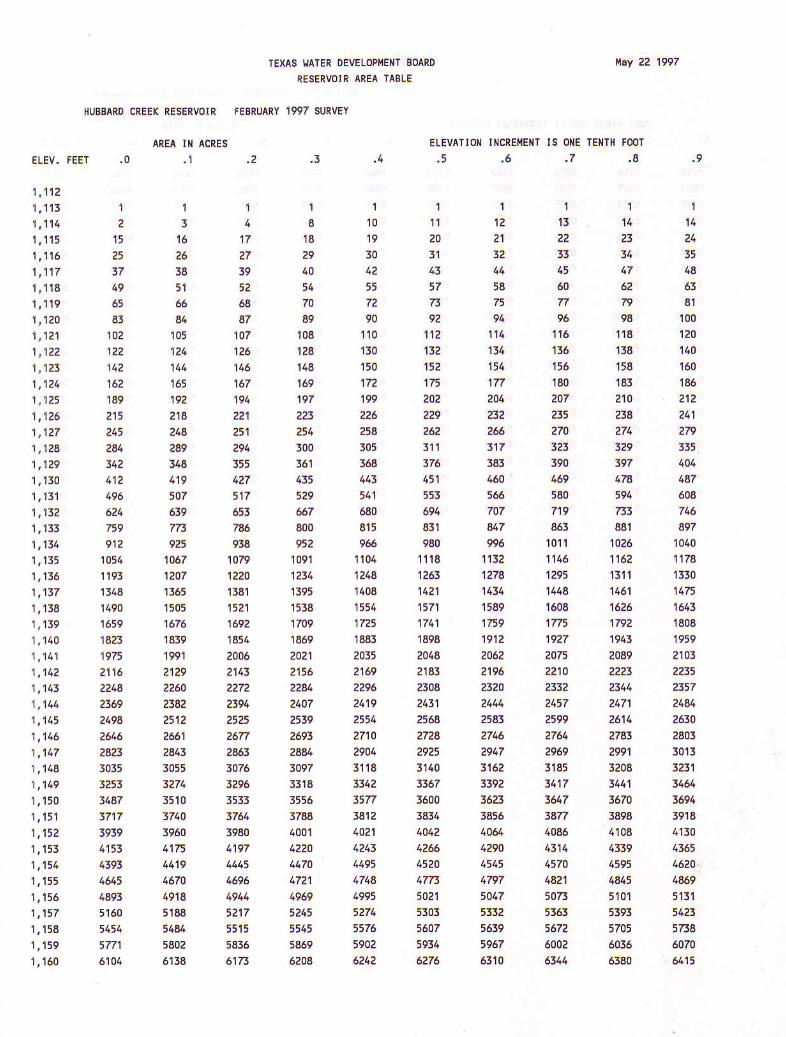
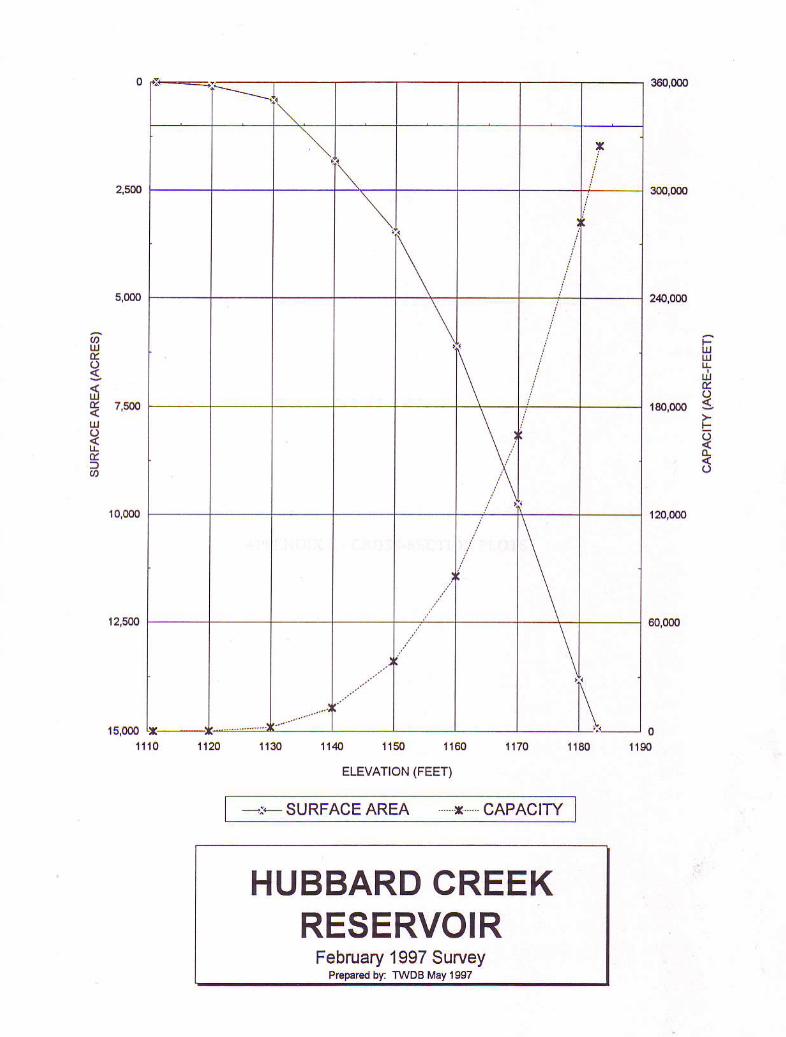
the area value for the volume being calculated. The computed reservoir volume table is presented in
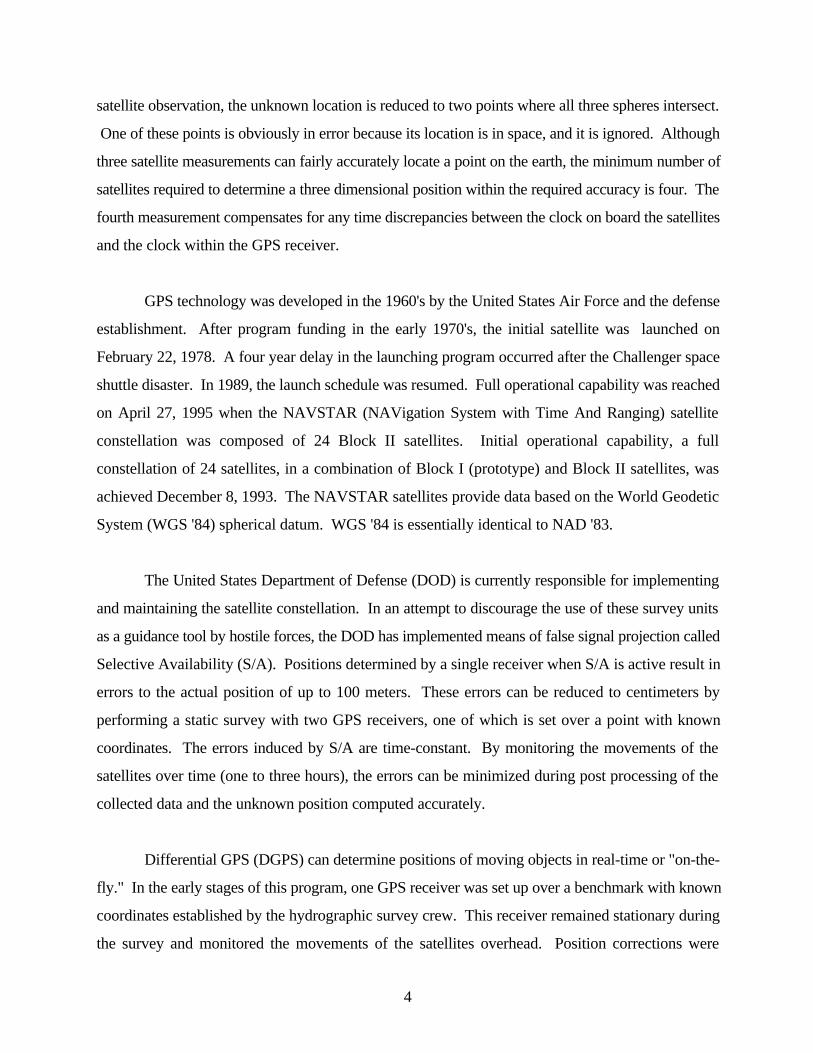
Appendix B and the area table in Appendix C. An elevation-area-volume graph is presented in
Appendix D.
Other presentations developed from the model include a shaded relief map and a shaded depth
range map. To develop these maps, the TIN was converted to a lattice using the TINLATTICE
command and then to a polygon coverage using the LATTICEPOLY command. Using the
POLYSHADE command, colors were assigned to the range of elevations represented by the polygons
that varied from navy to yellow. The lower elevation was assigned the color of navy, and the 1,183.0
lake elevation was assigned the color of yellow. Different color shades were assigned to the different
depths in between. Figure 3 presents the resulting color shaded representation of the lake. Figure 4
presents a similar version of the same map, using bands of color for selected depth intervals. The
color increases in intensity from the shallow contour bands to the deep water bands.
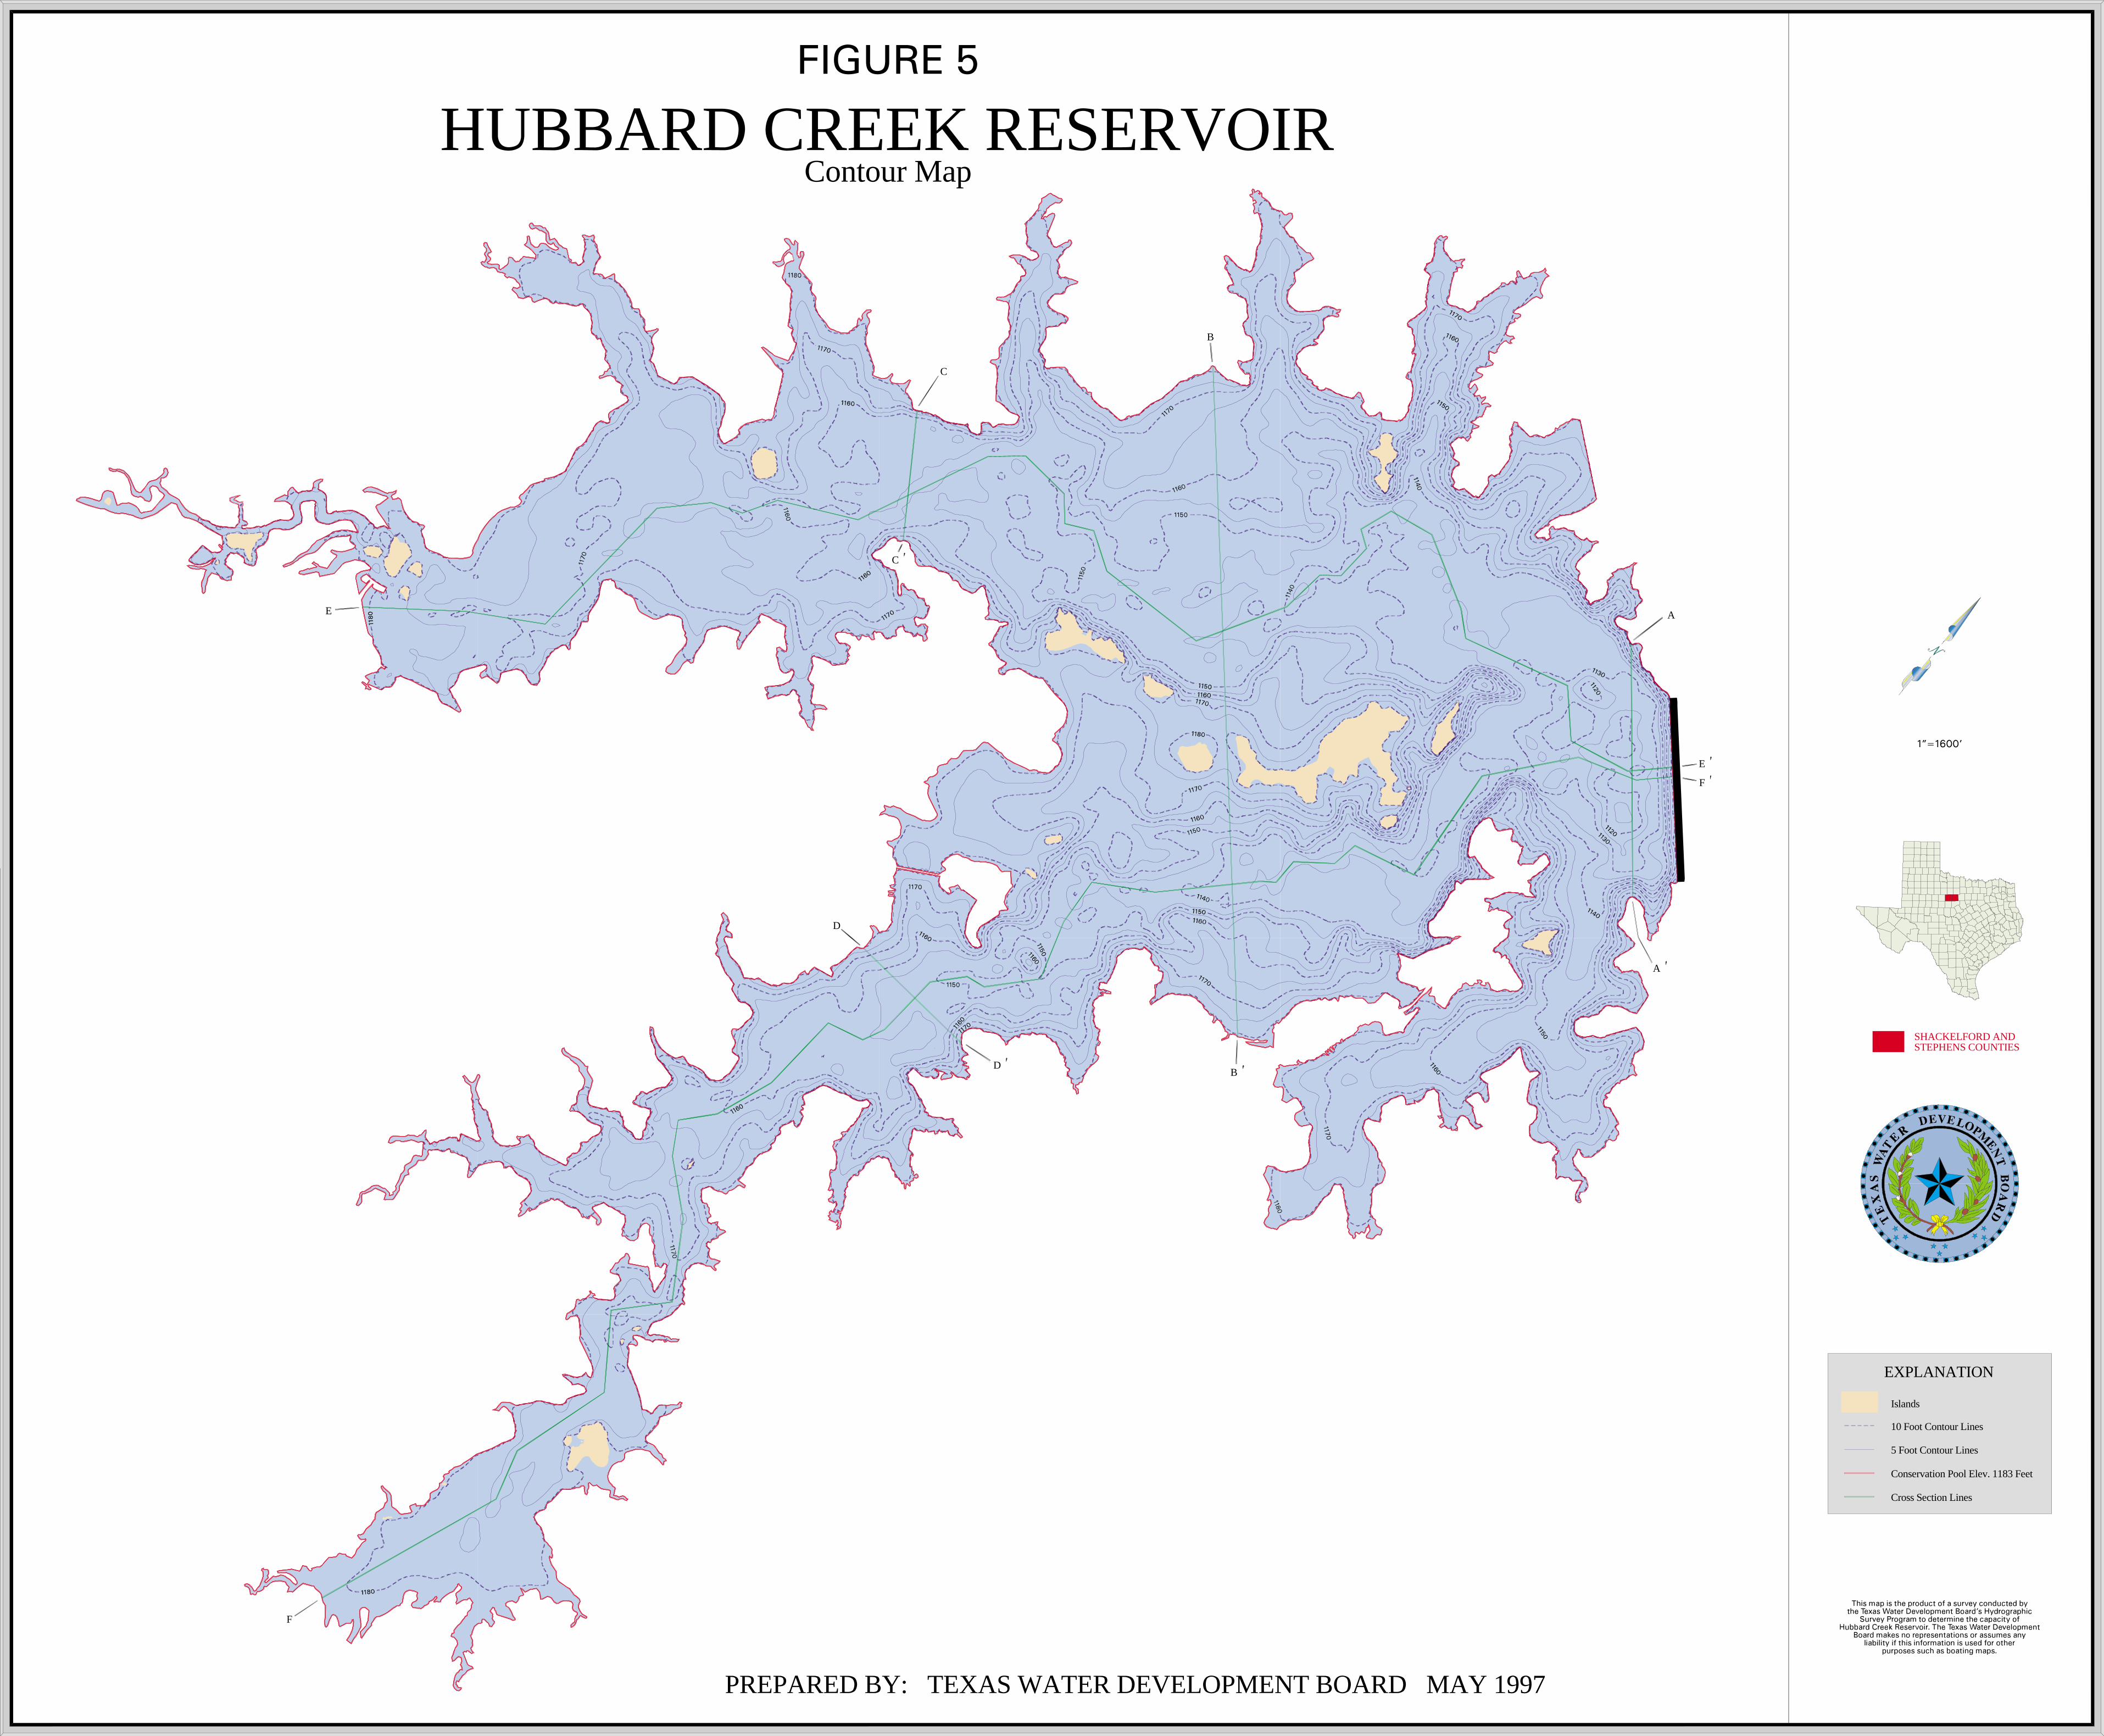
Linear filtration algorithms were then applied to the DTM to produce smooth cartographic
contours versus using the sharp engineered contours. The resulting contour map of the bottom surface
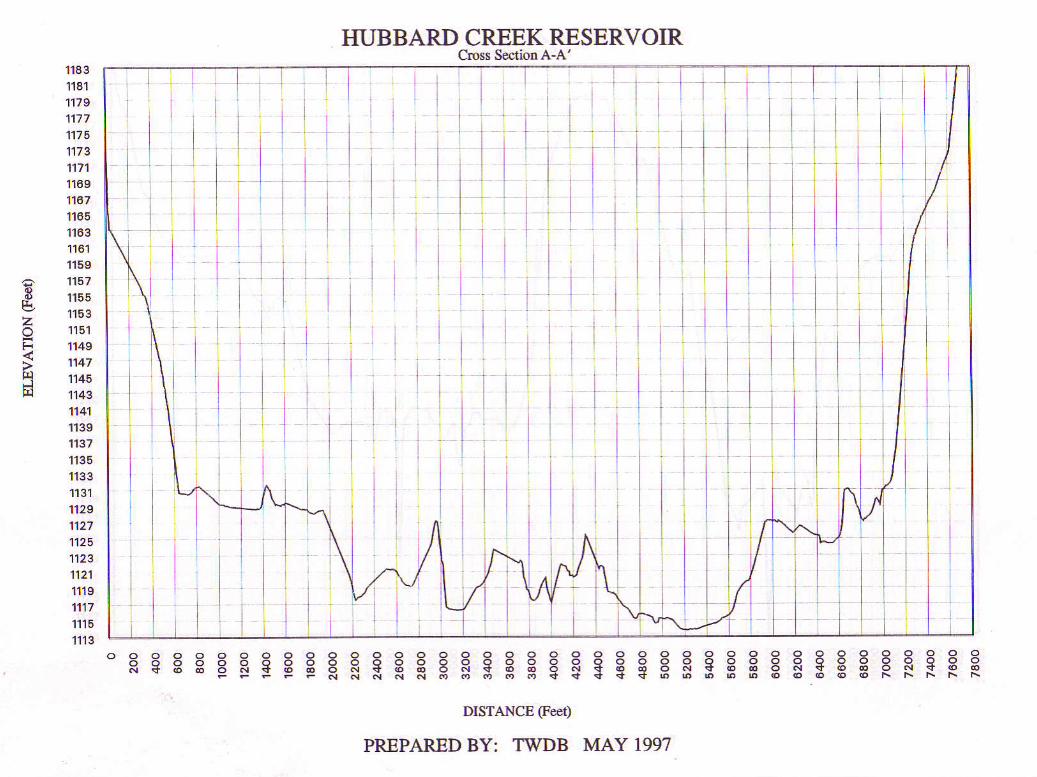
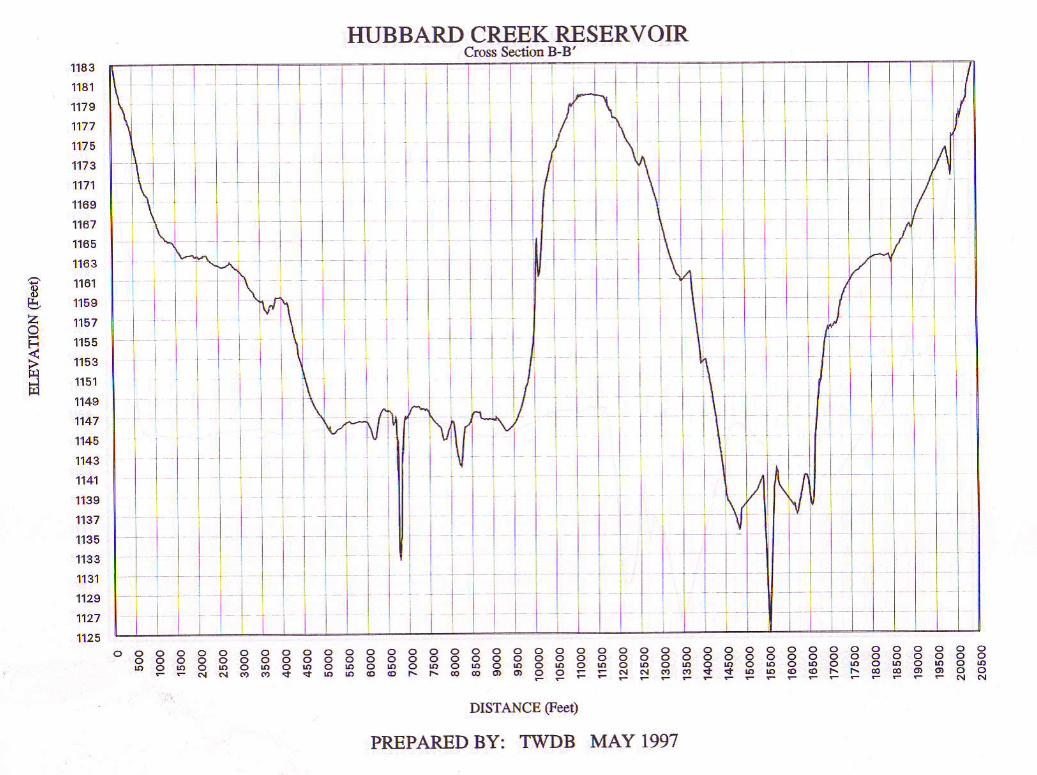
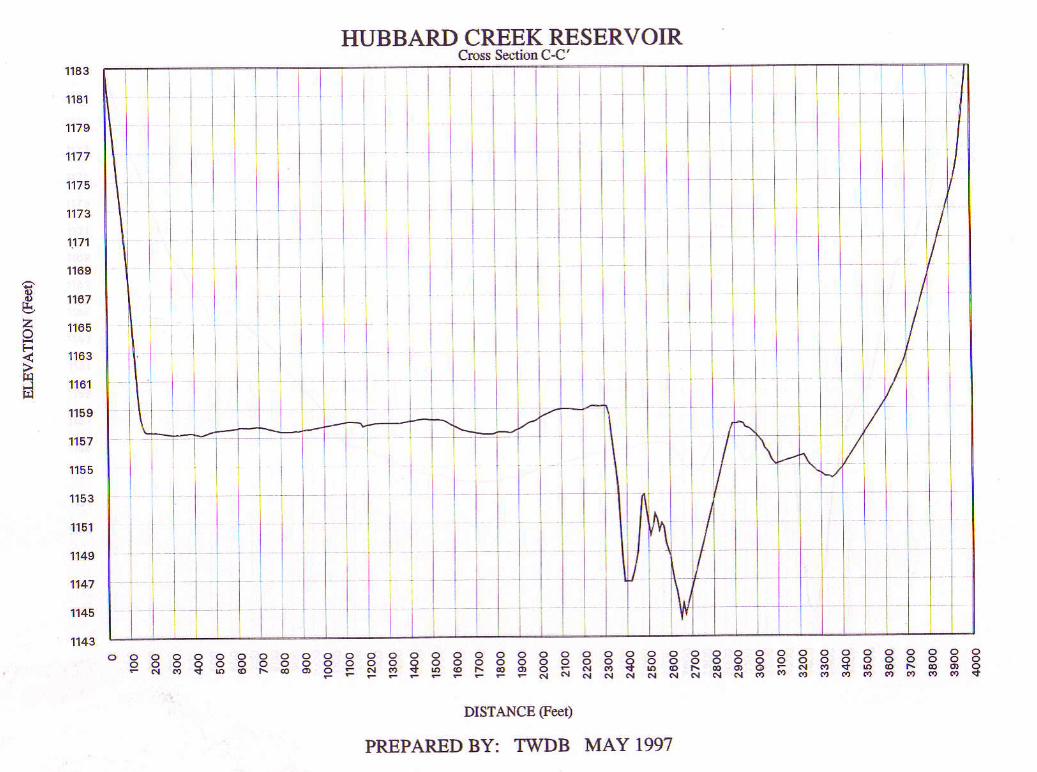
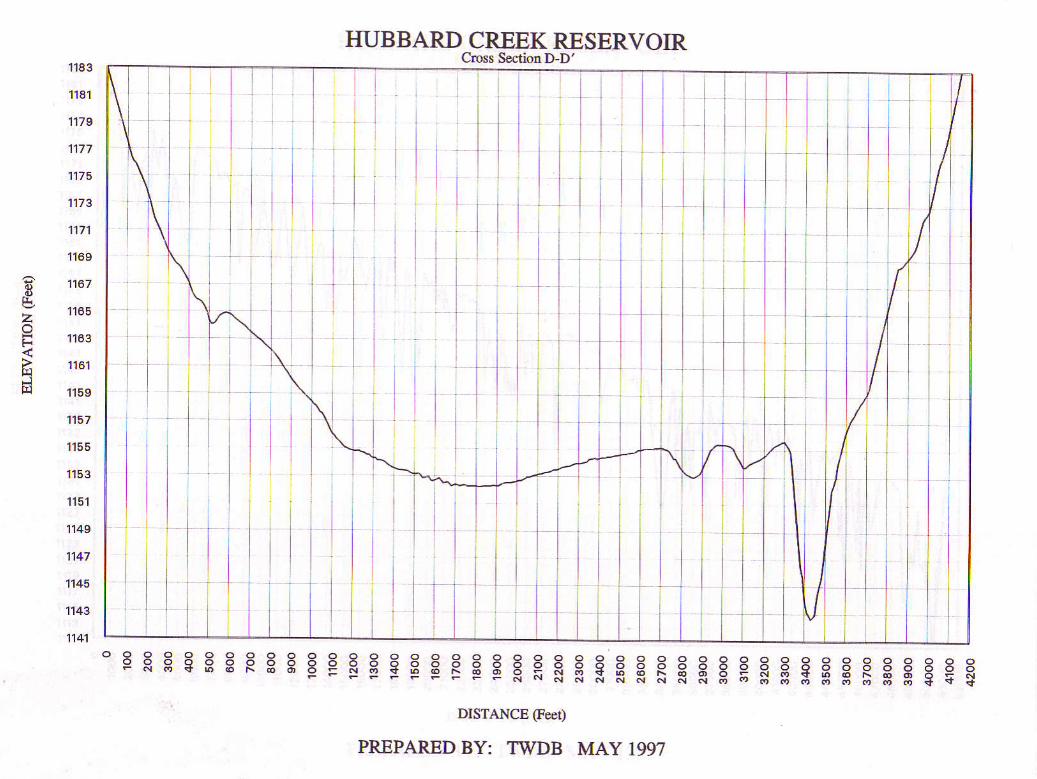
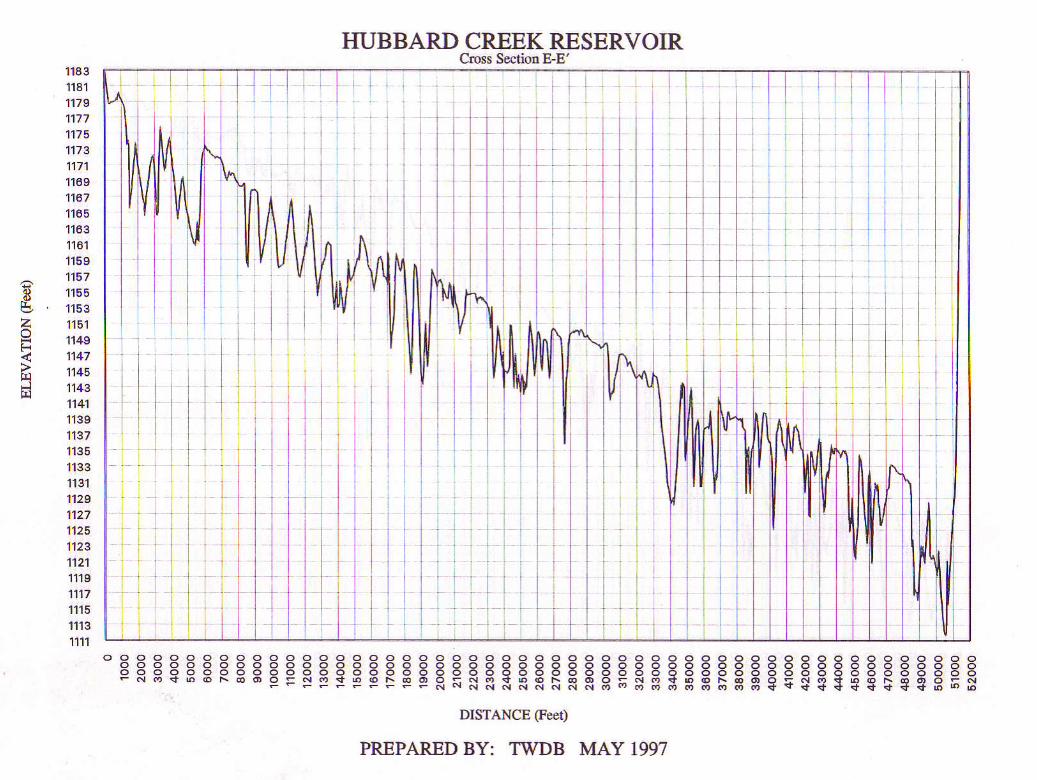
at five-foot intervals is presented in Figure 5. Various cross-sectional plots from the TIN model that
are identified on the contour map are presented in Appendix E.
12
RESULTS
Results from the 1996 TWDB survey indicate Hubbard Creek Reservoir encompasses 14,922
surface acres and contains a volume of 324,983 acre-feet at the conservation pool elevation of 1,183.0
feet. The shoreline at this elevation was calculated to be 120.0 miles. The deepest point of the lake,
elevation 1,111.53, was located approximately 980 feet upstream (due west) from the middle of the
dam. The dead storage volume, or the amount of water below the lowest outlet in the dam, was
calculated to be 6,916 acre-feet based on the low flow outlet invert elevation of 1,136.0 feet. The
conservation storage capacity, or the amount of water between the spillway and the lowest outlet, is,
318,070 acre-feet.
SUMMARY
Hubbard Creek Reservoir was formed in 1962. Initial storage calculations estimated the
volume at the conservation pool elevation of 1,183.0 feet to be 317,750 acre-feet with a surface area
of 15,250 acres.
During the period of February 3 - 21, 1997, a hydrographic survey of Hubbard Creek
Reservoir was performed by the Texas Water Development Board's Hydrographic Survey Program.
The 1996 survey used technological advances such as differential global positioning system and
geographical information system technology to build a model of the reservoir's bathemetry. These
advances allowed a survey to be performed quickly and to collect significantly more data of the
bathemetry of Hubbard Creek Reservoir than previous survey methods. Results indicate that the lake's
capacity at the conservation pool elevation of 1,183.0 feet was 324,983 acre-feet and the area was
14,922 acres. This volume calculated is 7,233 acre-feet higher than the original estimated volume of
the reservoir. Therefore, no estimates of sedimentation in the reservoir can be made at this time.
It is difficult to compare the original design information and the TWDB survey performed
because little is known about the original design information, the amount of data collected, and the

13
method used to process the collected data. However, the TWDB considers the 1997 survey to be a
significant improvement over previous survey procedures and recommends that the same methodology
be used in five to ten years or after major flood events to monitor changes to the lake's storage
capacity.
A-1
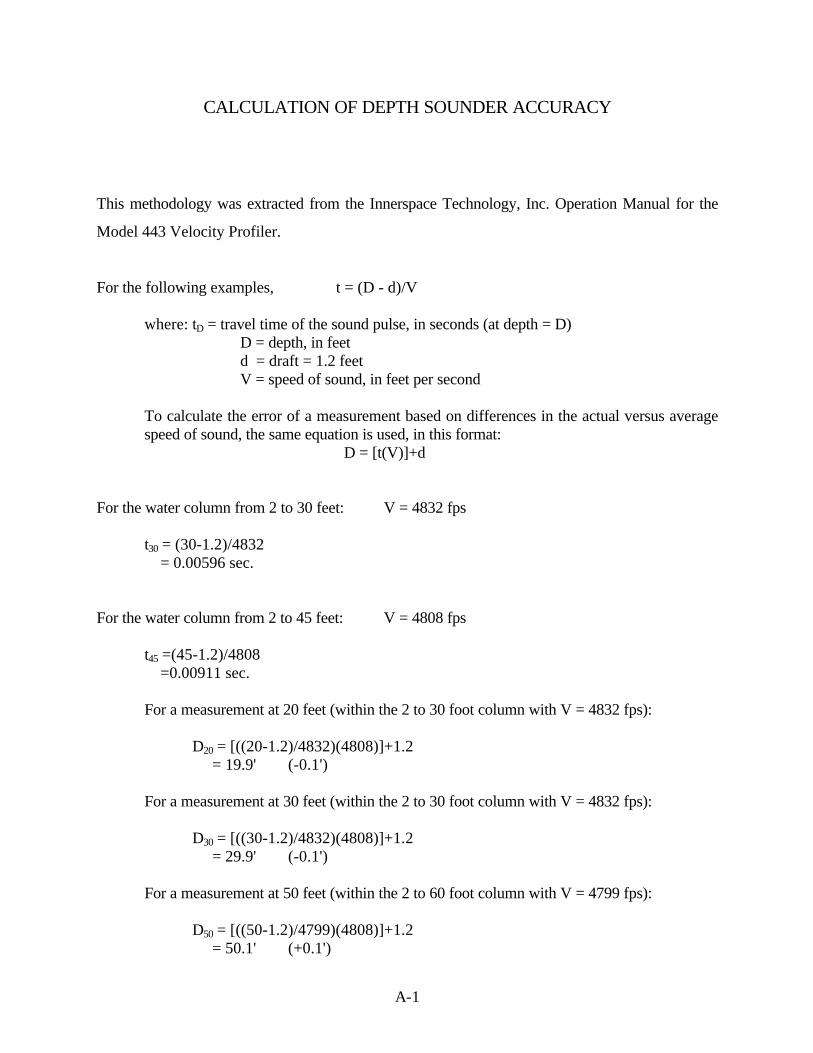
CALCULATION OF DEPTH SOUNDER ACCURACY
This methodology was extracted from the Innerspace Technology, Inc. Operation Manual for the
Model 443 Velocity Profiler.
For the following examples, t = (D - d)/V
where: tD = travel time of the sound pulse, in seconds (at depth = D)D = depth, in feetd = draft = 1.2 feetV = speed of sound, in feet per second
To calculate the error of a measurement based on differences in the actual versus averagespeed of sound, the same equation is used, in this format:
D = [t(V)]+d
For the water column from 2 to 30 feet: V = 4832 fps
t30 = (30-1.2)/4832 = 0.00596 sec.
For the water column from 2 to 45 feet: V = 4808 fps
t45 =(45-1.2)/4808 =0.00911 sec.
For a measurement at 20 feet (within the 2 to 30 foot column with V = 4832 fps):
D20 = [((20-1.2)/4832)(4808)]+1.2 = 19.9' (-0.1')
For a measurement at 30 feet (within the 2 to 30 foot column with V = 4832 fps):
D30 = [((30-1.2)/4832)(4808)]+1.2 = 29.9' (-0.1')
For a measurement at 50 feet (within the 2 to 60 foot column with V = 4799 fps):
D50 = [((50-1.2)/4799)(4808)]+1.2 = 50.1' (+0.1')

A-2
For the water column from 2 to 60 feet: V = 4799 fps Assumed V80 = 4785 fps
t60 =(60-1.2)/4799 =0.01225 sec.
For a measurement at 10 feet (within the 2 to 30 foot column with V = 4832 fps):
D10 = [((10-1.2)/4832)(4799)]+1.2 = 9.9' (-0.1')
For a measurement at 30 feet (within the 2 to 30 foot column with V = 4832 fps):
D30 = [((30-1.2)/4832)(4799)]+1.2 = 29.8' (-0.2')
For a measurement at 45 feet (within the 2 to 45 foot column with V = 4808 fps):
D45 = [((45-1.2)/4808)(4799)]+1.2 = 44.9' (-0.1')
For a measurement at 80 feet (outside the 2 to 60 foot column, assumed V = 4785 fps):
D80 = [((80-1.2)/4785)(4799)]+1.2 = 80.2' (+0.2')
IDOS I,JATER DEVELOPHENI BOARD
RESERVOIR VOLUNE TABLE
IIUBBARD CREEK RESERVOIR FEBRUARY 1997 SURVEY
tlay 22 1997
. 0
11 1l l62
1 0 5162235124
572724499
1 1 0 11330159119052240zn\
3981$145796691681819602
1117512917MA1516863190452131123746
290453201235154345?24212315955
51267547476355868580718a5
85129
VOLUI.IE IN
1
34
1 1 016924433815?546740918
112213551622191921222741lr514058490659027A368t17975?
1 1 t 4 ?131001 5 0 1 3174751927121591?4036?66212936932317354803887?424961635050415,1707,92r2&ua6909771131a0a7z46041
ACRE.FEET
. 2
1z
3770
115175252349165601757937
15801651
2364283t31161136
6009715784519903
1 1 5 1 01324415213172441949721830u28A2684429654
158093922112471
5081155150597206151169618749418065446657
. 3
12
39
1211gz?61360178616
9571167140t16802010240728863442421550936 1 1 872808591
1005611680131711r1151750319725220702151227156299113?93?361103957913?49
5125555597601926503770141755354124047276
1l
1 84278
126189270171
630791977
1 1 8 9 .1t31171120162451?9403549429651896227
a7t1 0 2 1 11 1 8 5 ?116581561717724199512231121796271?63023133243361733993'1362947517516745601'6066'6t5357066776091a1a2847499
l
2015a2
142197
aaz504615808997
145717412aa421962994351813745ZA7633975298875
14t671202513A47154211793720144225512505?2769440t223355636804102914/ .01147954521015649561141664367119676650a?12088525
1
85137204289t95, 1 7661426
1 0 1 712451481177l212225411050!68844625385615176569017
1052512?001103815027181562011622797?55102n723041633871371164065511396$3555253156919616196653971727772128301t89154
l
24,?91
1132 1 2296141510676s44
103812581 5 1 01805216025883108375945475486656577859161
1064512377142301623418t76206482301325569242473 1 1 1 1341881713641019447421476352961571016?1006701572262777778361189786
1a
265596
219108
514
462105E1?82153718372200263'316658124635
668079159307
10417125551112316112185982044221?4925830245253 1 4 1 03$043783041t854517149174533945746462544675547zaAO7A31781?1690123
. 9
l
2959
1 0 01t62?73 1 84245587oB880
1079130615651871zz4026833?263906472356916797au79151
1 1 0 1 0127351461816652148212111723537260922880431710544303817'117t34156219ral,342954421630706406573311749194142191063
ELEVATION IIICRE ENI IS OIIE TENTH FOOT
. 5 . 6 . 7 , AELEV. FEEI
1 , 1 1 21 , 1 1 5' | , 1 1 1
1 , 1 1 51 , 1 1 61 , 1 1 71 , 1 1 81 , 1 1 91 , 1 2 01 " 1 ? 11 , 1 2 ?1 , 1 2 31 , 1 2 41 , 1 2 51 , 1 ? 61 , 1 2 71 , 1 2 81 , 1 2 91 , 1 3 01 , 1 3 11 , 1 3 ?
1 , 1 3 11 , 1 3 51 , 1 3 61 , 1 3 71 , 1 3 4t . t l 91 , 1 4 0r , 1 4 11 , 1 4 21 , 1 4 I
1 , 1 1 5
1,1171,144
1 , 1 5 01 , 1 5 1
1,1531 , 1 5 41 , 1 5 51 , 1 t 61 , 1 5 71 , 1 5 41 , 1 5 91 , 1 6 0
r
HUBBARD CiEEK RESERVOIR
RESERVOIR VOLUI,IE TASLE
FESRUIRY 1997 SURVEY
Pase 2
VOLU E IN ACRE.FEE'
. 1 . 2ELEVATTON IIICREIIEI{T IS OIIE IEllTH FOOT
. 5 . 6 . 7 . 8 . 9ELEV. FEEI .O
91m698!39
10t308112190120203128161136516115295111443
1740081A!'76195141206104?17861?2985424Zt l !25r'19!26&t7282106u96t0031038632498i3
1 , 1 6 11 , 1 6 2' | ,163' | ,164
1 , 1 6 51,1661 , 1 6 71 , 1 6 81 , 1 6 91 , 1 7 01 , 1 7 1
1 , 1 7 41 , 1 n1 , 1 7 61 , 1 n1,1741, t791 , 1 8 01 , 1 8 11 , 1 8 21 , 1 8 :
9255599022
10602211t556120961129000137t9214619615542216502t1750271854141 239207412219039231079243583256502269EO42434912975155118!1
9500399m7
1067391140At12176412982213825211710015616116600317604916649619n42208561
2t?J0s244A57z578t527115528l�8{|0298933313279
. 5
9!6t810059710716011483912?t 71106491391171460111573121669091n|n1aDq.198449209ZJ02211102tta442161t72591t22n5102t62723003t4314730
9431610104910a1a31155911?13491314791399E61$92415426216nn178t061A8l�34199559219An222692234783247418260451273470247669301780316185
101764108909116154124144132t121408591198l�21592151649751m1421897092006742lzotzzAf\n?36026240m12617n2n2t324906630!206417542
956,�tloz4at109619117116124944133119111737150762160174169971180181190707zolnzz1t1E9z?5001
z4w126t107276599290457!04636tt9t01
963,12103184110372117442125?471559901426201515471611551m974141225191E69202911214351226207238527211287264l!�82m692918m306069320164
96945 97660105E90 144597111109 11ta4a11E653 11 26'tz6t56 127t67154E56 135684t4t50E 144199t52616 153547162102 16!0711V9A2 17299t182271 '�18!!21
t92957 191047204041 205171215517 21667227119 ZZ&142t9786 2410482125A6 25387265774 26f114z79tt44 ZAO72329t2V 294tEa307501 !08965322030 54500
-i_
TEXAS IATER DEVELOPIENT BOARD
RESERVOIR AREA TASIE
FEBRUART 1997 SURVEYHUBBARD €REEK RESERVOIR
AREA IN ACRES
FEET .O . I
aay 22 1997
ELEV.
1 , 1 1 21 , 1 1 3
1 , 1 1 51 , 1 1 61 , 1 1 71 . 1 1 81 , 1 1 91 , 1 ? 0
1 , 1 2 4
1 , 1 2 7r i 1 2 A1 , 1 2 91 , 1 3 01 , 1 3 11 , 1 3 ?1 , 1 3 31,134
1"1361,1371 , 1 3 81 , 1 3 91 " 1 4 0
1 , 1 1 21 , 1 4 3
1 , 1 1 5
1 , 1 4 41 , 1 4 91 , 1 5 01 , 1 t 1
1 , 1 5 31 , 1 5 4
1 , 1 5 61 ,1571 , 1 5 81 ,1591 , 1 6 0
?
25
65a3
1021 2 214216218921'
?84a4z412
624759912
105411911348'1190
16191823197'2116z24A23692494261624233035
3147371739391153439346154a9l5160,11457716104
13
1 5?6585 1
84105124
165192219244249J484195026t9773925
1067120713651505
183919t12129226423422512266128431055327135103710396011n
167019185188544458025138
1
1 72739526A87
107126
167
22125129415542751765I7aa918
1079122013811521169218542006
z27Z2391252526V28633476329635333761l9a0
52175 t 1 558366173
. 3
1I
1 829405470a9
104128148169
254300361135529667800
109112311395153a17091869202121562?442107253926932AA4309715183556378840011220
17?119695215
58696208
l
1 01 9301?557290
1 1 0130150
1992262593053681435416808 1 5
11041Z4A140815541725188320152169229621192554?71429013 1 1 834423577341210?112131195171849955274557659026212
11 t20
1357E9Z
112132152115202?29
t 1 1376151551694811940
1 1 1 81263142115711741189820LA2183230821312564zTza29253 1 1 0336716003834101?12664t20177350215303560759316276
IS ONE. 7
1
22331560n
1 1 6136156180207
270323190
580719863
1 0 1 111161295
16081 m19?7?4752210?33221572599276429693185311736173477404613111570$2150zl5361567260026311
, 9
1
21354a
8 11 0 0120140160186? 1 ?241zn535
487608
4971040117413301175164318081959?10322352157214126a428013011323131613691391441101365162018695 1 3 154235Ba60706115
ELEVAIION INCRE!'IENT
. 5 , 6
.I
32
5875
1141t41541 n201
317383
366707aq
1132127414341589175919'12206221962320
2583274629173162339236233856
12901515
50175332563959676310
'ENIH FOOT
. 8
1
?3
62799A
1 1 81181 5 81832 1 0zts271329397474594
8811026116?1 3 1 1146116261792194320492223231121712614z7a32991320831113670389811081339459548455 1 0 15393,74560366180
APPENDIX D - AREA-ELEVATION-CAPACITY GRAPH
5,000
6E
3.q 7.500
10,000
t.tLttt -
2,500
12,500
360,000
3m,0m
60,000
E
t8o,ooo s
Of
15,0m1 1 11901180113011201 0 117011!o 1150 1160
ELEVATION (FEET)
-r! SURFACE AREA ..x CAPAClry
HUBBARD CREEKRESERVOIR
February 1997 SurveyPrepared by: TWOS May 1997
\ i
\ r
\
c-
IF
z'
j
..
a>
v)rtl
ME
&E
F..1
o0
sz
oo
9z
oo
nL
oo
zLo
oo
40
08
9
oo
99
oo
t9
oo
z9
00
09
oo
g9
oo
99
00
ts
00
29
00
09
oo
at
00
9t
00"t
0o
zf
oo
o?
00
8e
oo
9€
00t8
00
ze
00
0e
00
82
00
92
oo
nz
oo
zzo
oo
zo
oa
t0
09
t
oo
tt
oozL
oo
ot
00
8
oo
9
oot
oo
zo
u b
;:;- Fl ii i- 6
b d
o
I i
I s
= 3
99
I9
P !
! !
s S
F =
= =
(l€a:D NO
IIvAa'Ig
F-
o\I{
E>
(J
tr
zs
..5
>
rqu)IY'I
MF
rr'l o
&e
00
90
2o
o0
0z
00
96
1
oo
o6
L
oo
98
L
00
08
r
00
92
t
00
0t1
oo
99
l
oo
ost
oo
99
lo
oo
9t
o0
stt
oo0 .
00
9€
ro
oo
E t,
oo
9zl,
oo
ozL
00
9l,l,
00
0 ,
00
90
1.
oo
oo
to
o9
6o
oo
60
09
80
00
80
0q
/o
o0
zo
o9
9
00
09
oo
99
oo
09
00
9t
o0
0t
oo
9€
00
0e
00
qz
oo
oz
oo
9l.
00
0t
oo
so
Oee:D
N
oIIvaaTI
ooot0
06
e
00
8e
oo
r.€o
o9
€o
o9
eo
ote
OO
E€
00
zeo
ot€
00
0e
oo
6z
oo
9z
oo
Lz
00
sz
00
92
00tzo
o8
z
00
zzo
0tz
00
02
00
€t
00
sto
0z
t
00
9t
00
9r
oo
tL
oo
€t
00
zlo
oll
oo
ot
oo
6
oo
8
oo
zo
o9
oo
9
00
to
oE
oo
zo
ot
0
c-Ol
:>
z-
J
..
9;
>F]
&rqrt)rrI
rrl 6
Ha
tsFr
n
(TA
E{) NO
IIV
TtrI
t-o\x{
frFz
^
t>
v)rr'l
}4F
rq,B
Et
H
oozto
ot?
ooot0
06
6o
o8
8o
ol.€
oo
9e
oo
98
oot€o
oE
e0
0zE
oo
tSo
oo
€o
o6
z0
08
2o
oL
zo
o9
z0
o9
zoonzo
oS
zo
ozz
00
tz0
00
20
o6
t0
0s
t0
0rt
oo
9t
o0
9t
00
ft0
08
t0
0z
to
otL
oo
0t
oo
€o
0€
00
1.
oo
9o
o9
ooto
oa
oo
zo
ot
0
PP
tr
:!
!F
P9
9P
99
9p
99
S1
.{
+i
-i
-i
-i
-i
-i
-i
-=
==
OE
OJ) NO
IJV
�TT
I
c-o\I3
FF
z'
3
..a
>Ar
F
rr.lT
A\.E
irl d
He
,vo
F1
rn
oo
oz
9o
oo
t9o
oo
o9
oo
o6
to
oo
S?
oo
ozt
oo
ost
oo
o9
?oootto
oo
et
oo
oz?
oo
ott
oo
oo
to
oo
€e
00
08
eo
oo
te0
00
9e
oo
o9
eo
oo
?E
oo
oE
0o
oo
za0
00
te0
00
04
00
08
20
00
82
00
01
20
00
92
00
09
2o
oo
rzo
oo
0z
oo
ozz
oo
0tz
oo
oo
z0
00
61
,o
oo
Sl
oo
ozl
oo
o9
lo
oo
9t
oo
ott
oo
oS
to
oo
zto
oo
Lt
oo
oo
to
oo
6o
oo
Sooo{o
oo
so
oo
So
oo
to
oo
eo
oo
z0
00
to
n F
F N
F
+ t
j j
J 9
I
I9
!
S S
S !
! =
F =
= =
(FE
J] NO
IIVA
ST
I
+\*
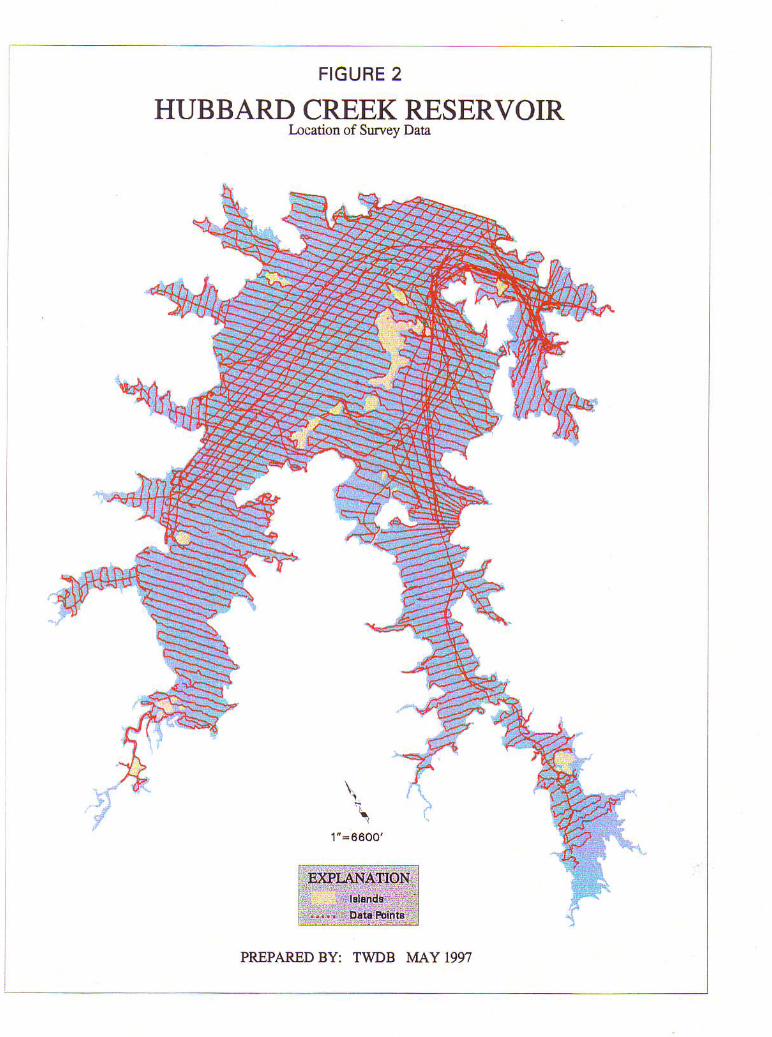
FIGURE 2
HUBBARD CREEK RESERVOIRI-ocatio! of Su.vey Data
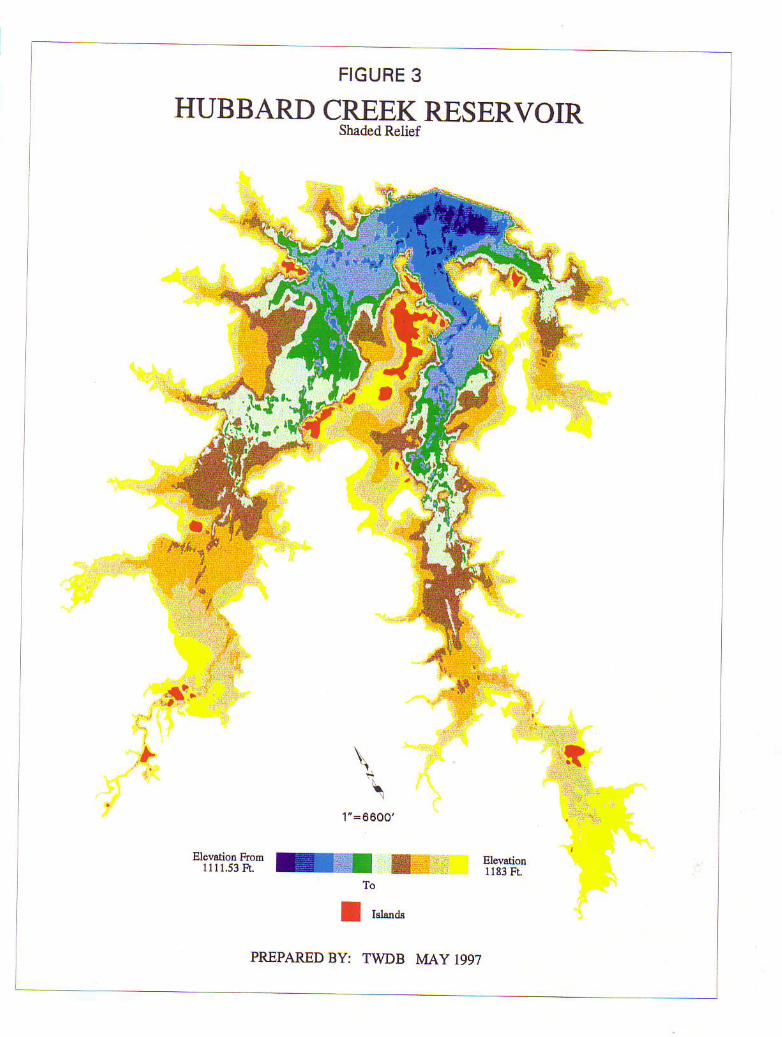
FIGURE 3
HUBBARD CREEK RESERVOIRSbaded Relief
\t\
1 '=860O.
"ifi!:lH'B G3i:s
PREPARED BY: TWDB MAY 199?
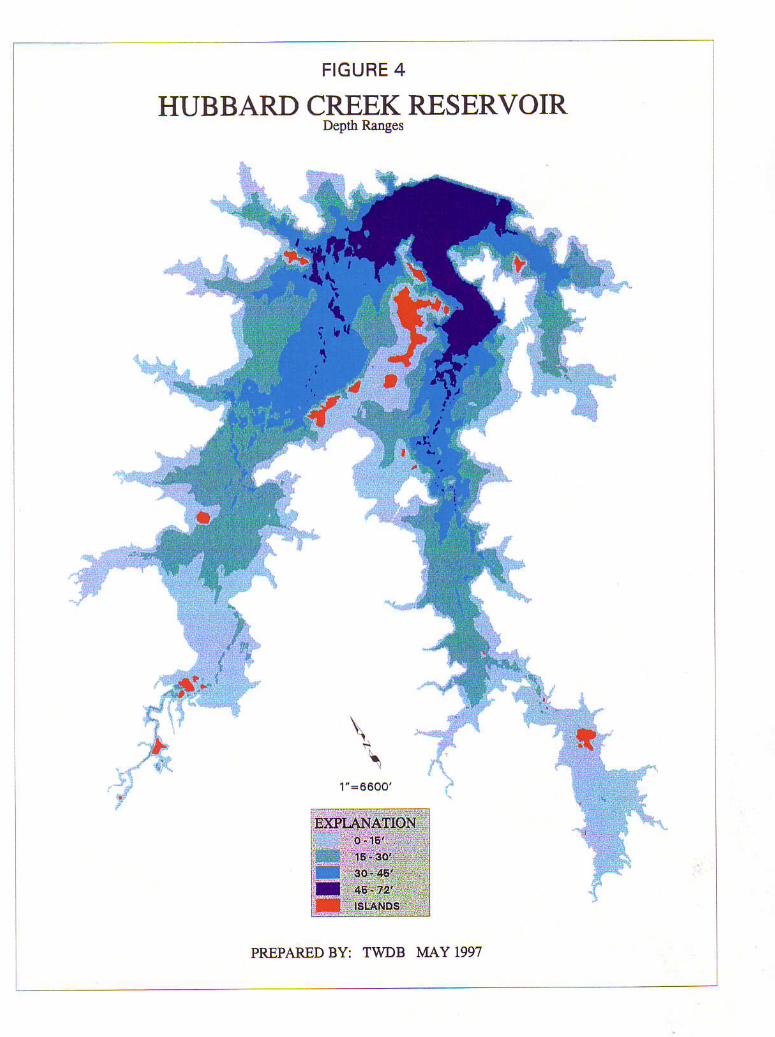
FIGURE 4
HUBBARD CREEK RESERVOIRDepth RaDges
\
1"=0600'
PREPARED BY: MAY 1997
SHACKELFORD ANDSTEPHENS COUNTIES
HUBBARD CREEK RESERVOIRContour Map
PREPARED BY: TEXAS WATER DEVELOPMENT BOARD MAY 1997
EXPLANATION
Islands
10 Foot Contour Lines
5 Foot Contour Lines
Conservation Pool Elev. 1183 Feet
Cross Section Lines
A
A
B
B
C
C
D
D
F
F
E
E


![Guntersville Reservoir Polygon [Converted] Spring Creek Buck Island Area Claysville Area Columbus City Area South Sauty Creek Mink Creek North Sauty Creek Roseberry Creek Polecat Hollow](https://img.pdfslide.us/doc/110x75/5ae3c5a07f8b9a5d648e655d/guntersville-reservoir-polygon-converted-spring-creek-buck-island-area-claysville.jpg)