Embed Size (px)
Citation preview
Proceedings World Geothermal Congress 2015
Melbourne, Australia, 19-25 April 2015
1
Reservoir Characterization Based on Hypocenter Location Analysis and 3-D Seismic
Velocities.
Vega Amazona Muchlis1, Rachmat Sule
2, Andri Dian Nugraha
3, and Yosep Kusnadi
4
1Geothermal Engineering, Faculty of Mining and Petroleum Engineering, Institut Teknologi Bandung
2Applied Geophysical Research Group, Faculty of Mining and Petroleum Engineering, Institut Teknologi Bandung
3Global Geophysical Research Group, Faculty of Mining and Petroleum Engineering, Institut Teknologi Bandung
4Star Energy Geothermal (Wayang Windu) Ltd
Keywords: Geothermal Field, Micro-earthquake, GAD, VELEST, Tomography, Vp, Vs, Vp/Vs ratio, Brine, Reservoir
ABSTRACT
Fluid injection process for hydraulic fracturing was conducted for two months from May 19-July 20, 2005 and was observed using
the Micro-earthquake (MEQ) method. MEQ is a powerful method to assess the effectiveness of hydraulic fracturing treatments and
to image the subsurface by delineating fluid in the reservoir for geothermal reservoir characterization.
A total of 357 events of MEQ waveform data were used for this research from at least 17 installed stations. Initial MEQ locations
were determined using Geiger’s method with Adaptive Damping (GAD) and two-layer 1D velocity models as input. Data were
processed using VELEST’s software for updating event travel time and a 1D velocity model. VELEST’s output was used for input
of travel time tomography application using SIMULPS12’s software. Total data used included 1,173 P-wave and 1,068 S-wave
travel times. The tomographic method was applied to generate an image of the 3-D velocity structure and relocate hypocenters
simultaneously.
Our result show several prominent features: [1] hypocenters formed some clustering scattered, indicated as high permeability area;
[2] strong low Vp anomaly, low Vs anomaly, and low Vp/Vs ratio at an elevation of 500 m above mean sea level (asl) were
interpreted as related to the steam zone in the reservoir; [3] an underlying zone below the lower steam reservoir zone with low Vp,
very low Vs, and high Vp/Vs ratio may be related to pore fluid pressure zone or the brine fluid zone.
Based on the results, we can conclude that the tomographic method can give good information of hypocenter relocation and 3-D
seismic velocity models for geothermal reservoir characterization. A steam zone at an elevation of 500 m above mean sea level
(asl) and a brine zone below can be predicted from travel time tomography implementation.
1. INTRODUCTION
In 2005, fluid injection process for hydraulic fracturing was conducted for two months from May 19-July 20, in a geothermal field.
The process of hydraulic fracturing was conducted to improve the performance of production wells (Mulyadi, 2010). Fluid injection
processes were performed in several injection wells and were monitored using the micro-earthquake (MEQ) method by at least 17
installed stations (Geosystem, 2005).
Seismic data recorded and data processing is expected to provide results that can be interpreted further, to determine accurate
hypocenter positions, and to simultaneously provide a model of seismic wave velocity below the surface in the research area of the
geothermal field. The high quality seismic mapping data of the area can be also used as a base-line for estimating the depth of the
reservoir, i.e., taking into consideration earthquakes under the reservoir zone (Asrizal et al., 2006).
The objective of using tomography in the geothermal field is to contribute imaging, i.e., 3-D velocity, P, S, and Vp/Vs ratio
structure, and monitoring hydraulic fracturing.
2. SEISMIC TOMOGRAPHY
According to Thurber (1993), body waves spreading from the micro-earthquake source to the recorded station are shown using the
theory of wave propagation:
receiver
source
ij dsuT (1)
where u is the slowness (1/velocity) and ds is the wavelength. Observed arrival time is formulated:
ijiij Tt (2)
Muchlis et al.
2
where i
is the origin time of the micro-earthquake source. In seismic tomography, micro-earthquake source coordinates (321 ,, xxx
), origin time, ray path, and slowness are unknown (the model parameters). Known parameters in tomographic inversion include
the receiving station location and the observed arrival time. Residuals of observed data obs
ijT and calculated arrival time calc
ijT are
expressed as:
calc
ij
obs
ijij TTr (3)
In SIMULPS12 (Evans et al., 1994), the calculated arrival time can be determined from equations (1) and (2) using the hypocenter
and origin time, initial velocity model, and ray tracing pseudo-bending method (Um and Thurber, 1987). Residual values can be
related to perturbation of the hypocenter and velocity structure by using a linear approach:
receiver
source
ikkk
ij
ij suxx
Tr
3
1 (4)
3. DATA AND METHODOLOGY
The initial step of this study is to collect and prepare data and other information in the area of research that is needed. The prepared
data consists of waveform, 1D velocity model, and station location data. Observed arrival times are obtained from accurate picking
of the waveform data. Picking was done manually and a total of 357 events were identified. The initial P and S velocity model that
was used consisted of two layers based on trial and error method until reasonable hypocenter positions were found relevant to the
hydraulic fracturing process.
All the prepared data was processed using several methods. The first step was to determine the initial location of micro-earthquake
events by using the Geiger Adaptive Damping method (GAD; Nishi, 2005). Initial positions still have quite large errors because the
processing assumed a two medium layer. The VELEST method (Kissling, 1994) was used to update hypocenter positions and the
initial velocity model. Velocity was updated in many layers (more than two layers). In VELEST, some hypocenters or events were
reduced based on GAP. GAP is the angle between two outermost stations with an event position. If GAP is greater than 180
degrees, it means the event is outside of the seismometer network and the event position is unstable. The event will be reduced. The
fixed hypocenter and updated velocity were used as the inputs for further processing using tomography to obtain 3-D velocity and
an updated hypocenter position simultaneously. The 3-D velocity model can be used for reservoir characterization. The flowchart
for this research process is shown in Figure 1.
Figure 1: Flow Chart of Research. First step was identified event and picked P and S phase of Waveform data. Arrival time
resulting from phase picking was processed using Geiger’s Adaptive Damping (GAD) with 1 D Velocity model. Next
processing step used the Velest method for updating 1D velocity model and reduced event based on GAP.
Tomography method using SIMULPS12 is used for final processing to relocate hypocenters and simultaneously
update the 3D velocity structure Vp, Vs, and Vp/Vs.
4. RESULT AND DISCUSSION
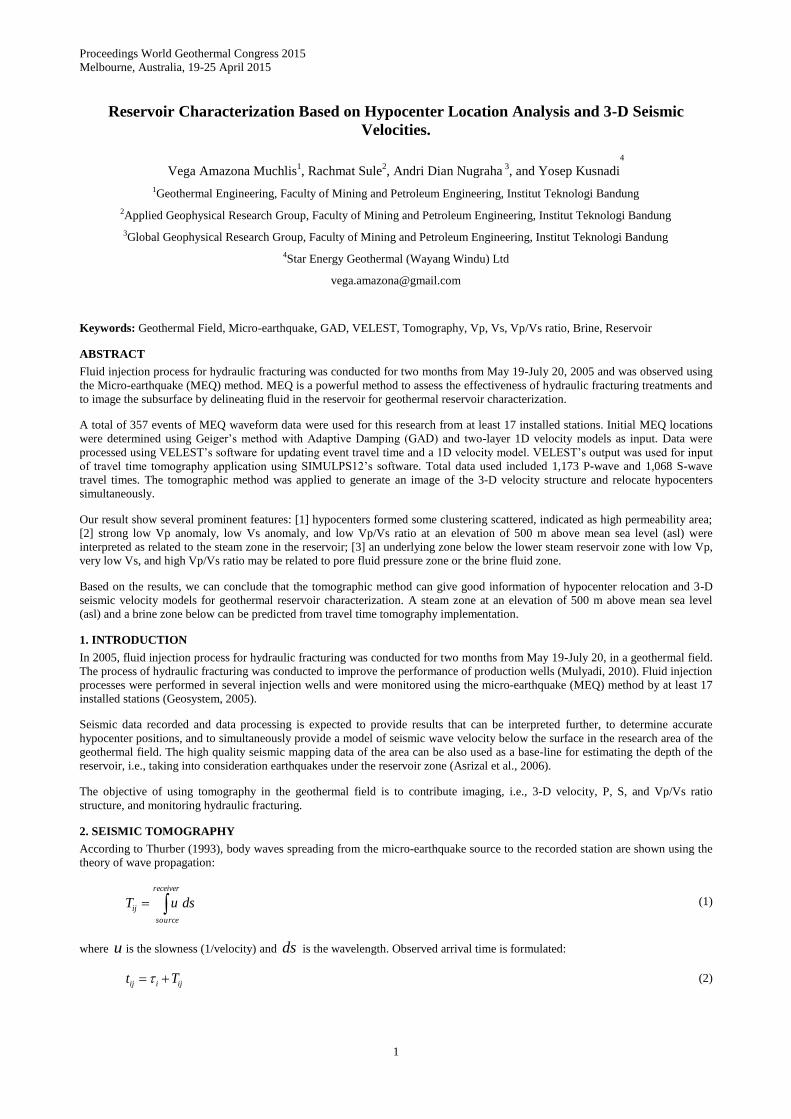
Good seismic response was observed in the “VAM” geothermal field, and it is evident from the hypocenter distribution that there is
some clustering near the injection wells (Figure 2).
Muchlis et al.
3
Figure 2: Hypocenter distribution identified using Geiger’s Method with Adaptive Damping (GAD). Plan view map and
cross sections (AA’ and BB’) depict station positions, injection well locations, and hypocenter distribution. Stations
are shown by red upside down triangles, hypocenter distributions are shown by green circles and well trajectories
are shown by black lines. 357 events were used in GAD processing method. The events were reduced until 303 events
based on the event position, which are called air-quake events.
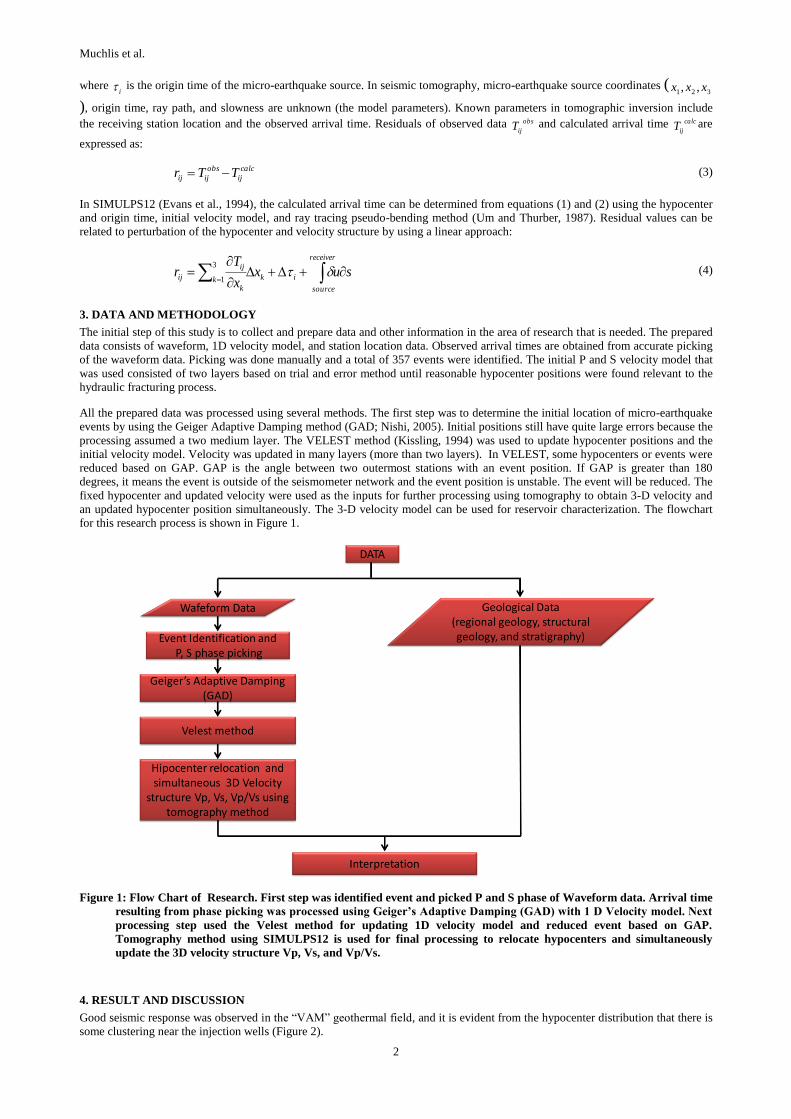
In the VELEST step, events which have GAP>180 degrees are indicated outside of the seismometer network and will be reduced.
The number of remaining events from GAP<180 degrees were 1,173 P-wave and 1,068 S-wave arrival time phases and these events
were included in the tomography method processing. Using this method, velocities were also updated several times until they
achieved stable values, which were interpreted to be closest to the real condition (Figure 3).
Figure 3: Events reduced based on GAP>180 degrees by Using Velest Method, which indicates the event is outside the
network of seismometers and not included in tomography methods processing. Reduced events marked by purple
circles (right) and the green circles are the events (left). The number of remaining events from GAP<180 degrees
were 1,173 P-wave and 1,068 S-wave arrival time phases. Using this method, the velocities were updated several
times until they achieved stable values which were interpreted as being closest to the real conditions. Updated
velocities in some layers and hypocenter positions were used as inputs for the tomography process.
Figure 4 depicts horizontal depth-section tomograms of Vp, Vs, and Vp/Vs at elevations of 1 to 0.5 km asl, msl, and 0.5 km bsl. In
the resulting 3D velocity model, we observe low anomaly Vp, strong low anomaly Vs, and high anomaly Vp/Vs ratio at an
elevation of 1 km asl (above sea level). These features can be interpreted as a zone that contains a lot of water. The layer containing
a lot of water in the geothermal field is interpreted to be an alteration zone that contains OH-, in essence a clay-rich zone.
At an elevation of 0.5 km above sea level, the combination of strong low anomaly Vp, low anomaly Vs, and low anomaly Vp/Vs
ratio is interpreted as a steam zone (based on previous study; Gunasekera, 2003) . This similar condition is still found to persist at
mean sea level. Below this steam zone, we observe low anomaly Vp, strong low Vs, and high anomaly Vp/Vs ratio, which are
interpreted as brine zone at an elevation of 0.5 km below sea level (bsl). This anomaly is stronger and greater until an elevation of
1.0 km below sea level (bsl) and we can suspect the brine zone persists down to the bottom of the reservoir (based on previous
study; Gunasekera, 2003).
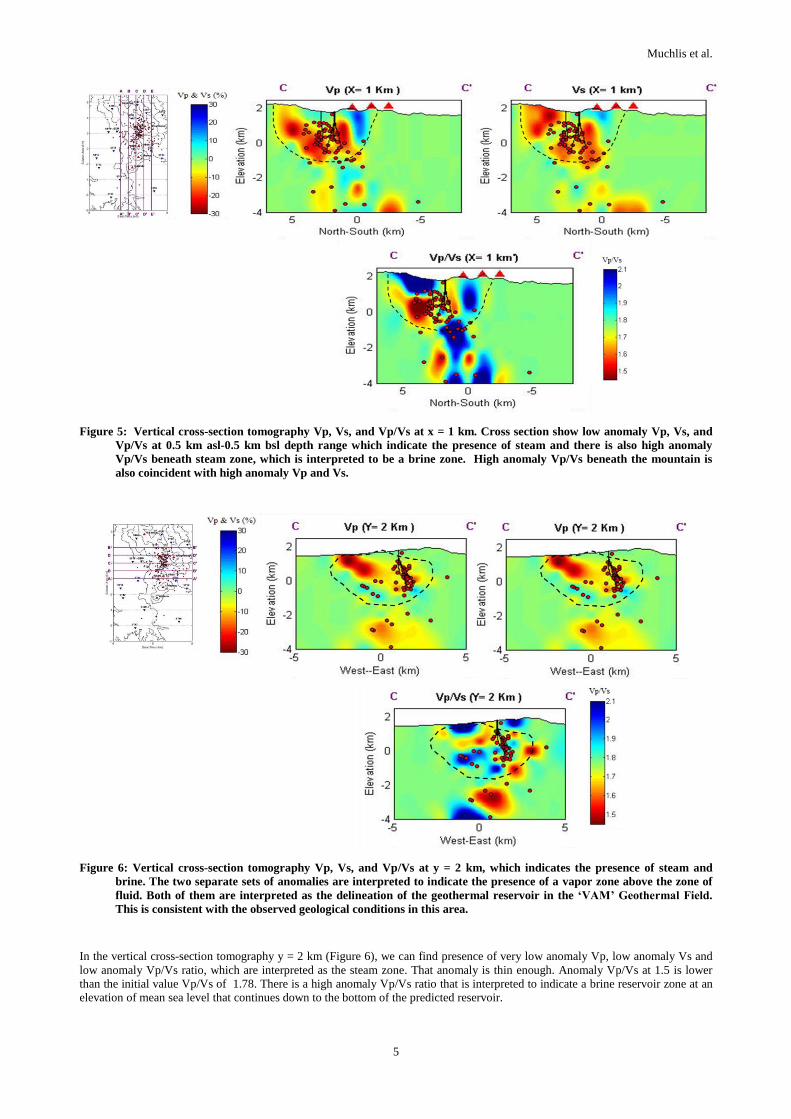
For vertical cross-section tomography, we choose a vertical cross section that intersects the x-axis = 1 km and y-axis = 2 km, which
is the most representative of the “VAM” geothermal field. Vertical cross-section tomography at x = 1 km shows us very low
anomaly Vp, low anomaly Vs, and low anomaly Vp/Vs ratio at an elevation of 500 m above mean sea level until mean sea level.
From previous study, we can confirm that the low Vp/Vs ratio may be related to the steam reservoir zone. There is also an
anomalously high Vp/Vs ratio that indicates the presence of brine. At the other side, there are also the same anomaly, i.e. high
anomaly Vp/Vs, beneath the mountain that is also associated with high Vp and Vs (Figure 5).

Muchlis et al.
4
Figure 4: Horizontal depth-section tomograms Vp, Vs, Vp/Vs at elevations of 1 to 0.5 km asl, msl, and 0.5 km bsl. Red
triangles show location of mountains in “VAM” Geothermal Field. The figures show us very low Vp anomaly, low Vs
anomaly, and low Vp/Vs ratio at elevations of 500 m above mean sea level down to mean sea level, and from previous
study, we can confirm that the low Vp/Vs ratio may be related to the steam reservoir zone. In addition, there is a
feature underlying the broad steam reservoir zone with low Vp, very low Vs and high Vp/Vs and from previous
study, we can confirm that the high Vp/Vs ratio may be related to pore fluid pressure zone reflecting the presence of
brine.
Muchlis et al.
5
Figure 5: Vertical cross-section tomography Vp, Vs, and Vp/Vs at x = 1 km. Cross section show low anomaly Vp, Vs, and
Vp/Vs at 0.5 km asl-0.5 km bsl depth range which indicate the presence of steam and there is also high anomaly
Vp/Vs beneath steam zone, which is interpreted to be a brine zone. High anomaly Vp/Vs beneath the mountain is
also coincident with high anomaly Vp and Vs.
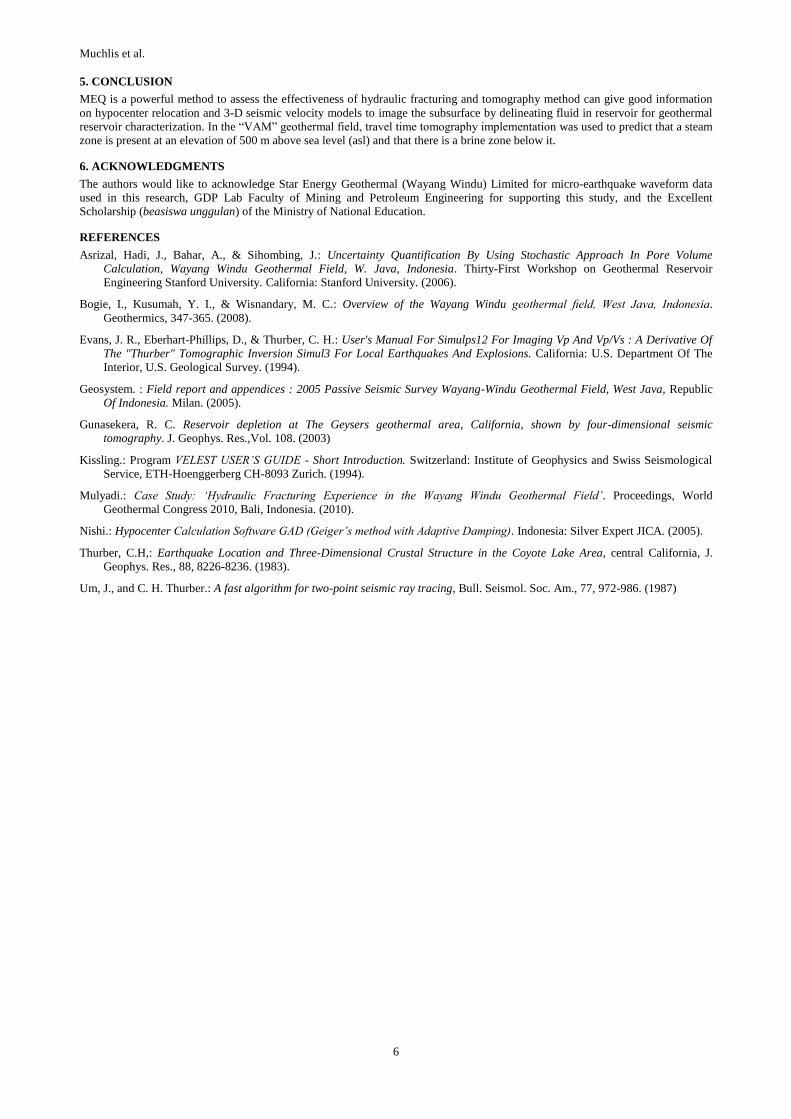
Figure 6: Vertical cross-section tomography Vp, Vs, and Vp/Vs at y = 2 km, which indicates the presence of steam and
brine. The two separate sets of anomalies are interpreted to indicate the presence of a vapor zone above the zone of
fluid. Both of them are interpreted as the delineation of the geothermal reservoir in the ‘VAM’ Geothermal Field.
This is consistent with the observed geological conditions in this area.
In the vertical cross-section tomography y = 2 km (Figure 6), we can find presence of very low anomaly Vp, low anomaly Vs and
low anomaly Vp/Vs ratio, which are interpreted as the steam zone. That anomaly is thin enough. Anomaly Vp/Vs at 1.5 is lower
than the initial value Vp/Vs of 1.78. There is a high anomaly Vp/Vs ratio that is interpreted to indicate a brine reservoir zone at an
elevation of mean sea level that continues down to the bottom of the predicted reservoir.
Muchlis et al.
6
5. CONCLUSION
MEQ is a powerful method to assess the effectiveness of hydraulic fracturing and tomography method can give good information
on hypocenter relocation and 3-D seismic velocity models to image the subsurface by delineating fluid in reservoir for geothermal
reservoir characterization. In the “VAM” geothermal field, travel time tomography implementation was used to predict that a steam
zone is present at an elevation of 500 m above sea level (asl) and that there is a brine zone below it.
6. ACKNOWLEDGMENTS
The authors would like to acknowledge Star Energy Geothermal (Wayang Windu) Limited for micro-earthquake waveform data
used in this research, GDP Lab Faculty of Mining and Petroleum Engineering for supporting this study, and the Excellent
Scholarship (beasiswa unggulan) of the Ministry of National Education.
REFERENCES
Asrizal, Hadi, J., Bahar, A., & Sihombing, J.: Uncertainty Quantification By Using Stochastic Approach In Pore Volume
Calculation, Wayang Windu Geothermal Field, W. Java, Indonesia. Thirty-First Workshop on Geothermal Reservoir
Engineering Stanford University. California: Stanford University. (2006).
Bogie, I., Kusumah, Y. I., & Wisnandary, M. C.: Overview of the Wayang Windu geothermal field, West Java, Indonesia.
Geothermics, 347-365. (2008).
Evans, J. R., Eberhart-Phillips, D., & Thurber, C. H.: User's Manual For Simulps12 For Imaging Vp And Vp/Vs : A Derivative Of
The "Thurber" Tomographic Inversion Simul3 For Local Earthquakes And Explosions. California: U.S. Department Of The
Interior, U.S. Geological Survey. (1994).
Geosystem. : Field report and appendices : 2005 Passive Seismic Survey Wayang-Windu Geothermal Field, West Java, Republic
Of Indonesia. Milan. (2005).
Gunasekera, R. C. Reservoir depletion at The Geysers geothermal area, California, shown by four-dimensional seismic
tomography. J. Geophys. Res.,Vol. 108. (2003)
Kissling.: Program VELEST USER’S GUIDE - Short Introduction. Switzerland: Institute of Geophysics and Swiss Seismological
Service, ETH-Hoenggerberg CH-8093 Zurich. (1994).
Mulyadi.: Case Study: ‘Hydraulic Fracturing Experience in the Wayang Windu Geothermal Field’. Proceedings, World
Geothermal Congress 2010, Bali, Indonesia. (2010).
Nishi.: Hypocenter Calculation Software GAD (Geiger’s method with Adaptive Damping). Indonesia: Silver Expert JICA. (2005).
Thurber, C.H,: Earthquake Location and Three-Dimensional Crustal Structure in the Coyote Lake Area, central California, J.
Geophys. Res., 88, 8226-8236. (1983).
Um, J., and C. H. Thurber.: A fast algorithm for two-point seismic ray tracing, Bull. Seismol. Soc. Am., 77, 972-986. (1987)