Embed Size (px)
Citation preview
RESEARCH ARTICLE
Reserve size and anthropogenic disturbance
affect the density of an African leopard
(Panthera pardus) meta-population
Rasmus Worsøe HavmøllerID1,2,3☯*, Simone Tenan4☯, Nikolaj Scharff1,
Francesco Rovero5,6☯
1 Center for Macroecology, Evolution and Climate, Natural History Museum of Denmark, University of
Copenhagen, Copenhagen, Denmark, 2 Section for Evolutionary Genomics, Natural History Museum of
Denmark, University of Copenhagen, Copenhagen, Denmark, 3 Department of Anthropology, University of
California, Davis, Davis, United States of America, 4 Vertebrate Zoology Section, MUSE-Museo delle
Scienze, Trento, Italy, 5 Tropical Biodiversity Section, MUSE-Museo delle Scienze, Trento, Italy,
6 Department of Biology, University of Florence, Sesto Fiorentino, Italy
☯ These authors contributed equally to this work.
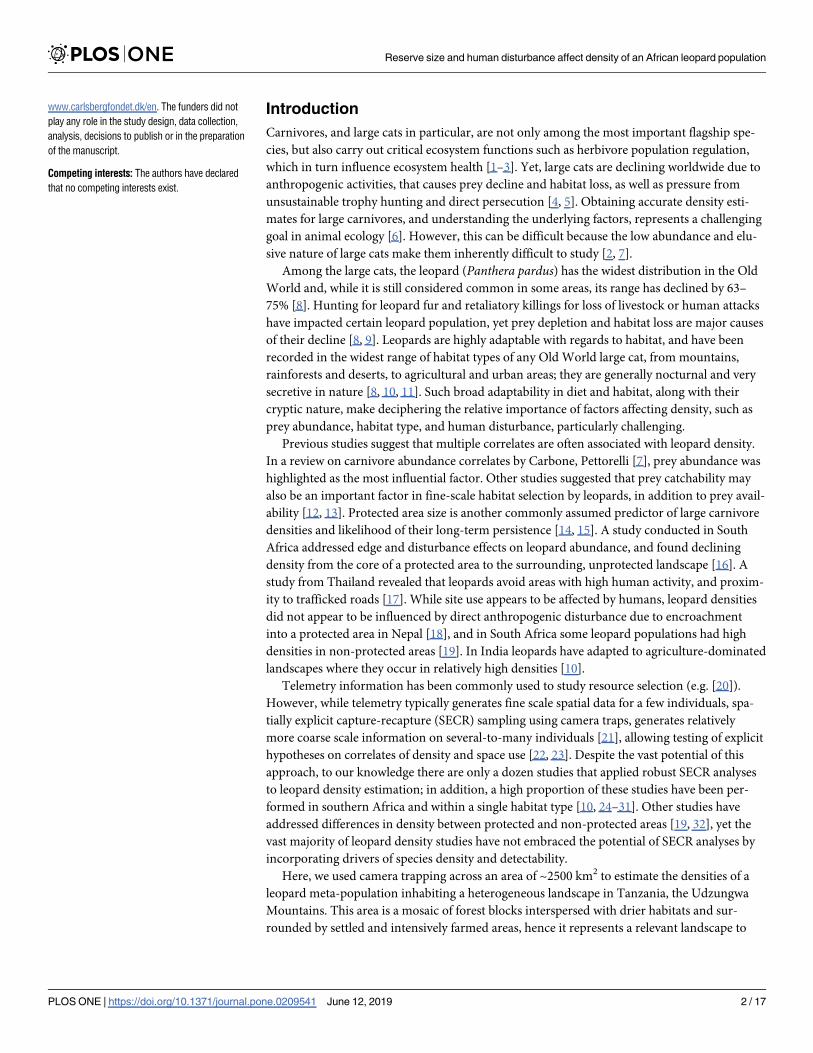
Abstract
Determining correlates of density for large carnivores is important to understand their eco-
logical requirements and develop conservation strategies. Of several earlier density studies
conducted globally, relatively few addressed a scale (usually >1000 km2) that allows infer-
ence on correlates of density over heterogeneous landscapes. We deployed 164 camera
trap stations covering ~2500 km2 across five areas characterized by broadly different vege-
tation cover in the Udzungwa Mountains, Tanzania, to investigate correlates of density for a
widespread and adaptable carnivore, the leopard (Panthera pardus). We modelled data in a
spatially explicit capture-recapture framework, with both biotic and abiotic covariates
hypothesised to influence density. We found that leopard density increased with distance to
protected area boundary (mean±SE estimated effect = 0.44±0.20), a proxy for both pro-
tected area extent and distance from surrounding human settlements. We estimated mean
density at 4.22 leopards/100 km2 (85% CI = 3.33–5.35/100 km2), with no variation across
habitat types. Results indicate that protected area extent and anthropogenic disturbance
limit leopard populations whereas no support was found for prey availability and trap array
as drivers of leopard density. Such vulnerability is relevant to the conservation of the leop-
ard, which is generally considered more resilient to human disturbance than other large
cats. Our findings support the notion that protected areas are important to preserve viable
population of leopards, increasingly so in times of unprecedented habitat fragmentation.
Protection of buffer zones smoothing the abrupt impact of human activities at reserve edges
also appears of critical conservation relevance.
PLOS ONE | https://doi.org/10.1371/journal.pone.0209541 June 12, 2019 1 / 17
a1111111111
a1111111111
a1111111111
a1111111111
a1111111111
OPEN ACCESS
Citation: Havmøller RW, Tenan S, Scharff N,
Rovero F (2019) Reserve size and anthropogenic
disturbance affect the density of an African leopard
(Panthera pardus) meta-population. PLoS ONE 14
(6): e0209541. https://doi.org/10.1371/journal.
pone.0209541
Editor: Andrew J. Hoskins, CSIRO Townsville
Australian Tropical Sciences and Innovation
Precinct, AUSTRALIA
Received: December 3, 2018
Accepted: May 22, 2019
Published: June 12, 2019
Copyright: © 2019 Havmøller et al. This is an open
access article distributed under the terms of the
Creative Commons Attribution License, which
permits unrestricted use, distribution, and
reproduction in any medium, provided the original
author and source are credited.
Data Availability Statement: All relevant data are
within the manuscript, Supporting Information
files, and on Figshare (DOI: 10.6084/m9.figshare.
8187416).
Funding: Support was provided by the Danish
National Research Foundation for funding for the
Center for Macroecology, Evolution and Climate
(grant no. DNRF96) to NS and RWH, https://dg.dk.
RWH is currently supported by the Carlsberg
Foundation (CF16-0310 & CF17-0539), http://
Introduction
Carnivores, and large cats in particular, are not only among the most important flagship spe-
cies, but also carry out critical ecosystem functions such as herbivore population regulation,
which in turn influence ecosystem health [1–3]. Yet, large cats are declining worldwide due to
anthropogenic activities, that causes prey decline and habitat loss, as well as pressure from
unsustainable trophy hunting and direct persecution [4, 5]. Obtaining accurate density esti-
mates for large carnivores, and understanding the underlying factors, represents a challenging
goal in animal ecology [6]. However, this can be difficult because the low abundance and elu-
sive nature of large cats make them inherently difficult to study [2, 7].
Among the large cats, the leopard (Panthera pardus) has the widest distribution in the Old
World and, while it is still considered common in some areas, its range has declined by 63–
75% [8]. Hunting for leopard fur and retaliatory killings for loss of livestock or human attacks
have impacted certain leopard population, yet prey depletion and habitat loss are major causes
of their decline [8, 9]. Leopards are highly adaptable with regards to habitat, and have been
recorded in the widest range of habitat types of any Old World large cat, from mountains,
rainforests and deserts, to agricultural and urban areas; they are generally nocturnal and very
secretive in nature [8, 10, 11]. Such broad adaptability in diet and habitat, along with their
cryptic nature, make deciphering the relative importance of factors affecting density, such as
prey abundance, habitat type, and human disturbance, particularly challenging.
Previous studies suggest that multiple correlates are often associated with leopard density.
In a review on carnivore abundance correlates by Carbone, Pettorelli [7], prey abundance was
highlighted as the most influential factor. Other studies suggested that prey catchability may
also be an important factor in fine-scale habitat selection by leopards, in addition to prey avail-
ability [12, 13]. Protected area size is another commonly assumed predictor of large carnivore
densities and likelihood of their long-term persistence [14, 15]. A study conducted in South
Africa addressed edge and disturbance effects on leopard abundance, and found declining
density from the core of a protected area to the surrounding, unprotected landscape [16]. A
study from Thailand revealed that leopards avoid areas with high human activity, and proxim-
ity to trafficked roads [17]. While site use appears to be affected by humans, leopard densities
did not appear to be influenced by direct anthropogenic disturbance due to encroachment
into a protected area in Nepal [18], and in South Africa some leopard populations had high
densities in non-protected areas [19]. In India leopards have adapted to agriculture-dominated
landscapes where they occur in relatively high densities [10].
Telemetry information has been commonly used to study resource selection (e.g. [20]).
However, while telemetry typically generates fine scale spatial data for a few individuals, spa-
tially explicit capture-recapture (SECR) sampling using camera traps, generates relatively
more coarse scale information on several-to-many individuals [21], allowing testing of explicit
hypotheses on correlates of density and space use [22, 23]. Despite the vast potential of this
approach, to our knowledge there are only a dozen studies that applied robust SECR analyses
to leopard density estimation; in addition, a high proportion of these studies have been per-
formed in southern Africa and within a single habitat type [10, 24–31]. Other studies have
addressed differences in density between protected and non-protected areas [19, 32], yet the
vast majority of leopard density studies have not embraced the potential of SECR analyses by
incorporating drivers of species density and detectability.
Here, we used camera trapping across an area of ~2500 km2 to estimate the densities of a
leopard meta-population inhabiting a heterogeneous landscape in Tanzania, the Udzungwa
Mountains. This area is a mosaic of forest blocks interspersed with drier habitats and sur-
rounded by settled and intensively farmed areas, hence it represents a relevant landscape to
Reserve size and human disturbance affect density of an African leopard population
PLOS ONE | https://doi.org/10.1371/journal.pone.0209541 June 12, 2019 2 / 17
www.carlsbergfondet.dk/en. The funders did not
play any role in the study design, data collection,
analysis, decisions to publish or in the preparation
of the manuscript.
Competing interests: The authors have declared
that no competing interests exist.
study factors affecting leopard density. We used a stratified population model in a spatially-
explicit capture-mark-recapture framework [33] to test hypotheses on natural and anthropo-
genic factors driving leopard density at the landscape level. Specifically, we aimed to determine
the effects of habitat type, prey availability, distance to water source, sex and distance to pro-
tected area boundary on leopard density.
Material and methods
Ethics statement
Data collection consisted of non-invasive, remotely set camera traps and did not involve direct
contact or interaction with the animals. This research was conducted under research permit
numbers 2013-274-NA-2013-111 and 2014-137-ER-2013-111, issued to RWH by the Tanzania
Commission for Science and Technology (COSTECH).
Study area
The Udzungwa Mountains of south-central Tanzania (centred on 7◦46’ S, 36◦43’ E; elevation
285–2600 m asl, 16,000 km2) are part of the Eastern Arc Mountains, a renowned biodiversity
hotspot [34, 35]. The Udzungwas consist of closed forest blocks interspersed with drier habi-
tats [36]. It is surrounded by subsistence farming to the north, west and south, and high inten-
sity sugar cane farming to the east, without natural connectivity to other adjacent protected
areas [37]. Within Africa, the area is known for its outstanding levels of mammalian richness
and endemism [34, 38].
The northern portion of the Udzungwas is protected by the Udzungwa Mountains National
Park (UMNP; 1990 km2), where patrolling rangers and remote ranger stations ensure effective
ground protection. The UMNP is connected to the south and west by the Kilombero Nature
Reserve (1345 km2) administered by Tanzania Forest Service, and receives less in situ protec-
tion. A strip of intense agriculture, in some places just ~5 km wide, separates the UMNP from
the Selous Game Reserve to the east (Fig 1).
As the Udzungwa Mountains consists of a mosaic of habitats with different vegetation
cover types [36, 39], we placed camera trap arrays in five areas to sample a representative varia-
tion of habitat type (Fig 1; S1 Table): (1) Lowland Afrotropical rainforest in the southern
UMNP (300–800 m). (2) Dry grassy Acacia-Commiphora woodlands in the northern UMNP,
buffered by dry baobab woodlands at low elevation and grasslands at high elevation (500–1900
m). (3) Grassy Miombo woodlands in the central valleys of the UMNP (300–500 m). (4) Ndun-
dulu forest, a block of Afromontane forest west of UMNP in the Kilombero Nature Reserve
(1400–2200 m). (5) Mwanihana forest, a rainforest escarpment in the eastern part of UMNP
(300–2100 m).
Camera trapping
We deployed six camera trap arrays covering a total of ~2500 km2 in the five areas. Each array
consisted of 25–34 pairs of traps (Fig 1) and was surveyed one time each. We sampled in the
dry season from August to December 2013 and from June to December 2014. Each station of
paired traps operated for an average of 31 days (minimum 12, maximum 49 days; S1 Table).
Camera traps were set following a protocol designed for studying leopards in African forests
[40]. The average trap spacing was 1.6 km, following a regular spaced grid placed randomly
over the study sites, ensuring a sampling grid tight enough to recapture females (with pre-
sumed smaller home-ranges than males) in multiple camera traps, while still encompassing an
area large enough for a male leopard home-range [40]. Mean edge distance between camera
Reserve size and human disturbance affect density of an African leopard population
PLOS ONE | https://doi.org/10.1371/journal.pone.0209541 June 12, 2019 3 / 17
trapping grids was 22.8 km (minimum edge distance 5 km, maximum edge distance 49 km).
At each camera trap site, the paired cameras were placed 3–4 m from the centre of an animal
trail or track, facing each other at 30–40 cm above ground level. At least one camera-trap per
station had a white Xenon flash Cuddeback Ambush (Cuddeback Non Typical Inc., Istanti, WI,
USA) and in 87 of 164 stations, the second camera consisted of an infrared camera UOVision
565HD IR+ (UOVision Technology, Shenzhen, China) set on 15-second video recording mode.
Leopards were identified by their unique spot-patterns across their body [41] and presence/
absence of external genitalia by two independent observers (RWH and FR). Only individuals
deemed adult from their body-size and consistently captured alone were used for subsequent
analyses, to avoid non-independence of individual activity centres, e.g. juveniles [22, 23]. For
leopards that could only be identified from one flank, gender was used as distinguishing fea-
ture from captures of other leopards captured only from the opposite flank of opposite sex.
Covariates of leopard density
To model leopard density, we derived the following set of covariates across the areas covered
by the six trap arrays. We first used Landsat 7 TM and ETM+ satellite imagery to derive at 500
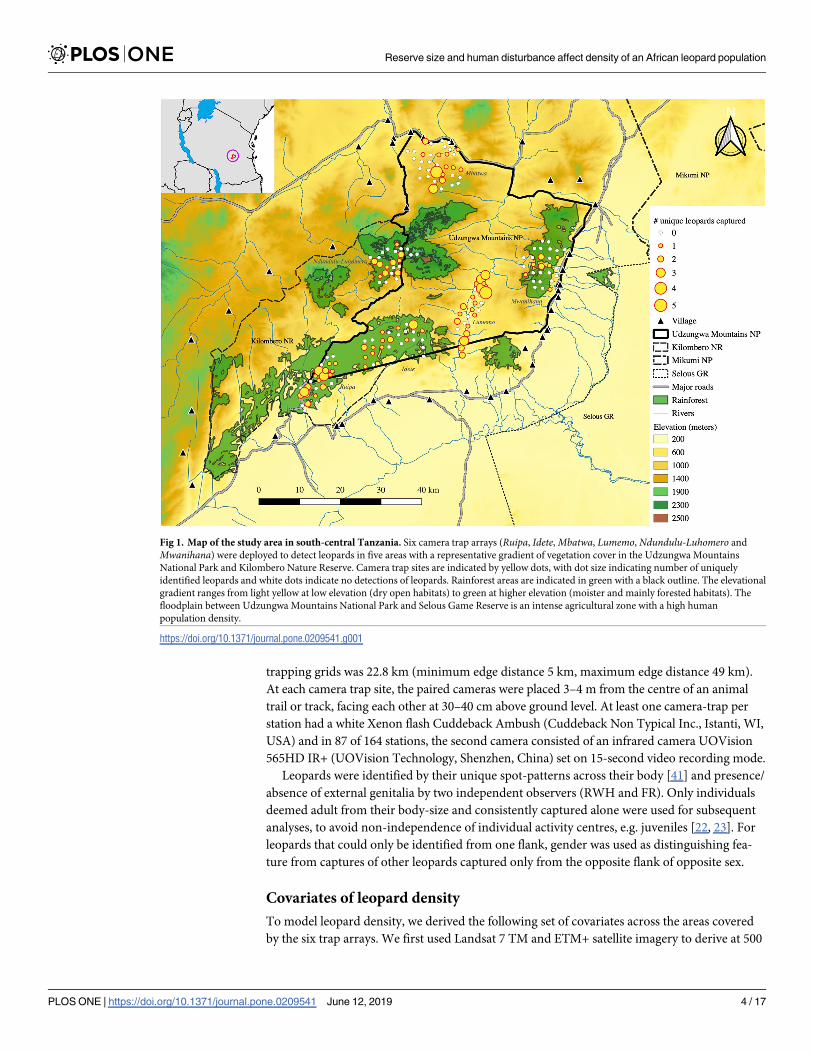
Fig 1. Map of the study area in south-central Tanzania. Six camera trap arrays (Ruipa, Idete, Mbatwa, Lumemo, Ndundulu-Luhomero and
Mwanihana) were deployed to detect leopards in five areas with a representative gradient of vegetation cover in the Udzungwa Mountains
National Park and Kilombero Nature Reserve. Camera trap sites are indicated by yellow dots, with dot size indicating number of uniquely
identified leopards and white dots indicate no detections of leopards. Rainforest areas are indicated in green with a black outline. The elevational
gradient ranges from light yellow at low elevation (dry open habitats) to green at higher elevation (moister and mainly forested habitats). The
floodplain between Udzungwa Mountains National Park and Selous Game Reserve is an intense agricultural zone with a high human
population density.
https://doi.org/10.1371/journal.pone.0209541.g001
Reserve size and human disturbance affect density of an African leopard population
PLOS ONE | https://doi.org/10.1371/journal.pone.0209541 June 12, 2019 4 / 17
m resolution (1) distance from each camera trap station to the nearest river, (2) distance to the
nearest protected area boundary (national park or nature reserve depending on arrays, see Fig
1). Elevation (3) was recorded at each camera trap site using a Garmin GPSMAP 64sc (Olathe,
Kansas, USA). Distance to protected area boundary correlated positively (r = 0.65) with dis-
tance to the nearest human settlement from each camera trap, thus to avoid collinearity we
only used distance to reserve border and considered it a proxy of both anthropogenic distur-
bance and extent of protected area. The 500 m resolution chosen for the covariates corre-
sponds to the resolution of the state-space adopted in the spatially explicit capture-recapture
models (see below), which we defined after testing a range of resolution values that yielded sta-
ble parameter estimates and reasonable computational time. We also derived (4) an index of
probability of leopard encounter with prey similar to Everatt, Andresen [42] as the array-spe-
cific mean estimated occupancy probability of 18 ground dwelling mammals detected by the
camera traps [43]. These species were assumed to be potential leopard prey based on dietary
studies [44]. In addition, 12 of these species were confirmed to be leopard prey in Udzungwa
through DNA analysis of leopard scats ([43]; S2 Table). We estimated mean and array-specific
site use probabilities (S3 Table) for the pool of potential prey by fitting a multi-species occu-
pancy model [45] to prey species’ detection/non-detection data. This modelling approach
accounts for imperfect detection and solves the ambiguity between species absence and non-
detection. We therefore considered occupancy a better state variable for prey abundance than
a crude index of captures, as this likely underestimates true abundance due to false negatives
[46]. In addition, as we set camera traps to target leopards, detectability of other mammals
across sites may vary largely among species, likely resulting in variably biased detection rates;
hence we considered it especially critical to use a state variable of prey encounter that is cor-
rected by detectability [47]. We designed our community occupancy model to estimate array-
specific mean occupancy values for the pool of prey species, as we assumed that the different
habitat types sampled by arrays represent a relevant correlate of variation in the ‘abundance’ of
prey species across the study area. However, given that we only had information on prey spe-
cies at camera trap sites, we could not realistically model prey occupancy across the state-
space. Specifically, we modelled the presence/absence zi,j of species i at sites j as a Bernoulli
trial with array-specific (a) occupancy probability ψi,a(j): zi,j ~ Bern(ψi,a(j)). We constrained the
species-specific parameters (i.e., the heterogeneity in occupancy and detection probability) by
the assumption of a common normal prior distribution for their logits [48]. For occupancy, we
considered an array-specific hyperparameter: logit(ψi,a(j)) = βi,a with βi,a ~ Normal(μψ,a, σψ),where μψ,a is the mean (community) occupancy of prey species in each array, and σψ is the
standard deviation. We organized daily detections into a species by sites matrix, with elements
yi,j, and modelled detections as yi,j ~ Bin(kj, pi,j�zi,j) where kj are the sampling occasions per site
and pi,j is the detection probability. As we were not interested in modelling array-specific
detectability, we modelled detection probability as logit(pi,j) = αi with αi ~ Normal(μp, σp),where μp is the mean (community) detectability of prey species and σp is the standard devia-
tion. We fitted the model using a Bayesian formulation, the Markov chain Monte Carlo, imple-
mented using the program JAGS [49] and executed from R [50]. The model code is provided
in S1 Appendix. Finally, given that leopard density associated significantly with the distance to
reserve border (see Results), we also controlled whether our prey encounter index may also be
associated with this variable, hence potentially confounding the interpretation of effects on
leopard density. We therefore ran a second prey occupancy model where the linear predictor
for occupancy included an effect of distance to reserve border on array-specific prey site use.
Prey site use was found not to be significantly associated with distance to reserve border, there-
fore we exclude that this effect may also be related to collinear variation in prey site use (see
also Discussion).
Reserve size and human disturbance affect density of an African leopard population
PLOS ONE | https://doi.org/10.1371/journal.pone.0209541 June 12, 2019 5 / 17
Leopard density estimation
We used spatial capture-recapture (SECR) models [22, 23] to account for animal movement in
density estimation, regarding array-specific data as samples of independent populations. This
assumption is supported by the absence of individuals recorded in more than one trap array.
SECR models allow study of the distribution of individuals (i.e. density) while accounting for
encounter probability (p) that declines with distance between an individual activity centre (s)
and a detector (j). We used a half-normal encounter model where detectability p is a function
of the baseline encounter probability (p0) and the spatial scale parameter (σ), which determines
how encounter probability decreases with an increase in the distance between trap j and activ-
ity centre si.
Both homogeneous and inhomogeneous point process models were fitted to study the dis-
tribution of individual activity centres within a defined state-space S, depending on the
absence or presence, respectively, of spatially explicit covariates on density. We fitted a strati-
fied population model [22, 23] to data grouped by trap array, where array-specific population
size was assumed as Nr ~ Poisson(Λr), where Λr is the expected number of activity centres in
the state-space, or region, surrounding array r, with r = 1, . . ., R = 6. We investigated the effects
of covariates (‘COV’, see previous section for details) on leopard density and detectability by
testing different hypotheses. First, we defined the best structure of the encounter model by
assessing the effect of the following covariates on the baseline encounter probability (p0): (i)
trap array, as a proxy of habitat type and seasonality (i.e. temporal variation in sampling), (ii)
distance of trap j to the nearest river, (iii) distance to reserve boundary, (iv) camera trap type
and (v) sex, for testing the effect of different probabilities of detections of males and females.
The same covariates, with the additional array-specific effect of prey encounters, along with
sex, which has been found to produces better estimates of density due to differences in home-
ranges sizes [51], were used as competing predictors for modelling the scale parameter (σ).
The general formulation of the linear predictors for two parameters of the encounter model,
for individual i in trap j of array r, was as follows:
logitðp0;jrÞ ¼ a0 þ aCOVCOVjr ð1Þ
logðsjrÞ ¼ d0 þ dCOVCOVjr: ð2Þ
Competing encounter models based on plausible combination of different covariates
(‘COV’).
Specifically, we expected encounter rate to decline (i) with increasing distance to rivers, as
waterways are frequently used as travelling routes and foraging areas [52, 53], and (ii) with
increasing distance to reserve boundary, in relation to possible behavioural effects induced by
an increase of anthropogenic disturbance close to the reserve boundary [13, 54]. We also
expected leopards to move less (thus having smaller home range size), in dense versus open
habitats, as the species has been found to prefer dense habitat for hunting and thus would have
to travel smaller distances in search of optimal hunting grounds [13]. In addition, we expected
leopard space usage to be (i) positively correlated with distance to the nearest river, as rivers
may represent good hunting grounds [53], and (ii) positively correlated with distance from
reserve boundary, where anthropogenic disturbance is higher.
We were interested in modelling density as a function of spatially-varying covariates and
used a discrete representation of the state space with the centre points of each pixel g(r) (with g
(r) = 1, . . ., Gr) in the state-space (region) surrounding trap array (r). The expected number of
activity centres in the state-space surrounding trap array (r) was modelled in relation to (i) ele-
vation, (ii) distance to the nearest river, (iii) distance to reserve boundary, (iv) prey encounter
Reserve size and human disturbance affect density of an African leopard population
PLOS ONE | https://doi.org/10.1371/journal.pone.0209541 June 12, 2019 6 / 17
index (occupancy probability of prey community; S3 Table), (v) trap array, and (vi) sex (S1
Table). Distance to river was intended as a proxy to major traveling routes used by leopards
[52, 53]. In addition, it may also indicate proximity to optimal hunting grounds. As elaborated
above, we considered distance to reserve boundary a proxy for both reserve size (i.e. remote-
ness) and human disturbance; as settlements and farms occur right outside protected areas, we
assumed human encroachment and other forms of disturbance to be more intense near
boundaries [16, 17, 55]. We expected density to be negatively correlated with elevation, as area
declines with increased altitude and because high-altitude habitats (1400–2600 m) may hold
sub-optimal abundance and low diversity of prey, that may be limiting leopard densities [56].
We hypothesised a negative correlation for density with increasing distance to permanently
flowing rivers as an indication of preferred hunting ground and travel routes [52]. We
expected the mean of the prey encounter index as proxy for prey abundance to be positively
correlated with leopard density, matching evidence for other large carnivores and for leopards
[57, 58]. We assumed leopard densities to be higher in low elevation habitats with denser,
arboreal vegetation cover (closed lowland forest versus open woodland and wooded grassland)
as these may hold more optimal hunting grounds [13]. We assumed different densities
between male and female leopards as overlap in home-ranges of adult males is unusual and
their home-ranges are normally larger than females [59]. Expected number of activity centres
were modelled the in the state-space of array r in relation to the different covariates (‘COV’) as
follows:
logðLgðrÞÞ ¼ b0 þ bCOVCOVgðrÞ þ bCOVCOVr ð3Þ
where covariates can be either spatially explicit (i.e. rasterised, ‘COVg(r)’) or region (i.e. survey
or array) specific (‘COVr’). We first defined the best structure for the encounter model (36
competing models, S4 Table), while considering survey-specific densities, and then tested
hypotheses on the correlates of leopard density (13 competing models, S5 Table) while keeping
the best encounter structure constant. We set a 6 km buffer around each trap array based on
ridged density estimates descending from 30 km, and based inference on maximum likelihood
estimates for leopard density using the R package ‘secr’ v. 3.2.0 [33]. Capture histories were
based on daily sampling occasions. We calculated the Akaike Information Criterion (AIC) for
each candidate model and used the difference among values (ΔAIC) to rank models. Accord-
ing to Burnham and Anderson [60], we examined models within 2 ΔAIC units to assess
whether they differed from the best model by one parameter and had similar values of the
maximized log-likelihood as the best model. In our case, we did not consider the top two mod-
els being supported, despite being within 2 ΔAIC units, because the second-best model had an
additional parameter, yet the log-likelihood value was not improved. We also considered 85%
confidence intervals for parameter estimates, that are compatible with information-based
model selection to evaluate potential uninformative parameters Arnold [61]. We derived den-
sity surface estimates from models that scored two points within their estimated ΔAIC [62].
We also derived home range size estimates (in km2) based on Royle, Chandler [22], using the
formula π (σp
5.99)2, where σ is the spatial scale parameter in km, interpreted as the radius of
the bivariate normal model of space use. The product (σp
5.99) is the 95% of space used by an
individual from the home-range centre. The valuep
5.99 derives from the fact that the square
of the distances between trap location and individual activity centres used in the Gaussian
encounter probability model have a chi-square distribution with 2 degrees of freedom which,
for α = 0.05, corresponds top
5.99.
Reserve size and human disturbance affect density of an African leopard population
PLOS ONE | https://doi.org/10.1371/journal.pone.0209541 June 12, 2019 7 / 17

Results
We accumulated a sampling effort of 5038 camera trap days and obtained 185 leopard events.
Overall, 62 individuals were identified from all six surveys (median 10, minimum 5, maxi-
mum 15; S1 Table), of these 62 individuals four were identified as juveniles and never captured
independently and were therefore excluded from the dataset, bringing the total number of
individuals used in the SECR analyses to 58. The 58 adult leopards were captured in 48.6% of
the 164 camera trap stations (S1 Table). No discrepancies were found between the two persons
reviewing the photos (RWH and FR). Individuals identified from just one flank made up
<13% of individuals (8 of 62) and all of these were single records (~4% of the total dataset)
were confidently identified as unique, as males were captured on their right flank, and females
were captured on their left flank. Five captures were of unidentifiable leopards and were not
included in the dataset.
Based on AIC weight, the most parsimonious encounter model included an effect of dis-
tance to the nearest river on the baseline encounter probability (p0) and array-specific scale
parameter σ (Table 1).
A single model that included distance to reserve boundary (model Md7 in Table 2) was
most supported based on AIC score. Another model (Md15 in Table 2), with an additional
effect of prey encounters, was ranked within 2 AIC units (ΔAIC = 0.771) of the model with
lowest AIC (model Md7). However, since Md15 differs from the best model by one parameter
and have essentially the same value of the maximized log-likelihood (-1025.334 vs -1024.719),
indicating the fit is not improved, we considered Md15 not adequately supported. Further-
more, the 85% CI for the estimate of the effect of prey encounters on leopard density in model
Md15 encompassed zero (0.093 mean; 85%CI = -0.027–0.214) supporting the uninformative
role of this covariate. We thus based our inference on the most supported model (Md7 in
Table 2), which suggested that leopard density was positively influenced by distance to reserve
boundary, with the related parameter βd2boundary equal to 0.44, (0.15–0.73, mean and 85% CI)
(Table 3, Fig 2).
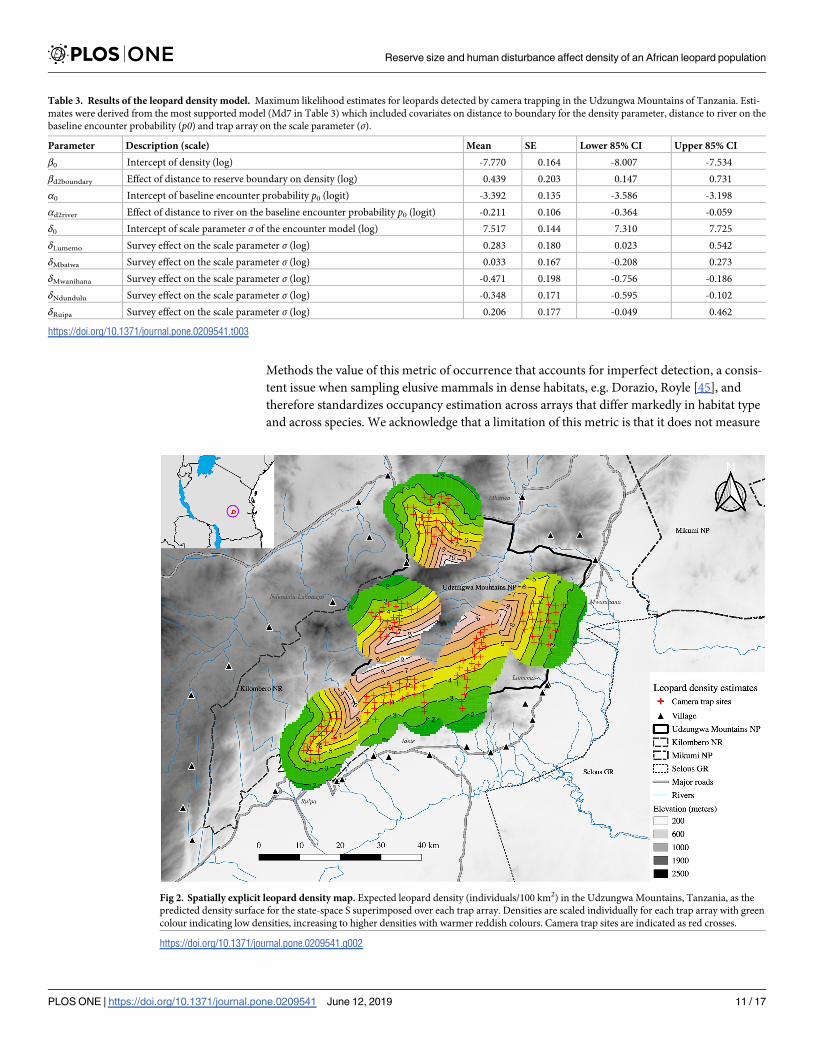
This effect translated into predicted densities that varied from approximately 2/100 km2
along the reserve border to over 8/100 km2 in the reserve interior (Fig 2). Mean density for the
total area surveyed was estimated to be 4.22/100 km2 (85% CI = 3.33–5.35/100 km2); mean
density in this case is the exponential of the intercept of density (β0 in equation [3]), which cor-
responds to density evaluated at the mean value of the covariates that were standardized to
have mean 0 and unit variance.
Intercept of the baseline encounter probability, on probability scale, was 0.030 (0.022–
0.040). In addition, results suggest a negative relationship between encounter probability and
distance of camera trap to the nearest river (αd2river = -0.21, -0.36– -0.01, Table 3). Trap array-
specific estimates of the spatial scale parameter of the half-normal encounter model (S6 Table)
were used to derive array-specific estimates of 95% home range sizes, which varied from a
minimum of 25 km2 in Mwanihana to a maximum of 112 km2 in Lumemo (mean 66 km2) (S7
Table).
Discussion
Correlates of leopard density at the landscape level
We analysed factors affecting the spatial variation of leopard density within a heterogeneous
landscape and found that leopard density was significantly associated with distance to reserve
boundary, which we considered a proxy for the extent of protected area and decreasing human
disturbance [63]. The Udzungwa Mountains National Park and adjacent Kilombero Nature
Reserve size and human disturbance affect density of an African leopard population
PLOS ONE | https://doi.org/10.1371/journal.pone.0209541 June 12, 2019 8 / 17
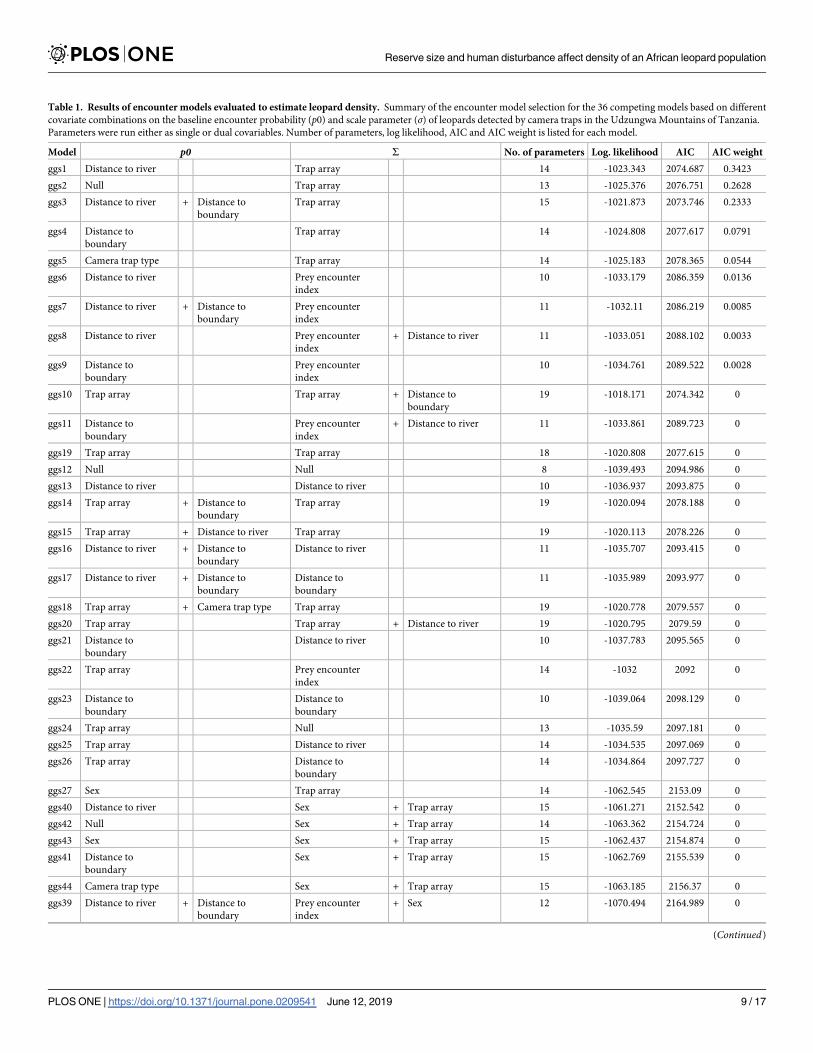
Table 1. Results of encounter models evaluated to estimate leopard density. Summary of the encounter model selection for the 36 competing models based on different
covariate combinations on the baseline encounter probability (p0) and scale parameter (σ) of leopards detected by camera traps in the Udzungwa Mountains of Tanzania.
Parameters were run either as single or dual covariables. Number of parameters, log likelihood, AIC and AIC weight is listed for each model.
Model p0 S No. of parameters Log. likelihood AIC AIC weight
ggs1 Distance to river Trap array 14 -1023.343 2074.687 0.3423
ggs2 Null Trap array 13 -1025.376 2076.751 0.2628
ggs3 Distance to river + Distance to
boundary
Trap array 15 -1021.873 2073.746 0.2333
ggs4 Distance to
boundary
Trap array 14 -1024.808 2077.617 0.0791
ggs5 Camera trap type Trap array 14 -1025.183 2078.365 0.0544
ggs6 Distance to river Prey encounter
index
10 -1033.179 2086.359 0.0136
ggs7 Distance to river + Distance to
boundary
Prey encounter
index
11 -1032.11 2086.219 0.0085
ggs8 Distance to river Prey encounter
index
+ Distance to river 11 -1033.051 2088.102 0.0033
ggs9 Distance to
boundary
Prey encounter
index
10 -1034.761 2089.522 0.0028
ggs10 Trap array Trap array + Distance to
boundary
19 -1018.171 2074.342 0
ggs11 Distance to
boundary
Prey encounter
index
+ Distance to river 11 -1033.861 2089.723 0
ggs19 Trap array Trap array 18 -1020.808 2077.615 0
ggs12 Null Null 8 -1039.493 2094.986 0
ggs13 Distance to river Distance to river 10 -1036.937 2093.875 0
ggs14 Trap array + Distance to
boundary
Trap array 19 -1020.094 2078.188 0
ggs15 Trap array + Distance to river Trap array 19 -1020.113 2078.226 0
ggs16 Distance to river + Distance to
boundary
Distance to river 11 -1035.707 2093.415 0
ggs17 Distance to river + Distance to
boundary
Distance to
boundary
11 -1035.989 2093.977 0
ggs18 Trap array + Camera trap type Trap array 19 -1020.778 2079.557 0
ggs20 Trap array Trap array + Distance to river 19 -1020.795 2079.59 0
ggs21 Distance to
boundary
Distance to river 10 -1037.783 2095.565 0
ggs22 Trap array Prey encounter
index
14 -1032 2092 0
ggs23 Distance to
boundary
Distance to
boundary
10 -1039.064 2098.129 0
ggs24 Trap array Null 13 -1035.59 2097.181 0
ggs25 Trap array Distance to river 14 -1034.535 2097.069 0
ggs26 Trap array Distance to
boundary
14 -1034.864 2097.727 0
ggs27 Sex Trap array 14 -1062.545 2153.09 0
ggs40 Distance to river Sex + Trap array 15 -1061.271 2152.542 0
ggs42 Null Sex + Trap array 14 -1063.362 2154.724 0
ggs43 Sex Sex + Trap array 15 -1062.437 2154.874 0
ggs41 Distance to
boundary
Sex + Trap array 15 -1062.769 2155.539 0
ggs44 Camera trap type Sex + Trap array 15 -1063.185 2156.37 0
ggs39 Distance to river + Distance to
boundary
Prey encounter
index
+ Sex 12 -1070.494 2164.989 0
(Continued)
Reserve size and human disturbance affect density of an African leopard population
PLOS ONE | https://doi.org/10.1371/journal.pone.0209541 June 12, 2019 9 / 17

Reserve form a relatively large protected area (3335 km2). Concomitantly, evidence suggests
that in proximity of reserve boundaries human disturbance increases, in the form of firewood
collection, selective pole and timber logging, poaching and charcoal production [43, 64].
Importantly, by assessing that prey occupancy model was not associated with distance to
reserve boundary (see Methods) we could exclude that increasing leopard density away from
reserve borders is mediated by an effect of increasing prey encounter probability.
Our findings partially mirror those from a study in South Africa, where edge effects and
higher mortality rates were associated with lowered densities of leopards outside the protected
area relative to inside [16]. Our results are similar to those of a study in Thailand, in which
leopards were reported to avoid roads and areas with high human activity compared to undis-
turbed areas and became more diurnal when human presence became limited [54]. In a
broader perspective, the magnitude of the effect of distance to reserve boundary fits the known
requirement of large carnivores, for large areas of protected habitat [65]. We elaborate in
Table 1. (Continued)
Model p0 S No. of parameters Log. likelihood AIC AIC weight
ggs32 Trap array Trap array + Sex 19 -1057.454 2152.909 0
ggs28 Distance to river Sex 10 -1075.787 2171.573 0
ggs33 Distance to river + Distance to
boundary
Sex 11 -1074.816 2171.632 0
ggs31 Null Sex 9 -1078.037 2174.074 0
ggs37 Distance to river + Distance to
boundary
Distance to river + Sex 12 -1074.396 2172.791 0
ggs29 Distance to
boundary
Sex 10 -1077.787 2175.575 0
ggs38 Distance to river + Distance to
boundary
Distance to
boundary
+ Sex 12 -1074.815 2173.629 0
ggs34 Camera trap type Sex 10 -1078.018 2176.037 0
ggs35 Trap array + Distance to river Sex 15 -1072.338 2174.676 0
ggs30 Trap array Sex 14 -1074.557 2177.114 0
ggs36 Trap array + Camera trap type Sex 15 -1074.546 2179.091 0
https://doi.org/10.1371/journal.pone.0209541.t001
Table 2. Results of density estimation models. Ranking of the 13 models evaluated for density estimation of leopards detected by camera traps in the Udzungwa Moun-
tains of Tanzania. The highest scoring model (Md7) included the covariates of distance to boundary on Density, distance to river on encounter probability (p0) and trap
array on the scale parameter (σ). Number of parameters, log. likelihood, AIC score, ΔAIC and AIC weight is listed for each model.
Model Density p0 σ No. parameters Log. likelihood AIC AIC weight
Md7 Distance to boundary Distance to river Trap array 10 -1025.334 2070.668 0.423
Md15 Prey encounter index + Distance to boundary Distance to river Trap array 11 -1024.719 2071.439 0.167
Md2 Null Distance to river Trap array 9 -1027.797 2073.594 0.158
Md9 Elevation Distance to river Trap array 10 -1027.029 2074.057 0.078
Md23 Prey encounter index Distance to river Trap array 10 -1027.25 2074.5 0.062
Md8 Distance to river Distance to river Trap array 10 -1027.446 2074.891 0.051
Md13 Prey encounter index + Elevation Distance to river Trap array 11 -1026.575 2075.151 0.026
Md14 Prey encounter index + Distance to river Distance to river Trap array 11 -1026.66 2075.319 0.024
Md4 Trap array + Distance to boundary Distance to river Trap array 15 -1020.902 2071.805 0.008
Md1 Trap array Distance to river Trap array 14 -1023.343 2074.687 0.004
Md5 Trap array + Distance to river Distance to river Trap array 15 -1022.447 2074.893 0
Md6 Trap array + Elevation Distance to river Trap array 15 -1022.803 2075.605 0
Md3 Sex Distance to river Trap array 10 -1066.593 2153.185 0
https://doi.org/10.1371/journal.pone.0209541.t002
Reserve size and human disturbance affect density of an African leopard population
PLOS ONE | https://doi.org/10.1371/journal.pone.0209541 June 12, 2019 10 / 17
Methods the value of this metric of occurrence that accounts for imperfect detection, a consis-
tent issue when sampling elusive mammals in dense habitats, e.g. Dorazio, Royle [45], and
therefore standardizes occupancy estimation across arrays that differ markedly in habitat type
and across species. We acknowledge that a limitation of this metric is that it does not measure
Table 3. Results of the leopard density model. Maximum likelihood estimates for leopards detected by camera trapping in the Udzungwa Mountains of Tanzania. Esti-
mates were derived from the most supported model (Md7 in Table 3) which included covariates on distance to boundary for the density parameter, distance to river on the
baseline encounter probability (p0) and trap array on the scale parameter (σ).
Parameter Description (scale) Mean SE Lower 85% CI Upper 85% CI
β0 Intercept of density (log) -7.770 0.164 -8.007 -7.534
βd2boundary Effect of distance to reserve boundary on density (log) 0.439 0.203 0.147 0.731
α0 Intercept of baseline encounter probability p0 (logit) -3.392 0.135 -3.586 -3.198
αd2river Effect of distance to river on the baseline encounter probability p0 (logit) -0.211 0.106 -0.364 -0.059
δ0 Intercept of scale parameter σ of the encounter model (log) 7.517 0.144 7.310 7.725
δLumemo Survey effect on the scale parameter σ (log) 0.283 0.180 0.023 0.542
δMbatwa Survey effect on the scale parameter σ (log) 0.033 0.167 -0.208 0.273
δMwanihana Survey effect on the scale parameter σ (log) -0.471 0.198 -0.756 -0.186
δNdundulu Survey effect on the scale parameter σ (log) -0.348 0.171 -0.595 -0.102
δRuipa Survey effect on the scale parameter σ (log) 0.206 0.177 -0.049 0.462
https://doi.org/10.1371/journal.pone.0209541.t003
Fig 2. Spatially explicit leopard density map. Expected leopard density (individuals/100 km2) in the Udzungwa Mountains, Tanzania, as the
predicted density surface for the state-space S superimposed over each trap array. Densities are scaled individually for each trap array with green
colour indicating low densities, increasing to higher densities with warmer reddish colours. Camera trap sites are indicated as red crosses.
https://doi.org/10.1371/journal.pone.0209541.g002
Reserve size and human disturbance affect density of an African leopard population
PLOS ONE | https://doi.org/10.1371/journal.pone.0209541 June 12, 2019 11 / 17
actual prey abundance, biomass or leopard prey preference, and it may also under-represent
the full spectrum of prey species. Our results partially mirror those of Balme, Hunter [13], that
did not find prey abundance to be the most important factor for a population of leopards in
South African savannah woodland.
We deployed six camera trap arrays covering five areas representative of the variation in
vegetation cover, from montane to lowland rainforest, dry forest and wooded grassland (Fig 1;
S1 Table). However, we did not find support for a substantial variation of leopard density
across these arrays. This result supports the notion of leopards being habitat generalists [59],
and in our case study their apparent flexibility in respect to vegetation cover and the fact that
leopards are the most abundant large carnivore in Udzungwa (spotted hyenas [Crocuta cro-cuta] occur in lower density and lions [Panthera leo] are only occasionally recorded [43]), thus
leopards are not constrained by interactions with other large carnivores.
We found that baseline encounter probability (p0) was positively correlated with proximity
to rivers, while space-usage (σ) varied with trap array. Higher encounter probability close to
waterways may be related to habitat structure, with large and frequently used trails cutting across
dense vegetation may result in optimal detection of animals by camera traps, as opposed to less
dense habitats. Travelling along rivers is also known to be more energy efficient and favoured
places for scent marking and hunting [40, 52, 53]. Higher density of leopards close to rivers may
increase encounter probability if the two variables are positively correlated. However, we did
not find support for a significant relationship between density and distance to rivers, potentially
because trails along rivers are used as travel routes and boundaries for many individuals.
Conservation implications
We considered a suite of natural and anthropogenic factors hypothesised to affect leopard den-
sities in a complex landscape with different habitat types and found that distance to protected
area boundary was the single most influential factor affecting leopard density. We also found
that the importance of this factor, overwhelmed the influence of prey encounters and of areas
with different vegetation cover, as neither had an effect on leopard densities. These results sup-
port the notion of high flexibility of the leopard [44]. However, we note that no individual
leopards were recaptured between the sampling grids despite their relative proximity. Our
mean population density estimate of 4.22 leopards/100 km2 appears in the mid-range when
compared to densities from other areas of Africa, where high density estimates of 12.03/100
km2 are known from Kenya [31] and low estimates of 0.59/100 km2 are known from Namibia
[27]. In Udzungwa, leopards are reported as extremely rare or locally extinct in the least pro-
tected parts of the Kilombero Nature Reserve [66] and in smaller and poorly protected forests
in the range, such as Uzungwa Scarp [67]. Indeed recent research shows that the reserves adja-
cent to UMNP have much lower mammalian abundance and species richness and that this is
associated with their level of protection [64]. Despite of the intense patrolling and permanently
manned ranger stations in the UMNP, we captured photographs of armed poachers across all
arrays, and recorded camps, snares, carcasses (predominantly elephants, but also other animals
including leopard) across the UMNP.
Leopards disappearance in parts of the Udzungwas has been attributed to direct hunting
and prey depredation [68], mirroring findings from the Congo [69] and South Africa [16].
While our study shows populations in the highest category of protected areas are in the mid-
range densities reported in Africa, the regional metapopulation could be at risk if they lose
connectivity with the major adjacent ecosystems of Selous and Ruaha. While Selous Game
Reserve is in close proximity (min. 6.4 km, Fig 1), the intersecting area is intensively farmed
and settled, hence leopard movements between these protected areas may be absent or only
Reserve size and human disturbance affect density of an African leopard population
PLOS ONE | https://doi.org/10.1371/journal.pone.0209541 June 12, 2019 12 / 17
sporadic. Our findings carry important conservation implications, which are related to the
need for maintaining large areas of continuous, well-protected habitat to preserve viable popu-
lations of large carnivores [14]. This becomes even more imperative given the ever increasing
habitat fragmentation that terrestrial mammals face globally [70]. Wildlife Management Areas
(WMAs), i.e., areas co-managed with local communities [71], have been proven effective in
protecting other wildlife species in Tanzania [72]. This could potentially be a useful manage-
ment strategy in the Udzungwas for establishing buffer zones in the community land sur-
rounding the nature and forest reserves. This would ensure greater protection along the
currently abrupt edges between reserves and human settlements [73]. Given that similarly to
all other large cats leopards are suffering from population decline and range loss [8], it is
imperative that their strongholds are efficiently protected and their populations monitored to
ensure their long-term survival.
Supporting information
S1 Appendix. Model code.
(DOCX)
S1 Table. Summary of sampling efforts and areas. Details of camera trap surveys in the
Udzungwa mountains of Tanzania per each camera trap array: dominant habitat type, number
of paired camera trap stations, camera trap days and survey period. Camera-trap stations were
retrieved after ~30 days and each survey had a mean of 27 camera traps (range 25–34).
(DOCX)
S2 Table. Potential leopard prey species. List of prey species detected by camera trapping in
the Udzungwa Mountains of Tanzania during the leopard survey and assumed to be potential
prey. The list includes daily detections that were used to estimate mean occupancy probability
for each of the six trap array (see S1 Table).
(DOCX)
S3 Table. Summary results of the community occupancy model. Posterior Bayesian distribu-
tions and quantiles of mean occupancy (ψ) and detectability (p) for the community of potential
leopard prey species detected by camera trapping in the Udzungwa mountains of Tanzania
(see text for details).
(DOCX)
S4 Table. List of competing encounter models. List of competing encounter models with the
specific hypotheses tested on the baseline encounter probability (p0) and the scale parameter
(σ).
(DOCX)
S5 Table. List of competing density models. List of competing models for leopard density, as
the combination of different covariates in the density linear predictor.
(DOCX)
S6 Table. Survey-specific estimates of the scale parameter (σ) of the half-normal encounter
model. Estimates are expressed in meters (m) with upper and lower confidence intervals (CI).
(DOCX)
S7 Table. Summary of leopard home range estimates. 95% home-range estimates in km2 for
leopards in the Udzungwa mountains of Tanzania in each trap array based on spatially explicit
capture-recapture models.
(DOCX)
Reserve size and human disturbance affect density of an African leopard population
PLOS ONE | https://doi.org/10.1371/journal.pone.0209541 June 12, 2019 13 / 17
Acknowledgments
We thank Roland Kays for constructive comments on an earlier version of the manuscript. We
also thank the Tanzania Wildlife Research Institute and Tanzania National Parks for their col-
laboration and assistance and the staff of the Udzungwa Ecological Monitoring Centre for
logistic support during field work. In particular, Richard Laizzer and Aloyce Mwakisoma for
invaluable field assistance. NS and RWH acknowledge co-funding from MUSE–Science
Museum (Trento, Italy). RWH would also like to thank Tom Gilbert from the Section of Evo-
lutionary Genomics for support, funding and supervision. FR and RWH would like to thank
Fototrappolaggio s.r.l. for sponsoring camera traps.
Author Contributions
Conceptualization: Rasmus Worsøe Havmøller, Nikolaj Scharff, Francesco Rovero.
Data curation: Rasmus Worsøe Havmøller, Francesco Rovero.
Formal analysis: Rasmus Worsøe Havmøller, Simone Tenan, Francesco Rovero.
Funding acquisition: Nikolaj Scharff, Francesco Rovero.
Investigation: Rasmus Worsøe Havmøller.
Methodology: Rasmus Worsøe Havmøller, Francesco Rovero.
Project administration: Rasmus Worsøe Havmøller.
Supervision: Nikolaj Scharff, Francesco Rovero.
Visualization: Rasmus Worsøe Havmøller.
Writing – original draft: Rasmus Worsøe Havmøller, Simone Tenan, Nikolaj Scharff, Fran-
cesco Rovero.
Writing – review & editing: Rasmus Worsøe Havmøller, Simone Tenan, Nikolaj Scharff,
Francesco Rovero.
References1. Ripple WJ, Beschta RL. Restoring Yellowstone’s aspen with wolves. Biol Conserv. 2007; 138(3):514–9.
2. Ripple WJ, Estes JA, Beschta RL, Wilmers CC, Ritchie EG, Hebblewhite M, et al. Status and ecological
effects of the world’s largest carnivores. Science. 2014; 343(6167):1241484. https://doi.org/10.1126/
science.1241484 PMID: 24408439
3. Miller B, Dugelby B, Foreman D, del Rio CM, Noss R, Phillips M, et al. The importance of large carni-
vores to healthy ecosystems. Endangered Species Update. 2001; 18(5):202–10.
4. Woodroffe R. Predators and people: using human densities to interpret declines of large carnivores.
Animal conservation. 2000; 3(2):165–73.
5. Ceballos G, Ehrlich PR. Mammal population losses and the extinction crisis. Science. 2002; 296
(5569):904–7. https://doi.org/10.1126/science.1069349 PMID: 11988573
6. Wahlberg N, Moilanen A, Hanski I. Predicting the occurrence of endangered species in fragmented
landscapes. Science. 1996; 273(5281):1536.
7. Carbone C, Pettorelli N, Stephens PA. The bigger they come, the harder they fall: body size and prey
abundance influence predator–prey ratios. Biology Letters. 2010:rsbl20100996.
8. Jacobson AP, Gerngross P, Lemeris JJR, Schoonover RF, Anco C, Breitenmoser-Wursten C, et al.
Leopard (Panthera pardus) status, distribution, and the research efforts across its range. PeerJ. 2016;(
4:e1974). https://doi.org/10.7717/peerj.1974. PMID: 27168983
9. Ray JC, Hunter L, Zigouris J. Setting conservation and research priorities for larger African carnivores.
New York, USA.: Wildlife Conservation Society; 2005.
Reserve size and human disturbance affect density of an African leopard population
PLOS ONE | https://doi.org/10.1371/journal.pone.0209541 June 12, 2019 14 / 17
10. Athreya V, Odden M, Linnell JD, Krishnaswamy J, Karanth U. Big cats in our backyards: persistence of
large carnivores in a human dominated landscape in India. PloS one. 2013; 8(3):e57872. https://doi.
org/10.1371/journal.pone.0057872 PMID: 23483933
11. Kshettry A, Vaidyanathan S, Athreya V. Leopard in a tea-cup: A study of leopard habitat-use and
human-leopard interactions in north-eastern India. PLOS ONE. 2017; 12(5):e0177013. https://doi.org/
10.1371/journal.pone.0177013 PMID: 28493999
12. Bhattarai BP, Kindlmann P. Interactions between Bengal tiger (Panthera tigris) and leopard (Panthera
pardus): implications for their conservation. Biodiversity and Conservation. 2012; 21(8):2075–94.
https://doi.org/10.1007/s10531-012-0298-y
13. Balme G, Hunter L, Slotow R. Feeding habitat selection by hunting leopards Panthera pardus in a wood-
land savanna: prey catchability versus abundance. Animal Behaviour. 2007; 74:589–98. https://doi.org/
10.1016/j.anbehav.2006.12.014
14. Woodroffe R, Ginsberg JR. Edge effects and the extinction of populations inside protected areas. Sci-
ence. 1998; 280(5372):2126–8. PMID: 9641920
15. Parks SA, Harcourt A. Reserve size, local human density, and mammalian extinctions in US protected
areas. Conservation Biology. 2002; 16(3):800–8.
16. Balme G, Slotow R, Hunter L. Edge effects and the impact of non-protected areas in carnivore conser-
vation: leopards in the Phinda–Mkhuze Complex, South Africa. Animal Conservation. 2010; 13(3):315–
23.
17. Ngoprasert D, Lynam AJ, Gale GA. Human disturbance affects habitat use and behaviour of Asiatic
leopard Panthera pardus in Kaeng Krachan National Park, Thailand. Oryx. 2007; 41(3):343–51. https://
doi.org/10.1017/s0030605307001102
18. Carter N, Jasny M, Gurung B, Liu J. Impacts of people and tigers on leopard spatiotemporal activity pat-
terns in a global biodiversity hotspot. Global Ecology and Conservation. 2015; 3:149–62.
19. Swanepoel LH, Somers MJ, Dalerum F. Density of leopards Panthera pardus on protected and non-pro-
tected land in the Waterberg Biosphere, South Africa. Wildlife Biology. 2015; 21(5):263–8.
20. Manly B, McDonald L, Thomas DL, McDonald TL, Erickson WP. Resource selection by animals: statisti-
cal design and analysis for field studies: Springer Science & Business Media; 2007.
21. Tenan S, Brambilla M, Pedrini P, Sutherland C. Quantifying spatial variation in the size and structure of
ecologically stratified communities. Methods in Ecology and Evolution. 2017.
22. Royle JA, Chandler RB, Sollmann R, Gardner B. Spatial capture-recapture: Academic Press; 2013.
23. Efford MG, Fewster RM. Estimating population size by spatially explicit capture–recapture. Oikos.
2013; 122(6):918–28.
24. Gray TNE, Prum S. Leopard density in post-conflict landscape, Cambodia: Evidence from spatially
explicit capture–recapture. The Journal of Wildlife Management. 2012; 76(1):163–9.
25. Grey JNC, Kent VT, Hill RA. Evidence of a high density population of harvested leopards in a montane
environment. PloS one. 2013; 8(12):e82832. https://doi.org/10.1371/journal.pone.0082832 PMID:
24349375
26. Strampelli P, Andresen L, Everatt KT, Somers MJ, Rowcliffe JM. Leopard Panthera pardus density in
southern Mozambique: evidence from spatially explicit capture–recapture in Xonghile Game Reserve.
Oryx. 2018:1–7.
27. Edwards S, Aschenborn O, Gange AC, Wiesel I. Leopard density estimates from semi-desert commer-
cial farmlands, south-west Namibia. African Journal of Ecology. 2015; 54(1):103–6. https://doi.org/10.
1111/aje.12235.
28. Chapman S, Balme G. An estimate of leopard population density in a private reserve in KwaZulu-Natal,
South Africa, using camera-traps and capture-recapture models. South African Journal of Wildlife
Research. 2010; 40(2):114–20.
29. Harihar A, Pandav B, Goyal SP. Density of leopards (Panthera pardus) in the Chilla Range of Rajaji
National Park, Uttarakhand, India. Mammalia. 2009; 73(1):68–71. https://doi.org/10.1515/mamm.2009.
007
30. Kalle R, Ramesh T, Qureshi Q, Sankar K. Density of tiger and leopard in a tropical deciduous forest of
Mudumalai Tiger Reserve, southern India, as estimated using photographic capture-recapture sam-
pling. Acta Theriologica. 2011; 56(4):335–42. https://doi.org/10.1007/s13364-011-0038-9
31. O’Brien TG, Kinnaird MF. Density estimation of sympatric carnivores using spatially explicit capture-
recapture methods and standard trapping grid. Ecological Applications. 2011; 21(8):2908–16.
32. Edwards S, Aschenborn O, Gange AC, Wiesel I. Leopard density estimates from semi-desert commer-
cial farmlands, south-west Namibia. African Journal of Ecology. 2016; 54(1):103–6.
33. Efford M. secr 3.2.0-spatially explicit capture–recapture in R. 2019.
Reserve size and human disturbance affect density of an African leopard population
PLOS ONE | https://doi.org/10.1371/journal.pone.0209541 June 12, 2019 15 / 17
34. Rovero F, Menegon M, Fjeldså J, Collett L, Doggart N, Leonard C, et al. Targeted vertebrate surveys
enhance the faunal importance and improve explanatory models within the Eastern Arc Mountains of
Kenya and Tanzania. Diversity and Distributions. 2014; 20(12):1438–49.
35. Burgess N, Butynski T, Cordeiro N, Doggart N, Fjeldså J, Howell K, et al. The biological importance of
the Eastern Arc Mountains of Tanzania and Kenya. Biological Conservation. 2007; 134(2):209–31.
36. Lovett J. Climatic history and forest distribution in eastern Africa. Biogeography and ecology of the rain
forests of Eastern Africa: Cambridge University Press; 1993.
37. Rovero F, Martin E, Rosa M, Ahumada JA, Spitale D. Estimating species richness and modelling habitat
preferences of tropical forest mammals from camera trap data. PloS one. 2014; 9(7):e103300. https://
doi.org/10.1371/journal.pone.0103300 PMID: 25054806
38. Rovero F, De Luca DW. Checklist of mammals of the Udzungwa Mountains of Tanzania. Mammalia.
2007; 71(1/2):47–55.
39. Lovett J. Moist forests of Tanzania. Swara. 1985; 8(5):8–9.
40. Henschel P, Ray J. Leopards in African rainforests: survey and monitoring techniques. New York:
Wildlife Conservation Society, 2003.
41. Miththapala S, Seidensticker J, Phillips LG, Fernando SBU, Smallwood JA. Identification of individual
leopards (Panthera pardus kotiya) using spot pattern variation. Journal of Zoology. 1989; 218(4):527–
36. https://doi.org/10.1111/j.1469-7998.1989.tb04996.x
42. Everatt KT, Andresen L, Somers MJ. Trophic scaling and occupancy analysis reveals a lion population
limited by top-down anthropogenic pressure in the Limpopo National Park, Mozambique. PloS one.
2014; 9(6):e99389. https://doi.org/10.1371/journal.pone.0099389 PMID: 24914934
43. Havmøller RG. Abundance and Ecology of Leopards (Panthera pardus) in the Udzungwa Mountains,
Tanzania. PhD Dissertation. Copenhagen: University of Copenhagen; 2016.
44. Hayward M, Henschel P, O’brien J, Hofmeyr M, Balme G, Kerley G. Prey preferences of the leopard
(Panthera pardus). Journal of Zoology. 2006; 270(2):298–313.
45. Dorazio RM, Royle JA, Soderstrom B, Glimskar A. Estimating species richness and accumulation by
modeling species occurrence and detectability. Ecology. 2006; 87(4):842–54. PMID: 16676528
46. Royle JA, Dorazio RM. Hierarchical modeling and inference in ecology: the analysis of data from popu-
lations, metapopulations and communities: Elsevier; 2008.
47. Sollmann R, Mohamed A, Samejima H, Wilting A. Risky business or simple solution–Relative abun-
dance indices from camera-trapping. Biological Conservation. 2013; 159:405–12.
48. Kerry M, Royle JA. Applied Hierarchical Modeling in Ecology: analysis of distribution, abundance and
spevies richness in R and BUGS. London: Academic Press; 2016.
49. Plummer M, editor JAGS: A program for analysis of Bayesian graphical models using Gibbs sampling.
Proceedings of the 3rd international workshop on distributed statistical computing; 2003: Vienna,
Austria.
50. Team RC. R: A language and environment for statistical computing. Vienna, Austria: http://www.R-
project.org. 2013.
51. Sollmann R, Furtado MM, Gardner B, Hofer H, Jacomo AT, Torres NM, et al. Improving density esti-
mates for elusive carnivores: accounting for sex-specific detection and movements using spatial cap-
ture–recapture models for jaguars in central Brazil. Biological Conservation. 2011; 144(3):1017–24.
52. Karanth KU. Estimating tiger Panthera tigris populations from camera-trap data using capture—recap-
ture models. Biological conservation. 1995; 71(3):333–8.
53. Pitman RT, Fattebert J, Williams ST, Williams KS, Hill RA, Hunter LT, et al. Cats, connectivity and con-
servation: incorporating data sets and integrating scales for wildlife management. Journal of Applied
Ecology. 2017.
54. Ngoprasert D, Lynam AJ, Gale GA. Effects of temporary closure of a national park on leopard move-
ment and behaviour in tropical Asia. Mammalian Biology-Zeitschrift fur Saugetierkunde. 2017; 82:65–
73.
55. Rovero F, Mtui AS, Kitegile AS, Nielsen MR. Hunting or habitat degradation? Decline of primate popula-
tions in Udzungwa Mountains, Tanzania: An analysis of threats. Biological Conservation. 2012; 146
(1):89–96.
56. Norton P, Lawson A, Henley S, Avery G. Prey of leopards in four mountainous areas of the south-west-
ern Cape Province. S AFR J WILDL RES/S-AFR TYDSKR NATUURNAV. 1986; 16(2):47–52.
57. Karanth KU, Nichols JD, Kumar NS, Link WA, Hines JE. Tigers and their prey: predicting carnivore den-
sities from prey abundance. Proceedings of the National Academy of Sciences of the United States of
America. 2004; 101(14):4854–8. https://doi.org/10.1073/pnas.0306210101 PMID: 15041746
Reserve size and human disturbance affect density of an African leopard population
PLOS ONE | https://doi.org/10.1371/journal.pone.0209541 June 12, 2019 16 / 17
58. Marker LL, Dickman AJ. Factors affecting leopard (Panthera pardus) spatial ecology, with particular ref-
erence to Namibian farmlands. South African Journal of Wildlife Research. 2005; 35(2):105–15.
59. Hunter L, Henschel P, Ray JC. Panthera pardus. In: Kingdon J. S. and Hoffmann M. (eds), The Mam-
mals of Africa. Amsterdam, The Netherlands: Academic Press; 2013.
60. Burnham KP, Anderson DR. Multimodel inference: understanding AIC and BIC in model selection.
Sociological methods & research. 2004; 33(2):261–304.
61. Arnold TW. Uninformative parameters and model selection using Akaike’s Information Criterion. The
Journal of Wildlife Management. 2010; 74(6):1175–8.
62. Anderson D, Burnham K. Model selection and multi-model inference. Second NY: Springer-Verlag.
2004.
63. Cavada N, Havmøller RW, Scharff N, Rovero F. A landscape-scale assessment of tropical mammals
reveals the effects of habitat and anthropogenic disturbance on community occupancy. PloS one. 2019;
14(4):e0215682. https://doi.org/10.1371/journal.pone.0215682 PMID: 31002707
64. Jones T, Hawes JE, Norton GW, Hawkins DM. Effect of protection status on mammal richness and
abundance in Afromontane forests of the Udzungwa Mountains, Tanzania. Biological Conservation.
2019; 229:78–84.
65. Lindstedt SL, Miller BJ, Buskirk SW. Home range, time, and body size in mammals. Ecology. 1986; 67
(2):413–8.
66. Havmøller R, Pagh Jensen F, Ciolli M, Rovero F. New population of Abbott’s duiker and other species’
range records in the Udzungwa Mountains, Tanzania. Oryx. 2014; 48(03):328–9.
67. Hegerl C, Burgess ND, Nielsen MR, Martin E, Ciolli M, Rovero F. Using camera trap data to assess the
impact of bushmeat hunting on forest mammals in Tanzania. Oryx. 2015:1–11.
68. Topp-Jørgensen J, Nielsen MR, Marshall AR, Pedersen UB. Relative densities of mammals in response
to different levels of bushmeat hunting in the Udzungwa Mountains, Tanzania. Tropical Conservation
Science. 2009:70–87.
69. Henschel P, Hunter LTB, Coad L, Abernethy KA, Muhlenberg M. Leopard prey choice in the Congo
Basin rainforest suggests exploitative competition with human bushmeat hunters. Journal of Zoology.
2011; 285(1):11–20. https://doi.org/10.1111/j.1469-7998.2011.00826.x
70. Crooks KR, Burdett CL, Theobald DM, King SR, Di Marco M, Rondinini C, et al. Quantification of habitat
fragmentation reveals extinction risk in terrestrial mammals. Proceedings of the National Academy of
Sciences. 2017; 114(29):7635–40.
71. Gibson CC, Marks SA. Transforming rural hunters into conservationists: an assessment of community-
based wildlife management programs in Africa. World Development. 1995; 23(6):941–57.
72. Lee DE. Evaluating conservation effectiveness in a Tanzanian community wildlife management area.
The Journal of Wildlife Management. 2018; 82(8):1767–74.
73. Haule K, Johnsen F, Maganga S. Striving for sustainable wildlife management: the case of Kilombero
Game Controlled Area, Tanzania. 2002.
Reserve size and human disturbance affect density of an African leopard population
PLOS ONE | https://doi.org/10.1371/journal.pone.0209541 June 12, 2019 17 / 17