Embed Size (px)
Citation preview

Montclair State University Montclair State University
Montclair State University Digital Montclair State University Digital
Commons Commons
Theses, Dissertations and Culminating Projects
5-2014
Anthropogenic Disturbance of the Herpetofauna in the Northeast Anthropogenic Disturbance of the Herpetofauna in the Northeast
US : Wildlife Disease and Habitat Modification US : Wildlife Disease and Habitat Modification
Paola Dolcemascolo Montclair State University
Follow this and additional works at: https://digitalcommons.montclair.edu/etd
Part of the Environmental Sciences Commons
Recommended Citation Recommended Citation Dolcemascolo, Paola, "Anthropogenic Disturbance of the Herpetofauna in the Northeast US : Wildlife Disease and Habitat Modification" (2014). Theses, Dissertations and Culminating Projects. 60. https://digitalcommons.montclair.edu/etd/60
This Dissertation is brought to you for free and open access by Montclair State University Digital Commons. It has been accepted for inclusion in Theses, Dissertations and Culminating Projects by an authorized administrator of Montclair State University Digital Commons. For more information, please contact [email protected].

ANTHROPOGENIC DISTURBANCE OF THE HERPETOFAUNA IN THE
NORTHEAST US: WILDLIFE DISEASE AND HABITAT MODIFICATION
A DISSERTATION
Submitted to the Faculty of
Montclair State University in partial fulfillment
of the requirements
for the degree of Doctor of Philosophy
by
PAOLA DOLCEMASCOLO
Montclair State University
Upper Montclair, NJ
2014
Dissertation Chair: Kirsten Monsen-Collar, PhD

Copyright © 2014 by Paola Dolcemascolo. All rights reserved.

iv
ABSTRACT
ANTHROPOGENIC DISTURBANCE OF THE HERPETOFAUNA IN THE
NORTHEAST US: WILDLIFE DISEASE AND HABITAT MODIFICATION
by Paola Dolcemascolo
Herpetofauna represent some of the most striking examples of the consequences of
human impact on biotic communities. They experience the full range of
anthropogenically-derived stressors: habitat loss, habitat modification and degradation,
pollution, collection for food and the pet trade, nuisance killings, road mortality, and
disease. In this study, I examined some of the main threats faced by herpetofauna of the
Northeastern United States and their implications for management of reptile and
amphibians in New Jersey. I first used molecular techniques to document and assess the
prevalence of two amphibian diseases, chytridiomycosis (caused by the chytrid fungus,
Batrachochytrium dendrobatidis) and Ranavirus, throughout the state of New Jersey.
While Bd does not seem to be a problem, Ranavirus was found at eleven sites in NJ.
Next, I examined the first recorded occurrence of the American Green Tree frog (Hyla
cinerea) in New Jersey to determine if its presence could be linked to a range expansion
event facilitated by climate change. Toe clips were collected from both populations and
partial sequences of the mitochondrial ND1 gene were used to generate a statistical
parsimony network. Four haplotypes were distinguished, with all NJ haplotypes being
identical to the most prevalent Delaware haplotype and the Delaware haplotypes differing

v
by at most one base pair. These results suggest a recent movement of Delaware frogs into
NJ. Finally, I examined populations of the Diamondback terrapin (Malaclemys terrapin)
in two urbanized locations of the species’ range in order to determine the genetic and
demographic health of these populations that live in such highly disturbed habitats. I used
a fragment of the mitochondrial D-loop from terrapin blood samples to examine patterns
of genetic diversity among populations of terrapins collected within Jamaica Bay (from
Ruler’s Bar Hassock and JFK airport), Hempstead Bay and Sawmill Creek Wildlife
Management Area in the NJ Meadowlands. I show that the picture of the terrapin’s
demographic past is a complex one, possessing signs of a bottleneck, as well as recent
expansion, and that genetic diversity of the mitochondrial D-loop is not severely reduced.
Genetic data confirm what other studies have shown, that dispersal capabilities of
terrapins are limited.

vi
ACKNOWLEDGEMENTS
To start, I would like to thank my advisor, Dr. Kirsten Monsen-Collar, for her
boundless enthusiasm and support during my academic career. My sanity would have
suffered a great deal more if it had not been for her. My sanity was also protected by the
rest of my committee members, Dr. Randall Fitzgerald, Dr. Lisa Hazard, Dr. Timothy L.
King, Dr. John Smallwood and Dr. Bill Thomas. Their feedback and encouragement and
availability allowed me to overcome even my most frustrating moments. I could always
pick up the phone and call Dr. Thomas to hear a friendly voice and incredibly insightful
advice. Drs. Fitzgerald and King were so helpful at keeping me grounded, as their very
relaxed personalities always assured me that “everything was going to be ok”. Dr. Hazard
was always ready with a great story to help ease my suffering and Dr. Smallwood’s
incorrect pronunciation of Latin always kept me amused.
I would like to thank my funding sources, without which it would have been
much more difficult to complete my research. I received money from the National Parks
Service, from the New Jersey Water Resources Research Institute and the Conserve
Wildlife Matching grant program through NJ Division of Fish and Wildlife. Thanks also
need to go to the many people who helped me collect field samples and gave me
feedback on my work, including Brett Bragin and Drew McQuade from the NJ
Meadowlands Commission, Roger Wood from the Wetlands Institute, Karena DiLeo
from the Conserve Wildlife Foundation, Kim Korth and Dave Golden from NJ Division
of Fish and Wildlife, Laura Francoeur from the Port Authority of NY and NJ, Holly

vii
Niederriter from the Delaware Department of Natural Resources and Control, Jenny
Mastantuono from USDA, Bob Zappalorti and Herpetological Associates, and Alexandra
Kanonik. A special thanks goes to Dr. Russ Burke, from Hofstra University, who was a
fundamental presence in my life. He provided advice, support and opportunities for
networking, and having fun. He made me feel like a part of his lab and for that I will be
forever grateful.
Thank you to my friends, who believed in me and thought more highly of me than
I thought of myself. Reshma Sapre was there from the beginning. Along the way, I’ve
met some great people, Rebecca Shell Kanarek and Derek Kanarek, Padmini Das,
Brittany McGee, and my dear, dear Master’s student, Stephanie Parelli. For dealing with
my DNA sequences and helping troubleshoot problems during my frantic meltdowns, I
thank Lina Halawani. Everyone at the NJ School of Conservation deserves thanks for
being such wonderful people and providing me with the space to relax and pursue my
love of the outdoors and herps in general. Thank you to Tom Duchak who was a great
herping buddy. Thank you to my partner, Denise Gemmellaro, for always thinking that
I’m capable of being successful at whatever I set out to do.
Thank you, finally, to Dr. Dibs Sarkar and the Graduate School for giving me the
opportunity to pursue my PhD, thank you to all of my colleagues in the program and
thank you to my family.

viii
DEDICATION
To all women and any who struggle to have their voices heard and strive for equality
And
To one woman in particular, Denise

ix
TABLE OF CONTENTS
Content Page
ABSTRACT………………………………………………………………………..….iv
ACKNOWLEDGEMENTS………………………………………………………….vi
LIST OF
TABLES.........................................................................................................................xii
LIST OF
FIGURES…………………………………………………………………….….……xiii
CHAPTER 1………………………………………………………..……………….….1
1.1 Herpetofaunal Susceptibility to Anthropogenic Disturbance……………….1
1.2 Amphibian Disease……………………………….…………………………2
1.3 Range Expansions and Invasion Biology………………………………....…4
1.4 Turtles in Urban Environments……………………………………………...7
1.5 Research Questions and Dissertation Structure……………………………...9
CHAPTER 2……………………………………………………………….……………12
Emerging Infectious Diseases of Amphibians in New Jersey………..………………….12
Abstract…………………………………………………………………………..12
2.1 Introduction………………………..………………………………………...14
2.2 Materials and Methods………………………………………………………23
2.3 Results………………………..……………………………………………...31
2.4 Discussion and Conclusions……………………………..………………….42

x
Content Page
CHAPTER 3………………………..………………………………………….……….46
Hopping into New Territory: A Case of Amphibian Range Expansion in New
Jersey……………………….…………………………………………………..………...46
Abstract……………………..………………………………………..…………..46
3.1 Introduction……………………………………………………..…………...48
3.2 Materials and Methods………………………………………………………56
3.3 Results……………………………………………..………………………...60
3.4 Discussion and Conclusions………………………………………………...67
CHAPTER 4…………………………………………………………………………….72
Anthropogenic Disturbance and Wildlife: Diamondback Terrapins in Urban
Environments…………………………………………………………………………….72
Abstract…………………………………………………………………………..72
4.1 Introduction…………………………………………...……………………..74
4.2 Materials and Methods……………………………………………….……...84
4.3 Results…………………………………………...…………………………..96
4.4 Discussion and Conclusions…………………………………………...…..108

xi
Content Page
CHAPTER 5………………………………………….………………………………..114
Management Implications…………………………….………………………………...114
REFERENCES………………………………………………………………………...118
APPENDIX A………………………………………………………………………….141
APPENDIX B………………………………………………………………………….154

xii
LIST OF TABLES
Table Page
Table 2-1. 2010 sampling information for assessment of
Batrachochytrium dendrobatidis……………………………………………………...24
Table 2-2. 2011 sampling information for assessment of
Batrachochytrium dendrobatidis………………………………………………………25
Table 2-3. 2011-2013 sampling information for assessment of Ranavirus…………....26
Table 2-4. Mean precipitation and temperature in Sussex County for the period June-
August for years 2009 and 2010. Taken from the Office of the New Jersey State
Climatologist (http://climate.rutgers.edu/stateclim/)……………………………...……32
Table 2-5. Comparison between number of positives obtained using traditional PCR and
number of positives obtained using RT-PCR………………………………………..….37
Table 4-1. Dates of trapping occasions in NJ Meadowlands.…………………………..86
Table 4-2. Candidate models for the Cormack-Jolly-Seber estimates of survival (Phi) and
recapture (p) probabilities. Notation: “g” = group effect (sex), “t” = time effect, “t*g” =
effect of interaction of time and sex……………………………………..……………..93
Table 4-3. Candidate models for the Jolly-Seber POPAN formulation. Notation: “g” =
group effect (sex), “t” = time effect, “t*g” = effect of interaction of time and sex, “pent”
= probability of entrance…………………………………………………..……………95
Table 4-4. Estimates of genetic diversity computed by Arlequin v. 3.5 for individual
diamondback terrapin populations in NY and NJ………………………………………99
Table 4-5. Pairwise Fst values generated by Arlequin v. 3.5 to assess genetic
differentiation among NY/NJ terrapin populations………………………………….…101
Table 4-6. Probability of Entrance parameter estimates from Jolly-Seber POPAN
formulation……………………………………………………………………………...107

xiii
LIST OF FIGURES
Figures Page
Figure 2-1. Location of reported mass die-off of L. clamitans tadpoles,
due to suspected Ranavirus outbreak…………………………………………………...29
Figure 2-2. Six ponds that were sampled for Ranavirus at Stafford Business Park. In
2011, Hay Pond had 0/18 positive, Beach Pond had 0/2 positive, MF Ponds (2 ponds
close enough together that they were treated as one) had 4/17 and 0/11 positive,
Mitigation Pond had 26/48 positive, Costco Pond had 2/13 positive and Spotted Pond had
0/2 positive. In 2012, a total of 24 samples were collected from Hay Pond, Costco Pond
and Mitigation Pond. Sixteen were positive for Ranavirus,
including samples from Hay Pond and Beach Pond, which had been
free of infection in 2011………………………………………………………………...34
Figure 2-3. Pictures taken at Stafford Business Park site to document Ranavirus outbreak.
A. Mass die-off of Lithobates clamitans tadpoles. B. Dying L. clamitans tadpole
exhibiting swelling and erratic swimming behavior. C. Apparently healthy Anaxyrus
fowleri tadpoles feeding on the carcass of a L. clamitans tadpole……………………...35
Figure 2-4. Sample 2% Agarose gel on which were run traditional PCR products. The
first and last line contain DNA size standard. PCR products are slightly larger than 500
bp, making them likely candidates for the Ranavirus major capsid protein gene.
Sequencing later confirmed this. The lane marked with “*” is the negative
control…………………………………………..………………………………………36
Figure 2-5. Characteristic swelling and red lesions associated with Ranavirus infection.
A. L. clamitans from Stafford Business Park Site. B. L. clamitans taken from
NJSOC…………………………………………………………………………… ……38
Figure 2-6. Map summarizing Ranavirus findings to date. Colored counties are those in
which Ranavirus has been found. Number indicates number of sites that have tested
positive for Ranavirus. To date, three sites in Sussex County, four in Warren County, 1
each in Morris, Passaic, Camden and Ocean Counties……………………………..….39
Figure 2-7. Fluorescence plot (A) and melting curve plot (B) for positive control (L.
clamitans tadpole that consistently tested positive for Ranavirus major capsid protein
gene, and PCR product was sequenced to confirm identity)…………………………..40

xiv
LIST OF FIGURES
Figures Page
Figure 2-8. Fluorescence curve plot (A) and melting curve plot (B) of representative
sample from NJSOC L. clamitans individual from die-off that tested positive for
Ranavirus……………………………………………………………………………..…41
Figure 3-1. The infinite island model (A) and the stepping stone model (B) of population
movement. Based on Whitlock and McCauley (1999)…………………………………51
Figure 3-2. Map of Hyla cinerea distribution, taken from
http://www.nwrc.usgs.gov/sc_armi/frogs_and_toads/hyla_cinerea.htm, which shows the
geographic distribution of Hyla cinerea prior to 2011. Dark green = museum records,
mid-level green = published records, light green = presumed presence, white = no known
occurrence……………………………………………………………………………....54
Figure. 3-3. Locations of sampling sites for Hyla cinerea in Delaware and
New Jersey…………………...…………………………………………………………57
Figure 3-4. Statistical parsimony network generated by TCS. DE1 is the most common
haplotype, possessed by 26 individuals. DE1 differs from DE6 and D4 by one nucleotide.
L1 was obtained from GenBank and used as an outgroup…………………………..….60
Figure 3-5. Haplotype map showing the distribution of haplotypes in NJ and
DE…………………………………...…………………………………………………..63
Figure 3-6. Arrows represent loci that differ between L1 and all other sequences.
Rectangles represent loci that differ between DE sequences…………………………...64
Figure 3-7. Locations of range survey in 2011 and 2012……………….………………66
Figure 3-8. Updated map of Hyla cinerea distribution (created 6/18/2012), from
http://www.pwrc.usgs.gov:8080/mapserver/naa/………………………………………..66
Figure 4-1. A. Location of NY sites for terrapin samples. B. NY sites in relation to the NJ
Meadowlands site………………………………………………………...……………..85
Figure 4-2. Examples of Maryland style crab traps for the mark-recapture study in the NJ
Meadowlands…………………………………………………………...………………87
Figure 4-3. Trapping locations in the Sawmill Creek Wildlife Management Area in the
NJ Meadowlands for 2011. Trapping locations for other years (2009, 2010, 2012) varied
slightly………………………………………………………………..………………...88

xv
LIST OF FIGURES
Figures Page
Figure 4-4. Statistical parsimony network generated by TCS. Notation = “RB” = Ruler’s
Bar, “JFK” = JFK airport, “H” = Hempstead, “ML” or “MW” = Meadowlands.
Sequences RB2R, H14R, FK2R, RB4R, MWDR, ML8R, MWLR, MWJ5 and MWFR
were not joined in the network by TCS with 95% certainty, suggesting they possess a
greater number of nucleotide differences…………………………………………...….97
Figure 4-5. Mismatch distributions for A. The NJ Meadowlands terrapin population and
B. The Hempstead Bay terrapin population………………………………………….…103
Figure 4-6. Mismatch distributions for A. The Ruler’s Bar terrapin population and B. The
JFK airport terrapin population (Jamaica Bay)…………………………………...…….104
Figure 4-7. Mismatch distribution for all NY/NJ populations pooled together………...105

1
CHAPTER 1
INTRODUCTION
1.1. Herpetofaunal susceptibility to anthropogenic disturbance
Various animal and plant taxa have been affected by anthropogenic disturbance, but
herpetofauna represent some of the best examples of the consequences of human impact
on biotic communities. Reptiles and amphibians are particularly affected by
anthropogenic disturbance because of their limited dispersal capacity; the majority of
species cannot migrate long distances to avoid disturbance and are therefore forced to co-
exist with humans in oftentimes sub-optimal habitats. While some species may thrive in
human-modified habitats, active management is required to make sure that these species
do not suffer from the myriad threats possible in such altered landscapes. Furthermore,
herpetofauna, especially amphibians, also often require different microhabitats for
different life stages, and so are exposed to multiple types of threats. For these reasons,
reptiles and amphibians are often seen as environmental indicators, reflections of the
health of the ecosystems of which they are a part. Understanding the responses of
herpetofauna to the effects of human activities can provide critical information on causes
of environmental degradation and the steps needed to manage that degradation.

2
1.2. Amphibian Disease
Perhaps no other taxonomic group better represents the effects of anthropogenic
disturbance on the health of the planet than amphibians. This taxonomic group is
declining around the world (Whiles et al. 2006; Hamer and McDonnell 2008), with an
estimated one-third of amphibian species being currently threatened with extinction,
according to the IUCN Red List and the Global Amphibian Assessment (GAA)
(http://www.iucnredlist.org/initiatives/amphibians/analysis; Lips et al. 2006; Kriger and
Hero 2007). This report, initiated in 2004 and updated in 2006 and 2008, contains
disturbing information. The number of threatened amphibians will most likely increase in
the future, as 42% of all species show declines in their numbers, while less than 1% are
increasing. In 2004, habitat loss was the major threat facing amphibians, with pollution
considered the second largest threat (Mann et al. 2009). While the latest update of the
Assessment has continued to find significant roles for both habitat loss and pollution for
the disappearance of amphibians, the GAA has also documented a fungal disease
discovered in the late 1990s that has been sweeping through populations on all continents
that are home to amphibians (Daszak et al. 2001; Drew et al. 2006; Fisher et al. 2009;
Kerby and Storfer 2009; Van Sluys and Hero 2009). Drastic and rapid population
declines and even extinctions have been ascribed to this fungus, known as
Batrachochytrium dendrobatidis (Bd). Yet another class of emerging infectious diseases,
attributed to the genus Ranavirus (family Iridoviridae), has been linked to dramatic

3
amphibian declines as well (Daszak et al. 1999; Gascon et al. 2005; Forson and Storfer
2006; St-Amour and Lesbarrères 2007; Kerby and Storfer 2009).
These declining trends are disturbing for a number of reasons. Such a staggering loss in
biodiversity will undoubtedly have significant effects on ecosystems. Amphibians in
particular tend to constitute a large percentage of the biomass in healthy temperate and
tropical ecosystems and, as ectotherms, the energy they store in their biomass can be
efficiently transferred to higher trophic levels (Whiles et al. 2006; Hossack et al. 2010).
Moreover, due to their biphasic lifestyle, that energy transfer can take place between
aquatic and terrestrial systems, and therefore amphibians form an essential bridge
between these two systems (Davic and Hartwell 2004; Whiles et al. 2006). Besides being
prey for other animals, amphibians are essential predators of invertebrates, keeping the
population of many insect pests in check (Whiles et al. 2006). Some of these
invertebrates are decomposers and so the presence of amphibians influences
decomposition rates, which could have an effect on nutrient cycling and even carbon
dynamics (Wyman 1998). Tadpoles are important grazers in aquatic ecosystems and
therefore can influence patterns of primary productivity and can alter the community
composition of algae (Daszak et al. 1999; Whiles et al. 2006). Finally, many amphibians,
especially salamanders, construct underground burrows and therefore play a role in soil
dynamics (Davic and Hartwell 2004).

4
Compromised ecosystems may lead to compromised ecosystem services. Unchecked
insect pests could be vectors for either wildlife disease or human disease, an alteration in
algal composition could alter aquatic food webs and have an effect on fish populations,
and altered soil dynamics could facilitate colonization by invasive species. In addition,
researchers are just now understanding that amphibians secrete compounds from their
skin which may have significant beneficial effects on human health (Doyle et al. 2003).
Finally, it has been recognized that amphibians are environmental indicators and their
globally compromised situation is a direct reflection of the globally compromised
situation of Earth’s ecosystems (Kriger and Hero 2007).
1.3. Range Expansions and Invasion Biology
Colonization events, often the result of range expansions, are significant ecological and
evolutionary processes for a number of reasons (Slatkin 1987, Le Corre and Kremer
1998, Excoffier et al. 2009, Sexton et al. 2009), and understanding the genetic
consequences of those events can provide a wealth of information on the underlying
mechanisms and driving forces of colonization (Johnson 1988, Ibrahim et al. 1996,
Templeton 1998, Emerson et al. 2001, Ray et al. 2003). In particular, the genetic
structure of colonizing populations can lead to a better understanding of general
migration patterns of wildlife and how these are impacted by anthropogenic activities,
which is fundamental to wildlife management directives (Ernest et al. 2003, Pearse and

5
Crandall 2004, Sacks et al. 2005, Coulon et al. 2006, Schwartz et al. 2006, Dixon et al.
2007, Crompton et al. 2008, Brown et al. 2009).
One particularly relevant issue to wildlife management that can be examined through the
understanding of colonization events is “invasion biology” (Sexton et al. 2009). While
movement of organisms into novel areas is not a recent phenomenon, the unprecedented
rate at which animals are being introduced into naïve habitats in the modern era is most
likely attributable to human activities (Hulme 2009, Pyšek and Richardson 2010).
Humans now have access to virtually the entire globe and where humans go, so follow
pets as well as animal and plant hitchhikers (Rahel and Olden 2008). Human
modification of habitats also often facilitates the establishment of species that would
otherwise not have been able to thrive in a previously undisturbed habitat (Sakai et al.
2001). There is a healthy debate in the ecological community as to the threats posed by
non-native species (Sakai et al. 2001, Pyšek and Richardson 2010). Organisms that move
into novel territories (non-native or invasive) can have a variety of detrimental effects on
native species (Watts et al. 2010, Fitzpatrick et al. 2012). They may directly prey on
native species, thereby decreasing their numbers; they may also compete with native
species for resources, thereby decreasing their survival probability (Tolley et al. 2008,
Leavitt and Fitzgerald 2009).
Moreover, a more subtle threat can be found in the potential for interbreeding between
native and non-native species (Funk et al. 2009, Haynes et al. 2012). One of the metrics

6
used by humans in conserving biodiversity is genetic “distinctness”(Frankham 2010,
Laikre et al. 2010, Frankham et al. 2012). Breeding between native species and non-
native species will affect the gene pool of both species and could complicate conservation
strategies, especially if the native species are threatened or endangered (Haynes et al.
2012). Collecting information on the colonization process that led to the introduction of
the non-native species can help wildlife management agencies and researchers formulate
strategies to mitigate the impacts of the non-native species and possibly prevent large-
scale catastrophes from happening in the future (Leavitt and Fitzgerald 2009, Fitzpatrick
et al. 2012). In particular, examining the genetic structure of colonizers can help
determine the genetic front of colonization and therefore the potential geographic source
of colonizing individuals (Pearse and Crandall 2004, Torres-Leguizamón et al. 2011).
Models have been predicting significant changes in the distribution of amphibians,
particularly in in the central and eastern United States, linked to changes in climate
(Carey 2001, Excoffier et al. 2009, Hutchens and DePerno 2009, Lawler et al. 2009,
Blaustein et al. 2010). Changes in amphibian behavior linked to climate patterns have
already been documented; in NY State, frog species are calling 10-13 days earlier over
the past 100 years (Gibbs and Breisch 2001). The American Green Tree Frog (Hyla
cinerea) has been shown to have expanded its range in the central part of its distribution,
moving 110 km north of the previous northernmost population in Illinois (Tucker et al.
2008). This species has been shown to thrive in association with humans and may prove
to be an adept invader, taking advantage of climate change. In 2011, the first occurrence

7
of H. cinerea in New Jersey was documented, and this may be a result of this species
expanding its range north from Delaware (the previous northernmost limit of the eastern
part of its range). The temperature in NJ has already increased an average of 2 degrees F
since 1900 and winter temperatures have increased 4 degrees F since 1970. Rainfall has
increased 5-10%, and the predicted 2-8 degree F increase in temperature (Union of
Concerned Scientists 2007, Center for Integrative Environmental Research 2008, New
Jersey Climate Adaptation Alliance 2011) will see the regional climate of southern NJ
become comparable to the current climate of DE, thereby favoring the establishment of
green tree frogs. Management agencies are concerned about possible hybridization with
the state threatened Pine Barrens Tree Frog, as well as general ecosystem disruption if the
presence of H. cinerea truly is due to a range expansion and establishment of this novel
species in the state of New Jersey.
1.4. Turtles in Urban Environments
While amphibians may be bearing the brunt of anthropogenic disturbance when it comes
to herpetofauna, turtles have certainly not escaped unscathed (Marchand and Litvaitis
2004, Conner et al. 2005). The life history characteristics that have allowed turtles to
achieve evolutionary success over the millennia are those that are now unfortunately
rendering them susceptible to human activities (Gibbons et al. 2001). They are long-
lived, reach sexual maturity late and have overall low reproductive rates (Tucker et al.
2001, Baldwin et al. 2005); this limits their ability to rapidly respond to environmental

8
disturbance. In a related manner, their longevity often leads to the erroneous assumption
that populations are healthy, based solely on their present numbers, and management is
deemed unnecessary (Kuo and Janzen 2004). In order to avoid this assumption and
circumvent the effects of turtle life history characteristics on their susceptibility to
disturbance, long-term monitoring of turtle populations has been suggested (Allendorf et
al. 2004, Alter et al. 2007). Besides the ongoing collection of demographic data, which
can provide information on survival rates, recruitment rates and population
growth/decline (Claisse et al. 2008, Loughry et al. 2013), genetic data can also be
collected. Genetic data can provide invaluable information on past events, such as
population bottlenecks, that could not have been detected any other way and on current
processes, such as range expansions, that are difficult to detect with traditional field-
based technologies, such as population bottlenecks (Cunningham et al. 2002, Rosenbaum
et al. 2007, DeYoung and Honeycutt 2008). Data from demographic and genetic
monitoring can then be related to environmental influences and appropriate management
plans can be implemented (Allendorf et al. 2009, Koumoundouros et al. 2009, Schwartz
et al. 2006).
Information of this nature may be especially critical for turtle populations inhabiting
developed areas in order to understand how turtles and humans can successfully coexist.
Evidence suggests that turtles may be successful in urbanized areas, but they face a
variety of threats, such as habitat degradation, road mortality, collection for the pet trade
or food, predation by subsidized predators, etc. (Marchand and Litvaitis 2004, Conner et

9
al. 2005). Only through ongoing monitoring can the severity of those threats be
understood and mitigated. Understanding how to manage turtles in developed areas is
necessary as more and more development encroaches on turtle habitat and turtles face
limited dispersal options.
1.5. Research Questions and Dissertation Structure
The overall goal of this dissertation work was to use molecular tools and field-based
approaches to address the consequences of a variety of human activities on the health of
amphibian and reptile populations. The results of the studies completed as part of this
dissertation are being shared with local, state and national environmental and wildlife
management agencies (such as the NJ Division of Fish and Wildlife, the National Park
Service and the NJ Meadowlands Commission) to inform management strategies relevant
to New Jersey herpetofauna.
This dissertation is written as a series of individual manuscripts and therefore there is
some necessary repetition with the Methods sections. The individual chapters address the
following objectives:
In Chapter 2, entitled “Emerging Infectious Diseases in New Jersey”, I returned to the
site of the first documented occurrence of Batrachochytrium dendrobatidis (Monsen-
Collar et al. 2010) at the New Jersey School of Conservation and was alerted to a mass

10
tadpole die-off in southern NJ with characteristics similar to Ranavirus outbreaks. In this
study, then, I aimed to document the occurrence and extent of these two emerging
infectious diseases, chytridiomycosis and Ranavirus, in the state of New Jersey in
collaboration with state and regional wildlife management agencies.
In Chapter 3, entitled “Hopping into New Territory: A Case of Amphibian Range
Expansion in New Jersey”, I examine the recent appearance of the American Green Tree
frog, Hyla cinerea, in New Jersey. My aim was to determine the most likely source
population for the Hyla cinerea that colonized New Jersey. This would help understand
whether or not the presence of this species represented a range expansion, which could
potentially be linked to habitat modification as a result of climate change. Because
Delaware was the closest geographical location that was inhabited by green tree frogs,
my hypothesis was that the H. cinerea in NJ originated via range expansion from
Delaware. Furthermore, this study documents the current range of Hyla cinerea in NJ, to
determine whether this species existed in an isolated pocket or if it was expanding
throughout the state.
The study which is the subject of Chapter 4, entitled “Anthropogenic Disturbance and
Wildlife: Diamondback Terrapins in Urban Environments”, had a number of objectives:
i) To examine the genetic diversity of Diamondback terrapins in urbanized areas of
NY/NJ, including Jamaica Bay Wildlife Refuge, Hempstead Bay, JFK and the NJ

11
Meadowlands using mitochondrial DNA; I was also interested in determining whether a
mitochondrial marker would possess the genetic signature of a bottleneck event due to
the intense overharvesting of terrapins until the early 1900s.
ii) To examine the relatedness of Diamondback terrapins in those urbanized areas to
understand potential connections between terrapin populations; I was also interested in
specifically examining the relationship between the terrapins in the Meadowlands and the
other populations to understand the origin of the Meadowlands terrapins population.
iii) To determine population parameters of the Meadowlands terrapins including
population size, survival rates and recruitment rates.
Finally, in Chapter 5, I discuss the management implications of the studies completed.

12
CHAPTER 2
EMERGING INFECTIOUS DISEASES OF AMPHIBIANS IN NEW JERSEY
Abstract
While habitat loss and pollution continue to be significant threats to amphibians,
emerging infectious diseases are playing a considerable role in the disappearance of these
ecologically important organisms. In this study, I used molecular techniques to document
and assess the prevalence of two amphibian diseases, chytridiomycosis (caused by the
chytrid fungus, Batrachochytrium dendrobatidis) and Ranavirus, throughout the state of
New Jersey. In 2009, the first known occurrence of the chytrid fungus, Bd, was
documented in the state. Further sampling has not revealed any new cases of Bd in NJ. In
2011, I documented the first known occurrence of Ranavirus in New Jersey amphibians.
Using a combination of traditional PCR and RT-PCR I showed the presence of this
emerging infectious disease in both Green Frog (Lithobates clamitans) tadpoles and
Fowler’s Toad (Anaxyrus fowleri) tadpoles at a site within the Pinelands, in Ocean
County, as well as in L. clamitans tadpoles at the NJ School of Conservation, in Sussex
County. Nine other sites in New Jersey have also tested positive for Ranavirus infection.
So far, only tadpoles seem to be affected in these areas, with dramatic symptoms being
exhibited especially by Green Frog tadpoles. This disease, however, has been shown to
impact both larval and adult amphibians, as well as reptiles. Additionally, my research
13
showed a difference between traditional and RT-PCR, with RT-PCR revealing a much
higher rate of infection than traditional PCR. The Ocean County site is home to many
reptile and amphibian species, including the threatened Pine Barrens Treefrog and the
threatened Pine Snake. The NJ School of Conservation site is home to a wide variety of
herpetofauna as well, including the Jefferson salamander, which is a species of special
concern in NJ. Little is known about Ranavirus’ ecology and transmission in the wild, or
its potential impact on species already in decline. Further investigation of the extent of
Ranavirus infection in New Jersey and its impact on both stable and declining species is
critical.

14
2.1. Introduction
Perhaps no other taxonomic group better represents the loss of biodiversity and the
effects of anthropogenic disturbance on the health of the planet than amphibians. This
taxonomic group is declining around the world (Whiles et al. 2006; Hamer and
McDonnell 2008), with an estimated one-third of amphibian species currently threatened
with extinction, according to the IUCN Red List and the Global Amphibian Assessment
(GAA) (http://www.iucnredlist.org/initiatives/amphibians/analysis; Lips et al. 2006;
Kriger and Hero 2007). The GAA, initiated in 2004 and updated in 2006 and 2008,
contains disturbing information. The number of threatened amphibians will most likely
increase in the future, as 42% of all species show declines in their numbers, while less
than 1% are increasing. In 2004, habitat loss was the major threat facing amphibians,
with pollution considered the second largest threat (Mann et al. 2009). While the latest
update of the Assessment documents significant roles for both habitat loss and pollution
for the disappearance of amphibians, the GAA now documents a fungal disease
discovered in the late 1990s that has been sweeping through populations on all continents
that are home to amphibians (Daszak et al. 2001; Drew et al. 2006; Fisher et al. 2009;
Kerby and Storfer 2009; Van Sluys and Hero 2009). Drastic and rapid population
declines and even extinctions have been ascribed to this fungus, known as
Batrachochytrium dendrobatidis (Bd). Yet another class of emerging infectious diseases,
attributed to the genus Ranavirus (family Iridoviridae), has been linked to dramatic
amphibian declines as well (Daszak et al. 1999; Gascon et al. 2005; Forson and Storfer

15
2006b; St-Amour and Lesbarrères 2007; Kerby and Storfer 2009). As of the 2008 GAA
update, moreover, a number of declines have no clear cause, making amphibian
conservation extremely difficult
(http://www.iucnredlist.org/initiatives/amphibians/analysis; Schiesari et al. 2007).
These declining trends are disturbing for a number of reasons. Such a staggering loss in
biodiversity will undoubtedly have significant effects on ecosystems. Amphibians in
particular tend to constitute a large percentage of the biomass in healthy temperate and
tropical ecosystems and, as ectotherms, the energy they store in their biomass can be
efficiently transferred to higher trophic levels (Whiles et al. 2006; Hossack et al. 2010).
Moreover, due to their biphasic lifestyle, that energy transfer can take place between
aquatic and terrestrial systems, and therefore amphibians form an essential bridge
between these two systems (Davic and Hartwell 2004; Whiles et al. 2006). Besides being
prey for other animals, amphibians are essential predators of invertebrates, keeping the
population of many insect pests in check (Whiles et al. 2006). Some of these
invertebrates are decomposers and so the presence of amphibians influences
decomposition rates, which could have an effect on nutrient cycling and even carbon
dynamics (Wyman 1998). Tadpoles are important grazers in aquatic ecosystems and
therefore can influence patterns of primary productivity and can alter the community
composition of algae (Daszak et al. 1999; Whiles et al. 2006). Finally, many amphibians,
especially salamanders, construct underground burrows and therefore play a role in soil
dynamics (Davic and Hartwell 2004).

16
Compromised ecosystems may lead to compromised ecosystem services. Unchecked
insect pests could be vectors for either wildlife disease or human disease, an alteration in
algal composition could alter aquatic food webs and have an effect on fish populations,
and altered soil dynamics could facilitate colonization by invasive species. In addition,
researchers are just now understanding that amphibians secrete compounds from their
skin which may have significant beneficial effects on human health (Doyle et al. 2003).
Finally, it has been recognized that amphibians are environmental indicators and their
globally compromised situation is a direct reflection of the globally compromised
situation of Earth’s ecosystems (Kriger and Hero 2007).
2.1.1. Emerging Amphibian Diseases
2.1.1.1. Chytridiomycosis
A number of amphibian declines in the last two decades have been attributed to the
emerging infectious disease chytridiomycosis, caused by the fungus Bd. The fungus was
discovered in 1998 when researchers from both Panama and Australia simultaneously
noticed massive die-offs of amphibians; at the same time, a captive blue poison dart frog
at the United States National Zoological Park also died of a mysterious disease (Berger et
al. 1998; Daszak et al. 1999; Retallick et al. 2004; Gascon et al. 2005; Fisher et al.
2009). The fungus that was isolated from these events constituted a new genus and
species. Like the other members of the phylum to which it belongs (the

17
Chytridiomycota), Bd produces motile zoospores and does not produce hyphae. Chytrids
are abundant and varied, found in both soil and water and are capable of utilizing a
number of different substrates, such as chitin, cellulose and keratin. Some are important
to ecosystems as decomposers while others parasitize nematodes, insects, plants and
algae. Bd is currently the only known chytrid that is pathogenic to vertebrates (Berger et
al. 1999; Gascon et al. 2005).
Bd’s motile, flagellated zoospores infect the keratinized tissue layers of amphibian skin.
In adults and juveniles, Bd infection causes skin to thicken and is thought to kill its hosts
via the disruption of osmoregulation and/or release of toxins; the exact mechanism of
death is still unknown. Amphibian larvae can be infected, though infection is limited to
mouthparts, as these are the only keratinized portion of the larval body. Infection in
larvae does not lead to death (Berger et al. 1998; Carey et al. 2006; Voordouw et al.
2010). Analysis of Bd has failed to demonstrate the existence of resistant spores capable
of tolerating extreme environmental conditions, and therefore it is thought that Bd is a
relatively fragile species. Laboratory experiments have shown that Bd’s optimal growth
temperature is between 15 and 25 ° C. While it may be able to survive freezing for short
periods of time, temperatures above 29 ° C are lethal (Piotrowski et al. 2004). It does not
survive desiccation and water or moisture is required for transmission of zoospores
(Berger et al. 1999; Daszak et al. 1999; Kriger and Hero 2007; Voordouw et al. 2010).

18
The majority of drastic and rapid population declines ascribed to Bd have occurred in
upland, pristine areas (Retallick et al. 2004; Gascon et al. 2005; Lips et al. 2006; Whiles
et al. 2006; Hamer and McDonnell 2008; Van Sluys and Hero 2009). In Central America,
time to decline was approximately four to six months, while in Australia, populations
plummeted at an even faster rate, in six to eight weeks (Gascon et al. 2005). Many
populations were completely wiped out. Until the fungus was isolated, the declines were
highly enigmatic because these areas were not seen to be suffering greatly from habitat
loss and pollution. In these upland habitats, it is believed that cold temperature is the
major determining factor leading to such a high impact of Bd on amphibians (Drew et al.
2006; Mann et al. 2009; Van Sluys and Hero 2009). Interestingly, Bd has also been found
in lowland habitats, but the outcomes of the presence of the fungus are quite different. In
these kinds of habitats, amphibians actually seem able to persist with a certain level of Bd
endemic in the population (Daszak et al. 2001; Briggs et al. 2005; Carey et al. 2006;
Mann et al. 2009).
2.1.1.2. Ranavirus
While in the past much more attention was given to Bd, researchers are now starting to
shift their focus to the Ranaviral diseases, as their effects may be even more severe and
dramatic than those caused by Bd. Ranavirus was first isolated in the mid-1960s, from
Lithobates pipiens (Gray et al. 2009b) and has been found to be part of a group of
double-stranded icosahedral viruses. The type species is Frog Virus-3 (FV-3) (Mao et al.

19
1997; Densmore and Green 2007), but there appear to be multiple strains within the
Ranavirus group capable of infecting fish, amphibians and reptiles (Forson and Storfer
2006a; Densmore and Green 2007; St-Amour and Lesbarrères 2007). Die-offs of
common toads (Bufo bufo) and common frogs (Rana temporaria) in the United Kingdom
have been attributed to Ranaviral diseases (Forson and Storfer 2006a; Balseiro et al.
2007, Gray et al. 2009a) and the United States, Australia, Japan, Italy and Spain have
also seen massive amphibian die-offs. Unlike the situation with Bd, die-offs are not
mainly restricted to pristine areas. Die-offs also occur at a much more rapid rate, often
with close to 100% mortality after less than two weeks. The virus causes skin ulcerations
and massive internal hemorrhaging (St-Amour and Lesbarrères 2007) leading to
abdominal edema (Une et al. 2009). Behaviorally, infected frogs are lethargic and swim
slowly and erratically. Tadpoles are the most vulnerable amphibian life stage (Daszak et
al. 1999), though adults are susceptible as well. Teacher et al. (2010) have noted that
Ranaviral outbreaks seem to infect tadpoles at a higher rate in North America, while
outbreaks in the UK seem to involve adults at a higher rate, though there is no clear
explanation for this.
There is as of yet no clear link between population or environmental characteristics and
probability of Ranavirus presence (Densmore and Green 2007). Studies point to pond-
breeding amphibians being the most severely affected group, though outcomes of
exposure to the virus are by no means identical among all species (Harp and Petranka
2006, St-Amour and Lesbarrères 2007). A number of researchers have noted that

20
Ranavirus replication is at its optimum at warmer temperatures, and this would seem to
be consistent with the fact that most outbreaks are observed during summer months.
Some lab studies seem to indicate that virus replication slows below 15° C (Teacher et al.
2010). Others, however, have postulated that it may be more likely that tadpoles are
infected during the winter; detection of die-offs during the summer may merely be a
result of higher visibility of amphibians and easier access to sites, increasing detection
probabilities (Gray et al. 2009b). While there is uncertainty with regards to temperature
and prevalence of Ranavirus, evidence suggests that dry conditions may be linked to
disease outbreaks. During dry periods, amphibian breeding ponds dry up, leading to
increased population density, and this increase in density is linked to increased infection
rates (Greer et al. 2005). St-Amour et al. (2008) have found that there is a positive
correlation between Ranavirus outbreaks and anthropogenic disturbance, though the exact
cause of this remains unknown. Gray et al. (2009b) found that tadpoles inhabiting
wetlands visited by cattle were almost 4 times more likely to be infected with Ranavirus
compared to tadpoles in wetlands to which cattle did not have access. Lower amounts of
vegetation surrounding wetlands with cattle may have caused individuals to congregate
and increase risk of infection. Alternatively, the presence of agricultural pollutants in
wetlands accessible to cattle may have had an effect on the presence of Ranavirus (Gray
et al. 2009b). The effect of pollutants on the incidence of Ranavirus, though, is still
unclear. As with Bd fungus, there is some evidence that low levels of chemical pollutants
may actually be beneficial for amphibians in avoiding disease outbreaks; the pollutants

21
may interfere with the disease organisms’ ability to infect hosts (Forson and Storfer
2006a, Forson and Storfer 2006b).
Though there is debate over whether or not Ranavirus (and Bd for that matter as well) is a
pathogen that has recently evolved or that has always been present but has recently
become virulent, the evidence is clear that both of these diseases have reached their
global distribution mainly due to human activities. In parts of the United States,
salamander larvae are sold as fish bait; studies have shown that many of these larvae are
infected with Ranavirus (Picco et al. 2007, Schloegel et al. 2009). Ranavirus can also
persist in wet sediment and water for up to two weeks (Daszak et al. 1999, Gray et al.
2009b) and boots, vehicles and equipment that are not properly cleaned can transport
virus particles in sediment and water between sites. What is particularly troubling is the
fact that once Ranavirus is present in ponds, the disease can persist in amphibian
populations and re-infect individuals on a yearly basis (Greer et al. 2005, Teacher et al.
2009). Besides persistence in the environment, this re-infection is due to the fact that
different life stages can remain sublethally infected and serve as reservoirs. Some
individuals may remain asymptomatic, while others can survive symptoms; indeed,
researchers have found frogs with scars that seem to have resulted from skin ulcerations
(consistent with Ranavirus) (Teacher et al. 2009). Metamorphs leaving their natal ponds
for overwintering grounds have been shown to asymptomatically carry infection (Brunner
et al. 2004). Adults returning to breeding ponds after overwintering have been shown to
carry mild infections (Brunner et al. 2004). Salamanders infected with Ambystoma

22
tigrinum virus (a member of the Ranavirus group closely related to FV3) may remain
asymptomatic yet infective for up to 5 months from initial exposure to the virus (Brunner
et al. 2005).
Transmission occurs either through direct contact with infected animals (for example, via
cannibalism in tadpoles) or direct contact with the virus in water or moist sediment
(Brunner et al. 2005). Cannibalism seems to greatly decrease time to death; death often
occurs a mere few days after ingesting infected carcasses and 90% mortality has been
observed within 5-12 days (Pearman et al. 2004, Harp and Petranka 2006). Because
certain individuals seem to remain asymptomatic during disease outbreaks, it seems
likely that there exists some form of immunity to the virus among amphibians (Greer et
al. 2005). This immunity appears to be genetic rather than environmental (in many
cases), as susceptibility to Ranavirus infection was shown to differ among clutches
(Brunner et al. 2005). Genetic diversity in amphibian hosts seems to play an important
role in Ranavirus outbreaks (Gray et al. 2009b), with low levels of heterozygosity
corresponding to higher susceptibility to infection and slower recovery times (Pearman et
al. 2004).
2.1.2. Study Objectives
Monsen-Collar et al. (2010) were the first to document the presence of the fungus
Batrachochytrium dendrobatidis in the state of New Jersey at the NJ School of

23
Conservation (NJSOC). Because this is a site used by school groups and researchers who
have the potential of carrying infective particles to other sites, particular attention was
paid to documenting the full extent of Bd at the NJSOC. In 2011, we were alerted to a
mass tadpole die-off in southern NJ (Ocean County), with characteristics similar to
Ranavirus outbreaks. Given that Ranavirus was present in states neighboring NJ, we
suspected this virus was the cause of the massive tadpole die-off. In collaboration with
state and regional wildlife management agencies, then, this study aimed to document the
occurrence and extent of the two emerging infectious amphibian diseases,
chytridiomycosis and Ranavirus, in New Jersey.
2.2. Materials and Methods
Amphibians were retrieved by net or by hand in wetlands that were chosen in
collaboration with the NJ Division of Fish and Wildlife Endangered and Non-game
Species Program (NJDFW) biologists. Wetlands were chosen based on accessibility and
proximity to NJ Calling Amphibian Monitoring Project (CAMP). For Bd, only adults and
metamorphs were sampled, while for Ranavirus, the attempt was made to sample all life
stages, though tadpoles were the most frequently sampled. Between June and August of
2009, 27 samples for Bd testing were collected from amphibians of various species, along
with 16 water samples, at the NJ School of Conservation (Sussex County). Between 2010
and 2013, sampling for both Bd and Ranavirus occurred throughout the state (Table 2-1,
Table 2-2, Table 2-3).

24
Tab
le 2
-1. 2
01
0 s
amp
lin
g in
form
atio
n f
or
asse
ssm
ent
of
Ba
tra
cho
chyt
riu
m
den
dro
ba
tid
is.

25
Table 2-2. 2011 sampling information for assessment of Batrachochytrium dendrobatidis.

26
2.2.1. Bd Sampling
In order to sample for Bd, a cotton swab was passed over the dorsal and ventral surfaces
of amphibians, focusing on the ventral surface of limbs and where the limbs meet the
trunk of the body (Kriger et al. 2006; Monsen-Collar et al. 2010). Swabs were then
Table 2-3. 2011-2013 sampling information for assessment of Ranavirus.

27
placed in an empty Eppendorf tube. Within 8 hours of sampling, tubes were stored at -20
° C until they were processed. For processing, 200 µl of deionized water was added to
each Eppendorf tube containing a swab. Each tube was then vortexed for approximately
30 seconds and then boiled for 10 minutes (Monsen-Collar et al. 2010). The liquid was
then used as template DNA for RT-PCR. Primers Bd1a and Bd2a were used (Annis et al.
2004), along with Brilliant II SYBR Green QPCR MasterMix (Agilent Technologies) for
a reaction volume of 25 µl and following the procedure outlined in Monsen-Collar et al.
(2010). Concentrations were as follows: 1X Brilliant II SYBR Green MasterMix, 0.4 μM
Forward and Reverse primers. Parameters were as follows: 95° C for 10 minutes, 40
cycles of 95° C for 45 seconds, 60° C for 30 seconds, 72° C for 30 seconds (Monsen-
Collar et al. 2010). Appropriate positive controls consisting of Bd DNA isolate using the
same boiling technique and negative controls using water in place of DNA were run for
comparison for all samples tested. Samples were run in a Stratagene Model Mx 3000 P
Thermalcycler (Stratagene Technologies). Samples were considered positive if they
displayed an exponential increase in fluorescence comparable to the positive control.
2.2.2. Ranavirus sampling
Previous research has shown that Ranavirus DNA can be detected from toe clips of
infected amphibians (St-Amour and Lesbarrères 2007). Therefore, toe clips were taken
from adult and metamorph amphibians and stored in an Eppendorf tube containing
Drierite desiccant to preserve Ranavirus DNA. Tubes were stored at room temperature

28
until ready for processing. When tadpoles were encountered, either tail clips were taken
(if the individual appeared asymptomatic) or the entire tadpole was collected (if the
individual was dead or manifested symptoms consistent with Ranavirus infection). Tubes
of entire tadpoles were stored on ice and then frozen at -20° C until ready for extraction.
In addition to sites chosen with NJDFW, the Stafford Business Park site in Ocean County
(Figure 2-1) was sampled because of the occurrence of a mass die-off of Lithobates
clamitans tadpoles (R. Zappalorti, pers. comm.). The cause of this die-off was unknown.
We visited the site on May 17, May 26 and June 16, 2011 and May 22, 2012. We used a
dip net to collect any tadpoles that were either dead or dying, placed them in Eppendorf
tubes and took them back to the lab to be frozen at -20° C. We also collected live,
apparently healthy, Anaxyrus fowleri tadpoles along with pond water in Eppendorf tubes;
after a period of approximately 30 seconds in the tubes, A. fowleri tadpoles were released
back into ponds, while the water was retained and brought back to the lab to be frozen
and then processed. Adult animals were treated as above, and toe clips were taken and
stored in Drierite desiccant. After toe removal they were released at the point of capture.
We opportunistically sampled a dead snapping turtle by removing a piece of tail and the
shed skin of a northern water snake. Samples were also taken at the NJ School of
Conservation (Sussex County) after encountering a die-off of L. clamitans tadpoles.
Entire tadpoles were taken back to the lab in the manner outlined above.

29
Total genomic DNA extraction was carried out on toe clips of adult amphibians; for
tadpoles, I used either the entire body of small individuals or large sections of the tail for
larger individuals. Extraction was performed via proteinase K digestion and silica spin
column using a QIAmp DNA Mini Kit (QIAGEN) following the manufacturer’s
instructions. ProK digests were left overnight in a 56° C water bath and after
approximately 24 hours, tubes were placed at -20° C for at least 2 days. This seemed to
increase DNA yield.
Figure 2-1. Location of reported mass die-off of L. clamitans tadpoles, due to suspected Ranavirus outbreak.

30
Both traditional PCR and RT-PCR were performed on samples from Stafford Business
Park and the NJSOC. RT-PCR was performed on all additional Ranavirus samples from
throughout the state. The same primers, MCP4 and MCP5 (Mao et al. 1997), were used
for both types of PCR. This primer pair was designed to amplify a fragment of the gene
that encodes for the major capsid protein; PCR product length was approximately 530 bp.
Traditional PCR reactions were carried out in a total volume of 25 μl, with concentrations
of reagents as follows: 1x PCR Buffer, 1.5 mM Magnesium Chloride, 0.2 mM dNTPs,
0.4 μM each of Forward and Reverse primer, and 0.1 units of taq polymerase. Two (2) μl
of genomic DNA was used. PCR parameters were as follows: initial denaturation at 94°
C for 2.5 minutes, followed by 25 cycles of denaturation at 94° C for 30 seconds,
annealing at 50° C for 30 seconds, extension at 72° C for 30 seconds and a final
extension at 72° C for 10 minutes. Reactions were run in a GeneAmp 9700 Thermocycler
(Applied Biosystems). PCR products were run on a 2% 1XTAE agarose gel with SYBR
Safe (Invitrogen) gel stain to check for the presence of the approximately 530-bp
Ranavirus-specific amplification product. Six PCR products that were considered positive
by examining a 2% agarose gel were sequenced (ABI 3130 Genetic Analyzer) and
compared to sequences deposited in GENBANK known to originate from the Ranavirus
major capsid protein gene. The samples showed over 99% similarity to Frog Virus-3 and
thus we were confident the PCR products that had been amplified were Ranavirus.
RT-PCR reactions were carried out in a total volume of 10 μl, with 4.6 μl of genomic
DNA and amounts of reagents as follows: 1X Brilliant II SYBR Green RT-PCR Master

31
Mix (Agilent Technologies), and 0.4 μM Forward and Reverse primers. The positive
control was DNA from a Lithobates clamitans tadpole that had consistently tested
positive for Ranavirus using traditional PCR (and which had been sequenced to confirm
its identity). Amplification parameters were as follows: 10 minutes at 95° C, 40 cycles of
95° C for 45 seconds, 50° C for 30 seconds and 72° C for 30 seconds. Reactions were run
on a StepOne Plus Real Time PCR System (Life Technologies). Samples were scored as
positive if the fluorescence was at least as high as the positive control and the melting
curve was equivalent to the melting curve of the positive control (Figure 2-7, Figure 2-8).
2.3. Results
2.3.1. Batrachochytrium dendrobatidis
Results from the screen for Batrachochytrium dendrobatidis were all negative, with the
exception of 2 Lithobates clamitans and one water sample collected at the NJSOC in
2009. No further occurrence of the Bd fungus has since been documented at the NJSOC.
When examining temperature and precipitation averages, The period from June to August
2010 was hotter and drier than the period between June to August 2009 (Table 2-4); Bd is
sensitive to temperate and moisture and the choice was made to sample during cooler
months at the NJSOC. Results were still negative. Furthermore, screens for Bd
throughout the state remained negative as well.

32
2.3.2. Ranavirus
We sampled six ponds at the Stafford Business Park site (Figure 2-2) and in 2011, three
of the six ponds contained amphibians that tested positive for Ranavirus using traditional
and RT-PCR. This is the first documented case of the disease in NJ. All adults collected
at Stafford appeared healthy, with the exception of one dead Southern leopard frog
(Lithobates sphenocephalus). The dead Southern leopard frog tested positive for
Ranavirus. No other adult tested positive on any of our trips. When we first visited the
site, on May 17, there were mass die-offs of Lithobates clamitans tadpoles (Figure 2-
3.A); a number of L. clamitans tadpoles that were not dead were symptomatic for
Ranavirus (red lesions, swelling, erratic swimming behavior) (Figure 2-3.B, 2-5.A).
Other species present at the time but not symptomatic were Hyla spp. and Anaxyrus
Table 2-4. Mean precipitation and temperature in Sussex County for the period June-August for years 2009 and 2010. Taken from the Office of the New Jersey State Climatologist (http://climate.rutgers.edu/stateclim/)

33
fowleri. Traditional PCR results (Figure 2-4) indicated that 24 animals tested positive for
Ranavirus in 2011. Twenty (20) of those positives were Lithobates clamitans tadpoles.
While there were no symptomatic A. fowleri tadpoles on our first visit, during our second
visit (May 26 2011), there appeared to be mass mortality of A. fowleri tadpoles and some
A. fowleri tadpoles exhibited symptoms of Ranaviral disease. Out of six dead tadpoles
collected, three tested positive for Ranavirus. A. fowleri tadpoles had been observed
feeding on the carcasses of dead L. clamitans tadpoles (Figure 2-3.C).
During one of our sampling sessions at the NJSOC, a number of dead Lithobates
clamitans tadpoles were observed in a vernal pool known to be home to a large breeding
population of Wood frogs (Lithobates sylvaticus) and Spotted salamanders (Ambystoma
maculatum). Tadpoles were examined and found to display symptoms consistent with
Ranaviral disease (Figure 2-5. B.). Six tadpoles were collected and traditional PCR of tail
clips was carried out; one sample tested positive.

34
Figure 2-2. Six ponds that were sampled for Ranavirus at Stafford Business Park. In 2011, Hay Pond had 0/18 positive, Beach Pond had 0/2 positive, MF Ponds (2 ponds close enough together that they were treated as one) had 4/17 and 0/11 positive, Mitigation Pond had 26/48 positive, Costco Pond had 2/13 positive and Spotted Pond had 0/2 positive. In 2012, a total of 24 samples were collected from Hay Pond, Costco Pond and Mitigation Pond. Sixteen were positive for Ranavirus, including samples from Hay Pond and Beach Pond, which had been free of infection in 2011.

35
Figure 2-3. Pictures taken at Stafford Business Park site to document Ranavirus outbreak. A. Mass die-off of Lithobates clamitans tadpoles. B. Dying L. clamitans tadpole exhibiting swelling and erratic swimming behavior. C. Apparently healthy Anaxyrus fowleri tadpoles feeding on the carcass of an L. clamitans tadpole.
A.
B.
C.

36
2.3.2.1. Rate of Infection: Traditional PCR vs. RT-PCR
To test whether RT-PCR was more sensitive at picking up lower viral loads, we screened
all the Stafford samples with RT-PCR. Thirty-two samples out of 114 tested positive with
RT-PCR, as opposed to 24 that tested positive with traditional PCR. With traditional
PCR, the 14 water samples from asymptomatic A. fowleri tadpoles collected on May 17,
2011 had all tested negative for Ranavirus. With RT-PCR, on the other hand, eight of
those water samples tested positive. For samples collected in 2012, we only screened
with RT-PCR and found 16 samples out of 24 collected were positive. Two ponds where
Figure 2-4. Sample 2% Agarose gel on which were run traditional PCR products. The first and last line contain DNA size standard. PCR products are slightly larger than 500 bp, making them likely candidates for the Ranavirus major capsid protein gene. Sequencing later confirmed this. The lane marked with “*” is the negative control.
*

37
no positives had been found in 2011 were positive for Ranavirus in 2012, suggesting that
the infection had spread. The six NJSOC samples were screened with RT-PCR as well
and four tested positive (See Figure 2-7 for representative positive sample), as compared
to one when the samples were screened using traditional PCR (Table 2-5).
Additionally, as part of a regional assessment for Ranavirus, RT-PCR has been used to
document Ranavirus in eight additional sites in New Jersey, including four in Warren
County, one in Morris County, two additional sites in Sussex County and one in Passaic
County (See Figure 2-6 for summary map).
Table 2-5. Comparison between number of positives obtained using traditional PCR and number of positives obtained using RT-PCR.

38
Figure 2-5. Characteristic swelling and red lesions associated with Ranavirus infection. A. L. clamitans from Stafford Business Park Site. B. L. clamitans taken from NJSOC.
A.
B.

39
Figure 2-6. Map summarizing Ranavirus findings to date. Colored counties are those in which Ranavirus has been found. Number indicates number of sites that have tested positive for Ranavirus. To date, three sites in Sussex County, four in Warren County, 1 each in Morris, Passaic, Camden and Ocean Counties.

40
Figure 2-7. Fluorescence plot (A) and melting curve plot (B) for positive control (L. clamitans tadpole that consistently tested positive for Ranavirus major capsid protein gene, and PCR product was sequenced to confirm identity).
A.
B.

41
Figure 2-8. Fluorescence curve plot (A) and melting curve plot (B) of representative sample from NJSOC L. clamitans individual from die-off
that tested positive for Ranavirus.
A.
B.

42
2.4. Discussion and Conclusions
2.4.1. Batrachochytrium dendrobatidis
Given the fact that Bd has caused rapid and massive die-offs in amphibian populations
around the world, we were concerned with the effect the fungus would have on the
amphibians at the NJSOC once it had been detected. To our surprise, however, we did not
detect Bd at the School of Conservation after 2009 despite extensive sampling. This
could have been due to a mass mortality event that decimated amphibian species that
served as hosts to the fungus; in the absence of hosts, the fungus would have drastically
decreased in abundance, possibly to the point of escaping detection. Since the site is used
by school groups and is home to staff that live on-site, though, any mass mortality event
involving amphibians is unlikely to have gone unnoticed. What seems more likely is that
environmental conditions were unfavorable for the growth of Bd. Indeed, the
precipitation decreased and the temperature increased in 2010 when compared to 2009.
Bd has been shown to be a relatively fragile species of fungus, which does not tolerate
heat; desiccation is lethal to the species.
2.4.2. Ranavirus
While Bd was not found in samples screened from various locations throughout NJ, an
increasing number of samples have tested positive for Ranavirus since the initial

43
discovery of the pathogen in the state in 2011. Ponds that were uninfected at the Stafford
Business Park site in 2011 were affected in 2012 and symptomatic animals were found in
all ponds tested, suggesting that the infection was spreading. Locations adjacent to the
Stafford Business Park site are home to breeding habitat for the threatened Pine Barrens
tree frog (Hyla andersonii). The NJ population of this amphibian is one of three known
disjunct populations and it is unique in that it is the northernmost population of this
species. The disjunct nature of this population means that if the population is decimated
(through a Ranavirus outbreak, for example), no ready source of migrants exists to keep
the population from being extirpated. The Pine Barrens tree frog has already suffered
from habitat loss and degradation and an outbreak of Ranavirus would have a significant
negative impact on its long-term survival prospects in the state. The location of the
Ranavirus outbreak at the NJ School of Conservation, as mentioned, was a vernal pool
that is a known breeding location for obligate vernal pool breeders. Besides wood frogs
and spotted salamanders, which have been documented at this site on a number of
occasions, a Jefferson salamander was documented at this location at least once;
Jefferson salamanders are a species of special concern in NJ. The NJ School of
Conservation is within the known range of the endangered Blue-Spotted salamander
(though to my knowledge none has been documented at the School of Conservation).
Ranavirus at these locations is troubling for the effect it may have on these ecologically
sensitive amphibian species. Additionally, Ranavirus has been documented in eight
additional sites in New Jersey, suggesting this pathogen is widespread throughout the
state.

44
Amphibians are not the only ones under threat from Ranavirus, though. Stafford Business
Park is a developed site that is being managed for conservation of the threatened
Northern Pine Snake (Pituophis melanoleucus). Ranavirus has unfortunately been
documented in reptiles, oftentimes with dramatically severe symptoms and high rates of
mortality. To this date, box turtles (DeVoe et al. 2004), gopher tortoises (Westhouse et
al. 1996), Hermann’s tortoise (Marschang et al. 1999), soft-shelled turtles (Zhao et al.
2007), leaf-tailed geckos (Marschang et al. 2005) and green pythons (Hyatt et al. 2002)
have shown susceptibility to Ranavirus-like pathogens. This is disturbing for two reasons.
First of all, the presence of Ranavirus at a site of known Northern Pine snake breeding
habitat could put this threatened NJ reptile species at risk of further population decline.
Second, though some populations may immediately die out after an outbreak of
Ranavirus, while others may survive and never show signs of infection again, there are a
number of populations that have been documented to become infected on a yearly basis.
Re-infection by Ranavirus depends on reservoirs. Reptiles throughout NJ could serve as
additional reservoirs for the virus, making re-infection of amphibian populations not only
possible, but also likely.
Furthermore, this study points to the importance of using the most sensitive method
possible for detecting Ranavirus, in particular in environmental samples (in the absence
of significant tissue). Traditional PCR is significantly less expensive than RT-PCR, but
may only be valid if the goal is to determine presence/absence in a particular location and
only if tissue samples from animals at advanced stages of the disease are available.

45
Indeed, traditional PCR of water from asymptomatic A. fowleri tadpoles from the
Stafford Business Park site tested negative with traditional PCR. Using RT-PCR, 8 out of
14 of those samples tested positive for Ranavirus DNA. Traditional PCR resulted in 1 out
of 6 positives from the NJ School of Conservation outbreak, while RT-PCR resulted in 4
out of 6 positives. RT-PCR, therefore, is the more sensitive method and should be
employed whenever possible, especially to test for Ranavirus in environmental samples
(e.g. water, soil).
The World Organization for Animal Health (OIE) has listed Ranavirus, as well as
chytridiomycosis, as “notifiable diseases”, legally obligating countries to report their
presence. This designation furthermore requires countries to monitor disease outbreaks
and take steps to ensure that the virus and the fungus do not spread (Une et al. 2009,
Teacher et al. 2010). Preventing the spread of these pathogenic organisms is the only way
to safeguard herpetofauna, as there is currently no treatment or vaccine for wild
organisms. In keeping with this directive, we have informed wildlife managers and
personnel at infected sites of the necessity for decontamination. It has been shown that
exposure to a 3% bleach solution for one minute was effective at inactivating Ranavirus
(Bryan et al. 2009); cleaning equipment and containers with this disinfectant in between
sampling and field work is highly recommended to prevent the spread of disease. This
concentration is not lethal to amphibians and so field biologists and environmental
educators handling amphibians can feel safe implementing this protocol to stem the rising
tide of amphibian mortality.

46
CHAPTER 3
HOPPING INTO NEW TERRITORY: A CASE OF AMPHIBIAN RANGE
EXPANSION IN NEW JERSEY
Abstract
In June 2011, a large population of Green tree frogs, Hyla cinerea, was discovered in
southwestern New Jersey along the Delaware River. This was the first recorded
occurrence of H. cinerea in NJ and represents a possible range expansion past their
northern-most limit in Delaware. Subsequent reports of this species have been confirmed
along the Delaware Bayshore. Northeastward range expansions by this species have been
documented in Illinois and recently metamorphosed H. cinerea have been found 0.5 km
from the nearest breeding habitat, demonstrating dispersal capacity. Management
strategies concerning species that invade novel habitats will differ depending on the
source of colonizing individuals. Therefore, it was my aim to determine the source of the
NJ population of H. cinerea. Because Delaware was the closest geographical location
where this species was found, my hypothesis was that the H. cinerea in NJ originated via
range expansion from Delaware. To determine this, toe clips were collected for genetic
analyses from Delaware and NJ populations and partial sequences of the mitochondrial
ND1 gene were used to generate a statistical parsimony network. Four haplotypes were
distinguished, with all NJ haplotypes being identical to the most prevalent Delaware

47
haplotype and the Delaware haplotypes differing by at most one base pair. A sequence
from a Louisiana green tree frog obtained from GenBank could not be joined in the
network with 95% confidence. These results indicate a recent movement of Delaware
frogs into NJ. Although movement may have been human-mediated, rising temperatures
are possibly favoring the persistence and establishment of these frogs in new areas. If H.
cinerea establishes itself in New Jersey, there could be long-term impacts on native NJ
species and ecosystems.

48
3.1. Introduction
3.1.1. Colonization Events
Colonization events are significant ecological and evolutionary processes for a
number of reasons (Slatkin 1987, Le Corre and Kremer 1998, Excoffier et al. 2009,
Sexton et al. 2009), and understanding the genetic consequences of those events can
provide a wealth of information on the underlying mechanisms and driving forces of
colonization (Johnson 1988, Ibrahim et al. 1996, Templeton 1998, Emerson et al. 2001,
Ray et al. 2003). At the heart of a number of cases of speciation, for example, are
colonization events, in which individuals expanded into novel territories, became isolated
from their source population and began to diversify to the point of being distinct from the
original population; this has occurred for Hawaiian Drosophila, the Ensatina salamander
complex and Mauritian macaques (Templeton 1980, Barton and Charlesworth 1984,
Carson and Templeton 1984, Lawler et al. 1995, Wake 1997, Irwin et al. 2001). All too
often, researchers are limited to extrapolating the details of speciation events, as they
occurred in the distant past. While hypotheses regarding speciation are typically based on
sound evidence and well-developed models, direct confirmation is usually lacking.
However, if the colonization even is witnessed close to its inception point, it can provide
researchers with a more direct view of the process of speciation, especially with regards
to its initial stages. In this way, scientists can observe speciation “in action” and confirm
models and theories. While understanding speciation is more theoretical and perhaps

49
beyond the scope of wildlife management, understanding migration patterns of wildlife
and how these are impacted by anthropogenic activities is well within the purview of
wildlife management directives (Sacks et al. 2005, Coulon et al. 2006, Schwartz et al.
2006). Examining the genetic structure of colonizing populations can shed light on how
colonization happened, and therefore what kind of movement patterns are being exhibited
by colonizing populations (Ernest et al. 2003, Pearse and Crandall 2004, Sacks et al.
2005, Dixon et al. 2007, Crompton et al. 2008, Brown et al. 2009). These can be related
to biotic and abiotic factors to potentially understand underlying reasons for species
movement (Coulon et al. 2006).
One particularly relevant issue to wildlife management that can be examined through the
understanding of colonization events is “invasion biology” (Sexton et al. 2009). While
movement of organisms into novel areas is not a recent phenomenon, the unprecedented
rate at which animals are being introduced into naïve habitats in the modern era is most
likely attributable to human activities (Hulme 2009, Pyšek and Richardson 2010).
Humans now have access to virtually the entire globe and where humans go, so follow
pets as well as animal and plant hitchhikers (Rahel and Olden 2008). Human
modification of habitats also often facilitates the establishment of species that would
otherwise not have been able to thrive in a previously undisturbed habitat (Sakai et al.
2001). There is a healthy debate in the ecological community as to the threats posed by
non-native species (Sakai et al. 2001, Pyšek and Richardson 2010) and, indeed, the
literature tends to distinguish between non-native species, or those that simply did not

50
evolve in a particular area, vs. invasive species, which are species that grow aggressively
and often (though not necessarily always) have detrimental impacts on native species
(Colautti and MacIsaac 2004). There is agreement on the characteristics of species that
invade or simply colonize new habitats: they are usually generalists and can tolerate (and
even thrive) in heavily degraded habitats (Sakai et al. 2001, Pyšek and Richardson 2010,
Thomas 2010). While the exact nature of the threat from any particular invasive species
may be questioned, there are certainly cases where invasions have proven to have
negative consequences on the ecosystems being invaded (Funk et al. 2009, Laikre et al.
2010, Pyšek and Richardson 2010). Indeed, organizations such as the USDA, the IUCN
and the ISSG have compiled a ranking of the most invasive species in the world and
various task forces have been created to deal with the threat from these invasive species,
which count among their numbers amphibians and reptiles (www.issg.org).
Organisms that move into novel territories (non-native or invasive) can have a variety of
detrimental effects on native species (Watts et al. 2010, Fitzpatrick et al. 2012). They
may directly prey on native species, thereby decreasing their numbers; they may also
compete with native species for resources, thereby decreasing their survival probability
(Tolley et al. 2008, Leavitt and Fitzgerald 2009). Moreover, a more subtle threat can be
found in the potential for interbreeding between native and non-native species (Funk et
al. 2009, Haynes et al. 2012). One of the metrics used by humans in conserving
biodiversity is genetic “distinctness”(Frankham 2010, Laikre et al. 2010, Frankham et al.
2012). Breeding between native species and non-native species will affect the gene pool

51
of both species and could complicate conservation strategies, especially if the native
species are threatened or endangered (Haynes et al. 2012). Collecting information on the
colonization process that led to the introduction of the non-native species can help
wildlife management agencies and researchers formulate strategies to mitigate the
impacts of the non-native species and possibly prevent large-scale catastrophes from
happening in the future (Leavitt and Fitzgerald 2009, Fitzpatrick et al. 2012). In
particular, examining the genetic structure of colonizers can help determine the genetic
front of colonization and therefore the potential geographic source of colonizing
individuals (Pearse and Crandall 2004, Torres-Leguizamón et al. 2011).
Traditionally, there have been two models (with variations on these two models)
explaining the process of colonization of new areas, the infinite island model and the
stepping stone model (Slatkin, 1985) (Figure 3-1).
A
B
Figure 3-1. The infinite island model (A) and the stepping stone model (B) of population movement. Based on Whitlock and McCauley (1999).

52
In the infinite island model, a metapopulation consists of multiple demes, all of which are
equally likely to exchange individuals among them. In the stepping stone model, demes
are much more likely to exchange individuals with those demes immediately adjacent to
them (Slatkin 1987). In the former case, the founder effect is potentially weak, since
genetic diversity can be maintained, as genes are randomly shuffled around. In the
stepping stone model, there is the potential for a very strong founder effect, as each deme
contains only a subset of the genes of the adjacent deme (Johnson 1988, Austerlitz et al.
1997, Excoffier et al. 2007). Indeed, migration is more constrained than in the infinite
island model. Biologically speaking, the stepping stone model is more likely to happen in
naturally occurring populations that disperse (Ibrahim et al. 1996, Le Corre and Kremer
1998). Because of the strong founder effect in this model, as one moves further away
from the source population, genetic diversity decreases (Templeton 1980, Tolley et al.
2008, Watts et al. 2010, Torres-Leguizamón et al. 2011); this means that colonization
events can be distinguished by a decrease in genetic diversity over a geographic gradient
(Johnson 1988, Austerlitz et al. 1997, Le Corre and Kremer 1998, Klopfstein et al. 2006,
May and Beebee 2010).
More often than not, we see the genetic effects of colonization events that happened in
the distant past and which we obviously did not witness. The examination of a recent
event, one which can be observed close to its inception point, can provide invaluable
information on the colonization process and can further elucidate what is biologically
realistic (Whitlock and McCauley 1990, Templeton 1998). Indeed, empirical evidence of

53
colonization events from their start can help either confirm or refute our models of
population dispersal.
3.1.2. The American Green Tree Frog
As stated previously, organisms that are good colonizers tend to be generalists and able to
thrive in disturbed habitats, often in close association with humans. One such organism
that possesses these characteristics is the American green tree frog (Hyla cinerea). This is
a medium-sized frog with a Snout-Vent Length (SVL) of 32-64 mm (1.25 to 2.5 inches)
(Somma 2012). Ground color in H. cinerea can vary from a light green or yellow to an
olive green or slate grey and individuals possess 2 lateral stripes that can be white or
yellow. There is variation within and between populations in the morphology of the
lateral stripe (Aresco 1996). They are “indiscriminate and opportunistic feeders” (Leavitt
and Fitzgerald 2009) and have been documented consuming insects, snails and spiders
(Freed 1980, Pham 2007). Green tree frogs are found in tidal marshes, ponds, lakes, and
swamps with emergent vegetation (Pham 2007); indeed, emergent vegetation seems to be
critical for this species, as males will perch on this vegetation to call during the breeding
season (Gunzburger 2006). They are active from late April to September and breed
during late spring to early summer (Gunzburger 2006, Pham 2007). As with many
invasive species, green tree frogs are often closely associated with humans and indeed
thrive in developed areas. They often use eaves of buildings as retreats and are found

54
around house lights foraging for insects (Somma 2012). Because of their hardiness and
dietary plasticity, they are popular in the pet trade (Tucker et al. 2008).
The green tree frog is prevalent in the southeastern part of the United States, with the
distribution in the central part of the country creeping up into Illinois (Aresco 1996). Up
until 2011, the northernmost limit of H. cinerea’s range along the east coast was the state
of Delaware. This distribution was reflected in a map published online by the US
Geological Survey, which had been last updated in 2005 (Figure 3-2).
Figure 3-2. Map of Hyla cinerea distribution, taken from http://www.nwrc.usgs.gov/sc_armi/frogs_and_toads/hyla_cinerea.htm, which shows the geographic distribution of Hyla cinerea prior to 2011. Dark green = museum records, mid-level green = published records, light green = presumed presence, white = no known occurrence.

55
In 2011, a chorus of unidentified frogs was heard in southern NJ, in Killcohook National
Wildlife Refuge (Salem County, NJ). The call was later identified as belonging to Hyla
cinerea and upon further examination, individuals were directly observed inhabiting a
freshwater tidal marsh in the refuge, which is located along the Delaware River. There
were other species of frogs present and calling at the same time, including Leopard frogs
(Rana spp. nova) and American Bullfrogs (Lithobates catesbeianus). The green tree frog
had to my knowledge not been officially documented in the state of NJ prior to this
occasion (DiLeo 2012).
Given the identification of these frogs in NJ that had not been previously recorded in the
state, there were two main objectives in this study.
i). To determine the most likely source population for the Hyla cinerea that colonized
New Jersey. This would help understand whether the presence of this species represented
a range expansion or possibly a pet release that led to the establishment of a new
population outside the core range. Because Delaware was the closest geographical
location that was inhabited by green tree frogs, my hypothesis was that the H. cinerea in
NJ originated via range expansion from Delaware.
ii). To document the current range of Hyla cinerea in NJ, to determine whether this
species existed in an isolated pocket or if it was expanding throughout the state.

56
3.2. Materials and Methods
In 2011, H. cinerea individuals were collected in July from three locations, one in New
Jersey, two in Delaware. On July 1, 10 individuals were collected from Killcohook
National Wildlife Refuge in Salem County, New Jersey (39°37’2.50”N, 75°32’37.83”W).
Animals were caught by hand at night with the use of headlamps; frogs were localized by
their calls. On July 8, one frog was found dead at the base of Reedy Point Bridge in
Delaware (39°33’30.70”N, 75°34’50.55”W) and a hind leg was taken as a tissue sample.
On July 13, six individuals were collected from McKay House Marsh in Delaware
(39°20’49.08”N, 75°32’11.81”W) (Figure 3-3); conditions of collection were the same as
for Killcohook NWR. Sites were visited again for collection in 2012. On May 9, 10 frogs
were collected from Killcohook NWR and on June 11, 13 frogs were collected from
McKay House Marsh in Delaware, in the same manner as above. For all frogs besides the
dead individual (from which a hind leg was taken), toe clips were taken before animals
were release at their point of capture; scissors were sterilized with 95% ethanol in
between uses.

57
Tissue samples were put into 1.5 mL Eppendorf tubes that were approximately ¾ full of
Drierite desiccant and taken back to the lab. Total genomic DNA extraction was
Figure. 3-3. Locations of sampling sites for Hyla cinerea in Delaware and New Jersey.

58
performed via alkaline lysis and silica spin column using a QIAmp DNA Mini Kit
(QIAGEN) following the manufacturer’s instructions. ProK digests were left overnight in
a 56° C water bath and after approximately 24 hours, tubes were placed at -20° C for at
least 2 days. This seemed to increase DNA yield. For PCR, I used hylid-specific primers
t-met-frog and 16S-frog (Wiens et al. 2005) that amplify the NADH dehydrogenase
subunit 1 (ND1) of mitochondrial DNA, along with adjacent areas that include isoleucine
and leucine transfer RNAs and part of the 16S ribosomal subunit 1. PCR reactions were
carried out in a total volume of 25 μl, with concentrations of reagents as follows: 1x PCR
Buffer, 1.5 mM Magnesium Chloride, 0.2 mM dNTPs, 0.4 μM each of Forward and
Reverse primer, and 0.1 units of taq polymerase. Ten (10) μl of genomic DNA was used.
Conditions for amplification were based on Robertson et al. (2009): 95° C initial
denaturation for 5 minutes, 35 cycles of denaturation at 94° C for 1 minute, annealing at
50° C for 1 minute, extension at 72° C for 1 minute and a final 5 minute extension at 72°
C. Reactions were then held at 4° C.
PCR reactions were cleaned for sequencing using the silica based microcentrifuge
protocol of the QIAquick PCR purification kit (QIAGEN). Thirty μl of buffer EB were
added to more concentrated PCR products, while 20 μl were added to more dilute
products. The same primers were used in sequencing reactions on an ABI 3130 Genetic
Analyzer. Big Dye terminator sequencing kits (Applied Biosystems) were used, with total
reaction volumes of 20 μl. One μl of PCR product was used, with 5X sequencing buffer
and a 10 μM concentration of primer. Parameters were as follows: 96° C for 1 min, 25
59
cycles of 96° C for 10 seconds, 50° C for 5 seconds, 60° C for 4 minutes, and a final 4° C
hold. The oven temperature was preheated to 60° C while loading sequencing plates.
Sequences were checked by eye and 486 base pairs were used for the analysis. A total of
twenty-nine sequences were used, 11 from New Jersey, 17 from Delaware and one from
Louisiana. Mitochondrial DNA was chosen because it evolves at a faster rate than nuclear
DNA (Beebee and Rowe 2007); the recent nature of the potential range expansion by H.
cinerea precludes the use of genetic markers that evolve slowly (Van Den Bussche et al.
2009, Torres-Leguizamón et al. 2011).
Sequences were initially aligned using MUSCLE
(http://www.ebi.ac.uk/Tools/services/web/toolform.ebi?tool=muscle), to be used for
statistical analyses. A statistical parsimony network was drawn using the method of
Templeton (1992) via the program TCS (Clement et al. 2000). Estimates of genetic
diversity, including mean number of pairwise differences, average gene diversity,
haplotype diversity and the number of polymorphic loci, were calculated using Arlequin.
GenePop on the Web was used to calculate Fst.

60
3.3. Results
3.3.1. Statistical Parsimony
According to TCS, there are 4 unique haplotypes among the samples, labeled DE1, DE6,
DE4 and L1 (DE = Delaware, L = Louisiana) (Figure 3-4). Twenty-six individuals had
the DE1 haplotype (the most common among all individuals). Only one individual in the
study had DE6, DE4 and L1, respectively. All of the New Jersey samples matched the
DE1 haplotype. The Louisiana sequence (L1) was not joined to the NJ/DE haplotypes by
TCS with 95% certainty, suggesting it is more distantly related.
Figure 3-4. Statistical parsimony network generated by TCS. DE1 is the most common haplotype, possessed by 26 individuals. DE1 differs from DE6 and D4 by one nucleotide. L1 was obtained from GenBank and used as an outgroup.

61
3.3.2. Estimates of Genetic Diversity
Mean number of pairwise differences was 1.310 (+/- 0.840) and average gene
diversity (haplotype diversity) over loci was 0.003 (+/- 0.002). Gene diversity indicates
the probability of drawing the same two alleles at random from a sample of genes and is
given by
∑
Gene diversity values range from 0 to 1. If a sample contains many alleles that are all
present at similar frequencies, the gene diversity will be close to 1. If, instead, there are
few alleles, with one being present at a significantly higher frequency than the rest, the
value will be close to 0. Gene diversity for the H. cinerea sequences taken as a group was
very low, indicating that there was one allele that dominated the group (and therefore a
low level of diversity); indeed, TCS showed that the DE1 haplotype was the predominant
haplotype (with no unique haplotypes in NJ) (Figure 3-5). Nucleotide diversity was
0.200 (+/- 0.098). This is a measure of the variation at individual nucleotide sites and in
this case, the small number is indicative of the similarities between the sequences. The
number of polymorphic sites, or segregating sites (S) (Wakeley 1998), was 19.
Fst between the NJ and DE populations was 0.025. Fst is a measure of the degree of
genetic differentiation between subpopulations and will vary from 0 to 1 (Beebee and
Where pi2 is the probability of drawing
the same allele twice
62
(Slatkin 1985, Slatkin 1987, Whitlock and McCauley
1990, Templeton 1998, Pearse and Crandall 2004)
Rowe 2007). The closer the value is to 1, the more genetically differentiated populations
are, with a value of 1 indicating the populations are fixed for different alleles. The closer
the value to 0, conversely, the less differentiated two populations are, with a value of 0
indicating no genetic differentiation at all. Little to no genetic differentiation means that
there are either migrants being exchanged between the subpopulations OR that two
subpopulations have split relatively recently in the past and not enough time has elapsed
for them to accumulate differences (Templeton 1998, Pearse and Crandall 2004). The low
Fst value between the NJ and DE populations indicates that there is very little
differentiation between the two, which could be indicative of the NJ population having
split from the DE population via a range expansion in the recent past. Insufficient time
has passed for the two subpopulations to diverge genetically (Okello et al. 2005). Once
Fst is obtained, the number of migrants between subpopulations can be calculated
(Beebee and Rowe 2007, Carreras et al. 2007), and is given by:
The number of migrants between the DE and NJ populations was found to be 19.5 over
the course of one generation. This is a fairly high number for an amphibian. There are
certain limitations, however, to this calculation (Slatkin 1987, Templeton 1998, Pearse
and Crandall 2004). This approach assumes that subpopulation dynamics follow the
infinite island model, which is not often the case; furthermore, it assumes that
subpopulations are all roughly the same size and are all equally likely to exchange

63
migrants. This last point is highly unlike to occur in most biological systems. Given those
limitations, though, it is often useful to calculate the number of migrants to obtain an
estimate of the degree of migration occurring. The higher the number of migrants, the
more genetic similarity between subpopulations.
Sequences were then aligned using CLUSTALW2
(http://www.ebi.ac.uk/Tools/msa/clustalw2/) to visualize distribution of the 19
polymorphic sites. Of those differences, 17 were between the Louisiana sequence (L1)
Figure 3-5. Haplotype map showing the distribution of haplotypes in NJ and DE.

64
and the rest of the Delaware sequences, while only two of those differences were found in
the NJ/DE group (Figure 3-6).
Figure 3-6. Arrows represent loci that differ between L1 and all other sequences. Rectangles represent loci that differ between DE sequences.
65
3.3.3. Range survey
In order to begin documenting the extent of establishment by H. cinerea in New
Jersey, acoustic surveys were undertaken by myself, Karena DiLeo of the Conserve
Wildlife Foundation of NJ and citizen scientists; the call, in fact, was put out for citizens
participating in the Calling Amphibian Monitoring Project (CAMP) to add the American
green tree frog to their list of possible species encountered. The presence of H. cinerea in
Hopewell, Quinton and Greenwich (Figure 3-7) was initially reported via photograph and
later confirmed in person. In Greenwich, the frogs were in a Phragmites marsh along a
tributary of the Cohansey River in the vicinity of forested wetland, while in Quinton, they
were found in a freshwater tidal marsh. The Hopewell case was one in which a frog fell
from the second story of house; this could have been a pet release, as no large choruses
were found in the vicinity. There was a report of a green tree frog in Medford, with no
photographic evidence; upon further investigation, no green tree frog was found. It is
thought that the frog in question may have been a juvenile gray treefrog, which is often
mistaken for a green tree frog. Sightings at the PSE&G properties were made by PSE&G
consultants (Karena DiLeo, personal communication).
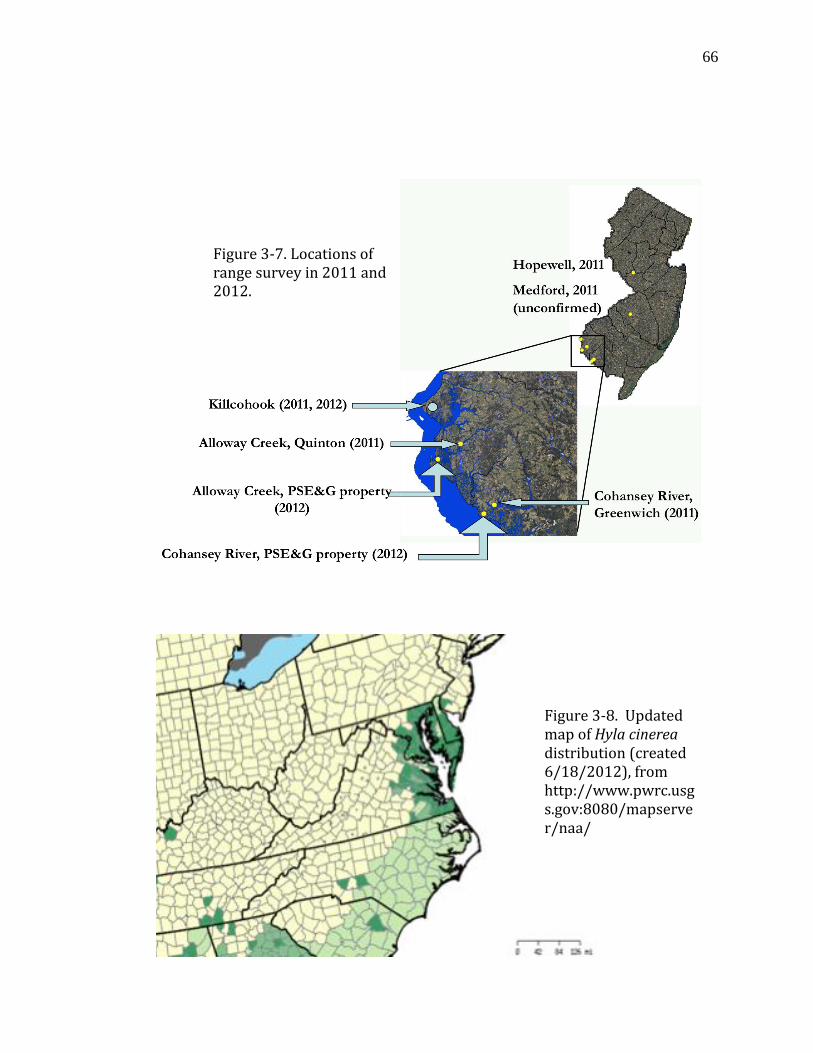
66
Figure 3-7. Locations of range survey in 2011 and 2012.
Figure 3-8. Updated map of Hyla cinerea distribution (created 6/18/2012), from http://www.pwrc.usgs.gov:8080/mapserver/naa/

67
3.4. Discussion and Conclusions
My data at least partially support the hypothesis that the NJ frogs are a result of range
expansion from the northernmost limit of the species’ distribution in DE. The NJ frogs
show impoverished genetic diversity compared to the DE population and the only
haplotype present in the NJ population is the predominant haplotype in the DE
population. I used the Louisiana sequence to test whether or not that haplotype was the
predominant haplotype in the species as a whole (which would be indicative of a species
with low overall genetic diversity, regardless of source population), but the Louisiana
sequence was not identical to either the NJ samples or the DE samples. Indeed, TCS
deemed the sequence so different as to not connect it within the statistical parsimony
network. The genetic impoverishment and an essentially zero Fst value suggest a very
recent colonization event. It is likely that insufficient time has passed for the NJ
population to develop enough genetic diversity to distinguish it from its founding
population (all animals still exhibit the predominant haplotype from the founding
population). This is a classic pattern expressed in the initial phases of colonization, due to
a strong founder effect (Tolley et al. 2008, Excoffier et al. 2009, Torres-Leguizamón et
al. 2011). Another possible hypothesis could be that the presence of the green tree frog in
NJ was the result of a pet release, as these animals are used heavily in the pet trade. If this
had been the case, there would have been no reason for the NJ individuals to possess the
common haplotype in DE. They would have been just as likely to posses a random,
unrelated haplotype or one of the minor haplotypes in the DE population. Furthermore,

68
pet releases of individuals are unlikely to allow for the establishment of populations,
unless continued releases sustain those populations. In that case, a population would
likely possess individuals with a number of different haplotypes, as random variation in
store-bought animals is more likely. The pattern exhibited by the NJ frogs is indicative of
a range expansion from the leading edge of the species’ distribution in Delaware. The
USGS has since updated its distribution map for Hyla cinerea as a result of this study
(Figure 3-8).
This evidence for range expansion is not surprising, given the fact that models have been
predicting significant changes in the distribution of amphibians, particularly in in the
central and eastern United States, linked to changes in climate (Carey 2001, Excoffier et
al. 2009, Hutchens and DePerno 2009, Lawler et al. 2009, Blaustein et al. 2010).
Changes in amphibian behavior linked to climate patterns have already been documented;
in NY State, frog species are calling 10-13 days earlier over the past 100 years (Gibbs
and Breisch 2001). Hyla cinerea itself has already expanded its range in the central part
of its distribution, moving 110 km north of the previous northernmost population in
Illinois (Tucker et al. 2008). The temperature in NJ has already increased an average of 2
degrees F since 1900 and winter temperatures have increased 4 degrees F since 1970.
Rainfall has increased 5-10%, and the predicted 2-8 degree F increase in temperature
(Union of Concerned Scientists 2007, Center for Integrative Environmental Research
2008, New Jersey Climate Adaptation Alliance 2011) will see the regional climate of

69
southern NJ become comparable to the current climate of DE, thereby favoring the
establishment of green tree frogs.
Genetic distinctness at the periphery of a population (and therefore in new colonizers) has
been thought to be indicative of the evolutionary potential of a population (Klopfstein et
al.2006, Gibson et al. 2009, Phillips et al. 2010). Indeed, there have been studies that
show that animals that are at the periphery of their range tend to possess extreme
phenotypes that are not present at the core of the range; these phenotypes have been
dubbed “colonizing phenotypes”, as they endow their possessors with increased abilities
at colonizing new habitats (Sexton et al. 2009). British crickets at the edge of their range
have been shown to have longer wings than crickets at the core of the range, as did
speckled wood butterflies, which correlated with longer flights (Sexton et al. 2009); cane
toads at the leading edge of their range in Australia were more likely to move and
covered more distance per movement than individuals at the core of the range (Bocxlaer
et al. 2010, Phillips et al. 2010).
In terms of management, then, the question becomes what to do with these colonizers. If
colonizers are targeted as invasives, and therefore potentially detrimental to the
ecosystems into which they are moving, extermination may be deemed necessary.
Extermination, though, could potentially deplete the evolutionary potential of the species,
thereby dooming them to be susceptible to climate change and other anthropogenic
disturbances. Regardless of evolutionary potential, colonizers unfortunately do pose a

70
practical problem to humans when they cross political boundaries, such as state lines.
Those animals are now new organisms within that political delineation and so the
question of how to classify them and how specifically to manage them must be addressed
(Tolley et al. 2008). Resources must be allocated in order to understand the dynamics of
this new population and understand whether the range expansion was natural or man-
made, like a pet release. In any case, it is advisable to monitor the process of colonization
to see if the new organisms are having an effect on the ecosystem and determine if steps
should be taken to mitigate their presence.
With regards to the green tree frog specifically, as of now no known negative
consequences have resulted from its presence in NJ. It has demonstrated dietary plasticity
outside of its native range (Leavitt and Fitzgerald 2009), but it does not seem to have
impacted ecosystems in NJ. However, there is a concern. There have been documented
cases of hybridization between Hyla cinerea and Hyla andersonii, the Pine Barrens tree
frog, in Florida (Anderson and Moler 1986). New Jersey has a disjunct population of H.
andersonii in southern NJ, in the vicinity of the locations that are being colonized by the
green tree frog; the NJ population of H. andersonii is state endangered. Studies have
shown that habitat degradation often leads to H. cinerea coming into contact and
breeding with other hylid species, including H. andersonii and H. gratiosa (Anderson and
Moler 1986, Aresco 1996). Anderson and Moler (1986) showed that a prolonged drought
may have reduced suitable breeding habitat for both H. cinerea and H. andersonii in
Florida, forcing the two species to extend their search for breeding habitat into sub-

71
optimal locations and to come into contact. Hybrids showed no developmental
abnormalities, but were infertile (Anderson and Moler 1986). Female H. andersonii seem
to actually prefer male H. cinerea (Anderson and Moler 1986) when the latter called
more loudly than males of their own species. This could potentially negatively impact the
endangered population of Pine Barrens tree frogs by “contaminating” the gene pool.
Future directions for this work include more thoroughly quantifying the genetic diversity
in Hyla cinerea throughout its entire range. Our lab has requested and received museum
specimens of American green tree frogs from the American Museum of Natural History
to this end. We are also collaborating with the NJ Division of Fish and Wildlife to collect
more tissue samples from other H. cinerea populations in NJ in order to determine
whether the source population for these other populations is the same as that for the
Killcohook population, and to continue to document the range of the species in NJ.
Finally, an analysis of nuclear microsatellite markers is planned.

72
CHAPTER 4
ANTHROPOGENIC DISTURBANCE AND WILDLIFE: DIAMONDBACK
TERRAPINS IN URBAN ENVIRONMENTS
Abstract
Herpetofauna are often limited in their ability to respond to anthropogenic disturbance
mainly because of life history characteristics and limited dispersal capabilities. This
means that an important survival strategy in a world of ever-increasing human
development may be to live alongside humans, possibly even in highly urbanized areas.
While wildlife in urbanized areas is faced with a number of threats, some organisms, such
as turtles, have shown that they may be able to thrive in disturbed habitats, if managed
appropriately. In order to gain more information on how some species fare in proximity
to human development, I examined populations of Diamondback terrapins (Malaclemys
terrapin) living in some of the most highly developed locations of the species’ range, in
NY and NJ. I used a fragment of the mitochondrial D-loop from terrapin blood samples
to examine patterns of genetic diversity among populations of terrapins collected within
Jamaica Bay (from Ruler’s Bar Hassock and JFK airport), Hempstead Bay and Sawmill
Creek Wildlife Management Area in the NJ Meadowlands. My aim was to determine the
presence of a bottleneck signature within this fragment of mitochondrial DNA and
correlate it to any loss of genetic diversity within the NY/NJ terrapins. Furthermore, the
73
origin of the Meadowlands population is unknown and therefore I aimed to shed light on
how far back documentation of terrapins in the Meadowlands stretched and if these
terrapins could have been recent immigrants from the NY populations. Finally, I aimed to
examine demographic parameters of the Meadowlands population, since very little is
known about this population. I show that the picture of the terrapin’s demographic past is
a complex one, possessing signs of a bottleneck, as well as recent expansion, and that
genetic diversity of the mitochondrial D-loop is not severely reduced. Genetic data
confirm what other studies have shown, that dispersal capabilities of terrapins are limited.
Given that terrapins live in habitats often subjected to intense anthropogenic impact, as
evidenced by the terrapins in this study, an understanding of their demographic and
genetic characteristics is critical to the development of sound management plans for this
species.

74
4.1. Introduction
While amphibians may be bearing the brunt of anthropogenic disturbance when it comes
to herpetofauna, turtles have certainly not escaped unscathed (Marchand and Litvaitis
2004, Conner et al. 2005). The life history characteristics that have allowed turtles to
achieve evolutionary success over the millennia are those that are now unfortunately
rendering them susceptible to human activities (Gibbons et al. 2001). They are long-
lived, reach sexual maturity late and have overall low reproductive rates (Tucker et al.
2001, Baldwin et al. 2005); this limits their ability to rapidly respond to environmental
disturbance. In a related manner, their longevity often leads to the erroneous assumption
that populations are healthy, based solely on their present numbers, and management is
deemed unnecessary (Kuo and Janzen 2004). In order to avoid this assumption and
circumvent the effects of turtle life history characteristics on their susceptibility to
disturbance, long-term monitoring of turtle populations has been suggested (Allendorf et
al. 2004, Alter et al. 2007). Besides the ongoing collection of demographic data, which
can provide information on survival rates, recruitment rates and population
growth/decline (Claisse et al. 2008, Loughry et al. 2013), genetic data can also be
collected. Genetic data can provide invaluable information on past events that could not
have been detected any other way and on current processes that are difficult to detect
with traditional field-based technologies, such as population bottlenecks (Cunningham et
al. 2002, Rosenbaum et al. 2007, DeYoung and Honeycutt 2008). Data from
demographic and genetic monitoring can then be related to environmental influences and

75
appropriate management plans can be implemented (Allendorf et al. 2009,
Koumoundouros et al. 2009, Schwartz et al. 2006).
Information of this nature may be especially critical for turtle populations inhabiting
developed areas in order to understand how turtles and humans can successfully coexist.
Evidence suggests that turtles may be successful in urbanized areas, but they face a
variety of threats, such as habitat degradation, road mortality, collection for the pet trade
or food, predation by subsidized predators, etc. (Marchand and Litvaitis 2004, Conner et
al. 2005). Only through ongoing monitoring can the severity of those threats be
understood and mitigated. Understanding how to manage turtles in developed areas is
necessary as more and more development encroaches on turtle habitat and turtles face
limited dispersal options. Furthermore, and fortunately, the appreciation for urban
ecology is growing. Direct exposure to the outdoors and wildlife has been shown to
improve the well being of humans (Maller et al. 2005, Berman et al. 2012) and their
understanding of the importance of environmental issues (Strife and Downey 2009).
People who live in urbanized areas often have limited opportunities to get outdoors and
are forced to seek ecological experiences close to home (Strife and Downey 2009). The
establishment and maintenance of parks and refuges that are home to wildlife, like turtles,
are extremely important for these individuals. With their improved understanding of
environmental issues, so grows their support for conservation programs.

76
4.1.1. The Diamondback terrapin
The Diamondback terrapin (Malaclemys terrapin) is an excellent subject for both
understanding the impact that anthropogenic disturbance has had on herpetofauna, as well
as understanding how turtles can survive in urbanized areas. This is the only turtle in
North America that is adapted to a brackish environment (Gibbons et al. 2001; Tucker et
al. 2001; Hart and Lee 2006), inhabiting salt marshes, estuarine habitats and mangroves
along the eastern coast of the US, from Cape Cod to Florida and along the Gulf of
Mexico, to Texas (Butler et al. 2006). Terrapins play important roles in their ecosystems,
and there is evidence that they help to control populations of grazers, which would
otherwise substantially alter estuarine environments (Silliman and Bertness 2002).
Unfortunately, coastal ecosystems are some of the most heavily impacted ecosystems on
the planet, putting terrapins in the direct path of human-induced habitat degradation
(Baldwin et al. 2005; Hart and Lee 2006).
Terrapins have always had a difficult relationship with humans. Before facing their
current threats, they were seen as a source of protein and harvested for food; their shells
were used to fashion items such as spoons and bowls. The threat from harvesting
intensified in the 1800s. A main ingredient in turtle soup, terrapins were harvested to the
point of near extinction until the early 1900s (Baldwin et al. 2005; Brennessel 2006; Hart
and Lee 2006). The decreasing popularity of turtle soup (mainly due to the difficulty of
finding another crucial ingredient in the soup, sherry, during Prohibition) afforded

77
terrapins some protection, as did new regulations. Thanks to this kind of protection, it is
thought that terrapin populations rebounded, but their numbers may now be impacted by
current threats which include, besides habitat degradation, mortality in crab pots and road
mortality when females migrate to nesting sites (Tucker et al. 2001; Avissar 2006).
Despite these threats, terrapins seem to be persisting in urbanized areas. In this study, I
examined two populations of Diamondback terrapin (Malaclemys terrapin), found in
perhaps the most urbanized locations of the species’ range, Jamaica Bay, NY, and the
New Jersey Hackensack Meadowlands. Although long-term monitoring has been ongoing
in Jamaica Bay since 1998, very little is known about the terrapins in the NJ
Meadowlands. These populations are found at the heart of an extremely developed area
and present an excellent opportunity to study ways to manage urban wildlife for the
benefit of ecosystem health, as well as for urban ecotourism. My aim was to understand
the population structure and extent of genetic diversity of the terrapins in these locations
in order to shed light on historical population processes that may have impacted the
demographic and genetic health of these populations. In particular, I was looking for
signals of reduced genetic diversity due to habitat fragmentation and a population
bottleneck caused by severe overharvesting in the late 1800s to early 1900s. Information
on the genetic and demographic characteristics of terrapin populations has been flagged
as crucial for the implementation of management strategies by both the National Park
Service, which manages the Jamaica Bay terrapins, as well as the NJ Meadowlands
Commission, which manages the NJ Meadowlands population of terrapins.

78
4.1.1.1. Jamaica Bay
The population of terrapins in Jamaica Bay, NY, has been continuously monitored since
1998 to understand the threats faced by these urban-dwelling turtles (Russell Burke, pers.
comm.). Jamaica Bay contains a series of small marsh islands adjacent to John F.
Kennedy International airport (JFK). Marsh loss is seen as a serious problem plaguing the
bay (Hartig et al. 2002), so much so that the National Park Service has made it a priority
to attempt to mitigate this loss (Waldman 2008). The area has in general been heavily
impacted by human activities over the past two centuries, with waste disposal activities
having played an important role in the history of the bay (Black 1981). The terrapin
monitoring program has focused on nesting females and hatchlings to gauge nesting
ecology, reproductive success, nest predation rates, hatchling survival and recruitment.
Nesting activity may, indeed, be shifting from Ruler’s Bar island (the main marsh island
in the bay, and the original focus of the monitoring program, where Jamaica Bay Wildlife
Refuge is located) to the most pristine marsh left in the bay, JoCo marsh, which is located
adjacent to JFK airport (Russell Burke, pers. comm.).
4.1.1.2. The New Jersey Hackensack Meadowlands
The NJ Hackensack Meadowlands is a heavily industrialized area containing wetlands,
open waterways and upland areas about 6 miles west of the island of Manhattan. Like
Jamaica Bay, despite its heavily urbanized location, there is a thriving wilderness and

79
there is much interest in visiting the Meadowlands to appreciate local ecology. What we
know today as the Meadowlands, though, has undergone a significant amount of change
over the years, due to both natural as well as anthropogenic causes (Quinn 1997). The
events that would lead to the present-day Meadowlands began roughly 15,000 years ago,
when the Wisconsin glacier retreated and left behind a series of glacial lakes, one of
which was Glacial Lake Hackensack (Harshberger and Burns 1919, Maguire Group
1989, Quinn 1997). A few thousand years after the retreat of the glacier created the lake,
the lake drained and in its place were left freshwater meadows composed of sedges,
grasses and alders, as well as swamps of black ash (Sipple 1972, Kraus and Smith 1988).
Thus began a period of significant, natural, vegetational change in the ancient
Meadowlands area. Subsequent to the black ash swamps there most likely came northern
bogs of larch and black spruce and following that, Atlantic white cedar swamps. It was
the Atlantic white cedar swamps that were the dominant vegetational type when
European colonizers arrived (Kraus and Smith 1988, Quinn 1997).
Starting in the 1600s, then, anthropogenic activity took over as the main driver of
vegetational change in the Meadowlands. The Atlantic white cedar swamps were
decimated and human activity drastically altered the hydrology of the area (Sipple 1972).
There are reports that before the early 1800s, water flowing into Newark Bay from the
Hackensack and Passaic Rivers was mostly freshwater; in a short span of time this was
no longer the case (Quinn 1997). The Meadowlands were seen as a “wasteland” and
intense development was undertaken to make the land suitable for agriculture and other

80
activities (“The Reclamation of Marshlands – A Useful Profit” 1866, “Hackensack
Meadows” 1901, State of New Jersey Department of Community Affairs 1968, Quinn
1997). Dikes and drainage ditches were built, as well as dams to create millponds;
freshwater was diverted into municipal water systems (Kraus and Smith 1988). Hand in
hand with this alteration in hydrology came the invasion of Phragmites, which further
altered the ecosystem of the area (Maguire Group 1989, Sipple 1972). Perhaps the most
damage to the Meadowlands was done, however, in the name of eradicating mosquitoes,
which were the bane of Meadowlands’ life. A large number of additional dikes, tide gates
and drainage ditches were built from around 1915 to 1950 in order to eliminate mosquito
breeding habitat (Headlee 1911, Quinn 1997). A great storm in November of 1950
destroyed these tide gates and tidal flow was then returned to Sawmill Creek and
Kingsland Creek, in the southern part of the Meadowlands, which had not seen tidal flow
in over 130 years. The presence of Phragmites declined and Spartina alterniflora
increased, and the area became a brackish salt marsh (Portera and MacNamara 1972,
Kraus and Smith 1988).
Because of the human presence in the Meadowlands since colonial times, written records
exist of the vegetation and wildlife that was encountered. Herpetofauna, including turtles,
have always been abundant in the area. There are records of box turtles at the edge of
Overpeck Meadows in the 1950s (Quinn 1997). Snapping turtles were collected in the
Meadowlands as early as the 1890s by young boys to sell to a local hotel that served
snapping turtle soup (Quinn 1997). As mentioned previously, terrapins have been used as

81
a food source since before colonial times. When European settlers arrived in this area,
they, too, took up the practice of eating terrapins. Terrapin soup became somewhat of a
delicacy in the late 1800s and early 1900s (Brennessel 2006). Terrapins fetched a hefty
price and fisheries sprang up along the east coast in order to harvest these animals for a
very lucrative market. Terrapin farming operations were even established (Goode 1887,
Hart and Lee 2007). Because of the economic importance of terrapins, there are fairly
good written records of their presence and abundance dating to colonial times. Despite
this documentation, no records of terrapins in the Meadowlands seem to exist prior to the
1970s.
The absence of terrapins in this area may be attributable to two factors. The salt marshes
on which terrapins are dependent seem to have been scarce in the Meadowlands prior to
the 1950s (Sipple 1972, Kraus and Smith 1988, Quinn 1997) and those that were present
were heavily impacted by human activities (Quinn 1997). Therefore, even if there were
terrapins in the Meadowlands before the first official record of them, their numbers must
have been small. In 1972-1973, the NJ Division of Fish, Game and Shellfisheries
conducted a study of the marshland in the Kingsland/Sawmill marshes (which today are
home to a large population of terrapins) and did not report the presence of terrapins. The
first mention of the diamondback terrapin in the Meadowlands was in a 1975 report by
the Hackensack Meadowlands Development Commission (“Wetland Bio-Zones of the
Hackensack Meadowlands: An Inventory” 1975). Since that first mention the New
Jersey Meadowlands Commission (NJMC) has seen an increase in the number of

82
terrapins present. In 2009, the NJMC began a mark-recapture study of the terrapins in the
Sawmill Creek Wildlife Management area, which contained one of the healthiest
examples of brackish marsh in the Meadowlands area, and therefore contained suitable
habitat for terrapins (Brett Bragin pers. comm.). In contrast to the Jamaica Bay
monitoring program, both males and females in the Meadowlands were captured and so a
more thorough understanding of Diamondback terrapin urban ecology can be obtained
from the study of this unique, under-studied population.
4.1.2. Study Objectives and Hypotheses
This study had a number of objectives:
i) To examine the genetic diversity of Diamondback terrapins in urbanized areas of
NY/NJ, including Jamaica Bay Wildlife Refuge, Hempstead Bay, JFK and the NJ
Meadowlands using mitochondrial DNA (Figure 4-1. A); I was also interested in
determining whether a mitochondrial marker would possess the genetic signature of a
bottleneck event due to the intense overharvesting of terrapins until the early 1900s
ii) To examine the relatedness of Diamondback terrapins in those urbanized areas to
understand potential connections between terrapin populations; I was also interested in
specifically examining the relationship between the terrapins in the Meadowlands and the
other populations to understand the origin of the Meadowlands terrapins (Figure 4-1.B)

83
iii) To determine population parameters of the Meadowlands terrapins including
population size, survival rates and recruitment rates.
I predicted a lack of genetic diversity, as indicated by the presence of very few unique
mitochondrial DNA sequences, within terrapin populations due to the potential
bottleneck through which the population passed (due to extensive harvesting in the past).
Between populations, however, I predicted at least a moderate level of genetic diversity,
as the literature indicates that terrapins do not disperse great distances. I predicted,
therefore, that the Meadowlands population would be distinct from populations in New
York, as they possibly expanded from a small number of turtles that were located in the
Meadowlands in isolated pockets when human activity was intense. Isolation from the
NY populations was probably achieved by the presence of the Hudson River, which
terrapins are unlikely to cross because it represents unsuitable habitat (Russ Burke, pers.
comm.). I predicted the possibility of some genetic relatedness between the
Meadowlands population and the NY populations, due to random transportation of turtles
by humans and occasional turtles able to make the migration.
With regards to the population characteristics of the Meadowlands, I predicted a fairly
large population size and a possible effect of sex on survival probabilities. Females are
subject to predation and road mortality when making nesting forays, so I predicted that
females would have slightly lower survival probabilities than males.

84
4.2. Materials and Methods
4.2.1. Genetic Samples
Jamaica Bay and other NY locations: Blood samples for genetic analysis were taken
during a nesting ecology study at Jamaica Bay Wildlife Refuge. Females were followed
as they came ashore to nest; once they completed their nesting activities, they were
captured and taken to a common processing area. Females that did not nest were captured
before they returned to the water. Once blood was collected and information for the
nesting ecology was recorded, terrapins were released from the common processing area,
to return to the bay. Approximately 300 μl of blood was collected by inserting a small-
gauge needle between caudal (tail) vertebrae into the caudal vein, and blood was blotted
onto gauze. The gauze was then placed in an envelope and stored in a container of
Drierite desiccant at room temperature. Similar procedures were used for the turtles in the
Hempstead and JFK populations. The population at John F Kennedy National Airport
was sampled during nesting season, as females came ashore in search of nesting sites.
Females were collected by airport personnel as they (the turtles) attempted to cross
runways. Terrapins from Hempstead Bay were collected by local NY Department of
Environmental Conservation employees and were included in this study to understand
movement of terrapins in the absence of a barrier to dispersal such as the Hudson River.
Blood samples were collected June-July 2011.

85
Figure 4-1. A. Location of NY sites for terrapin samples. B. NY sites in relation to the NJ Meadowlands site.
A.
B.

86
NJ Meadowlands: A NJ Meadowlands commission pontoon boat was used to set 12
baited Maryland-style crab traps at various locations throughout the Sawmill-Kingsland
marsh system from 2009 to 2012 (Table 4-1, Figure 4-2.). Trap locations varied slightly
from year to year depending on local conditions. Figure 4-3 shows trapping locations for
2011, which were representative of trapping locations throughout the study.
Table 4-1. Dates of trapping occasions in NJ Meadowlands.

87
Fig
ure
4-2
. E
xam
ple
s o
f M
aryl
and
sty
le c
rab
tra
ps
for
the
mar
k-r
ecap
ture
stu
dy
in t
he
NJ
Mea
do
wla
nd
s.

88
Figure 4-3. Trapping locations in the Sawmill Creek Wildlife Management Area in the NJ Meadowlands for 2011. Trapping locations for other years (2009, 2010, 2012) varied slightly.

89
Traps were placed in the water in the morning and retrieved between 2 and 5 hours later.
Approximately 300 μl of blood was collected in June 2011 by inserting a small-gauge
needle between caudal (tail) vertebrae into the caudal vein, and blood was blotted onto
gauze. The gauze was then placed in an envelope and stored in a container of Drierite
desiccant at room temperature. Both males and females were captured. Terrapins were
tagged with a glass encapsulated 12.50 x 2.07 mm, 134.2 kHz Biomark Radio Frequency
ID (RFID) Passive Integrated Transponder (PIT) tag, using a 12-gauge needle. Sex was
recorded and measurements such as midline carapace length, midline plastron length,
weight, scute number, maximum shell width, and maximum shell height were taken.
Following data collection, a Biomark PIT tag pocket reader was used to verify the
implanted tag number and then turtles were released at point of capture.
Total genomic DNA extraction was performed on the gauze via proteinase K digestion
and silica spin column using a QIAmp DNA Mini Kit (QIAGEN) following the
manufacturer’s instructions, with the exception of ATL buffer and ProK amounts; double
the amount of these two reagents were added. ProK digests were left overnight in a 56° C
water bath and after approximately 24 hours, tubes were placed at -20° C for at least 2
days. This seemed to increase DNA yield.
For PCR, I used D-loop primers LGL283 and LGL1115 (Lamb and Osentoski 1997),
which amplify a region of the mitochondrial control region, or D-loop approximately 500
bp in length. PCR reactions were carried out in a total volume of 25 μl, with

90
concentrations of reagents as follows: 1x PCR Buffer, 3.5 mM Magnesium Chloride, 0.2
mM dNTPs, 0.4 μM each of Forward and Reverse primer, and 0.1 units of taq
polymerase. Ten (10) μl of genomic DNA was used. Conditions for amplification were
based on Lamb and Osentoski (1997): 95° C initial denaturation for 5 minutes, 30 cycles
of denaturation at 92° C for 1 minute, annealing at 50° C for 1 minute, extension at 72° C
for 2 minutes and a final 7 minute extension at 72° C. Reactions were then held at 4° C.
PCR reactions were cleaned for sequencing using the silica based microcentrifuge
protocol of the QIAquick PCR purification kit (QIAGEN). Thirty μl of buffer EB were
added to more concentrated PCR products, while 20 μl were added to more dilute
products. The same primers were used in sequencing reactions on an ABI 3130 Genetic
Analyzer. The Big Dye terminator sequencing kit (Applied Biosystems) was used, with
total reaction volumes of 20 μl. One μl of PCR product was used, with 5X sequencing
buffer and a 10 μM concentration of primer. Parameters were as follows: 96° C for 1 min,
25 cycles of 96° C for 10 seconds, 50° C for 5 seconds, 60° C for 4 minutes, and a final
4° C hold. The oven temperature was preheated to 60° C while loading sequencing plates.
4.2.2. Estimates of Genetic Diversity
Sequences were initially aligned using MUSCLE
(http://www.ebi.ac.uk/Tools/services/web/toolform.ebi?tool=muscle), to be used for
statistical analyses. Sequences were checked for errors and trimmed to maximize the

91
cleanest regions of sequence, to obtain a final sequence of 362 base pairs. A statistical
parsimony network was drawn using the method of Templeton (1992) via the program
TCS (Clement et al. 2000). Estimates of genetic diversity within and among populations,
including mean number of pairwise differences, average gene diversity, haplotype
diversity, the number of polymorphic loci, and Fst were calculated using Arlequin v. 3.5
(Excoffier and Lischer 2010). Mismatch distributions were also obtained from Arlequin
to test for a potential bottleneck signature within the mitochondrial D-loop. Essentially,
the program plots the distribution of pairwise nucleotide site differences among different
haplotypes and the resulting distribution can be related to particular demographic trends
through a population’s history. Stable populations have multimodal distributions
(Rosenbaum et al. 2007; Markolf et al. 2008; Koumoundouros et al. 2009).
4.2.2. Demographic Information on Meadowlands Terrapins
Because of inconsistent time intervals between trapping days during each year, the
encounter histories for each tagged terrapin were collapsed down into 4 occasions, one
for each year. Maximum likelihood estimates of survival and recapture probabilities were
generated using Cormack-Jolly-Seber (CJS) models in the program MARK (White and
Burnham 1999). Candidate models were constructed to determine the effect of time and
sex on survival and recapture and an information criterion-based approached (AICc) was
used to determine the model that best fit the data (Table 4-2). The model with the lowest
AICc value is the best model. Akaike weights can be used to determine the level of

92
confidence in a particular model; the higher the weight, the more evidence to support that
model (Cooch and White 2010). With regards to the CJS models, since no one model
obtained greater than 90% of the weight of evidence (AICc weight > 0.90), a model
averaging approach was used.

93
Tab
le 4
-2. C
and
idat
e m
od
els
for
the
Co
rmac
k-J
oll
y-Se
ber
est
imat
es o
f su
rviv
al (
Ph
i) a
nd
rec
aptu
re
(p)
pro
bab
ilit
ies.
No
tati
on
: “g”
= g
rou
p e
ffec
t (s
ex),
“t”
= t
ime
effe
ct, “
t*g”
= e
ffec
t o
f in
tera
ctio
n o
f ti
me
and
sex
.

94
In addition, the Jolly-Seber POPAN formulation was used to obtain estimates of
probability of entrance (a metric that combines both recruitment and immigration), as
well as population estimates (Table 4-3).

95
Tab
le 4
-3. C
and
idat
e m
od
els
for
the
Joll
y-S
eber
PO
PA
N f
orm
ula
tio
n.
No
tati
on
: “g”
= g
rou
p
effe
ct (
sex)
, “t”
= t
ime
effe
ct, “
t*g”
= e
ffec
t o
f in
tera
ctio
n o
f ti
me
and
sex
, “p
ent”
= p
rob
abil
ity
of
entr
ance
.

96
4.3. Results
4.3.1. Statistical Parsimony
According to TCS, there are 47 haplotypes, and only one haplotype is shared between
two populations (the JFK9R haplotype from the JFK population is identical to the
ML7JR haplotype from the Meadowlands). There is a significant level of haplotype
diversity within the NY/NJ terrapins (Fig. 4-4). Sequences that were directly joined
differed from each other by anywhere from between 1 to 14 nucleotides. While there
does not seem to be any apparent clustering of the NY sequences, the Meadowlands
sequences cluster among themselves more frequently than they cluster with other
sequences.

97
Figure 4-4. Statistical parsimony network generated by TCS. Notation = “RB” = Ruler’s Bar, “JFK” = JFK airport, “H” = Hempstead, “ML” or “MW” = Meadowlands. Sequences RB2R, H14R, FK2R, RB4R, MWDR, ML8R, MWLR, MWJ5 and MWFR were not joined in the network by TCS with 95% certainty, suggesting they possess a greater number of nucleotide differences.

98
4.3.2. Estimates of Genetic Diversity using Arlequin
Average gene diversity for all populations pooled together was 0.9991 +/- 0.0045,
number of polymorphic sites was 146, mean number of pairwise differences was
19.948582 +/- 8.975421 and average nucleotide diversity over all loci was 0.060268 +/-
0.030097. Theta S was 32.89797 (s. d. 9.44904) and theta pi was 19.94858 (s. d.
9.96221). I then separated the populations and computed the estimates of genetic
diversity for the individual populations (Table 4-4).

99
Tab
le 4
-4. E
stim
ates
of
gen
etic
div
ersi
ty c
om
pu
ted
by
Arl
equ
in v
. 3.5
fo
r in
div
idu
al d
iam
on
db
ack
te
rrap
in p
op
ula
tio
ns
in N
Y a
nd
NJ.

100
Where pi2 is the probability of drawing
the same allele twice
Gene diversity indicates the probability of drawing the same two alleles at random from a
sample of genes and is given by
∑
Gene diversity values range from 0 to 1. If a sample contains many alleles that are all
present at similar frequencies, the gene diversity will be close to 1. If, instead, there are
few alleles, with one being present at a significantly higher frequency than the rest, the
value will be close to 0. Nucleotide diversity is a measure of the variation at individual
nucleotide sites and in this case, the small number is indicative of the similarities between
the sequences.
To assess genetic relatedness between populations, I obtained pairwise Fst values (Table
4-5). Fst is a measure of the degree of genetic differentiation between subpopulations and
will vary from 0 to 1 (Beebee and Rowe 2007). The closer the value is to 1, the more
genetically differentiated populations are, with a value of 1 indicating the populations are
fixed for different alleles. The closer the value to 0, conversely, the less differentiated
two populations are, with a value of 0 indicating no genetic differentiation at all. Little to
no genetic differentiation means that there are either migrants being exchanged between
the subpopulations OR that two subpopulations have split relatively recently in the past
and not enough time has elapsed for them to accumulate differences (Templeton 1998,
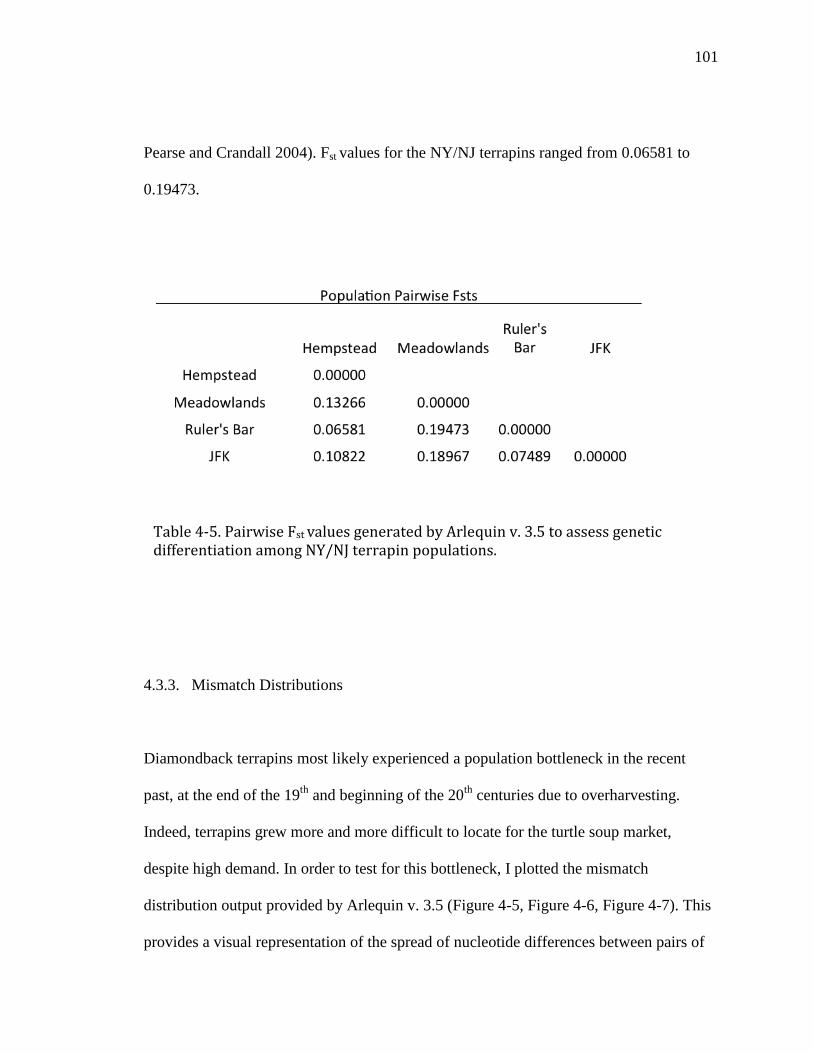
101
Pearse and Crandall 2004). Fst values for the NY/NJ terrapins ranged from 0.06581 to
0.19473.
4.3.3. Mismatch Distributions
Diamondback terrapins most likely experienced a population bottleneck in the recent
past, at the end of the 19th
and beginning of the 20th
centuries due to overharvesting.
Indeed, terrapins grew more and more difficult to locate for the turtle soup market,
despite high demand. In order to test for this bottleneck, I plotted the mismatch
distribution output provided by Arlequin v. 3.5 (Figure 4-5, Figure 4-6, Figure 4-7). This
provides a visual representation of the spread of nucleotide differences between pairs of
Table 4-5. Pairwise Fst values generated by Arlequin v. 3.5 to assess genetic differentiation among NY/NJ terrapin populations.

102
sequences (in this case, mitochondrial haplotypes). The shape of the distribution can give
indications as to past population events. In particular, multimodal distributions are
indicative of populations at stable equilbrium, unimodal distributions are indicative of
populations that have undergone a recent range expansion and bimodal distributions are
indicative of populations that have experienced a recent bottleneck (Johsnon et al. 2007,
Markolf et al. 2008, Excoffier et al. 2009, Cooch and White 2010).
These distributions arise because of how mutations accumulate in DNA sequences. The
oldest sequences in a population are going to differ by the largest number of mutations
simply because the more time passes, the higher the probability of mutations occurring.
As those older sequences give rise to younger sequences (moving forward in time to the
present), those younger sequences will inherit the mutations of the ancestral sequences,
but may also accumulate new mutations of their own. These younger sequences will have
fewer mismatches, as they have had less time to accumluate a large number of
differences (Wiley 2009).
Mismatch distributions are plotted against an expected null hypothesis of a recent range
expansion, which produces a smooth unimodal curve. Raggedness indices, which are
indicative of the fit between the observed mismatch distribution and this expected null
model, are reported. P values indicate significance of deviation from the null model. I
plotted mismatch distributions for each of the four populations separately, and then for all
terrapin sequences pooled together.

103
Raggedness index: 0.1244 P = 0.5600
Raggedness index: 0.01265 P = 0.7200
Figure 4-5. Mismatch distributions for A. The NJ Meadowlands terrapin population and B. The Hempstead Bay terrapin population.
A.
B.

104
Raggedness index: 0.0217 P = 0.5600
Raggedness index: 0.1131 P = 0.1600
A.
B. Figure 4-6. Mismatch distributions for A. The Ruler’s Bar terrapin population and B. The JFK airport terrapin population (Jamaica Bay).

105
Rag
ged
nes
s in
dex
: 0.0
05
0
P =
0.6
00
0
Fig
ure
4-7
. Mis
mat
ch d
istr
ibu
tio
n f
or
all N
Y/N
J p
op
ula
tio
ns
po
ole
d t
oge
ther
.

106
4.3.4. Demographic Parameters from Mark-Recapture Analysis
A total of 892 terrapins were marked between 2009 and 2012, with 418 female and 474
male. There were 141 recaptures. According to program MARK, the model with the
most support out of the set of candidate models showed time dependence in survival
probability and a combined effect of both time and sex for recapture probability. This
model was approximately 1.84 times more likely than the next model, in which both
survival and recapture probabilities showed time dependence and no effect of sex, and
almost 2.3 times more likely than the next two models, which showed an effect of sex on
survival and either a combined effect of sex and time on recapture or simply an effect of
time. Because no one model received an AICc weight value of over 0.90 (indicating that
it possessed at least 90% of the evidence to support it), a model averaging approach was
implemented and estimates were obtained that took into account model uncertainty.
Survival estimates were high for both males and females (0.933 for the first year of the
study and 0.704 for the second year of the study for males; 0.943 for the first year of the
study and 0.693 for the second year of the study for females). Recapture probabilities for
males were 0.155 for the first year of the study and 0.161 for the second year of the
study, while for females they were 0.207 and 0.243, respectively.
A Jolly-Seber POPAN formulation was used to estimate the population size of terrapins
in the Meadowlands. This is an indication of the super-population from which the
animals in the study could be drawn. The model that overwhelmingly received the

107
majority of support among the candidate model set was one which showed an effect of
time on survival (with no effect of sex), an effect of sex on recapture probability and a
combined effect of time and sex on the PENT parameter. PENT represents the
“Probability of Entrance”, which is a parameter that describes the likelihood of adding
new individuals to the population; the PENT parameter includes the contribution of both
immigration and recruitment. The number of males was estimated to be 1,770 while the
number of females was estimated to be 1,377, for a total population of 3,147. According
to the POPAN formulation, survival probability for the second year of the study was
0.668 and 0.404 for the third year of the study (for both males and females). Recapture
probability was 0.140 for males and 0.233 for females. Finally, the Table 4-6 lists the
PENT probabilities for males and females for the years of the study.
Table 4-6. Probability of Entrance parameter estimates from Jolly-Seber POPAN formulation.

108
4.4. Discussion and Conclusions
Reduced genetic diversity, which often accompanies a bottleneck event, can be
detrimental to a population’s long-term survival prospects. Lack of variation can deprive
a population of the ability to respond to environmental change. Furthermore, a bottleneck
event can increase the likelihood of inbreeding and this can lead to inbreeding depression
(Keller and Waller 2002). For birds, this reduction in fitness could be manifested as a
reduction in the number of hatchlings, a decreased fledgling rate or a decreased rate of
recruitment to reproductive age (Schmoll et al. 2005). Sperm deformities, sterility and
decreased courtship frequency also can result (Pusey and Wolf 1996). The cheetah, one
of the most inbred animals known, has a number of genetic deformities, thought to be the
result of inbreeding depression. Inbred spiders have smaller egg masses and lower
juvenile survival (Pusey and Wolf 1996). A reduction of genetic diversity can also
increase susceptibility to diseases and parasites; indeed, homozygous Soay sheep in an
isolated, inbred population suffered higher parasite loads than the heterozygous members
of the population (Keller and Waller 2002).
Diamondback terrapins were subjected to intense harvesting practices in the late 1800s
and early 1900s and records indicate that populations throughout the range suffered
drastic reductions (Roosenburg 1990). A drastic decrease in numbers of this nature often
leaves a genetic signature. I used mitochondrial DNA to detect this signature. I plotted
mismatch distributions of pairwise differences among DNA sequences and found that
there was an approximately bimodal distribution when pooling all NY/NJ sequences

109
together, suggesting the presence of a bottleneck signature (Markolf et al. 2008). The
very low raggedness index and high P value indicated, however, that there was a strong
signal of recent population expansion in the data; indeed, low raggedness values are
indicative of younger, expanding populations (Campos-Krauer and Wisely 2011, Ray et
al. 2003). Supporting the concept of population contraction followed by a recent range
expansion is the presence of high gene diversity and low nucleotide diversity. This
indicates that there are a large number of different sequences that, however, only diverge
on average at a small number of nucleotide sites; this indicates that these sequences are
young (the older a sequence is, the more time it has had to accumulate mutations)
(Gaubert et al. 2009).
In order to determine the contribution of the subpopulations to the picture of terrapin
historical demographic process in NY/NJ, I plotted the mismatch distributions for each of
the subpopulations separately. Both the Meadowlands and Hempstead populations show
similar patterns to that demonstrated by the overall population, though the Hempstead
population shows a higher raggedness index. This indicates a weaker signal of population
expansion, and a stronger contribution of recent population contraction. This could
indicate that the Hempstead population was comparatively small until relatively recently.
In contrast, both the Ruler’s Bar and JFK populations show a much stronger signal of
prolonged population expansion with their unimodal distributions centered over a mid-
range of pairwise differences. This difference in population histories is most likely due to
the availability of suitable habitat for terrapins in these two locations over a much longer

110
time span compared to the Meadowlands and Hempstead populations, therefore giving
the Ruler’s Bar and JFK populations more stable conditions under which to expand their
numbers.
These different signals can be explained by the fact that terrapins show a limited capacity
for dispersal (Gibbons et al. 2001, Avissar 2006, Harden et al. 2007) and therefore
different subpopulations will tend to diverge in their genetic characteristics. Indeed, when
looking at pairwise Fst values, we see moderate to great genetic differentiation among and
between NY/NJ subpopulations. Wright (1978) postulated that Fst values between 0.05
and 0.15 show moderate genetic differentiation, while values from 0.15 to 0.25 show
great genetic differentiation. Using these benchmarks, the weakest signals are found
between Ruler’s Bar and Hempstead (0.066) and Ruler’s Bar and JFK (0.075), and
therefore among the NY populations. The strongest signals are found between the NY
populations and the Meadowlands population (0.133 with Hempstead, 0.195 with Ruler’s
Bar and 0.190 with JFK). This corresponds with the idea that the Meadowlands terrapins
have been isolated from the NY populations and that long-distance migrations are
unlikely for this species. Besides unwillingness to cross areas of unsuitable habitat, lack
of long-distance migration in terrapins may be due to this species’ propensity for site
fidelity. In particular, many females of various turtle species show nest site fidelity, and
this behavior translates into clustering of mitochondrial haplotypes according to
geographic location (Encalada et al. 1998, Bowen and Karl 2007, Carreras et al. 2007).
This is precisely the pattern demonstrated in this study. The idea of site fidelity is further

111
evidenced by the moderate level of genetic differentiation between Ruler’s Bar turtles
and JFK turtles; there are no obvious barriers to movement between these two locations,
so any genetic divergence is most likely caused by female turtle preference to nest in
either one or the other location.
Finally, as mentioned, there is a significant level of genetic differentiation between the
Meadowlands population and the NY populations. In terms of the origin of the
Meadowlands population, this could indicate that the present-day population of
Meadowlands terrapins resulted from the expansion of a small number of terrapins that
persisted in isolated pockets of the Meadowlands, rather than from immigration from the
NY populations. Their genetic history is also slightly different than the NY terrapins,
having gone through a bottleneck event much more recently than either the Ruler’s Bar or
JFK populations, the more stable populations in NY. Hempstead provides an exception,
most likely due to the more recent nature of that population. Results from the mark-
recapture study add to this picture, showing a population that has grown to an estimated
3,147 individuals in the 37 years since terrapins were first mentioned in the NJ
Meadowlands. Furthermore, survival rates of adults were high (which is not surprising
for a long-lived turtle species). The lower recapture rates I found for males could be
consistent with the idea that while females show high levels of site fidelity, males are the
dispersers in this species.

112
In summary, we can see that Diamondback terrapins did experience a bottleneck, but
seem to be recovering from this decrease in population size. Genetic diversity was
reduced in the past, but populations in NY and NJ are expanding in such a way as to
show new mutations in each of the populations studied. This expansion is occurring in
highly urbanized habitats, which indicates that terrapins can thrive alongside human
activity if properly managed. Female site fidelity could pose a problem if nesting
locations are lost, as is occurring in Jamaica Bay due to the degradation of marshes.
Terrapins there seem to be responding by switching nesting locations from Ruler’s Bar to
the JFK airport marsh, JoCo marsh; this is causing problems, though, as female terrapins
are crossing airport runways in their search for nesting sites. If the Port Authority of New
York and New Jersey chooses to exclude terrapins from JoCo marsh, the impact on the
population of terrapins around JFK and Ruler’s Bar could be significant. Terrapins in
urban environments also face the threat of subsidized predators (Russ Burke, pers.
comm.), or animals that benefit from increased resource availability resulting from the
presence of humans (Boarman 1997, Gompper and Vanak 2008). On Ruler’s Bar,
approximately 95-98% of nests are predated by raccoons (Russ Burke, pers. comm.). This
seems to be a problem in the Meadowlands as well (Brett Bragin, pers. comm), though it
has yet to be quantified. Road mortality does not seem to pose a significant threat in any
of the populations studied, as females do not need to cross any major roadways in order
to find suitable nesting sites. Crab pot mortality is also virtually non-existent, as crabbing
is not practiced in the locations under study. Therefore, if provided with sufficient nest

113
site locations and afforded protection from predation, then terrapins can fare well in areas
impacted by anthropogenic activity.

114
CHAPTER 5
MANAGEMENT IMPLICATIONS
Herpetofauna are often limited in their ability to respond to anthropogenic disturbance
mainly because of life history characteristics and limited dispersal capabilities. This
means that an important survival strategy in a world of ever-increasing human
development may be to live alongside humans, and tolerate a certain level of disturbance.
This kind of co-existence may be successful only with appropriate management
strategies, however. In order for these management strategies to be enacted, there must be
an adequate understanding of the consequences of disturbance.
The presence of two emerging infectious diseases of amphibians, chytridiomycosis and
Ranavirus, has now been documented in New Jersey. While chytridiomycosis does not
seem to be a current threat, Ranavirus has been decimating certain amphibian
populations. The locations in which it has currently caused mass mortality events are
home to some of New Jersey’s most sensitive herpetofaunal species, including Fowler’s
toads (Anaxyrus fowleri), the endangered Blue-spotted salamanders (Ambystoma
laterale), the threatened Pine Barrens Tree frog (Hyla andersonii) and the threatened
Northern Pine Snake (Pituophis melanoleucus). Little is known about Ranavirus’ ecology
and transmission in the wild, or its potential impact on species already in decline. Further

115
investigation of the extent of Ranavirus infection in New Jersey and its impact on both
stable and declining species is critical in order to manage amphibian populations.
In particular, the finding of Ranavirus in New Jersey has led wildlife biologists and
environmental educators to pay more attention to preventing the spread of the disease.
There is evidence that both chytridiomycosis and Ranavirus have reached their global
distribution mainly due to human activities. In parts of the United States, salamander
larvae are sold as fish bait; studies have shown that many of these larvae are infected with
Ranavirus (Picco et al. 2007, Schloegel et al. 2009). Ranavirus can also persist in wet
sediment and water for up to two weeks (Daszak et al. 1999, Gray et al. 2009) and boots,
vehicles and equipment that are not properly cleaned can transport virus particles in
sediment and water between sites. In keeping with the directive issued by the World
Organization for Animal Health (OIE) to take steps towards preventing the spread of
Ranavirus and Bd, we have suggested that all personnel that visit wetland habitats have
decontamination protocols in place.
Besides spreading disease, human activities have also led, albeit indirectly (perhaps), to
the spread of new herpetological species through range expansions. A case in point is the
American Green Tree frog expanding its range into New Jersey. There is strong evidence
that this species has now established itself in southern NJ because of increasing
temperatures and the creation of favorable environmental conditions. As of now no
known negative consequences have resulted from the presence of Hyla cinerea in NJ. It

116
has demonstrated dietary plasticity outside of its native range (Leavitt and Fitzgerald
2009), but it does not seem to have impacted ecosystems in NJ. However, there is a
concern. There have been documented cases of hybridization between Hyla cinerea and
Hyla andersonii, the Pine Barrens tree frog, in Florida (Anderson and Moler 1986). New
Jersey has a disjunct population of H. andersonii in southern NJ, in the vicinity of the
locations that are being colonized by the green tree frog; the NJ population of H.
andersonii is state threatened. Studies have shown that habitat degradation often leads to
H. cinerea coming into contact and breeding with other hylid species, including H.
andersonii (Anderson and Moler 1986, Aresco 1996). Hybrids showed no developmental
abnormalities, but were infertile (Anderson and Moler 1986). Female H. andersonii seem
to actually prefer male H. cinerea (Anderson and Moler 1986) when the latter called
more loudly than males of their own species. This could potentially negatively impact the
threatened population of Pine Barrens tree frogs by “contaminating” the gene pool. Close
observation of this species in southern NJ is critical to prevent large-scale disruptions of
local ecological communities. Future management strategies will benefit from the results
of this monitoring.
Finally, there are examples of species successfully thriving in the face of anthropogenic
disturbance, such as the Diamondback terrapins in Jamaica Bay, NY and the NJ
Meadowlands. Understanding the characteristics of these populations can shed light on
how to manage other urban-dwelling wildlife for both the benefit of ecosystem health and
urban ecosystem. Fortunately, the appreciation for urban ecology is growing. Direct

117
exposure to the outdoors and wildlife has been shown to improve the well being of
humans (Maller et al. 2005, Berman et al. 2012) and their understanding of the
importance of environmental issues (Strife and Downey 2009). People who live in
urbanized areas often have limited opportunities to get outdoors and are forced to seek
ecological experiences close to home (Strife and Downey 2009). The establishment and
maintenance of parks and refuges that are home to wildlife, like reptiles and amphibians,
are extremely important for these individuals. Reptiles and amphibians are ideal for urban
wildlife refuges, as they do not require vast open spaces for survival. An improved
understanding of environmental issues on the part of people who live in urban areas can
lead to increased support for conservation programs.
118
REFERENCES
Allendorf FW, England PR, Luikart G, Ritchie PA, Ryman N. 2008. Genetic effects of
harvest on wild animal populations. Trends in Ecology and Evolution
23:327—337
Alter SE, Rynes E, Palumbi SR. 2007. DNA evidence for historic population size and
past ecosystem impacts of gray whales. Proceedings of the National Academy
of Sciences. 104:15162-15167.
Anderson K and Moler PE. 1986. Natural Hybrids of the Pine Barrens Treefrog, Hyla
andersonii with H. cinerea and H. femoralis (Anura, Hylidae): Morphological
and Chromosomal Evidence. Copeia. 1:70-76.
Annis SL, Dastoor FP, Ziel H, Daszak P, Longcore JE. 2004. A DNA-Based Assay
Identifies Batrachochytrium dendrobatidis in Amphibians. Journal of Wildlife
Diseases. 40:420-428.
Aresco MJ. 1996. Geographic variation in the morphology of the lateral stripe of the
green treefrog (Hyla cinerea) in the southeastern United States. The American
Midland Naturalist. 135:293-298.
Austerlitz F, Jung-Muller B, Godelle B and Gouyon P. 1997. Evolution of Coalescence
Times, Genetic Diversity and Structure during Colonization. Theoretical
Population Biology. 51:148-164.
Avissar NG. 2006. Changes in population structure of diamondback terrapins
(Malaclemys terrapin terrapin) in a previously surveyed creek in southern New
Jersey. Chelonian Conservation and Biology. 5:154-159.

119
Baldwin JD, Latino LA, Mealey BK, Parks GM, Forstner MRJ. 2005. The diamondback
terrapin in Florida Bay and the Florida Keys: insights into turtle conservation
and biology. In: Amphibians and Reptiles: status and conservation in Florida
(eds. Meshaka WE, Babbitt KJ) pp180—186. Krieger Publishing Company,
Malabar, Florida.
Balseiro A, Dalton KP, del Cerro A, Marquez I, Cunningham AA, Parra F, Prieto JM,
Casais R. 2009. Pathology, isolation and molecular characterisation of a
ranavirus from the common midwife toad Alytes obstetricans on the Iberian
Peninsula. Diseases of Aquatic Organisms. 84:95-104.
Barton, NJ and Charlesworth B. 1984. Genetic Revolutions, Founder Effects,
and Speciation. Annual Review of Ecology and Systematics. 15:133-164.
Beebee T, Rowe G (2007) An Introduction to Molecular Ecology. University of
Oxford Press, Oxford, England.
Berger L, Speare R, Daszak P, Green DE, Cunningham AA, Goggin CL, Slocombe R,
Ragan MA, Hyatt AD, McDonald KR, Hines HB, Lips KR, Marantelli G,
Parkes H. 1998. Chytridiomycosis causes amphibian mortality associated with
population declines in the rain forests of Australia and Central America. PNAS.
95:9031-9036.
Berger L, Speare R, Hyatt AD. 1999. Chytrid fungi and amphibian declines:
overview, implications and future directions. In: Campbell A (ed) Declines
and disappearances of Australian frogs. Environment Australia, Canberra. 23-33.

120
Berman MG, Kross E, Krpan KM, Askren MK, Burson A, Deldin PJ, Kaplan S,
Sherdell L, Gotlib IH, Jonides J. 2012. Interacting with Nature Improves
Cognition and Affect for Individuals with Depression. Journal of Affective
Disorders. 140:300-305.
Black FR. 1981. Jamaica Bay: A History. Cultural Resource Management Study No. 3.
Blaustein AR, Walls SC, Bancroft BA, Lawler JJ, Searle CL, Gervasi SS. 2010. Direct
and Indirect Effects of Climate Change on Amphibian Populations. Diversity.
2:281-313.
Boarman WI. Predation on Turtles and Tortoises by a “Subsidized Predator”. 1997.
Proceedings: Conservation, Restoration, and Management of Tortoises and
Turtles. 103-104.
Bocxlaer IV, Loader SP, Roelants K, Biju SD, Menegon M, Bossuyt F. 2010. Gradual
Adaptation Toward a Range-Expansion Phenotype Initiated the Global Radiation
of Toads. Science. 327:679-682.
Bowen BW and Karl SA. 2007. Population genetics and Phylogeography of sea
turtles. Molecular Ecology. 16:4886-4907.
Brennessel B. 2006. Diamonds in the Marsh: A natural history of the Diamondback
terrapin. University Press of New England, Lebanon, New Hampshire.
Briggs CJ, Vredenberg VT, Knapp RA, Rachowicz LJ. 2005. Investigating the
Population-Level Effects of Chytridiomycosis: An Emerging Infectious
Disease of Amphibians. Ecology. 86:3149-3159.
Brown SK, Hull JM, Updike DR, Fain SR, Ernest HB (2009) Black bear population

121
genetics in California: Signatures of population structure, competitive release, and
historical translocation. Journal of Mammalogy. 90:1066-1074.
Brunner JL, Schock DM, Davidson EW, Collins JP. 2004. Intraspecific reservoirs:
complex life history and the persistence of a lethal ranavirus. Ecology.
85:560-566.
Brunner JL, Richards K, Collins JP. 2005. Dose and host characteristics influence
virulence of ranavirus infections. Oecologia. 144:399-406.
Bryan LK, Baldwin CA, Gray MJ, Miller DL. 2009. Efficacy of select disinfectants at
inactivating Ranavirus. Diseases of Aquatic Organisms. 84:89-94.
Butler JA, Seigel RA, Mealey BK. 2006. Malaclemys terrapin – Diamondback
Terrapin. Chelonian Research Monographs. 3:279-295.
Campos-Krauer JM and Wisely SM. 2011. Deforestation and cattle ranching drive
rapid range expansion of capybara in the Gran Chaco ecosystem. Global
Change Biology. 17:206-218.
Carey C, Bruzgul JE, Livo LJ, Walling ML, Kuehl KA, Dixon BF, Pessier AP, Alford
RA, Rogers KB. 2006. Experimental Exposures of Boreal Toads (Bufo boreas)
to a Pathogenic Chytrid Fungus (Batrachochytrium dendrobatidis). EcoHealth.
3:5-21.
Carey C, Heyer WR, Wilkinson J, Alford RA, Arntzen JW, Halliday T, Hungerford L,
Lips KR, Middleton EM, Orchard SA, Rand AS. 2001. Amphibian Declines and
Environmental Change: Use of Remote-Sensing Data to Identify Environmental
Correlates. Conservation Biology. 15:903-913.

122
Carreras C, Pascual M, Cardona L, Aguilar A, Margaritoulis D, Rees A, Turkozan O,
Levy Y, Gasith A, Aureggi M, Khalil M. 2007. The genetic structure of the
loggerhead sea turtle (Caretta caretta) in the Mediterranean as revealed by
nuclear and mitochondrial DNA and its conservation implications.
Conservation Genetics. 8:761-775.
Carson HL and Templeton AR. 1984. Genetic Revolutions in Relation to Speciation
Phenomena: The Founding of New Populations. Annual Review of Ecology and
Systematics. 15:97-131.
Center for Integrative Environmental Research, University of Maryland and The
National Conference of State Legislatures. 2008. Climate Change and the
Economy in NJ: Assessing the Costs of Climate Change.
Claisse JT, McTee SA, Parrish JD. 2008. Effects of age, size, and density on natural
survival for an important coral reef fishery species, yellow tang, Zebrasoma
flavescens. Coral Reefs. 28:95-105.
Colautti RI and MacIsaac HJ. 2004. A neutral terminology to define ‘invasive’ species.
Diversity and Distributions. 10:135-141.
Conner CA, Douthitt BA, Ryan TJ. 2005. Descriptive ecology of a turtle assemblage in
an urban landscape. American Midland Naturalist. 153:426-435.
Cooch E and White G. 2010. Program MARK: a gentle introduction.
http://www.phidot.org/software/mark/docs/book/
Coulon A, Guillot G, Cosson J-F, Angibault JMA, Aulagnier S, Cargnelutti B, Galan M,

123
Hewison JM (2006) Genetic structure is influenced by landscape features:
empirical evidence from a roe deer population. Molecular Ecology 15:1669-1679.
Crompton AE, Obbard ME, Peterson SD, Wilson PJ (2008) Population genetic
structure in polar bears (Ursus maritimus) from Hudson Bay, Canada:
Implications of future climate change. Biological Conservation. 141:2528-2539.
Cunningham J, Baard EHW, Harley EH, O’Ryan C. 2002. Investigation of genetic
diversity in fragmented geometric tortoise (Psammobates geometricus)
populations. Conservation Genetics. 3:215-223.
Daszak P, Berger L, Cunningham AA, Hyatt AD, Green E, Speare R. 1999. Emerging
Infectious Diseases and Amphibian Population Declines. Emerging Infectious
Diseases. 5:735-748.
Daszak P, Cunningham AA, Hyatt AD. 2001. Anthropogenic environmental change
and the emergence of infectious diseases in wildlife. Acta Tropica.
78:103-116.
Davic RD, Hartwell HW Jr. 2004. On the Ecological Roles of Salamanders. Annual
Review of Ecology, Evolution, and Systematics. 35:405-434.
Densmore CL, Green DE. 2007. Disease of Amphibians. ILAR Journal 48:235-254.
DeVoe R, Geissler K, Elmore S, Rotstein D, Lewbart G, Guy J. 2004. Ranavirus-
associated morbidity and mortality in a group of captive eastern Box turtles
(Terrapene carolina carolina). Journal of Zoo and Wildlife Medicine.
35:534-543.
DeYoung RW, Honeycutt RL. 2005. The molecular toolbox: genetic techniques in

124
wildlife ecology and management. Journal of Wildlife Management.
69:1362-1384.
DiLeo K. 2012. Geographic Distribution: Hyla cinerea. Herpetological Review. 43:97.
Dixon JD, Oli MK, Wooten MC, Eason TH, McCown JW Cunningham MW. 2007.
Genetic consequences of habitat fragmentation and loss: the case of the Florida
black bear (Ursus americanus floridanus). Conservation Genetics. 8:455-464.
Doyle J, Brinkworth CS, Wegener KL, Carver JA, Llewellyn LE, Oliver IN, Bowie JH,
Wabnitz PA, Tyler MJ. 2003. nNOS inhibition, antimicrobial and anticancer
activity of the amphibian skin peptide, citropin 1.1 and synthetic modifications.
European Journal of Biochemistry. 270:1141-1153.
Drew A, Allen EJ, Allen LJS. 2006. Analysis of climatic and geographic factors
affecting the presence of chytridiomycosis in Australia. Diseases of Aquatic
Organisms. 68:245-250.
Emerson BC, Paradis E, Thébaud C. 2001. Revealing the demographic histories of
species using DNA sequences. TRENDS in Ecology and Evolution. 16:707-716.
Encalada SE, Bjorndal KA, Bolten AB, Zurita JC, Schroeder B, Possardt E, Sears CJ,
Bowen BW. 1998. Population structure of loggerhead turtle (Caretta caretta)
nesting colonies in the Atlantic and Mediterranean as inferred from
mitochondrial DNA control region sequences. Marine Biology. 130:567-575.
Ernest HB, Boyce WM, Bleich VC, May B, Stiver SJ, Torres SG (2003) Genetic
structure of mountain lion (Puma concolor) populations in California.
Conservation Genetics 4:353-366.

125
Excoffier L, Foll M, Petit RJ. 2009. Genetic Consequences of Range Expansions. Annual
Review of Ecology, Evolution and Systematics. 40:481-501.
Excoffier L and Lischer HEL. 2010. Arlequin suite ver 3.5: A new series of programs
to perform populations genetics analyses under Linux and Windows.
Molecular Ecology Resources. 10:564-567.
Fisher MC, Garner TWJ, Walker SF. 2009. Global Emergence of Batrachochytrium
dendrobatidis and Amphibian Chytridiomycosis in Space, Time, and Host.
Annual Review of Microbiology. 63:291-310.
Fitzpatrick BM, Fordyce JA, Niemiller ML, Reynolds RG. 2012. What can DNA tell us
about biological invasions? Biological Invasions. 14:235-253.
Forson D, Storfer A. 2006a. Effects of Atrazine and Iridovirus Infection on Survival
and Life-History Traits of the Long-toed Salamander (Ambystoma
macrodactylum). Environmental Toxicology and Chemistry. 25:168-173.
Forson DD, Storfer A. 2006b. Atrazine Increases Ranavirus Susceptibility in the Tiger
Salamander, Ambystoma tigrinum. Ecological Applications. 16:2325-2332.
Frankham R. 2010. Challenges and opportunities of genetic approaches to biological
conservation. Biological Conservation. 143:1919-1927.
Frankham R, Ballou JD, Dudash MR, Eldridge MDB, Fenster CB, Lacy RC, Mendelson
JR III, Porton IJ, Ralls K, Ryder OA. 2012. Implications of different species
concepts for conserving biodiversity. Biological Conservation. 153:25-31.
Freed AN. 1980. Prey Selection and Feeding Behavior of the Green Treefrog (Hyla
cinerea). Ecology. 61:461-465.

126
Funk WC, Forsman ED, Johnson M, Mullins TD, Haig SM. 2009. Evidence for recent
Population bottlenecks in northern spotted owls (Strix occidentalis caurina).
Conservation Genetics. 11:1013-1021.
Gascon C, Colins JP, Moore RD, Church R, McKay JE, Menelson JR III. 2005.
Amphibian Conservation Action Plan. Proceedings: IUCN/SSC Amphibian
Conservation Summit 2005.
Gaubert P, Godoy JA, del Cerro I, Palomares F. 2009. Early phases of a successful
invasion: mitochondrial Phylogeography of the common genet (Genetta
genetta) within the Mediterranean Basin. Biological Invasions. 11:523-546.
Gibbons JW, Lovich JE, Tucker AD, FitzSimmons NN, Greene JL. 2001. Demographic
and ecological factors affecting conservation and management of the
diamondback terrapin (Malaclemys terrapin). Chelonian Conservation Biology.
4:66-74.
Gibbs JP and Breisch AR. 2001. Climate Warming and Calling Phenology of Frogs
near Ithaca, New York, 1900-1999. Conservation Biology. 15:1175-1178.
Gibson SY, Van Der Marel RC, Starzomski BM. 2009. Climate Change and
Conservation of Leading-Edge Peripheral Populations. Conservation Biology.
23:1369-1373.
Gompper ME and Vanak AT. 2008. Subsidized predators, landscapes of fear and
disarticulated carnivore communities. Animal Conservation. 11:13-14.
Goode GB. 1887. The Fisheries and Fishery Industries of the United States. A
Geographical Review of the Fisheries Industries and Fishing Communities for

127
the Year 1880. Section 2:381-503.
Gray MJ, Miller DL, Hoverman JT. 2009a. First Report of Ranavirus Infecting Lungless
Salamanders. Herpetological Review. 40:316-319.
Gray MJ, Miller DL, Hoverman JT. 2009b. Ecology and pathology of amphibian
ranaviruses. Diseases of Aquatic Organisms. 87:243-266.
Greer AL, Berrill M, Wilson PJ. 2005. Five amphibian mortality events associated
with Ranavirus infection in south central Ontario, Canada. Diseases of Aquatic
Organisms. 67:9-14.
Gunzburger MS. 2006. Reproductive Ecology of the Green Treefrog (Hyla cinerea) in
Northwestern Florida. The American Midland Naturalist. 155:321-328.
“Hackensack Meadows”. July 2, 1901. NY Tribune. Pg. 12.
Hamer AJ, McDonnell MJ. 2008. Amphibian ecology and conservation in the
urbanizing world: A review. Biological Conservation. 141:2432-2449.
Harden LA, Diluzio NA, Gibbons JW, Dorcas ME. 2007. Spatial and thermal ecology of
Diamondback terrapins (Malaclemys terrapin) in a South Carolina salt marsh.
Journal of the North Carolina Academy of Science. 123:154-162.
Harp EM and Petranka JW. 2006. Ranavirus in Wood frogs (Rana sylvatica):
Potential Sources of Transmission within and between Ponds. Journal of
Wildlife Diseases. 42:307-318.
Harshberger JW and Burns VG. 1919. The Vegetation of the Hackensack Marsh: A
Typical American Fen. Transactions of the Wagner Free Institute of Science of
Philadelphia. Vol 9-Part1.

128
Hart KM, Lee DS. 2006. The diamondback terrapin; the biology, ecology, cultural
history, and conservation status of an obligate estuarine turtle. Studies in Avian
Biology. 32:206-213.
Hartig EK, Gornitz V, Kolker A, Mushacke F, Fallon D. 2002. Anthropogenic
And climate-change impacts on salt marshes of Jamaica Bay, New York City.
Wetlands. 22:71-89.
Haynes GD, Gongora J, Gilligan DM, Grewe P, Moran C, Nicholas FW. 2012. Cryptic
Hybridization and introgression between invasive Cyprinid species Cyprinus
Carpio and Carassius auratus in Australia: implications for invasive species
Management. Animal Conservation. 15:83-94.
Headlee TJ. 1911. Mosquito Breeding Conditions on the Hackensack River Marshes.
Mosquito Commission Report.
Hossak BR, Adams MJ, Campbell Grant EH, Pear CA, Bettaso JB, Barichivich WJ,
Lowe WH, True K, Ware JL, Corn PS. 2010. Low Prevalence of Chytrid Fungus
(Batrachochytrium dendrobatidis) in Amphibians of U.S. Headwater Streams.
Journal of Herpetology. 44:253-260.
Hulme PE. 2009. Trade, transport and trouble: managing invasive species pathways
in an era of globalization. Journal of Applied Ecology. 46:10-18.
Hutchens S and DePerno C. 2009. Measuring species diversity to determine land-use
effects on reptile and amphibian assemblages. Amphibia-Reptilia. 30:81-88.
Hyatt AD, Williamson M, Coupar BEH, Middleton D, Hengstberger SG, Gould AR,
Selleck P, Wise TG, Kattenbelt J, Cunningham AA, Lee J. 2002. First

129
Identification of a Ranavirus from Green Pythons (Chondropython viridis).
Journal of Wildlife Diseases. 38:239-252.
Ibrahim KM, Nichols RA, Hewitt GM. 1996. Spatial patterns of genetic variation
generated by different forms of dispersal during range expansion. Heredity.
77:282-291.
Invasive Species Specialist Group. www.issg.org
Irwin DE, Irwin JH, Price TD. 2001. Ring species as bridges between microevolution
and speciation. Genetica. 112-113:223-243.
Johnson JA, Dunn PO, Bouzat JL. 2007. Effects of recent population bottlenecks on
reconstructing the demographic history of prairie-chickens. Molecular
Ecology. 16:2203-2222.
Johnson MS. 1988. Founder effects and geographic variation in the land snail Theba
pisana. Heredity. 61:133-142.
Keller LF and Waller DM. 2002. Inbreeding effects in wild populations. Trends in
Ecology & Evolution. 17:230-241.
Kerby JL, Storfer A. 2009. Combined Effects of Atrazine and Chlorpyrifos on
Susceptibility of the Tiger Salamander to Ambystoma tigrinum Virus.
EcoHealth. 6:91-98.
Klopfstein S, Currat M, Excoffier L. 2006. The Fate of Mutations Surfing on the
Wave of a Range Expansion. Molecular Biology and Evolution.
23:482-490.
130
Koumoundouros T, Sumner J, Clemann N, Stuart-Fox D. 2009. Current genetic
isolation and fragmentation contrasts with historical connectivity in an alpine
lizard (Cyclodomorphus praealtus) threatened by climate change. Biological
Conservation. 142:992-1002.
Kraus ML and Smith DJ. 1988. Competition and Succession in a Perturbed Urban
Estuary: The Effects of Hydrology. Proceedings of the National Wetland
Symposium: Mitigation of Impacts and Losses. 325-327.
Kriger KM, Hines HB, Hyatt AD, Boyle DG, Hero J-M. 2006. Techniques for detecting
chytridiomycosis in wild frogs: comparing histology with real-time Taqman
PCR. Disease of Aquatic Organisms. 71:141-148.
Kriger KM, Hero J-M. 2007. The chytrid fungus Batrachochytrium dendrobatidis is
non-randomly distributed across amphibian breeding habitats. Diversity and
Distributions. 13:781-788.
Kuo C-H and Janzen FJ. 2004. Genetic effects of a persistent bottleneck on a natural
population of ornate box turtles (Terrapene ornata). Conservation Genetics. 5:
425-437.
Laikre L, Schwartz MK, Waples RS, Ryman N, The GeM Working Group. 2010.
Compromising genetic diversity in the wild: unmonitored large-scale release
of plants and animals. Trends in Ecology and Evolution. 25:520-529.
Lamb T and Osentoski MF. 1997. On the Paraphyly of Malaclemys: A Molecular
Genetic Assessment. Journal of Herpetology. 31:258-265.

131
Lawler JJ, Shafer SL, White D, Kareiva P, Maurer EP, Blaustein AR, Bartlein PJ. 2009.
Projected climate-induced faunal change in the Western Hemisphere.
Ecology. 90:588-597.
Lawler SH, Sussman RW, Taylor LL. 1995. Mitochondrial DNA of the Mauritian
Macaques (Macaca fascicularis): An example of the founder effect. American
Journal of Physical Anthropology. 96:133-141.
Leavitt DJ and Fitzgerald LA. 2009. Diet of Nonnative Hyla cinerea in a Chihuahuan
Desert Wetland. Journal of Herpetology. 43:541-545.
Le Corre V and Kremer A. 1998. Cumulative effects of founding events during
colonization on genetic diversity and differentiation in an island model and
stepping-stone model. Journal of Evolutionary Biology. 11:495-512.
Lips KR, Brem F, Brenes R, Reeve JD, Alford RA, Voyles J, Carey C, Livo L, Pessier
AP, Collins JP. 2006. Emerging infectious disease and the loss of biodiversity
in a Neotropical amphibian community. PNAS. 103:3165-3170.
Loughry WJ, Perez-Heydrich C, McDonough CM, Oli MK. 2013. Population ecology of
the nine-banded armadillo in Florida. Journal of Mammology. 94:408-416.
Mann RM, Hyne RV, Choung CB, Wilson SP. 2009. Amphibians and agricultural
chemicals: Review of the risks in a complex environment. Environmental
Pollution. 157:2903-2927.
Maguire Group Inc. 1989. Functional Assessment of Wetlands in New Jersey’s
Hackensack Meadowlands. Prepared for the U.S. Environmental Protection
Agency, Region 2.

132
Maller C, Townsend M, Pryor A, Brown P, St. Leger L. 2005. Healthy nature healthy
people: ‘contact with nature’ as an upstream health promotion intervention
for populations. Health Promotion International. 21:45-54.
Mao J, Hedrick RP, Chinchar VG. 1997. Molecular Characterization, Sequence
Analysis, and Taxonomic Position of Newly Isolated Fish Iridoviruses.
Virology. 229:212-220.
Marchand MN and Litvaitis JA. 2004. Effects of habitat features and landscape
composition on the population structure of a common aquatic turtle in a
region undergoing rapid development. Conservation Biology. 18:758-767.
Markolf M, Roos C, Kappeler P. 2008. Genetic and Demographic Consequences of a
Rapid Reduction in Population Size in a Solitary Lemur (Mirza coquereli).
The Open Conservation Biology Journal. 2:21-29.
Marschang RE, Becher P, Posthaus H, Wild P, Thiel H-J, Muller-Doblies U, Kaleta EF,
Bacciarini LN. 1999. Isolation and characterization of an iridovirus from
Hermann’s tortoises (Testudo hermanni). Archives of Virology.
144:1909-1922.
Marschang RE, Braun S, Becher P. 2005. Isolation of a Ranavirus from a Gecko
(Uroplatus fimbriatus). Journal of Zoo and Wildlife Medicine. 36:295-300.
May S and Beebee TJC. 2010. Recent introduction or ancient ancestry? Use of genetic
evidence to investigate the origins of range edge populations in natterjack
toads (Bufo calamita). Conservation Genetics. 11:293-300.

133
Monsen-Collar KJ, Hazard L, Dussa R. 2010. Comparison of PCR and RT-PCR in the
first report of Batrachochytrium dendrobatidis in amphibians in New Jersey,
USA. Herpetological Review. 41:460-462.
New Jersey Climate Adaptation Alliance, Rutgers University. 2011. Climate Change
in New Jersey: Trends and Projections.
Okello JBA, Nyakaana S, Masembe C, Siegismund HR, Arctander P. 2005.
Mitochondrial DNA variation of the common hippopotamus: evidence for a
recent population expansion. Heredity. 95:206-215.
Pearman PB, Garner TWJ, Straub M Greber UF. 2004. Response of the Italian Agile
Frog (Rana latastei) to a Ranavirus, Frog Virus 3: a Model for Viral Emergence
in Naïve Populations. Journal of Wildlife Diseases. 40:660-669.
Pearse DE and Crandall KA. 2004. Beyond Fst: Analysis of population genetic data
for conservation. Conservation Genetics. 5:585-602.
Pham L, Boudreaux S, Karhbet S, Price B, Ackleh AS, Carter, J, Pal N. 2007. Population
Estimates of Hyla cinerea (Schneider) (Green Tree Frog) in an Urban
Environment. Southeastern Naturalist. 6:203-216.
Phillips BL, Brown GP, Shine R. 2010. Evolutionarily accelerated invasions: the rate
of dispersal evolves upwards during the range advance of cane toads.
Journal of Evolutionary Biology. 23:2595-2601.
Picco AM, Brunner JL, Collins JP. 2007. Susceptibility of the Endangered California
Tiger Salamander, Ambystoma californiense, to Ranavirus Infection. Journal
of Wildlife Disease. 43:286-290.

134
Piotrowski JS, Annis SL, Longcore JE. 2004. Physiology of Batrachochytrium
dendrobatidis, a chytrid pathogen of amphibians. Mycologia. 96:9-15.
Potera, G.T. and E.E. MacNamara. 1972. Spartina alterniflora (tall) Productivity in a
Polluted New Jersey Estuary. Bulletin of the New Jersey Academy of Science.
17:13-14.
Pusey A and Wolf M. 1996. Inbreeding avoidance in animals. Trends in Ecology &
Evolution. 11:201-206.
Pyšek P and Richardson DM. 2010. Invasive Species, Environmental Change and
Management, and Health. Annual Review of Environment and Resources.
35:25-55.
Quinn JR. 1997. Fields of Sun and Grass: An Artist’s Journal of the New Jersey
Meadowlands. Rutgers University Press.
Rahel FJ and Olden JD. 2008. Assessing the Effects of Climate Change on Aquatic
Invasive Species. Conservation Biology. 22:521-533.
Ray N, Currat M, Excoffier L. 2003. Intra-Deme Molecular Diversity in Spatially
Expanding Populations. Molecular Biology and Evolution. 20:76-86.
Retallick RWR, McCallum H, Speare R. 2004. Endemic Infection of the Amphibian
Chytrid Fungus in a Frog Community Post-Decline. PLOS Biology.
2:1965-1971.
Roosenburg W. 1990. The Diamondback Terrapin: Population Dynamics, Habitat
Requirements, and Opportunities for Conservation. New Perspectives in the
Chesapeake System: A Research and Management Partnership. Proceedings

135
of a Conference. Chesapeake Research Consortium Publication No. 137.
Rosenbaum PA, Robertson JM, Zamudio KR. 2007. Unexpectedly low genetic
divergences among populations of the threatened bog turtle (Glyptemys
muhlenbergii). Conservation Genetics. 8:331-342.
Sacks BN, Mitchell BR, Williams CL, Ernest HB. 2005. Coyote movements and
social structure along a cryptic population genetic subdivision. Molecular
Ecology. 14:1241-1249.
Sakai AK, Allendorf FW, Holt JS, Lodge DM, Molofsky J, With KA, Baughman S,
Cabin RJ, Cohen JE, Ellstrand NC, McCauley DE, O’Neil P, Parker IM,
Thompson JN, Weller SG. 2001. The Population Biology of Invasive Species.
Annual Review Of Ecology and Systematics. 32:305-32.
Schiesari L, Grillitsch B, Grillitsch H. 2007. Biogeographic biases in research and
their consequences for linking amphibian declines to pollution. Conservation
Biology. 21:465-471.
Schloegel LM, Picco AM, Kilpatrick AM, Davies AJ, Hyatt AD, Daszak P. 2009.
Magnitude of the US trade in amphibians and presence of Batrachochytrium
Dendrobatidis and ranavirus infection in imported North American bullfrogs
(Rana catesbeiana). Biological Conservation. 142:1420-1426.
Schmoll T, Quellmalz A, Dietrich V, Winkel W, Epplen JT, Lubjuhn T. 2005. Genetic
similarity between pair mates is not related to extrapair paternity in the
socially monogamous coal tit. Animal Behaviour. 69:1013-1022.

136
Schwartz MK, Luikart G, Waples RS. 2006. Genetic monitoring as a promising tool
for conservation and management. Trends in Ecology and Evolution.
22:25-33.
Sexton JP, McIntyre PJ, Angert AL, Rice KJ. 2009. Evolution and Ecology of Species
Range Limits. Annual Review of Ecology, Evolution, and Systematics.
40:415-436.
Silliman BR, Bertness MD. 2002. A trophic cascade regulates salt marsh primary
production. Proceedings of the National Academy of Sciences of the United
States of America. 99:10500-10505.
Sipple WS. 1972. The Past and Present Vegetation of the Hackensack Meadows.
Bartonia. 41:4-56.
Slatkin M. 1985. Gene Flow in Natural Populations. Annual Review of Ecology and
Systematics. 16:393-430.
Slatkin M. 1987. Gene flow and the geographic structure of natural populations.
Science. 236:787-792.
St-Amour V, Lesbarrères. 2007. Genetic evidence of Ranavirus in toe clips: an
Alternative to lethal sampling methods. Conservation Genetics. 8:1247-1250.
St-Amour V, Wong WM, Garner WJ, Lesbarrères D. 2008. Anthropogenic Influence
on Prevalence of 2 Amphibian Pathogens. Emerging Infection Diseases.
14:1175-1176.
State of New Jersey Department of Community Affairs. 1968. The Hackensack
Meadowlands. Jersey Plans. Vol XVII, No.2.

137
Strife S and Downey L. 2009. Childhood Development and Access to Nature.
Organization and Environment. 22:99-122.
Teacher AGF, Garner TWJ, Nichols RA. 2009. Population genetic patterns suggest a
behavioural change in wild common frogs (Rana temporaria) following
disease outbreaks (Ranavirus). Molecular Ecology. 18:3163-3172.
Teacher AGF, Cunningham AA, Garner TWJ. 2010. Assessing the long-term impact of
Ranavirus infection in wild common frog populations. Animal Conservation.
13:514-522.
Templeton AR. 1980. The Theory of Speciation via the Founder Principle. Genetics.
94:1011-1038.
Templeton AR. 1998. Nested clade analyses of phylogeographic data: testing
hypotheses about gene flow and population history. Molecular Ecology.
7:381-397.
“The Reclamation of Marsh Lands – A Useful Profit”. October 8, 1866. The New York
Times.
Thomas CD. 2010. Climate, climate change and range boundaries. Diversity and
Distributions. 16:488-495.
Tolley KA, Davies, SJ, Chown SL. 2008. Deconstructing a controversial local range
expansion: conservation biogeography of the painted reed frog (Hyperoloius
marmoratus) in South Africa. Diversity and Distributions. 14:400-411.
Torres-Leguizamón M, Dupas S, Dardon D, Gómez, Niño L, Carnero A, Padilla A,
Merlin I, Fossoud A, Zeddam J-L, Lery X, Capdevielle-Dulac C, Dangles O,

138
Silvain J-F. 2011. Inferring native range and invasion scenarios with
mitochondrial DNA: the case of T. solanivora successive north-south step-
wise introductions across Central and South America. Biological Invasions.
13:1505-1519.
Tucker AD, Gibbons JW, Greene JL. 2001. Estimates of adult survival and migration
for diamondback terrapins: conservation insight from local extirpation within a
metapopulation. Canadian Journal of Zoology. 79:2199-2209.
Tucker JK, Lamer JT, Dolan CR. 2008. A northern range expansion for the green tree
frog (Hyla cinerea) and trends in distributions of Illinois reptiles and
amphibians. Transactions of the Illinois State Academy of Science. 101:125-131.
Une Y, Sakuma A, Matsueda H, Nakai K, Murakami M. 2009. Ranavirus outbreak in
North American Bullfrogs (Rana catesbeiana), Japan, 2008. Emerging
Infectious Diseases. 15:1146-1147.
Union of Concerned Scientists. 2007. New Jersey: Confronting Climate Change in the
US Northeast.
Van Den Bussche RA, Lack JB, Onorato DP, Gardner-Santana LC, McKinney BR,
Delgadillo Villalobos J, Chamberlain MJ, White D, Hellgren EC. 2009.
Mitochondrial DNA Phylogeography of Black Bears (Ursus americanus)
in Central and Southern North America: Conservation Implications. Journal
of Mammalogy. 90:1075-1082.

139
Van Sluys M, Hero J-M. 2009. How Does Chytrid Infection Vary Among Habitats?
The Case of Litoria wilcoxii (Anura, Hylidae) in SE Queensland, Australia.
EcoHealth. 6:576-583.
Voordouw MJ, Adama D, Houston B, Govindarajulu P, Robinson J. 2010. Prevalence
of the pathogenic chytrid fungus, Batrachochytrium dendrobatidis, in an
endangered population of northern leopard frogs, Rana pipiens. BMC Ecology.
10:6.
Wake DB. 1997. Incipient species formation in salamanders of the Ensatina complex.
Proceedings of the National Academy of Sciences. 94:7761-7767.
Wakely J. 1998. Segregating Sites in Wright’s Island Model. Theoretical Population
Biology. 53:166-174.
Waldman J. 2008. Research Opportunities in the Natural and Social Sciences at the
Jamaica Bay Unit of Gateway National Recreation Area.
Watts PC, Keat S, Thompson DJ. 2010. Patterns of spatial genetic structure and
diversity at the onset of a rapid range expansion: colonization of the UK by
the small red-eyed damselfly Erythromma viridulum. Biological Invasions.
12:3887-3903.
“Wetland Bio-Zones of the Hackensack Meadowlands: An Inventory”. 1975. A Report
of the Hackensack Meadowlands Development Commission.
Westhouse RA, Jacobson ER, Harris RK, Winter R, Homer, BL. 1996. Respiratory and
pharyngo-esophageal iridovirus infection in a gopher tortoise (Gopherus
polyphemus). Journal of Wildlife Diseases. 32:682-686.

140
Whiles MR, Lips KR, Pringle CM, Kilham SS, Bixby RJ, Brenes R, Connelly S,
Colon-Gaud JC, Hunte-Brown M, Huryn AD, Montgomery C, Peterson S. 2006.
The effects of amphibian population declines on the structure and function of
Neotropical stream ecosystems. Frontiers in Ecology and the Environment.
4:27-34.
White GC and Burnham KP 1999. Program MARK: Survival estimation from
population of marked animals. Bird Study 46 Supplement, 120-138.
Whitlock MC and McCauley DE. 1990. Some Population Genetic Consequences of
Colony Formation and Extinction: Genetic Correlations within Founding
Groups. Evolution. 44:1717-1724.
Whitlock MC and McCauley DE. 1999. Indirect measures of gene flow and migration:
Fst ≠1/(4Nm+1). Heredity. 82:117-125.
Wright S. 1978. Evolution and the Genetics of Populations. University of Chicago
Press, Chicago.
Wyman RL. 1998. Experimental assessment of salamanders as predators of detrital
food webs: effects on invertebrates, decomposition and the carbon cycles.
Biodiversity and Conservation. 7:641-650.
Zhao Z, Teng Y, Liu H, Lin X, Wang K, Jiang Y, Chen H. 2007. Characterization of a
late gene encoding for MCP in soft-shelled turtle iridovirus (STIV). Virus
Research. 129:135-144.

141
APPENDIX A
Hyla cinerea ND1 Sequences
L1
TTCGTTTGTTCAACGATTAAAACCCTACGTGATCTGAGTTCAGACCGGAGCAATCCA
GGTCAGTTTCTATCTATAACAGCGCTTTCTCTAGTACGAAAGGACCGAAAAAGCATG
GTCCATGTATTATGCAAACCATACCCGATTATTTATGACCTAGTCTCAATAAACACTC
AACCTACTACCTCTCTCAAGACAAGAGTAGTTAATGTAGCAAAATCTGGTTTTGCAA
AAGACCT?AAACCCTTTCTATAGAGGTTCAAATCCTCTCATTAACTTTGAACCTAATC
CAACTCATTCTTCCCCTTTTATATATTGCCCCGATCCTTCTTGCAGTTGCCTTCCTCAC
CCTTATTGAACGCAAAGTGCTTGGCTATATACAACATCGCAAAGGCCCCAACGTAGT
CGGCCCCACAGGCCTTCTTCAACCAATCGCTGATGGAGTAAAACTCTTCATTAAAGA
ACCCATCCGACCATCAAATTCATCTC
D4
TTCGTTTGTTCAACGATTAAAACCCTACGTGATCTGAGTTCAGACCGGAGCAATCCA
GGTCAGTTTCTATCTATAACAGCGCTTTCTCTAGTACGAAAGGACCGAAAAAGCATG
GTCCATGTATTATACAAACCATACCTGATTATTTATGACTTAGTCTCAATAAACACTC
AACCTATTATTTCCCTCAAGACAAGAGCAGTTAATGTAGCAAAATCTGGTTTTGCAA
AAGACCT?AAACCCTTTCTATAGAGGTTCAAATCCTCTCATTAACTTTGAACCTAGTC
CAACTTATTCTCCCCCTTTTATATATTGCTCCGATCCTTCTTGCAGTTGCCTTCCTCAC
CCTTATTGAACGCAAAGTGCTTGGTTATATACAACACCGCAAAGGCCCCAACGTAGT
CGGCCCCACAGGCCTCCTTCAGCCAATCGCTGATGGGGTAAAACTTTTCATTAAAGA
ACCCATCCGACCATCAAATTCATCTC

142
DE1
TTCGTTTGTTCAACGATTAAAACCCTACGTGATCTGAGTTCAGACCGGAGCAATCCA
GGTCAGTTTCTATCTATAACAGCGCTTTCTCTAGTACGAAAGGACCGAAAAAGCATG
GTCCATGTATTATACAAACCATACCTGATTATTTATGACTTAGTCTCAATAAACACTC
AACCTATTATTTCCCTCAAGACAAGAGTAGTTAATGTAGCAAAATCTGGTTTTGCAA
AAGACCT?AAACCCTTTCTATAGAGGTTCAAATCCTCTCATTAACTTTGAACCTAGTC
CAACTTATTCTCCCCCTTTTATATATTGCTCCGATCCTTCTTGCAGTTGCCTTCCTCAC
CCTTATTGAACGCAAAGTGCTTGGTTATATACAACACCGCAAAGGCCCCAACGTAGT
CGGCCCCACAGGCCTCCTTCAGCCAATCGCTGATGGGGTAAAACTTTTCATTAAAGA
ACCCATCCGACCATCAAATTCATCTC
DE2
TTCGTTTGTTCAACGATTAAAACCCTACGTGATCTGAGTTCAGACCGGAGCAATCCA
GGTCAGTTTCTATCTATAACAGCGCTTTCTCTAGTACGAAAGGACCGAAAAAGCATG
GTCCATGTATTATACAAACCATACCTGATTATTTATGACTTAGTCTCAATAAACACTC
AACCTATTATTTCCCTCAAGACAAGAGTAGTTAATGTAGCAAAATCTGGTTTTGCAA
AAGACCT?AAACCCTTTCTATAGAGGTTCAAATCCTCTCATTAACTTTGAACCTAGTC
CAACTTATTCTCCCCCTTTTATATATTGCTCCGATCCTTCTTGCAGTTGCCTTCCTCAC
CCTTATTGAACGCAAAGTGCTTGGTTATATACAACACCGCAAAGGCCCCAACGTAGT
CGGCCCCACAGGCCTCCTTCAGCCAATCGCTGATGGGGTAAAACTTTTCATTAAAGA
ACCCATCCGACCATCAAATTCATCTC
DE3
TTCGTTTGTTCAACGATTAAAACCCTACGTGATCTGAGTTCAGACCGGAGCAATCCA
GGTCAGTTTCTATCTATAACAGCGCTTTCTCTAGTACGAAAGGACCGAAAAAGCATG
GTCCATGTATTATACAAACCATACCTGATTATTTATGACTTAGTCTCAATAAACACTC

143
AACCTATTATTTCCCTCAAGACAAGAGTAGTTAATGTAGCAAAATCTGGTTTTGCAA
AAGACCT?AAACCCTTTCTATAGAGGTTCAAATCCTCTCATTAACTTTGAACCTAGTC
CAACTTATTCTCCCCCTTTTATATATTGCTCCGATCCTTCTTGCAGTTGCCTTCCTCAC
CCTTATTGAACGCAAAGTGCTTGGTTATATACAACACCGCAAAGGCCCCAACGTAGT
CGGCCCCACAGGCCTCCTTCAGCCAATCGCTGATGGGGTAAAACTTTTCATTAAAGA
ACCCATCCGACCATCAAATTCATCTC
DE4
TTCGTTTGTTCAACGATTAAAACCCTACGTGATCTGAGTTCAGACCGGAGCAATCCA
GGTCAGTTTCTATCTATAACAGCGCTTTCTCTAGTACGAAAGGACCGAAAAAGCATG
GTCCATGTATTATACAAACCATACCTGATTATTTATGACTTAGTCTCAATAAACACTC
AACCTATTATTTCCCTCAAGACAAGAGTAGTTAATGTAGCAAAATCTGGTTTTGCAA
AAGACCT?AAACCCTTTCTATAGAGGTTCAAATCCTCTCATTAACTTTGAACCTAGTC
CAACTTATTCTCCCCCTTTTATATATTGCTCCGATCCTTCTTGCAGTTGCCTTCCTCAC
CCTTATTGAACGCAAAGTGCTTGGTTATATACAACACCGCAAAGGCCCCAACGTAGT
CGGCCCCACAGGCCTCCTTCAGCCAATCGCTGATGGGGTAAAACTTTTCATTAAAGA
ACCCATCCGACCATCAAATTCATCTC
DE7
TTCGTTTGTTCAACGATTAAAACCCTACGTGATCTGAGTTCAGACCGGAGCAATCCA
GGTCAGTTTCTATCTATAACAGCGCTTTCTCTAGTACGAAAGGACCGAAAAAGCATG
GTCCATGTATTATACAAACCATACCTGATTATTTATGACTTAGTCTCAATAAACACTC
AACCTATTATTTCCCTCAAGACAAGAGTAGTTAATGTAGCAAAATCTGGTTTTGCAA
AAGACCT?AAACCCTTTCTATAGAGGTTCAAATCCTCTCATTAACTTTGAACCTAGTC
CAACTTATTCTCCCCCTTTTATATATTGCTCCGATCCTTCTTGCAGTTGCCTTCCTCAC
CCTTATTGAACGCAAAGTGCTTGGTTATATACAACACCGCAAAGGCCCCAACGTAGT

144
CGGCCCCACAGGCCTCCTTCAGCCAATCGCTGATGGGGTAAAACTTTTCATTAAAGA
ACCCATCCGACCATCAAATTCATCTC
DE8
TTCGTTTGTTCAACGATTAAAACCCTACGTGATCTGAGTTCAGACCGGAGCAATCCA
GGTCAGTTTCTATCTATAACAGCGCTTTCTCTAGTACGAAAGGACCGAAAAAGCATG
GTCCATGTATTATACAAACCATACCTGATTATTTATGACTTAGTCTCAATAAACACTC
AACCTATTATTTCCCTCAAGACAAGAGTAGTTAATGTAGCAAAATCTGGTTTTGCAA
AAGACCT?AAACCCTTTCTATAGAGGTTCAAATCCTCTCATTAACTTTGAACCTAGTC
CAACTTATTCTCCCCCTTTTATATATTGCTCCGATCCTTCTTGCAGTTGCCTTCCTCAC
CCTTATTGAACGCAAAGTGCTTGGTTATATACAACACCGCAAAGGCCCCAACGTAGT
CGGCCCCACAGGCCTCCTTCAGCCAATCGCTGATGGGGTAAAACTTTTCATTAAAGA
ACCCATCCGACCATCAAATTCATCTC
DE9
TTCGTTTGTTCAACGATTAAAACCCTACGTGATCTGAGTTCAGACCGGAGCAATCCA
GGTCAGTTTCTATCTATAACAGCGCTTTCTCTAGTACGAAAGGACCGAAAAAGCATG
GTCCATGTATTATACAAACCATACCTGATTATTTATGACTTAGTCTCAATAAACACTC
AACCTATTATTTCCCTCAAGACAAGAGTAGTTAATGTAGCAAAATCTGGTTTTGCAA
AAGACCT?AAACCCTTTCTATAGAGGTTCAAATCCTCTCATTAACTTTGAACCTAGTC
CAACTTATTCTCCCCCTTTTATATATTGCTCCGATCCTTCTTGCAGTTGCCTTCCTCAC
CCTTATTGAACGCAAAGTGCTTGGTTATATACAACACCGCAAAGGCCCCAACGTAGT
CGGCCCCACAGGCCTCCTTCAGCCAATCGCTGATGGGGTAAAACTTTTCATTAAAGA
ACCCATCCGACCATCAAATTCATCTC
DE10
TTCGTTTGTTCAACGATTAAAACCCTACGTGATCTGAGTTCAGACCGGAGCAATCCA

145
GGTCAGTTTCTATCTATAACAGCGCTTTCTCTAGTACGAAAGGACCGAAAAAGCATG
GTCCATGTATTATACAAACCATACCTGATTATTTATGACTTAGTCTCAATAAACACTC
AACCTATTATTTCCCTCAAGACAAGAGTAGTTAATGTAGCAAAATCTGGTTTTGCAA
AAGACCT?AAACCCTTTCTATAGAGGTTCAAATCCTCTCATTAACTTTGAACCTAGTC
CAACTTATTCTCCCCCTTTTATATATTGCTCCGATCCTTCTTGCAGTTGCCTTCCTCAC
CCTTATTGAACGCAAAGTGCTTGGTTATATACAACACCGCAAAGGCCCCAACGTAGT
CGGCCCCACAGGCCTCCTTCAGCCAATCGCTGATGGGGTAAAACTTTTCATTAAAGA
ACCCATCCGACCATCAAATTCATCTC
DE11
TTCGTTTGTTCAACGATTAAAACCCTACGTGATCTGAGTTCAGACCGGAGCAATCCA
GGTCAGTTTCTATCTATAACAGCGCTTTCTCTAGTACGAAAGGACCGAAAAAGCATG
GTCCATGTATTATACAAACCATACCTGATTATTTATGACTTAGTCTCAATAAACACTC
AACCTATTATTTCCCTCAAGACAAGAGTAGTTAATGTAGCAAAATCTGGTTTTGCAA
AAGACCT?AAACCCTTTCTATAGAGGTTCAAATCCTCTCATTAACTTTGAACCTAGTC
CAACTTATTCTCCCCCTTTTATATATTGCTCCGATCCTTCTTGCAGTTGCCTTCCTCAC
CCTTATTGAACGCAAAGTGCTTGGTTATATACAACACCGCAAAGGCCCCAACGTAGT
CGGCCCCACAGGCCTCCTTCAGCCAATCGCTGATGGGGTAAAACTTTTCATTAAAGA
ACCCATCCGACCATCAAATTCATCTC
DE12
TTCGTTTGTTCAACGATTAAAACCCTACGTGATCTGAGTTCAGACCGGAGCAATCCA
GGTCAGTTTCTATCTATAACAGCGCTTTCTCTAGTACGAAAGGACCGAAAAAGCATG
GTCCATGTATTATACAAACCATACCTGATTATTTATGACTTAGTCTCAATAAACACTC
AACCTATTATTTCCCTCAAGACAAGAGTAGTTAATGTAGCAAAATCTGGTTTTGCAA
AAGACCT?AAACCCTTTCTATAGAGGTTCAAATCCTCTCATTAACTTTGAACCTAGTC

146
CAACTTATTCTCCCCCTTTTATATATTGCTCCGATCCTTCTTGCAGTTGCCTTCCTCAC
CCTTATTGAACGCAAAGTGCTTGGTTATATACAACACCGCAAAGGCCCCAACGTAGT
CGGCCCCACAGGCCTCCTTCAGCCAATCGCTGATGGGGTAAAACTTTTCATTAAAGA
ACCCATCCGACCATCAAATTCATCTC
DE13
TTCGTTTGTTCAACGATTAAAACCCTACGTGATCTGAGTTCAGACCGGAGCAATCCA
GGTCAGTTTCTATCTATAACAGCGCTTTCTCTAGTACGAAAGGACCGAAAAAGCATG
GTCCATGTATTATACAAACCATACCTGATTATTTATGACTTAGTCTCAATAAACACTC
AACCTATTATTTCCCTCAAGACAAGAGTAGTTAATGTAGCAAAATCTGGTTTTGCAA
AAGACCT?AAACCCTTTCTATAGAGGTTCAAATCCTCTCATTAACTTTGAACCTAGTC
CAACTTATTCTCCCCCTTTTATATATTGCTCCGATCCTTCTTGCAGTTGCCTTCCTCAC
CCTTATTGAACGCAAAGTGCTTGGTTATATACAACACCGCAAAGGCCCCAACGTAGT
CGGCCCCACAGGCCTCCTTCAGCCAATCGCTGATGGGGTAAAACTTTTCATTAAAGA
ACCCATCCGACCATCAAATTCATCTC
D2
TTCGTTTGTTCAACGATTAAAACCCTACGTGATCTGAGTTCAGACCGGAGCAATCCA
GGTCAGTTTCTATCTATAACAGCGCTTTCTCTAGTACGAAAGGACCGAAAAAGCATG
GTCCATGTATTATACAAACCATACCTGATTATTTATGACTTAGTCTCAATAAACACTC
AACCTATTATTTCCCTCAAGACAAGAGTAGTTAATGTAGCAAAATCTGGTTTTGCAA
AAGACCT?AAACCCTTTCTATAGAGGTTCAAATCCTCTCATTAACTTTGAACCTAGTC
CAACTTATTCTCCCCCTTTTATATATTGCTCCGATCCTTCTTGCAGTTGCCTTCCTCAC
CCTTATTGAACGCAAAGTGCTTGGTTATATACAACACCGCAAAGGCCCCAACGTAGT
CGGCCCCACAGGCCTCCTTCAGCCAATCGCTGATGGGGTAAAACTTTTCATTAAAGA
ACCCATCCGACCATCAAATTCATCTC

147
D3
TTCGTTTGTTCAACGATTAAAACCCTACGTGATCTGAGTTCAGACCGGAGCAATCCA
GGTCAGTTTCTATCTATAACAGCGCTTTCTCTAGTACGAAAGGACCGAAAAAGCATG
GTCCATGTATTATACAAACCATACCTGATTATTTATGACTTAGTCTCAATAAACACTC
AACCTATTATTTCCCTCAAGACAAGAGTAGTTAATGTAGCAAAATCTGGTTTTGCAA
AAGACCT?AAACCCTTTCTATAGAGGTTCAAATCCTCTCATTAACTTTGAACCTAGTC
CAACTTATTCTCCCCCTTTTATATATTGCTCCGATCCTTCTTGCAGTTGCCTTCCTCAC
CCTTATTGAACGCAAAGTGCTTGGTTATATACAACACCGCAAAGGCCCCAACGTAGT
CGGCCCCACAGGCCTCCTTCAGCCAATCGCTGATGGGGTAAAACTTTTCATTAAAGA
ACCCATCCGACCATCAAATTCATCTC
D6
TTCGTTTGTTCAACGATTAAAACCCTACGTGATCTGAGTTCAGACCGGAGCAATCCA
GGTCAGTTTCTATCTATAACAGCGCTTTCTCTAGTACGAAAGGACCGAAAAAGCATG
GTCCATGTATTATACAAACCATACCTGATTATTTATGACTTAGTCTCAATAAACACTC
AACCTATTATTTCCCTCAAGACAAGAGTAGTTAATGTAGCAAAATCTGGTTTTGCAA
AAGACCT?AAACCCTTTCTATAGAGGTTCAAATCCTCTCATTAACTTTGAACCTAGTC
CAACTTATTCTCCCCCTTTTATATATTGCTCCGATCCTTCTTGCAGTTGCCTTCCTCAC
CCTTATTGAACGCAAAGTGCTTGGTTATATACAACACCGCAAAGGCCCCAACGTAGT
CGGCCCCACAGGCCTCCTTCAGCCAATCGCTGATGGGGTAAAACTTTTCATTAAAGA
ACCCATCCGACCATCAAATTCATCTC
D7
TTCGTTTGTTCAACGATTAAAACCCTACGTGATCTGAGTTCAGACCGGAGCAATCCA
GGTCAGTTTCTATCTATAACAGCGCTTTCTCTAGTACGAAAGGACCGAAAAAGCATG
GTCCATGTATTATACAAACCATACCTGATTATTTATGACTTAGTCTCAATAAACACTC

148
AACCTATTATTTCCCTCAAGACAAGAGTAGTTAATGTAGCAAAATCTGGTTTTGCAA
AAGACCT?AAACCCTTTCTATAGAGGTTCAAATCCTCTCATTAACTTTGAACCTAGTC
CAACTTATTCTCCCCCTTTTATATATTGCTCCGATCCTTCTTGCAGTTGCCTTCCTCAC
CCTTATTGAACGCAAAGTGCTTGGTTATATACAACACCGCAAAGGCCCCAACGTAGT
CGGCCCCACAGGCCTCCTTCAGCCAATCGCTGATGGGGTAAAACTTTTCATTAAAGA
ACCCATCCGACCATCAAATTCATCTC
NJ1
TTCGTTTGTTCAACGATTAAAACCCTACGTGATCTGAGTTCAGACCGGAGCAATCCA
GGTCAGTTTCTATCTATAACAGCGCTTTCTCTAGTACGAAAGGACCGAAAAAGCATG
GTCCATGTATTATACAAACCATACCTGATTATTTATGACTTAGTCTCAATAAACACTC
AACCTATTATTTCCCTCAAGACAAGAGTAGTTAATGTAGCAAAATCTGGTTTTGCAA
AAGACCT?AAACCCTTTCTATAGAGGTTCAAATCCTCTCATTAACTTTGAACCTAGTC
CAACTTATTCTCCCCCTTTTATATATTGCTCCGATCCTTCTTGCAGTTGCCTTCCTCAC
CCTTATTGAACGCAAAGTGCTTGGTTATATACAACACCGCAAAGGCCCCAACGTAGT
CGGCCCCACAGGCCTCCTTCAGCCAATCGCTGATGGGGTAAAACTTTTCATTAAAGA
ACCCATCCGACCATCAAATTCATCTC
NJ2
TTCGTTTGTTCAACGATTAAAACCCTACGTGATCTGAGTTCAGACCGGAGCAATCCA
GGTCAGTTTCTATCTATAACAGCGCTTTCTCTAGTACGAAAGGACCGAAAAAGCATG
GTCCATGTATTATACAAACCATACCTGATTATTTATGACTTAGTCTCAATAAACACTC
AACCTATTATTTCCCTCAAGACAAGAGTAGTTAATGTAGCAAAATCTGGTTTTGCAA
AAGACCT?AAACCCTTTCTATAGAGGTTCAAATCCTCTCATTAACTTTGAACCTAGTC
CAACTTATTCTCCCCCTTTTATATATTGCTCCGATCCTTCTTGCAGTTGCCTTCCTCAC
CCTTATTGAACGCAAAGTGCTTGGTTATATACAACACCGCAAAGGCCCCAACGTAGT

149
CGGCCCCACAGGCCTCCTTCAGCCAATCGCTGATGGGGTAAAACTTTTCATTAAAGA
ACCCATCCGACCATCAAATTCATCTC
NJ3
TTCGTTTGTTCAACGATTAAAACCCTACGTGATCTGAGTTCAGACCGGAGCAATCCA
GGTCAGTTTCTATCTATAACAGCGCTTTCTCTAGTACGAAAGGACCGAAAAAGCATG
GTCCATGTATTATACAAACCATACCTGATTATTTATGACTTAGTCTCAATAAACACTC
AACCTATTATTTCCCTCAAGACAAGAGTAGTTAATGTAGCAAAATCTGGTTTTGCAA
AAGACCT?AAACCCTTTCTATAGAGGTTCAAATCCTCTCATTAACTTTGAACCTAGTC
CAACTTATTCTCCCCCTTTTATATATTGCTCCGATCCTTCTTGCAGTTGCCTTCCTCAC
CCTTATTGAACGCAAAGTGCTTGGTTATATACAACACCGCAAAGGCCCCAACGTAGT
CGGCCCCACAGGCCTCCTTCAGCCAATCGCTGATGGGGTAAAACTTTTCATTAAAGA
ACCCATCCGACCATCAAATTCATCTC
NJ6
TTCGTTTGTTCAACGATTAAAACCCTACGTGATCTGAGTTCAGACCGGAGCAATCCA
GGTCAGTTTCTATCTATAACAGCGCTTTCTCTAGTACGAAAGGACCGAAAAAGCATG
GTCCATGTATTATACAAACCATACCTGATTATTTATGACTTAGTCTCAATAAACACTC
AACCTATTATTTCCCTCAAGACAAGAGTAGTTAATGTAGCAAAATCTGGTTTTGCAA
AAGACCT?AAACCCTTTCTATAGAGGTTCAAATCCTCTCATTAACTTTGAACCTAGTC
CAACTTATTCTCCCCCTTTTATATATTGCTCCGATCCTTCTTGCAGTTGCCTTCCTCAC
CCTTATTGAACGCAAAGTGCTTGGTTATATACAACACCGCAAAGGCCCCAACGTAGT
CGGCCCCACAGGCCTCCTTCAGCCAATCGCTGATGGGGTAAAACTTTTCATTAAAGA
ACCCATCCGACCATCAAATTCATCTC

150
NJ7
TTCGTTTGTTCAACGATTAAAACCCTACGTGATCTGAGTTCAGACCGGAGCAATCCA
GGTCAGTTTCTATCTATAACAGCGCTTTCTCTAGTACGAAAGGACCGAAAAAGCATG
GTCCATGTATTATACAAACCATACCTGATTATTTATGACTTAGTCTCAATAAACACTC
AACCTATTATTTCCCTCAAGACAAGAGTAGTTAATGTAGCAAAATCTGGTTTTGCAA
AAGACCT?AAACCCTTTCTATAGAGGTTCAAATCCTCTCATTAACTTTGAACCTAGTC
CAACTTATTCTCCCCCTTTTATATATTGCTCCGATCCTTCTTGCAGTTGCCTTCCTCAC
CCTTATTGAACGCAAAGTGCTTGGTTATATACAACACCGCAAAGGCCCCAACGTAGT
CGGCCCCACAGGCCTCCTTCAGCCAATCGCTGATGGGGTAAAACTTTTCATTAAAGA
ACCCATCCGACCATCAAATTCATCTC
NJ9
TTCGTTTGTTCAACGATTAAAACCCTACGTGATCTGAGTTCAGACCGGAGCAATCCA
GGTCAGTTTCTATCTATAACAGCGCTTTCTCTAGTACGAAAGGACCGAAAAAGCATG
GTCCATGTATTATACAAACCATACCTGATTATTTATGACTTAGTCTCAATAAACACTC
AACCTATTATTTCCCTCAAGACAAGAGTAGTTAATGTAGCAAAATCTGGTTTTGCAA
AAGACCT?AAACCCTTTCTATAGAGGTTCAAATCCTCTCATTAACTTTGAACCTAGTC
CAACTTATTCTCCCCCTTTTATATATTGCTCCGATCCTTCTTGCAGTTGCCTTCCTCAC
CCTTATTGAACGCAAAGTGCTTGGTTATATACAACACCGCAAAGGCCCCAACGTAGT
CGGCCCCACAGGCCTCCTTCAGCCAATCGCTGATGGGGTAAAACTTTTCATTAAAGA
ACCCATCCGACCATCAAATTCATCTC
NJ10
TTCGTTTGTTCAACGATTAAAACCCTACGTGATCTGAGTTCAGACCGGAGCAATCCA
GGTCAGTTTCTATCTATAACAGCGCTTTCTCTAGTACGAAAGGACCGAAAAAGCATG
GTCCATGTATTATACAAACCATACCTGATTATTTATGACTTAGTCTCAATAAACACTC

151
AACCTATTATTTCCCTCAAGACAAGAGTAGTTAATGTAGCAAAATCTGGTTTTGCAA
AAGACCT?AAACCCTTTCTATAGAGGTTCAAATCCTCTCATTAACTTTGAACCTAGTC
CAACTTATTCTCCCCCTTTTATATATTGCTCCGATCCTTCTTGCAGTTGCCTTCCTCAC
CCTTATTGAACGCAAAGTGCTTGGTTATATACAACACCGCAAAGGCCCCAACGTAGT
CGGCCCCACAGGCCTCCTTCAGCCAATCGCTGATGGGGTAAAACTTTTCATTAAAGA
ACCCATCCGACCATCAAATTCATCTC
G2
TTCGTTTGTTCAACGATTAAAACCCTACGTGATCTGAGTTCAGACCGGAGCAATCCA
GGTCAGTTTCTATCTATAACAGCGCTTTCTCTAGTACGAAAGGACCGAAAAAGCATG
GTCCATGTATTATACAAACCATACCTGATTATTTATGACTTAGTCTCAATAAACACTC
AACCTATTATTTCCCTCAAGACAAGAGTAGTTAATGTAGCAAAATCTGGTTTTGCAA
AAGACCT?AAACCCTTTCTATAGAGGTTCAAATCCTCTCATTAACTTTGAACCTAGTC
CAACTTATTCTCCCCCTTTTATATATTGCTCCGATCCTTCTTGCAGTTGCCTTCCTCAC
CCTTATTGAACGCAAAGTGCTTGGTTATATACAACACCGCAAAGGCCCCAACGTAGT
CGGCCCCACAGGCCTCCTTCAGCCAATCGCTGATGGGGTAAAACTTTTCATTAAAGA
ACCCATCCGACCATCAAATTCATCTC
G3
TTCGTTTGTTCAACGATTAAAACCCTACGTGATCTGAGTTCAGACCGGAGCAATCCA
GGTCAGTTTCTATCTATAACAGCGCTTTCTCTAGTACGAAAGGACCGAAAAAGCATG
GTCCATGTATTATACAAACCATACCTGATTATTTATGACTTAGTCTCAATAAACACTC
AACCTATTATTTCCCTCAAGACAAGAGTAGTTAATGTAGCAAAATCTGGTTTTGCAA
AAGACCT?AAACCCTTTCTATAGAGGTTCAAATCCTCTCATTAACTTTGAACCTAGTC
CAACTTATTCTCCCCCTTTTATATATTGCTCCGATCCTTCTTGCAGTTGCCTTCCTCAC
CCTTATTGAACGCAAAGTGCTTGGTTATATACAACACCGCAAAGGCCCCAACGTAGT

152
CGGCCCCACAGGCCTCCTTCAGCCAATCGCTGATGGGGTAAAACTTTTCATTAAAGA
ACCCATCCGACCATCAAATTCATCTC
G4
TTCGTTTGTTCAACGATTAAAACCCTACGTGATCTGAGTTCAGACCGGAGCAATCCA
GGTCAGTTTCTATCTATAACAGCGCTTTCTCTAGTACGAAAGGACCGAAAAAGCATG
GTCCATGTATTATACAAACCATACCTGATTATTTATGACTTAGTCTCAATAAACACTC
AACCTATTATTTCCCTCAAGACAAGAGTAGTTAATGTAGCAAAATCTGGTTTTGCAA
AAGACCT?AAACCCTTTCTATAGAGGTTCAAATCCTCTCATTAACTTTGAACCTAGTC
CAACTTATTCTCCCCCTTTTATATATTGCTCCGATCCTTCTTGCAGTTGCCTTCCTCAC
CCTTATTGAACGCAAAGTGCTTGGTTATATACAACACCGCAAAGGCCCCAACGTAGT
CGGCCCCACAGGCCTCCTTCAGCCAATCGCTGATGGGGTAAAACTTTTCATTAAAGA
ACCCATCCGACCATCAAATTCATCTC
G7
TTCGTTTGTTCAACGATTAAAACCCTACGTGATCTGAGTTCAGACCGGAGCAATCCA
GGTCAGTTTCTATCTATAACAGCGCTTTCTCTAGTACGAAAGGACCGAAAAAGCATG
GTCCATGTATTATACAAACCATACCTGATTATTTATGACTTAGTCTCAATAAACACTC
AACCTATTATTTCCCTCAAGACAAGAGTAGTTAATGTAGCAAAATCTGGTTTTGCAA
AAGACCT?AAACCCTTTCTATAGAGGTTCAAATCCTCTCATTAACTTTGAACCTAGTC
CAACTTATTCTCCCCCTTTTATATATTGCTCCGATCCTTCTTGCAGTTGCCTTCCTCAC
CCTTATTGAACGCAAAGTGCTTGGTTATATACAACACCGCAAAGGCCCCAACGTAGT
CGGCCCCACAGGCCTCCTTCAGCCAATCGCTGATGGGGTAAAACTTTTCATTAAAGA
ACCCATCCGACCATCAAATTCATCTC

153
DE6
TTCGTTTGTTCAACGATTAAAACCCTACGTGATCTGAGTTCAGACCGGAGCAATCCA
GGTCAGTTTCTATCTATAACAGCGCTTTCTCTAGTACGAAAGGACCGAAAAAGCATG
GTCCATGTATTATACAAACCATACCTGATTATTTATGACTTAGTCTCAATAAACACTC
AACCTATTATTTCCCTCAAGACAAGAGTAGTTAATGTAGCAAAATCTGGTTTTGCAA
AAGACCTAAAACCCTTTCTATAGAGGTTCAAATCCTCTCATTAACTTTGAACCTAGTC
CAACTTATTCTCCCCCTTTTATATATTGCTCCGATCCTTCTTGCAGTTGCCTTCCTCAC
CCTTATTGAACGCAAAGTGCTTGGTTATATACAACACCGCAAAGGCCCCAACGTAGT
CGGCCCCACAGGCCTCCTTCAGCCAATCGCTGATGGGGTAAAACTTTTCATTAAAGA
ACCCATCCGACCATCAAATTCATCTC

154
APPENDIX B
Malaclemys terrapin Dloop Sequences
H14R
AT?????ACACTCTCA?GTGTCTCCAGAATGA??AAATCCTCTTGGTTTACAAGACCTCTG
TATGCTGAAAAATAATTAT?TTAACTCTATGTTCTTAAACCATTCCATTTATAATACCT
GTGTGATAGTCACATTGAATAAATATGTTATGTAAAACCAATAAAATGTATGTCAAT
AATCAAATTAACCACTAATATTACTGGAGATATGCTAACGGAAAATAAATGAATGTA
CAATATTACATGG??????AGGGTATAACG?GAAACTATTCTACCGGGC?CTGGTAGAGA
?AAAATGGGCAAATGTTTGGCGTTAGATGCCGTGGTGTTTACTACCTGTGTCAAAAG?
??????????
H11R
AA?????ACAATCGCG?GTGTCTCCAGAATGA??AAATCCTCTTGGTTTACAAGACCAGT
GTAAA?TGTAGAATAACTAT?TTAAGTTTATGTCCTTAAACCATTACATTAACGATAC
CCCTTTAATATTCATGTTGAAATAAT?TCTTATGTAAAACTAAT?GATTTCATGTAAAT
?GTGAAATTAAACAATAACATTGTTAAAGATATGCTAACGGAAAATAAATGAATGCA
CGATAATACATAG??????AGAGTATTATATGGATATTTTCTACCGAGCAACGGTAGAT
G?AAAATGGGCTTGTATTTAGCGTT?TATG?CCCGATA??AACCCTTTGGGGGGGAGGG
GGGGG?????
H1R
AT?????TCACTCTCA?GTGTCTCCAGAATGA??AAATCCTCTTGGTTTACAAGACCAGT
GTAAT?TGCAAAACCACTGT?ATAAGTTTATGTCCTTAAACCATTACATTAACAATAC
CTATATAATATTCATGTTGAAATAAT?TCTTATGTAAAACTAAT?GATTTCATGTAAAT
?GTCAAATTAAACAATAACATTGTTAAAGATATGCTAACGGAAAATAAATGAATGCA
CGATAATACATAG??????AGAGTATTATATGGATATTTTCTACCGAGCAACGGTAGAT

155
G?AAAATGGGCTTGTATTTAGCGTT?TATG?CCCGATA??AACCCTTTGGGGGGGAGGG
GGG???????
H24R
AT?????TCACTCTCA?GTGTCTCCAAAATGA??AAATCCTCTTGGTTTACAAGACCAGT
GTAAG?TGTAAAATAACTAT?TTAAGTTTATGTCCTTAAACCATTACATTAACTATACC
TATATAATATTCATGTTGAAATAAT?TCTTATGTAAAACTAAT?GATTTCATGTAAAT?
GTCAAATTAAACAATAACATTGTTAAAGATATGCTAACGGAAAATAAATGAATGCAC
GATAATACATAG??????AGAGTATTATATGGATATTTTCTACCGAGCAACGGTAGATG?
AAAATGGGCTTGTATTTAGCGTT?TATG?CCCGATA??AACCCTTTGGGGGGGAGGGG
GG???????
H8R
AT?????TCACTCTCA?GTGTCTCCAGAATGA??AAATCCTCTTGGTTTACAAGACCAGT
GTAAA?TGTAGAATAACTAT?TTAAGTTTATGTCCTTAAACCATTACATTAACAATAC
CTATATAATATTCATGTTGAAATAAT?TCTTATGTAAAACTAAT?GATTTCATGTAAAT
?GTCAAATTAAACAAAAACATTGTTAAAGATATGCTAACGGAAAATAAATGAATGCA
CGATAATACATAG??????AGAGTATTATATGGATATTTTCTACCGAGCAACGGTAGAT
G?AAAATGGGCTTGTATTTAGCGTT?TATG?CCCGATA??AACCCTTTGGGGGGGAGGG
GGG???????
H12R
AT?????TCACTCTCA?GTGTCTCCAGAATGA??AAATCCTCTTGGTTTACAAGACCAGT
GTAAG?TGTAGAATAACTAT?TTAAGTTTATGTCCTTAAACCATTACATTAACAATAC
CTATATAATATTCATGTTGAAATAAT?TCTTATGTAAAACTAAT?GATTTCATGTAAAT
?GTCAAATTAAACAATAACATTGTTAAAGATATGCTAACGGAAAATAAATGAATGCA
CGATAATACATAG??????AGAGTATTATATGGATATTTTCTACCGAGCAACGGTAGAT

156
G?AAAATGGGCTTGTATTTAGCGTT?TATG?CCCGATA??AACCCTTTGGGGGGGAGGG
GGGGG?????
ML8BR
AT?????TCACTCTCA?GTGTCTCCAGAATGA??AAATCCTCTTGGTTTACAAGACCAGT
GTATGCTGAACATAACTTAT?TTAACTCTATGTTCTTAAACCATTCCATTTATAATACC
TGTGTGATAGTCACATTGAATAAATATGTTATGTAAAACCAATAAAATGTATGTCAA
TAATCAAATTAAGCAGTAATATTACTGGAGATATGCTAACGGAAAATAAATGAATGT
ACAATAGTACATGG??????AGGGTATAACG?GAAACTATTCTACCGGGC?CTGGTAGA
GA?AAAATGGGCAAATGTTTGGCGTTAAATGCCGTGGTGTTTACTACCTGTGTCAAA
AG???????????
MWDR
CT?????TATTTCTCG?CGATGACGTAAATTAATAAATAACCAGGTACCGCGGCAATAG
TGTAGG?TGTAGAATAACTAT?TTAAGTTTATGTCCTTAAACCATTACATTAACAATAC
CTATATAATATTCATGTTGAAATAAT?TCTTATGTAAAACTAAT?GATTTCATGTAAAT
?GTCAAATTAAACAATAACATTGTTAAAGATATGCTAACGGAAAATAAATGAATGCA
CGATAATACATAG??????AGAGTGTTATGTGGATATTTTCTACCGAGCAACGGTAGAT
G?AAAATGGGCTTGTATTTAGCGTT?TATG?CCCGATA??AACCCTTTGGGGGGGAGGG
GGG???????
MWAR
AA?????AAAATCTCGTGATTAGGTAGAATAA?TAAATAACCAGGTACCGCAGCAATAG
TCAAGG?TGTAGAATAACTAT?TTAAGTTTATGTCCTTAAACCATTACATTAACAATA
CCTATATAATATTCATGTTGAAATAAT?TCTTATGTAAAACTAAT?GATTTCATGTAAA
T?GTCAAATTAAACAATAACATTGTTAAAGATATGCTAACGGAAAATAAATGAATGC
ACGATAATACATAG??????AGAGTGTTATGTGGATATTTTCTACCGAGCAATGGTAGA

157
TG?AAAATGGGCTTGTATTTAGCGTT?TATG?CCCGATA??AACCCTTTGGGGGGGAGG
GGGG???????
MWJ5
????????????CTCGTGATTAGGTAGATTAA?TAAATAACCAGGTACAGCGGCGATAGTC
ATGG?TGTAGAATAACTAT?TTAAGTTTATGTCCTTAAACCATTACATTAACAATACCT
ATATAATATTCATGTTGAAATAAT?TCTTATGTAAAACTAAT?GATTTCATGTAAAT?G
TCAAATTAAACAATAACATTGTTAAAGATATGCTAACGGAAAATAAATGAATGCACG
ATAATACATAG??????AGAGTATTATATGGATATTTTCTACCGAGCAACGGTAGATG?A
AAATGGGCTTGTATTTAGCGTT?TATG?CCCGATA??AACCCTTTGGGGGGGAGGGGG
GGGTACCT
MWFR
AA????AAAACTCGTG?AT?TAGGTAGATTAA?TAAATAACCAGGTACTGCGGCGATAG
TCATGG?TGTAGAATAACTAT?TTAAGTTTATGTCCTTAAACCATTACATTAACAATAC
CTATATAATATTCATGTTGAAATAAT?TCTTATGTAAAACTAAT?GATTTCATGTAAAT
?GTCAAATTAAACAATAACATTGTTAAAGATATGCTAACGGAAAATAAATGAATGCA
CGATAATACATAG??????AGAGTGTTATGTGGATATTTTCTACCGAGCAACGGTAGAT
G?AAAATGGGCTTGTATTTAGCGTT?TATG?CCCGATA??AACCCTTTGGGGGGGAGGG
GGGG??????
MWMR
AA?????ACAAGCTCGTGATTAGGTAGATTAA?TAAATAACCAGGTACCGCGGCGATAG
TCAAGG?TGTAGAATAACTAT?TTAAGTTTATGTCCTTAAACCATTACATTAACAATA
CCTATATAATATTCATGTTGAAATAAT?TCTTATGTAAAACTAAT?GATTTCATGTAAA
T?GTCAAATTAAACAATAACATTGTTAAAGATATGCTAACGGAAAATAAATGAATGC
ACGATAATACATAG??????AGAGTGTTATGTGGATATTTTCTACCGAGCAACGGTAGA

158
TG?AAAATGGGCTTGTATTTAGCGTT?TATG?CCCGATA??AACCCTTTGGGGGGGAGG
GGGG???????
ML7AR
TT?????TTACTCTCA?ATGTCTCCAAAATGA??AAATCCTCTTGGTTTACAAGACCAGTG
TAGG?TGTAGAATAACTAT?TTAAGTTTATGTCCTTAAACCATTACATTAACAATACCT
ATATAATATTCATGTTGAAATAAT?TCTTATGTAAAACTAAT?GATTTCATGTAAAT?G
TCAAATTAAACAATAACATTGTTAAAGATATGCTAACGGAAAATAAATGAATGCACG
ATAATACATAG??????AGAGTGTTATGTGGATATTTTCTACCGAGCAACGGTAGATG?A
AAATGGGCTTGTATTTAGCGTT?TATG?CCCGATA??AACCCTTTGGGGGGGAGGGGG
GTT?????
ML7BR
TT?????TCACTCTCG?ATGTCTCCAAAATGA??AAATCCTCTTGGTTTACAAGACCAGTG
TAGG?TGTAGAATAACTAT?TTAAGTTTATGTCCTTAAACCATTACATTAACAATACCT
ATATAATATTCATGTTGAAATAAT?TCTTATGTAAAACTAAT?GATTTCATGTAAAT?G
TCAAATTAAACAATAACATTGTTAAAGATATGCTAACGGAAAATAAATGAATGCACG
ATAATACATAG??????AGAGTGTTATGTGGATATTTTCTACCGAGCAACGGTAGATG?A
AAATGGGCTTGTATTTAGCGTT?TATG?CCCGATA??AACCCTTTGGGGGGGAGGGGG
GTT?????
MWBR
AA?????TCACTCTCA?GTGTCTCCAGAATGA??AAATCCTCTTGGTTTACAAGACCAGT
GTAAG?TGTAAAATAACTAT?TTAAGTTTATGTCCTTAAACCATTACATTAGCAATAC
CTATATAATATTCAAGTTGAAATAAT?TCTTATGTAAAACTAAT?GATTTCATGTAAAT
?GTCAAATTAAACAATAACATTGTTAAAGATATGCTAACGGAAAATAAATGAATGCA
CGATAATACATAG??????AGAGTGTTATGTGGATATTTTCTACCGAGCAACGGTAGAT

159
G?AAAATGGGCTTGTATTTAGCGTT?TATG?CCCGATA??AACCCTTTGGGGGGGAGGG
GGGGG?????
MWER
AA?????TCACTCTCG?GTGTCTCCAAAATGA??AAATCCTCTTGGTTTACAAGACCAGT
GTAAG?TGTAGAATAACTAT?TTAAGTTTATGTCCTTAAACCATTACATTAGCAATAC
CTATATAATATTCAAGTTGAAATAAT?TCTTATGTAAAACTAAT?GATTTCATGTAAAT
?GTCAAATTAAACAATAACATTGTTAAAGATATGCTAACGGAAAATAAATGAATGCA
CGATAATACATAG??????AGAGTATTATATGGATATTTTCTACCGAGCAACGGTAGAT
G?AAAATGGGCTTGTATTTAGCGTT?TATG?CCCGATA??AACCCTTTGGGGGGGAGGG
GGGGG?????
ML7JR
AT?????TCACTCTCA?GTGTCTCCAAAATGA??AAATCCTCTTGGTTTACAAGACCAGT
GTAAG?TGTAGAATAACTAT?TTAAGTTTATGTCCTTAAACCATTACATTAACAATAC
CTATATAATATTCATGTTGAAATAAT?TCTTATGTAAAACTAAT?GATTTCATGTAAAT
?GTCAAATTAAACAATAACATTGTTAAAGATATGCTAACGGAAAATAAATGAATGCA
CGATAATACATAG??????AGAGTATTATATGGATATTTTCTACCGAGCAACGGTAGAT
G?AAAATGGGCTTGTATTTAGCGTT?TATG?CCCGATA??AACCCTTTGGGGGGGAGGG
GGG???????
MWLR
TA?????ACACTCGCG?GTGTCGCCAAAAAGA??AAATCCTCTTGGTTTACAAGAACAGT
GTAAG?TGTAGAATAACTAT?TTAAGTTTATGTCCTTAAACCATTACATTAACAATAC
CTATATAATATTCATGTTGAAATAAT?TCTTATGTAAAACTAAT?GATTTCATGTAAAT
?GTCAAATTAAACAATAACATTGTTAAAGATATGCTAACGGAAAATAAATGAATGCA
CGATAATACATAG??????AGAGTGTTATGTGGATATTTTCTACCGAGCAACGGTAGAT

160
G?AAAATGGGCTTGTATTTAGCGTT?TATG?CCCGATA??AACCCTTTGGGGGGGAGGG
GGGGG?????
ML5BR
AA?????TCTCTCGCG?GTGTCGCCAAAATGA??AAATCCTCTTGGTTTACGGCACCAGT
GTAAG?TGTAGAATAATTAT?TTAAGTTTATGTCCTTAAACCATTACATTAACAATACC
TATATAATATTCATGTTGAAATAAT?TCTTATGTAAAACTAAT?GATTTCATGTAAAT?
GTCAAATTAAACAATAACATTGTTAAAGATATGCTAACGGAAAATAAATGAATGCAC
GATAATACATAG??????AGAGTGTTATGTGGATATTTTCTACCGAGCAACGGTAGATG?
AAAATGGGCTTGTATTTAGCGTT?TATG?CCCGATA??AACCCTTTGGGGGGGAGGGG
GG???????
ML5FR
AA?????TTTCTCGCG?ATGTCGCCAAAAAGA??AAATCCTCTTGGTTTGCGGCACCAGT
GTAGG?TGTAGAATAACTAT?TTAAGTTTATGTCCTTAAACCATTACATTAACAATAC
CTATATAATATTCATGTTGAAATAAT?TCTTATGTAAAACTAAT?GATTTCATGTAAAT
?GTCAAATTAAACAATAACATTGTTAAAGATATGCTAACGGAAAATAAATGAATGCA
CGATAATACATAG??????AGAGTGTTATGTGGATATTTTCTACCGAGCAATGGTAGAT
G?AAAATGGGCTTGTATTTAGCGTT?TATG?CCCGATA??AACCCTTTGGGGGGGAGGG
GGG???????
ML4A
AA?????TTTCTCGCG?ATGTCGCCAAATAGA??AAATCCTCTTGGTTTGCGGCAATAGT
GTAAG?TGTAGAATAACTAT?TTAAGTTTATGTCCTTAAACCATTACATTAACAATAC
CTATATAATATTCATGTTGAAATAAT?TCTTATGTAAAACTAAT?GATTTCATGTAAAT
?GTCAAATTAAACAATAACATTGTTAAAGATATGCTAACGGAAAATAAATGAATGCA
CGATAATACATAG??????AGAGTGTTATGTGGATATTTTCTACCGAGCAACGGTAGAT

161
G?AAAATGGGCTTGTATTTAGCGTT?TATG?CCCGATA??AACCCTTTGGGGGGGAGGG
GGG???????
ML6ER
AA?????TCACTCTCG?ATGTCGCCAAAAAGA??AAATCCTCTTGGTTTGCAGCACCAGT
GTAAG?TGTAGAATAACTAT?ATAAGTTTATGTCCTTAAACCATTACATTAACAATAC
CTATATAATATTCATGTTGAAATAAT?TCTTATGTAAAACTAAT?GATTTCATGTAAAT
?GTCAAATTAAACAATAACATTGTTAAAGATATGCTAACGGAAAATAAATGAATGCA
CGATAATACATAG??????AGAGTGTTATGTGGATATTTTCTACCGAGCAACGGTAGAT
G?AAAATGGGCTTGTATTTAGCGTT?TATG?CCCGATA??AACCCTTTGGGGGGGAGGG
GGG???????
ML6BR
AA?????TCACTCTCG?ATGTCGCAAAAAAGA??AAATCCTCTTGGTTTGCGGCAATAGT
GTAAG?TGTAGAATAACTAT?TTAAGTTTATGTCCTTAAACCATTACATTAACAATAC
CTATATAATATTCATGTTGAAATAAT?TCTTATGTAAAACTAAT?GATTTCATGTAAAT
?GTCAAATTAAACAATAACATTGTTAAAGATATGCTAACGGAAAATAAATGAATGCA
CGATAATACATAG??????AGAGTGTTATGTGGATATTTTCTACCGAGCAACGGTAGAT
G?AAAATGGGCTTGTATTTAGCGTT?TATG?CCCGATA??AACCCTTTGGGGGGGAGGG
GGG???????
RB61202R
AT?????TCACTCTCA?GTGTCTCCAGAATGA??AAATCCTCTTGGTTTACAAGACCAGT
GTAAG?TGTAAAATAAGTAA?TTAAGTTTATGTCCTTAAACCCTTACATTAACTATAC
CTATATAATATTCATGTTGAAATAAT?TCTTATGTAAAACTAAT?GATTTCATGTAAAT
?GTCAAATTAAACAATAACATTGTTAACGATATGCTAACGGAAAATAAATGAATGCA
CGATAATACATAC??????AGAGTATTATATGGATATTTTCTACCGAGCAACGGTGGAT

162
G?AAAATGGGCTTGTATTTATCGTT?TATG?CCCGATA??AACCCTTTGGGGGGGAGGG
GGG???????
RB61003R
AT?????ATACTCTCA?GTGTCTCCAGAATGA??AAATCCTCTTGGTTTACAAGACCAGT
GTAAG?TGTAGAATAACTAT?TTAAGTTTATGTCCTTCTACCATTACATTAGCAATACC
TATATAATATTGAAGTTGAAATAAT?TCTTATGTAAAACTAAT?GATTTCATGTAAAT?
GTCAAATTAAACAATAACATTGTTAAAGATATGCTAACGGAAAATAAATGAATGCAC
GATAATACATAG??????AGAGTATTATATGGATATTTTCTACCGAGCAACGGTAGATG?
AAAATGGGCTTGTATTTAGCGTT?TATG?CCCGATA??AACCCTTTGGGGGGGAGGGG
GG???????
RB62513R
AT?????TCACTCTCA?GTGTCTCCAGAATGA??AAATCCTCTTGGTTTACAAGACCAGT
GTAAT?TGTAAAATAACTGT?ATAAGTTTATGTCCTTATACCATTACATTAACAATACC
TATATAATATTCAAGTTGAAATAAT?TCTTATGTAAAACTAAT?GATTTCATGTAAAT?
GTCAAATTAAACAATAACATTGTTAAAGATATGCTAACGGAAAATAAATGAATGCAC
GATAATACATAG??????AGAGTATTATATGGATATTTTCTACCGAGCAACGGTAGATG?
AAAATGGGCTTGTATTTAGCGTT?TATG?CCCGATA??AACCCTTTGGGGGGGAGGGG
GGGG?????
RB61803R
AT?????TCACTCTCA?GTGTCTCCAAAATGA??AAATCCTCTTGGTTTACAAGACCAGT
GTAAG?ACTAGACTAG?TGTAATAAGTTTATGTCCTTAAACCATTACATTAACAATAC
CTATATAATATTCATGTTGAAATAAT?TCTTATGTAAAACTAAT?GATTTCATGTAAAT
?GTCAAATTAAACAATAACATTGTTAAAGATATGCTAACGGAAAATAAATGAATGCA
CGATAATACATAG??????AGAGTATTATATGGATATTTTCTACCGAGCAACGGTAGAT

163
G?AAAATGGGCTTGTATTTAGCGTT?TATG?CCCGATA??AACCCTTTGGGGGGGAGGG
GGG???????
RB4R
CT?????TCACTCTCA?GTGTCTCCAGAATGA??AAATCCTCTTGGTTTACAAGACCAGTG
TAAT?TGTAGACTAACTATAATAAGTTTATGTCCTTAAACCATTACATTAACAATACC
TATATAATATTCATGTTGAAATAAT?TCTTATGTAAAACTAAT?GATTTCATGTAAAT?
GTCAAATTAAACAATAACATTGTTAAAGATATGCTAACGGAAAATAAATGAATGCAC
GATAATACATAG??????AGAGTATTATATGGATATTTTCTACCGAGCAACGGTAGATG
AAAAATGGGCTTGTATTTAGCGTT?TATGCCCCGATA?AAACCCTTTGGGGGGGGGAG
GGGGG?????
RB10R
AT?????TCACTCTCA?GTGTCTCCAAAATGA??AAATCCTCTTGGTTTACAAGACCAGT
GTAAG?TGTAAAATAACTTA?TTAAGTTTATGTCCTTAAACCATTACATTAACAATAC
CTATATAATATTCATGTTGAAATAAT?TCTTATGTAAAACTAAT?GATTTCATGTAAAT
?GTCAAATTAAACAATAACATTGTTAAAGATATGCTAACGGAAAATAAATGAATGCA
CGATAATACATAG??????AGAGTATTATATGGATATTTTCTACCGAGCAACGGTAGAT
G?AAAATGGGCTTGTATTTAGCGTT?TATG?CCCGATA??AACCCTTTGGGGGGGAGGG
GAG???????
RB61204R
AT?????TCACTCTCA?GTGTCTCCAAAATGA??AAATCCTCTTGGTTTACAAGACCAGT
GTAAG?TGTAGACTAGCTAA?TTAAGTTTATGTCCTTAAACCATTACATTAACAATAC
CTATATAATATTCATGTTGAAATAAT?TCTTATGTAAAACTAAT?GATTTCATGTAAAT
?GTCAAATTAAACAATAACATTGTTAAAGATATGCTAACGGAAAATAAATGAATGCA
CGATAATACATAG??????AGAGTATTATATGGATATTTTCTACCGAGCAACGGTAGAT

164
G?AAAATGGGCTTGTATTTAGCGTT?TATG?CCCGATA??AACCCTTTGGGGGGGAGGG
GGG???????
RB62202R
AC?????CCACTCTCA?GTGTCTCCAGAATGA??AAATCCTCTTGGTTTACAAGACCAGT
GTAAG?TGTAGAATAACTAT?TTAAGTTTATGTCCTTAAACCATTACATTAACAATAC
CTATATAATATTCAAGTTGAAATAAT?TCTTATGTAAAACTAAT?GATTTCATGTAAAT
?GTCAAATTAAACAATAACATTGTTAAAGATATGCTAACGGAAAATAAATGAATGCA
CGATAATACATAG??????AGAGTATTATATGGATATTTTCTACCGAGCAACGGTAGAT
G?AAAATGGGCTTGTATTTAGCGTT?TATG?CCCGATA??AACCCTTTGGGGGGGAGGG
GGGGG?????
RB61023R
AA?????ACACTCTCA?GTGTCTCCAGAATGA??AAATCCTCTTGGTTTACAAGACCAGT
GTAAA?TGTAGAATAACTAT?TTAAGTTTATGTCCTTAAACCATTACATTAACAATAC
CTATATAATATTCATGTTGAAATAAT?TCTTATGTAAAACTAAT?GATTTCATGTAAAT
?GTCAAATTAAACAATAACATTGTTAAAGATATGCTAACGGAAAATAAATGAATGCA
CGATAATACATAG??????AGAGTATTATATGGATATTTTCTACCGAGCAACGGTAGAT
G?AAAATGGGCTTGTATTTAGCGTT?TATG?CCCGATA??AACCCTTTGGGGGGGAGGG
GGGGG?????
RB8R
AT?????TCACTCTCA?GTGTCTCCAGAATGA??AAATCCTCTTGGTTTACAAGACCAGT
GTAAG?TGTAAAATAACTAT?TTAAGTTTATGTCCTTAAACCATTACATTAACAATAC
CTATATAATATTCATGTTGAAATAAT?TCTTATGTAAAACTAAT?GATTTCATGTAAAT
?GTCAAATTAAACAATAACATTGTTAAAGATATGCTAACGGAAAATAAATGAATGCA
CGATAATACATAG??????AGAGTATTATATGGATATTTTCTACCGAGCAACGGTAGAT

165
G?AAAATGGGCTTGTATTTAGCGTT?TATG?CCCGATA??AACCCTTTGGGGGGGAGGG
GGG???????
RB61507R
AT?????TCACTCTCA?GTGTCTCCAAAATGA??AAATCCTCTTGGTTTACAAGACCAGT
GTAAG?TGTAAAATAACTAT?TTAAGTTTATGTCCTTAAACCATTACATTAACAATAC
CTATATAATATTCATGTTGAAATAAT?TCTTATGTAAAACTAAT?GATTTCATGTAAAT
?GTCAAATTAAACAATAACATTGTTAAAGATATGCTAACGGAAAATAAATGAATGCA
CGATAATACATAG??????AGAGTATTATATGGATATTTTCTACCGAGCAACGGTAGAT
G?AAAATGGGCTTGTATTTAGCGTT?TATG?CCCGATA??AACCCTTTGGGGGGGAGGG
GGG???????
RB61301R
TT?????TCACTCTCA?GTGTCTCCAGAATGA??AAATCCTCTTGGTTTACAAGACCAGTG
TAAG?TGTAGAATAACTAT?TTAAGTTTATGTCCTTAAACCATTACATTAACAATACCT
ATATAATATTCATGTTGAAATAAT?TCTTATGTAAAACTAAT?GATTTCATGTAAAT?G
TCAAATTAAACAATAACATTGTTAAAGATATGCTAACGGAAAATAAATGAATGCACG
ATAATACATAG??????AGAGTATTATATGGATATTTTCTACCGAGCAACGGTAGATG?A
AAATGGGCTTGTATTTAGCGTT?TATG?CCCGATA??AACCCTTTGGGGGGGAGGGGG
GGG?????
RB2R
?A?????TTACTCTCG?ATGTCGCAAAATAGA??AAATCCTCTTGGTTTGCAGCACCAGTG
TAGG?TGTAGAATAACTAT?TTAAGTTTATGTCCTTAAACCATTACATTAACAATACCT
ATATAATATTCATGTTGAAATAAT?TCTTATGTAAAACTAAT?GATTTCATGTAAAT?G
TCAAATTAAACAATAACATTGTTAAAGATATGCTAACGGAAAATAAATGAATGCACG
ATAATACGTAG??????AGAGTATTATATGGATATTTTCTACCGAGCAACGGTAGATG?A

166
AAATGGGCTTGTATTTAGCGTT?TATG?CCCGATA??AACCCTTTGGGGGGGAGGGGG
G???????
RB62509R
AA?????TCACTCTCA?ATGTCGCCAAAAAGA??AAATCCTCTTGGTTTACAGCACCAGT
GTAAG?TGTAAAATAACTGT?AAAAGTTTATGTCCTTAAACCATTACATTAACAATAC
CTATATAATATTCATGTTGAAATAAT?TCTTATGTAAAACTAAT?GATTTCATGTAAAT
?GTCAAATTAAACAATAACATTGTTAAAGATATGCTAACGGAAAATAAATGAATGCA
CGATAATACATAG??????AGAGTATTATATGGATATTTTCTACCGAGCAACGGTAGAT
G?AAAATGGGCTTGTATTTAGCGTT?TATG?CCCGATA??AACCCTTTGGGGGGGAGGG
GGG???????
JFK2R
AA?????TCTCTCTCG?GTGTCTCCAAAATGA??AAATCCTCTTGGTTTACAAGACCAGT
GTAAG?TGTAGAATAACTAT?TTAAGTTTATGTCCTTAAACCATTACATTAACAATAC
CTATATAATATTCATGTTGAAATAAT?TCTTATGTAAAACTAAT?GATTTCATGTAAAT
?GTCAAATTAAACAATAACATTGTTAAAGATATGCTAACGG?AAATAAATGAGTGCA
CGATAATACATAGACAGATAGAGTATTATATGGATATTTTCTACCGAGCAACGGTAG
ATG?AAAATGGGCTTGTATTTAGCGTT?TATG?CCCGATA??AACCCTTTGGGGGGGAG
GGGGG???????
JFK10R
AT?????TCTCTCTCG?ATGTCTCCAAAATGA??AAATCCTCTTGGTTTACAAGACCAGTG
TAAG?TGTAGAATAACTAT?TTAAGTTTATGTCCTTAAACCATTACATTAACAATACCT
ATATAATATTCATGTTGAAATAAT?TCTTATGTAAAACTAAT?GATTTCATGTAAAT?G
TCAAATTAAACAATAACATTGTTAAAGATATGCTAACGGAAAATAAATGAATGCACG
ATAATACATAG??????AGAGTATTATATGGATATTTTCTACCGAGCAACGGTAGATG?A

167
AAATGGGCTTGTATTTAGCGTT?TATG?CCCGATA??AACCCTTTGGGGGGGAGGGGG
G???????
JFK8R
AT?????TCACTCTCG?GTGTCTCCAAAATGA??AAATCCTCTTGTTTTACAAGACCAGTG
TAAG?TGTAGAATAACTAT?TTAAGTTTATGTCCTTAAACCATTACATTAACAATACCT
ATATAATATTCATGTTGAAATAAT?TCTTATGTAAAACTAAT?GATTTCATGTAAAT?G
TCAAATTAAACAATAACATTGTTAAAGATATGCTAACGGAAAATAAATGAATGCACG
ATAATACATAG??????AGAGTATTATATGGATATTTTCTACCGAGCAACGGTAGATG?A
AAATGGGCTTGTATTTAGCGTT?TATG?CCCGATA??AACCCTTTGGGGGGGAGGGGG
G???????
JFK4
ATTGATCTCTCTCTCG?GTGTCTCCAAATTGA??AAATCCTCTTGTTTTACAAGACCAG
TGTAAG?TGTAGAATAACTAT?TTAAGTTTATGTCCTTAAACCATTACATTAACAATAC
CTATATAATATTCATGTTGAAATAAT?TCTTATGTAAAACTAAT?GATTTCATGTAAAT
?GTCAAATTAAACAATAACATTGTTAAAGATATGCTAACGGAAAATAAATGAATGCA
CGATAATACATAG??????AGAGTATTATATGGATATTTTCTACCGAGCAACGGTAGAT
G?AAAATGGGCTTGTATTTAGCGTT?TATG?CCCGATA??AACCCTTTGGGGGGGAGGG
GGG???????
JFK5R
AT?????TCACTCTCG?ATGTCTCCAAATTGA??AAATCCTCTTGTTTTACAAGACCAGTG
TAAG?TGTAGAATAACTAT?TTAAGTTTATGTCCTTAAACCATTACATTAACAATACCT
ATATAATATTCATGTTGAAATAAT?TCTTATGTAAAACTAAT?GATTTCATGTAAAT?G
TCAAATTAAACAATAACATTGTTAAAGATATGCTAACGGAAAATAAATGAATGCACG
ATAATACATAG??????AGAGTATTATATGGATATTTTCTACCGAGCAACGGTAGATG?A

168
AAATGGGCTTGTATTTAGCGTT?TATG?CCCGATA??AACCCTTTGGGGGGGAGGGGG
G???????
JFK11R
AA?????ACACTCTCA?GTGTCTCCAGAATGA??AAATCCTCTTGGTTTACAAGACCAGT
GTAAA?TGTAGAATAACTAT?TTAAGTTTATGTCCTTAAACCATTACATTAACAATAC
CTATATAATATTCATGTTGAAATAAT?TCTTATGTAAAACTAAT?GATTTCATGTAAAT
?GTCAAATTAAACAATAACATTGTTAAAGATATGCTAACGGAAAATAAATGAATGCA
CGATAATACATAG??????AGAGTATTATATGGATATTTTCTACCGACCAACGGTACAT
G?AAAATGGGCTTGTATTTAGCGTT?TATG?CCCGATA??AACCCTTTGGGGGGGAGGG
GGGGG?????
JFK7R
AC?????TCACTCTCG?GTGTCTCCAGAATGA??AAATCCTCTTGGTTTACAAGACCAGT
GTAAG?TGTAGAATAACTAT?TTAAGTTTATGTCCTTAAACCATTACATTAACAATAC
CTATATAATATTCATGTTGAAATAAT?TCTTATGTAAAACTAAT?GATTTCATGTAAAT
?GTCAAATTAAACAATAACATTGTTAAAGATATGCTAACGGAAAATAAATGAATGCA
CGATAATACATAG??????AGAGTATTATATGGATATTTTCTACCGAGCAACGGTAGAT
G?AAAATGGGCTTGTATTTAGCGTT?TATG?CCCGATA??AACCCTTTGGGGGGGAGGG
GGG???????
JFK3R
AT?????TCACTCTCA?GTGTCTCCAGAATGA??AAATCCTCTTGGTTTACAAGACCAGT
GTAAA?TGTAGAATAACTAT?TTAAGTTTATGTCCTTAAACCATTACATTAACAATAC
CTATATAATATTCATGTTGAAATAAT?TCTTATGTAAAACTAAT?GATTTCATGTAAAT
?GTCAAATTAAACAATAACATTGTTAAAGATATGCTAACGGAAAATAAATGAATGCA
CAATAATACATAG??????AGAGTATTATATGGATATTTTCTACCGAGCAACGGTAGAT

169
G?AAAATGGGCTTGTATTTAACGTT?TATG?CCCGATA??AACCCTTTGGGGGGGAGGG
GGG???????
JFK9R
AT?????TCACTCTCA?GTGTCTCCAAAATGA??AAATCCTCTTGGTTTACAAGACCAGT
GTAAG?TGTAGAATAACTAT?TTAAGTTTATGTCCTTAAACCATTACATTAACAATAC
CTATATAATATTCATGTTGAAATAAT?TCTTATGTAAAACTAAT?GATTTCATGTAAAT
?GTCAAATTAAACAATAACATTGTTAAAGATATGCTAACGGAAAATAAATGAATGCA
CGATAATACATAG??????AGAGTATTATATGGATATTTTCTACCGAGCAACGGTAGAT
G?AAAATGGGCTTGTATTTAGCGTT?TATG?CCCGATA??AACCCTTTGGGGGGGAGGG
GGG???????
JFK12R
AT?????TCACTCTCA?GTGTCTCCAGAATGA??AAATCCTCTTGGTTTACAAGACCAGT
GTAAA?TGTAGAATAACTAT?TTAAGTTTATGTCCTTAAACCATTACATTAACAATAC
CTATATAATATTCATGTTGAAATAAT?TCTTATGTAAAACTAAT?GATTTCATGTAAAT
?GTCAAATTAAACAATAACATTGTTAAAGATATGCTAACGGAAAATAAATGAATGCA
CGATAATACATAG??????AGAGTATTATATGGATATTTTCTACCGAGCAACGGTAGAT
G?AAAATGGGCTTGTATTTAGCGTT?TATG?CCCGATA??AACCCTTTGGGGGGGAGGG
GGGGG?????
JFK13R
AA?????TCACTCTCA?GTGTCTCCAGAATGA??AAATCCTCTTGGTTTACAAGACCAGT
GTAAG?TGTAGAATAACTAT?TTAAGTTTATGTCCTTAAACCATTACATTAACAATAC
CTATATAATATTCATGTTGAAATAAT?TCTTATGTAAAACTAAT?GATTTCATGTAAAT
?GTCAAATTAAACAATAACATTGTTAAAGATATGCTAACGGAAAATAAATGAATGCA
CGATAATACATAG??????AGAGTATTATATGGATATTTTCTACCGAGCAACGGTAGAT

170
G?AAAATGGGCTTGTATTTAGCGTT?TATG?CCCGATA??AACCCTTTGGGGGGGAGGG
GGGGG?????

171