Embed Size (px)
Citation preview
Report of the Central Board of Directors on the working of the Reserve Bank of India
for the year ended June 30, 2015 submitted to the Central Government in terms of
Section 53(2) of the Reserve Bank of India Act, 1934
RESERVE BANK OF INDIA ANNUAL REPORT2014-15


LETTER OF TRANSMITTAL
Ref. No.SYD.720/02.16.001/2015-16 August 27, 2015
Bhadra 5, 1937 (Saka)
The Finance Secretary
Government of India
Ministry of Finance
New Delhi – 110 001
Dear Sir,
In pursuance of Section 53(2) of the Reserve Bank of India Act, 1934, I have the pleasure in
transmitting the following documents:
(i) A copy of the Annual Accounts for the year ended June 30, 2015 signed by
me, the Deputy Governors and the Chief General Manager, and certified by
the Bank's Auditors; and
(ii) Two copies of the Annual Report of the Central Board on the working of the
Bank during the year ended June 30, 2015.
Yours faithfully
Sd/-
(Raghuram G. Rajan)

CENTRAL BOARD / LOCAL BOARDS
GOVERNOR
Raghuram G. Rajan
DEPUTY GOVERNORS
Harun R. Khan
Urjit R. Patel
R. Gandhi
S.S. Mundra
DIRECTORS NOMINATED UNDER
SECTION 8 (1) (b) OF THE RBI ACT, 1934
Anil Kakodkar
Kiran S. Karnik
Nachiket M. Mor
DIRECTORS NOMINATED UNDER
SECTION 8 (1) (c) OF THE RBI ACT, 1934
Y. H. Malegam
Dipankar Gupta
G. M. Rao
Ela Bhatt
Indira Rajaraman
Y.C. Deveshwar
Damodar Acharya
DIRECTORS NOMINATED UNDER
SECTION 8 (1) (d) OF THE RBI ACT, 1934
Hasmukh Adhia
Ajay Tyagi
MEMBERS OF LOCAL BOARDS
WESTERN AREA
Kiran S. Karnik
EASTERN AREA
Nachiket M. Mor
Anila Kumari
Sharif Uz-zaman Laskar
NORTHERN AREA
Anil Kakodkar
A. Naveen Bhandary
SOUTHERN AREA
K. Selvaraj
Kiran Pandurang
PRINCIPAL OFFICERS
EXECUTIVE DIRECTORS ....................................................................... Deepak Mohanty ....................................................................... P. Vijaya Bhaskar ....................................................................... Jasbir Singh ....................................................................... Deepali Pant Joshi ....................................................................... N.S. Vishwanathan ....................................................................... U.S. Paliwal ....................................................................... Chandan Sinha ....................................................................... Michael D. Patra ....................................................................... K.K. Vohra ....................................................................... G. Mahalingam ....................................................................... Meena HemchandraCENTRAL OFFICECentral Vigilance Cell ............................................................................... Surekha Marandi, Chief Vigilance Offi cer Consumer Education and Protection Department .................................... Arun Pasricha, Chief General ManagerCorporate Strategy and Budget Department ........................................... Saurav Sinha, Chief General ManagerDepartment of Banking Regulation ......................................................... Sudarshan Sen, Principal Chief General ManagerDepartment of Banking Supervision ........................................................ Parvathy Sundaram, Chief General Manager-in-ChargeDepartment of Communication ................................................................. Alpana Killawala, Principal Press Relations Offi cerDepartment of Co-operative Bank Regulation .......................................... Suma Varma, Principal Chief General ManagerDepartment of Co-operative Bank Supervision ........................................ Malvika Sinha, Principal Chief General ManagerDepartment of Corporate Services ........................................................... J.L. Negi, Chief General ManagerDepartment of Currency Management ..................................................... Uma Shankar, Principal Chief General ManagerDepartment of Economic and Policy Research ........................................ B.M. Misra, Principal Adviser Department of External Investments and Operations ............................... S.K. Bal, Chief General Manager-in-ChargeDepartment of Government and Bank Accounts ...................................... M. Sarkar Deb, Chief General Manager-in-Charge Department of Information Technology ..................................................... S. Ganeshkumar, Chief General Manager-in-ChargeDepartment of Non-Banking Regulation ................................................... C.D. Srinivasan, Chief General ManagerDepartment of Non-Banking Supervision ................................................. Sathyan David, Chief General ManagerDepartment of Payment and Settlement Systems .................................... Nanda Dave, Chief General ManagerDepartment of Statistics and Information Management ........................... G. Chatterjee, Offi cer-in-ChargeFinancial Inclusion and Development Department .................................. A. Udgata, Principal Chief General ManagerFinancial Markets Operations Department ............................................... M. Rajeshwar Rao, Chief General ManagerFinancial Markets Regulation Department ............................................... R. Subramanian, Chief General ManagerForeign Exchange Department ................................................................. B.P. Kanungo, Principal Chief General ManagerFinancial Stability Unit .............................................................................. S. Rajagopal, Chief General ManagerHuman Resource Management Department ............................................ R.L. Das, Chief General Manager-in-ChargeInspection Department ............................................................................. B.P. Vijayendra, Principal Chief General ManagerInternal Debt Management Department ................................................... R.G. Warriar, Chief General ManagerInternational Department .......................................................................... M.K. Saggar, AdviserLegal Department ..................................................................................... Mona Anand, Legal Adviser-in-ChargeMonetary Policy Department .................................................................... B.K. Bhoi, Principal AdviserPremises Department ............................................................................... Arvind Sharma, Chief General Manager-in-ChargeRajbhasha Department ............................................................................ Ramakant Gupta, General ManagerRisk Monitoring Department ..................................................................... A.K. Misra, Chief General ManagerSecretary’s Department ............................................................................ S.K. Maheshwari, Chief General Manager
COLLEGES PRINCIPALSCollege of Agricultural Banking, Pune ....................................................... P.K. PandaReserve Bank Staff College, Chennai ....................................................... Uma Subramaniam
OFFICES REGIONAL DIRECTORSChennai ..................................................................................................... J. SadakkadullaKolkata ....................................................................................................... R.N. KarMumbai ...................................................................................................... S. RamaswamyNew Delhi .................................................................................................. Deepak Singhal
BRANCHESAhmedabad ............................................................................................... P.C. SahooBengaluru .................................................................................................. E.E. KarthakBhopal ....................................................................................................... Ajay MichyariBhubaneswar ............................................................................................. P.K. JenaChandigarh ................................................................................................ Rashmi FauzdarDehradun ................................................................................................... R.L. SharmaGuwahati ................................................................................................... S.S. BarikHyderabad ................................................................................................. R.N. DashJaipur ......................................................................................................... Arnab RoyJammu ....................................................................................................... D. SethyKanpur ....................................................................................................... Shekhar BhatnagarLucknow .................................................................................................... Supriya PattnaikNagpur ....................................................................................................... J.M. JivaniPatna ......................................................................................................... M.K. VermaRaipur ........................................................................................................ Saraswati ShyamaprasadShimla ........................................................................................................ I.S. Negi Thiruvananthapuram ................................................................................. Nirmal Chand
OFFICERS-IN-CHARGEAgartala .................................................................................................... N.P. Topno, General Manager (O-i-C)Belapur ..................................................................................................... S.N. Panda, Chief General Manager Gangtok .................................................................................................... Manabendra Misra, General Manager (O-i-C)Kochi ......................................................................................................... U. Chiranjeevi, General Manager (O-i-C)Panaji ........................................................................................................ Jaikish, General Manager (O-i-C)Ranchi ...................................................................................................... Patric Barla, General Manager (O-i-C)Shillong ..................................................................................................... Amar Nath, General Manager (O-i-C)Srinagar .................................................................................................... Satish Sharma, Assistant General Manager (O-i-C)
(As on August 13, 2015)
i
GOVERNOR’S OVERVIEW: ANNUAL REPORT, 2014-15 ................................................ 1
PART ONE: THE ECONOMY: REVIEW AND PROSPECTS .............................................. 9
I. ASSESSMENT AND PROSPECTS ......................................................................... 9
Assessment: 2014-15............................................................................................... 9
Prospects: 2015-16 .................................................................................................. 11
II. ECONOMIC REVIEW .............................................................................................. 13
The Real Economy ................................................................................................... 13
Price Situation .......................................................................................................... 21
Money and Credit ..................................................................................................... 28
Financial Markets ..................................................................................................... 36
Government Finances .............................................................................................. 43
The External Sector.................................................................................................. 48
PART TWO: THE WORKING AND OPERATIONS OF THE RESERVE BANK OF INDIA 56
III. MONETARY POLICY OPERATIONS ...................................................................... 56
The Changing Institutional Edifi ce of Monetary Policy ............................................. 56
IV. CREDIT DELIVERY AND FINANCIAL INCLUSION ............................................... 68
Credit Delivery .......................................................................................................... 69
Financial Inclusion .................................................................................................... 71
Financial Literacy ..................................................................................................... 73
V. REGULATION OF FINANCIAL MARKETS AND FOREIGN EXCHANGE MANAGEMENT 75
Financial Markets Regulation Department ............................................................... 75
Financial Markets Operations Department ............................................................... 78
Foreign Exchange Department ................................................................................ 78
VI. REGULATION, SUPERVISION AND FINANCIAL STABILITY .............................. 82
Financial Stability Unit .............................................................................................. 83
Regulation of Financial Intermediaries ..................................................................... 84
Commercial Banks: Department of Banking Regulation .......................................... 84
Cooperative Banks: Department of Cooperative Bank Regulation .......................... 89
Non-Banking Financial Companies: Department of Non-Banking Regulation ......... 91
Supervision of Financial Intermediaries ................................................................... 93
Commercial Banks: Department of Banking Supervision ......................................... 93
Cooperative Banks: Department of Cooperative Bank Supervision ......................... 95
Non-Banking Financial Companies: Department of Non-Banking Supervision ........ 95
CONTENTS
Page No.

ii
Deposit Insurance and Credit Guarantee Corporation ............................................. 96
National Housing Bank ............................................................................................. 97
Consumer Education and Protection ........................................................................ 98
VII. PUBLIC DEBT MANAGEMENT .............................................................................. 100
Debt Management of the Central Government ........................................................ 101
Debt Management of State Governments ................................................................ 103
VIII. CURRENCY MANAGEMENT .................................................................................. 107
Trends in Currency ................................................................................................... 107
Currency Management Infrastructure ....................................................................... 108
Clean Note Policy ..................................................................................................... 109
Counterfeit Notes ..................................................................................................... 110
Expenditure on Security Printing and Distribution .................................................... 110
Department of Currency Management ..................................................................... 111
Bharatiya Reserve Bank Note Mudran Private Limited ............................................ 112
IX. PAYMENT AND SETTLEMENT SYSTEMS AND INFORMATION TECHNOLOGY 114
Department of Payment and Settlement Systems ................................................... 114
Trend and Progress in Payment Systems ................................................................ 114
Department of Information Technology .................................................................... 119
X. GOVERNANCE, HUMAN RESOURCES AND ORGANISATIONAL MANAGEMENT 122
Governance Structure .............................................................................................. 122
Communication Processes ....................................................................................... 125
Human Resource Initiatives ..................................................................................... 126
Enterprise-Wide Risk Management in the Bank ....................................................... 132
Internal Audit/ Inspection in the Reserve Bank ........................................................ 134
International Relations ............................................................................................. 135
Government and Bank Accounts ............................................................................. 135
Managing Foreign Exchange Reserves .................................................................. 136
Page No.
CONTENTS
iii
Economic and Policy Research ................................................................................ 136
Statistics and Information Management ................................................................... 137
Legal Matters ........................................................................................................... 138
Corporate Strategy and Budgeting ........................................................................... 139
Corporate Services................................................................................................... 139
Rajbhasha ................................................................................................................ 139
Premises .................................................................................................................. 140
XI. THE RESERVE BANK’S ACCOUNTS FOR 2014-15 ............................................. 141
Balance Sheet ................................................................................................................ 144
Statement of Signifi cant Accounting Policies for the year ended June 30, 2015 ............ 150
Income ............................................................................................................................ 161
Expenditure .................................................................................................................... 163
Annex: Chronology of Major Policy Announcements: July 2014 to June 2015 ........... 166
Appendix Tables ................................................................................................................. 179
Page No.
CONTENTS
iv
Page No.
CONTENTS
APPENDIX TABLES
1. Macroeconomic and Financial Indicators ................................................................. 179
2. Growth Rates and Composition of Real Gross Domestic Product (At 2011-12 Prices) 181
3. Infl ation, Money and Credit ...................................................................................... 182
4. Capital Market - Primary and Secondary ................................................................. 183
5. Key Fiscal Indicators ................................................................................................ 184
6. Combined Receipts and Disbursements of the Central and State Governments .... 185
7. India’s Overall Balance of Payments ........................................................................ 186
8. Foreign Direct Investment Flows to India: Country-wise and Industry-wise ............. 187
BOXES
1. Box II.1 How Monsoon Proof is Indian Agriculture? ................................................. 16
2. Box II.2 Wage Growth and Rural Infl ation – Are They Related? .............................. 25
3. Box II.3 Spillovers and Spillbacks ............................................................................ 29
4. Box II.4 Factors Underlying Recent Credit Slowdown: An Empirical Exploration .... 32
5. Box II.5 Quality of Fiscal Adjustment ........................................................................ 45
6. Box II.6 Trade Linkages and Elasticities .................................................................. 49
7. Box II.7 India’s New Foreign Trade Policy 2015-20 ................................................. 52
8. Box III.1 Monetary Policy Report – A Communication Tool under Infl ation Targeting 61
9. Box III.2 Time-varying Natural Interest Rate in India ................................................ 66
10. Box IV.1 Priority Sector Lending – A Fresh Look ..................................................... 69
11. Box IV.2 RBI@80: Conference on Financial Inclusion ............................................. 72
12. Box V.1 G20 Commitments and Reforms in the OTC Derivatives Market in India .. 76
13. Box VI.1 Discussion Paper on Large Exposures (LE) Framework and Enhancing
Credit Supply through the Market Mechanism ......................................................... 85
14. Box VI.2 Bankruptcy Procedures in India ................................................................. 87
15. Box VI.3 Asset Quality of NBFCs and Revised Guidelines ...................................... 92
16. Box VI.4 Micro Units Development Refi nance Agency (MUDRA) Ltd. ..................... 93
v
Page No.
CONTENTS
17. Box VI.5 Risk-based Premium for Banks ................................................................. 96
18. Box VI.6 Charter of Customer Rights ....................................................................... 98
19. Box VII.1 New Initiatives in Government Banking .................................................... 105
20. Box VIII.1 Efforts for Indigenisation of Currency Printing ......................................... 111
21. Box X.1 Reserve Bank of India: Core Purpose, Values and Vision Statement ........ 124
22. Box X.2 Organisational Restructuring of the Reserve Bank ..................................... 126
23. Box X.3 Operational Risk Monitoring Framework in Central Banks ......................... 132
24 Box X.4 Risk Management and Economic Capital in Central Banks ....................... 133

vi
LIST OF ABBREVIATIONS
AAY - Antyodaya Anna Yojana
ABCI - Association of Business
Communications of India
ACB - Audit Committee of Board
AD - Authorised Dealer
ADF - Asset Development Fund
ADF - Automated Data Flow
ADR - American Depository Receipts
AEs - Advanced Economies
AFA - Additional Factor of Authentication
AFCs - Asset Finance Companies
AIFIs - All India Financial Institutions
AMS - Audit Management System
ANBC - Adjusted Net Bank Credit
APL - Above Poverty Line
APMC - Agricultural Produce Marketing
Committee
APMS - Asset Price Monitoring System
ARCs - Asset Restructuring Companies
ARMS - Audit and Risk Management Sub-
Committee
ATBs - Auction Treasury Bills
ATM - Automated Teller Machine
BAs - Business Areas
BBPCU - Bharat Bill Payment Central Unit
BBPOU - Bharat Bill Payment Operating Unit
BBPS - Bharat Bill Payment System
BC - Business Correspondent
BCBS - Basel Committee on Banking
Supervision
BCM - Bank for Currency Management
BCM - Business Continuity Management
BCSBI - Banking Codes and Standards Board
of India
BE - Budget Estimates
BFS - Board for Financial Supervision
BIS - Bank for International Settlements
BLRC - Bankruptcy Law Reform Committee
BO - Banking Ombudsman
BoJ - Bank of Japan
BoP - Balance of Payments
BPL - Below Poverty Line
BPLR - Benchmark Prime Lending Rate
BPR - Business Process Re-engineering
bps - Basis Points
BPSS - Board for Regulation and Supervision
of Payment and Settlement Systems
BRBNMPL - Bharatiya Reserve Bank Note Mudran
Private Ltd.
BRICS - Brazil, Russia, India, China and South
Africa
BSBD - Basic Savings Banking Deposit
BSBDAs - Basic Savings Bank Deposit Accounts
BSR - Basic Statistical Return
CAB - College of Agricultural Banking
CAD - Current Account Defi cit
CAFRAL - Centre for Advanced Financial
Research and Learning
CAMELS - Capital Adequacy, Asset Quality,
Management, Earnings, Liquidity,
Systems and Control
CAP - Corrective Action Plan
CARG - Compound Annual Rate of Growth
CBLO - Collateralised Borrowing and Lending
Obligation
vii
LIST OF ABBREVIATIONS
CBS - Core Banking Solution
CBSE - Central Board of Secondary Education
CBSL - Central Bank of Sri Lanka
CCB - Committee of the Central Board
CCC - Central Complaints Committee
CCCB - Counter-Cyclical Capital Buffer
CCIL - Clearing Corporation of India Ltd
CCP - Central Counter Party
CCS - Credit Condition Survey
CCSO - Chief Customer Service Offi cer
CD - Certificate of Deposit
C-D - Credit-Deposit
CDR - Corporate Debt Restructuring
CDS - Credit Default Swaps
CEOBE - Credit Equivalent Amount of Off-
Balance Sheet Exposure
CEPD - Consumer Education and Protection
Department
CERSAI - Central Registry of Securitisation
Asset Reconstruction and Security
Interest of India
CES - Consumer Expenditure Survey
CFs - Capital Funds
CGFs - Committee of Global Financial System
CGRA - Currency and Gold Revaluation
Account
CGTMSE - Credit Guarantee Trust for Micro and
Small Enterprises
CHRS - Comprehensive Human Resource
System
CICs - Credit Information Companies
CICs - Core Investment Companies
CIL - Coal India Limited
CIS - Collective Investment Schemes
CISO - Chief Information Security Offi cer
CIT - Cash in Transit
CLSS - Credit Linked Subsidy Scheme
CMBs - Cash Management Bills
CMD - Chairman and Managing Director
CODs - Central Offi ce Departments
CP - Commercial Paper
CPC - Cash Processing Centre
CPC - Cheque Processing Centre
CPI - Consumer Price Index
CPI-AL - Consumer Price Index-Agricultural
Labourers
CPI-C - Consumer Price Index - Combined
CPIS - Co-ordinated Portfolio Investment
Survey
CPMI - Committee on Payments and Market
Infrastructure
CRA - Contingent Reserve Arrangement
CRAR - Capital to Risk-Weighted Assets Ratio
CRILC - Central Repository of Information on
Large Credits
CRR - Cash Reserve Ratio
CS - Currency Swaps
CSBD - Corporate Strategy and Budget
Department
CSF - Consolidated Sinking Fund
CSO - Central Statistics Offi ce
CTS - Cheque Truncation System
CVA - Credit Valuation Adjustment
CVMs - Coin Vending Machines
DBIE - Database on Indian Economy
DBR - Department of Banking Regulation
DBS - Department of Banking Supervision
viii
DBT - Direct Benefi t Transfer
DCBR - Department of Co-operative Bank
Regulation
DCBS - Department of Co-operative Bank
Supervision
DCC - Dynamic Currency Conversion
DCCBs - District Central Co-operative Banks
DCCO - Date of Commencement of
Commercial Operations
DCM - Department of Currency Management
DCs - Data Centres
DCS - Department of Corporate Services
DEA - Depositor’s Education and Awareness
DEIO - Department of External Investments
and Operations
DEPR - Department of Economic and Policy
Research
DGBA - Department of Government and Bank
Accounts
DGCIS - Directorate General of Commercial
Intelligence and Statistics
DICGC - Deposit Insurance and Credit
Guarantee Corporation
DIF - Deposit Insurance Fund
DIMU - Data and Information Management
Unit
DIT - Department of Information Technology
DNBR - Department of Non-Banking
Regulation
DNBS - Department of Non-Banking
Supervision
DoC - Date of Commissioning
DoC - Department of Communication
DOLS - Dynamic Ordinary Least Square
DPSS - Department of Payment and
Settlement Systems
DRG - Development Research Group
DRHP - Draft Red Herring Prospectus
DRTs - Debt Recovery Tribunals
D-SIBs - Domestic Systemically Important
Banks
DSIM - Department of Statistics and
Information Management
EBT - Electronic Benefi t Transfer
ECA - Essential Commodities Act
ECB - European Central Bank
ECB - External Commercial Borrowing
ECCS - Express Cheque Clearing System
ECF - Economic Capital Framework
ECR - Export Credit Refi nance
ECS - Electronic Clearing Service
EDMS - Electronic Data Management System
EDPMS - Export Data Processing and
Monitoring System
EKP - Enterprise Knowledge Portal
email - Electronic mail
EMDEs - Emerging Market and Developing
Economies
EME - Emerging Market Economy
EMV - Europay, MasterCard and Visa
EOI - Expression of Interest
EPC - Engineering, Procurement and
Construction
ERE - Exchange Rate Elasticity
ERM - Enterprise-wide Risk Management
ETCD - Exchange Traded Currency
Derivatives
EU - European Union
LIST OF ABBREVIATIONS

ix
EWS - Early Warning System
EXIM Bank - Export Import Bank
FAO - Food and Agriculture Organisation
FAQs - Frequently Asked Questions
FBIL - Financial Benchmarks India Pvt. Ltd
FCA - Foreign Currency Assets
FCCBs - Foreign Currency Convertible Bonds
FCI - Food Corporation of India
FCNR(B) - Foreign Currency Non Resident
(Bank) Account
FCRA - Foreign Currency Revaluation Account
FCs - Financial Conglomerates
FCVA - Forward Contracts Valuation Account
FCY - Foreign Currency
FDI - Foreign Direct Investment
FDIC - Federal Deposit Insurance Corporation
FED - Foreign Exchange Department
FEDAI - Foreign Exchange Dealers'
Association of India
FEMA - Foreign Exchange Management Act
FI - Financial Institution
FIAC - Financial Inclusion Advisory
Committee
FICN - Fake Indian Currency Notes
FIDD - Financial Inclusion and Development
Department
FII - Foreign Institutional Investor
FIMMDA - Fixed Income Money Market and
Derivatives Association of India
FIP - Financial Inclusion Plan
FIPB - Foreign Investment Promotion Board
FIT - Flexible Infl ation Targeting
FLCs - Financial Literacy Centers
FMCG - Fast-Moving Consumer Goods
FMD - Financial Markets Department
FMIs - Financial Market Infrastructures
FMOD - Financial Markets Operations
Department
FMRD - Financial Markets Regulation
Department
FOREX - Foreign Exchange
FPAS - Forecasting and Policy Analysis
System
FPI - Foreign Portfolio Investment
FPOs - Follow on Public Offers
FRA - Financial Resolution Authority
FRA - Forward Rate Agreement
FRBM Act - Fiscal Responsibility and Budget
Management Act
FSAP - Financial Sector Assessment
Programme
FSB - Financial Stability Board
FSDC - Financial Stability and Development
Council
FSLRC - Financial Sector Legislative Reforms
Commission
FSR - Financial Stability Report
FSU - Financial Stability Unit
FSWM - Financially Sound and Well Managed
FTP - Foreign Trade Policy
FVCIs - Foreign Venture Capital Investors
FWG - Framework Working Group
FX - Foreign Exchange
GBP - Great British Pound
GCC - General Credit Card
GDP - Gross Domestic Product
GDR - Global Depository Receipts
LIST OF ABBREVIATIONS
x
GFCE - Gross Final Consumption Expenditure
GFCF - Gross Fixed Capital Formation
GFD - Gross Fiscal Defi cit
GIFT - Gujarat International Finance Tech-
City
GJRHRS - Golden Jubilee Rural Housing
Refi nance Scheme
GMM - Generalised Method of Moments
GNDI - Gross National Disposable Income
GoI - Government of India
GRA - Gold Revaluation Account
GRF - Guarantee Redemption Fund
GRQ - General Review of Quotas
GSDP - Gross State Domestic Product
G-Secs - Government Securities
G-SIBs - Global Systemically Important Banks
G-SII - Global Systemically Important Insurer
GST - Goods and Services Tax
GVA - Gross Value Added
GVC - Global Value Chains
HFA - Housing for All
HFCs - Housing Finance Companies
HPI - House Price Index
HQLAs - High Quality Liquid Assets
HRMD - Human Resource Management
Department
HTM - Held to Maturity
HUF - Hindu Undivided Family
IADI - International Association of Deposit
Insurers
IAERM - Internal Audit and Enterprise Risk
Management
IBA - Indian Banks’ Association
IBL - Inter-Bank Liabilities
IBS - International Banking Statistics
IBU - IFSC Banking Unit
ICBA - Inter-Central Bank Agreement
ICDR - Issue of Capital and Disclosure
Requirements
ICSD - International Central Security
Depositories
ICT - Information and Communication
Technology
IDFC - Infrastructure Development Finance
Company
IDMD - Internal Debt Management
Department
IDPMS - Import Data Processing and
Monitoring System
IESH - Infl ation Expectation Survey of
Households
IFC - Indian Financial Code
IFCs - Infrastructure Finance Companies
IFRS - International Financial Reporting
Standards
IFSC - International Financial Services
Centre
IGIDR - Indira Gandhi Institute of Development
Research
IIBM - Indian Institute of Bank Management
IIFC - India Infrastructure Finance Company
IIP - Index of Industrial Production
IIWG - Investment and Infrastructure Working
Group
ILO - International Labour Organisation
IMD - India Meteorological Department
IMF - International Monetary Fund
IMPS - Immediate Payment Service
LIST OF ABBREVIATIONS
xi
INR - Indian Rupee
InvITs - Infrastructure Investment Trusts
IOD - Indian Ocean Dipole
IORWG - International Operational Risk Working
Group
IOS - Industrial Outlook Survey
IOSCO - International Organisation of
Securities Commission
IP - Internet Protocol
IPOs - Initial Public Offerings
IPv6 - Internet Protocol Version 6
IRA - Investment Revaluation Account
IRDA - Insurance Regulatory and
Development Authority
IRF - Inter-Regulatory Forum
IRFs - Interest Rate Futures
IRS - Interest Rate Swap
IRS - Incident Reporting System
IRTG - Inter-Regulatory Technical Group
IS - Information System
ISHUP - Interest Subsidy Scheme for Housing
the Urban Poor
ISOC - Information Security Operations
Centre
ISS - Integrated Security System
IT - Infl ation Targeting
IT - Information Technology
IT-BPO - Information Technology-Business
Process Outsourcing
ITBs - Intermediate Treasury Bills
ITF - Implementation Task Force
IT-PAN - Income Tax-Permanent Account
Number
ITSC - Information Technology Sub
Committee
JLF - Joint Lenders Forum
JLGs - Joint Liability Groups
JV - Joint Venture
KCC - Kisan Credit Card
KRA - Key Result Area
KYC - Know Your Customer
LABs - Local Area Banks
LAF - Liquidity Adjustment Facility
LBMA - London Bullion Market Association
LCR - Liquidity Coverage Ratio
LE - Large Exposure
LEI - Legal Entity Identifi er
LLPs - Liability Partnership Companies
LOBOM - Lower of Book or Market Value
LOLR - Lender of Last Resort
LOU - Local Operating Unit
LPA - Long Period Average
LPG - Liquefi ed Petroleum Gas
LR - Leverage Ratio
LRS - Liberalised Remittance Scheme
LSE - London School of Economics
LTV - Loan to Value Ratio
M3 - Money Supply
MAT - Minimum Alternate Tax
MCA - Ministry of Corporate Affairs
MD - Managing Director
MDR - Merchant Discount Rate
MEIS - Merchandise Exports from India
Scheme
MEP - Minimum Export Price
MFI - Micro Finance Institution
LIST OF ABBREVIATIONS

xii
MGNREGA - Mahatma Gandhi National Rural
Employment Guarantee Act
MI - Market Intelligence
MIBOR - Mumbai Interbank Offer Rate
MICR - Magnetic Ink Character Recognition
MIS - Management Information System
MMLR - Market Maker of Last Resort
MMRP - Modifi ed Mixed Reference Period
MMS - Mail Messaging System
MNOs - Mobile Network Operators
MoSPI - Ministry of Statistics and Programme
Implementation
MoU - Memorandum of Understanding
MPC - Monetary Policy Committee
MPD - Monetary Policy Department
MPR - Monetary Policy Report
MSEs - Micro and Small Enterprises
MSF - Marginal Standing Facility
MSMEs - Micro, Small and Medium Enterprises
MSPs - Minimum Support Prices
MT - Million Tonnes
MT - Metric Tonne
MTM - Mark to Market
MTSS - Money Transfer Service Scheme
MUDRA - Micro Units Development Refi nance
Agency
MW - Mega Watt
NAB - New Arrangements to Borrow
NABARD - National Bank for Agriculture and
Rural Development
NACH - National Automated Clearing House
NAV - Net Asset Value
NBFC - Non-Banking Financial Company
NBFC-MFI - NBFC-Micro Finance Institution
NBFCs-D - Deposit-taking NBFCs
NBFCs-ND - Non-Deposit taking NBFCs
NBFCs-ND-SI - Systemically Important NBFCs-ND
NBV - Net Book Value
NCBs - Non-Cooperative Borrowers
NCDs - Non-Convertible Debentures
NCERT - National Council of Education
Research and Training
NCLT - National Company Law Tribunal
NCM - National Commission for Minorities
NDA - Net Domestic Assets
NDS-OM - Negotiated Dealing System-Order
Matching
NDTL - Net Demand and Time Liabilities
NECS - National Electronic Clearing Service
NEFT - National Electronic Funds Transfer
NEM - Northeast Monsoon
NFA - Net Foreign Assets
NFS - National Financial Switch
NHAI - National Highways Authority of India
NHB - National Housing Bank
NIBM - National Institute of Bank
Management
NIC - Notes in Circulation
NIIF - National Investment and Infrastructure
Fund
NIIP - Net International Investment Position
NIMs - Net Interest Margins
NM3 - New Monetary Aggregate
NOF - Net Owned Fund
NONG - Non-Oil Non-Gold
NPA - Non-Performing Asset
LIST OF ABBREVIATIONS
xiii
NPCI - National Payments Corporation of
India
NPISH - Non-Profi t Institutions Serving
Households
NRIs - Non-Resident Indians
NRLM - National Rural Livelihoods Mission
NSDL - National Securities Depository Limited
NSDP - Net State Domestic Product
NSFR - Net Stable Funding Ratio
NSSO - National Sample Survey Organisation
NULM - National Urban Livelihoods Mission
NUUP - National Unifi ed USSD Platform
OBCs - Other Backward Classes
OBS - Off-Balance Sheet
OD - Overdraft
ODI - Overseas Direct Investment
OECD - Organisation for Economic
Co-operation and Development
OIS - Overnight Index Swap
OMO - Open Market Operations
OPEC - Organisation of Petroleum Exporting
Countries
ORM - Operational Risk Management
OSMOS - Off-Site Monitoring and Surveillance
System
OSS - Off-Site Surveillance
OTC - Over-The-Counter
OVD - Offi cially Valid Document
PA - Provisional Accounts
PAN - Permanent Account Number
PCA - Prompt Corrective Action
PDMA - Public Debt Management Agency
PDs - Primary Dealers
PDS - Public Distribution System
PFCE - Private Final Consumption
Expenditure
PFCVA - Provision for Forward Contracts
Valuation Account
PFMIs - Principles for Financial Market
Infrastructures
PFMS - Public Finance Management System
PID - Protection of Interests of Depositors’
PLF - Plant Load Factor
PMG - Project Monitoring Group
PMI - Purchasing Managers Index
PMJDY - Pradhan Mantri Jan DhanYojana
PMS - Performance Management System
POL - Petroleum, Oil and Lubricants
PoS - Point of Sale
PPI - Pre-Paid Payment Instrument
PPP - Public-Private Partnership
PSBs - Public Sector Banks
PSL - Priority Sector Lending
PSLCs - Priority Sector Lending Certifi cates
PSS Act - Payment and Settlement Systems Act
PSUs - Public Sector Undertakings
PvP - Payment Versus Payment
QE - Quantitative Easing
QFI - Qualifi ed Foreign Investor
QIB - Qualifi ed Institutional Buyer
QIP - Qualifi ed Institutional Placement
R&D - Research and Development
RAF - Risk Appetite Framework
RBI - Reserve Bank of India
RBIA - Risk Based Internal Audit
LIST OF ABBREVIATIONS
xiv
RBIQ - Reserve Bank of India Quiz
RBIWPS - Reserve Bank Working Paper Series
RBS - Risk Based Supervision
RBSC - Reserve Bank Staff College
RCG - Regional Consultative Group for Asia
RCs - Reconstruction Companies
RD - Revenue Defi cit
RDA - Rupee Drawing Arrangement
RECS - Regional Electronic Clearing Service
REITs - Real Estate Investment Trusts
RFCA - Revaluation of Forward Contracts Account
RFPI - Registered Foreign Portfolio Investor
RGS - Risk Governance Structure
RHF - Rural Housing Fund
RIDF - Rural Infrastructure Development Fund
RMD - Risk Monitoring Department
RoA - Return on Assets
ROC - Regulatory Oversight Committee
RoE - Return on Equity
ROs - Regional Offi ces
RRBs - Regional Rural Banks
RTGS - Real Time Gross Settlement System
RTI Act - Right to Information Act
RWA - Risk Weighted Assets
SAA - Swap Amortisation Account
SAARC - South Asian Association for Regional
Cooperation
SARFAESI - Securitisation and Reconstruction of
Financial Assets and Enforcement of
Security Interest
SBIG - Shadow Banking Implementation
Group
SBP - State Bank of Pakistan
SC - Securitisation Company
SCAV - Standing Committee on Assessment
of Vulnerabilities
SCBs - Scheduled Commercial Banks
SCs - Scheduled Castes
SDF - Special Drawing Facility
SDLs - State Development Loans
SDR - Special Drawing Rights
SDR - Strategic Debt Restructuring
SDS - Step Down Subsidiary
SEBI - Securities and Exchange Board of
India
SEIS - Services Exports from India Scheme
SEP - Self-Employment Programme
SEZs - Special Economic Zones
SF - SAARCFINANCE
SFT - Securities Financing Transaction
SGL - Subsidiary General Ledger
SHGs - Self Help Groups
SIA - Secretariat Industrial Assistance
SIBs - Systemically Important Banks
SICA - Sick Industrial Companies (Special
Provisions) Act
SIDBI - Small Industries Development Bank of
India
SIOS - Services and Infrastructure Outlook
Survey
SJSRY - Swarna Jayanti Shahari Rozgaar
Yojana
SLBCs - State Level Bankers’ Committees
SLCCs - State Level Coordination Committees
SLR - Statutory Liquidity Ratio
LIST OF ABBREVIATIONS
xv
This Report can also be accessed on InternetURL : www.rbi.org.in
SMA - Special Mention Accounts
SMC - Senior Management Committee
SMS - Short Message Service
SNB - Swiss National Bank
SPMCIL - Security Printing and Minting
Corporation of India Limited
SRC - Standing Committee on Supervisory &
Regulatory Co-operation
SRs - Security Receipts
StCBs - State Co-Operative Banks
STOs - State Treasury Offi ces
STP - Straight-Through-Processing
STs - Scheduled Tribes
SWM - Southwest Monsoon
SWMA - Special Ways and Means Advances
TAC - Technical Advisory Committee
TACS - Technical Advisory Committee on
Surveys
TAG - Technical Advisory Group
TC - Technical Committee
TLAC - Total Loss-Absorbing Capacity
TOLIC - Town Offi cial Language
Implementation Committee
TR - Trade Repositories
TReDS - Trade Receivables Discounting
System
UBD - Urban Banks Department
UCBs - Urban Co-Operative Banks
UK - United Kingdom
UMP - Unconventional Monetary Policy
US - United States
USD - US Dollar
USSD - Unstructured Supplementary Service Data
UT - Union Territory
VAPT - Vulnerability Assessment and Penetration Testing
VARs - Vector Auto-Regressions
VC - Video Conferencing
VEC - Vector Error Correction
VIF - Variance Infl ation Factor
WACR - Weighted Average Call Money Rate
WADR - Weighted Average Discount Rate
WADTDR - Weighted Average Domestic Term Deposit Rate
WAEIR - Weighted Average Effective Interest Rate
WALR - Weighted Average Lending Rates
WAR - Weighted Average Rate
WLAs - White Label ATMs
WMA - Ways and Means Advances
WOS - Wholly Owned Subsidiary
WPI - Wholesale Price Index
WSS - Weekly Statistical Supplement
XBRL - eXtensible Business Reporting Language
ZTC - Zonal Training Centre
LIST OF ABBREVIATIONS


GOVERNOR’S OVERVIEW: ANNUAL REPORT, 2014-15
1
1. The Reserve Bank’s Annual Report informs the people of India on what RBI intended to accomplish during the past year and what was actually done. In it, RBI also lays out proposals for the coming year. Our actions are infl uenced both by the current macroeconomic environment as well as our broad medium-term framework for the development of the fi nancial sector.
Challenges in the Current Macroeconomic Environment
2. Despite the immense efforts in recent years of both the Government and RBI to restore macroeconomic stability to the economy, three areas are still “work in progress” from RBI’s perspective. First, economic growth is still below levels that the country is capable of. Second, infl ation projections for January 2016 (as of early August 2015) are still at the upper limits of RBI’s infl ation objective. Third, the willingness of banks to cut base rates – whereby they forego income on existing borrowers in order to attract more new business -is muted; not only does weak corporate investment reduce the volume of new profi table loans, some bank capital positions, weakened by NPAs, may prevent them from lending freely.
3. The short term macroeconomic priorities of the Reserve Bank are therefore clear: focus on bringing down infl ation in line with the proposed glide path; work with the Government and banks on speeding up the resolution of distressed projects and cleaning up bank balance sheets; ensure banks have the capital to make provisions, support new lending, and thus pass on future possible rate cuts.
Infl ation Objective
4. RBI signed a historic agreement with the Government, wherein RBI’s mandate is clearly
spelled out in terms of a fl exible infl ation objective over the medium term. This year, the Finance Minister proposes to lay out, after consultation with RBI, the structure of a monetary policy committee that can be formally and legally entrusted with policy decisions. This is a welcome step forward in building the institutions we need for transparent and independent monetary policy.
5. Turning to liquidity management, RBI has largely moved from windows where banks can get liquidity at fi xed prices to auctioning liquidity in the market. The intent is to undertake suffi cient operations to keep the weighted average call money rate (purged of off-market transactions effected by co-operative banks) close to the policy rate. In choosing between auctioning short term instruments (such as overnight repos and reverse repos) and long term instruments [such as Open Market Operations (OMOs)] to manage liquidity, the Bank estimates the pace at which it wants to grow its “permanent” assets, consisting of the sum of foreign exchange reserves and government bonds, and decides accordingly.
Stressed Assets and Speedy Resolution
6. In dealing with stressed bank assets, RBI has been focused on getting the underlying real projects back on track. There are a number of impediments here. First, the stigma as well as the provisioning (and the associated fall in profi tability) attached to a loan being labelled “non-performing” makes banks eager to avoid the label. In some cases, they ignore the reality that existing loans will have to be written down because of the changed situation since they were sanctioned (which includes extensive delays, cost overruns, and overoptimistic demand projections). Regulatory forbearance, where RBI makes it easy for banks
GOVERNOR’S OVERVIEW: ANNUAL REPORT, 2014-15
ANNUAL REPORT
2
to “extend and pretend” is not a solution. Since no other stake-holder – such as the promoter, tariff authorities and tax authorities - contributes to resolution, the real project limps along becoming increasingly unviable. Meanwhile, analysts grow increasingly suspicious of bank balance sheets and the growing volume of “restructured” assets. Second, some large promoters take advantage of banker fears about assets turning non-performing to extract unwarranted concessions, without any sacrifi ce in the value of their stake. The judicial process, despite a variety of creditor-friendly bills like the SARFAESI Act, further tends to hamper the ability of creditors to collect their just dues from infl uential promoters.
7. To remedy both the paralysis as well as the unfair distribution of losses, RBI has taken a number of actions. First, it has created a database of loans over ̀ 50 million (the CRILC database), and has advised banks and NBFCs to report regularly on the status of the loans. Early identifi cation of distressed projects offers the best opportunity to put them back on track. So if a loan is identifi ed as more than 60 days overdue, all lenders to the borrower have to come together in a Joint Lending Forum (JLF) to see how the underlying problems can be fi xed. The JLF has to follow strict timelines, failing which the project loans’ classifi cation has to be downgraded. On the other hand, if the timelines are met, the deterioration in loan classifi cation is halted. Furthermore, by bringing the creditors into one forum, RBI has made it easier for the promoter and the creditors to reach a consensus on actions, even while making it harder for the promoter to play one creditor off against another.
8. Some other regulatory actions are worth noting. RBI ended the forbearance accorded to restructured loans. Henceforth, restructured loans will be classifi ed as non-performing loans. To deal with genuine problems of poor structuring, however,
it has allowed bankers to stretch repayment profi les for performing loans to infrastructure and the core sector (the so-called “5/25” rule), provided the project has reached commercial take-off, has a genuinely long commercial life, and the net present value of loans is maintained. RBI is undertaking periodic examination of randomly selected “5/25” deals to ensure they are facilitating genuine adjustment rather than becoming a back-door means of postponing principal payments indefi nitely. Also, in cases of restructuring, RBI and SEBI have together allowed banks to write in clauses that allow banks to convert loans to equity in case the project gets stressed again. Not only will such Strategic Debt Restructuring give creditors some upside, in return for reducing the project’s debt, it can also give them the control needed to redeploy the asset (say with a more effective promoter).
9. Going forward, RBI has to monitor the effi cacy of the various measures put in place to speed up resolution, and take remedial action where necessary. The move by the Government to add to the recapitalisation fund for banks is also welcome, as is the proposal to allocate it taking into account the progress in cleaning up balance sheets and generating healthy growth. RBI will welcome progress in the coming year on the creation of the institutions necessary for resolution such as the new Bankruptcy Code and the Company Law Tribunals that will administer it and the Financial Resolution Authority (for resolving fi nancial institution distress).
Medium Term Challenges
10. A regulatory view, fashionable in the past, was that the pace of regulatory reforms had to be limited by the capacity of our banks, especially our public sector banks (PSBs). The current stress in the banking system suggests that the real economy will not wait for the banking system, and a slow
GOVERNOR’S OVERVIEW: ANNUAL REPORT, 2014-15
3
pace of reform could lead to greater, rather than lower risk residing in the banking system. Financial sector reforms need to move on many fronts.
11. For a country as big and populous as India, reforms cannot be shots in the dark, subjecting the economy to great uncertainty and risk. Wherever possible, we have to move steadily but fi rmly, ever expanding the scope of reforms while always limiting the uncertainty they create. The Chinese term this ‘Crossing the river by feeling the stones’. It is an appropriate metaphor to guide our own reforms.
12. In the fi nancial sector, we need to increase effi ciency through greater entry and competition. The most appropriate institutions will prevail when the competitive arena is level, so we have to remove regulatory privileges as well as impediments wherever possible, especially those that are biased towards some form of ownership or some particular institutional form. We need more participation in our fi nancial markets to increase their size, depth, and liquidity. Participation is best enhanced not through subventions and subsidies but by creating supporting frameworks that improve transparency, contract enforcement, and protections for market participants against abusive practices. Technology can be very helpful in reducing the costs of supportive frameworks, and can bring hitherto excluded populations into the fi nancial fold. It is these ideas that guide our medium-term reform strategy. Let me be more specifi c.
Banking and Other Financial Institutions
13. The banking system is dominated by PSBs. While a number of extraordinary offi cers have led PSBs over time, recent bank underperformance suggests room for improvement. Following the Nayak Committee Report, the Government has decided to separate the posts of Chairman
and Managing Director of these banks, follow a more open search by considering private sector candidates also for a number of these posts, and professionalise the Boards of these banks by inducting professional Board members with the relevant experience. Going forward, the Government intends to set up a Bank Board Bureau (BBB), composed of eminent personalities with integrity and domain experience, to take over the appointments process.
14. RBI has also stepped away from micromanaging the functioning of the PSB Boards through regulations, allowing Boards to determine how they will carry out their responsibilities for strategic planning, risk management, accounting, etc. RBI has also liberalised the compensation of private bank Board members, while maintaining some checks, to ensure Board members are properly incentivised.
15. Because PSBs compete in the same market place for talent as do private sector banks and foreign banks, and because skill gaps are increasing at middle management levels because of past hiring freezes, they will be unnecessarily hampered if they are unable to pay appropriate compensation to middle and senior managers, as well as Board members. Of course, higher pay should come with better accountability for performance. Given that many PSBs have higher overall costs than private sector banks performing similar activities, there is some scope for cost rationalisation even while improving the pattern of compensation. At the same time, we should recognise that PSBs undertake public interest activities (like the rollout of accounts under the Pradhan Mantri Jan Dhan Yojana) that are not always fully compensated. Government should endeavour to keep the competitive playing fi eld level by fully compensating banks for activities it wants undertaken in the public interest.

ANNUAL REPORT
4
16. A committee under RBI Deputy Governor
Shri Gandhi has detailed the ways governance in
urban co-operative banks (UCBs) can be improved,
including through implementation of the Malegam
Committee report. Licensing of new UCBs will
follow after the committee’s recommendations
are evaluated and implemented. The committee
has also proposed modalities by which well-
functioning co-operatives, including multi-state co-
operatives, can convert to joint stock companies.
17. The banking sector will experience a
substantial change in the nature of competition
as two new universal banks start operations, and
a number of payment banks and small fi nance
banks are approved this year for license. Payment
banks are expected to offer bank accounts in
every corner of the country, facilitating payments
and cash transfers through new technologies and
physical access points. Small fi nance banks are
expected to channel loans and fi nancial services to
small players. The MUDRA Limited will also help in
such efforts through refi nancing and securitisation
services to unincorporated lenders. After reviewing
the experience with this fi rst round of licenses, RBI
intends to put the licensing process “on tap”, with
applications being considered as and when they
come in.
18. Non-Banking Financial Companies
(NBFCs) are an integral and important part of
our financial landscape. RBI has endeavoured to
streamline regulations across NBFCs, reducing
the regulatory burden in case an NBFC is not
systemic, does not face retail customers, or
does not raise money from the public. It has
also harmonised regulations such as NPA
norms, capital requirements, provisioning
requirements across different types of NBFCs
as also between NBFCs and other financial
institutions.
Other Regulatory Changes
19. New Basel norms on regulation will require implementation. The Reserve Bank has put out frameworks on the Leverage Ratio, Countercyclical Capital Buffer, Capital for Domestic Systemically Important Banks, the desirable extent of large exposures, and various liquidity ratios. While tailoring the international accords to domestic conditions, the Reserve Bank intends to meet international commitments on schedule.
20. With rapid changes in regulations, we need to go back periodically and revise the entire regulatory handbook. With this in mind, the Reserve Bank plans to come out by January 1, 2016 with thoroughly revised master documents covering different regulatory issues. Each of these master documents is intended to become a complete user-friendly compendium of applicable regulations on a subject. Each will be updated in real time, and will attempt to streamline and simplify regulations where possible.
Supervisory Changes
21. Even as our regulations change, supervision has to keep pace. We are working on improving our collection and dissemination of information, on refi ning our methods of inspection and analysis, and on enhancing the capabilities of our staff. We will continuously rationalise regulations but will come down hard on non-compliance when detected.
22. More information is being collected and disseminated through the CRILC database of large loans, through a new fraud registry which is being supported with a detailed framework on detecting and dealing with banking frauds, and through a new Early Warning System to track bank stress. Going forward, we plan to integrate all our supervisory data into a seamless database.
23. RBI moved to risk-based supervision of some of our larger banks in 2013. We have
GOVERNOR’S OVERVIEW: ANNUAL REPORT, 2014-15
5
been evaluating our experience and refi ning our methods, including validating them with the assistance of multilateral agencies. We are also working on systemic risk assessments through our Financial Stability Unit.
24. With changes in technology, cyber security, both at the bank level and at the system level, has become very important. RBI is working on upgrading the capabilities of its inspectors to undertake bank system audit as well as to detect vulnerabilities in them. RBI is also in the process of setting up an IT subsidiary, which will be able to recruit directly from industry, and will give the Reserve Bank better ability to manage and supervise technology.
25. Finally, RBI will help State Level Coordination Committees (SLCCs) become more effective so that they can ferret out unauthorised fi nancial operators before they can misuse public trust. SLCC sub-committees will keep regulators and law-enforcement authorities in constant contact. RBI will help SLCCs develop websites, where the public can get, and give, information about the legitimacy of fi nancial schemes offered by non-bank operators.
Debt Management and Markets
26. RBI has been managing central government and state government debt issuance with a view to reducing risks even while minimising transactions- and fi nancing costs. This means, among other things, articulating a clear medium term debt strategy, spreading issues over different maturities so that there is no bunching of securities, and switching or buying back certain maturing issues. It also means improving liquidity, resilience and depth in the market for government securities by expanding the role of long term players like pension funds and insurance companies, creating more, and predictable, room for Foreign Portfolio
Investors, and making it easier for domestic retail investors to participate through their “demat” accounts.
27. In addition to issuing debt on the government’s behalf, RBI works closely with the central government and state governments to facilitate the government’s electronic payments and receipts, as well as its accounting. Increasingly, through its e-Kuber platform, RBI has been undertaking some functions itself to reduce costs.
28. The Government has announced its intent to move debt management to a separate agency, the PDMA. While the public discourse has sometimes suggested large reductions in government bond yields from setting up an independent PDMA with no confl icts of interest, these stem primarily from such an agency being unable to sell debt to captive government-owned or regulated institutions, thus forcing the government to reduce fi scal defi cits. Given the Government has embarked on a fi scal consolidation path, the benefi t from such discipline may be small. At any rate, RBI is working closely with the Government in setting up the PDMA.
29. RBI recognises the role of a vibrant fi nancial market in complementing and competing with the banking system in allocating and absorbing risks. Our focus is on improving the variety of products and participants, as well as on reducing the costs of transaction, all the while keeping fi nancial stability in mind.
30. To improve activity in the corporate debt market, RBI has allowed banks to issue long term bonds that will be free of regulatory pre-emptions. It has encouraged the emergence of an international rupee market by allowing multilateral institutions to issue rupee bonds abroad, and will permit Indian corporates to also do so. It is also exploring ways by which banks can enhance corporate bond credit ratings through credit
ANNUAL REPORT
6
facilities. Ultimately, though, a robust bankruptcy system is needed for the corporate bond market to really take off. The Government has indicated it will move quickly to put this in place.
31. RBI has encouraged the development of new instruments such as exchange traded interest rate futures. It plans to open the way to interest rate options, a variety of swaps (including a swap execution facility), as well as cross-currency futures and options. Where possible, RBI will be more liberal in allowing a variety of instrument designs and participation when an instrument is initiated, putting greater focus on stability issues once trading picks up.
Currency and Payments
32. Our country still depends on physical currency in many transactions. RBI is constantly seeking to improve the quality of bank notes it issues, even while making sure that notes are available wherever needed. A new series of bank notes are being issued, and we also intend to start a pilot project with plastic/polymer bank notes. We have also examined the logistics of currency distribution and we intend to make signifi cant changes in our current model, with a greater focus on incentivising banks to take over storage and distribution of currency. Moreover, we will emphasise the decentralised return of coins (into coin machines and through coin collection programs) and notes (through ATMs that accept cash and re-circulate it).
33. It is a reality that cash use will fall off over time, lowering transactions costs and reducing the role of black money. RBI is working with the Government to incentivise electronic payments. New institutions, such as the Bharat Bill Payment System, and new technologies, especially through mobile phones, will emerge that will facilitate such payments. While RBI recognises the need
for regulatory adaptation, and will work with stakeholders to achieve that, it will not brook the violation of existing regulations simply because a user thinks they are outdated. For instance, after asking an operator to cease violating rules on small value payments, RBI has permitted issuers to dispense with two factor authentication for small value payments, provided some safeguards are in place. Over time, RBI believes mobile- and Internet-based payments will explode, and is working with the fi nancial sector to facilitate them.
Financial Inclusion
34. The Pradhan Mantri Jan Dhan Yojana has created a base of accounts for much of the population. Government has taken the next step of attaching a variety of fi nancial services such as accident and life insurance to these accounts, and sending Direct Benefi ts such as scholarships, pensions, and subsidies to these accounts. We also have to ease access to bank accounts through Business Correspondents, payment banks, and point-of-sales machines so that they are used frequently. Easy payments, access to cash-in and cash-out facilities, and widespread availability of safe savings instruments have to be our next objectives in fi nancial inclusion of households.
35. We also need to ease lending to small producers, whether they are farmers, Self Help Groups, or businesses. For this, we need to improve the structure and working of credit information bureaus, collateral registries, and debt recovery tribunals – ironically, credit fl ows easily only when the lender is persuaded that he will get his money back, so easier access to credit necessitates closer attention to default prevention mechanism. Perhaps the most important source of collateral value is land. We need better digital mapping and clean records of land ownership across the country so that it can be used more effectively as collateral.
GOVERNOR’S OVERVIEW: ANNUAL REPORT, 2014-15
7
36. New institutions like the Trade Receivables Discounting System (where small fi rms can post their receivables from large fi rms for sale) and Small Finance Banks are being set up to facilitate credit fl ow to small fi rms. The MUDRA Limited is also likely to propose innovative new ways of channelling fl ows to small producers.
37. Priority sector in India pertains to those sectors of the economy which, though viable and creditworthy, may not get timely and adequate credit in the absence of any special dispensation. Typically, these are small value loans to farmers for agriculture and allied activities, micro and small enterprises, poor people for housing, students for education and other low income groups and weaker sections. In the context of India, such sectors are spread across the length and breadth of the country and especially prevalent in the hilly and coastal regions.
38. Priority sector activities have to be carried out by banks as part of their normal business operations and, therefore, banks are expected not to view this as a Corporate Social Responsibility. On the part of the Reserve Bank, one important facilitation in this regard has been that pricing of all credit has been made free, though with the expectation that pricing should not be exploitative. Priority sector efforts will not be successful unless market players are willing to take risks by innovating structures, products and processes.
39. RBI revamped priority sector guidelines so as to reemphasise lending to excluded or nationally important sectors in a changing economy. In particular, it set new targets of 8 per cent of Adjusted Net Bank Credit to small and marginal farmers and 7.5 per cent for micro enterprises, while allowing medium-sized fi rms, social infrastructure such as toilets, and renewable energy investments to qualify for priority sector credit.
40. Financial inclusion also means greater consumer protection for the newly included and typically unsophisticated customers, an easily-accessed and speedy grievance redressal process, and expanded efforts on fi nancial literacy. Following public consultation, RBI has developed a Charter of Consumer Rights. Bank boards have been asked to put in place frameworks that ensure those rights are protected. After those frameworks have been in operation for some time, RBI will take a view on best practices, and needed regulation, if any. In the meantime, fi eld visits by RBI, to check mis-selling as well as proper functioning of bank infrastructure such as branches and ATMs, will be expanded.
41. RBI is reviewing its Banking Ombudsman system to see how it can be extended to non-banks and how it can be more effective in rural areas. Each bank has also been asked to set up an internal Ombudsman system, which will examine the bank’s grievance cases to see if resolution is possible before it is escalated to RBI’s ombudsman system.
42. Financial literacy, whether through courses in schools, through literacy camps organised by banks and RBI, or through newspaper or social media campaigns, is extremely important. All too often, unscrupulous operators have discovered that greed trumps education – even the sophisticated fail to apply the maxim that if it is too good to be true, it probably is… Nevertheless, it is our duty to try and educate our public and we have to be better than the unscrupulous at exploiting new technologies, including mass and social media, to reach them. RBI intends to increase its focus on such campaigns signifi cantly.
RBI’s Organisational Changes and Human Resources Development
43. To respond to its changing responsibilities, especially the need for more specialisation, the
ANNUAL REPORT
8
Reserve Bank created some new departments, merged others, and reorganised all into 5 clusters: 1) Monetary Policy and Research; 2) Regulation and Risk Management; 3) Supervision and Inclusion; 4) Financial Markets and Infrastructure; and 5) Human Resources and Operations. The restructuring was carried out this year.
44. Henceforth, most offi cers will be recruited through a revamped common entrance exam (starting 2015), given an overall view of the Bank during initial training, and then encouraged to specialise in a couple of clusters in their early years. To encourage specialisation, the Bank will also consider promoting some particularly capable employees in situ. For most employees, however, as they become more senior, skill building will shift from acquiring technical skills to acquiring managerial skills. At very senior levels, these offi cers will again be posted freely between clusters.
45. The Bank intends to make more postings based on the Bank’s needs and the staff member’s specialisation interests. This also means that we have to help staff assess their own aptitude through an Assessment Centre and help them identify their strengths and weaknesses through a more discriminating Performance Evaluation System. We also must identify the needs of various jobs through careful job profi ling. Staff members have to be given the training support, including through scholarships, to build necessary skills as well as to remedy identifi ed gaps. We plan to set up an RBI Academy to offer higher-order skills to RBI staff and bank offi cials. And staff members who consistently perform well should also be rewarded with more challenging assignments. All this will require substantial effort in the area of
Human Resource Development, but is absolutely necessary.
Conclusion
46. RBI is an effi cient organisation, which has steadily reduced its employee count from 35,500 in 1981 to 16,700 today, even while performing ever increasing quantities of work. The surplus it generated from its activities this year is `659 billion, which has been paid out entirely to the Government. There is, of course, always scope for improvement. For example, to ensure that we meet our commitment to the public, we have put out on our website timelines within which the public can expect responses to applications made to RBI. We will monitor those timelines to ensure our staff delivers as promised.
47. A key factor in RBI’s success has been a satisfi ed staff. In the past, RBI used to have no problem attracting junior offi cers, losing only an occasional offi cer who was successful in the IAS exam. Today, we lose more than we should be comfortable with. This is why a revamp of the professional challenges we offer our staff is very much needed, and we hope the changes outlined earlier will help us become a more attractive employer. In this regard, our review of compensation, as well as the long-pending improvement in pensions for our retirees also assume importance.
48. Let me end by thanking all my 16,700 colleagues for their work in the past year and challenging them, in the 81st year of this great institution, to do even better so that the Reserve Bank of India continues to help the nation secure prosperity and economic opportunity for all for many years to come.

ASSESSMENT AND PROSPECTS
9
Notwithstanding deterioration in export performance brought on, inter alia, by weak external market conditions, the current account defi cit narrowed in 2014-15 from its level a year ago on terms of trade gains and weak import demand. With fi scal consolidation fi rmly underway and with buoyant business optimism, the stage is now set for unshackling stalled investments and for boosting new capital spending in order to accelerate the pace of growth. Drawing on the experience of 2014-15, it is now time to implement an agenda to take the economy to higher growth in 2015-16 and over the medium-term. Concomitantly, recent gains in reducing infl ation pressures need to be built upon so that disinfl ation continues along with higher growth. Importantly, resolute actions are needed to ease stress in fi nancial assets, mitigate/resolve debt burdens so that stranded assets are put back to work quickly wherever feasible and capital buffers are built to enable fi nancial intermediaries to provide adequate fl ow of credit to productive sectors.
ASSESSMENT: 2014-15
I.3 While the pick-up in the growth of GDP at market prices in 2014-15 was largely sustained by private consumption, the decline in the
ASSESSMENT AND PROSPECTSI
For the Year July 1, 2014 to June 30, 2015*
PART ONE: THE ECONOMY - REVIEW AND PROSPECTS
I.1 Over the year gone by, the Indian economy remained resilient in a global environment characterised by falling macroeconomic risks but rising fi nancial stability risks. While a modest recovery is tentatively gaining foothold in advanced economies, activity slowed across a broad swathe of emerging economies as commodity prices fell, fi nancing conditions tightened and structural constraints started building. India is a notable exception. Globally, fi nancial risks increased as investors reached for yields, expecting US monetary policy to normalise more slowly. Incipient threats to fi nancial stability were also evident in rising corporate indebtedness in both advanced and emerging economies, stretched asset valuations in some sectors, marked increase in exchange rate volatility and the debt crisis in Greece in the closing months of 2014-15. Spillovers from these external shocks impacted various segments of the fi nancial markets in India, asset prices and capital fl ows, although the latter remained by and large buoyant.
I.2 Even as banking sector risks remained elevated domestically, the macroeconomic fundamentals of the Indian economy improved gradually over the year, anchored by some easing of infl ation and continuing fi scal consolidation.
* While the Reserve Bank of India’s accounting year is July-June, data on a number of variables are available on a fi nancial year basis, i.e., April-March, and hence, the data are analysed on the basis of the fi nancial year. Where available, the data have been updated beyond March 2015. For the purpose of analysis and for providing proper perspective on policies, reference to past years as also prospective periods, wherever necessary, has been made in this Report.
THE ANNUAL REPORT ON THE WORKING OF THE RESERVE BANK OF INDIA
ANNUAL REPORT
10
rates of saving and investment for the second consecutive year to 2013-14 emerged as a matter of concern. The improvement in the fi nancial saving of households and the expected decline in government dissaving in 2014-15 should work towards releasing the fi nancing constraints on investment, especially when seen in conjunction with the step-up in capital goods production in the latter half of 2014-15.
I.4 On the production side, the weather-induced slowdown in agriculture impacted rural demand and also necessitated policy interventions to manage food price pressures. In the industrial sector, a turnaround in manufacturing in the latter half of the year was essentially driven by upbeat business sentiment, some unclogging of stalled projects and a robust improvement in electricity generation and coal production in the closing months. A durable upturn in new capex, capacity utilisation and new orders – both domestic and foreign – holds the key to a sustained revival of industrial activity. In the services sector, only a few sub-sectors, such as fi nance, real estate and construction, grew at a higher pace.
I.5 From June 2014, infl ation declined faster than initially anticipated. A combination of favourable factors such as the collapse of international commodity prices, particularly of crude, and loss of pricing power among corporates due to weakening demand as well as pro-active supply management and deregulation of key fuel prices worked in alignment with a disinfl ationary monetary policy stance that was set from September 2013. Accordingly, infl ation expectations eased to single digit for the fi rst time since September 2009 and wage pressures moderated.
I.6 A signifi cant factor infl uencing the evolution of monetary conditions during 2014-15 was the large surge in capital infl ows, which necessitated active and nimble liquidity management operations
to sterilise fl ows in accord with the stance of monetary policy. Still sluggish demand, receding infl ation and risk aversion stemming from stress in fi nancial assets restrained bank credit growth and also incentivised substitution of bank lending to take advantage of competitive pricing conditions.
I.7 The revised liquidity management framework introduced in September 2014, and in particular intra-day fi ne-tuning operations, improved, over time, the alignment of money market rates with the policy repo rate. Notably, large spikes in rates hitherto associated with advance tax payments and balance sheet closure were muted. Gilt yields declined, refl ecting the improvement in macro-fundamentals. In the foreign exchange market, two-way movements were associated with lower volatility. Stock markets rallied strongly throughout the year on buoyant investor optimism, both foreign and domestic, stretching valuations before some correction in the closing months of the year.
I.8 While the committed path of fi scal consolidation was adhered to by the central government for the third year in succession, slack revenue mobilisation – particularly through disinvestment – necessitated cutbacks in productive capital expenditure towards the end of the year. This highlights the need for more realistic assessment of revenue targets and expenditure allocations. Furthermore, states need to remain committed to fi scal consolidation.
I.9 The contraction in merchandise exports since December 2014 emerged as an area of concern, sapping aggregate demand and increasing external vulnerability, notwithstanding terms of trade gains and a large saving on POL imports helped contain the current account defi cit. Buoyant capital infl ows in excess of the external fi nancing requirement raised international reserves to an all-time high by the end of the year.
ASSESSMENT AND PROSPECTS
11
PROSPECTS: 2015-16
I.10 Turning to 2015-16, the outlook for the global economy has been adversely impacted by the contraction in output in North America in the fi rst quarter of 2015. In the second and third quarters, there are indications of demand picking up in advanced economies; however, the continuing slowdown in emerging economies holds back a fuller global recovery. At the same time, with hardening bond yields and risk premia, emerging economies are contending with volatile currency movements and capital fl ows. Going forward, these factors could pose risks to the global recovery. Accordingly, the IMF has pared its forecast for global growth in 2015 to 3.3 per cent in its July update, marginally lower than in 2014.
I.11 For the Indian economy, the outlook for growth is improving gradually. Business confi dence remains robust, and as the initiatives announced in the Union Budget to boost investment in infrastructure roll out, they should crowd in private investment and revive consumer sentiment, especially as infl ation ebbs. While the progress of the monsoon has allayed initial fears of moisture shortfall, uncertainty surrounding the progress and distribution of the monsoon remains a risk to the outlook for both growth and infl ation. Comprehensive and pre-emptive food management strategies need to be put in place to contain these spillovers. In the fi rst four months of 2015-16, indicators of real activity have broadly tracked the Reserve Bank’s baseline projection of output growth (at basic prices) at 7.6 per cent for the year as a whole, up from 7.2 per cent in 2014-15.
I.12 Taking into account initial conditions, including the prospects for the monsoon and for international crude prices, the Reserve Bank projected in April 2015 a baseline path for infl ation
in 2015-16 in which it would be pulled down from current levels by base effects till August but is expected to start rising thereafter to below 6.0 per cent by January 2016. So far, infl ation outcomes have closely tracked these projections. The risks to this trajectory are balanced as the weather-related uncertainties are offset by falling crude prices. Infl ation developments will warrant close and continuous monitoring as part of the overall disinfl ation strategy that requires infl ation to be brought down to 5 per cent by January 2017.
I.13 As regards fi scal policy, the Government’s resolve on fi scal consolidation should propel efforts to reach the target for the gross fi scal defi cit for 2015-16 at 3.9 per cent of GDP. In the early months of the year, indirect tax collections have been robust and set to achieve budget estimates, though contingent upon a recovery in manufacturing and services. Furthermore, plans for disinvestment need to be front-loaded to take advantage of supportive market conditions, and also to forestall cutbacks in capital expenditure to meet defi cit targets. Such cut backs compromise the quality of fi scal consolidation. States need to take advantage of the greater fi scal autonomy stemming from higher devolutions and prioritise capital and developmental expenditure so that the quality of sub-national fi scal correction is maintained.
I.14 In the external sector, merchandise exports have contracted through the fi rst four months of 2015-16, rendering the economy vulnerable to external shocks. Imports have remained subdued, primarily refl ecting softening of crude and gold prices. Non-oil non-gold imports have also moderated due to muted domestic activity. Over the rest of the year, some savings may accrue on account of POL and bullion imports; on the other hand, the gradual pick-up in activity anticipated over the rest of the year may revive non-oil non-
ANNUAL REPORT
12
gold import demand. Remittances from Indians working abroad have weathered the slowdown in global growth and should continue to lend support to the balance of payments. Along with a surplus expected on trade in services as in the past, from software exports and travel earnings, the current account defi cit for the year as a whole should be contained below 1.5 per cent of GDP. The outlook for capital fl ows is highly uncertain, with the widely anticipated normalisation of US monetary policy later in 2015 expected to generate capital outfl ows from emerging markets and also to harden fi nancing conditions as bond yields rise. In this context, the level of reserves at over US$ 350 billion and equivalent of about nine months of imports should provide a buffer and smooth out normal import and debt servicing requirements over the year.
I.15 Key to the realisation of these expectations is a durable pick up in investment, supported by sustained efforts to alleviate supply constraints. The proposal to introduce a Comprehensive Bankruptcy Code of global standards by 2015-16 and replacement of the existing multiple prior permission procedure for investments by a pre-existing regulatory mechanism is expected to improve the business environment in India. Easing the doing of business has now become a widely cited constraint on the
revitalisation of manufacturing. Areas that require
signifi cant changes include legal and regulatory
environment, labour market reforms, tax regime
and administrative environment.
I.16 Gaps in distribution networks and
deteriorating fi nancials of power discoms need to
be addressed expeditiously for demand to keep
pace with the ongoing easing of supply constraints.
Focusing on renewable and clean sources of
energy should be accompanied by conservation
of energy as a medium-term strategy.
I.17 Expansion of the avenues for gainful
employment opportunities is vital for efforts to
harness the demographic dividend. This calls
for careful identifi cation of skill gaps, providing
vocational and technical training, and building
of new skills. The National Mission for Skill
Development which aims at consolidating skill
building initiatives spread across several ministries,
is relevant in this context. As self-employment
holds out greater employment opportunities, the
SETU (Self Employment and Talent Utilisation)
initiative for supporting all aspects of start-up
business and other self-employment activities is
crucial. Other initiatives like Digital India and Make
in India will also help to enhance the employment
potential.
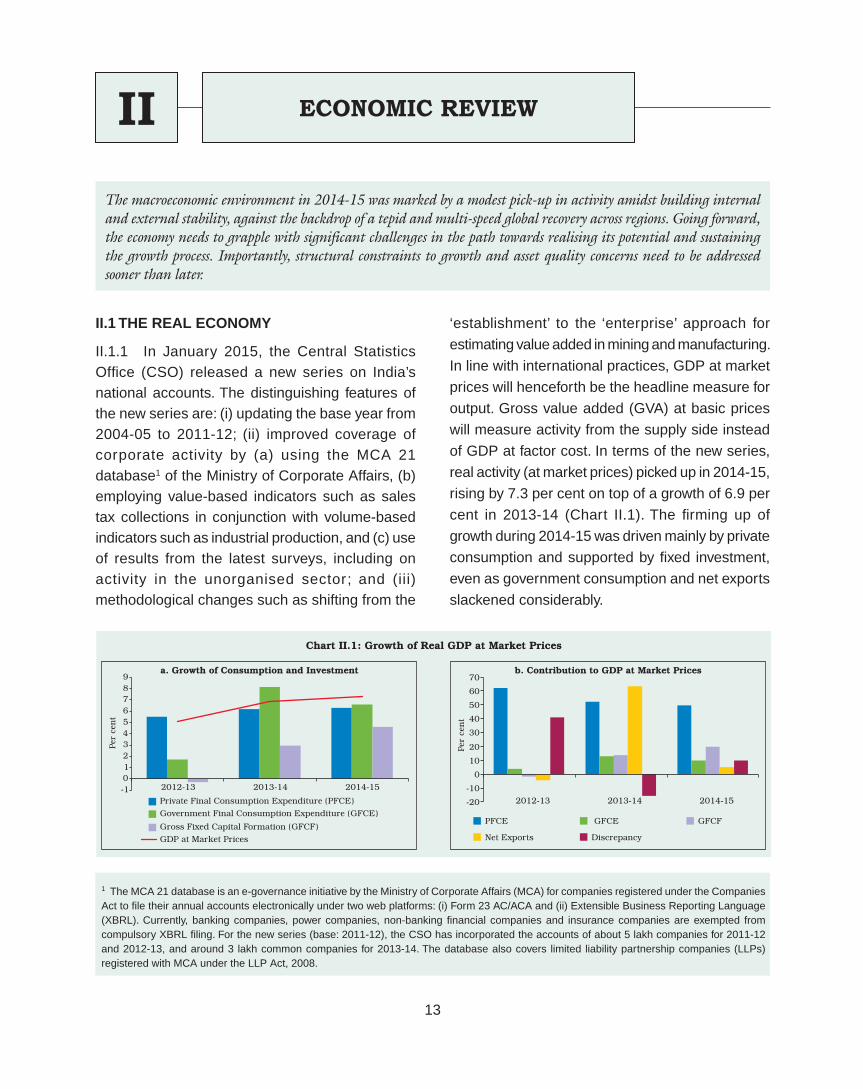
ECONOMIC REVIEW
13
II.1 THE REAL ECONOMY
II.1.1 In January 2015, the Central Statistics Offi ce (CSO) released a new series on India’s national accounts. The distinguishing features of the new series are: (i) updating the base year from 2004-05 to 2011-12; (ii) improved coverage of corporate activity by (a) using the MCA 21 database1 of the Ministry of Corporate Affairs, (b) employing value-based indicators such as sales tax collections in conjunction with volume-based indicators such as industrial production, and (c) use of results from the latest surveys, including on activity in the unorganised sector; and (iii) methodological changes such as shifting from the
‘establishment’ to the ‘enterprise’ approach for
estimating value added in mining and manufacturing.
In line with international practices, GDP at market
prices will henceforth be the headline measure for
output. Gross value added (GVA) at basic prices
will measure activity from the supply side instead
of GDP at factor cost. In terms of the new series,
real activity (at market prices) picked up in 2014-15,
rising by 7.3 per cent on top of a growth of 6.9 per
cent in 2013-14 (Chart II.1). The fi rming up of
growth during 2014-15 was driven mainly by private
consumption and supported by fi xed investment,
even as government consumption and net exports
slackened considerably.
The macroeconomic environment in 2014-15 was marked by a modest pick-up in activity amidst building internal and external stability, against the backdrop of a tepid and multi-speed global recovery across regions. Going forward, the economy needs to grapple with significant challenges in the path towards realising its potential and sustaining the growth process. Importantly, structural constraints to growth and asset quality concerns need to be addressed sooner than later.
ECONOMIC REVIEWII
1 The MCA 21 database is an e-governance initiative by the Ministry of Corporate Affairs (MCA) for companies registered under the Companies Act to fi le their annual accounts electronically under two web platforms: (i) Form 23 AC/ACA and (ii) Extensible Business Reporting Language (XBRL). Currently, banking companies, power companies, non-banking fi nancial companies and insurance companies are exempted from compulsory XBRL fi ling. For the new series (base: 2011-12), the CSO has incorporated the accounts of about 5 lakh companies for 2011-12 and 2012-13, and around 3 lakh common companies for 2013-14. The database also covers limited liability partnership companies (LLPs) registered with MCA under the LLP Act, 2008.
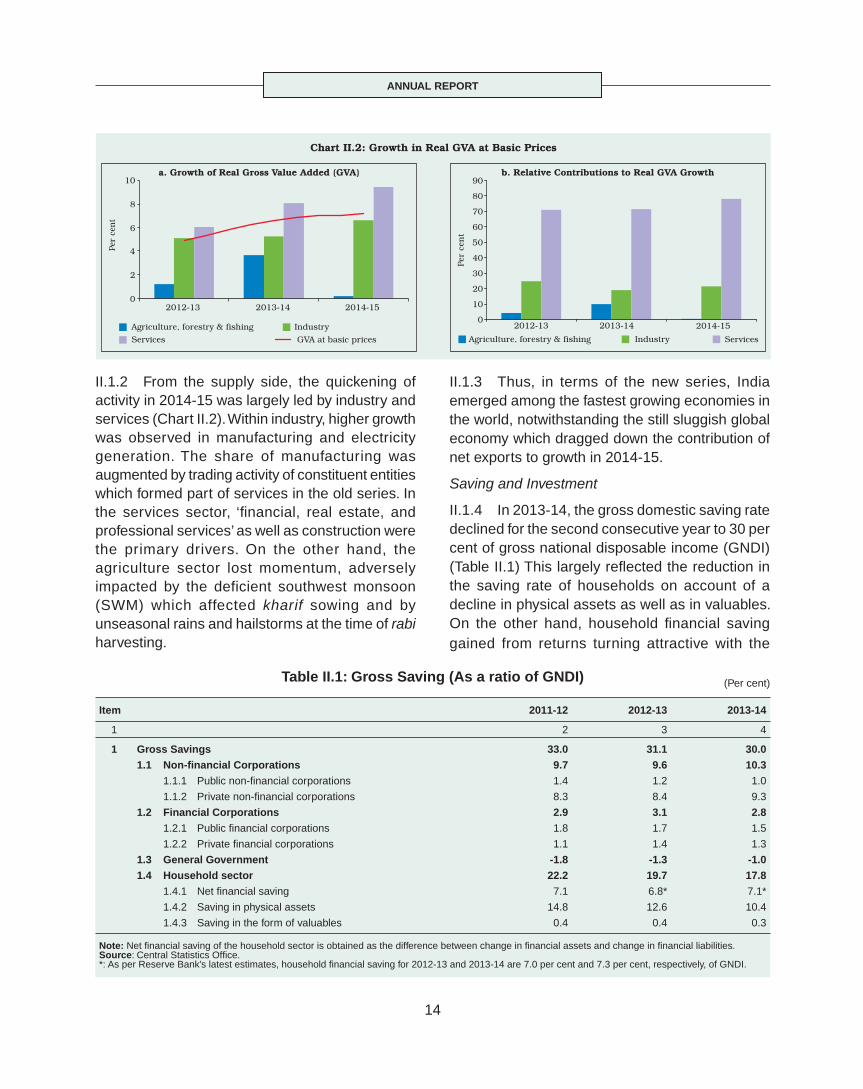
ANNUAL REPORT
14
II.1.2 From the supply side, the quickening of activity in 2014-15 was largely led by industry and services (Chart II.2). Within industry, higher growth was observed in manufacturing and electricity generation. The share of manufacturing was augmented by trading activity of constituent entities which formed part of services in the old series. In the services sector, ‘fi nancial, real estate, and professional services’ as well as construction were the primary drivers. On the other hand, the agriculture sector lost momentum, adversely impacted by the deficient southwest monsoon (SWM) which affected kharif sowing and by unseasonal rains and hailstorms at the time of rabi harvesting.
II.1.3 Thus, in terms of the new series, India emerged among the fastest growing economies in the world, notwithstanding the still sluggish global economy which dragged down the contribution of net exports to growth in 2014-15.
Saving and Investment
II.1.4 In 2013-14, the gross domestic saving rate declined for the second consecutive year to 30 per cent of gross national disposable income (GNDI) (Table II.1) This largely refl ected the reduction in the saving rate of households on account of a decline in physical assets as well as in valuables. On the other hand, household fi nancial saving gained from returns turning attractive with the
Table II.1: Gross Saving (As a ratio of GNDI) (Per cent)
Item 2011-12 2012-13 2013-14
1 2 3 4
1 Gross Savings 33.0 31.1 30.01.1 Non-fi nancial Corporations 9.7 9.6 10.3
1.1.1 Public non-fi nancial corporations 1.4 1.2 1.0
1.1.2 Private non-fi nancial corporations 8.3 8.4 9.3
1.2 Financial Corporations 2.9 3.1 2.81.2.1 Public fi nancial corporations 1.8 1.7 1.5
1.2.2 Private fi nancial corporations 1.1 1.4 1.3
1.3 General Government -1.8 -1.3 -1.01.4 Household sector 22.2 19.7 17.8
1.4.1 Net fi nancial saving 7.1 6.8* 7.1*
1.4.2 Saving in physical assets 14.8 12.6 10.4
1.4.3 Saving in the form of valuables 0.4 0.4 0.3
Note: Net fi nancial saving of the household sector is obtained as the difference between change in fi nancial assets and change in fi nancial liabilities. Source: Central Statistics Offi ce. *: As per Reserve Bank’s latest estimates, household fi nancial saving for 2012-13 and 2013-14 are 7.0 per cent and 7.3 per cent, respectively, of GNDI.

ECONOMIC REVIEW
15
moderation in infl ation as well as the pick-up in economic activity. For 2014-15, CSO has not yet released its estimates of gross saving. However, in terms of the Reserve Bank’s preliminary estimates, household fi nancial saving is placed at 7.5 per cent of GNDI in 2014-15, up from 7.3 per cent in 2013-14.
II.1.5 As regards the saving rate of the private corporate sector, non-fi nancial corporations posted a near-steady improvement since 2011-12, i.e., since the new series is available, but it appears that this increase may not have sustained in 2014-15. Private fi nancial corporations, on the other hand, underwent some erosion in saving rates in 2013-14, partly refl ecting the slowdown in the growth of operating profi ts of private sector banks. Available indicators suggest that this has been recouped in 2014-15.
II.1.6 The ongoing reduction in ‘dissaving’ of the general government boosted the gross national saving rate in 2013-14. With the perseverance of fi scal consolidation, especially by the centre, the decline in the dissaving of the government sector has likely continued into 2014-15. There was, however, a decline in the saving rate of the public fi nancial (including public sector banks) and non-fi nancial corporations in 2013-14. In case of public sector banks, there was a decline in profi t after tax during 2014-15.
II.1.7 The investment rate (gross capital formation as a proportion to GDP at current market prices) declined in 2012-13 and 2013-14, largely reflecting the slackening in the non-financial corporations’ investment rate on account of weak domestic and external demand and other structural factors such as delay in land acquisition and environment clearances, weak business confi dence and policy uncertainties. The household sector’s investment rate also declined in 2012-13 and 2013-14. The improvement in general government investment in 2013-14 did, however, provide some offset (Chart II.3).
II.1.8 Viewed in conjunction with other indicators of investment activity such as stalled projects,
capital goods imports/production and capex spending, the decline in the private investment intention appears to have become more pronounced in 2014-15 relative to the preceding year. As per the Reserve Bank’s data on new projects which were sanctioned fi nancial assistance by banks/fi nancial institutions (FIs) or funded through external commercial borrowings (ECBs)/foreign currency convertible bonds (FCCBs)/domestic capital market issuance, investment intentions for such projects aggregated to `1,459 billion during 2014-15 as against `2,081 billion in the previous year. A turnaround in the investment demand cycle, therefore, assumes critical importance to steer the economy on to a sustainable high growth trajectory. The recent experience suggests that a strong step-up in public investment may be required to dispel the inertia constraining private investment and to crowd it in, given the robust business sentiment. Key to this effort will be putting stranded investments in stalled projects back to work while ensuring the availability of key inputs such as power, land (especially for roads) and skilled labour. Steadfast implementation of structural reforms like the goods and services tax (GST) is also required to reinvigorate productivity and competitiveness.
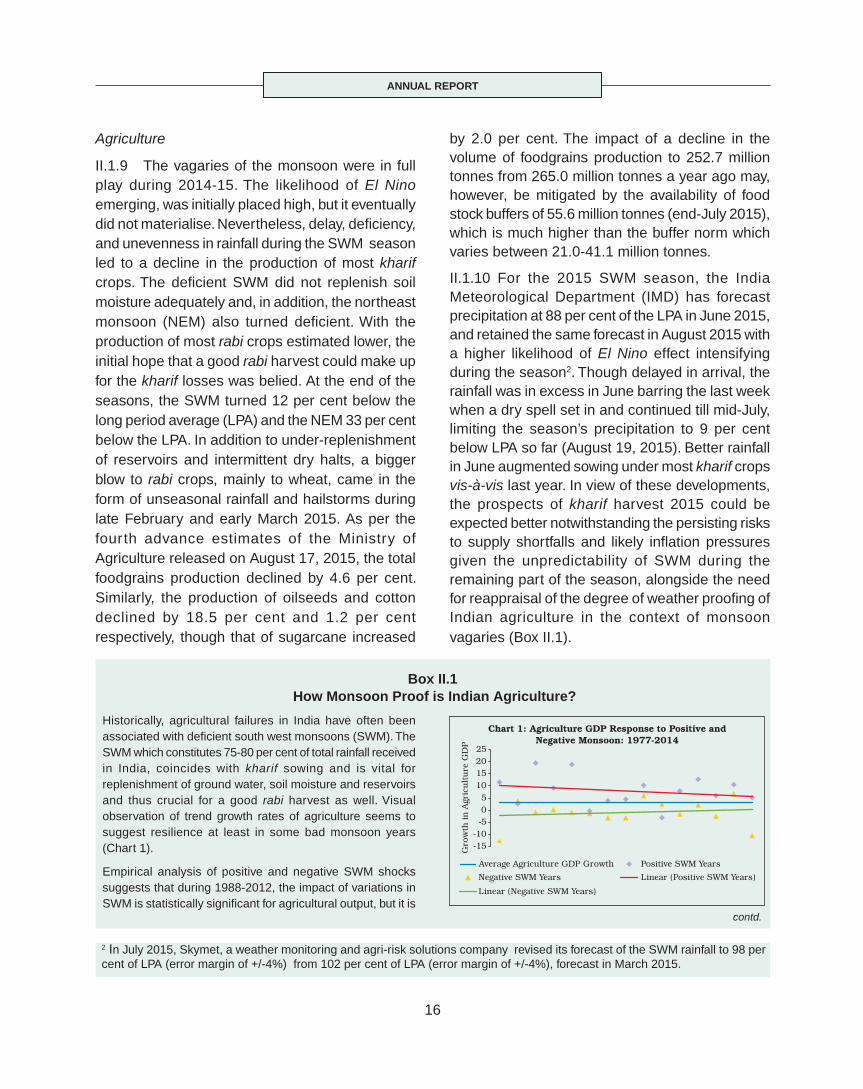
ANNUAL REPORT
16
Agriculture
II.1.9 The vagaries of the monsoon were in full play during 2014-15. The likelihood of El Nino emerging, was initially placed high, but it eventually did not materialise. Nevertheless, delay, defi ciency, and unevenness in rainfall during the SWM season led to a decline in the production of most kharif crops. The defi cient SWM did not replenish soil moisture adequately and, in addition, the northeast monsoon (NEM) also turned defi cient. With the production of most rabi crops estimated lower, the initial hope that a good rabi harvest could make up for the kharif losses was belied. At the end of the seasons, the SWM turned 12 per cent below the long period average (LPA) and the NEM 33 per cent below the LPA. In addition to under-replenishment of reservoirs and intermittent dry halts, a bigger blow to rabi crops, mainly to wheat, came in the form of unseasonal rainfall and hailstorms during late February and early March 2015. As per the fourth advance estimates of the Ministry of Agriculture released on August 17, 2015, the total foodgrains production declined by 4.6 per cent. Similarly, the production of oilseeds and cotton declined by 18.5 per cent and 1.2 per cent respectively, though that of sugarcane increased
by 2.0 per cent. The impact of a decline in the volume of foodgrains production to 252.7 million tonnes from 265.0 million tonnes a year ago may, however, be mitigated by the availability of food stock buffers of 55.6 million tonnes (end-July 2015), which is much higher than the buffer norm which varies between 21.0-41.1 million tonnes.
II.1.10 For the 2015 SWM season, the India Meteorological Department (IMD) has forecast precipitation at 88 per cent of the LPA in June 2015, and retained the same forecast in August 2015 with a higher likelihood of El Nino effect intensifying during the season2. Though delayed in arrival, the rainfall was in excess in June barring the last week when a dry spell set in and continued till mid-July, limiting the season’s precipitation to 9 per cent below LPA so far (August 19, 2015). Better rainfall in June augmented sowing under most kharif crops vis-à-vis last year. In view of these developments, the prospects of kharif harvest 2015 could be expected better notwithstanding the persisting risks to supply shortfalls and likely infl ation pressures given the unpredictability of SWM during the remaining part of the season, alongside the need for reappraisal of the degree of weather proofi ng of Indian agriculture in the context of monsoon vagaries (Box II.1).
Box II.1 How Monsoon Proof is Indian Agriculture?
Historically, agricultural failures in India have often been associated with defi cient south west monsoons (SWM). The SWM which constitutes 75-80 per cent of total rainfall received in India, coincides with kharif sowing and is vital for replenishment of ground water, soil moisture and reservoirs and thus crucial for a good rabi harvest as well. Visual observation of trend growth rates of agriculture seems to suggest resilience at least in some bad monsoon years (Chart 1).
Empirical analysis of positive and negative SWM shocks suggests that during 1988-2012, the impact of variations in SWM is statistically signifi cant for agricultural output, but it is
2 In July 2015, Skymet, a weather monitoring and agri-risk solutions company revised its forecast of the SWM rainfall to 98 per cent of LPA (error margin of +/-4%) from 102 per cent of LPA (error margin of +/-4%), forecast in March 2015.
contd.
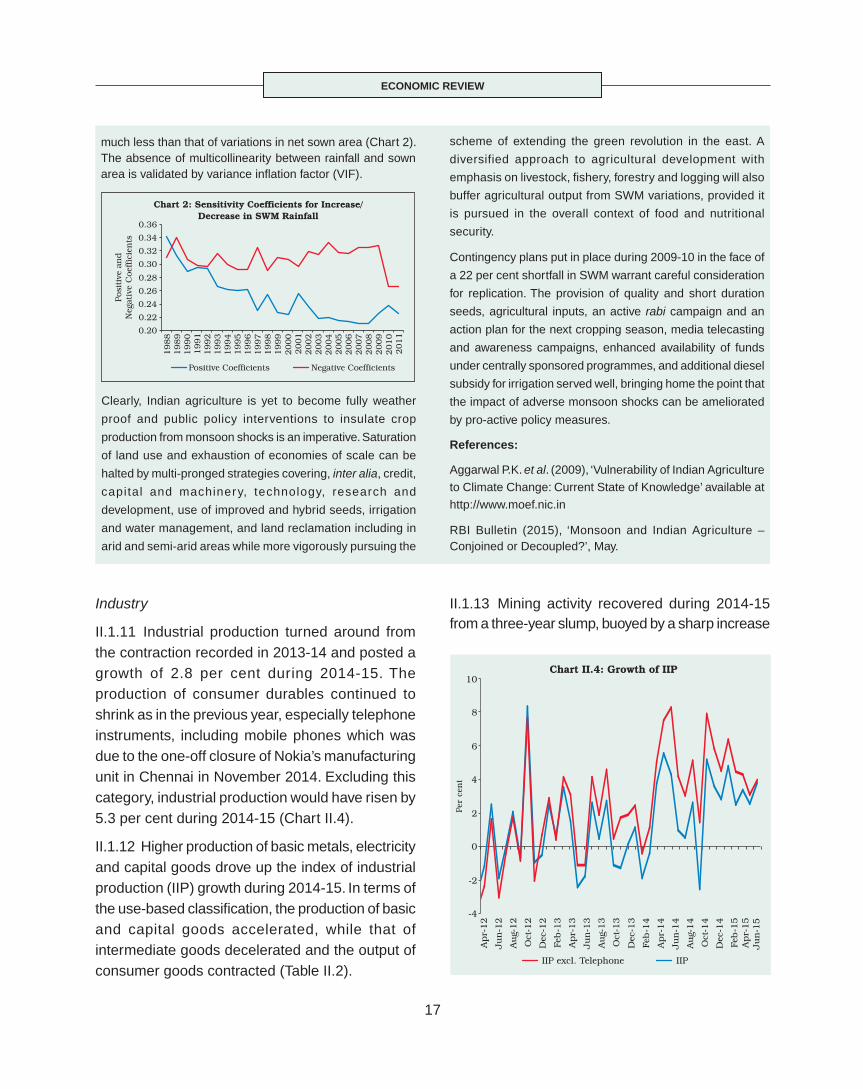
ECONOMIC REVIEW
17
Industry
II.1.11 Industrial production turned around from the contraction recorded in 2013-14 and posted a growth of 2.8 per cent during 2014-15. The production of consumer durables continued to shrink as in the previous year, especially telephone instruments, including mobile phones which was due to the one-off closure of Nokia’s manufacturing unit in Chennai in November 2014. Excluding this category, industrial production would have risen by 5.3 per cent during 2014-15 (Chart II.4).
II.1.12 Higher production of basic metals, electricity and capital goods drove up the index of industrial production (IIP) growth during 2014-15. In terms of the use-based classifi cation, the production of basic and capital goods accelerated, while that of intermediate goods decelerated and the output of consumer goods contracted (Table II.2).
II.1.13 Mining activity recovered during 2014-15 from a three-year slump, buoyed by a sharp increase
much less than that of variations in net sown area (Chart 2). The absence of multicollinearity between rainfall and sown area is validated by variance infl ation factor (VIF).
Clearly, Indian agriculture is yet to become fully weather
proof and public policy interventions to insulate crop
production from monsoon shocks is an imperative. Saturation
of land use and exhaustion of economies of scale can be
halted by multi-pronged strategies covering, inter alia, credit,
capital and machinery, technology, research and
development, use of improved and hybrid seeds, irrigation
and water management, and land reclamation including in
arid and semi-arid areas while more vigorously pursuing the
scheme of extending the green revolution in the east. A
diversified approach to agricultural development with
emphasis on livestock, fi shery, forestry and logging will also
buffer agricultural output from SWM variations, provided it
is pursued in the overall context of food and nutritional
security.
Contingency plans put in place during 2009-10 in the face of
a 22 per cent shortfall in SWM warrant careful consideration
for replication. The provision of quality and short duration
seeds, agricultural inputs, an active rabi campaign and an
action plan for the next cropping season, media telecasting
and awareness campaigns, enhanced availability of funds
under centrally sponsored programmes, and additional diesel
subsidy for irrigation served well, bringing home the point that
the impact of adverse monsoon shocks can be ameliorated
by pro-active policy measures.
References:
Aggarwal P.K. et al. (2009), ‘Vulnerability of Indian Agriculture
to Climate Change: Current State of Knowledge’ available at
http://www.moef.nic.in
RBI Bulletin (2015), ‘Monsoon and Indian Agriculture – Conjoined or Decoupled?’, May.
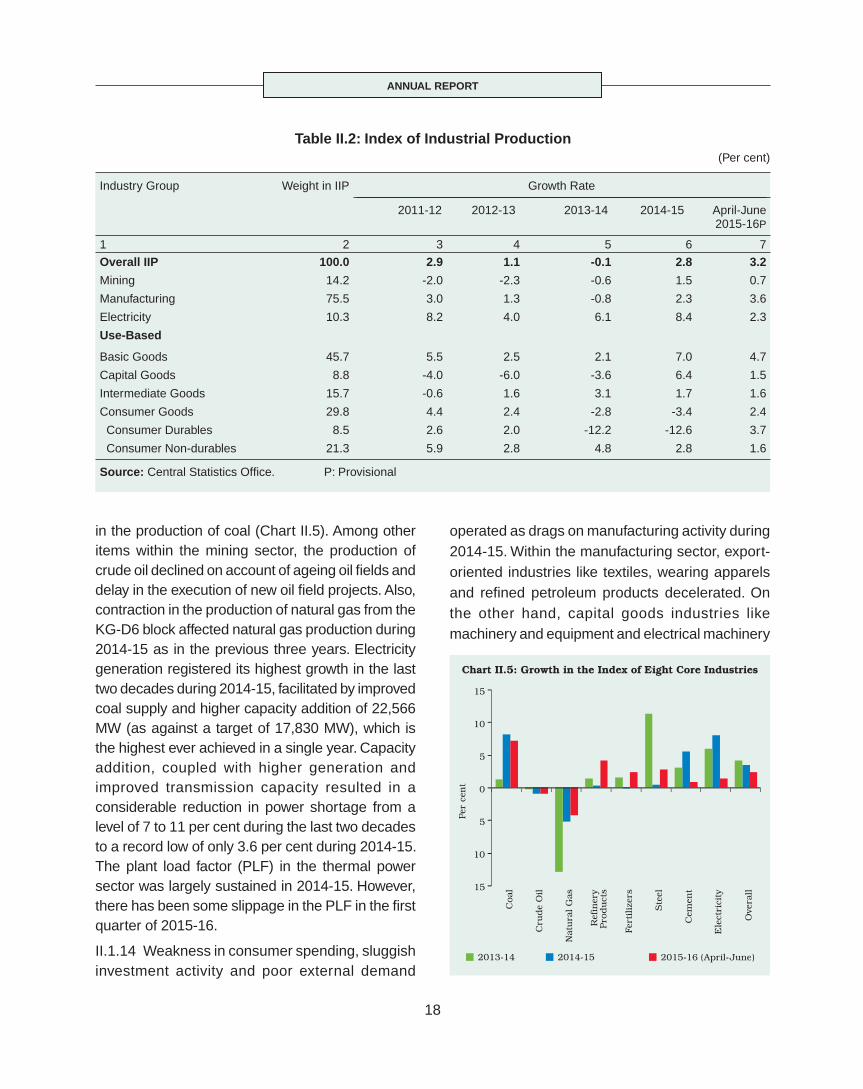
ANNUAL REPORT
18
in the production of coal (Chart II.5). Among other items within the mining sector, the production of crude oil declined on account of ageing oil fi elds and delay in the execution of new oil fi eld projects. Also, contraction in the production of natural gas from the KG-D6 block affected natural gas production during 2014-15 as in the previous three years. Electricity generation registered its highest growth in the last two decades during 2014-15, facilitated by improved coal supply and higher capacity addition of 22,566 MW (as against a target of 17,830 MW), which is the highest ever achieved in a single year. Capacity addition, coupled with higher generation and improved transmission capacity resulted in a considerable reduction in power shortage from a level of 7 to 11 per cent during the last two decades to a record low of only 3.6 per cent during 2014-15. The plant load factor (PLF) in the thermal power sector was largely sustained in 2014-15. However, there has been some slippage in the PLF in the fi rst quarter of 2015-16.
II.1.14 Weakness in consumer spending, sluggish investment activity and poor external demand
operated as drags on manufacturing activity during 2014-15. Within the manufacturing sector, export-oriented industries like textiles, wearing apparels and refi ned petroleum products decelerated. On the other hand, capital goods industries like machinery and equipment and electrical machinery
Table II.2: Index of Industrial Production(Per cent)
Industry Group Weight in IIP Growth Rate
2011-12 2012-13 2013-14 2014-15 April-June2015-16P
1 2 3 4 5 6 7
Overall IIP 100.0 2.9 1.1 -0.1 2.8 3.2
Mining 14.2 -2.0 -2.3 -0.6 1.5 0.7
Manufacturing 75.5 3.0 1.3 -0.8 2.3 3.6
Electricity 10.3 8.2 4.0 6.1 8.4 2.3
Use-Based
Basic Goods 45.7 5.5 2.5 2.1 7.0 4.7
Capital Goods 8.8 -4.0 -6.0 -3.6 6.4 1.5
Intermediate Goods 15.7 -0.6 1.6 3.1 1.7 1.6
Consumer Goods 29.8 4.4 2.4 -2.8 -3.4 2.4
Consumer Durables 8.5 2.6 2.0 -12.2 -12.6 3.7
Consumer Non-durables 21.3 5.9 2.8 4.8 2.8 1.6
Source: Central Statistics Offi ce. P: Provisional
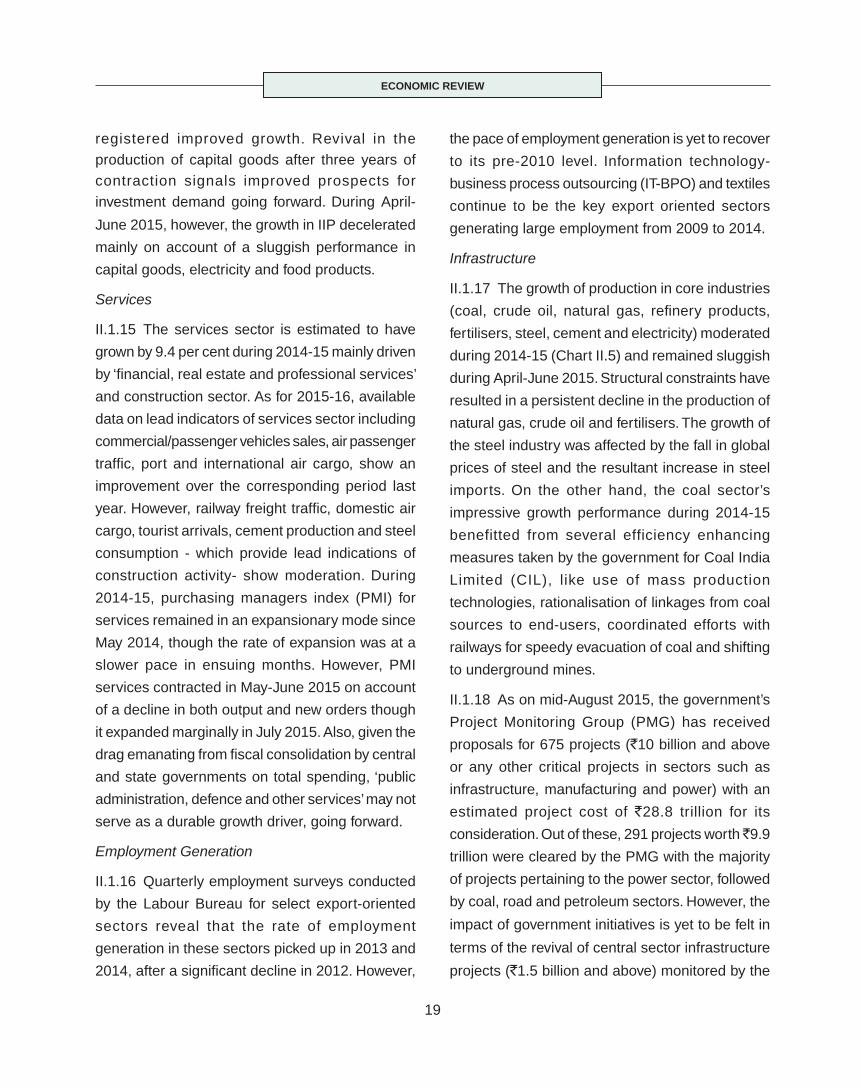
ECONOMIC REVIEW
19
registered improved growth. Revival in the production of capital goods after three years of contraction signals improved prospects for investment demand going forward. During April-
June 2015, however, the growth in IIP decelerated
mainly on account of a sluggish performance in
capital goods, electricity and food products.
Services
II.1.15 The services sector is estimated to have
grown by 9.4 per cent during 2014-15 mainly driven
by ‘fi nancial, real estate and professional services’
and construction sector. As for 2015-16, available
data on lead indicators of services sector including
commercial/passenger vehicles sales, air passenger
traffi c, port and international air cargo, show an
improvement over the corresponding period last
year. However, railway freight traffi c, domestic air
cargo, tourist arrivals, cement production and steel
consumption - which provide lead indications of
construction activity- show moderation. During
2014-15, purchasing managers index (PMI) for
services remained in an expansionary mode since
May 2014, though the rate of expansion was at a
slower pace in ensuing months. However, PMI
services contracted in May-June 2015 on account
of a decline in both output and new orders though
it expanded marginally in July 2015. Also, given the
drag emanating from fi scal consolidation by central
and state governments on total spending, ‘public
administration, defence and other services’ may not
serve as a durable growth driver, going forward.
Employment Generation
II.1.16 Quarterly employment surveys conducted
by the Labour Bureau for select export-oriented
sectors reveal that the rate of employment
generation in these sectors picked up in 2013 and
2014, after a signifi cant decline in 2012. However,
the pace of employment generation is yet to recover
to its pre-2010 level. Information technology-
business process outsourcing (IT-BPO) and textiles
continue to be the key export oriented sectors
generating large employment from 2009 to 2014.
Infrastructure
II.1.17 The growth of production in core industries
(coal, crude oil, natural gas, refi nery products,
fertilisers, steel, cement and electricity) moderated
during 2014-15 (Chart II.5) and remained sluggish
during April-June 2015. Structural constraints have
resulted in a persistent decline in the production of
natural gas, crude oil and fertilisers. The growth of
the steel industry was affected by the fall in global
prices of steel and the resultant increase in steel
imports. On the other hand, the coal sector’s
impressive growth performance during 2014-15
benefitted from several efficiency enhancing
measures taken by the government for Coal India
Limited (CIL), like use of mass production
technologies, rationalisation of linkages from coal
sources to end-users, coordinated efforts with
railways for speedy evacuation of coal and shifting
to underground mines.
II.1.18 As on mid-August 2015, the government’s
Project Monitoring Group (PMG) has received
proposals for 675 projects (`10 billion and above
or any other critical projects in sectors such as
infrastructure, manufacturing and power) with an
estimated project cost of `28.8 trillion for its
consideration. Out of these, 291 projects worth ̀ 9.9
trillion were cleared by the PMG with the majority
of projects pertaining to the power sector, followed
by coal, road and petroleum sectors. However, the
impact of government initiatives is yet to be felt in
terms of the revival of central sector infrastructure
projects (`1.5 billion and above) monitored by the
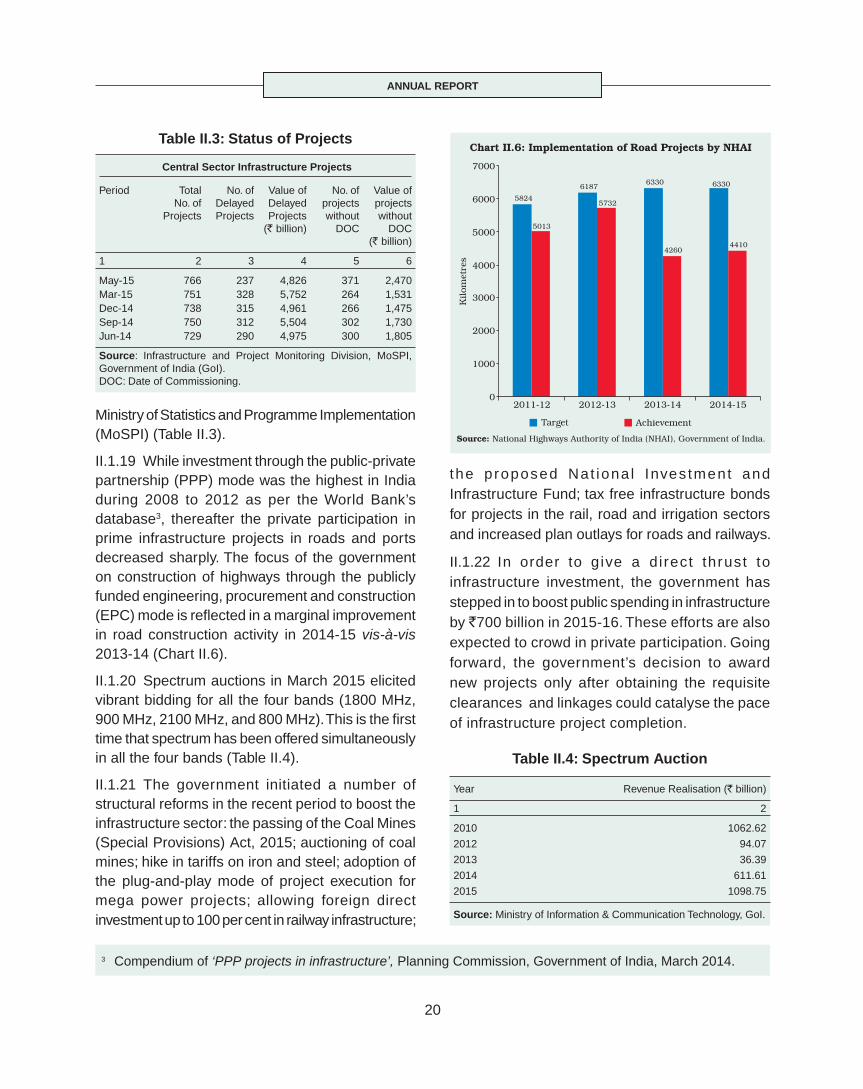
ANNUAL REPORT
20
Table II.3: Status of Projects
Central Sector Infrastructure Projects
Period TotalNo. of
Projects
No. of Delayed Projects
Value of Delayed Projects
(` billion)
No. of projects without
DOC
Value of projects without
DOC(` billion)
1 2 3 4 5 6
May-15 766 237 4,826 371 2,470Mar-15 751 328 5,752 264 1,531Dec-14 738 315 4,961 266 1,475Sep-14 750 312 5,504 302 1,730Jun-14 729 290 4,975 300 1,805
Source: Infrastructure and Project Monitoring Division, MoSPI, Government of India (GoI).DOC: Date of Commissioning.
Ministry of Statistics and Programme Implementation (MoSPI) (Table II.3).
II.1.19 While investment through the public-private partnership (PPP) mode was the highest in India during 2008 to 2012 as per the World Bank’s database3, thereafter the private participation in prime infrastructure projects in roads and ports decreased sharply. The focus of the government on construction of highways through the publicly funded engineering, procurement and construction (EPC) mode is refl ected in a marginal improvement in road construction activity in 2014-15 vis-à-vis 2013-14 (Chart II.6).
II.1.20 Spectrum auctions in March 2015 elicited vibrant bidding for all the four bands (1800 MHz, 900 MHz, 2100 MHz, and 800 MHz). This is the fi rst time that spectrum has been offered simultaneously in all the four bands (Table II.4).
II.1.21 The government initiated a number of structural reforms in the recent period to boost the infrastructure sector: the passing of the Coal Mines (Special Provisions) Act, 2015; auctioning of coal mines; hike in tariffs on iron and steel; adoption of the plug-and-play mode of project execution for mega power projects; allowing foreign direct investment up to 100 per cent in railway infrastructure;
the proposed Nat iona l Inves tment and Infrastructure Fund; tax free infrastructure bonds for projects in the rail, road and irrigation sectors and increased plan outlays for roads and railways.
II.1.22 In order to g ive a d i rect thrust to infrastructure investment, the government has stepped in to boost public spending in infrastructure by `700 billion in 2015-16. These efforts are also expected to crowd in private participation. Going forward, the government’s decision to award new projects only after obtaining the requisite clearances and linkages could catalyse the pace of infrastructure project completion.
Table II.4: Spectrum Auction
Year Revenue Realisation (` billion)
1 2
2010 1062.62
2012 94.07
2013 36.39
2014 611.61
2015 1098.75
Source: Ministry of Information & Communication Technology, GoI.
3 Compendium of ‘PPP projects in infrastructure’, Planning Commission, Government of India, March 2014.

ECONOMIC REVIEW
21
II.2 PRICE SITUATION
II.2.1 The year 2014-15 marked a turning point
in the evolution of price-cost dynamics in India. In
January 2014, the stance of monetary policy was
anchored to a path of disinfl ation that would take
infl ation (measured in terms of y-o-y changes in
the all India consumer price index (combined) or
CPI-C, base 2010 =100) down from 8.6 per cent
to below 8 per cent by January 2015 and to below
6 per cent by January 2016. This stance was
backed by policy rate increases of 25 basis points
each in September 2013, October 2013 and
January 2014. Although unseasonal food price
spikes owing to weather-related transportation
disruptions in north India kept infl ation stubbornly
high till July 2014, steadfast perseverance with the
anti-inflationary monetary policy allowed rate
increases in the second half of 2013-14 to feed
through into the economy. Aided by a range of
supply management strategies and a dramatic
plunge in international commodity prices1 by 28
per cent between September 2014 and February
2015, infl ation persistence (near double digit CPI
inflation for six consecutive years) was finally
broken and headline infl ation started easing from
August 2014. The abatement in food price
pressures contributed 76 per cent to the decline in
infl ation between July and November 2014. By April
2015, it had declined to 4.9 per cent measured by
the new CPI series (base 2012=100), thus
confi rming that disinfl ation was getting entrenched.
Notwithstanding an uptick in June 2015 to 5.4 per
cent, largely refl ecting fuel price adjustments and
short-term food price pressures, infl ation moderated
signifi cantly to 3.8 per cent in July 2015. Importantly,
infl ation excluding food and fuel almost halved from
8.3 per cent in May 2014 to 4.2 per cent in March
2015, providing abiding momentum to the
disinflation process. However, this moved
signifi cantly up to 5.0 per cent in June 2015 before
falling to 4.5 per cent in July 2015. By December
2014, households’ infl ation expectations (both
three months ahead and one-year ahead), which
had been ruling in double digits persistently since
September 2009, eased to single digit.
II.2.2 Average infl ation at 5.9 per cent during
2014-15 turned out to be signifi cantly lower than
9.5 per cent a year ago (Chart II.7). Intra-year
movements in infl ation during 2014-15, however,
exhibited three distinct phases – fi rst, weather-
related vegetable price pressures till August;
second, the subsequent fall in food prices and
pass-through of declining global commodity prices
into food, fuel and services prices, resulting in a
major shift in the inflation trajectory that took
infl ation down to an intra-year low of 3.3 per cent
in November 2014; and finally the reversal of
favourable base effect, which pushed infl ation up
1 As measured by IMF’s primary commodity price index.
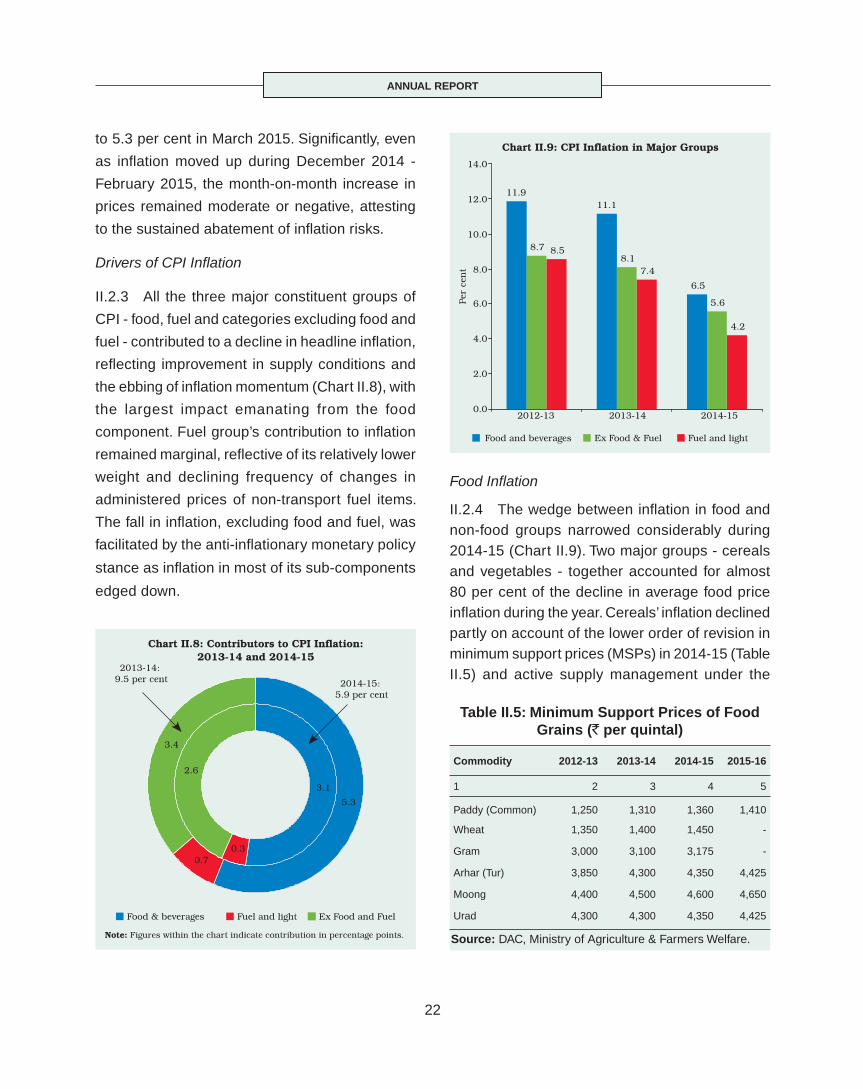
ANNUAL REPORT
22
to 5.3 per cent in March 2015. Signifi cantly, even
as infl ation moved up during December 2014 -
February 2015, the month-on-month increase in
prices remained moderate or negative, attesting
to the sustained abatement of infl ation risks.
Drivers of CPI Infl ation
II.2.3 All the three major constituent groups of
CPI - food, fuel and categories excluding food and
fuel - contributed to a decline in headline infl ation,
refl ecting improvement in supply conditions and
the ebbing of infl ation momentum (Chart II.8), with
the largest impact emanating from the food
component. Fuel group’s contribution to infl ation
remained marginal, refl ective of its relatively lower
weight and declining frequency of changes in
administered prices of non-transport fuel items.
The fall in infl ation, excluding food and fuel, was
facilitated by the anti-infl ationary monetary policy
stance as infl ation in most of its sub-components
edged down.
Food Infl ation
II.2.4 The wedge between infl ation in food and non-food groups narrowed considerably during 2014-15 (Chart II.9). Two major groups - cereals and vegetables - together accounted for almost 80 per cent of the decline in average food price infl ation during the year. Cereals’ infl ation declined partly on account of the lower order of revision in minimum support prices (MSPs) in 2014-15 (Table II.5) and active supply management under the
Table II.5: Minimum Support Prices of Food Grains (` per quintal)
Commodity 2012-13 2013-14 2014-15 2015-16
1 2 3 4 5
Paddy (Common) 1,250 1,310 1,360 1,410
Wheat 1,350 1,400 1,450 -
Gram 3,000 3,100 3,175 -
Arhar (Tur) 3,850 4,300 4,350 4,425
Moong 4,400 4,500 4,600 4,650
Urad 4,300 4,300 4,350 4,425
Source: DAC, Ministry of Agriculture & Farmers Welfare.

ECONOMIC REVIEW
23
public distribution system (PDS), including the open market sale of wheat. Vegetable prices shrugged off bouts of weather-related volatility in
H1 of 2014-15 and declined relatively faster in H2
of 2014-15 with policy actions taken to discourage
stockpiling, and bringing vegetables under the
Essential Commodities Act (ECA). Sugar prices
moderated in tandem with global prices, but
protein-rich items (eggs, fish, meat, milk and
pulses) exhibited downward rigidity in infl ation,
refl ecting structural mismatches between demand
and supply.
II.2.5 A number of policy initiatives were taken
to improve both supply chain and post-harvest
crop management. These included issuing
advisories to states to enable free movement of
fruits and vegetables by delisting them from the
Agricultural Produce Marketing Committee
(APMC) Act; bringing onions and potatoes under
the purview of ECA, thereby allowing state
governments to impose stock limits so as to deal
with cartelisation and hoarding and making
violation of stock limits a non-bailable offence.
Imposing a minimum export price (MEP) of US$
450 per metric tonne (MT) for potatoes with effect
from June 26, 2014 and US$ 300 per MT for onions
with effect from August 21, 2014 also helped in
maintaining domestic supplies of these perishable
items.
Fuel Group Infl ation
II.2.6 From August 2014, crude oil prices fell but
the full pass-through of this decline was impeded
by lingering under-recoveries of the oil marketing
companies (OMCs) (Table II.6). Further, the
government increased the excise duty on petrol
and diesel cumulatively by ̀ 7.75 per litre for petrol
and `6.50 per litre for diesel during November
2014 - January 2015, which partially offset the
overall fall in prices. In case of coal, Indian prices
have historically remained substantially lower than
the global prices. Therefore, the decline in global
coal prices during 2014-15 resulted in bridging the
gap between global and domestic prices rather
than a fall in domestic prices. Since the CPI fuel
group includes a number of items, such as
electricity and kerosene whose prices are
administered, prices in this category remained
sticky (Chart II.10).
Table II.6: Under-recoveries of Oil Marketing Companies
(` billion)
Product 2013-14 2014-15
1 2 3
Diesel 628 109
PDS Kerosene 306 248
Domestic LPG 465 366
Total 1,399 723
Source: PPAC, Ministry of Petroleum & Natural Gas.

ANNUAL REPORT
24
Infl ation Excluding Food and Fuel
II.2.7 Prices in respect of the transport and
communication sub-group declined in tandem with
softening of global crude oil prices. By the end of
the year, the transport and communication
category contributed negatively to infl ation (Chart
II.11). Also, housing infl ation showed a much more
signifi cant moderation under the new series (base 2012=100) partly on account of methodological improvements, which included doubling the sample size for collection of rentals data from 6,684 rented dwellings in the old series to 13,368 in the revised series. Inflation in services components, such as health, education and household requisites declined, reflecting a slowdown in wage growth.
Rural Wage Growth Moderated
II.2.8 Input cost pressures from fuel, farm inputs and rural wages ebbed signifi cantly during 2014-15. After the high and unprecedented rise in rural wages during 2007-08 to 2012-13, the recent slowdown in wage growth has evoked academic
and policy interest. Average wage growth, as per
the new wage series, for November 2014 to May
2015, remained at 3.9 per cent for agricultural and
5.7 per cent for non-agricultural occupations,
respectively. This was substantially lower than the
annual average rate of 16 per cent for agricultural
occupations and 14 per cent for non-agricultural
occupations during the six-year period from 2007
to 2013. However, the role of productivity will have
to be examined carefully while assessing the
durability of the impact of the changes in wage
growth on infl ation (Box II.2).
Wholesale Price Infl ation
II.2.9 Infl ation measured by the wholesale price
index (WPI) declined signifi cantly during 2014-15.
Since November 2014, wholesale prices have
moved into contraction [(-) 4.1 per cent in July
2015, y-o-y] (Chart II.12). Prices of non-food
manufactured products also contracted in July
2015 [(-) 1.4 per cent, y-o-y], indicating the extent
of slack in the economy as well as falling cost
pressures.
Global Commodity Prices and Supply Conditions
II.2.10 Global commodity prices declined sharply
amidst improved supply, large spare capacity and
weak demand conditions in 2014-15 (Chart II.13). During the initial part of the year, crude oil prices
hardened on account of supply outages in Libya,
Nigeria and Syria. From August 2014, global
crude oil prices fell substantially, driven by
abundant supplies of North American shale oil
and the Organisation of Petroleum Exporting
Countries’ (OPEC) decision not to cut production
at its November 2014 meeting. Global crude oil
prices reached a trough of US$ 47 per barrel

ECONOMIC REVIEW
25
Box II.2Wage Growth and Rural Infl ation – Are They Related?
An increase in rural wages can infl uence prices, both by
increasing demand and pushing up the cost of production.
On the other hand, wage growth in itself could respond to
high price increases, particularly food price increases. The
wage-infl ation nexus also works through productivity - as
labour productivity increases, wages rise. An increase in
labour productivity will reduce unit labour cost, which is the
average cost of labour per unit of output (usually calculated
as the ratio of total labour costs to real output) and therefore,
it will be possible to pay a higher wage without an increase
in fi nal output price. On the other hand, if wage increases
are unaccompanied by productivity increases, rise in unit
labour costs will lead to further increase in output prices and
hence infl ation. This dynamics is more complex in a regional
perspective, where there is large heterogeneity in product
and labour markets.
A comparison between agricultural labour productivity and
agricultural wages at the all-India level as well as for major
states is insightful. Real wage growth, i.e., growth in
agricultural wages adjusted for CPI - agricultural labourers
(AL) infl ation, remained moderate during 1999-00 to 2009-
10. Subsequently, it went up sharply during 2009-10 to
2011-12 (Chart 1). This trend was broad-based and
observed in major agricultural states like Bihar, Maharashtra,
Madhya Pradesh, Tamil Nadu and Uttar Pradesh.
Agricultural labour productivity declined in some states
over the period from 1999-2000 to 2004-05, but went up
subsequently during the period 2009-10 to 2011-12 at the
all-India level as well as for major states (Chart 2). The
productivity improvement was partly contributed by a shift
in labour force from agricultural to non-agricultural
occupations, which led to a decline in the total number of
persons engaged in agriculture in 2011-12 vis-à-vis 2004-
05. Thus, the sharp increase in real wages in recent years
was partly offset by a rise in productivity. The impact of
rural wage increases on rural food prices was not as large
due to commensurate rise in productivity (Goyal and Baikar
2014). Post-2013, real wage growth declined in India
barring a few states like Madhya Pradesh, Uttar Pradesh,
Gujarat and Tamil Nadu. The fall in real wage growth is
mainly contributed by a fall in nominal wage growth.
References:
Dholakia, R.H., M. B. Pandya and P. Pateriya (2014), ‘Urban
– Rural Income Differential in Major States: Contribution of
Structural Factors’, WP No. 7, Indian Institute of Management,
Ahmedabad.
Goyal, A. and A.K. Baikar (2014), ‘Psychology, Cyclicality
or Social Programs: Rural Wage and Infl ation Dynamics in
India’, WP, IGIDR, Mumbai.
(Indian basket), marking a decline of 57 per cent
during June 2014 to January 2015. Though the
slow pace of global economic recovery has kept
demand prospects weak, the International
Monetary Fund (IMF) estimated that lower
demand could account for only 20 to 35 per cent
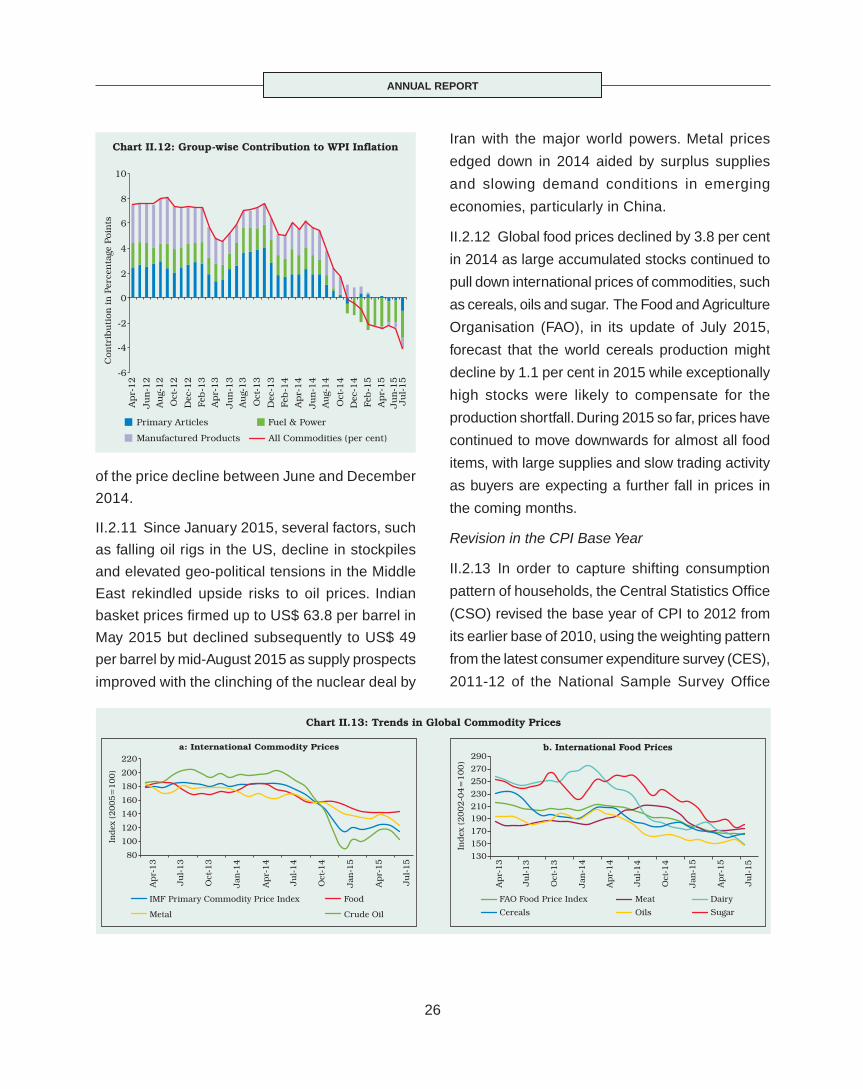
ANNUAL REPORT
26
of the price decline between June and December
2014.
II.2.11 Since January 2015, several factors, such
as falling oil rigs in the US, decline in stockpiles
and elevated geo-political tensions in the Middle
East rekindled upside risks to oil prices. Indian
basket prices fi rmed up to US$ 63.8 per barrel in
May 2015 but declined subsequently to US$ 49
per barrel by mid-August 2015 as supply prospects
improved with the clinching of the nuclear deal by
Iran with the major world powers. Metal prices
edged down in 2014 aided by surplus supplies
and slowing demand conditions in emerging
economies, particularly in China.
II.2.12 Global food prices declined by 3.8 per cent
in 2014 as large accumulated stocks continued to
pull down international prices of commodities, such
as cereals, oils and sugar. The Food and Agriculture
Organisation (FAO), in its update of July 2015,
forecast that the world cereals production might
decline by 1.1 per cent in 2015 while exceptionally
high stocks were likely to compensate for the
production shortfall. During 2015 so far, prices have
continued to move downwards for almost all food
items, with large supplies and slow trading activity
as buyers are expecting a further fall in prices in
the coming months.
Revision in the CPI Base Year
II.2.13 In order to capture shifting consumption
pattern of households, the Central Statistics Offi ce
(CSO) revised the base year of CPI to 2012 from
its earlier base of 2010, using the weighting pattern
from the latest consumer expenditure survey (CES),
2011-12 of the National Sample Survey Offi ce

ECONOMIC REVIEW
27
(NSSO). Changing patterns of consumer
expenditure over the years are refl ected in sub-
category-wise weights computed for the new CPI
series (Table II.7).
II.2.14 Methodologically, the new series has
incorporated certain improvements: a weighting
pattern based on the modifi ed mixed reference
per iod (MMRP); internat ional ly accepted
‘classifi cation of individual consumption according
to purpose’ with suitable deviations; and the use
of a geometric mean to compute indices at the
elementary/item level. Along with the prices of
items under the above poverty line (APL) and
below poverty line (BPL) categories, prices of
items under the Antyodaya Anna Yojana (AAY)
are also incorporated in the new series. The
revision has a number of policy implications: lower
sensitivity of the overall index to food price shocks
and id iosyncrat ic pr ice movements and
incisiveness in identifying sources of infl ation at
the item level.
Developments in Infl ation: 2015-16 so far
II.2.15 After dipping below 5 per cent in April
2015, CPI infl ation edged up to 5.4 per cent in
June driven by the food group owing to a fall in
pulses production during 2014-15 and short-term
pressures in vegetables prices. In July, however,
infl ation declined signifi cantly to 3.8 per cent
aided by favourable base effect and ebbing food
price pressures. Excluding food and fuel, infl ation
moved up substantially to 5.0 per cent in June
2015 from 4.2 per cent in March 2015 on account
of a broad-based rise in infl ation in services
segment, such as health and education as well
as retail fuel price increases captured by the
transport and communication sub-group. It,
however, moderated to 4.5 per cent in July 2015
tracking lower transport costs with recent fall in
fuel prices. Importantly, household inflation
expectations returned to double digits in June
2015 quarter.
Table II.7: Comparison of Weighting Diagrams–Previous and Revised CPI Series
Sub-Categories Base Year: 2010 Base Year: 2012
Rural Urban Combined Rural Urban Combined
1 2 3 4 5 6 7
Food and Beverages 56.59 35.81 47.58 54.18 36.29 45.86
Pan, Tobacco and Intoxicants 2.72 1.34 2.13 3.26 1.36 2.38
Clothing and Footwear 5.36 3.91 4.73 7.36 5.57 6.53
Housing -- 22.54 9.77 -- 21.67 10.07
Fuel and Light 10.42 8.40 9.49 7.94 5.58 6.84
Miscellaneous 24.91 28.00 26.31 27.26 29.53 28.32
Total 100 100 100 100 100 100
‘--’ : CPI (Rural) for housing is not compiled.
Source: Press Release on CPI base year revision, MOSPI, GoI.
(Per cent)
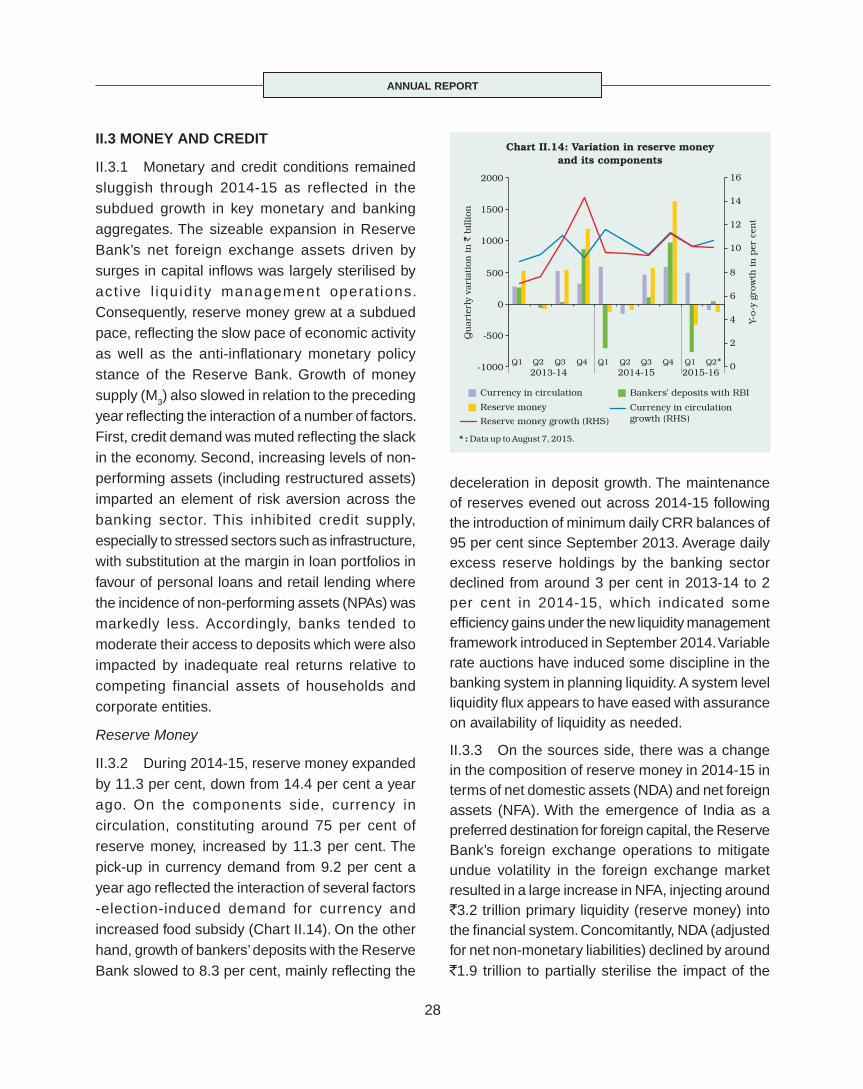
ANNUAL REPORT
28
II.3 MONEY AND CREDIT
II.3.1 Monetary and credit conditions remained sluggish through 2014-15 as reflected in the subdued growth in key monetary and banking aggregates. The sizeable expansion in Reserve Bank’s net foreign exchange assets driven by surges in capital infl ows was largely sterilised by act ive l iquidi ty management operat ions. Consequently, reserve money grew at a subdued pace, refl ecting the slow pace of economic activity as well as the anti-infl ationary monetary policy stance of the Reserve Bank. Growth of money supply (M3) also slowed in relation to the preceding year refl ecting the interaction of a number of factors. First, credit demand was muted refl ecting the slack in the economy. Second, increasing levels of non-performing assets (including restructured assets) imparted an element of risk aversion across the banking sector. This inhibited credit supply, especially to stressed sectors such as infrastructure, with substitution at the margin in loan portfolios in favour of personal loans and retail lending where the incidence of non-performing assets (NPAs) was markedly less. Accordingly, banks tended to moderate their access to deposits which were also impacted by inadequate real returns relative to competing financial assets of households and corporate entities.
Reserve Money
II.3.2 During 2014-15, reserve money expanded by 11.3 per cent, down from 14.4 per cent a year ago. On the components side, currency in circulation, constituting around 75 per cent of reserve money, increased by 11.3 per cent. The pick-up in currency demand from 9.2 per cent a year ago refl ected the interaction of several factors-election-induced demand for currency and increased food subsidy (Chart II.14). On the other hand, growth of bankers’ deposits with the Reserve Bank slowed to 8.3 per cent, mainly refl ecting the
deceleration in deposit growth. The maintenance of reserves evened out across 2014-15 following the introduction of minimum daily CRR balances of 95 per cent since September 2013. Average daily excess reserve holdings by the banking sector declined from around 3 per cent in 2013-14 to 2 per cent in 2014-15, which indicated some effi ciency gains under the new liquidity management framework introduced in September 2014. Variable rate auctions have induced some discipline in the banking system in planning liquidity. A system level liquidity fl ux appears to have eased with assurance on availability of liquidity as needed.
II.3.3 On the sources side, there was a change in the composition of reserve money in 2014-15 in terms of net domestic assets (NDA) and net foreign assets (NFA). With the emergence of India as a preferred destination for foreign capital, the Reserve Bank’s foreign exchange operations to mitigate undue volatility in the foreign exchange market resulted in a large increase in NFA, injecting around `3.2 trillion primary liquidity (reserve money) into the fi nancial system. Concomitantly, NDA (adjusted for net non-monetary liabilities) declined by around `1.9 trillion to partially sterilise the impact of the
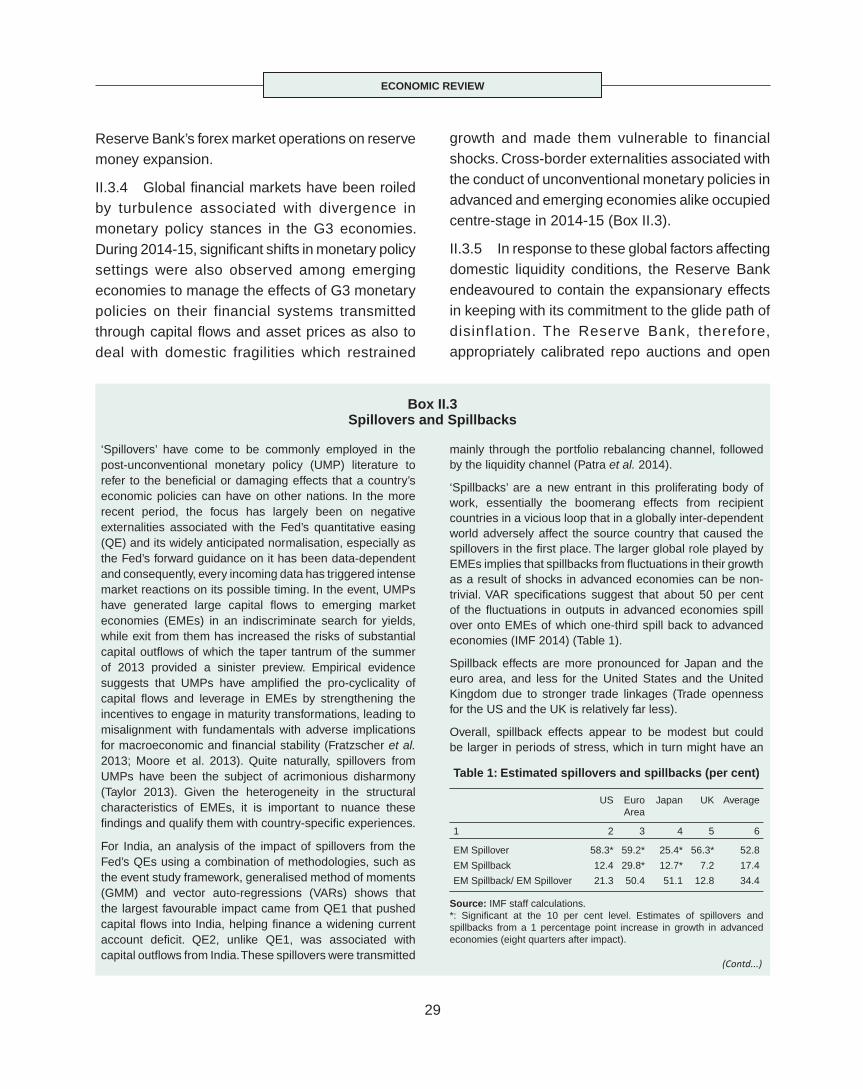
ECONOMIC REVIEW
29
Box II.3Spillovers and Spillbacks
‘Spillovers’ have come to be commonly employed in the post-unconventional monetary policy (UMP) literature to refer to the benefi cial or damaging effects that a country’s economic policies can have on other nations. In the more recent period, the focus has largely been on negative externalities associated with the Fed’s quantitative easing (QE) and its widely anticipated normalisation, especially as the Fed’s forward guidance on it has been data-dependent and consequently, every incoming data has triggered intense market reactions on its possible timing. In the event, UMPs have generated large capital fl ows to emerging market economies (EMEs) in an indiscriminate search for yields, while exit from them has increased the risks of substantial capital outfl ows of which the taper tantrum of the summer of 2013 provided a sinister preview. Empirical evidence suggests that UMPs have amplifi ed the pro-cyclicality of capital fl ows and leverage in EMEs by strengthening the incentives to engage in maturity transformations, leading to misalignment with fundamentals with adverse implications for macroeconomic and fi nancial stability (Fratzscher et al. 2013; Moore et al. 2013). Quite naturally, spillovers from UMPs have been the subject of acrimonious disharmony (Taylor 2013). Given the heterogeneity in the structural characteristics of EMEs, it is important to nuance these fi ndings and qualify them with country-specifi c experiences.
For India, an analysis of the impact of spillovers from the Fed’s QEs using a combination of methodologies, such as the event study framework, generalised method of moments (GMM) and vector auto-regressions (VARs) shows that the largest favourable impact came from QE1 that pushed capital fl ows into India, helping fi nance a widening current account defi cit. QE2, unlike QE1, was associated with capital outfl ows from India. These spillovers were transmitted
Table 1: Estimated spillovers and spillbacks (per cent)
US Euro Area
Japan UK Average
1 2 3 4 5 6
EM Spillover 58.3* 59.2* 25.4* 56.3* 52.8
EM Spillback 12.4 29.8* 12.7* 7.2 17.4
EM Spillback/ EM Spillover 21.3 50.4 51.1 12.8 34.4
Source: IMF staff calculations.*: Signifi cant at the 10 per cent level. Estimates of spillovers and spillbacks from a 1 percentage point increase in growth in advanced economies (eight quarters after impact).
mainly through the portfolio rebalancing channel, followed by the liquidity channel (Patra et al. 2014).
‘Spillbacks’ are a new entrant in this proliferating body of work, essentially the boomerang effects from recipient countries in a vicious loop that in a globally inter-dependent world adversely affect the source country that caused the spillovers in the fi rst place. The larger global role played by EMEs implies that spillbacks from fl uctuations in their growth as a result of shocks in advanced economies can be non-trivial. VAR specifi cations suggest that about 50 per cent of the fl uctuations in outputs in advanced economies spill over onto EMEs of which one-third spill back to advanced economies (IMF 2014) (Table 1).
Spillback effects are more pronounced for Japan and the euro area, and less for the United States and the United Kingdom due to stronger trade linkages (Trade openness for the US and the UK is relatively far less).
Overall, spillback effects appear to be modest but could be larger in periods of stress, which in turn might have an
(Contd...)
Reserve Bank’s forex market operations on reserve money expansion.
II.3.4 Global fi nancial markets have been roiled by turbulence associated with divergence in monetary policy stances in the G3 economies. During 2014-15, signifi cant shifts in monetary policy settings were also observed among emerging economies to manage the effects of G3 monetary policies on their financial systems transmitted through capital fl ows and asset prices as also to deal with domestic fragilities which restrained
growth and made them vulnerable to financial shocks. Cross-border externalities associated with the conduct of unconventional monetary policies in advanced and emerging economies alike occupied centre-stage in 2014-15 (Box II.3).
II.3.5 In response to these global factors affecting domestic liquidity conditions, the Reserve Bank endeavoured to contain the expansionary effects in keeping with its commitment to the glide path of disinflation. The Reserve Bank, therefore, appropriately calibrated repo auctions and open
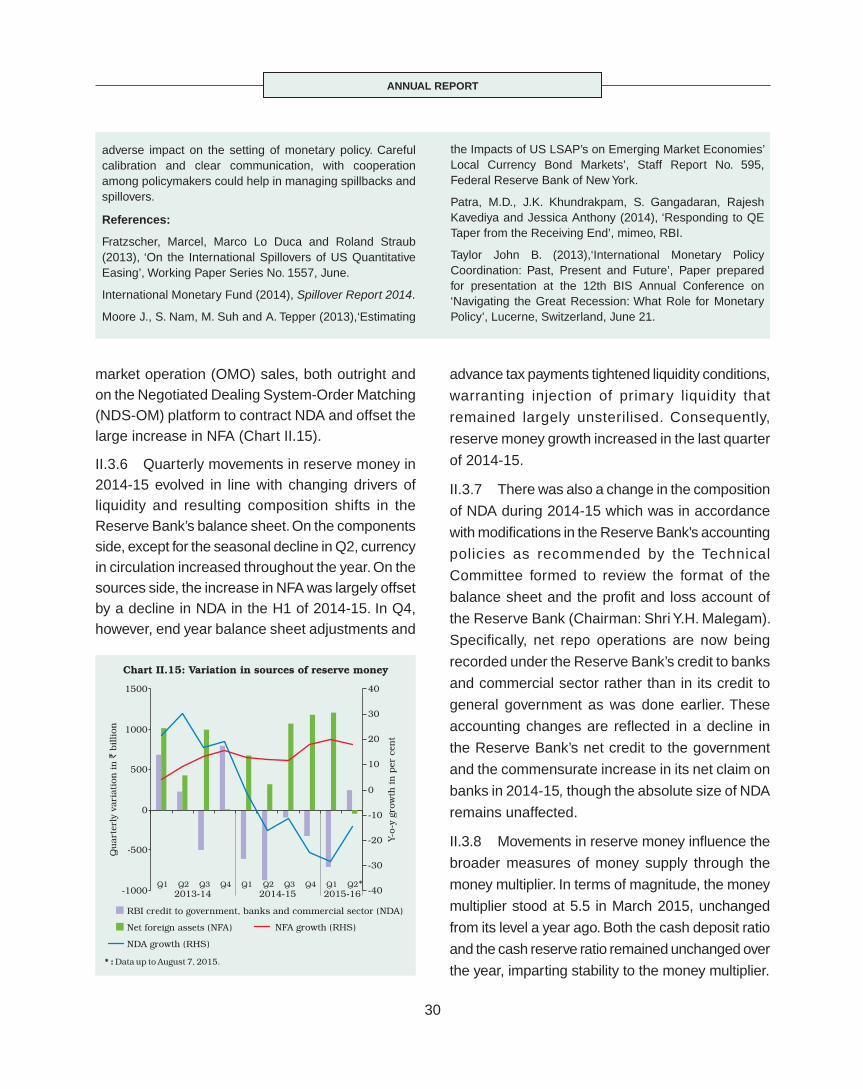
ANNUAL REPORT
30
market operation (OMO) sales, both outright and on the Negotiated Dealing System-Order Matching (NDS-OM) platform to contract NDA and offset the large increase in NFA (Chart II.15).
II.3.6 Quarterly movements in reserve money in 2014-15 evolved in line with changing drivers of liquidity and resulting composition shifts in the Reserve Bank’s balance sheet. On the components side, except for the seasonal decline in Q2, currency in circulation increased throughout the year. On the sources side, the increase in NFA was largely offset by a decline in NDA in the H1 of 2014-15. In Q4, however, end year balance sheet adjustments and
advance tax payments tightened liquidity conditions,
warranting injection of primary liquidity that
remained largely unsterilised. Consequently,
reserve money growth increased in the last quarter
of 2014-15.
II.3.7 There was also a change in the composition
of NDA during 2014-15 which was in accordance
with modifi cations in the Reserve Bank’s accounting
policies as recommended by the Technical
Committee formed to review the format of the
balance sheet and the profi t and loss account of
the Reserve Bank (Chairman: Shri Y.H. Malegam).
Specifi cally, net repo operations are now being
recorded under the Reserve Bank’s credit to banks
and commercial sector rather than in its credit to
general government as was done earlier. These
accounting changes are refl ected in a decline in
the Reserve Bank’s net credit to the government
and the commensurate increase in its net claim on
banks in 2014-15, though the absolute size of NDA
remains unaffected.
II.3.8 Movements in reserve money infl uence the
broader measures of money supply through the
money multiplier. In terms of magnitude, the money
multiplier stood at 5.5 in March 2015, unchanged
from its level a year ago. Both the cash deposit ratio
and the cash reserve ratio remained unchanged over
the year, imparting stability to the money multiplier.
adverse impact on the setting of monetary policy. Careful calibration and clear communication, with cooperation among policymakers could help in managing spillbacks and spillovers.
References:
Fratzscher, Marcel, Marco Lo Duca and Roland Straub (2013), ‘On the International Spillovers of US Quantitative Easing’, Working Paper Series No. 1557, June.
International Monetary Fund (2014), Spillover Report 2014.
Moore J., S. Nam, M. Suh and A. Tepper (2013),‘Estimating
the Impacts of US LSAP’s on Emerging Market Economies’ Local Currency Bond Markets’, Staff Report No. 595, Federal Reserve Bank of New York.
Patra, M.D., J.K. Khundrakpam, S. Gangadaran, Rajesh Kavediya and Jessica Anthony (2014), ‘Responding to QE Taper from the Receiving End’, mimeo, RBI.
Taylor John B. (2013),‘International Monetary Policy Coordination: Past, Present and Future’, Paper prepared for presentation at the 12th BIS Annual Conference on ‘Navigating the Great Recession: What Role for Monetary Policy’, Lucerne, Switzerland, June 21.

ECONOMIC REVIEW
31
Money Supply
II.3.9 The money supply growth slowed down in 2014-15 (Table II.8), mainly reflecting easing infl ation which lowered the demand for money. The slowdown in money supply in general, and in aggregate deposits in particular, vis-à-vis 2013-14 has to be seen in the context of the base effect caused by the swap facility for FCNR(B) deposits operated by the Reserve Bank during September-November 2013 which led to high mobilisation of these deposits in 2013-14. Money supply net of FCNR(B) deposits was marginally lower in 2014-15 than in the preceding year. However, money supply improved in the second half of the year (March 2015 over September 2014) in line with the growth in credit. In tandem, the year-on-year growth in the liquidity aggregate L1 [sum of the new monetary aggregate (NM
3) and postal deposits] remained marginally lower than a year ago.
II.3.10 Growth in aggregate deposits, which forms a major component of money supply, has generally been declining over the years in line with a decrease in the saving rate of the economy. In addition, slowdown in credit growth led to lower deposit mobilisation by banks. The growth in aggregate deposits decelerated to 10.6 per cent in 2014-15 from 14.1 per cent a year ago. On the sources side, a decline in banks’ credit growth to the commercial sector was one of the key drivers. Another major constituent from the sources side, that is, net bank credit to the government declined during the year mainly due to reduction in the Reserve Bank’s holding of government securities (G-secs). Commercial banks, on the other hand, stepped up their investment in G-secs in view of credit deceleration during the year.
II.3.11 The velocity of money (Chart II.16), which declined over the past six decades hovered around
Table II.8: Monetary Aggregates
Item Outstanding as on(` billion)
Year-on-year growth rate(in per cent)
Growth rate (in per cent)
March 31, 2015
August 7, 2015
2013-14 2014-15 2015-16 (as on
August 7)
FY 15: H1
FY 15: H2
FY16: H1
1 2 3 4 5 6 7 8 9
I. Reserve Money 19,285 18,815 14.4 11.3 10.1 -1.4 12.9 -2.4
II. Broad Money (M3) 105,455 109,830 13.4 10.8 10.9 4.4 6.2 4.1
III. Liquidity Aggregate (L1) 106,759 110,722# 11.2 10.7 11.6# 4.0 6.5 3.7#
IV. Major Components of M3
IV.1. Currency with the Public 13,863 14,251 9.2 11.3 9.5 3.4 7.6 2.8
IV.2. Aggregate Deposits 91,446 95,567 14.1 10.6 11.2 4.4 5.9 4.5
V. Major Sources of Money Stock (M3)
V.1. Net Bank Credit to Government 30,062 33,781 12.4 -1.3 10.6 -0.5 -0.8 12.4
V.2. Bank Credit to Commercial Sector 70,396 71,627 13.7 9.2 9.0 2.3 6.8 1.7
V.3. Net Foreign Exchange Assets of the Banking Sector 22,506 23,664 17.6 17.0 16.0 3.9 12.6 5.1
M3 Net of FCNR(B) 102,782 107,009 11.5 11.0 11.1 4.4 6.3 4.1
M3 Multiplier 5.5 5.8
M3 Velocity 1.25 -
-: Not available; #: Data pertain to July 2015.Note: 1. Data are provisional. 2. FY 15: H1: Growth rate of September 2014 over March 2014, FY 15: H2: Growth rate of March 2015 over September 2014, and
FY 16: H1: Growth rate of August 7, 2015 over March 31, 2015.
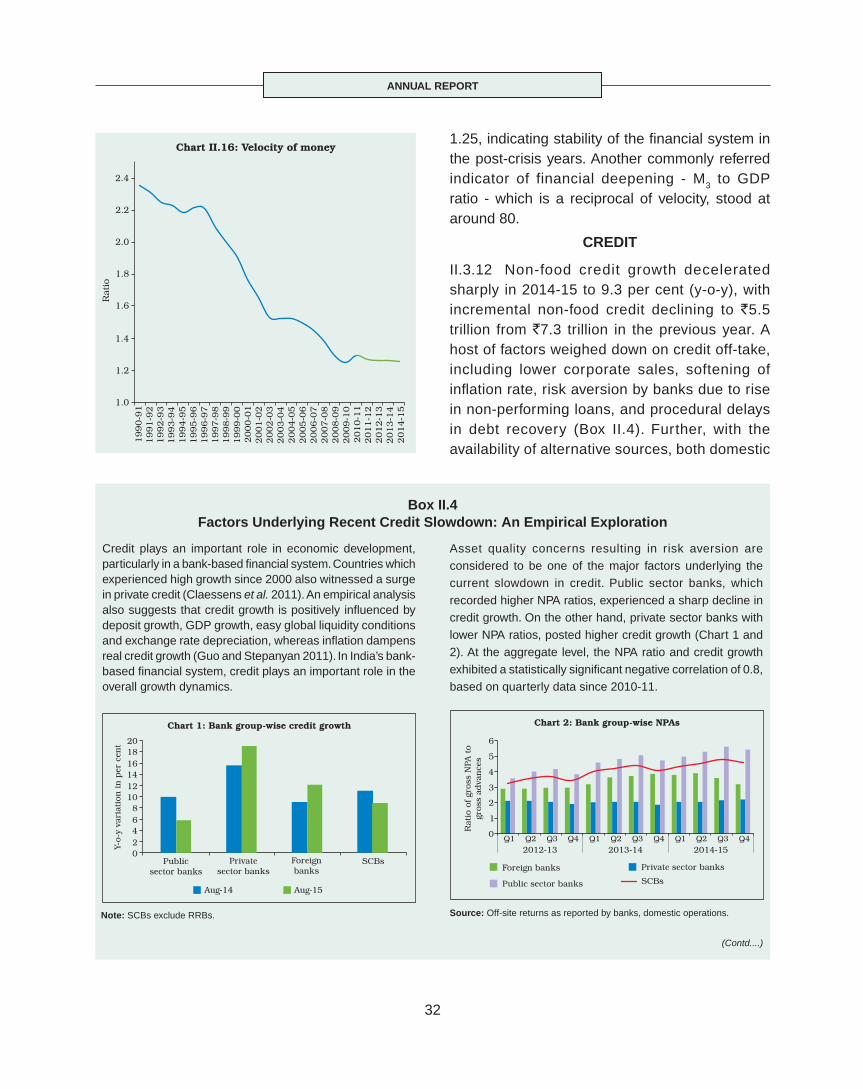
ANNUAL REPORT
32
1.25, indicating stability of the fi nancial system in the post-crisis years. Another commonly referred indicator of financial deepening - M3 to GDP ratio - which is a reciprocal of velocity, stood at around 80.
CREDIT
II.3.12 Non-food credit growth decelerated sharply in 2014-15 to 9.3 per cent (y-o-y), with incremental non-food credit declining to `5.5 trillion from `7.3 trillion in the previous year. A host of factors weighed down on credit off-take, including lower corporate sales, softening of infl ation rate, risk aversion by banks due to rise in non-performing loans, and procedural delays in debt recovery (Box II.4). Further, with the availability of alternative sources, both domestic
Box II.4Factors Underlying Recent Credit Slowdown: An Empirical Exploration
(Contd....)
Credit plays an important role in economic development, particularly in a bank-based fi nancial system. Countries which experienced high growth since 2000 also witnessed a surge in private credit (Claessens et al. 2011). An empirical analysis also suggests that credit growth is positively infl uenced by deposit growth, GDP growth, easy global liquidity conditions and exchange rate depreciation, whereas infl ation dampens real credit growth (Guo and Stepanyan 2011). In India’s bank-based fi nancial system, credit plays an important role in the overall growth dynamics.
Asset quality concerns resulting in risk aversion are considered to be one of the major factors underlying the current slowdown in credit. Public sector banks, which recorded higher NPA ratios, experienced a sharp decline in credit growth. On the other hand, private sector banks with lower NPA ratios, posted higher credit growth (Chart 1 and 2). At the aggregate level, the NPA ratio and credit growth exhibited a statistically signifi cant negative correlation of 0.8, based on quarterly data since 2010-11.
Source: Off-site returns as reported by banks, domestic operations.Note: SCBs exclude RRBs.

ECONOMIC REVIEW
33
and foreign, corporates switched some of the demand for fi nancing to non-bank sources. Sale of signifi cantly larger amount of non-performing loans (`317 b i l l ion) by banks to asset reconstruction companies (ARCs) during 2014-15 also contributed to a deceleration in bank credit. Food credit also registered a decline of 4.1 per cent during the year, despite some pick-up in procurement, as a result of enhanced food
subsidies which increased by 28.1 per cent in 2014-15.
II.3.13 With the deceleration in non-food credit growth on a year-on-year basis, nearly 80 per cent of the incremental credit off-take during 2014-15 took place in the second half of the year, refl ecting
the improving economic environment (Charts II.17
and II.18). Non-food credit growth increased to 7.1
Applying the methodology of Guo and Stepanyan (2011) to Indian quarterly data from June 1997 to September 2014, non-food credit was found to be infl uenced by lagged real GDP growth in a positive and statistically signifi cant manner. The cost of credit proxied by the overnight call rate, as expected, had a negative impact on credit growth. The impact of the interest rate was found to be strong up to two lags, refl ecting transmission lags. In line with the theory, the coeffi cient of gross fi scal defi cit (GFD) of the Centre had a negative sign, indicating crowding out effects of fi scal defi cit in market for bank credit. Finally, the change in outstanding commercial papers (CPs), a proxy for an alternative source of funds, had a negative and signifi cant coeffi cient.
BC = 7.2 + 0.6 GDP (-2) - 0.3 WCMR(-2) - 0.2 GFD - 0.04 CP_Out +
(2.4)* (–2.3)* (–2.4)* (–2.3)*
Adjusted R2=0.30; *: Signifi cant at 5 per cent;
NPAs were not included in the regression as the series had multiple
structural breaks.
Note: 1. BC=q-o-q seasonally adjusted growth in bank credit; WCMR=quarterly weighted average call rate; GDP= q-o-q seasonally adjusted growth in GDP (base: 2004-05); GFD: quarterly GFD (Centre) as per cent of GDP at current market price; CP_out: q-o-q seasonally adjusted growth in CP outstanding.
2. The results were subjected to standard robustness checks.
Thus economic activity, cost of credit, the fi scal position and competitive alternative funding sources turned out to be major factors affecting credit behaviour in India.
References:
Claessens, S., M. A. Koseand M.E. Terrones (2011), ‘How Do Business and Financial Cycles Interact?’, IMF Working Paper, No. WP/11/88.
Guo K. and V. Stepanyan (2011), ‘Determinants of Bank Credit in Emerging Market Economies’, IMF Working Paper WP/11/51.

ANNUAL REPORT
34
per cent in H2 of 2014-15 from 2.0 per cent in H1, representing an improvement of 5 percentage points in H2 compared with 0.6 percentage point increase a year ago.
II.3.14 In order to create more space for banks to expand credit to the productive sectors of the economy, the statutory liquidity ratio (SLR) was reduced in three stages from 23 per cent to 21.5 per cent of net demand and time liabilities (NDTL) during 2014-15. However, banks continued to maintain SLR investments around 28 per cent of NDTL, the buffer providing access to collateralised borrowings from the wholesale funding market and the Reserve Bank. Maintaining excess SLR securities also helped banks to weather the impact of the current slow phase of the economic cycle on their balance sheets and earnings.
II.3.15 Data on sectoral deployment of credit, which constitutes about 95 per cent of total bank credit by SCBs, indicate that deceleration in credit off-take
in 2014-15 was more pronounced with respect to the industry and services sectors, which together constituted about 68 per cent of total non-food credit. Credit growth in the services sector was weighed down by its major components: trade and non-banking fi nancial companies (NBFCs) that accounted for nearly 48 per cent of the total credit to the services sector. In the industrial sector, growth slowed down across sectors, particularly for infrastructure, basic metals and food processing. The sectors which witnessed lower incidence of NPAs such as personal loans saw higher growth during the year.
II.3.16 Infrastructure accounts for nearly one-third of the credit to the industrial sector. Its main
components are power and roads, constituting 60
and 18 per cent of the total infrastructure credit
respectively. While deceleration in credit to the
power sector was modest, the slowdown was sharp
with respect to roads in 2014-15 (Table II.9).
Table II.9: Trends in Credit Deployment to Select Sectors(Variation in per cent)
Outstanding at 20-Mar-2015
(` billion)
2013-14 2014-15 2015-16
H1 H2 Year H1 H2 Year H1
1 2 3 4 5 6 7 8 9
Non-food Credit (1 to 4) 60,030 6.8 6.3 13.6 2.2 6.2 8.6 1.1
1. Agriculture & Allied Activities 7,659 3.4 9.2 12.9 8.8 5.7 15.0 3.8
2. Industry 26,576 6.3 6.1 12.8 -0.1 5.7 5.6 -1.0
Of which: (i) Infrastructure
9,245 8.8 5.3 14.6 4.3 6.0 10.5 1.0
Of which: (a) Power 5,576 10.7 5.8 17.1 6.6 7.5 14.5 2.8
(b) Telecommunications 919 -0.6 1.1 0.5 -3.6 8.0 4.2 -2.9
(c) Roads 1,687 9.2 10.1 20.2 3.5 3.3 6.9 -0.7
(ii) Basic Metal & Metal Product 3,854 7.2 7.1 14.9 -0.4 7.2 6.8 -0.6
(iii) Food Processing 1,715 3.5 20.4 24.6 -2.6 20.4 17.3 -6.2
3. Services 14,131 9.0 6.5 16.1 -1.2 6.9 5.7 1.4
4. Personal Loans 11,663 7.5 4.6 12.5 8.0 6.9 15.5 4.0
Note: Latest available data for H1 of 2015-16 are up to June 2015.

ECONOMIC REVIEW
35
II.3.17 During 2015-16 so far (up to August 7),
credit off-take seems to be picking up reflecting
an improving economic and policy environment,
though it is too early for a conclusive evidence.
Incremental non-food credit stood around
`1,282 billion as against `963 billion during the
corresponding period last year. Data on sectoral
deployment (up to June 2015) reveal a
significant pick-up in services mainly supported
by trade and professional services, while
industry registered a decline. Within industry,
although credit to infrastructure shows signs of
pick-up, that to roads continues to be weak
(Chart II.19).
Non-bank funding
II.3.18 Slowdown in credit growth dragged down
the overall flow of financial resources to the
commercial sector in 2014-15, despite higher
recourse to non-bank sources of funds (Chart
II.20). Amongst the non-bank domestic sources,
net issuance of CPs witnessed a four-fold
increase during the year, mainly attributable to
competitive pricing vis-á-vis banks’ lending
rates. Further, FDI inflows remained strong and
accounted for a major chunk of the non-bank
foreign resources to the commercial sector.
Reliance on non-bank sources continues during
2015-16 so far (up to August 7) amidst
comfortable liquidity conditions and competitive
rates.
II.3.19 Regime shifts in the conduct of monetary
policy shaped monetary and credit conditions in
2014-15. Money supply and other key monetary
aggregates decelerated in line with underlying
macroeconomic activity. Overall, credit growth was
subdued during 2014-15 owing to various factors,
such as risk aversion by banks due to rising NPAs
and alternative and cheaper sources of non-bank
funding, though there was some evidence that a
turnaround in the second half of the year might have
set in.
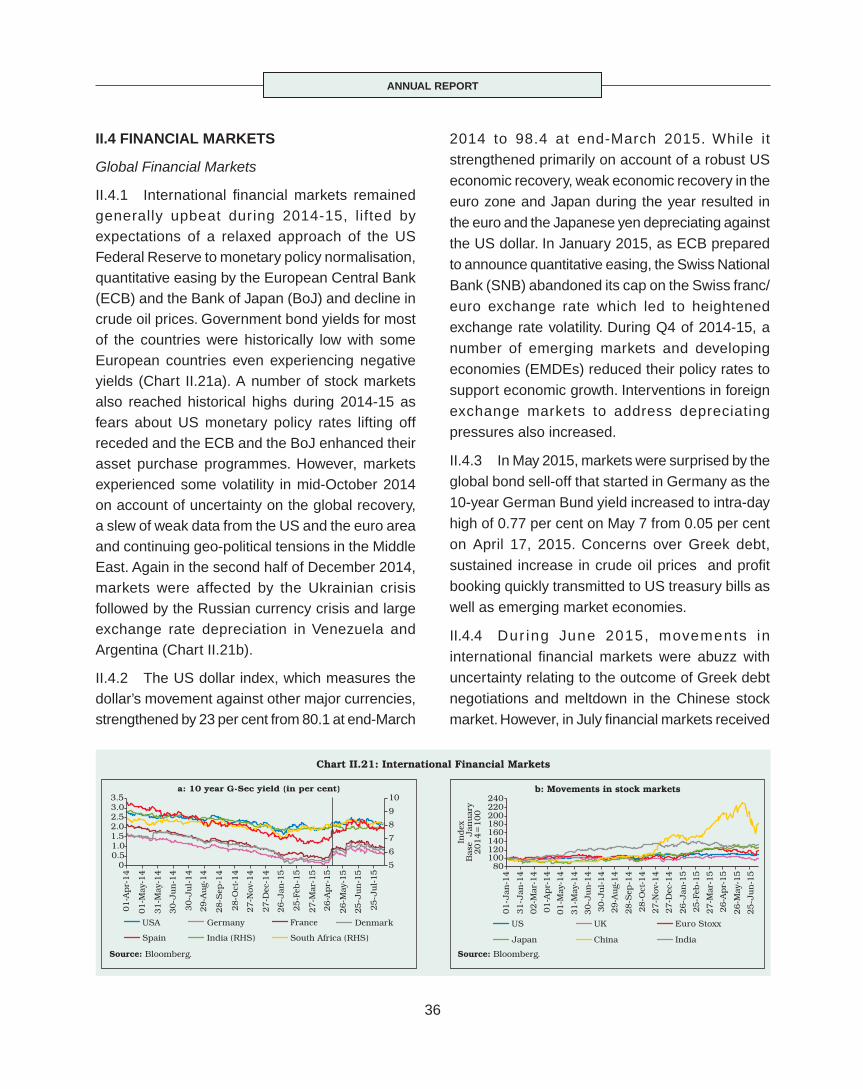
ANNUAL REPORT
36
II.4 FINANCIAL MARKETS
Global Financial Markets
II.4.1 International fi nancial markets remained generally upbeat during 2014-15, lifted by expectations of a relaxed approach of the US Federal Reserve to monetary policy normalisation, quantitative easing by the European Central Bank (ECB) and the Bank of Japan (BoJ) and decline in crude oil prices. Government bond yields for most of the countries were historically low with some European countries even experiencing negative yields (Chart II.21a). A number of stock markets also reached historical highs during 2014-15 as fears about US monetary policy rates lifting off receded and the ECB and the BoJ enhanced their asset purchase programmes. However, markets experienced some volatility in mid-October 2014 on account of uncertainty on the global recovery, a slew of weak data from the US and the euro area and continuing geo-political tensions in the Middle East. Again in the second half of December 2014, markets were affected by the Ukrainian crisis followed by the Russian currency crisis and large exchange rate depreciation in Venezuela and Argentina (Chart II.21b).
II.4.2 The US dollar index, which measures the dollar’s movement against other major currencies, strengthened by 23 per cent from 80.1 at end-March
2014 to 98.4 at end-March 2015. While it strengthened primarily on account of a robust US economic recovery, weak economic recovery in the euro zone and Japan during the year resulted in the euro and the Japanese yen depreciating against the US dollar. In January 2015, as ECB prepared to announce quantitative easing, the Swiss National Bank (SNB) abandoned its cap on the Swiss franc/euro exchange rate which led to heightened exchange rate volatility. During Q4 of 2014-15, a number of emerging markets and developing economies (EMDEs) reduced their policy rates to support economic growth. Interventions in foreign exchange markets to address depreciating pressures also increased.
II.4.3 In May 2015, markets were surprised by the global bond sell-off that started in Germany as the 10-year German Bund yield increased to intra-day high of 0.77 per cent on May 7 from 0.05 per cent on April 17, 2015. Concerns over Greek debt, sustained increase in crude oil prices and profi t booking quickly transmitted to US treasury bills as well as emerging market economies.
II.4.4 Dur ing June 2015, movements in international fi nancial markets were abuzz with uncertainty relating to the outcome of Greek debt negotiations and meltdown in the Chinese stock market. However, in July fi nancial markets received
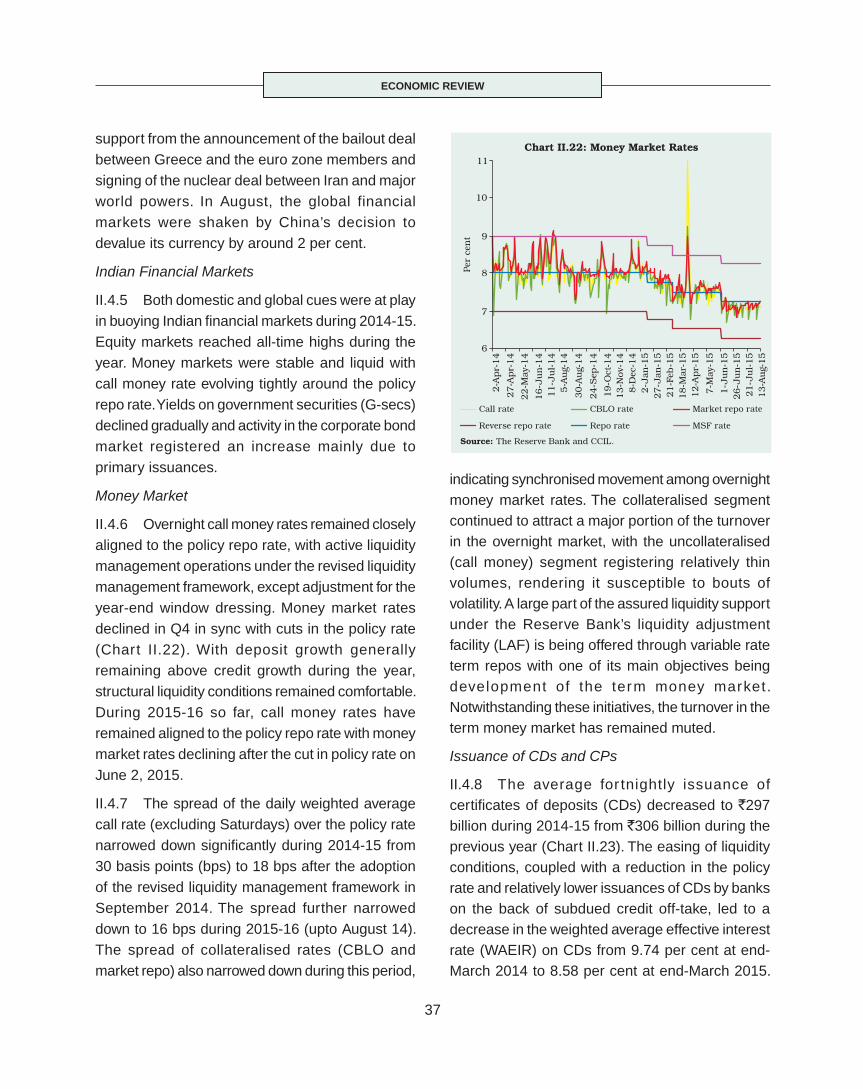
ECONOMIC REVIEW
37
support from the announcement of the bailout deal between Greece and the euro zone members and signing of the nuclear deal between Iran and major world powers. In August, the global financial markets were shaken by China’s decision to devalue its currency by around 2 per cent.
Indian Financial Markets
II.4.5 Both domestic and global cues were at play in buoying Indian fi nancial markets during 2014-15. Equity markets reached all-time highs during the year. Money markets were stable and liquid with call money rate evolving tightly around the policy repo rate. Yields on government securities (G-secs) declined gradually and activity in the corporate bond market registered an increase mainly due to primary issuances.
Money Market
II.4.6 Overnight call money rates remained closely aligned to the policy repo rate, with active liquidity management operations under the revised liquidity management framework, except adjustment for the year-end window dressing. Money market rates declined in Q4 in sync with cuts in the policy rate (Chart II.22). With deposit growth generally remaining above credit growth during the year, structural liquidity conditions remained comfortable. During 2015-16 so far, call money rates have remained aligned to the policy repo rate with money market rates declining after the cut in policy rate on June 2, 2015.
II.4.7 The spread of the daily weighted average call rate (excluding Saturdays) over the policy rate narrowed down signifi cantly during 2014-15 from 30 basis points (bps) to 18 bps after the adoption of the revised liquidity management framework in September 2014. The spread further narrowed down to 16 bps during 2015-16 (upto August 14). The spread of collateralised rates (CBLO and market repo) also narrowed down during this period,
indicating synchronised movement among overnight money market rates. The collateralised segment continued to attract a major portion of the turnover in the overnight market, with the uncollateralised (call money) segment registering relatively thin volumes, rendering it susceptible to bouts of volatility. A large part of the assured liquidity support under the Reserve Bank’s liquidity adjustment facility (LAF) is being offered through variable rate term repos with one of its main objectives being development of the term money market. Notwithstanding these initiatives, the turnover in the term money market has remained muted.
Issuance of CDs and CPs
II.4.8 The average for tnightly issuance of certificates of deposits (CDs) decreased to `297 billion during 2014-15 from `306 billion during the previous year (Chart II.23). The easing of liquidity conditions, coupled with a reduction in the policy rate and relatively lower issuances of CDs by banks on the back of subdued credit off-take, led to a decrease in the weighted average effective interest rate (WAEIR) on CDs from 9.74 per cent at end-March 2014 to 8.58 per cent at end-March 2015.
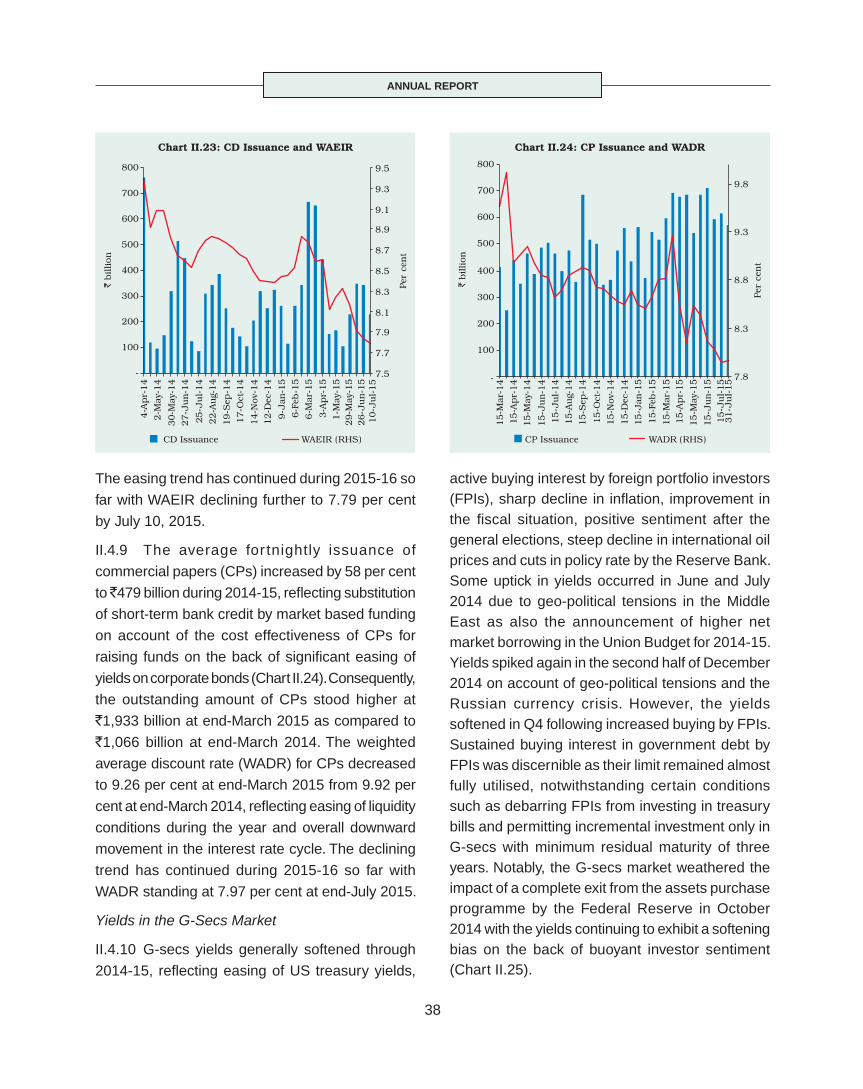
ANNUAL REPORT
38
The easing trend has continued during 2015-16 so
far with WAEIR declining further to 7.79 per cent
by July 10, 2015.
II.4.9 The average for tnightly issuance of
commercial papers (CPs) increased by 58 per cent
to ̀ 479 billion during 2014-15, refl ecting substitution
of short-term bank credit by market based funding
on account of the cost effectiveness of CPs for
raising funds on the back of signifi cant easing of
yields on corporate bonds (Chart II.24). Consequently,
the outstanding amount of CPs stood higher at
`1,933 billion at end-March 2015 as compared to
`1,066 billion at end-March 2014. The weighted
average discount rate (WADR) for CPs decreased
to 9.26 per cent at end-March 2015 from 9.92 per
cent at end-March 2014, refl ecting easing of liquidity
conditions during the year and overall downward
movement in the interest rate cycle. The declining
trend has continued during 2015-16 so far with
WADR standing at 7.97 per cent at end-July 2015.
Yields in the G-Secs Market
II.4.10 G-secs yields generally softened through
2014-15, refl ecting easing of US treasury yields,
active buying interest by foreign portfolio investors (FPIs), sharp decline in infl ation, improvement in the fi scal situation, positive sentiment after the general elections, steep decline in international oil prices and cuts in policy rate by the Reserve Bank. Some uptick in yields occurred in June and July 2014 due to geo-political tensions in the Middle East as also the announcement of higher net market borrowing in the Union Budget for 2014-15. Yields spiked again in the second half of December 2014 on account of geo-political tensions and the Russian currency crisis. However, the yields softened in Q4 following increased buying by FPIs. Sustained buying interest in government debt by FPIs was discernible as their limit remained almost fully utilised, notwithstanding certain conditions such as debarring FPIs from investing in treasury bills and permitting incremental investment only in G-secs with minimum residual maturity of three years. Notably, the G-secs market weathered the impact of a complete exit from the assets purchase programme by the Federal Reserve in October 2014 with the yields continuing to exhibit a softening bias on the back of buoyant investor sentiment (Chart II.25).
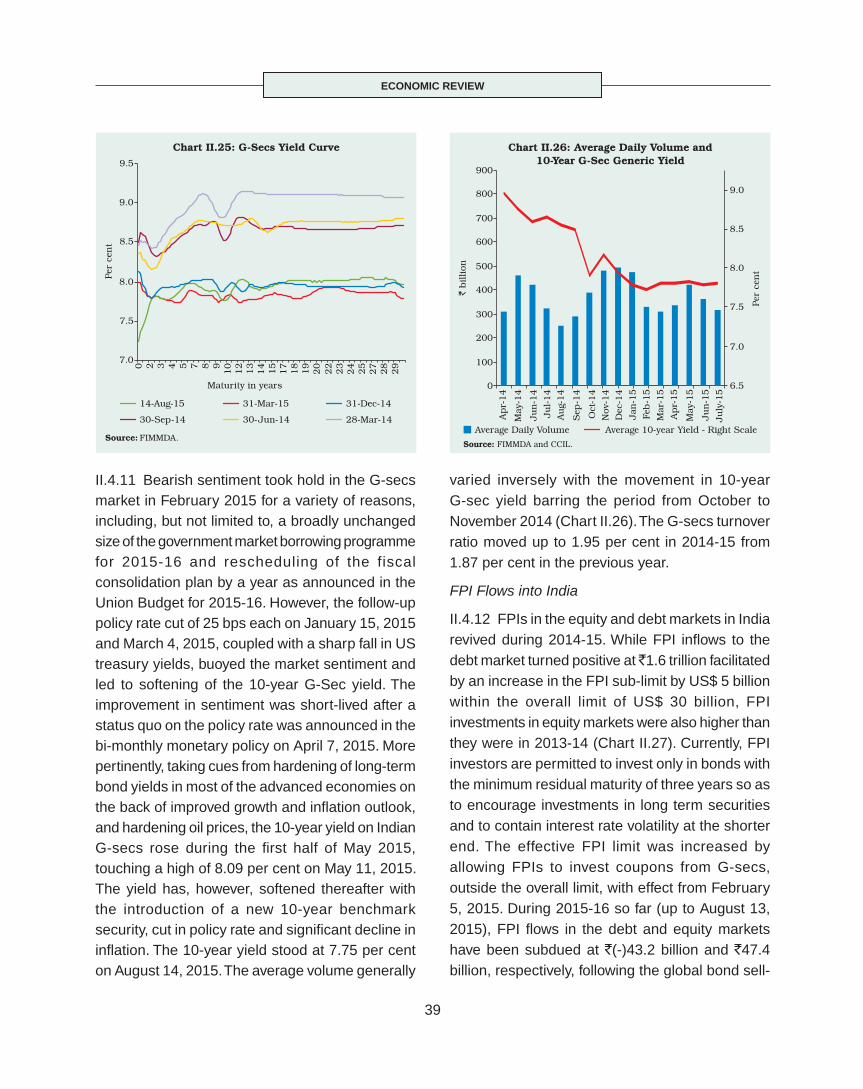
ECONOMIC REVIEW
39
II.4.11 Bearish sentiment took hold in the G-secs market in February 2015 for a variety of reasons, including, but not limited to, a broadly unchanged size of the government market borrowing programme for 2015-16 and rescheduling of the fiscal consolidation plan by a year as announced in the Union Budget for 2015-16. However, the follow-up policy rate cut of 25 bps each on January 15, 2015 and March 4, 2015, coupled with a sharp fall in US treasury yields, buoyed the market sentiment and led to softening of the 10-year G-Sec yield. The improvement in sentiment was short-lived after a status quo on the policy rate was announced in the bi-monthly monetary policy on April 7, 2015. More pertinently, taking cues from hardening of long-term bond yields in most of the advanced economies on the back of improved growth and infl ation outlook, and hardening oil prices, the 10-year yield on Indian G-secs rose during the fi rst half of May 2015, touching a high of 8.09 per cent on May 11, 2015. The yield has, however, softened thereafter with the introduction of a new 10-year benchmark security, cut in policy rate and signifi cant decline in infl ation. The 10-year yield stood at 7.75 per cent on August 14, 2015. The average volume generally
varied inversely with the movement in 10-year G-sec yield barring the period from October to November 2014 (Chart II.26). The G-secs turnover ratio moved up to 1.95 per cent in 2014-15 from 1.87 per cent in the previous year.
FPI Flows into India
II.4.12 FPIs in the equity and debt markets in India revived during 2014-15. While FPI infl ows to the debt market turned positive at ̀ 1.6 trillion facilitated by an increase in the FPI sub-limit by US$ 5 billion within the overall limit of US$ 30 billion, FPI investments in equity markets were also higher than they were in 2013-14 (Chart II.27). Currently, FPI investors are permitted to invest only in bonds with the minimum residual maturity of three years so as to encourage investments in long term securities and to contain interest rate volatility at the shorter end. The effective FPI limit was increased by allowing FPIs to invest coupons from G-secs, outside the overall limit, with effect from February 5, 2015. During 2015-16 so far (up to August 13, 2015), FPI fl ows in the debt and equity markets have been subdued at `(-)43.2 billion and `47.4 billion, respectively, following the global bond sell-
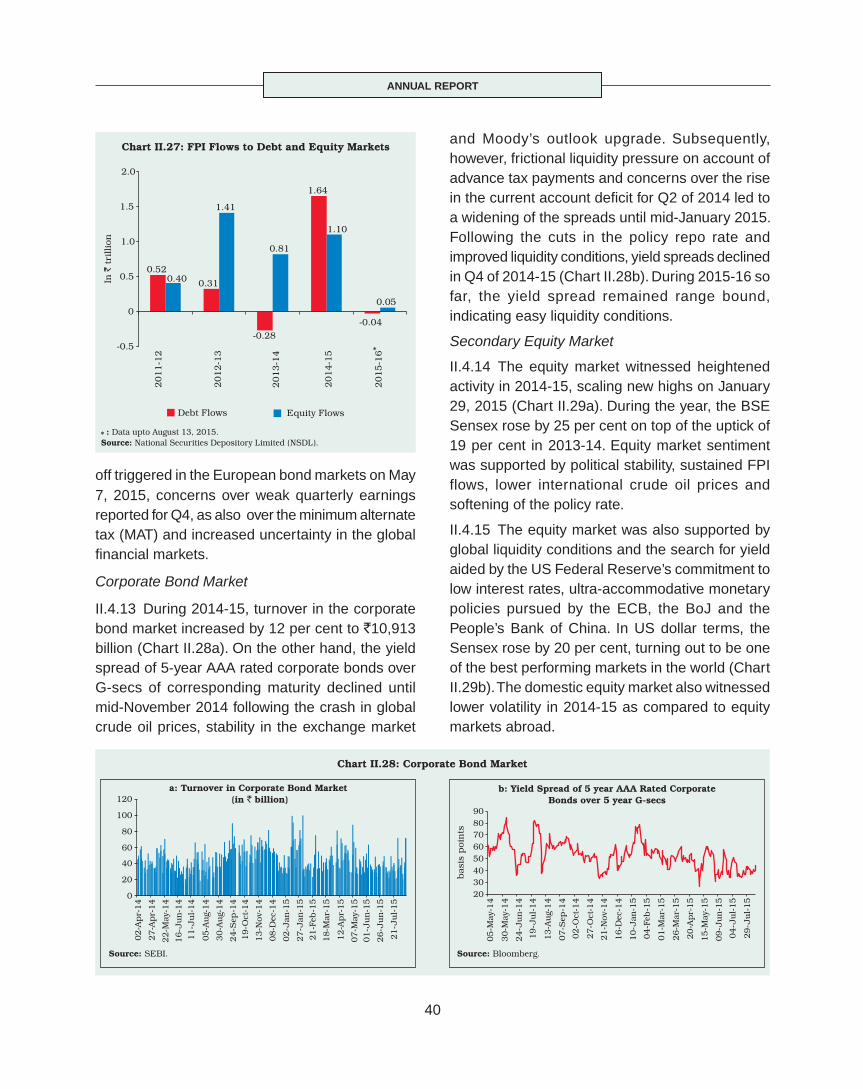
ANNUAL REPORT
40
off triggered in the European bond markets on May 7, 2015, concerns over weak quarterly earnings reported for Q4, as also over the minimum alternate tax (MAT) and increased uncertainty in the global fi nancial markets.
Corporate Bond Market
II.4.13 During 2014-15, turnover in the corporate bond market increased by 12 per cent to `10,913 billion (Chart II.28a). On the other hand, the yield spread of 5-year AAA rated corporate bonds over G-secs of corresponding maturity declined until mid-November 2014 following the crash in global crude oil prices, stability in the exchange market
and Moody’s outlook upgrade. Subsequently, however, frictional liquidity pressure on account of advance tax payments and concerns over the rise in the current account defi cit for Q2 of 2014 led to a widening of the spreads until mid-January 2015. Following the cuts in the policy repo rate and improved liquidity conditions, yield spreads declined in Q4 of 2014-15 (Chart II.28b). During 2015-16 so far, the yield spread remained range bound, indicating easy liquidity conditions.
Secondary Equity Market
II.4.14 The equity market witnessed heightened activity in 2014-15, scaling new highs on January 29, 2015 (Chart II.29a). During the year, the BSE Sensex rose by 25 per cent on top of the uptick of 19 per cent in 2013-14. Equity market sentiment was supported by political stability, sustained FPI flows, lower international crude oil prices and softening of the policy rate.
II.4.15 The equity market was also supported by global liquidity conditions and the search for yield aided by the US Federal Reserve’s commitment to low interest rates, ultra-accommodative monetary policies pursued by the ECB, the BoJ and the People’s Bank of China. In US dollar terms, the Sensex rose by 20 per cent, turning out to be one of the best performing markets in the world (Chart II.29b). The domestic equity market also witnessed lower volatility in 2014-15 as compared to equity markets abroad.
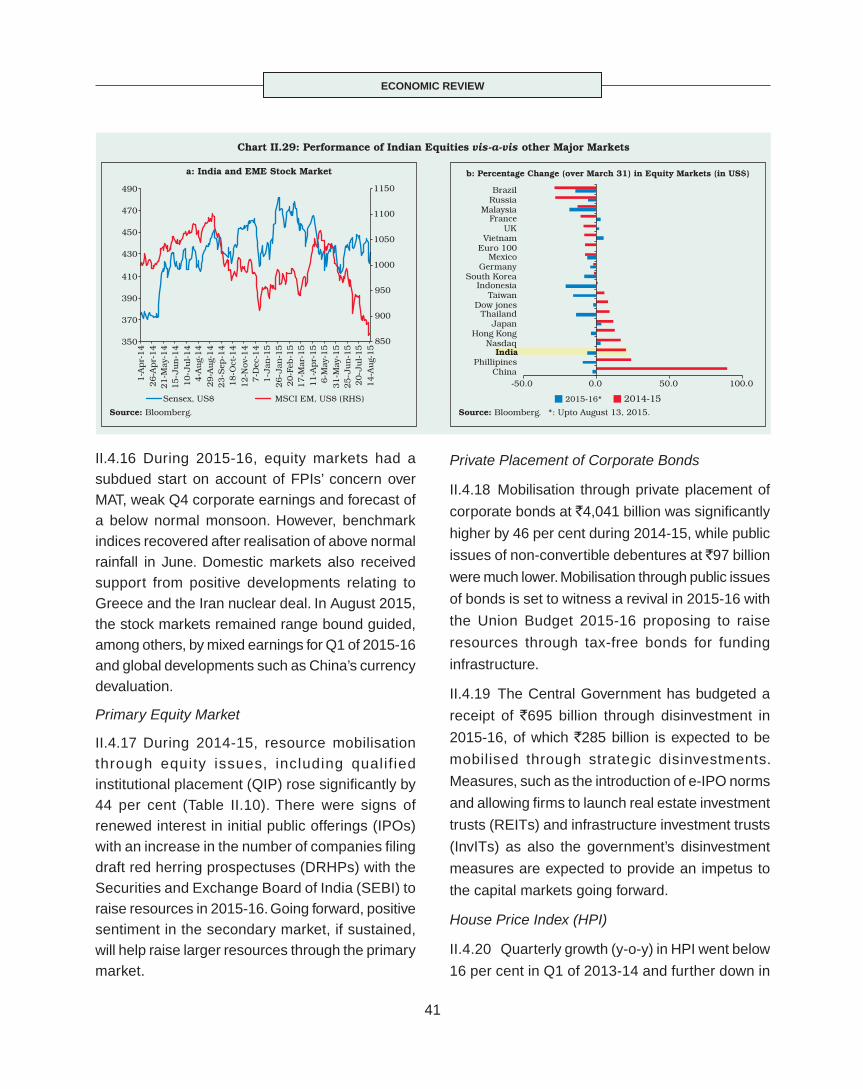
ECONOMIC REVIEW
41
II.4.16 During 2015-16, equity markets had a subdued start on account of FPIs’ concern over MAT, weak Q4 corporate earnings and forecast of a below normal monsoon. However, benchmark indices recovered after realisation of above normal rainfall in June. Domestic markets also received support from positive developments relating to Greece and the Iran nuclear deal. In August 2015, the stock markets remained range bound guided, among others, by mixed earnings for Q1 of 2015-16 and global developments such as China’s currency devaluation.
Primary Equity Market
II.4.17 During 2014-15, resource mobilisation through equity issues, including qualif ied institutional placement (QIP) rose signifi cantly by 44 per cent (Table II.10). There were signs of renewed interest in initial public offerings (IPOs) with an increase in the number of companies fi ling draft red herring prospectuses (DRHPs) with the Securities and Exchange Board of India (SEBI) to raise resources in 2015-16. Going forward, positive sentiment in the secondary market, if sustained, will help raise larger resources through the primary market.
Private Placement of Corporate Bonds
II.4.18 Mobilisation through private placement of
corporate bonds at `4,041 billion was signifi cantly
higher by 46 per cent during 2014-15, while public
issues of non-convertible debentures at `97 billion
were much lower. Mobilisation through public issues
of bonds is set to witness a revival in 2015-16 with
the Union Budget 2015-16 proposing to raise
resources through tax-free bonds for funding
infrastructure.
II.4.19 The Central Government has budgeted a
receipt of `695 billion through disinvestment in
2015-16, of which `285 billion is expected to be
mobilised through strategic disinvestments.
Measures, such as the introduction of e-IPO norms
and allowing fi rms to launch real estate investment
trusts (REITs) and infrastructure investment trusts
(InvITs) as also the government’s disinvestment
measures are expected to provide an impetus to
the capital markets going forward.
House Price Index (HPI)
II.4.20 Quarterly growth (y-o-y) in HPI went below
16 per cent in Q1 of 2013-14 and further down in
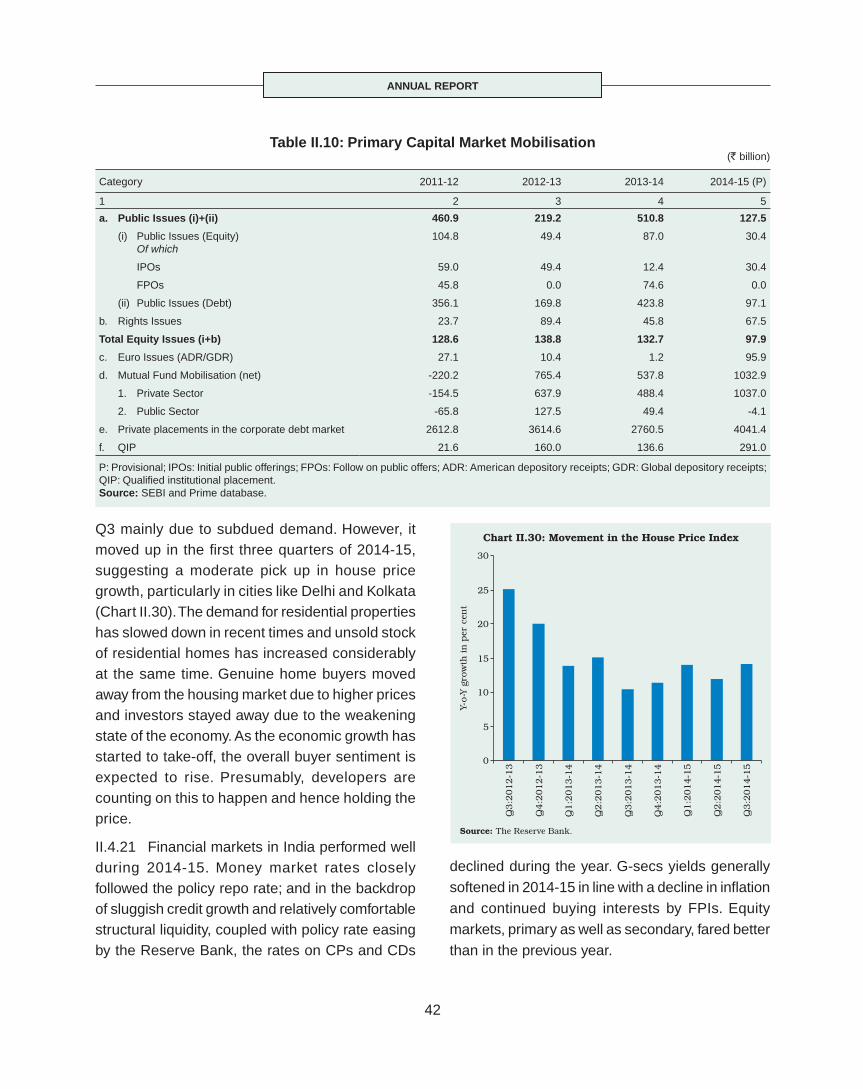
ANNUAL REPORT
42
Q3 mainly due to subdued demand. However, it moved up in the fi rst three quarters of 2014-15, suggesting a moderate pick up in house price growth, particularly in cities like Delhi and Kolkata (Chart II.30). The demand for residential properties has slowed down in recent times and unsold stock of residential homes has increased considerably at the same time. Genuine home buyers moved away from the housing market due to higher prices and investors stayed away due to the weakening state of the economy. As the economic growth has started to take-off, the overall buyer sentiment is expected to rise. Presumably, developers are counting on this to happen and hence holding the price.
II.4.21 Financial markets in India performed well during 2014-15. Money market rates closely followed the policy repo rate; and in the backdrop of sluggish credit growth and relatively comfortable structural liquidity, coupled with policy rate easing by the Reserve Bank, the rates on CPs and CDs
declined during the year. G-secs yields generally softened in 2014-15 in line with a decline in infl ation and continued buying interests by FPIs. Equity markets, primary as well as secondary, fared better than in the previous year.
Table II.10: Primary Capital Market Mobilisation (` billion)
Category 2011-12 2012-13 2013-14 2014-15 (P)
1 2 3 4 5
a. Public Issues (i)+(ii) 460.9 219.2 510.8 127.5
(i) Public Issues (Equity) Of which
104.8 49.4 87.0 30.4
IPOs 59.0 49.4 12.4 30.4
FPOs 45.8 0.0 74.6 0.0
(ii) Public Issues (Debt) 356.1 169.8 423.8 97.1
b. Rights Issues 23.7 89.4 45.8 67.5
Total Equity Issues (i+b) 128.6 138.8 132.7 97.9
c. Euro Issues (ADR/GDR) 27.1 10.4 1.2 95.9
d. Mutual Fund Mobilisation (net) -220.2 765.4 537.8 1032.9
1. Private Sector -154.5 637.9 488.4 1037.0
2. Public Sector -65.8 127.5 49.4 -4.1
e. Private placements in the corporate debt market 2612.8 3614.6 2760.5 4041.4
f. QIP 21.6 160.0 136.6 291.0
P: Provisional; IPOs: Initial public offerings; FPOs: Follow on public offers; ADR: American depository receipts; GDR: Global depository receipts;QIP: Qualifi ed institutional placement.Source: SEBI and Prime database.

ECONOMIC REVIEW
43
II.5 GOVERNMENT FINANCES
II.5.1 Public fi nances have been gradually improving at the level of both the Centre and the states. The impetus for rectitude has mainly emanated from a re-commitment to calibrated paths of fiscal consolidation in the post-global crisis period. Initially quantity-driven, these efforts have been guided by the imperative to stabilise fi scal consolidation on the chosen trajectories and then to re-order expenditure priorities from subsidies to investment, to raise tax buoyancy, to rationalise non-developmental spending and leakages and to contain public debt at sustainable levels for all layers of the government. With annual budgetary targets for the gross fi scal defi cit (GFD) met since 2012-13, attention has increasingly turned to the quality of fi scal consolidation. Key defi cit indicators of the Central Government were lower in 2014-15, as per the provisional accounts (PA), than a year ago. GFD was lower than the budgetary target, both in absolute terms and as percentage of GDP.
Centre: Receipts and Expenditure
II.5.2 In 2014-15 (provisional accounts), non-debt receipts were sluggish refl ecting tepid domestic activity. While gross tax collection suffered a shortfall of 8.8 per cent from the budget estimates
(BE), net tax infl ows turned out to be 7.7 per cent lower than BE, mainly on account of subdued indirect tax receipts. Non-tax revenue was also lower than BE due to lower collections from general, economic, fi scal and social services. Non-debt capital receipts were signifi cantly lower than the budgetary target, refl ecting a large shortfall in disinvestment proceeds.
II.5.3 The shortfall in non-debt receipts warranted a sharp cutback in plan expenditure by more than 20 per cent, both on the revenue and capital accounts, in order to meet defi cit targets. A marginal reduction in non-plan expenditure over BE was also effected through reduction in capital expenditure and interest payments.
II.5.4 Both overall capital expenditure and capital outlay were lower than budgeted levels and also lower than last year’s levels. This has potentially adverse implications for growth in the medium term.
Recalibration of the Fiscal Consolidation Path in 2015-16
II.5.5 Union Budget 2015-16 has carried forward the process of fi scal consolidation, with all the key defi cit indicators projected to decline (Table II.11). The targeted reduction in GFD is proposed to be
Table II.11: Fiscal Performance of the Central Government(Per cent of GDP)
Variables 2004-08 (Avg) 2008-10 (Avg) 2010-14 (Avg) 2013-14 2014-15(RE) 2014-15 (PA) 2015-16 (BE)
1 2 3 4 5 6 7 8
Non Debt Receipts 10.4 9.5 9.5 9.3 9.3 9.1 8.7Tax revenue 7.8 7.5 7.3 7.2 7.2 7.2 6.5
Non-tax revenue 2.1 1.8 1.8 1.8 1.7 1.6 1.6
Non debt capital receipts 0.4 0.3 0.4 0.4 0.3 0.3 0.6
Total Expenditure 14.2 15.8 14.5 13.7 13.4 13.1 12.6Revenue expenditure 11.9 14.1 12.7 12.1 11.9 11.6 10.9
Capital expenditure 2.3 1.7 1.8 1.7 1.5 1.5 1.7
Plan expenditure 4.0 4.8 4.4 4.0 3.7 3.6 3.3
Non-plan expenditure 10.2 11.0 10.1 9.7 9.7 9.5 9.3
Revenue Defi cit 2.0 4.9 3.6 3.1 2.9 2.9 2.8Gross Fiscal Defi cit 3.4 6.2 5.0 4.4 4.1 4.0 3.9
Note: 1. Avg: Average; RE: Revised Estimates; PA: Provisional Accounts; BE: Budget Estimates. 2. GDP 2014-15 is as per Provisional Estimates of CSO.

ANNUAL REPORT
44
attained by a compression in revenue expenditure combined with an increase in non-debt capital receipts. The goalpost for achieving the GFD-GDP target of 3.0 per cent under the FRBM Act/Rules has been shifted by a year to 2017-18 mainly to accommodate higher public investment to support growth, and higher devolution to the states following the recommendations of 14th Finance Commission as also accounting for uncertainties associated with the implementation of the Goods and Services Tax (GST) and the likely burden of the 7th Pay Commission award.
Targets for Indirect Taxes and Disinvestment Proceeds
II.5.6 With an expected growth of 16.4 per cent in gross tax revenue, the ratio of gross tax revenue to GDP is estimated to improve by 0.4 percentage points to 10.3 per cent in 2015-16. The net tax revenue accruing to the Centre is, however, budgeted signifi cantly lower at 6.5 per cent of GDP – down from 7.2 per cent in 2014-15 (PA) due to higher devolution to the states following the 14th Finance Commission award. The implied tax buoyancy for gross tax revenue is signifi cantly higher than the realised buoyancy of less than 1 in the previous two years (Table II.12). Further, the projected increase of 18.9 per cent in indirect taxes as against 9.8 per cent realised in 2014-15 (PA) assumes a buoyancy of about 2 for service tax on
the back of a hike in the service tax rate (inclusive of education cess) by 1.64 per cent, pruning of the Negative List under service tax and withdrawal of certain other exemptions to widen the tax base. The projected buoyancy of 1.73 in the case of excise duty collections is mainly supported by ad hoc hikes in excise duty on petrol and diesel in 2014-15, increase in excise duty on select products, such as mobile handsets and cigarettes, imposition of excise duty on hitherto untaxed items like condensed milk and peanut butter, and a general increase in excise duty to 12.5 per cent from the prevailing 12.36 per cent. While these measures will facilitate meeting budgeted targets for indirect tax collections in 2015-16, it is crucial to adhere to the timeline for the rollout of GST for a sustainable increase in tax revenues in the medium term.
II.5.7 Non-tax revenue, which includes dividends from public sector undertakings (PSUs), the Reserve Bank, PSU banks and spectrum charges, is budgeted to grow at 12.6 per cent in 2015-16. Disinvestment proceeds are budgeted higher at `410 billion, with an additional infl ow of ̀ 285 billion estimated out of strategic disinvestments. The projected increase of about 179 per cent in disinvestment receipts, despite a track record to the contrary in terms of actual realisation, poses possible risks to overall budgetary targets for 2015-16.
Table II.12: Tax Buoyancy and Growth Rates in Tax Collections*
Tax Categories Tax Buoyancy Growth Rates (Per cent)
2013-14 2014-15(PA) 2015-16 (BE) 2013-14 2014-15(PA) 2015-16 (BE)
1 2 3 4 5 6 7
Gross Tax Revenue 0.73 0.89 1.31 9.9 9.3 16.4
Corporation Tax 0.79 0.82 0.78 10.8 8.7 9.7
Income Tax 1.55 0.82 1.93 21.0 8.6 24.2
Customs Duty 0.30 0.88 0.86 4.1 9.3 10.8
Union Excise Duty -0.24 1.05 1.73 -3.2 11.1 21.6
Service Tax 1.23 0.81 1.99 16.7 8.5 24.9
*: Buoyancies are worked out with respect to overall GDP growth rate.

ECONOMIC REVIEW
45
Expenditure Pattern
II.5.8 The Centre’s total expenditure is budgeted to increase by 8.1 per cent in 2015-16 (BE) with revenue expenditure declining as a proportion to GDP. Capital expenditure is budgeted to increase sharply, refl ecting the projected high growth in non-defence capital outlay.
II.5.9 Plan expenditure is expected to increase marginally in 2015-16 reflecting higher capital expenditure. In the non-plan expenditure, subsidies are budgeted to decline on account of around 48 per cent cut in petroleum subsidy following a sharp
fall in international crude prices and the deregulation of the retail sale of diesel that was undertaken in 2014. Food subsidies are budgeted to increase at a modest pace, while fertiliser subsidies are expected to decline.
Quality of Fiscal Adjustment in 2015-16
II.5.10 Overall, the Government’s plan for fi scal consolidation in 2015-16 through re-orientation of public expenditure in favour of investment rather than subsidies is a welcome move towards improving the quality of fi scal adjustment (Box II.5). Towards achieving this, it will be important to
Box II.5Quality of Fiscal Adjustment
In the aftermath of the global fi nancial crisis, government fi nances deteriorated signifi cantly across the world as fi scal stimulus measures were introduced to reinvigorate the growth process and kick-start national economies worldwide. Both advanced and emerging market economies have embarked on fi scal consolidation since 2010, although the speed and extent of consolidation has been country-specifi c. In India, fi scal consolidation resumed from the second half of 2012-13, bringing about a steady decline in the centre’s gross fi scal defi cit (GFD) from 5.8 per cent of GDP in 2011-12 to 4.0 per cent in 2014-15 (PA). Notwithstanding such improvement, the quality of fi scal adjustment has remained a cause for concern.
Ideally, a fi scal consolidation strategy should be a mix of rationalisation of expenditure and revenue augmentation so that the welfare burden of consolidation is fairly distributed across society. Apart from obvious steps like reducing government consumption and unproductive expenditure, such as subsidies, a consolidation process must deploy freed-up resources in higher public investment and/or more social spending via transfers to the poor. This will induce medium term growth that can compensate the near-term decline in output. Adjustments must necessarily be accompanied by structural reforms to enhance productivity and a credible fi scal consolidation roadmap that will anchor market expectations (Tapsoba 2013).
Fiscal consolidation in India has primarily been effected through aggressive cut-backs in expenditure, both on the revenue and capital accounts due to non-realisation of budgeted non-debt receipts. As a result, the onus of fi scal consolidation has disproportionately fallen on expenditure compression. In the process, certain productive expenditures under the central plan suffered cuts in excess of 20 per cent over budget estimates during 2012-13 to 2014-15 (RE). These include irrigation and fl ood control, communications, rural development and education. Plan capital expenditure suffered a shortfall of 14.4 per cent, on an average, during this period. Fiscal rectitude based on cutbacks in capital expenditure has adverse effects on sustainable growth since the multiplier effects of capital expenditure are found to be larger and more prolonged than those of revenue expenditure (Jain and Kumar 2013).1
Union Budget 2015-16 has envisaged a reorientation of government expenditure with capital expenditure budgeted to grow at 29.1 per cent, while expenditure on subsidies is projected to undergo a decline (Chart 1). This re-prioritisation of government expenditure along with the other initiatives discussed in Section II.1 of this Chapter is expected to facilitate pick up in investment in the economy. While this is indicative of an improvement in the quality of expenditure, it is imperative that budgeted targets are converted into actual realisation. In the past three years, the government has been
(Contd....)
1 As per Jain and Kumar’s (2013) estimates, the impact multipliers of non-defence capital outlay, revenue expenditure and aggregate expenditure for the Central Government are 2.09, 0.19 and 0.40, respectively.

ANNUAL REPORT
46
realise the budgeted revenue on the one hand, and adhere to the budgeted expenditure on subsidies on the other (Chart II.31).
II.5.11 Food subsidy is budgeted to increase modestly in 2015-16, despite the proposed expansion in coverage under the National Food Security Act. Capping the food subsidy within the budgeted level will involve a multi-pronged strategy: end-to-end computerisation of the public distribution system, decentralisation of procurement and distribution of food grains and improving the operational effi ciency of the Food Corporation of India (FCI). Through direct benefi t transfers (DBTs),
the government may economise on food subsidy expenditure by eliminating costs associated with procuring, distributing and storing foodgrains. The recently announced Urea Policy of the government, which aims at maximising indigenous production and promoting energy effi ciency in urea production units, so as to reduce import dependency and hydrocarbon inputs respectively, is expected to result in direct savings in the fertiliser subsidy of around ̀ 26.2 billion and indirect savings of around `22.1 billion, respectively, over the next four years on account of reduced energy consumption and import substitution.
II.5.12 As per the latest available information, the key defi cit indicators of the Central Government, viz., GFD and RD, as percentages to their budget estimates (BE), were lower during April-June 2015 than in the corresponding period of the previous year. Despite higher total expenditure, robust non-debt receipts resulted in lower GFD during this period. Higher collections under all categories of indirect taxes and higher non-tax revenue provided a boost to the Central Government’s receipts. While outgo on major subsidies was lower, capital expenditure was higher on account of higher growth in plan capital expenditure. On July 31, 2015, the Government has approved additional provision of `255 billion sought through the first batch of Supplementary Demand for Grants for 2015-16 to
effecting a cut of about 19 per cent in the actual capital outlay
over budgeted levels in view of revenue shortfalls. A
comprehensive fi scal consolidation strategy will also need
sustainable improvement in government revenue.
References:
Jain, R., and P. Kumar (2013), ‘Size of Government
Expenditure Multipliers in India: A Structural VAR Analysis’,
RBI Working Paper No. 07.
Tapsoba, S. J. (2013), ‘Options and strategies for fi scal
consolidation in India’, IMF Working Paper No.127.
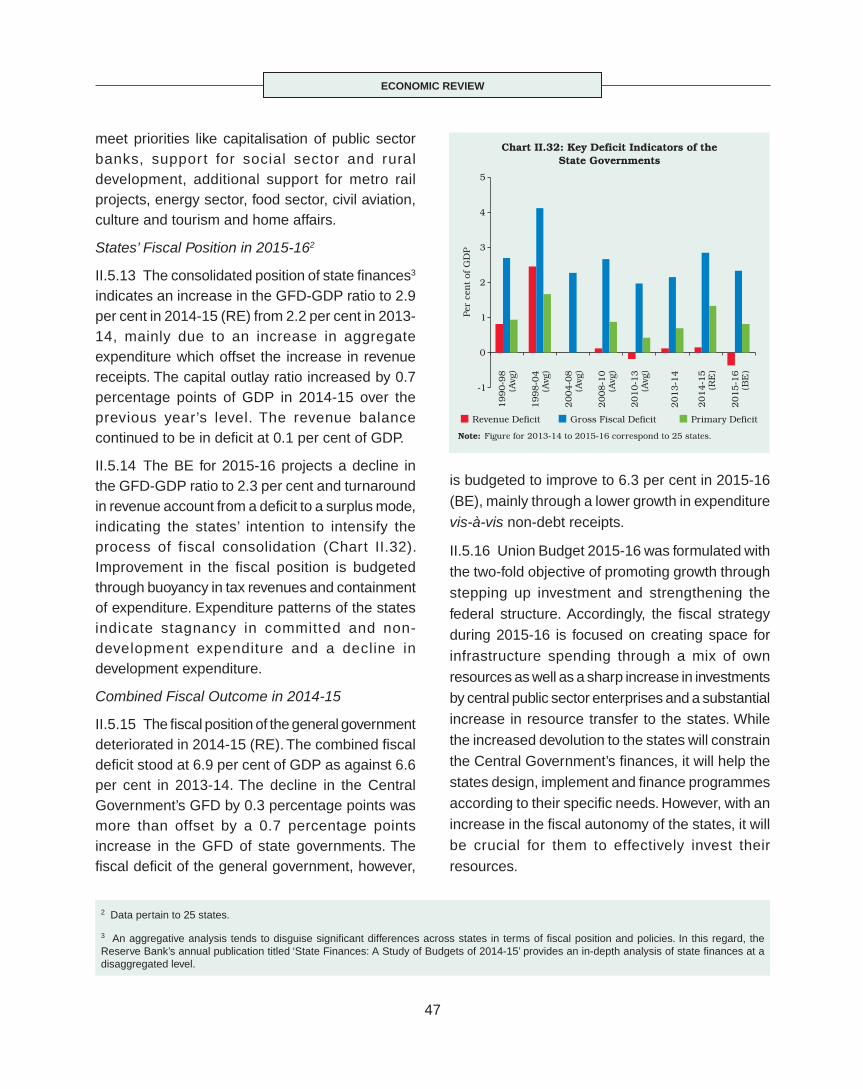
ECONOMIC REVIEW
47
meet priorities like capitalisation of public sector banks, suppor t for social sector and rural development, additional support for metro rail projects, energy sector, food sector, civil aviation, culture and tourism and home affairs.
States’ Fiscal Position in 2015-162
II.5.13 The consolidated position of state fi nances3 indicates an increase in the GFD-GDP ratio to 2.9 per cent in 2014-15 (RE) from 2.2 per cent in 2013-14, mainly due to an increase in aggregate expenditure which offset the increase in revenue receipts. The capital outlay ratio increased by 0.7 percentage points of GDP in 2014-15 over the previous year’s level. The revenue balance continued to be in defi cit at 0.1 per cent of GDP.
II.5.14 The BE for 2015-16 projects a decline in the GFD-GDP ratio to 2.3 per cent and turnaround in revenue account from a defi cit to a surplus mode, indicating the states’ intention to intensify the process of fiscal consolidation (Chart II.32). Improvement in the fi scal position is budgeted through buoyancy in tax revenues and containment of expenditure. Expenditure patterns of the states indicate stagnancy in committed and non-development expenditure and a decline in development expenditure.
Combined Fiscal Outcome in 2014-15
II.5.15 The fi scal position of the general government deteriorated in 2014-15 (RE). The combined fi scal defi cit stood at 6.9 per cent of GDP as against 6.6 per cent in 2013-14. The decline in the Central Government’s GFD by 0.3 percentage points was more than offset by a 0.7 percentage points increase in the GFD of state governments. The fi scal defi cit of the general government, however,
is budgeted to improve to 6.3 per cent in 2015-16 (BE), mainly through a lower growth in expenditure vis-à-vis non-debt receipts.
II.5.16 Union Budget 2015-16 was formulated with the two-fold objective of promoting growth through stepping up investment and strengthening the federal structure. Accordingly, the fi scal strategy during 2015-16 is focused on creating space for infrastructure spending through a mix of own resources as well as a sharp increase in investments by central public sector enterprises and a substantial increase in resource transfer to the states. While the increased devolution to the states will constrain the Central Government’s fi nances, it will help the states design, implement and fi nance programmes according to their specifi c needs. However, with an increase in the fi scal autonomy of the states, it will be crucial for them to effectively invest their resources.
2 Data pertain to 25 states.
3 An aggregative analysis tends to disguise signifi cant differences across states in terms of fi scal position and policies. In this regard, the Reserve Bank’s annual publication titled ‘State Finances: A Study of Budgets of 2014-15’ provides an in-depth analysis of state fi nances at a disaggregated level.
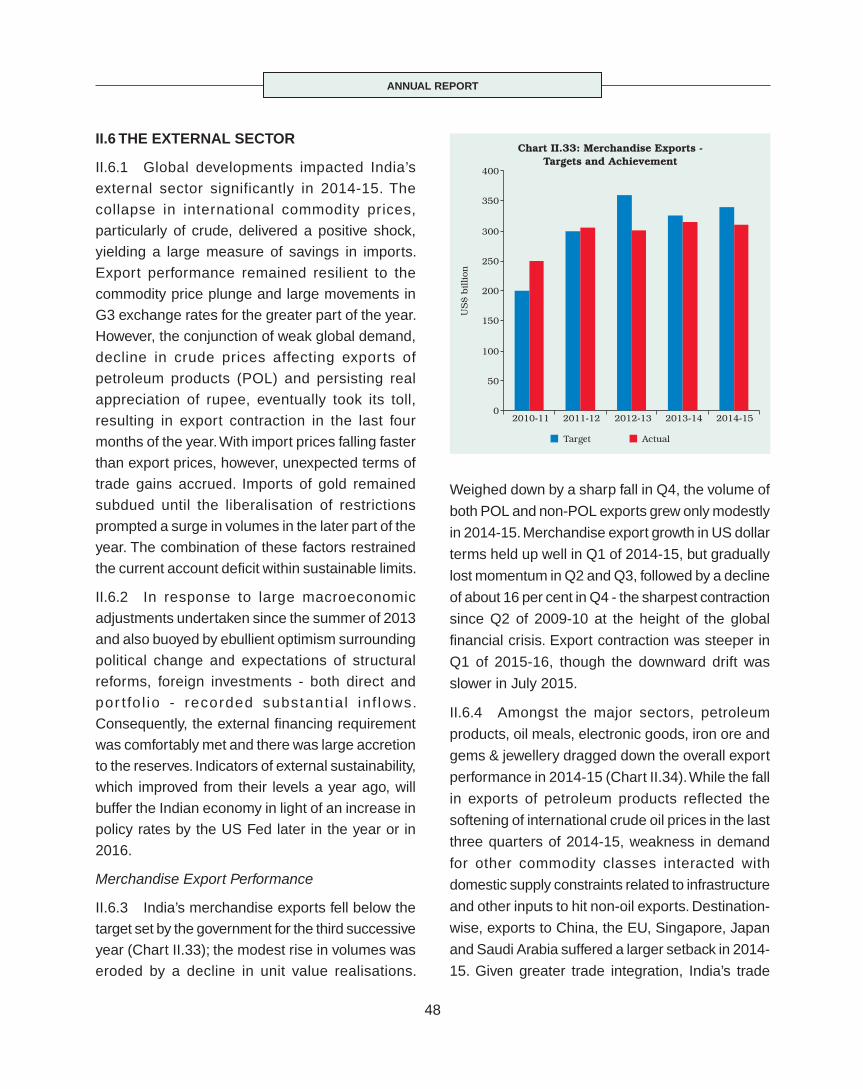
ANNUAL REPORT
48
II.6 THE EXTERNAL SECTOR
II.6.1 Global developments impacted India’s external sector significantly in 2014-15. The collapse in international commodity prices, particularly of crude, delivered a positive shock, yielding a large measure of savings in imports. Export performance remained resilient to the commodity price plunge and large movements in G3 exchange rates for the greater part of the year. However, the conjunction of weak global demand, decline in crude prices affecting exports of petroleum products (POL) and persisting real appreciation of rupee, eventually took its toll, resulting in export contraction in the last four months of the year. With import prices falling faster than export prices, however, unexpected terms of trade gains accrued. Imports of gold remained subdued until the liberalisation of restrictions prompted a surge in volumes in the later part of the year. The combination of these factors restrained the current account defi cit within sustainable limits.
II.6.2 In response to large macroeconomic adjustments undertaken since the summer of 2013 and also buoyed by ebullient optimism surrounding political change and expectations of structural reforms, foreign investments - both direct and por t fo l io - recorded substant ia l inf lows. Consequently, the external fi nancing requirement was comfortably met and there was large accretion to the reserves. Indicators of external sustainability, which improved from their levels a year ago, will buffer the Indian economy in light of an increase in policy rates by the US Fed later in the year or in 2016.
Merchandise Export Performance
II.6.3 India’s merchandise exports fell below the target set by the government for the third successive year (Chart II.33); the modest rise in volumes was eroded by a decline in unit value realisations.
Weighed down by a sharp fall in Q4, the volume of
both POL and non-POL exports grew only modestly
in 2014-15. Merchandise export growth in US dollar
terms held up well in Q1 of 2014-15, but gradually
lost momentum in Q2 and Q3, followed by a decline
of about 16 per cent in Q4 - the sharpest contraction
since Q2 of 2009-10 at the height of the global
fi nancial crisis. Export contraction was steeper in
Q1 of 2015-16, though the downward drift was
slower in July 2015.
II.6.4 Amongst the major sectors, petroleum
products, oil meals, electronic goods, iron ore and
gems & jewellery dragged down the overall export
performance in 2014-15 (Chart II.34). While the fall
in exports of petroleum products reflected the
softening of international crude oil prices in the last
three quarters of 2014-15, weakness in demand
for other commodity classes interacted with
domestic supply constraints related to infrastructure
and other inputs to hit non-oil exports. Destination-
wise, exports to China, the EU, Singapore, Japan
and Saudi Arabia suffered a larger setback in 2014-
15. Given greater trade integration, India’s trade

ECONOMIC REVIEW
49
seems to have become increasingly responsive to global economic and fi nancial conditions (Box II.6).
Merchandise Imports
II.6.5 The plunge in global prices of crude oil by nearly 50 per cent between June 2014 and March 2015 compressed India’s POL import bill by 16 per cent yielding a saving of US$ 26.5 billion in relation to the outgo on this account a year ago. Global crude oil prices stayed modest in Q1 of 2015-16 (Chart II.35). Gold imports, however, recorded an increase in terms of both value (20 per cent) and volume (38 per cent) in response to a surge in demand in H2 of 2014-15. The uptick in gold imports in the later part of 2014-15 could largely be attributed to festival demand, permission to trading
Box II.6Trade Linkages and Elasticities
India’s cross-border trade linkages have strengthened over time. Not only has India diversifi ed its exports in terms of destinations, but its participation in global value chains (GVCs) has also increased over the years, albeit at a lower level than other peer economies (Chart 1), particularly in chemicals and electrical equipment (OECD 2014). Participation in GVC allows domestic fi rms to enter markets by specialising in niche intermediate activities within a chain and enables suppliers to upgrade production into higher-value segments of their industries. This enhances comparative advantages, productivity growth and development levels in economies.
Greater cross-border linkages through GVCs also tend to increase the sensitivity of trade to external business cycle shocks (Gangnes et al. 2014). Since the world is gradually transitioning to a stage in which GVC trade is assuming more importance than it did before, there appears to have been a long-run increase in the elasticity of global trade with respect to world economic activity (Escaith et al. 2010). In this context, estimation of country-specifi c trade elasticities assumes importance, especially in an international environment in which competitive monetary policy stances and exchange rate effects have implications for export competitiveness.
(Contd....)
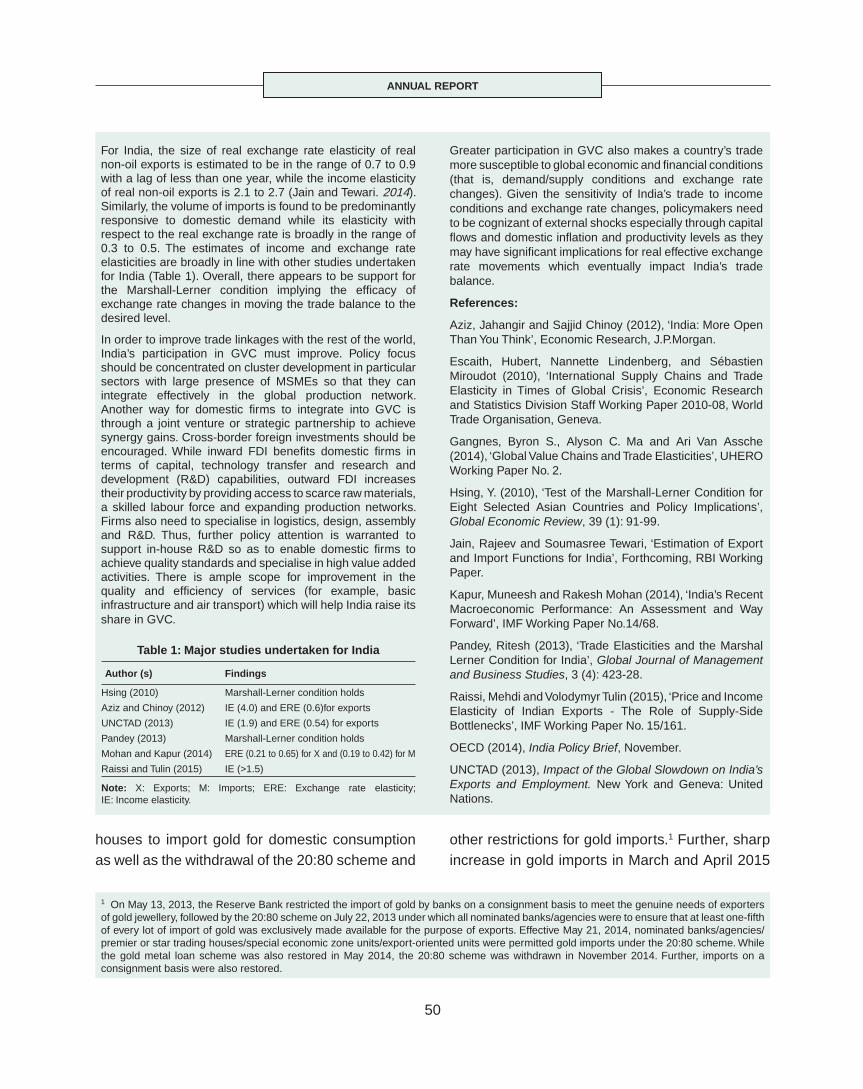
ANNUAL REPORT
50
houses to import gold for domestic consumption as well as the withdrawal of the 20:80 scheme and
other restrictions for gold imports.1 Further, sharp increase in gold imports in March and April 2015
Greater participation in GVC also makes a country’s trade more susceptible to global economic and fi nancial conditions (that is, demand/supply conditions and exchange rate changes). Given the sensitivity of India’s trade to income conditions and exchange rate changes, policymakers need to be cognizant of external shocks especially through capital fl ows and domestic infl ation and productivity levels as they may have signifi cant implications for real effective exchange rate movements which eventually impact India’s trade balance.
References:
Aziz, Jahangir and Sajjid Chinoy (2012), ‘India: More Open Than You Think’, Economic Research, J.P.Morgan.
Escaith, Hubert, Nannette Lindenberg, and Sébastien Miroudot (2010), ‘International Supply Chains and Trade Elasticity in Times of Global Crisis’, Economic Research and Statistics Division Staff Working Paper 2010-08, World Trade Organisation, Geneva.
Gangnes, Byron S., Alyson C. Ma and Ari Van Assche (2014), ‘Global Value Chains and Trade Elasticities’, UHERO Working Paper No. 2.
Hsing, Y. (2010), ‘Test of the Marshall-Lerner Condition for Eight Selected Asian Countries and Policy Implications’, Global Economic Review, 39 (1): 91-99.
Jain, Rajeev and Soumasree Tewari, ‘Estimation of Export and Import Functions for India’, Forthcoming, RBI Working Paper.
Kapur, Muneesh and Rakesh Mohan (2014), ‘India’s Recent Macroeconomic Performance: An Assessment and Way Forward’, IMF Working Paper No.14/68.
Pandey, Ritesh (2013), ‘Trade Elasticities and the Marshal Lerner Condition for India’, Global Journal of Management and Business Studies, 3 (4): 423-28.
Raissi, Mehdi and Volodymyr Tulin (2015), ‘Price and Income Elasticity of Indian Exports - The Role of Supply-Side Bottlenecks’, IMF Working Paper No. 15/161.
OECD (2014), India Policy Brief, November.
UNCTAD (2013), Impact of the Global Slowdown on India’s Exports and Employment. New York and Geneva: United Nations.
Table 1: Major studies undertaken for India
Author (s) Findings
Hsing (2010) Marshall-Lerner condition holds
Aziz and Chinoy (2012) IE (4.0) and ERE (0.6)for exports
UNCTAD (2013) IE (1.9) and ERE (0.54) for exports
Pandey (2013) Marshall-Lerner condition holds
Mohan and Kapur (2014) ERE (0.21 to 0.65) for X and (0.19 to 0.42) for M
Raissi and Tulin (2015) IE (>1.5)
Note: X: Exports; M: Imports; ERE: Exchange rate elasticity; IE: Income elasticity.
For India, the size of real exchange rate elasticity of real non-oil exports is estimated to be in the range of 0.7 to 0.9 with a lag of less than one year, while the income elasticity of real non-oil exports is 2.1 to 2.7 (Jain and Tewari. 2014). Similarly, the volume of imports is found to be predominantly responsive to domestic demand while its elasticity with respect to the real exchange rate is broadly in the range of 0.3 to 0.5. The estimates of income and exchange rate elasticities are broadly in line with other studies undertaken for India (Table 1). Overall, there appears to be support for the Marshall-Lerner condition implying the effi cacy of exchange rate changes in moving the trade balance to the desired level.
In order to improve trade linkages with the rest of the world, India’s participation in GVC must improve. Policy focus should be concentrated on cluster development in particular sectors with large presence of MSMEs so that they can integrate effectively in the global production network. Another way for domestic fi rms to integrate into GVC is through a joint venture or strategic partnership to achieve synergy gains. Cross-border foreign investments should be encouraged. While inward FDI benefi ts domestic fi rms in terms of capital, technology transfer and research and development (R&D) capabilities, outward FDI increases their productivity by providing access to scarce raw materials, a skilled labour force and expanding production networks. Firms also need to specialise in logistics, design, assembly and R&D. Thus, further policy attention is warranted to support in-house R&D so as to enable domestic fi rms to achieve quality standards and specialise in high value added activities. There is ample scope for improvement in the quality and effi ciency of services (for example, basic infrastructure and air transport) which will help India raise its share in GVC.
1 On May 13, 2013, the Reserve Bank restricted the import of gold by banks on a consignment basis to meet the genuine needs of exporters of gold jewellery, followed by the 20:80 scheme on July 22, 2013 under which all nominated banks/agencies were to ensure that at least one-fi fth of every lot of import of gold was exclusively made available for the purpose of exports. Effective May 21, 2014, nominated banks/agencies/premier or star trading houses/special economic zone units/export-oriented units were permitted gold imports under the 20:80 scheme. While the gold metal loan scheme was also restored in May 2014, the 20:80 scheme was withdrawn in November 2014. Further, imports on a consignment basis were also restored.
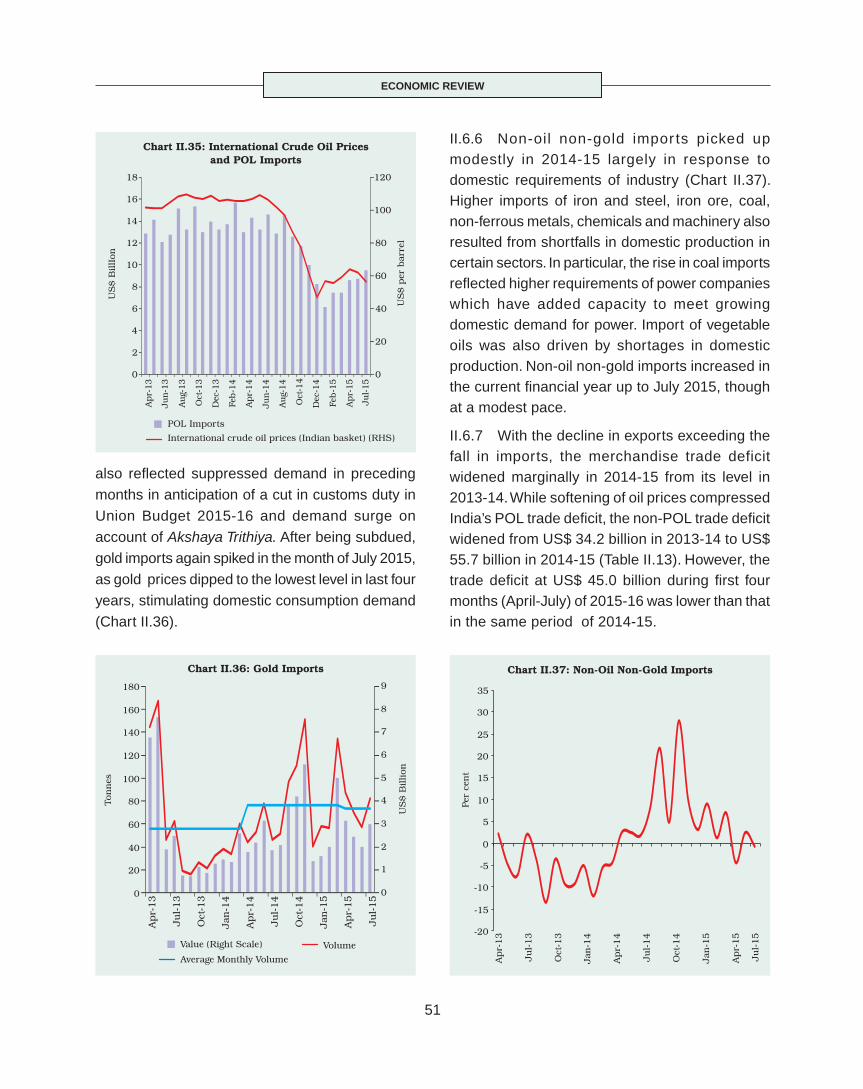
ECONOMIC REVIEW
51
also refl ected suppressed demand in preceding
months in anticipation of a cut in customs duty in
Union Budget 2015-16 and demand surge on
account of Akshaya Trithiya. After being subdued,
gold imports again spiked in the month of July 2015,
as gold prices dipped to the lowest level in last four
years, stimulating domestic consumption demand
(Chart II.36).
II.6.6 Non-oil non-gold impor ts picked up modestly in 2014-15 largely in response to domestic requirements of industry (Chart II.37). Higher imports of iron and steel, iron ore, coal, non-ferrous metals, chemicals and machinery also resulted from shortfalls in domestic production in certain sectors. In particular, the rise in coal imports refl ected higher requirements of power companies which have added capacity to meet growing domestic demand for power. Import of vegetable oils was also driven by shortages in domestic production. Non-oil non-gold imports increased in the current fi nancial year up to July 2015, though at a modest pace.
II.6.7 With the decline in exports exceeding the fall in imports, the merchandise trade deficit widened marginally in 2014-15 from its level in 2013-14. While softening of oil prices compressed India’s POL trade defi cit, the non-POL trade defi cit widened from US$ 34.2 billion in 2013-14 to US$ 55.7 billion in 2014-15 (Table II.13). However, the trade defi cit at US$ 45.0 billion during fi rst four months (April-July) of 2015-16 was lower than that in the same period of 2014-15.
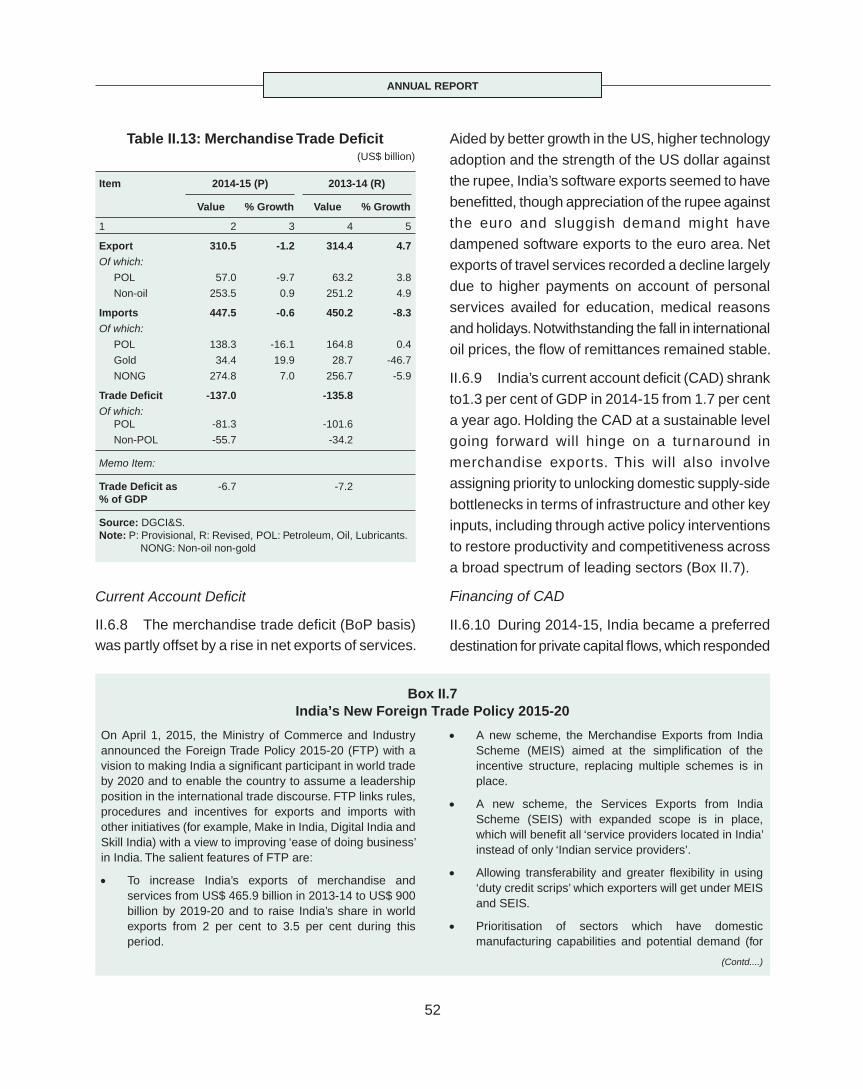
ANNUAL REPORT
52
Current Account Defi cit
II.6.8 The merchandise trade defi cit (BoP basis) was partly offset by a rise in net exports of services.
Aided by better growth in the US, higher technology adoption and the strength of the US dollar against the rupee, India’s software exports seemed to have benefi tted, though appreciation of the rupee against the euro and sluggish demand might have dampened software exports to the euro area. Net exports of travel services recorded a decline largely due to higher payments on account of personal services availed for education, medical reasons and holidays. Notwithstanding the fall in international oil prices, the fl ow of remittances remained stable.
II.6.9 India’s current account defi cit (CAD) shrank to1.3 per cent of GDP in 2014-15 from 1.7 per cent a year ago. Holding the CAD at a sustainable level going forward will hinge on a turnaround in merchandise exports. This will also involve assigning priority to unlocking domestic supply-side bottlenecks in terms of infrastructure and other key inputs, including through active policy interventions to restore productivity and competitiveness across a broad spectrum of leading sectors (Box II.7).
Financing of CAD
II.6.10 During 2014-15, India became a preferred destination for private capital fl ows, which responded
Table II.13: Merchandise Trade Defi cit(US$ billion)
Item 2014-15 (P) 2013-14 (R)
Value % Growth Value % Growth
1 2 3 4 5
Export 310.5 -1.2 314.4 4.7Of which:
POL 57.0 -9.7 63.2 3.8
Non-oil 253.5 0.9 251.2 4.9
Imports 447.5 -0.6 450.2 -8.3Of which:
POL 138.3 -16.1 164.8 0.4
Gold 34.4 19.9 28.7 -46.7
NONG 274.8 7.0 256.7 -5.9
Trade Defi cit -137.0 -135.8Of which: POL -81.3 -101.6
Non-POL -55.7 -34.2
Memo Item:
Trade Defi cit as % of GDP
-6.7 -7.2
Source: DGCI&S.Note: P: Provisional, R: Revised, POL: Petroleum, Oil, Lubricants. NONG: Non-oil non-gold
Box II.7India’s New Foreign Trade Policy 2015-20
On April 1, 2015, the Ministry of Commerce and Industry announced the Foreign Trade Policy 2015-20 (FTP) with a vision to making India a signifi cant participant in world trade by 2020 and to enable the country to assume a leadership position in the international trade discourse. FTP links rules, procedures and incentives for exports and imports with other initiatives (for example, Make in India, Digital India and Skill India) with a view to improving ‘ease of doing business’ in India. The salient features of FTP are:
To increase India’s exports of merchandise and services from US$ 465.9 billion in 2013-14 to US$ 900 billion by 2019-20 and to raise India’s share in world exports from 2 per cent to 3.5 per cent during this period.
A new scheme, the Merchandise Exports from India Scheme (MEIS) aimed at the simplifi cation of the incentive structure, replacing multiple schemes is in place.
A new scheme, the Services Exports from India Scheme (SEIS) with expanded scope is in place, which will benefi t all ‘service providers located in India’ instead of only ‘Indian service providers’.
Allowing transferability and greater fl exibility in using ‘duty credit scrips’ which exporters will get under MEIS and SEIS.
Prioritisation of sectors which have domestic manufacturing capabilities and potential demand (for
(Contd....)
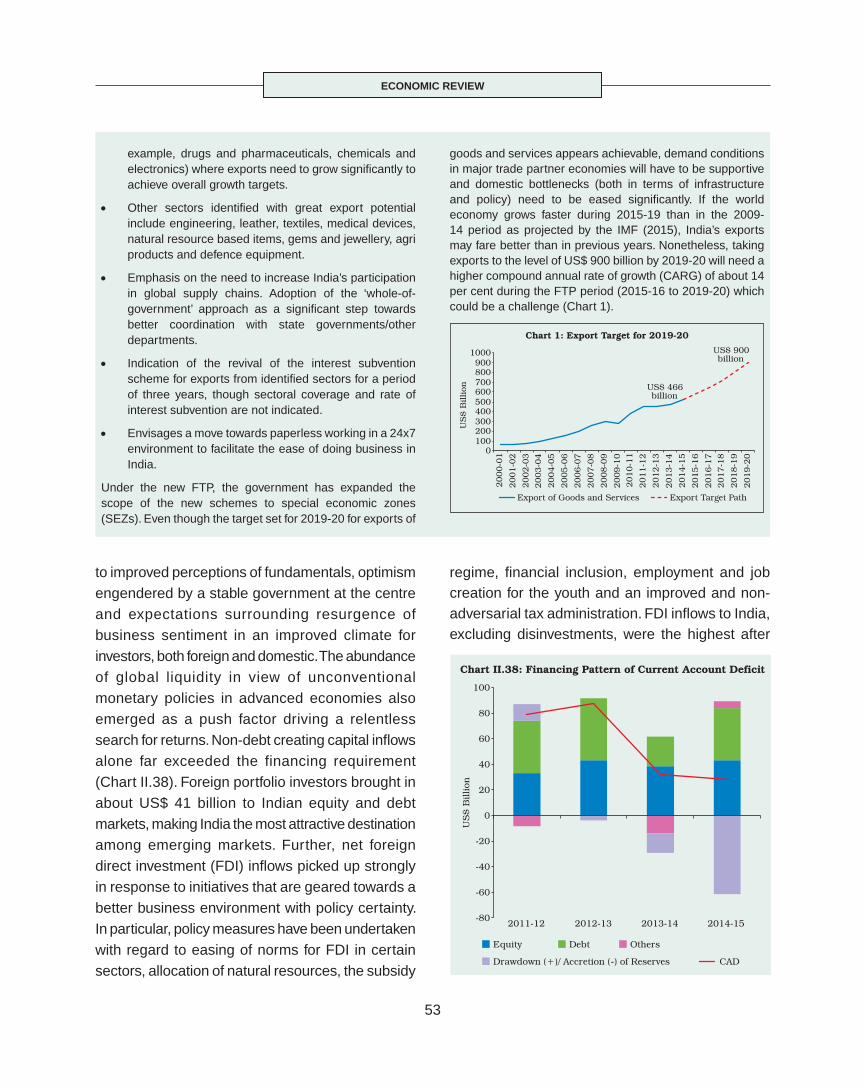
ECONOMIC REVIEW
53
to improved perceptions of fundamentals, optimism engendered by a stable government at the centre and expectations surrounding resurgence of business sentiment in an improved climate for investors, both foreign and domestic. The abundance of global liquidity in view of unconventional monetary policies in advanced economies also emerged as a push factor driving a relentless search for returns. Non-debt creating capital infl ows alone far exceeded the financing requirement (Chart II.38). Foreign portfolio investors brought in about US$ 41 billion to Indian equity and debt markets, making India the most attractive destination among emerging markets. Further, net foreign direct investment (FDI) infl ows picked up strongly in response to initiatives that are geared towards a better business environment with policy certainty. In particular, policy measures have been undertaken with regard to easing of norms for FDI in certain sectors, allocation of natural resources, the subsidy
regime, fi nancial inclusion, employment and job creation for the youth and an improved and non-adversarial tax administration. FDI infl ows to India, excluding disinvestments, were the highest after
example, drugs and pharmaceuticals, chemicals and electronics) where exports need to grow signifi cantly to achieve overall growth targets.
Other sectors identifi ed with great export potential include engineering, leather, textiles, medical devices, natural resource based items, gems and jewellery, agri products and defence equipment.
Emphasis on the need to increase India’s participation in global supply chains. Adoption of the ‘whole-of-government’ approach as a signifi cant step towards better coordination with state governments/other departments.
Indication of the revival of the interest subvention scheme for exports from identifi ed sectors for a period of three years, though sectoral coverage and rate of interest subvention are not indicated.
Envisages a move towards paperless working in a 24x7 environment to facilitate the ease of doing business in India.
Under the new FTP, the government has expanded the scope of the new schemes to special economic zones (SEZs). Even though the target set for 2019-20 for exports of
goods and services appears achievable, demand conditions in major trade partner economies will have to be supportive and domestic bottlenecks (both in terms of infrastructure and policy) need to be eased signifi cantly. If the world economy grows faster during 2015-19 than in the 2009-14 period as projected by the IMF (2015), India’s exports may fare better than in previous years. Nonetheless, taking exports to the level of US$ 900 billion by 2019-20 will need a higher compound annual rate of growth (CARG) of about 14 per cent during the FTP period (2015-16 to 2019-20) which could be a challenge (Chart 1).
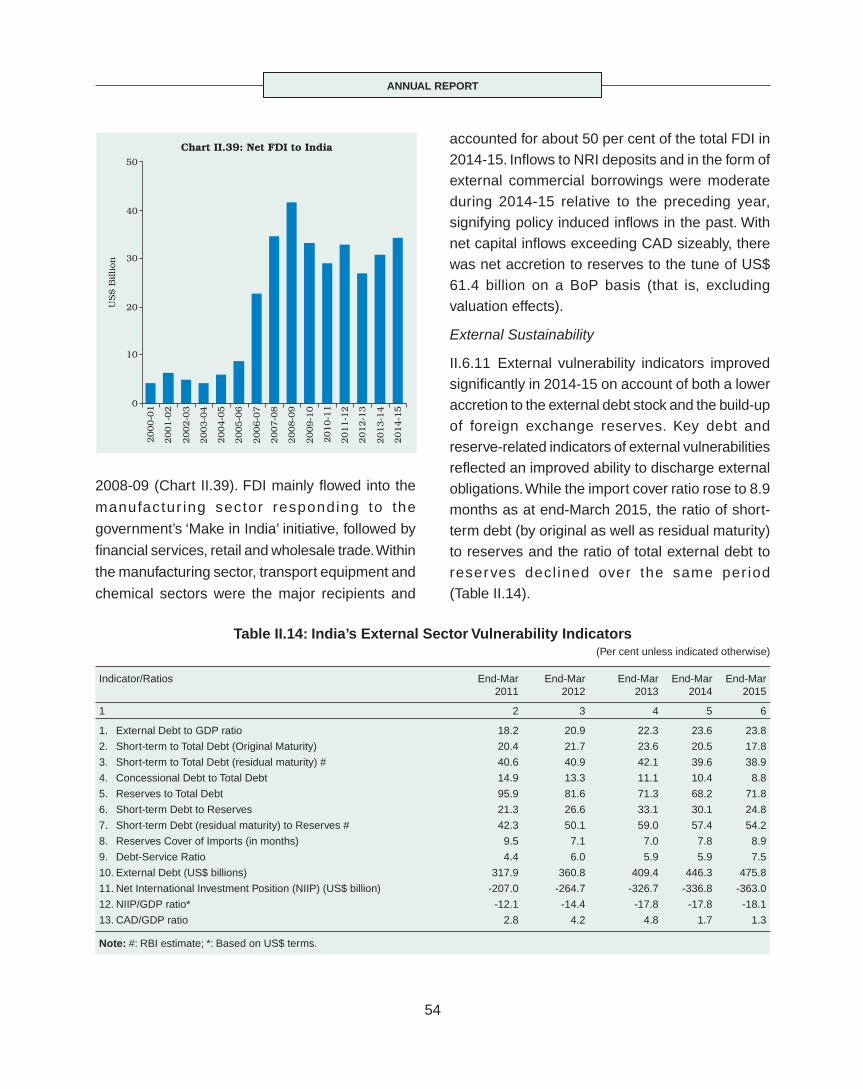
ANNUAL REPORT
54
2008-09 (Chart II.39). FDI mainly fl owed into the
manufactur ing sector responding to the
government’s ‘Make in India’ initiative, followed by
fi nancial services, retail and wholesale trade. Within
the manufacturing sector, transport equipment and
chemical sectors were the major recipients and
accounted for about 50 per cent of the total FDI in 2014-15. Infl ows to NRI deposits and in the form of external commercial borrowings were moderate during 2014-15 relative to the preceding year, signifying policy induced infl ows in the past. With net capital infl ows exceeding CAD sizeably, there was net accretion to reserves to the tune of US$ 61.4 billion on a BoP basis (that is, excluding valuation effects).
External Sustainability
II.6.11 External vulnerability indicators improved signifi cantly in 2014-15 on account of both a lower accretion to the external debt stock and the build-up of foreign exchange reserves. Key debt and reserve-related indicators of external vulnerabilities refl ected an improved ability to discharge external obligations. While the import cover ratio rose to 8.9 months as at end-March 2015, the ratio of short-term debt (by original as well as residual maturity) to reserves and the ratio of total external debt to reserves decl ined over the same per iod (Table II.14).
Table II.14: India’s External Sector Vulnerability Indicators(Per cent unless indicated otherwise)
Indicator/Ratios End-Mar 2011
End-Mar 2012
End-Mar 2013
End-Mar 2014
End-Mar 2015
1 2 3 4 5 6
1. External Debt to GDP ratio 18.2 20.9 22.3 23.6 23.8
2. Short-term to Total Debt (Original Maturity) 20.4 21.7 23.6 20.5 17.8
3. Short-term to Total Debt (residual maturity) # 40.6 40.9 42.1 39.6 38.9
4. Concessional Debt to Total Debt 14.9 13.3 11.1 10.4 8.8
5. Reserves to Total Debt 95.9 81.6 71.3 68.2 71.8
6. Short-term Debt to Reserves 21.3 26.6 33.1 30.1 24.8
7. Short-term Debt (residual maturity) to Reserves # 42.3 50.1 59.0 57.4 54.2
8. Reserves Cover of Imports (in months) 9.5 7.1 7.0 7.8 8.9
9. Debt-Service Ratio 4.4 6.0 5.9 5.9 7.5
10. External Debt (US$ billions) 317.9 360.8 409.4 446.3 475.8
11. Net International Investment Position (NIIP) (US$ billion) -207.0 -264.7 -326.7 -336.8 -363.0
12. NIIP/GDP ratio* -12.1 -14.4 -17.8 -17.8 -18.1
13. CAD/GDP ratio 2.8 4.2 4.8 1.7 1.3
Note: #: RBI estimate; *: Based on US$ terms.

ECONOMIC REVIEW
55
Exchange Rate Movements
II.6.12 The US dollar gained signifi cantly against most international currencies during the year. The Indian rupee, however, depreciated only marginally against the US dollar; therefore, by the same token, it gained strongly against other major currencies, viz., euro, GBP and Japanese yen, refl ecting the weak economic outlook for these economies and their ultra-accommodative monetary policies. Reflecting persisting inflation differentials and appreciation of the rupee in nominal terms vis-à-vis India’s major trade partners, the real effective exchange rate of the rupee during 2014-15, on average, appreciated by 6.1 per cent and by 5.5 per cent (y-o-y) for the basket of 6 and 36 currencies respectively. The rupee exchange rate also witnessed lower volatility in 2014-15 and 2015-16 so far than in the earlier period (Chart II.40).
II.6.13 Going forward, external sector sustainability will need close monitoring, especially in a global environment characterised by high volatility in financial markets, asynchronicity in monetary policies of major advanced economies and in particular, the widely expected lift-off of US interest rates, and still high geo-political risks. Although international crude oil prices stayed at modest levels in Q1 of 2015-16 and dropped sharply in August 2015 due to excess supply and subdued demand, continuation of benign conditions for the remaining part of the year still remains uncertain.
II.6.14 For India, every US$ 1 increase in international crude prices broadly translates into an increase in the net POL import bill by US$ 1 billion. Second, following the withdrawal of gold import related measures, the import demand for gold seems to be bouncing back as evident from a growth (volume terms) of 38.5 per cent in 2014-15 and 34.3 per cent in April-July 2015. Third, key to ensuring the viability of the external sector in this backdrop is a renewed thrust on exports in terms of both products and markets. Export diversifi cation has provided a means of insulation in the face of sluggish global economic conditions and this should be vigorously pursued to strengthen resilience and to minimise the spillovers of external shocks.
ANNUAL REPORT
56
MONETARY POLICY OPERATIONSIII
THE ANNUAL REPORT ON THE WORKING OF THE RESERVE BANK OF INDIA
PART TWO: THE WORKING AND OPERATIONS OFTHE RESERVE BANK OF INDIA
III.1 Sustaining the disinfl ation path set in motion
in 2013-14 and instituting a robust and transparent
institutional framework assigning primacy to price
stability constituted the over-riding goals that the
Reserve Bank had set for itself in formulating and
conducting monetary policy in 2014-15. These are
the fi rst building blocks of its medium-term vision
of ensuring price stability on a durable basis as a
necessary pre-condition for fostering higher
economic growth.
The Changing Institutional Edifi ce of Monetary Policy
III.2 There was a fundamental change in the
conduct of monetary policy in 2014-15. Several
institutional and operational innovations were put
in place in the preceding year to enable this regime
shift based on the recommendations of the Expert
Committee to Revise and Strengthen the Monetary
Policy Framework. These included improved
communication by means of bi-monthly policy
reviews; introduction of term repos to offset the
reduction in access to liquidity through overnight fi xed rate repo under the liquidity adjustment facility (LAF); and the adoption of headline consumer price index (CPI) infl ation as the nominal anchor for the conduct of monetary policy. Set against this backdrop, managing the transition to a fl exible inflation targeting (FIT) framework in a non-disruptive manner in 2014-15 became a key challenge. Ensuring disinfl ation consistent with the glide path announced in January 2014 required maintaining an anti-infl ationary monetary policy stance till upside risks to the infl ation outlook had been contained. Greater transparency on monetary policy necessitated release of Monetary Policy Reports (MPRs). Sector specifi c refi nance facilities were phased out to create conditions for more effective transmission of monetary policy. A new liquidity management framework had to be put in place to ensure market-based liquidity operations through auctions, while str iving to ensure consistency of liquidity conditions with the stance of monetary policy. Besides forward looking
The conduct of monetary policy in India is undergoing a transformation, transiting to a flexible inflation targeting (FIT) framework. During 2014-15, a formal architecture for FIT based on an agreement between the Reserve Bank and the Government of India pertaining to the monetary policy framework was put in place. The liquidity management framework was revised to bring in proactive liquidity operations based on variable rate term repo/reverse repo auctions to align the weighted average call rate, that is, the operating target around the policy rate. With ebbing inflationary pressures, receding risks to the inflation outlook and commitments to fiscal prudence, the Reserve Bank eased its monetary policy stance with a cumulative 75 bps cut in the policy repo rate during January-August 2015.

MONETARY POLICY OPERATIONS
57
surveys, the need to strengthen technical research through forecasting and policy analysis models in order to facilitate decision making under uncertainty also assumed signifi cance.
Agenda 2014-15: Implementation Status
Disinfl ation Consistent with the Glide Path
III.3 The Reserve Bank had set out a formal framework to guide monetary policy operations in 2014-15. First, in January 2014, it announced a disinfl ationary glide path for bringing down CPI infl ation to below 8 per cent by January 2015 and to below 6 per cent by January 2016. Second, in September 2014, the Reserve Bank introduced a revised liquidity management framework that brought flexibility and transparency to liquidity management operations, while aiming at strengthening transmission in the money market by anchoring the weighted average call rate (WACR) at or closely aligned to the repo rate. Third, a landmark agreement was signed between the Government of India and the Reserve Bank in February 2015 that provided the formal architecture for conducting monetary policy operations consistent with FIT and related institutional and accountability processes.
III.4 In response to the upside risks to infl ation stemming from the impact of a sub-normal monsoon on food prices and still elevated international crude oil prices, the policy rate was kept unchanged in Q1 of 2014-15. The disinfl ationary effects of rate increases under taken dur ing September 2013-January 2014 were transmitted through the economy, tempering inflationary pressures. Concerns about tepid economic activity nevertheless required the commencement of a process of gradual reduction in the statutory liquidity ratio (SLR) to give banks more freedom to expand credit to productive sectors.
III.5 By Q2, perseverance with the anti-infl ationary policy stance had yielded a softening
bias to infl ation outcomes and was supported by a host of other factors that created room for a softer stance for monetary policy. Besides temporary base effects pulling down headline infl ation, international commodity prices, particularly of crude oil (Indian basket), declined sharply by about 57 per cent between June 2014 and January 2015, aiding the disinfl ationary momentum. Furthermore, there were indications of a more durable downward movement in headline inflation driven by transport and communication and household requisites, suggesting that prices of non-tradables were responding to policy impulses. Awaiting a clearer assessment of the balance of risks and the durability of disinfl ation, the policy rate was kept unchanged during Q2 and Q3.
III.6 Infl ation for January 2015 turned out to be nearly 300 basis points (bps) below the target of 8 per cent. Moreover, by January 2015, there was increasing evidence of a robust disinfl ationary process having taken hold. For instance, household infl ation expectations three months ahead as well as one year ahead eased to a single digit for the fi rst time since September 2009. On January 15, 2015, the policy repo rate was reduced by 25 bps to 7.75 per cent. Further, monetary policy actions were made contingent on on-going evidence about continuing disinflationary momentum and sustenance of high quality fi scal consolidation.
III.7 The new CPI re-based to 2012, which was released on February 12, 2015, confi rmed that strong disinfl ationary impulses were underway in the economy. The pre-conditions for effecting a change in the monetary policy stance materialised in quick succession with infl ation ebbing and the Union Budget for 2015-16 suggesting a tangible progress on fiscal consolidation for 2014-15 alongside a renewed medium-term commitment about fi scal rectitude. Consistent with the forward guidance, the Reserve Bank announced a cut in

ANNUAL REPORT
58
bi-monthly policy on August 4, 2015 kept the policy ra te unchanged, wh i le main ta in ing the accommodative stance of monetary policy. The statement noted that the short-term real risk free rates were supportive of borrowing by interest rate sensitive consumer segments such as housing and automobiles and as greater transmission of front-loaded past actions was awaited, developments would be monitored for emerging room for more accommodation.
Improved Transmission in the Money Market
III.11 The operating framework of monetary policy provides clarity on how the objectives of monetary policy respond to changes in policy rate - the repo rate. The link from the policy rate to infl ation target requires a systematic and stable transmission path linking the policy rate, the operating target, an intermediate target and a transparent set of rules guiding liquidity and monetary operations on a day-to-day basis (see Box IV.I in MPR of April 2015). Liquidity management is key to aligning the operating target of monetary policy to the policy rate and is thus critical for the fi rst leg of monetary transmission.
III.12 In India, currently the WACR is the operating target of monetary policy. Recognising the long and variable lags in transmission of monetary policy, inflation forecasts - or the projected baseline infl ation path - are used as the intermediate target. This makes monetary policy proactive and forward looking.
III.13 In line with the recommendations of the Expert Committee, Q3 of 2014-15 saw the implementation of a revised liquidity management framework aimed at making liquidity management operations fl exible, transparent and predictable. The revised liquidity management framework has the following features: (i) subject to availability of excess SLR securities, assured access to central bank
the repo rate outside the normal policy review cycles to 7.50 per cent in March 2015. This pre-emptive policy action was intended to utilise available space for monetary accommodation, given low capacity utilisation and continuing weakness in production and credit off-take.
III.8 The fi rst bi-monthly policy statement for 2015-16 announced on April 7, 2015 noted that the stance of monetary policy going forward would centre around a gradual and durable disinfl ation, taking headline CPI infl ation to 6 per cent by January 2016 and to 4 per cent by the end of 2017-18. The identifi ed upside risks included the possibility of a sub-normal monsoon, large deviations from their seasonal patterns in vegetable and fruit prices, larger than anticipated administered price revisions, faster closing of the output gap, geo-political risks causing hardening of global commodity prices and external spillovers through the exchange rate and asset price channels. Downsides originating from global defl ationary/disinfl ationary tendencies, the benign outlook on global commodity prices and slack in the domestic economy appeared to ameliorate upside risks. Accordingly, key policy rates were kept unchanged, pending expected transmission of past policy rate reductions to lending rates by banks.
III.9 The second bi-monthly policy statement of June 2, 2015, recognised that the headline infl ation trajectory had evolved according to the projected path while the economic activity continued to be fragile. Therefore, while awaiting further data for greater clarity on the risks in meeting the medium term disinfl ation targets, a cut in the policy repo rate by 25 bps was front-loaded, taking it to 7.25 per cent.
III.10 Taking into account the developments in 2015-16 thus far and the balance of risks as also the front-loaded policy action of June, the third
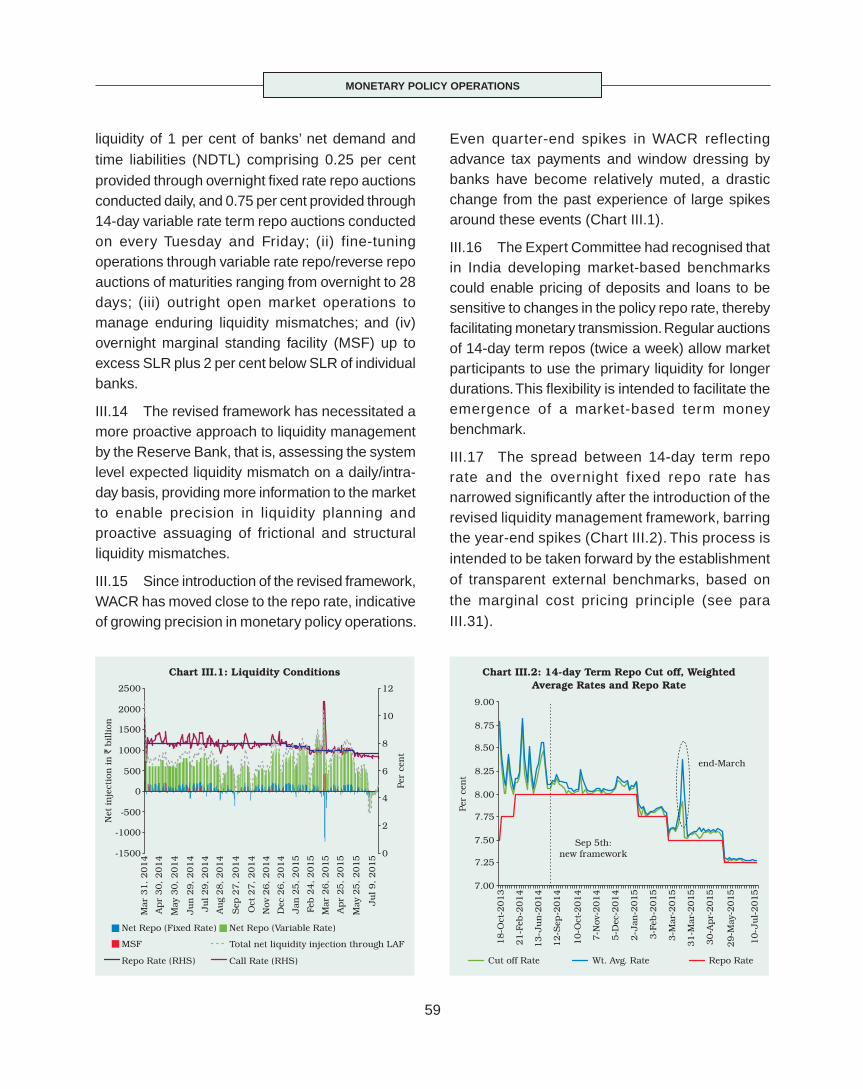
MONETARY POLICY OPERATIONS
59
liquidity of 1 per cent of banks’ net demand and time liabilities (NDTL) comprising 0.25 per cent provided through overnight fi xed rate repo auctions conducted daily, and 0.75 per cent provided through 14-day variable rate term repo auctions conducted on every Tuesday and Friday; (ii) fine-tuning operations through variable rate repo/reverse repo auctions of maturities ranging from overnight to 28 days; (iii) outright open market operations to manage enduring liquidity mismatches; and (iv) overnight marginal standing facility (MSF) up to excess SLR plus 2 per cent below SLR of individual banks.
III.14 The revised framework has necessitated a more proactive approach to liquidity management by the Reserve Bank, that is, assessing the system level expected liquidity mismatch on a daily/intra-day basis, providing more information to the market to enable precision in liquidity planning and proactive assuaging of frictional and structural liquidity mismatches.
III.15 Since introduction of the revised framework, WACR has moved close to the repo rate, indicative of growing precision in monetary policy operations.
Even quarter-end spikes in WACR reflecting advance tax payments and window dressing by banks have become relatively muted, a drastic change from the past experience of large spikes around these events (Chart III.1).
III.16 The Expert Committee had recognised that in India developing market-based benchmarks could enable pricing of deposits and loans to be sensitive to changes in the policy repo rate, thereby facilitating monetary transmission. Regular auctions of 14-day term repos (twice a week) allow market participants to use the primary liquidity for longer durations. This fl exibility is intended to facilitate the emergence of a market-based term money benchmark.
III.17 The spread between 14-day term repo rate and the overnight fixed repo rate has narrowed signifi cantly after the introduction of the revised liquidity management framework, barring the year-end spikes (Chart III.2). This process is intended to be taken forward by the establishment of transparent external benchmarks, based on the marginal cost pricing principle (see para III.31).
ANNUAL REPORT
60
III.18 For smooth conduct of banking operations, the Reserve Bank has allowed access to the MSF and reverse repo windows on Saturdays with effect from February 21, 2015. Recognising that sector-specifi c refi nance facilities at the fi xed repo rate could interfere with the transmission process, the export credit refi nance (ECR) facility was phased out gradually during the year and replaced with the provision of system-level liquidity with effect from February 7, 2015.
III.19 The liquidity framework was tested in March 2015 as liquidity tightened due to accumulation of cash balances of the government and banks with the Reserve Bank peaking at the end of the fi nancial year on balance sheet and year-end considerations. In April 2015, these balances reversed, declining signifi cantly and creating surplus liquidity conditions in the inter-bank market. The Reserve Bank managed these alternating but large movements in liquidity through 7-day, 2/3-day and overnight reverse repo auctions to fi ne-tune liquidity. Since mid-April, the liquidity requirement of the system has moved in a narrower range of around 1 per cent of NDTL, which has been managed through additional variable rate overnight and term repos/reverse repos. With the increase in spending by the government, l iquidity conditions improved signifi cantly in June and July. The Reserve Bank absorbed the excess liquidity through the variable rate reverse repo auctions of varying terms.Besides, the Reserve Bank also absorbed the excess liquidity to the tune of `82.7 billion through OMO sales conducted on July 14, 2015.
Agreement on the Monetary Policy Framework
III.20 On February 20, 2015, the Government of India and the Reserve Bank signed an agreement on the Monetary Policy Framework. The agreement makes price stability the primary objective of monetary policy; defi nes price stability numerically - below 6 per cent CPI infl ation for 2015-16 (to be
achieved by January 2016) and 4 +/- 2 per cent for all subsequent years; sets out what will constitute a failure in achieving the target; and specifi es that the Reserve Bank in the event of failure will report to the government on: (a) reasons for deviation of infl ation from the target over three consecutive quarters, (b) remedial measures, and (c) an estimated time frame over which infl ation will be brought back to the target.
III.21 The agreement represents a fundamental institutional reform in India as it mandates the Reserve Bank to pursue FIT with transparency, predictability and accountability. The government’s commitment to the agreement also enhances the credibility of the framework, bringing confi dence about the process of fi scal consolidation and supply management, both of which are highly relevant for maintaining price stability.
Monetary Policy Reports and Transparency
III.22 In pursuance of the recommendations of the Expert Committee, the fi rst issue of the MPR was released along with the fourth bi-monthly monetary policy statement in September 2014, providing a medium-term outlook and the balance of risks around a variety of potential shocks. With the publication of MPR, India joins a select band of countries that lay emphasis on transparency and forward looking communication to ensure public understanding and accountability of monetary policy formulation and operations (Box III.1).
III.23 Forward guidance provided in the fi fth bi-
monthly policy statement in December 2014
indicated the possible commencement of an easing
cycle by early 2015 if the disinfl ationary process
moved along the expected trajectory, coupled with
evidence of softening infl ationary expectations,
quality and quantity of fi scal consolidation, steps to
augment supply of key inputs and unlocking of
stalled investments so as to revive the economy
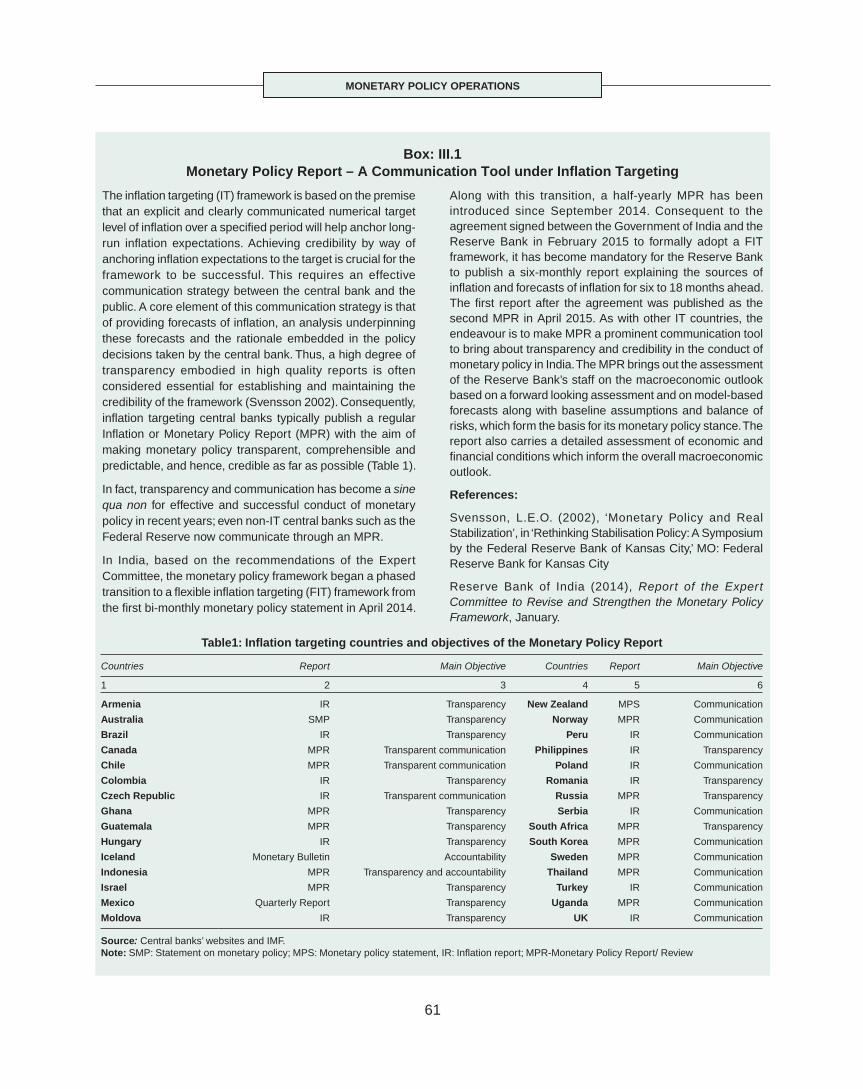
MONETARY POLICY OPERATIONS
61
Box: III.1Monetary Policy Report – A Communication Tool under Infl ation Targeting
The infl ation targeting (IT) framework is based on the premise that an explicit and clearly communicated numerical target level of infl ation over a specifi ed period will help anchor long-run infl ation expectations. Achieving credibility by way of anchoring infl ation expectations to the target is crucial for the framework to be successful. This requires an effective communication strategy between the central bank and the public. A core element of this communication strategy is that of providing forecasts of infl ation, an analysis underpinning these forecasts and the rationale embedded in the policy decisions taken by the central bank. Thus, a high degree of transparency embodied in high quality reports is often considered essential for establishing and maintaining the credibility of the framework (Svensson 2002). Consequently, infl ation targeting central banks typically publish a regular Infl ation or Monetary Policy Report (MPR) with the aim of making monetary policy transparent, comprehensible and predictable, and hence, credible as far as possible (Table 1).
In fact, transparency and communication has become a sine qua non for effective and successful conduct of monetary policy in recent years; even non-IT central banks such as the Federal Reserve now communicate through an MPR.
In India, based on the recommendations of the Expert Committee, the monetary policy framework began a phased transition to a fl exible infl ation targeting (FIT) framework from the fi rst bi-monthly monetary policy statement in April 2014.
Along with this transition, a half-yearly MPR has been introduced since September 2014. Consequent to the agreement signed between the Government of India and the Reserve Bank in February 2015 to formally adopt a FIT framework, it has become mandatory for the Reserve Bank to publish a six-monthly report explaining the sources of infl ation and forecasts of infl ation for six to 18 months ahead. The fi rst report after the agreement was published as the second MPR in April 2015. As with other IT countries, the endeavour is to make MPR a prominent communication tool to bring about transparency and credibility in the conduct of monetary policy in India. The MPR brings out the assessment of the Reserve Bank’s staff on the macroeconomic outlook based on a forward looking assessment and on model-based forecasts along with baseline assumptions and balance of risks, which form the basis for its monetary policy stance. The report also carries a detailed assessment of economic and fi nancial conditions which inform the overall macroeconomic outlook.
References:
Svensson, L.E.O. (2002), ‘Monetary Policy and Real Stabilization’, in ‘Rethinking Stabilisation Policy: A Symposium by the Federal Reserve Bank of Kansas City,’ MO: Federal Reserve Bank for Kansas City
Reserve Bank of India (2014), Report of the Expert Committee to Revise and Strengthen the Monetary Policy Framework, January.
Table1: Infl ation targeting countries and objectives of the Monetary Policy Report
Countries Report Main Objective Countries Report Main Objective
1 2 3 4 5 6
Armenia IR Transparency New Zealand MPS Communication
Australia SMP Transparency Norway MPR Communication
Brazil IR Transparency Peru IR Communication
Canada MPR Transparent communication Philippines IR Transparency
Chile MPR Transparent communication Poland IR Communication
Colombia IR Transparency Romania IR Transparency
Czech Republic IR Transparent communication Russia MPR Transparency
Ghana MPR Transparency Serbia IR Communication
Guatemala MPR Transparency South Africa MPR Transparency
Hungary IR Transparency South Korea MPR Communication
Iceland Monetary Bulletin Accountability Sweden MPR Communication
Indonesia MPR Transparency and accountability Thailand MPR Communication
Israel MPR Transparency Turkey IR Communication
Mexico Quarterly Report Transparency Uganda MPR Communication
Moldova IR Transparency UK IR Communication
Source: Central banks’ websites and IMF.Note: SMP: Statement on monetary policy; MPS: Monetary policy statement, IR: Infl ation report; MPR-Monetary Policy Report/ Review
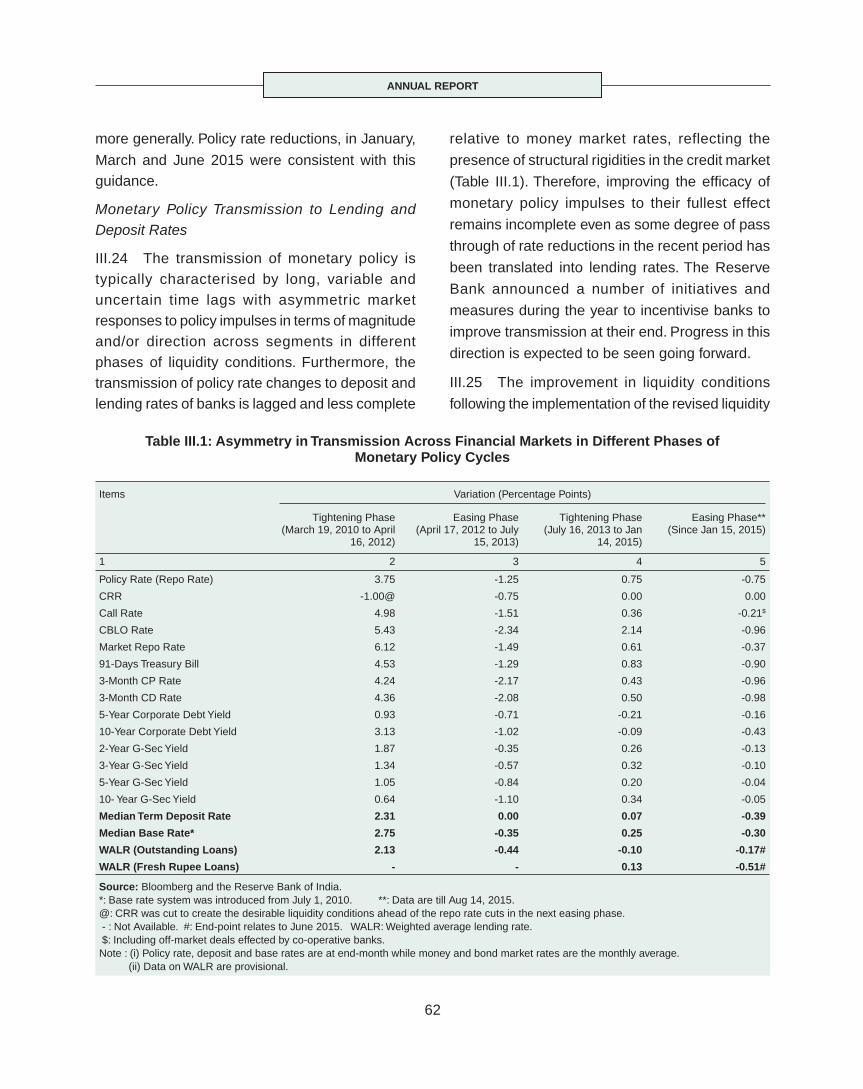
ANNUAL REPORT
62
more generally. Policy rate reductions, in January,
March and June 2015 were consistent with this guidance.
Monetary Policy Transmission to Lending and Deposit Rates
III.24 The transmission of monetary policy is typically characterised by long, variable and uncertain time lags with asymmetric market responses to policy impulses in terms of magnitude and/or direction across segments in different phases of liquidity conditions. Furthermore, the transmission of policy rate changes to deposit and lending rates of banks is lagged and less complete
relative to money market rates, reflecting the
presence of structural rigidities in the credit market
(Table III.1). Therefore, improving the effi cacy of
monetary policy impulses to their fullest effect
remains incomplete even as some degree of pass
through of rate reductions in the recent period has
been translated into lending rates. The Reserve
Bank announced a number of initiatives and
measures during the year to incentivise banks to
improve transmission at their end. Progress in this
direction is expected to be seen going forward.
III.25 The improvement in liquidity conditions
following the implementation of the revised liquidity
Table III.1: Asymmetry in Transmission Across Financial Markets in Different Phases of Monetary Policy Cycles
Items Variation (Percentage Points)
Tightening Phase(March 19, 2010 to April
16, 2012)
Easing Phase(April 17, 2012 to July
15, 2013)
Tightening Phase(July 16, 2013 to Jan
14, 2015)
Easing Phase**(Since Jan 15, 2015)
1 2 3 4 5
Policy Rate (Repo Rate) 3.75 -1.25 0.75 -0.75
CRR -1.00@ -0.75 0.00 0.00
Call Rate 4.98 -1.51 0.36 -0.21$
CBLO Rate 5.43 -2.34 2.14 -0.96
Market Repo Rate 6.12 -1.49 0.61 -0.37
91-Days Treasury Bill 4.53 -1.29 0.83 -0.90
3-Month CP Rate 4.24 -2.17 0.43 -0.96
3-Month CD Rate 4.36 -2.08 0.50 -0.98
5-Year Corporate Debt Yield 0.93 -0.71 -0.21 -0.16
10-Year Corporate Debt Yield 3.13 -1.02 -0.09 -0.43
2-Year G-Sec Yield 1.87 -0.35 0.26 -0.13
3-Year G-Sec Yield 1.34 -0.57 0.32 -0.10
5-Year G-Sec Yield 1.05 -0.84 0.20 -0.04
10- Year G-Sec Yield 0.64 -1.10 0.34 -0.05
Median Term Deposit Rate 2.31 0.00 0.07 -0.39
Median Base Rate* 2.75 -0.35 0.25 -0.30
WALR (Outstanding Loans) 2.13 -0.44 -0.10 -0.17#
WALR (Fresh Rupee Loans) - - 0.13 -0.51#
Source: Bloomberg and the Reserve Bank of India.*: Base rate system was introduced from July 1, 2010. **: Data are till Aug 14, 2015.@: CRR was cut to create the desirable liquidity conditions ahead of the repo rate cuts in the next easing phase. - : Not Available. #: End-point relates to June 2015. WALR: Weighted average lending rate. $: Including off-market deals effected by co-operative banks.Note : (i) Policy rate, deposit and base rates are at end-month while money and bond market rates are the monthly average. (ii) Data on WALR are provisional.

MONETARY POLICY OPERATIONS
63
management framework in September 2014 was refl ected in a decline in deposit and lending rates of banks. The decline in deposit rates was, however, not fully refl ected in the weighted average lending rates (WALR) of banks, indicating their efforts to maintain net interest margins (NIMs) in an environment characterised by weak credit demand
Table III.2: Deposit and Lending Rates of SCBs (Excluding RRBs)
(Per cent)
Month-end RepoRate
Term Deposit Rates WALR
Median WADTDR OutstandingRupee Loans
FreshRupee Loans
1 2 3 4 5 6
Mar-14 8.00 7.74 8.79 12.21 11.64
Jun-14 8.00 7.74 8.73 12.21 11.68
Sep-14 8.00 7.72 8.70 12.12 11.59
Dec-14 8.00 7.55 8.64 12.11 11.59
Mar-15 7.50 7.50 8.57 12.06 11.25
June-15 7.25 7.22 8.43 11.94 11.08
Aug 14,15 7.25 7.14 - - -
Variation (Percentage Points) (since Jan 15, 2015)
-0.75 -0.39 -0.21 -0.17 -0.51
-: Not available.
WADTDR: Weighted average domestic term deposit rate.
Note: Data on WADTDR and WALR are provisional.
Table III.3: Weighted Average Lending Rates of SCBs (Excluding RRBs)* - Select Sectors(at which 60 per cent or more business is contracted)
(Per cent)
End-Month Agriculture Industry(Large)
MSME Infrastructure Personal Loans
Housing Vehicle Education Credit Card
1 2 3 4 5 6 7 8 9
Mar-14 10.70 13.06 13.10 13.09 10.85 12.38 12.96 35.46
Jun-14 10.79 13.05 13.04 13.05 10.61 12.09 12.91 36.70
Sep-14 10.79 13.01 13.09 13.02 10.52 11.97 12.90 38.23
Dec-14 10.93 12.95 13.05 13.05 10.76 11.83 12.90 37.86
Mar-15 10.96 12.80 12.91 12.89 10.99 11.62 12.87 37.88
June-15 10.76 12.62 12.36 12.24 10.81 11.39 12.58 37.87
Variation (Percentage Points)
(Jun15-15 over Jan-15)
-0.17 -0.33 -0.69 -0.81 0.05 -0.44 -0.32 0.01
*: Based on outstanding rupee loans. MSME: Micro, Small, and Medium Enterprises
and risk aversion amidst rising non-performing loans (NPAs). The WALR on fresh rupee loans sanctioned by banks declined by 51 bps to 11.08 per cent since the fi rst round of reduction in the repo rate (Table III.2). WALR on outstanding rupee loans, however, declined by only 17 bps during the same period as the interest rates on loans disbursed earlier are reset with a time lag.
III.26 While the response of commercial banks to a reduction in the policy rate by 75 bps is still unfolding, the movement of lending rates across various sectors is uneven, presumably refl ecting the differential r isk assessment of banks (Table III.3).
III.27 The base rate system introduced in 2010 has been an improvement over the benchmark prime lending rate (BPLR) system, disallowing sanctioning of a large proportion of the loans at sub-prime rates. Banks are free to determine their lending rates based on cost of funds or any other relevant market based benchmark. Base rates have converged to a narrow range of 9.70-10.15 per cent for public sector banks (PSBs). However, the base rates are found to be sticky and impeding transmission of monetary policy.
ANNUAL REPORT
64
III.28 As highlighted in the Report of the Expert Committee, the sluggish transmission to credit markets refl ects the interaction of several factors. The major factors impeding transmission include rigidities in re-pricing for fi xed deposits, high volume of government borrowing, practice of yearly resetting of administered interest rates on small savings (including public provident fund) linked to G-sec yields, interest rate subventions, high level of NPAs and a signifi cant presence of informal fi nance. There could also be risks emanating from a possible migration of deposits to alternative fi nancial assets, as well as physical savings yielding higher expected real rates of return. Further, in the calculation of the base rate, the repo rate does not enter directly, operating only through the costs of wholesale funding which are sensitive to changes in the repo rate.
III.29 In an easing phase, banks tweak the spread over the base rate while pricing loans instead of changing the base rate itself. This is an opaque practice that leads to discrimination among new and old borrowers. The issue was highlighted by the Working Group on Pricing of Credit and accordingly in January 2015, banks were allowed greater operational fl exibility to price credit with the freedom to revise the methodology every three years instead of every fi ve years as was done earlier.
III.30 Moreover, to address the issue of arbitrary
charging of spread, banks were advised: (a) to have
a board-approved policy, delineating the components
of spread charged to a customer; and (b) to ensure
that the spread charged to an existing borrower
(other than a consortium and multiple banking
arrangements) does not increase, except on
account of deterioration in the credit risk profi le of
the customer or change in the tenor premium. Going
forward, these measures are expected to improve
transparency and fairness in the credit pricing
framework in India.
III.31 In its first bi-monthly monetary policy
statement for 2015-16 announced on April 7, 2015,
the Reserve Bank stated that the base rate
calculated on the basis of a marginal cost of funds
should be more sensitive to changes in policy rate.
In order to improve the effi ciency of monetary policy
transmission, the Reserve Bank will encourage
banks to move to a marginal cost-of-funds-based
determination of their base rates. Once the
Financial Benchmark India Pvt. Ltd., an independent
benchmark administrator, starts publishing various
indices of market interest rates, the Reserve Bank
will encourage banks to use the indices as an
external benchmark for pricing bank products.
Projected and Actual Trajectories of Growth and
Infl ation
III.32 The Reserve Bank’s growth and infl ation
projections are prepared under considerable
uncertainty and shifting balance of risks. While
common assumptions (covering some of the key
determinants of infl ation and growth) are used to
generate the baseline projected paths, upside/
downside risks and the resultant likely deviations
of the infl ation and growth paths from the baseline
are presented as part of the assessment of balance
of risks in the MPRs.
III.33 The actual infl ation path during Q4 of 2014-15 turned out to be signifi cantly below what was indicated in the September 2014 MPR in view of the large changes in underlying conditions which were widely unanticipated. Two major factors, inter alia, necessitated this revision. First, in February 2015, the CSO updated the all India CPI-Combined series base from 2010=100 to 2012=100. As per CSO, infl ation on an average in 2014 in the new series was 50 bps lower than what was recorded in the old series. The divergence varied from (+) 0.04 to (-) 1.11 percentage points in different months. Second, crude prices registered a sharp
MONETARY POLICY OPERATIONS
65
fall between September 2014 and January 2015 and, on an average, crude oil prices were 36 per cent lower than what was considered as part of the baseline assumptions in the MPR of September 2014. The release of the new series on national accounts by the CSO in January 2015 was another major exogenous shock to the Reserve Bank’s projections. Growth projection for 2014-15 was retained unchanged at 5.5 per cent since January 2014 till the revised national accounts numbers were released by the CSO in January/February 2015. The stronger than anticipated growth momentum in the CSO data (new base) relative to the data as per the old base was the key factor behind the deviation of the Reserve Bank’s projected output growth for 2014-15 from CSO’s estimates. The Reserve Bank is continuously engaged in refi ning and modernising its analysis and forecasting capacities so as to improve precision and stability. These efforts notwithstanding, improving projection performance in the face of major data revisions and large magnitudes of supply/external shocks will remain a key challenge for forward looking conduct of monetary policy.
Anchoring Infl ation Expectations
III.34 The monetary policy framework of the Reserve Bank aims at anchoring inflation expectations as close as possible to the target. During 2014-15, anchoring expectations, especially breaking the rigidities that had set in from the experience of 2009-13 turned out to be a major challenge.
III.35 Large divergence between the wholesale price index (WPI) and CPI infl ation in the fi rst half of 2015 also posed a major challenge for monetary policy communication, given the formal adoption of CPI-C infl ation jointly by the government and the Reserve Bank to set the infl ation target against the backdrop of growing expectations of a highly accommodative monetary policy stance based on deflationary WPI. The Expert Committee had
examined all the policy relevant issues involving WPI and CPI, and also reviewed the choice of a relevant measure of infl ation in other advanced and emerging economies for the conduct of monetary policy. The coverage of items in the two price indices – CPI-C and WPI - is different. The weight of food in the CPI-C basket is higher at about 46 per cent, as against about 24 per cent in WPI. Nearly a quarter of CPI-C is composed of services whereas this component is not covered in WPI. CPI-C, therefore, is the most representative of available measures of price indices in India. The decline in WPI in the last 9 months has been driven by the sharp fall in global commodity prices, including crude petroleum and industrial raw materials, such as metals and chemicals. Generally, divergent infl ation trends as per different price indices do not persist for long. Even if such divergences persist, anchoring the expectations of all agents in the economy as per the CPI-C infl ation target will be important, even though divergent trends may entail differential welfare effects on different sections of the population depending on their own consumption baskets and range of inputs used in the production processes.
Uncertain and Time Varying Macro-dynamics
III.36 Modern day monetary policy operating frameworks focus on price stability under dynamic liquidity and fi nancial conditions. Macro-fi nancial linkages can, however, change signifi cantly, and the conduct of monetary policy should recognise this and respond in a timely manner. An assessment of the natural real rate of interest assumes critical importance in this context under the explicit recognition that it is not static and may vary over time. Model-based estimates of natural real interest rate for India in Q4 of 2014-15 suggest a range of 0.6 per cent to 3.1 per cent, with +/- one standard error of about 50 bps (Box III.2).
III.37 There were, however, some challenges that were not fully addressed during 2014-15. First,

ANNUAL REPORT
66
efforts for a better assessment of intra-day liquidity conditions to support more effective fi ne-tuning of liquidity operations were handicapped by the uncertainties involved in predicting government cash balances. Second, the capacity to assess the impact of external spillovers on the domestic
economy was also limited owing to the suddenness characterising various international developments, particularly, blurred assessments worldwide on the magnitude and timing of these events. Third, the transmission of repo rate cut to deposit and lending rates remained incomplete, and credit growth
Box III.2Time-varying Natural Interest Rate in India
The natural rate of interest propounded by Wicksell (1898) has become a standard reference point in assessing the monetary policy stance of central banks since the 1990s, particularly after the growing popularity of fl exible infl ation targeting (FIT) and the use of Taylor type interest rate rules. While it was originally conceptualised as an equilibrium real rate at which desired saving equals desired investment, in its modern day formulation it is equated with the real rate of interest that is consistent with a zero output gap and infl ation stable around its target over the business cycle. In any Taylor rule type assessment of a monetary policy stance, the natural real interest rate is often assumed as constant, even though in reality it may vary over time in response to supply and demand side shocks, which could be large and persistent.
Trend changes in productivity, population growth and households’ time preference in terms of consumption and saving decisions over their life cycle have been the conventional determinants of the natural real interest rate. The global saving glut that preceded the global fi nancial crisis had already imparted a signifi cant downward pressure to global natural real interest rates. After the global crisis, the collapse of investment demand and subsequent deleveraging by corporations and households seem to have amplifi ed the downward pressure on natural real interest rates in advanced economies (AEs).
Estimates for the US economy suggest that the natural real interest rate which declined from about 3.5 per cent in 1990 to about 2 per cent in 2007, fell sharply to zero over the recession years of 2008 and 2009, and since then remained near zero for fi ve years up to 2014 (Williams 2015). Secular stagnation is widely believed to keep the natural real interest rate near zero in the medium-run.
In India there has been a signifi cant fall in total factor productivity after the global crisis which is a major structural factor pushing down the natural real interest rate. The sharp deceleration in the annual rate of increase in gross fi xed capital formation over the six-year period 2009-10 to 2014-15 relative to the pre-crisis phase of high growth refl ects the change in time preference of entrepreneurs, that is, to wait and delay new investment projects in the midst of elevated uncertainty. Households, in turn, had to face persistently high infl ation in the midst of a weakening outlook for
employment and income growth, and their preference for infl ation hedges in the form of gold and real estate led to a decline in fi nancial savings. Favourable demography and the associated shift in the pattern of demand for credit and saving behaviour over life-time to smooth consumption could also alter the natural rate.
When so many factors potentially alter the natural rate, the time varying natural rate for India, estimated using the Kalman fi lter (Laubach and Williams 2003), has moved in the range of 0.5 per cent to 4 per cent over time, and seems to have declined since 2010 gradually to about 2 per cent now (Chart 1). The estimation of the natural rate of interest is highly sensitive to the underlying model, choice of variables, assumptions used for approximating potential output, the representative measure of infl ation expectations and even the infl ation target (that is, 6 per cent vis-à-vis 4 per cent). Alternative estimates of the risk free natural real interest rate accordingly suggest a range of 0.6 per cent to 3.1 per cent for Q4 of 2014-15. Uncertainty about the true value of the natural rate is a challenge for the conduct of monetary policy.
References:
Williams, John C. (2015), ‘The Decline in the Natural Rate of Interest’, Federal Reserve Bank of San Francisco, March 2.
Laubach, Thomas and John C. Williams (2003), ‘Measuring the Natural rate of Interest’, Review of Economics and Statistics, 85(4), November.
MONETARY POLICY OPERATIONS
67
continued to be sluggish in an easing cycle of monetary policy. Besides the several factors mentioned earlier and the various steps taken by the Reserve Bank, the lower share of wholesale funding of banks in India has also partly hampered effective transmission of the policy rate to deposit and lending rates. Bank funding in India has a preponderance of retail deposits/savings that inhibits a seamless moderation in the cost of funds in response to reductions in the policy rate.
Agenda for 2015-16
III.38 In the context of the agenda set for 2014-15, the stance of monetary policy on the back of conducive supply management and the government’s fi scal measures aided by favourable commodity prices helped in achieving sustained and signifi cant disinfl ation to levels well below the set trajectory. The new liquidity management framework contributed to lower volatility in money market rates while allowing these rates to be determined through market forces in response to policy repo rate signals and day-to-day normal and fi ne-tuning liquidity operations. Two macro models were institutionalised for generating forecasts and scenario analyses, and the publication of two bi-annual MPRs contributed to strengthening communication with enhanced transparency on key aspects of the forward looking new monetary policy framework.
III.39 Going forward, the focus of the Reserve Bank’s monetary policy stance during 2015-16 will be on fostering a gradual and durable disinfl ationary process towards the target of below 6 per cent by January 2016 in order to achieve the centrally projected rate of 4 per cent by the end of 2017-18. At the same time, the effi cacy of the monetary policy transmission mechanism needs to improve since the pass-through of recent cuts in policy rate to the bank lending rate has been partial, reflecting constraints in transmission under the existing base rate system. Identifying the impediments in pass-through and implementing an alternative method, such as marginal cost based credit pricing or identifying an appropriate benchmark for the bank lending rate will be a priority for the Reserve Bank. In this regard, it is imperative to develop market based benchmarks by developing the term segment of the money market. Thus, liquidity support may have to be progressively provided through regular auctions of longer term repos with reduced dependence on overnight fixed-rate liquidity support. While doing so, it will also be important to dampen deviations of WACR and other money market rates such as CBLO rates from the repo rate in a narrow range. The Reserve Bank will continue to explore and augment its instruments of liquidity management, including standing deposit facility for absorption of surplus liquidity, as recommended by the Expert Committee.
ANNUAL REPORT
68
CREDIT DELIVERY AND FINANCIAL INCLUSIONIV
IV.1 Within the developmental and regulatory role of the Reserve Bank as a full service central bank, effi cient and comprehensive credit delivery through panoply of channels/institutions for provision of fi nancial products has always been accorded priority with a view to ensuring adequate fi nancing for the productive sectors of the Indian economy. Over the years, the credit delivery system has been scaled up and expanded with innovations that reach out to the diverse fi nancing needs of society. More recently, the effort has been to spread the economies of scale and scope and experience gained in urban and semi-urban areas to geographical regions and sections of society that asymmetric credit markets tend to exclude in view of their lack of pricing power. In 2014-15, the focus was on improving the availability of credit to micro, small and medium enterprises (MSMEs), revising priority sector guidelines to foster greater inclusiveness and enhancing the fl ow of credit to agriculture.
IV.2 In line with this, the Financial Inclusion and Development Department (FIDD) being the nodal department for financial inclusion focused on creating an enabling environment for providing universal access to banking services throughout the country and ensuring timely and smooth fl ow of credit to the priority sectors of the economy with a view to developing an effi cient and inclusive fi nancial system.
Agenda 2014-15: Implementation Status
IV.3 Guided by its core objective of fostering greater inclusiveness, the Reserve Bank’s endeavour during the year was to continue its efforts to ensure extension of banking facilities to all unbanked villages and make fi nancial inclusion a viable proposition for banks to improve credit delivery. Under the on-going Phase-II of the roadmap for fi nancial inclusion, which envisages opening of banking outlets in all unbanked villages with population less than 2,000, the strategy included identifying unbanked villages and allotting such villages to banks for coverage. To address the need for aligning priority sector lending guidelines with national priorities, the Reserve Bank constituted an Internal Working Group to revisit the guidelines.
IV.4 In pursuance of its developmental role, the Reserve Bank accords priority to effi cient and comprehensive credit delivery, particularly to priority sectors comprising primarily of the agricultural and MSME sectors, and the weaker sections of society. The guidelines on priority sector lending were revised during the year with a view to widening the scope of the sector and improving the fl ow of credit. Financial inclusion efforts received a big fi llip with the launch of the Pradhan Mantri Jan Dhan Yojana (PMJDY) coupled with synchronised efforts by the Reserve Bank. To simplify credit dispensation, the need to submit ‘no due certifi cates’ to scheduled commercial banks by individual borrowers, including self help groups (SHGs) and
The Reserve Bank kept up its efforts to ensure universal access to banking services throughout the country and improving credit delivery during the year. Apart from continued emphasis on enhancement of credit to agriculture, the major thrust during the year was on improving availability of credit to the micro, small and medium enterprises to help the sector realise its full potential. The launch of the Pradhan Mantri Jan Dhan Yojana (PMJDY) provided an added impetus to the various initiatives undertaken by the Reserve Bank towards furthering financial inclusion and financial literacy.
CREDIT DELIVERY AND FINANCIAL INCLUSION
69
joint liability groups (JLGs) for all types of loans, irrespective of the amount involved, was discontinued. Innovative steps to provide support to MSMEs like guidelines for introduction of a mechanism to address the issue of delayed payment in the form of a technology enabled Trade Receivables Discounting System (TReDS), conducting research on matters relating to MSMEs, design and conduct of training programmes for the MSME division-in-charges and trainers in commercial banks were initiated during the year. Additionally, MSME divisions were opened by regional offi ces of the Reserve Bank to focus on issues concerning lending to the sector in their respective jurisdictions.
CREDIT DELIVERY
Priority Sector Lending
IV.5 Priority sector refers to those sectors of the
economy which, though viable and creditworthy,
may not get timely and adequate credit in the
absence of a special dispensation. Typically, priority
sector loans are small value loans to farmers for
agriculture and allied activities, micro and small
enterprises, poor people for housing, students for
education, other low income groups and weaker
sections. Such sectors are spread across the length
and breadth of the country and especially prevalent
in the hilly and coastal regions. Priority sector
lending needs to be extended by banks as part of their normal business operations and should not be viewed as a corporate social responsibility. Towards this end, pricing of all credit has been made free, though with the expectation that pricing should not be exploitative (Table IV.1).
IV.6 Drawing upon the recommendations of an Internal Working Group, revised guidelines on priority sector lending were issued in April 2015. With the intention of giving a thrust to the MSME sector, medium enterprises were brought in the ambit of the priority sector. Additionally, a specifi c target was introduced for lending to micro enterprises. In addition to medium enterprises, two new categories, viz., social infrastructure and renewable energy were included under the priority sector (Box IV.1).
Table IV.1: Performance in Achievement of Priority Sector Lending Targets
(Amount in ` billion)
Outstanding ason March 31
Public Sector Banks
Private Sector Banks
Foreign Banks
1 2 3 4
2014 16,190 4,645 907(39.4) (43.9) (35.8)
2015 17,512 5,303 970(37.3) (42.8) (35.9)
Notes: 1. Figures in parenthesis are percentages to ANBC or CEOBE, whichever is higher in the respective groups.
2. The data for 2015 are provisional.
Box IV.1Priority Sector Lending – A Fresh Look
The salient features of the revised priority sector lending guidelines are:
Separate targets of 8 per cent for small and marginal farmers (within the agriculture target of 18 per cent) and 7.5 per cent for micro industries have been prescribed to be achieved in a phased manner by 2017. These targets will be made applicable to foreign banks with 20 branches and above post 2018 after a review in 2017.
Priority sector widened to include medium enterprises, social infrastructure and renewable energy.
Monitoring of priority sector lending compliance on a ‘quarterly’ average basis at the end of the respective year from 2016-17.
Priority Sector Lending Certifi cates (PSLCs) will be an eligible tradable instrument for achieving priority sector targets. The buyer (a defi cient bank) will pay a ‘price/
(Contd...)

ANNUAL REPORT
70
Flow of Credit to Agriculture
IV.7 The target for agricultural credit is fi xed by the Government every year. Led by the performance of scheduled commercial banks (SCBs), the actual fl ow of credit to the agriculture sector has been consistently higher than the target in recent years. Co-operative banks and regional rural banks (RRBs), however, could not achieve their targets for 2013-14 and 2014-15 (Table IV.2).
Stressed Assets in Agriculture
IV.8 SCBs’ non-performing assets (NPAs) in the agriculture sector have been rising steadily since 2010, refl ecting, inter alia, a decline in the recovery of agriculture advances (Tables IV.3 and IV.4).
IV.9 Although the Government has been incentivising repayment of agricultural loans through the interest subvention scheme, this has not helped in improving the asset quality. The Government has been examining various measures
to improve the effi cacy of the scheme. The scheme
has been extended for 2015-16.
Credit Flow to Micro and Small Enterprises (MSEs)
IV.10 Refl ecting the focus of the Government and
the Reserve Bank on enhancing credit fl ow to the
MSE sector, credit to the sector showed a growth
of 13.6 per cent as compared to the overall bank
credit growth of 9.0 per cent during 2014-15
(Table IV.5).
Initiatives for the MSME Sector
IV.11 Continuing its efforts of promoting fi nancial inclusion in the MSME sector, the Reserve Bank launched several initiatives during the year to address impediments in the credit fl ow to the sector. To address the issue of delayed payments to the MSME sector, TReDS has been conceptualised as an authorised electronic platform to facilitate discounting of invoices/bills of exchange of MSMEs (see Chapter IX for details). TReDS is expected to speed up the
Table IV.2: Targets and Achievements for Agricultural Credit (` billion)
End March Scheduled Commercial Banks Cooperative Banks RRBs Total
Target Achievement Target Achievement Target Achievement Target Achievement
1 2 3 4 5 6 7 8 9
2013-14 4,750 5,090 1,250 1,199 1,000 827 7,000 7,116
2014-15* 5,400 5,997 1,400 1,384 1,200 1,025 8,000 8,406
*: Provisional.
fee’ to the seller bank (a bank which has over achieved its PSL requirements) for purchasing a specifi ed amount of PSL obligation applicable for a particular date.
Educational loans (including loans for vocational courses) up to `1 million irrespective of the sanctioned amount to be considered as eligible for the priority sector.
Export credit up to 32 per cent of adjusted net bank credit (ANBC) or credit equivalent amount of off-balance sheet exposure (CEOBE), whichever is higher, to be eligible as part of the priority sector for foreign banks
with less than 20 branches. For domestic and foreign banks with 20 branches and above, the incremental export credit over the corresponding date of the preceding year will be reckoned up to 2 per cent of ANBC or CEOBE (whichever is higher), as part of the priority sector.
Foreign banks with less than 20 branches are required to achieve the total priority sector target of 40 per cent of ANBC or CEOBE, whichever is higher, in a phased manner by 2020.

CREDIT DELIVERY AND FINANCIAL INCLUSION
71
Table IV.4: Recovery of Direct Agriculture Advances
Year Total Demand (` billion)
Total Recovery (` billion)
Per cent of Recovery to
Demand
1 2 3 4
2012 1,917.7 1,428.9 74.5
2013 2,596.2 1,975.7 76.1
2014 2,814.9 2,066.0 73.4
Table IV.3 : NPAs in the Agriculture Sector
End-March Agriculture Loans
Outstanding(` billion)
Gross NPAs in Agriculture*
(` billion)
Ratio of Gross NPAs (Agriculture) to
Agriculture Loans Outstanding
(per cent)
1 2 3 4
2010 4,636 104 2.2
2011 5,072 167 3.3
2012 5,802 248 4.3
2013 6,428 302 4.7
2014 7,698 340 4.4
2015 8,295 391 4.7
*Only SCBs.
trainers in commercial banks. CAB, Pune has also developed a syllabus for the regional offi ces of the Reserve Bank, which, in turn, will conduct workshops for capacity building for branch managers of specialised MSME branches in their jurisdictions.
FINANCIAL INCLUSION
Roadmap for Provision of Banking Facilities in Unbanked Villages with Population less than 2,000
IV.14 The Reserve Bank continued with its efforts to ensure extension of banking facilities to all unbanked villages. For this, about 490,000 unbanked villages with population less than 2,000 were identifi ed and allotted to banks for coverage under the ongoing Phase-II of the roadmap. At end-March 2015, as reported by State Level Bankers Committees (SLBCs), 390,387 villages were covered by 14,207 branches, 357,856 business correspondents (BCs) and 18,324 other modes, such as automated teller machines (ATMs) and mobile vans. In view of the ongoing implementation of PMJDY, banks were advised to complete Phase-II coverage by August 14, 2015 instead of March 31, 2016 as prescribed earlier.
Pradhan Mantri Jan Dhan Yojana (PMJDY)
IV.15 The Government of India launched PMJDY on August 28, 2014, for extending formal fi nancial services to the excluded population. The major features of the scheme include: (i) the facility to open a basic saving bank deposit (BSBD) account
Table IV.5: Credit Flow to MSEs
Year Number of Accounts
(million)
Amount Outstanding
(` billion)
MSE credit as per cent of
ANBC
1 2 3 4
2014 12.6 (12.3) 8,510.9 (23.9) 15.7
2015 13.8 (10.1) 9,664.8 (13.6) 17.8
Note: 1. Data for 2015 are provisional.2. Figures in parentheses indicate y-o-y change in per cent.
Source: Scheduled commercial banks.
realisation of receivables and reduce the incidence of sickness in this sector.
IV.12 Regional offi ces of the Reserve Bank have set up MSME specifi c divisions to: (i) collate and analyse data on credit fl ow and sickness from the region; (ii) monitor banks’ efforts towards nursing and rehabilitation of MSME units in the region; (iii) monitor the level of banking activity in identifi ed and unidentifi ed clusters and initiate steps to enhance banking activity, wherever required; (iv) organise capacity building activities for bank functionaries involved in lending to the MSME sector; and (v) conduct research on matters relating to MSMEs, such as credit issues, availability of banking services in clusters, sickness and capacity building.
IV.13 As part of capacity building of MSME divisions in banks and to develop entrepreneurial sensitivity, the Reserve Bank’s College of Agricultural Banking (CAB), Pune has designed training programmes for the MSME division-in-charges and

ANNUAL REPORT
72
A financial inclusion conference was organised by the Reserve Bank in Mumbai on April 2, 2015. The Prime Minister of India was the chief guest on the occasion. Other dignitaries who attended the conference included the Governor of Maharashtra, the Finance Minister of India and the Chief Minister of Maharashtra, apart from experts from the banking and finance fraternity. The Prime Minister released the Concise History of Reserve Bank of India: 1935-1981 at the function.
The Prime Minister encouraged the Reserve Bank to prepare a roadmap for achieving fi nancial inclusion objectives by setting targets in a phased manner till the centenary year of the establishment of the Reserve Bank.
Panel discussions were held on the following topics as part of the conference: (i) ‘Financial Inclusion - Let All Efforts Bloom’; (ii) ‘Building the Business Case for Financial Inclusion - Whether BC Model is the Way to Go?’(iii) ‘Financial Inclusion - the Way Forward’; and (iv) ‘The linkage between Financial Inclusion, Financial Literacy and Consumer Protection’. Some of the key points which
emerged from the discussions are:
Concerted efforts of the Government of India, the Reserve Bank and banks are necessary to further the fi nancial inclusion agenda. The strategy to realise this goal will comprise of a mix of conducive policy environment, use of innovative channels/technology and optimal utilisation of the BC model.
The risks associated with the BC model can be mitigated by putting in place a secure system, use of appropriate technology, effective supervision, efficient cash management services and capacity building.
Raising the level of acceptance of technology by customers will require sustained financial literacy initiatives on the part of bankers.
Customers’ awareness about their rights and duties is integral to developing a conducive consumer protection environment. This will also necessitate banks to develop strong internal grievance redressal mechanisms.
Box IV.2RBI@80: Conference on Financial Inclusion
in any bank branch or BC outlet; (ii) accidental insurance cover (` 0.1 million) and life insurance cover (` 30,000); and (iii) an overdraft (OD) facility after satisfactory operation of the account for six months. Since the inception of the scheme, 165.7 million accounts had been opened by June 30, 2015. The Government of India has initiated routing of subsidy payments and also introduced insurance and pension products for BSBD account holders including for those accounts opened under PMJDY. To ensure increased activity in these accounts, the efforts that needed to be taken include: (i) rolling out direct benefi t transfer (DBT) for all Central and State Government payments; (ii) offering appropriate credit products (farm and non-farm sector) after due diligence; (iii) strengthening the BC network; and (iv) increasing awareness through fi nancial literacy initiatives.
IV.16 Refl ecting the focus of the Reserve Bank on financial inclusion, the 80th anniversary celebrations of the Reserve Bank were held in Mumbai on April 2, 2015, with fi nancial inclusion as the central theme (Box IV.2).
Financial Inclusion Plan (FIP)
IV.17 The Reserve Bank has been encouraging banks to adopt a structured and planned approach to fi nancial inclusion with commitment at the highest levels by preparing board-approved FIPs. Out of 3,445 rural bank branches opened during 2014-15, 2,230 branches were opened in unbanked rural centres. Around 155 million basic savings bank deposit accounts (BSBDAs) were added taking the total BSBDAs to 398 million. This includes 147 million accounts opened under PMJDY. With the addition of 2.6 million small farm sector credits (kisan credit cards-KCCs) and 1.8 million small non-farms sector credits (general credit cards-GCCs), the total number of such accounts went up to nearly 42.5 million and 9.2 million respectively (Table IV.6).
Constraints in Financial Inclusion
IV.18 Though the initiative under financial inclusion has led to opening of large number of basic bank accounts of people from the excluded segment, the effort for ensuring that these accounts remain operational has to continue. This is possible

CREDIT DELIVERY AND FINANCIAL INCLUSION
73
if all government payments are routed through the banking channel. A step ahead will be to remunerate banks appropriately for routing these transactions through the banking channel. In addition, since the last mile delivery of all banking services is expected to be done mostly through the large BC network created across the country, it is necessary to ensure that appropriate control system for oversight over BC operations is provided by banks. The success of the Information and Communication Technology based BC model critically depends upon the availability of proper network connectivity across the country.
Simplifying Credit Dispensation
IV.19 SCBs have been advised to dispense with no due certificate from individual borrowers (including SHGs and JLGs) for all types of loans, irrespective of the amount involved. Banks have
been encouraged to use an alternative framework
of due diligence for credit appraisal, which could
consist of one or more of the following : (i) credit
history check through credit information companies;
(ii) self-declaration or an affi davit from the borrower;
(iii) central registry of securitisation asset
reconstruction and security interest (CERSAI)
registration; (iv) peer monitoring; (v) information
sharing among lenders; and (vi) information search
(writing to other lenders with an auto deadline).
FINANCIAL LITERACY
Financial Literacy Camps
IV.20 Apart from direct initiatives, the Reserve
Bank’s efforts to expand financial literacy are
channelled through banks. In terms of current
instructions, fi nancial literacy centres (FLCs) and
rural branches of banks are required to conduct
fi nancial literacy camps at least once a month with
focus on fi nancially excluded people. Additionally,
Table IV.6: Financial Inclusion Plan-Summary Progress of All Banks Including RRBs
Particulars Year ended March 2010
Year ended March 2014
Year ended Mar 2015
Progress April 2014 -
Mar 2015
1 2 3 4 5
Banking Outlets in Villages - Branches 33,378 46,126 49,571 3,445
Banking Outlets in Villages – Branchless mode 34,316 337,678 504,142 166,464
Banking Outlets in Villages -Total 67,694 383,804 553,713 169,909
Urban Locations covered through BCs 447 60,730 96,847 36,117
Basic Savings Bank Deposit A/c through branches (No. in million) 60.2 126.0 210.3 84.3
Basic Savings Bank Deposit A/c through branches (Amt. in ` billion) 44.3 273.3 365.0 91.7
Basic Savings Bank Deposit A/c through BCs (No. in million) 13.3 116.9 187.8 70.9
Basic Savings Bank Deposit A/c through BCs (Amt. in ` billion) 10.7 39.0 74.6 35.6
BSBDAs Total(No. in million) 73.5 243.0 398.1 155.1
BSBDAs Total (Amt. in ` billion) 55 312.3 439.5 127.3
OD facility availed in BSBDAs (No. in million) 0.2 5.9 7.6 1.7
OD facility availed in BSBDAs (Amt. in ` billion) 0.1 16.0 19.9 3.9
KCCs (No. in million) 24.3 39.9 42.5 2.6
KCCs (Amt. in ` billion) 1,240.1 3,684.5 4,382.3 697.8
GCC (No. in million) 1.4 7.4 9.2 1.8
GCC (Amt. in ` billion) 35.1 1,096.9 1,301.6 204.7
ICT A/Cs BC Transaction (No. in million)* 26.5 328.6 477.0 477.0
ICT A/Cs BC Transactions (Amt. in ` billion)* 6.9 524.4 859.8 859.8
*: During the fi nancial year.

ANNUAL REPORT
74
Table IV.7 : Activities Undertaken by Financial Literacy Centres
Particulars 2013-14(April-March)
2014-15#(April-March)
1 2 3
No. of operational FLCs 942 1,181
No. of activities conducted* 56,985 84,089
Total no. of participants* 3,826,068 5,238,358
No. of participants opened accounts after attending the camps
NA 1,442,546
No. of participants already having accounts while attending camps
NA 2,890,204
*: Includes both outdoor and indoor activities. However, indoor
activities have been discontinued w.e.f. April 2014.
NA: Not available. #: Provisional.
banks are encouraged to conduct such camps in
unbanked locations. As at end March 2015, 1,181
FLCs were operational in the country, up from 942
as at end March 2014. During the period April 2014
to March 2015, financial literacy camps were
conducted by 32,509 rural branches of banks and
1.4 million and 5.7 million participants opened
accounts in the camps organised by the FLCs and
rural branches of banks, respectively (Table IV.7
and IV.8).
Agenda for 2015-16
IV.21 Going forward, the mechanism for issue of priority sector lending certifi cates (PSLCs) will be made operational. This will provide banks with an instrument to aid them in priority sector target achievement and allow leveraging of their comparative advantage in lending to the priority sector. To work out a medium-term (five year) measureable action plan for fi nancial inclusion, the Reserve Bank has constituted a Committee on
Medium-term Path on Financial Inclusion (Chairman: Shri Deepak Mohanty). Studies will be conducted to assess the effi cacy of existing schemes on lead bank, credit guarantee trust for micro and small enterprises (CGTMSE), KCC, SHG - bank linkage and the BC model.
IV.22 Operationalisation of TReDS, which has been conceptualised as an authorised electronic platform to facilitate discounting of invoices/bills of exchange of MSMEs, will be taken up during the course of the year. In pursuance of the objective of fostering a conducive policy environment for the MSME sector, there will be continuous monitoring of banks’ efforts towards nursing and rehabilitation of MSME units, collation and analysis of data on credit fl ow and sickness in such units. With a view to developing ‘entrepreneurial sensitivity’ and improving the skills of dealing functionaries of banks, the Reserve Bank proposes to roll out a national capacity building programme. This is expected to help the functionaries understand the genuine credit needs of MSME entrepreneurs and provide timely response.
Table IV.8 : Activities Undertaken by Rural Branches
Particulars 2014-15*
1 2
No. of Rural branches 52,934
No. of Rural branches conducted camps 32,509
No. of camps conducted 306,188
Total no. of participants 14,826,647
No. of participants opened accounts after attending the camp
5,657,092
No. of participants already having accounts while attending camps
6,686,518
*: Provisional.

REGULATION OF FINANCIAL MARKETS AND FOREIGN EXCHANGE MANAGEMENT
75
REGULATION OF FINANCIAL MARKETS AND FOREIGN EXCHANGE MANAGEMENTV
V.1 Broadening and deepening financial markets and putting in place an appropriate architecture for regulating them have been an on-going engagement of the Reserve Bank. During 2014-15, guided by the fi ve-pillar approach set out in the Second Quarter Review of Monetary Policy of 2013-14 to drive its developmental and regulatory policies, the Reserve Bank undertook several measures to improve liquidity, activity and resilience of various segments of the financial market spectrum, especially in the context of a volatile and uncertain international environment, so that these markets perform effi ciently their intermediation role in fi nancing India’s growth. The efforts were targeted at increasing participation, simplifying procedures and making the markets deeper, effi cient, accessible and stable.
V.2 In the money market, the endeavour was to fur ther develop term/repo markets. In the government securities (G-secs) market, the objective, as in the past, was to promote liquidity and broad based participation, including by foreign investors and resident individuals. In the foreign exchange market, emphasis was placed on the liberalisation of transactions, both current and capital and inward and outward. In the derivatives segment, the objective was to develop participation through simplification of procedures. Three departments of the Reserve Bank are primarily entrusted with the roles of developing and regulating of fi nancial markets, fi nancial market operations and foreign exchange management.
FINANCIAL MARKETS REGULATION DEPARTMENT (FMRD)
V.3 FMRD was set up on November 3, 2014 with a mandate to regulate, develop and oversee fi nancial markets in an integrated manner. The primary activities of the department include regulation and development of the money, G-secs, foreign exchange and related derivatives markets. The department is also responsible for the implementation of the recommendations of the Committee on Financial Benchmarks (Chairman: Shri P. Vijaya Bhaskar), strengthening of the financial market infrastructure and market surveillance. A Market Intelligence Cell is proposed to be set up as part of FMRD. Going forward, the department will focus on (i) making market access norms easier for all participants; (ii) expanding the menu of products and participants across all segments; (iii) strengthening market infrastructure in line with global standards; and (iv) leveraging the market analytics and surveillance mechanism for policy inputs.
Agenda 2014-15: Implementation Status
V.4 During 2014-15, FMRD undertook measures targeted at increasing participation, simplifying procedures and making the markets more effi cient. The Technical Advisory Committee (TAC) on Money, Forex and G-secs Markets (Chairman: Harun R. Khan) was reconstituted in April 2015 with representation from various stakeholders to advise the Reserve Bank in this endeavour.
During 2014-15, the Reserve Bank undertook several measures to improve the financial markets. The efforts were targeted at increasing participation, simplifying procedures and making the markets deeper, efficient, accessible and stable. Developing the money market with appropriate instruments and adequate participation assumed central importance. Further, refining and rationalising foreign exchange regulations should contribute to the widening and deepening of the foreign exchange market. In the derivatives markets, the measures taken during 2014-15 were aimed at simplifying the documentation requirements and increasing participation in both over-the-counter and exchange traded currency derivatives.

ANNUAL REPORT
76
V.5 With the objective of implementing the recommendations of Committee on Financial Benchmarks, a new company, Financial Benchmarks India Pvt Ltd (FBIL), jointly promoted by the Fixed Income Money Market and Derivatives Association of India (FIMMDA), the Foreign Exchange Dealers’ Association of India (FEDAI) and the Indian Banks’ Association (IBA), has commenced operations in February 2015. As a fi rst step, FBIL overnight Mumbai interbank offer rate (FBIL-Overnight MIBOR) was launched on July 22, 2015.
V.6 An appropriate public dissemination system was to be instituted at the Clearing Corporation of
India Ltd. (CCIL) for disclosing the price and volume information on major interbank over-the-counter (OTC) foreign exchange derivatives. CCIL has, accordingly, started disseminating data on USD-INR forwards and USD-INR currency options with effect from April 13, 2015. The data disseminated are on an aggregated basis and contain tenor-wise traded rate/implied volatility in terms of open, high, low, last, weighted average rate (WAR), volumes and number of trades (Box V.1).
V.7 As planned, limits for short sale have been increased and undertaking short sales in the OTC market has been permitted. Re-repo of G-secs
Box V.1 G20 Commitments and Reforms in the OTC Derivatives Market in India
In response to the global fi nancial crisis of 2007, the G20 initiated reforms to strengthen the regulation and oversight of the fi nancial system, and tasked the Financial Stability Board (FSB) with coordination of the reforms. The reforms include improving transparency and enhancing the resilience of OTC derivatives markets. An implementation group for OTC derivatives (Chairman: Shri R. Gandhi), constituted on the direction of the sub-committee of the Financial Stability and Development Council (FSDC) has set out a roadmap for reforms.
Standardisation
Following the standardisation of inter-bank trades in credit default swaps (CDS) and the rupee overnight index swap (OIS) based on overnight MIBOR, interest rate swaps (IRS) referenced to other benchmarks will be standardised in phases.
Standardisation of foreign exchange derivatives will be addressed at the end of 2015 since they are generally ‘plain vanilla’ and market liquidity is low in currency swaps, IRS in foreign currency (FCY) and interest rate options.
Exchange or electronic platform trading
As the market develops for forex options, currency swaps (CS), FCY-IRS and interest rate options in FCY and CDS, the possibility of introducing a trading platform will be examined.
Reporting to trade repositories (TRs)
As in the case of all OTC forex and interest rate derivatives, client transactions in rupee IRS/ forward rate agreement (FRA) and CDS, FCY interest rate
options will be brought under the reporting framework but as and when its liquidity picks up.
Thus, India has become fully compliant with the G20 commitment on reporting of OTC derivatives transactions to TRs.
Central clearing
More than 80 per cent of IRS trades are being centrally cleared on a non-guaranteed basis without a regulatory mandate. In principle approval has been given to CCIL to provide central counterparty (CCP) based clearing for IRS trades which will be made operational shortly.
In the case of forex derivatives, CCP’s clearing of forex forwards has been mandated. CCP clearing for forex options, CS, IRS and interest rate options in FCY and CDS in which liquidity remains low will be reviewed by end-2015.
Margin requirements
Detailed modalities for OTC derivatives, including CDS will be prescribed taking into account the recommendation of the Basel Working Group on margin requirements and other international developments.
Capital requirements for non-centrally cleared OTC derivatives
Rules on capital requirements for banks’ exposures to CCPs have been made effective from January 1, 2014, reducing the capital requirements for centrally cleared products. In addition, credit valuation adjustment (CVA) capital charge for non-centrally cleared derivatives has also been made effective.

REGULATION OF FINANCIAL MARKETS AND FOREIGN EXCHANGE MANAGEMENT
77
acquired under reverse repo has also been permitted. Facilitating participation of foreign portfolio investors (FPIs) in G-secs was one of the key mandates for the year. In this direction, FPIs were permitted to acquire G-secs directly from any counterparty in the secondary market, obviating the requirement of a broker. Settlement of all FPI transactions in G-secs has been permitted on T+2 basis. FPIs were allowed to reinvest coupons, received on their investments in G-secs, outside the existing limit and also permitted to hedge the currency risk of the coupon receipts on debt securities falling due during the following 12 months.
V.8 With the objective of introducing new products and expanding markets, 6-year and 13-year cash settled interest rate futures (IRFs) on Government of India (GoI) securities with residual maturity of 4-8 years and 11-15 years, respectively, were permitted on exchanges. A Working Group (Chairman: Prof. P.G. Apte) has been constituted for introduction of interest rate options.
V.9 To make documentation in forex markets less onerous, the certifi cation required from the hedging entity’s statutory auditors has been replaced with an undertaking from the designated offi cials of the entity, both in the OTC and the exchange traded currency derivatives (ETCD) markets. The eligibility limits for hedging for importers, based on past performance, have been brought at par with exporters, both in the OTC and ETCD markets. The permissible position limits on the exchanges, without the requirement of establishing underlying exposure, have been enhanced to US$ 15 million for USD-INR and US$ 5 million for all other permitted currency pairs put together.
V.10 Towards achieving the objective of providing overseas entities greater access to onshore hedging markets, external commercial borrowings (ECBs) lenders in rupees have been permitted to
enter into swap transactions with their overseas bank which shall, in turn, enter into a back-to-back swap transaction with any authorised dealers (AD) category-I bank in India. In order to improve transparency and broad base participation in interest rate swaps (IRS), an anonymous electronic trading platform for IRS contracts referenced to overnight MIBOR benchmark was launched on August 3, 2015 with the CCIL’s guaranteed settlement.
V.11 In respect of a few areas identified for implementation, while action has been initiated, full implementation is yet to be achieved. With regard to upgradation of the negotiated dealing system order-matching (NDS-OM) platform, necessary approvals were given to CCIL. While the architecture, messaging structure and technology infrastructure have been finalised for the purpose, software development is at an advanced stage.
V.12 Examining the feasibility of international settlements for Indian sovereign debt securities was another planned activity. There has been continuous engagement with the GoI and the major international central security depositories (ICSD), Euroclear and Clearstream, in this regard. A feasible mechanism addressing all concerns is likely to become operational during 2015-16.
Agenda for 2015-16
V.13 The regime for fi xing limits for FPI investment in debt securities has undergone changes over the years. The Reserve Bank, in consultation with the GoI, intends to put in place a structured process for fi xing these limits along with a framework for periodic reviews. Encouraging retail participation in G-secs continues to engage the Reserve Bank’s attention. To enable seamless movement of securities from the subsidiary general ledger (SGL) form to the demat form and vice versa, it was announced to provide demat account holders a functionality to put through trades on NDS-OM. An
ANNUAL REPORT
78
implementation group with representatives from all stakeholders has been set up to roll out the measures by December 2015.
V.14 A deep and liquid corporate bond market has been a shared policy goal of the GoI and fi nancial regulators. Introduction of an electronic platform for facilitating repo in corporate bonds will be considered for implementation. In order to impart liquidity to the options segment in the OTC forex market and attract greater all-round participation, fi nal guidelines allowing exporters and importers to write covered options against their contracted exposures are expected to be issued shortly. Based on the recommendations of the Working Group on interest rate options, the fi nal guidelines will be issued. A framework for assessment of benchmark submission practices by market participants will also be put in place in 2015-16.
FINANCIAL MARKETS OPERATIONS DEPARTMENT (FMOD)
V.15 As part of organisational restructuring, FMOD was created from the erstwhile Financial Markets Department (FMD) on November 3, 2014 by hiving off the surveillance function. With this, FMOD has primarily become an operational department responsible for conducting fi nancial market operations effi ciently. The role of FMOD is to facilitate vibrant, effi cient and stable fi nancial markets to support a rapidly growing real economy.
Agenda 2014-15: Implementation Status
V.16 FMOD is primarily entrusted with the task of conducting market operations in consonance with the policies of the Reserve Bank. Thus, as in the previous years, maintaining orderly conditions in the forex market through its operations in both spot and forward segments was high on the agenda for 2014-15. Efforts were also directed at maintaining appropriate levels of liquidity in the fi nancial system through liquidity management operations, which
include the liquidity adjustment facility (LAF) (fi xed/variable rate repo/reverse repo of various tenors) and overnight marginal standing facility (MSF), other standing facilities and open market operations (OMOs) with a view to ensuring better alignment between money market rates and the policy rate for more effi cient transmission of monetary policy signals. Regular analyses and research on developments in fi nancial markets and market operations were also carried out.
V.17 During 2014-15, exchange rate of the rupee exhibited stability, unlike in the previous year when it witnessed intense volatility during July-August 2013 on account of taper tantrums. For better liquidity management, the LAF was revised in September 2014 which entailed more frequent 14-day term repo auctions besides use of variable rate repo/reverse repo auctions of various tenors for fi ne tuning. These steps helped in reducing volatility in the money market and ensuring closer alignment of the money market rates with the policy rate.
Agenda for 2015-16
V.18 The department aims to continue with its endeavour to carry out liquidity management operations effectively, conduct foreign exchange operations, including interventions, in an effective manner and carry out policy oriented research on fi nancial markets. The department also intends to undertake technological up-gradation to facilitate smoother and more fl exible liquidity management operations.
FOREIGN EXCHANGE DEPARTMENT (FED)
V.19 With increasing globalisation, and evolving business practices and models, effective integration of the needs of both residents and non-residents is necessary while meeting the basic objectives of the Foreign Exchange Management Act (FEMA), 1999. Since India is likely to remain a capital defi cit country in the near to medium term, the regulatory
REGULATION OF FINANCIAL MARKETS AND FOREIGN EXCHANGE MANAGEMENT
79
regime needs to provide a framework which is simple, comprehensive and principle based so as to reduce the regulatory cost and improve the ease of doing business. This has to be implemented within the overarching principle of calibrated progress towards capital account liberalisation within the constraints imposed by macro-prudential stability. Within the Reserve Bank, FED acts as the nodal department for this purpose.
Agenda 2014-15: Implementation Status
V.20 With normalcy returning to the external sector, the Reserve Bank rolled back many of the emergency steps taken in 2013-14 and focussed on ensuring robust and stable capital fl ows to fi nance the current account defi cit and supplement savings in fi nancing the investment needs of the economy. In 2014-15, efforts were directed at further simplifying the foreign investment regime and making it more user-friendly both for domestic fi rms and foreign investors. A review of the existing framework of the ECBs was also envisaged.
Easing of FDI and FPI Regimes
V.21 On a review of the policy on eligible instruments for foreign direct investment (FDI) and FPI, partly paid equity shares and warrants issued by an Indian company were allowed to be considered as eligible instruments for the purpose of FDI and FPI schemes. To provide greater freedom and fl exibility in the FDI framework, the issue and transfer of shares, including compulsorily convertible preference shares/debentures, with or without optionality clauses (without any assured return), was allowed to be carried out at a price worked out as per the guidelines issued by the Securities and Exchange Board of India (SEBI) in case of listed companies and any internationally accepted pricing methodology in case of unlisted companies on an arm’s length basis. Further, Indian companies were permitted to issue equity shares against any funds payable by them, remittances of
which did not require prior permission of the government or the Reserve Bank under FEMA, 1999 or any rules/regulations framed or directions issued thereunder.
V.22 AD category-I banks were permitted to allow pledge of equity shares of an Indian company held by non-resident investor/s in accordance with the FDI policy in favour of non-banking fi nancial companies (NBFCs) to secure credit facilities extended to the resident investee company. Following the changes announced by the Government in the FDI policy, regulations were amended to enable foreign investments: (a) up to 49 per cent in the defence sector under the government approval route; and (b) up to 100 per cent in railway infrastructure and manufacturing of medical devices under the automatic route. In addition, FDI in the insurance sector was increased to 49 per cent from the earlier level of 26 per cent.
V.23 A new depository receipts scheme, 2014 was notifi ed by the Reserve Bank on January 22, 2015, under which a person is eligible to issue or transfer eligible securities to a foreign depository for the purpose of converting the securities into depository receipts.
Review of Framework for ECBs
V.24 The scope of ECB was expanded and recognised non-resident lenders were allowed to extend loans in Indian rupees to eligible resident borrowers. The facility, besides providing greater fl exibility for structuring of ECB arrangements, shifts the currency risk from borrowers to lenders. For better structuring of the draw-down of ECB proceeds and their subsequent utilisation for permitted end uses, eligible ECB borrowers were allowed to park ECB proceeds in term deposits with AD Category-I banks in India for a maximum period of six months, pending utilisation. The set of eligible securities for raising ECBs was made more broad-
ANNUAL REPORT
80
based to include movable assets and fi nancial securities in addition to immovable assets.
Simplifi cation of Non-trade Outward Remittances and Travel-related Transactions
V.25 Policies relating to overseas direct investment (ODI) were liberalised with a view to providing fl exibility to residents for availing fund based or non-fund based facilities for overseas joint ventures (JVs), wholly owned subsidiaries (WOS) and step down subsidiaries (SDS). This, inter alia, included permitting pledging of shares of its overseas SDS and creating a charge on domestic/ foreign assets.
V.26 In view of the resumption of buoyant capital infl ows in the recent period and as part of macro-prudential management, the limit under the liberalised remittance scheme (LRS) was enhanced to US$ 2,50,000 per individual per fi nancial year from the existing limit of US$ 1,25,000. Further, to ensure ease of transactions, all the facilities for release of exchange/ remittances for current account transactions available to resident individuals under Schedule III of the Foreign Exchange Management (Current Account Transactions) Rules, 2000, as amended from time to time, were subsumed under this limit.
V.27 To mitigate the hardships faced by people travelling to Nepal and Bhutan, individuals were permitted to carry higher value denomination notes up to a value of `25,000. Earlier, individuals travelling to these two countries were allowed to carry Indian currency without any limit in denominations of only up to `100.
Export Data Processing and Monitoring System (EDMPS)
V.28 An EDPMS was put in place in March 2014 to bring about effi ciency and ease in data reporting as also enabling more effective monitoring of export transactions. EDPMS has a single master database
for all export transactions and is shared by all the stake-holders involved (Reserve Bank of India, customs and banks). EDPMS effectively addressed the long standing issue of unmatched export transactions reported by customs but not detected in the banking channel.
International Financial Services Centre (IFSC)
V.29 Regulations were framed in March 2015 to enable functioning of IFSCs under which a fi nancial institution or a branch of a fi nancial institution will be treated as a person resident outside India and its transactions with a person resident in India will be treated as those between a non-resident and a resident and subject to the provisions of FEMA, 1999.
Rupee Denominated Overseas Bonds
V.30 A few international institutions were permitted since 2013 to issue rupee bonds in overseas markets, which elicited a positive response. In the monetary policy statement of April 2015, the Reserve Bank, in consultation with the GoI, decided to permit Indian corporates eligible to raise ECBs to issue rupee denominated bonds overseas. The draft framework on overseas issuance of rupee linked bonds by multilateral fi nancial institutions and eligible borrowers was placed in the public domain and the policy in this regard is likely to be fi nalised soon.
Agenda for 2015-16
V.31 Considering the progress that the country has made in foreign exchange management and to facilitate the ease of doing business, there is a need for aligning the regulations issued under FEMA, 1999 with evolving business models and practices. Accordingly, the Reserve Bank proposes to (i) complete the task of rationalising and simplifying the notifi cations issued under FEMA, which commenced last year; (ii) issue master regulations covering all instructions on a subject in a more user friendly format; and (iii) rationalise the returns submitted to it in order to reduce the
REGULATION OF FINANCIAL MARKETS AND FOREIGN EXCHANGE MANAGEMENT
81
regulatory load on users of foreign exchange. The task of simplifying the ECB guidelines is an ongoing process and the Reserve Bank will also take into account the recommendations of the Committee to Review the Framework of Access to Domestic and Overseas Capital Markets (Phase II, Part II: Foreign
Currency Borrowing, Report III; Chairman: Shri M.S. Sahoo). Encouraged by the stabilisation of EDPMS, the Reserve Bank will initiate work on installing an import data processing and monitoring system (IDPMS) in coordination with the government agencies.
ANNUAL REPORT
82
VI.1 The year under review was marked by rising fi nancial stability risks worldwide - uncertainty surrounding the normalisation of monetary policy in the US and market reactions to incoming data that prompted risk-on risk-off switches in sentiment, asset prices and capital fl ows around its timing; highly accommodative monetary policies in the euro area and Japan with large swings in fi nancial asset prices; and fi nancial rebalancing and managing domestic vulnerabilities in emerging market economies, higher corporate indebtedness and growing exposure to market and liquidity risks. Against this backdrop, safeguarding fi nancial stability through well-designed macro-prudential measures addressing both banking and non-banking constituents of the fi nancial system assumed critical importance.
VI.2 With asset quality and profi tability of banks coming under stress due to a combination of global and domestic developments, the Reserve Bank’s focus during 2014-15 was on strengthening the regulatory and supervisory frameworks by aligning them with Basel III norms and also with those established by other international standard setting bodies.
VI.3 The regulatory and supervisory regime for non-banking fi nancial companies (NBFCs) and
urban cooperative banks (UCBs) was also fortifi ed by aligning it with that of the banking system while promoting technological upgradation and sharing credit histories of borrowers. The banking structure itself was sought to be strengthened by infusion of new entrants, including in niche domains, such as small fi nance and payments banks and by extending the reach of the payment system infrastructure by bringing into its fold non-bank authorised entities. The Reserve Bank also signed memoranda of understandings (MoUs)/ exchange of letters/ statements of cooperation with a host of supervisors of other countries to promote greater cooperation and sharing of supervisory information relating to Indian banks with overseas operations and foreign banks operating in India.
VI.4 A critical area in the banking space that warranted prioritised attention was the mounting overhang of stressed assets. Besides mechanisms for early corrective actions, a multi-pronged strategy was adopted comprising higher provisioning against restructured assets, recovery management through asset reconstruction companies and strategic debt restructuring.
VI.5 Towards this end, various departments of the Reserve Bank dealing with the regulation and supervision of fi nancial intermediaries as also
Following the economic slowdown and sector-specific factors, the banking sector has been beset with the problem of deteriorating asset quality. In response, the Reserve Bank focused on strengthening the regulatory and supervisory framework to identify stress at the incipient stage and initiate corrective action. Alongside, the Reserve Bank sought to infuse competition in the banking sector by allowing new private sector banks and differentiated banks. Asset reconstruction companies were also encouraged for recovery management. Simultaneously, focus was placed on aligning the regulatory framework for NBFCs and UCBs with the rest of the banking sector. In pursuance of customer protection, the Reserve Bank released the Charter of Customer Rights, enunciating five basic rights for bank customers.
REGULATION, SUPERVISION AND FINANCIAL STABILITYVI
REGULATION, SUPERVISION AND FINANCIAL STABILITY
83
customer interest set out for themselves an agenda of work plans in 2014-15. The following paragraphs outline the activities undertaken by them, the challenges faced and the way forward for 2015-16.
FINANCIAL STABILITY UNIT (FSU)
VI.6 In the aftermath of the global fi nancial crisis, maintaining fi nancial stability has emerged as a prime responsibility of central banks. FSU of the Reserve Bank was set up in July 2009 to monitor stability related matters with the objective of strengthening the fi nancial system. This is envisaged to be achieved by conducting macro-prudential surveillance on an on-going basis, systemic stress tests and dissemination of the status of fi nancial stability in addition to supporting the institutional mechanism for fi nancial stability in the country, viz., Financial Stability and Development Council (FSDC).
Agenda for 2014-15: Implementation Status
VI.7 As planned for 2014-15, two Financial Stability Reports (FSRs) were published - one in December 2014 and the other in June 2015. It is the endeavour of the Reserve Bank to bring about improvements to its stress testing framework. Accordingly, refi nements were made to the macro stress testing methodology with respect to the variables used (e.g., using the consumer price index (CPI) instead of the wholesale price index (WPI), and weighted average lending rate in place of call rate). In addition, FSU collaborated with the International Monetary Fund (IMF) in the areas of modelling risk weighted asset (RWA) dynamics and modelling corporate sector distress and its impact on the banking sector in order to make further refi nements in the stress testing framework as also to develop new predictive models. Analyses of power and iron and steel industries, with emphasis on stressed assets were undertaken.
Further, their impact on the banking sector was assessed to gauge the resilience of the banking system.
VI.8 As the secretariat to the sub-committee of FSDC, FSU conducted three meetings of the sub-committee during 2014-15. The sub-committee’s recommendation for putting in place an enabling framework for creating an ‘account aggregation’ facility for customers to view all their fi nancial assets through a single window, is being worked out. Based on the discussions in the sub-committee, the Central Registry of Securitisation, Asset Reconstruction and Security Interest of India (CERSAI) will be acting as the central know your customer (KYC) registry to ensure both uniformity in the approach to KYC and its inter-usability across the fi nancial sector.
VI.9 Drawing on the sub-committee’s recommendations, various steps have been taken to strengthen State Level Coordination Committees (SLCCs) to make them more effective in the dissemination of market intelligence on unauthorised deposit taking schemes. Enactment of the Protection of Interests of Depositors’ (PID) Act has been undertaken across a number of states/ union territories.
VI.10 Based on the sub-committee’s direction to capture information on lending by insurance companies to corporates, insurance companies were advised to subscribe to the Central Repository of Information on Large Credits (CRILC), a repository of information on large credits set up by the Reserve Bank.
VI.11 Further, FSU also serves as the secretariat for the inter-regulatory technical group (IRTG), a sub-group of the FSDC sub-committee and in this capacity it conducted four meetings during 2014-15, in which issues such as legal entity identifi er (LEI), reporting of lending against shares by NBFCs, account aggregation and common KYC,
ANNUAL REPORT
84
among others, were discussed. The IRTG has advised all regulators to draw a road map to mandate use of LEI by entities identifi ed in their jurisdiction.
Agenda for 2015-16
VI.12 Going ahead, conducting macro-prudential surveillance and publishing FSR in December 2015 and June 2016 are envisaged along with conducting meetings of the FSDC sub-committee. FSU will continue to undertake analyses of some of the critical industrial sectors. In addition, it is also proposed to collaborate with international agencies/ other central banks to review the tools and techniques used for conducting stress tests.
REGULATION OF FINANCIAL INTERMEDIARIES
Commercial Banks: Department of Banking Regulation (DBR)
VI.13 On the banking regulation front, the Reserve Bank strives to ensure a robust and resilient banking system in line with the best international practices capable of catering to the fi nancial and associated needs of all sections of society effi ciently and effectively. Accordingly, the department initiated a number of measures in 2014-15 for strengthening the banking structure.
Agenda for 2014-15: Implementation Status
Basel III Liquidity Standards
VI.14 During 2014-15, signifi cant progress was made towards implementation of the two Basel III Liquidity Ratios - liquidity coverage ratio (LCR) which is set to impart resilience in the short term liquidity risk profi le of banks, and the net stable funding ratio (NSFR) that seeks to limit over-reliance on short-term wholesale funding. While LCR was phased in for Indian banks with a minimum requirement of 60 per cent from January 1, 2015, NSFR is set to be implemented at the
minimum requirement of 100 per cent from January 1, 2018.
Basel III Leverage Ratio (LR)
VI.15 In line with the Basel Committee on Banking Supervision (BCBS), the Reserve Bank issued a revised framework for LR in January 2015 as a credible supplement to risk-based capital requirements. While the fi nal minimum LR for Indian banks will be stipulated in line with the fi nal rules to be prescribed by BCBS by end-2017, the Reserve Bank will meanwhile monitor individual banks against an indicative LR of 4.5 per cent as part of a parallel run and also for the purpose of public disclosure of Tier 1 LR by banks.
Countercyclical Capital Buffer (CCCB) Framework
VI.16 Guidelines on implementation of CCCB in India have been issued covering aspects, such as constituents of CCCB, main and supplementary indicators to decide CCCB activation and calibration of CCCB based on indicators. Implementation of this buffer requirement will be pre-announced with a lead time of four quarters so as to provide suffi cient time to meet CCCB requirements.
Framework for Dealing with Domestic Systemically Important Banks (D-SIBs)
VI.17 In line with the global practice of identifying
global systemically important banks (G-SIBs), the
Reserve Bank has released the framework for
dealing with D-SIBs, which discusses the
methodology for identifying D-SIBs and additional
regulatory/ supervisory policies for them. The
names of banks classifi ed as D-SIBs will be
disclosed in August every year starting from 2015.
Large Exposures Framework
VI.18 The danger of concentration of a bank’s assets with a single counterparty or a group of
REGULATION, SUPERVISION AND FINANCIAL STABILITY
85
connected counterparties poses a systemic risk. Accordingly, the Reserve Bank has proposed a regulatory framework in line with international best practices to address the concerns arising from large exposures of banks and to prevent building up of concentrated exposures (Box VI.1).
Partial Credit Enhancement on Corporate Bonds
VI.19 During 2014-15, ways to incentivise corporates to reduce dependence on bank fi nance
for their long-term resource requirements were explored. Pursuant to this, draft guidelines were issued to banks to provide partial credit enhancement to corporate bonds. The fi nal guidelines in this regard are underway.
Revitalising Stressed Assets
VI.20 Towards greater alignment of prudential norms on project fi nance with international best practices, banks were allowed to extend structured
Box VI.1Discussion Paper on Large Exposures (LE) Framework and
Enhancing Credit Supply through the Market Mechanism
Internationally, concentration risk has been addressed by prescribing regulatory and statutory limits on exposures towards counterparties and various sectors of the economy. Since 1989, the Reserve Bank has been prescribing regulatory limits on a bank’s exposures to its single and group borrowers. At present, the exposure limits stand at 15 per cent and 40 per cent of capital funds (CFs), respectively.On account of exposures towards infrastructure sector and further on the special discretion of the board of a bank, these exposure limits can be taken up to 25 per cent and 55 per cent of its CFs, respectively. Besides, there are certain other specifi c counterparty, sectoral and activity-based exposure limits (Table 1).
In order to ensure regulatory convergence in the area of large exposures internationally, the Basel Committee on Banking Supervision (BCBS) issued the ‘Supervisory
Framework for Measuring and Controlling Large Exposures’ in April 2014 that will be fully applicable from January 1, 2019. Accordingly, the sum of all the exposure values of a bank to a single counterparty or to a group of connected counterparties must, at all times, not be higher than 25 per cent of the bank’s available eligible capital base, i.e, the effective amount of Tier 1 capital fulfi lling the criteria defi ned in the Basel III capital framework.
The Reserve Bank has sought to align exposure limits (both single and group) in India with the BCBS LE framework. In this context, a discussion paper on the proposed LE framework was issued on March 27, 2015. The discussion paper also contained proposals on enhancing credit supply to large corporates through the market mechanism (corporate bonds, commercial papers and other instruments).
(Contd....)
Table 1: Major Exposure Limits
Specifi c Counterparty/ Sector/ Activity Regulatory Exposure Limits
NBFCs predominantly engaged in loan against gold jewellery 7.5 per cent of CFs; can exceed by 5 per cent of CF for infrastructure
Other NBFCs (excluding AFCs/ IFCs) 10 per cent of CFs; can exceed by 5 per cent of CF for infrastructure
Direct Capital Market Exposures 20 per cent of net worth
Total Capital Market Exposures 40 per cent of net worth
Borrowing from the Call Money Market 100 per cent of CFs on a fortnightly average basis; can increase up to 125 per cent of CF on any day
Lending to the Call Money Market 25 per cent of CFs on a fortnightly average basis; can increase up to 50 per cent of CF on any day
Inter-Bank Liabilities 200 per cent of net worth as on 31 March of the previous year; can increase up to 300 per cent of the net worth for banks having minimum CRAR of 11.25 per cent
Investment in instruments issued by other banks/ FIs and eligible for capital status for the issuing bank/ FI
10 per cent of CF*
Investments in equity shares of other banks 5 per cent of the investee bank’s equity capital*
Leasing, Hire Purchase and Factoring Services 10 per cent of total advances of a bank for each of such activities
*: A bank/ FI’s equity holdings in another bank held under provisions of a statute will be outside the purview of the ceiling prescribed.AFCs: Asset Finance Companies; IFCs: Infrastructure Finance Companies; CRAR: Capital to Risk-Weighted Assets Ratio; FIs: Financial Institutions.
ANNUAL REPORT
86
long-term project loans with tenors up to 80 per cent of the initial economic life of a project, with a periodic refi nancing option to avoid asset liability mismatch, fund cost over-runs up to a limit and extend the date of commencement of commercial operations (DCCO) subsequent to the change in ownership of the borrowing entity. These measures are expected to further strengthen banks’ abilities to deal with complexities in project fi nance.
Strategic Debt Restructuring (SDR)
VI.21 With a view to enhancing banks’ capabilities to initiate change in ownership for accounts which fail to achieve the projected viability milestones under a restructuring package, the Reserve Bank introduced a SDR scheme in June 2015. Under SDR, secured creditors of a Joint Lenders’ Forum (JLF) can convert their loan dues into equity shares at a ‘fair price’ as per the pricing formula prescribed by the Reserve Bank, which has been exempted from the SEBI’s ICDR (Issue of Capital and Disclosure Requirements) Regulations, 2009
subject to certain conditions. Lenders under JLF
should collectively become majority shareholders
post conversion. SDR will not be treated as
restructuring for the purpose of asset classifi cation
and provisioning. JLF can appoint a suitable
professional management to run the affairs of the
company and should divest its holdings at the
earliest. In this regard, the proposal of a
comprehensive Bankruptcy Code in the Union
Budget, 2015-16 is expected to bring about speed,
clarity, predictability and fairness to the
restructuring and recovery process (Box VI.2).
Treatment of Wilful Defaulters and Non-
Cooperative Borrowers (NCBs)
VI.22 Regulations governing treatment of wilful
defaulters and NCBs having aggregate fund-
based and non-fund based facilities of `50 million
from a bank/ fi nancial institution (FI) were
strengthened during 2014-15 and banks/ FIs were
mandated to put in place transparent mechanisms
for identifying NCBs as also for reporting.
Two New Entrants in the Banking Domain
VI.23 In its endeavour to foster healthy
competition, the Reserve Bank laid out a
framework for licensing new banks in the private sector in February 2013. Accordingly, in-principle approval was granted in April 2014 to IDFC Limited, an NBFC, and Bandhan Financial Services Private Limited, an NBFC-MFI (micro-fi nance institution) to set up banks. In June-July
Under the proposed LE framework, a large exposure is one where the sum of all exposure values of a bank to a counterparty or a group of connected counterparties, is equal to or above 10 per cent of the bank’s eligible capital base. Further, exposures to the central government, the Reserve Bank, intra-day inter-bank exposures, intra-group exposures and clearing exposures of qualifi ed central counterparties are exempt from the LE limit. The LE Framework also prescribes differential exposure limits for certain counterparties, such as non-banking fi nancial companies (NBFCs) and systemically important banks (SIBs), both global and domestic (G-SIBs and D-SIBs). Connected counterparties are proposed to be identifi ed on the basis of ‘control’ as well as ‘economic interdependence’ criteria as against only the ‘control’ criteria under the extant exposure norms.
Computation of exposures under the LE framework will be permitted after taking into account credit risk mitigation adjustment based on risk-based capital framework techniques. Under the framework, banks may also be required to use ‘look through approach’ for assigning exposures to the underlying counterparties in structured products.
An internal study of the 20 largest group borrower exposures of the 10 largest banks has revealed that average exposure to groups of connected counterparties is 10.6 per cent of their CF as against the current permissible limit of 40 per cent of CF. In terms of Tier 1 capital, the present average exposure is 14.75 per cent as against the proposed LE limit of 25 per cent. Therefore, it is assumed that banks will not face any material diffi culty with regard to their group exposures while adhering to the proposed LE limit.
REGULATION, SUPERVISION AND FINANCIAL STABILITY
87
2015, Bandhan Bank Limited and IDFC Bank
Limited were granted license to carry out the
banking business in India.
Licensing of Differentiated Banks
VI.24 Guidelines on ‘Payments Banks’ and ‘Small
Finance Banks’ were issued on November 27,
2014. These banks are ‘niche’ or ‘differentiated’ banks with the common objective of furthering fi nancial inclusion. The Reserve Bank received 72 and 41 applications for small fi nance banks and payments banks respectively; these are under review. So far, 11 applicants have been granted in-principle approval to set up payments banks.
Box VI.2Bankruptcy Procedures in India
Stronger bankruptcy laws enable a sound debtor-creditor relationship by protecting the rights of both debtors and creditors; promoting predictability; clarifying the risks associated with lending; and ensuring effi cient collection of debt through bankruptcy proceedings. The Union Budget 2015-16 identifi ed bankruptcy law reforms as a key priority and proposed a comprehensive Bankruptcy Code in line with global standards to provide for necessary judicial capacity. It is envisaged to bring about legal certainty, speed and also improve the ease of doing business.
At present, there is no comprehensive policy/ law on corporate bankruptcy in India. The Sick Industrial Companies (Special Provisions) Act (SICA), 1985 remains to date the most important corporate restructuring law in force for revival and rehabilitation of sick companies, despite its well-recognised drawbacks. Other legislative attempts to overhaul the corporate rescue regime in India have not yet been made operational. For instance, Chapter XIX of the Companies Act, 2013 that provides for a broader, more balanced corporate rescue procedure applicable to all companies has not been notifi ed for commencement. Similarly, Chapter VIA of the Companies Act, 1956, inserted by the Companies (Second Amendment) Act, 2002, which provides for the National Company Law Tribunal (NCLT) to exercise powers in relation to sick industrial companies remains to be notifi ed.
With a view to overcoming the existing inadequacies, the Bankruptcy Law Reform Committee (BLRC) (Chairman: Shri TK Vishwanathan) was established in August 2014 and entrusted with the task of examining the present legal framework for corporate insolvency and suggesting immediate reforms; and developing an ‘Insolvency Code’ for India covering all aspects of personal and business insolvency. Salient recommendations of the BLRC made in line with international best practices are:
A secured creditor can initiate rescue proceedings if the debtor company fails to pay a single undisputed
debt above a prescribed value within 30 days of a notice of demand; or pre-emptively on the grounds of likelihood of inability to pay debt.
Unsecured creditors representing 25 per cent of the debt can initiate rescue proceedings against the debtor company.
Once a company has been declared sick, 75 per cent of the secured creditors in value should be able to appoint a company administrator directly.
Amendment to the Companies Act, 2013 so that at the time of sanctioning a scheme of revival creditors within the same class are treated equally; and dissenting creditors receive as much as they would in liquidation.
An administrative mechanism for resolving fi nancial distress of viable MSMEs through ‘Committees for Distressed Micro, Small and Medium Enterprises’ to be established by banks by amending the Micro, Small and Medium Enterprises Development Act, 2006.
Bankruptcy codes in the US and the UK provide for an automatic/ interim moratorium on the enforcement of claims upon fi ling for bankruptcy. However, in view of problems with an automatic moratorium under SICA, it is proposed to retain the present provisions in the Companies Act, 2013, while stipulating clear principles regarding exercise of discretion by NCLT on grant of moratorium or not.
BLRC has provided a comprehensive and improvised framework for strengthening the bankruptcy procedures in India. This will result in considerable improvement in the credit climate in the country.
Reference:
Government of India (2015), ‘Interim Report of The Bankruptcy Law Reform Committee’, Ministry of Finance.
ANNUAL REPORT
88
New Banking Structure to Facilitate International Financial Services Centres (IFSCs)
VI.25 Pursuant to the announcement of Government of India on setting up of an IFSC in Gujarat International Finance Tech-City (GIFT), the Reserve Bank has formulated a scheme for setting up of IFSC banking units (IBUs). This scheme will provide the fi nancial services entities in GIFT as well as other future IFSCs with a sound supporting regulatory framework. The IBUs are expected to offer fi nancial services to non-residents as also to residents subject to the provisions of Foreign Exchange Management Act (FEMA), 1999.
Corporate Governance
VI.26 In pursuance of the recommendations of the Committee to Review Governance of Boards of Banks in India (Chairman: Dr P. J. Nayak), set up by the Reserve Bank, guidelines were issued to banks on: fi xing of upper age limit for whole time directors of private sector banks; replacing the calendar of reviews with seven key themes; and compensation for non-executive directors of private sector banks. Further, the post of chairman and managing director (CMD) has been split into an executive managing director (MD) and a non-executive chairman. The revamped process for appointment of non-executive chairmen on the boards of public sector banks (PSBs) has been initiated by the government.
KYC Norms Simplifi ed
VI.27 KYC guidelines were revised in April 2014 to ease diffi culties in opening and operating bank accounts. Accordingly, the physical presence of a customer categorised as ’low risk’ is not mandatory at the time of KYC updation. Fresh proof of identity and address is not required for ‘low risk’ customers for updation in case of unaltered status. Self-certifi cation of proof is allowed and banks can
accept a certifi ed copy by mail/ post; and no fresh
documents are required if an existing KYC
compliant customer desires to open another
account in the same bank. Banks can now rely on
third party due diligence at the time of account
opening, provided the third party is regulated and
supervised and has adequate measures in place
for compliance with client due diligence.
Partial Freezing of Accounts in Case of KYC Non-
Compliance
VI.28 In case of non-compliance of KYC
requirements despite repeated reminders, banks
should impose ‘partial freezing’ of such accounts
in a phased manner to mitigate the threat of money
laundering and fi nancing of terrorism. If the
account is still KYC non-compliant after six months
of ‘partial freezing’, banks may render it inoperative.
The account can be revived on submission of KYC
documents.
Deposit Callability, Sole Criteria for Differential
Rates
VI.29 Effective April 16, 2015, banks are allowed
to offer differential rates of interest on term
deposits on the basis of tenor and premature-
withdrawal facility for deposits of less than `10
million and on the basis of quantum, tenor and
premature-withdrawal facility for deposits of `10
million and above, subject to certain conditions.
However, all term deposits of individuals (held
singly or jointly) of `1.5 million and below should,
necessarily have premature withdrawal facility.
Rationalisation of Penal Charges
VI.30 From April 1, 2015, banks are required to
notify a customer by SMS/ email/ letter before
applying penal charges for non-maintenance of
minimum balance in the inoperative savings
account. Furthermore, penal charges have to be
REGULATION, SUPERVISION AND FINANCIAL STABILITY
89
directly proportional to the extent of shortfall observed and levied after one month from the date of notice to a customer.
Distribution of Insurance Products
VI.31 Detailed customer protection guidelines were issued to banks conducting insurance distribution activities, e.g., ensuring customer suitability while selling an insurance product only when the customer volunteers to purchase it, prohibiting payment of commission/ incentive directly to the staff, transparency in disclosure of brokerage/ fee earned from the insurer, adherence to KYC guidelines and requirement of having a robust grievance redressal mechanism.
Agenda for 2015-16
VI.32 In continuation of the stance that guided regulatory actions in 2014-15, it is proposed to implement the fi nal framework for the LE regime and for NSFR in the ensuing year. Besides, the Reserve Bank will be issuing draft guidelines for consultation on counterparty credit risk exposures, Pillar 3 disclosures and the securitisation framework. These regulations will refl ect the revised BCBS norms in the respective areas.
VI.33 The Reserve Bank will also be initiating suitable measures towards convergence of accounting standards with the International Financial Reporting Standards (IFRS). In-principle approvals will be issued to suitable applicants for
setting up of Small Finance Banks/ Payments
Banks while the regulatory framework for them will
be formulated. On the future of local area banks
(LABs), a consultation process will be initiated
while draft guidelines for on tap licensing of
universal banks will be framed.
VI.34 Implementation of certain major
recommendations of the Nayak Committee
regarding governance reforms in PSBs, including
remuneration and professionalisation of the
boards will be taken forward. For more effective
monetary transmission, banks will be encouraged
to move in a time-bound manner to a marginal
cost of funds-based determination of their base
rates. It is further proposed to examine the current
framework on presence of foreign banks in India in
line with emerging international developments as
well as the experience gained so far. To add
additional clarity, frequently asked questions
(FAQs) will be issued on various aspects of the
wholly owned subsidiary framework issued in
November 2013. Guidelines will also be framed on
ownership in private sector banks which will
include raising the ceiling on voting rights from 10
to 15 per cent.
Cooperative Banks: Department of Cooperative Bank Regulation (DCBR)
VI.35 As UCBs play an important role in the
Indian fi nancial system, the Reserve Bank has
always endeavoured to strengthen the regulatory
and supervisory framework so that they emerge
fi nancially strong and have sound governance.
DCBR plays the lead role in framing regulations
for UCBs apart from State Cooperative Banks
(StCBs) and District Central Cooperative Banks
(DCCBs).
Agenda for 2014-15: Implementation Status
VI.36 The agenda of DCBR for 2014-15 focused on putting in place a revised supervisory action framework, pursuing legal/ regulatory amendments to facilitate conversion of UCBs into commercial banks and also to facilitate takeover of assets and liabilities of UCBs by commercial banks. Accordingly, a revised supervisory action framework was put in place in 2014-15. As regards legal amendments to facilitate conversion of UCBs into commercial banks, while the Companies Act, 2013 has enabling provisions there is need for
ANNUAL REPORT
90
corresponding provisions in the Multi State Cooperative Societies Act, which have been taken up with the government. With regard to commercial banks taking over assets and liabilities of UCBs, necessary tweaking of the regulations was accomplished during the year. This enables commercial banks to complete the effort on a fair price basis. The other important achievements during the year were:
Reserve Requirements
VI.37 Cash reserve ratio (CRR) requirements for non-scheduled UCBs and statutory liquidity ratio (SLR) requirements for all UCBs have been aligned with those of commercial banks following the Banking Laws (Amendment) Act, 2012 coming into force. Accordingly, UCBs were required to comply with the stipulated SLR by March 31, 2015. Balances with StCBs/ DCCBs and term deposits with PSBs are not eligible to be reckoned for SLR with effect from April 1, 2015. StCBs and DCCBs were also required to maintain SLR only in the form of approved securities from April 1, 2015. On a review, they have been allowed to shift their SLR term deposits to approved securities in phases by March 31, 2017.
Liquidity Adjustment Facility (LAF) Extended to Scheduled UCBs
VI.38 With a view to providing an additional avenue for liquidity management, LAF has been extended from November 28, 2014 to scheduled UCBs that are core banking solution (CBS)-enabled, have capital to risk-weighted assets ratio (CRAR) of at least 9 per cent and are fully compliant with the eligibility criteria prescribed for LAF.
Technology Adoption
VI.39 In order to integrate with the fi nancial system and to improve regulatory reporting, UCBs were advised to implement CBS by December 31, 2014. At end-June 2015, 1,040 of the 1,577 UCBs
had implemented CBS. Implementation of CBS has been prescribed as an additional criterion for being considered as fi nancially sound and well managed (FSWM) bank, a criterion applied for extending various regulatory approvals to UCBs, including opening new branches. In order to bring in transparency and objectivity, ‘regulatory comfort’, an important aspect considered for classifying a bank as FSWM, has been redefi ned to include compliance with standard regulatory provisions during the last two fi nancial years.
VI.40 FSWM UCBs are allowed to offer internet banking (view only) facilities to their customers provided they have migrated to the Internet Protocol Version 6 (IPv6). They can also open on-site/ off-site/ mobile automated teller machines (ATMs) without prior approval of the Reserve Bank provided they have a minimum net worth of `0.5 billion.
VI.41 Similarly, with a view to providing greater freedom to StCBs to expand their business and to provide technology-enabled services to their customers, StCBs can also open off-site/ mobile ATMs without prior approval of the Reserve Bank subject to certain prescribed criteria. These initiatives are aimed at bringing cooperative banks on par with commercial banks.
Supervisory Action Framework for UCBs
VI.42 As indicated in the last Annual Report, trigger points necessitating supervisory/ regulatory action have been revised for UCBs for early identifi cation of stress and its rectifi cation. UCBs are required to go for corrective action if the gross non-performing assets (NPAs) to advances ratio exceeds 10 per cent or they experience an incremental gross NPA ratio of 3 percentage points each during the last two consecutive years, whichever is earlier. Other triggers for corrective actions include regulatory capital falling below 9 per cent, incurring losses for two consecutive years and the credit deposit ratio exceeding 70 per cent.
REGULATION, SUPERVISION AND FINANCIAL STABILITY
91
VI.43 UCBs have been advised to constitute special committee of the board for monitoring and following up cases of frauds involving amounts of `10 million and above exclusively. The Audit Committee of Board (ACB) will continue to monitor all the cases of frauds, in general. UCBs have also been advised to become members of all the four credit information companies (CICs), and furnish historical data to them with a view to enhancing accuracy of the credit information.
Agenda for 2015-16
VI.44 A High Powered Committee for UCBs (Chairman: Shri R Gandhi) constituted, inter alia, to examine and recommend an appropriate set of businesses, size, conversion and licensing terms for UCBs has since submitted its report. The recommendations of the committee will be considered for implementation during the year. The Reserve Bank will also initiate measures to improve the quality of statutory audits in UCBs during the year. The process of harmonisation of regulation of UCBs and Rural Cooperative Banks will be continued.
NBFCs: Department of Non-Banking Regulation (DNBR)
VI.45 The regulation of the NBFC sector is guided by the need to foster additional credit delivery channels while preserving fi nancial stability. DNBR which was carved out of the erstwhile Department of Non-Banking Supervision (DNBS) is the nodal department for regulation of NBFCs, including stand-alone primary dealers (PDs). Keeping in view the role of shadow banking activities in intensifying the global fi nancial crisis as also the rising role of NBFCs domestically, the Reserve Bank’s focus during 2014-15 was on addressing gaps in regulation of NBFCs and harmonising regulations to enable delivery of innovation and last mile connectivity in credit. Further, in the light of signifi cant progress made
by NBFC-MFIs following the crisis in then Andhra Pradesh in 2008-09, a comprehensive review of their regulation was also completed during the year.
Agenda for 2014-15: Implementation Status
Review of the Regulatory Framework for NBFCs
VI.46 The NBFC sector has evolved considerably in terms of its size, operations, technological sophistication and entry into newer areas of fi nancial services and products. Accordingly, the entire regulatory framework for the sector was reviewed with a view to transitioning, over time, to an activity-based regulation of NBFCs while ensuring that NBFCs having lower risk profi les will be lightly regulated (Box VI.3).
Aligning NBFC Regulation
VI.47 Aligning regulation of the non-banking fi nancial sector with that of the banking sector not only fosters competition but also helps lower regulatory arbitrage and contain a possible build-up of systemic risks outside the banking system. Accordingly, a number of regulatory initiatives were undertaken covering lending by NBFCs against shares, restructuring of advances, structuring of long term project loans to infrastructure and core industries, levy of foreclosure charges and private placement of non-convertible debentures.
Shadow Banking Implementation Group (SBIG)
VI.48 In line with the Financial Stability Board’s (FSB) approach to shadow banking activities, a preliminary inter-regulatory study was conducted to identify the nature of non-bank credit intermediation in India. Accordingly, a SBIG has been formed to assess the level of regulatory compliance vis-a-vis FSB guidelines and recommend possible approaches for implementation of reforms. SBIG is expected to submit its report shortly.
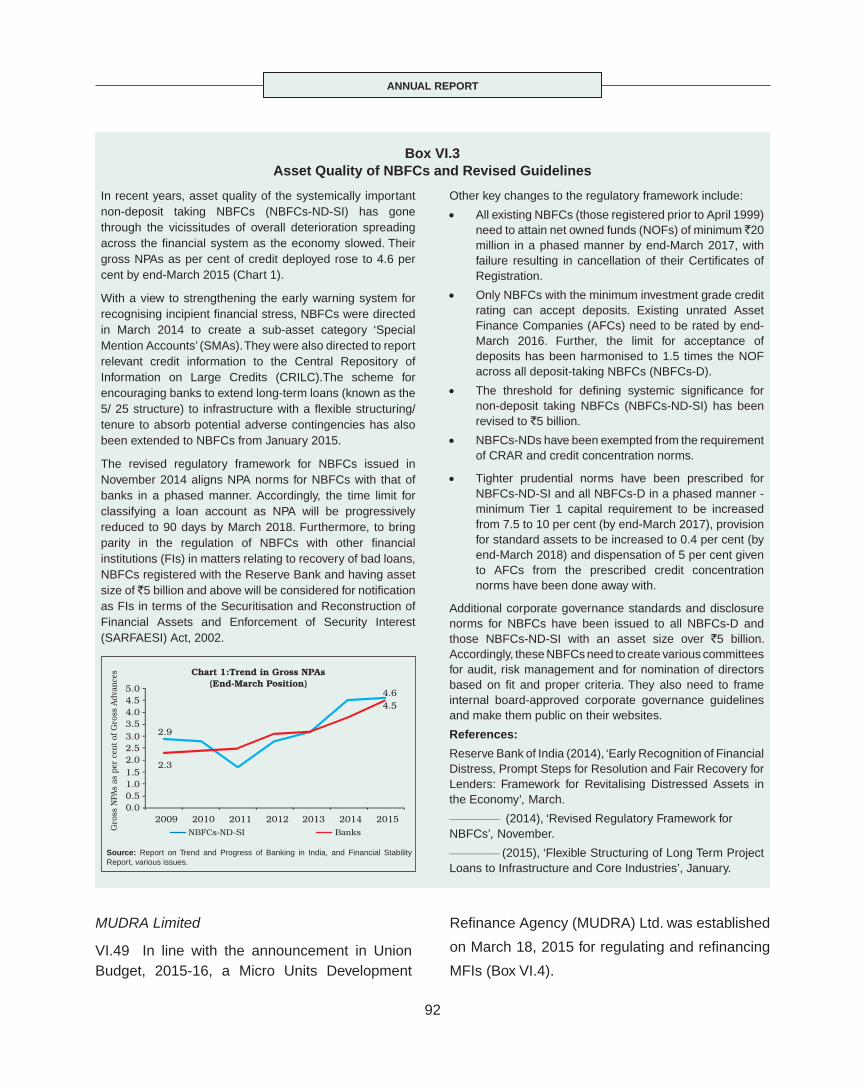
ANNUAL REPORT
92
Box VI.3Asset Quality of NBFCs and Revised Guidelines
In recent years, asset quality of the systemically important non-deposit taking NBFCs (NBFCs-ND-SI) has gone through the vicissitudes of overall deterioration spreading across the fi nancial system as the economy slowed. Their gross NPAs as per cent of credit deployed rose to 4.6 per cent by end-March 2015 (Chart 1).
With a view to strengthening the early warning system for recognising incipient fi nancial stress, NBFCs were directed in March 2014 to create a sub-asset category ‘Special Mention Accounts’ (SMAs). They were also directed to report relevant credit information to the Central Repository of Information on Large Credits (CRILC).The scheme for encouraging banks to extend long-term loans (known as the 5/ 25 structure) to infrastructure with a fl exible structuring/ tenure to absorb potential adverse contingencies has also been extended to NBFCs from January 2015.
The revised regulatory framework for NBFCs issued in November 2014 aligns NPA norms for NBFCs with that of banks in a phased manner. Accordingly, the time limit for classifying a loan account as NPA will be progressively reduced to 90 days by March 2018. Furthermore, to bring parity in the regulation of NBFCs with other fi nancial institutions (FIs) in matters relating to recovery of bad loans, NBFCs registered with the Reserve Bank and having asset size of `5 billion and above will be considered for notifi cation as FIs in terms of the Securitisation and Reconstruction of Financial Assets and Enforcement of Security Interest (SARFAESI) Act, 2002.
Other key changes to the regulatory framework include:
All existing NBFCs (those registered prior to April 1999) need to attain net owned funds (NOFs) of minimum ̀ 20 million in a phased manner by end-March 2017, with failure resulting in cancellation of their Certifi cates of Registration.
Only NBFCs with the minimum investment grade credit rating can accept deposits. Existing unrated Asset Finance Companies (AFCs) need to be rated by end-March 2016. Further, the limit for acceptance of deposits has been harmonised to 1.5 times the NOF across all deposit-taking NBFCs (NBFCs-D).
The threshold for defi ning systemic signifi cance for non-deposit taking NBFCs (NBFCs-ND-SI) has been revised to `5 billion.
NBFCs-NDs have been exempted from the requirement of CRAR and credit concentration norms.
Tighter prudential norms have been prescribed for NBFCs-ND-SI and all NBFCs-D in a phased manner - minimum Tier 1 capital requirement to be increased from 7.5 to 10 per cent (by end-March 2017), provision for standard assets to be increased to 0.4 per cent (by end-March 2018) and dispensation of 5 per cent given to AFCs from the prescribed credit concentration norms have been done away with.
Additional corporate governance standards and disclosure norms for NBFCs have been issued to all NBFCs-D and those NBFCs-ND-SI with an asset size over `5 billion. Accordingly, these NBFCs need to create various committees for audit, risk management and for nomination of directors based on fi t and proper criteria. They also need to frame internal board-approved corporate governance guidelines and make them public on their websites.
References:
Reserve Bank of India (2014), ‘Early Recognition of Financial Distress, Prompt Steps for Resolution and Fair Recovery for Lenders: Framework for Revitalising Distressed Assets in the Economy’, March._____________ (2014), ‘Revised Regulatory Framework for NBFCs’, November._____________ (2015), ‘Flexible Structuring of Long Term Project Loans to Infrastructure and Core Industries’, January.
Refi nance Agency (MUDRA) Ltd. was established
on March 18, 2015 for regulating and refi nancing
MFIs (Box VI.4).
MUDRA Limited
VI.49 In line with the announcement in Union Budget, 2015-16, a Micro Units Development
Source: Report on Trend and Progress of Banking in India, and Financial Stability Report, various issues.
REGULATION, SUPERVISION AND FINANCIAL STABILITY
93
Agenda for 2015-16
VI.50 The process of regulatory convergence between banks and non-banks will be taken forward in 2015-16. Further, activity based regulation is envisaged for the sector, thereby doing away with multiple categories of NBFCs. As a fi rst step, NBFCs are being progressively classifi ed into two broad heads - core investment companies and non - core investment companies. In addition, government owned NBFCs are being brought in within the regulatory ambit of the Reserve Bank.
SUPERVISION OF FINANCIAL INTERMEDIARIES
Commercial Banks: Department of Banking Supervision (DBS)
VI.51 DBS is entrusted with the supervisory responsibility of commercial banks, and aims at designing and implementing policies and strategies for supervision to develop a safe and effi cient banking system. In this endeavour, managerial practices in banks and All India Financial Institutions (AIFIs) that strengthen their corporate governance and internal controls are also encouraged. DBS also functions as the secretariat to the Inter Regulatory Forum set up under the aegis of the sub-committee of FSDC for
oversight of identifi ed fi nancial conglomerates (FCs) in coordination with other domestic regulators.
Agenda for 2014-15: Implementation Status
Risk Based Supervision (RBS) and Capacity Building
VI.52 The Reserve Bank is moving progressively from a performance based CAMELS (capital adequacy, asset quality, management, earning, liquidity and system and control) framework to a forward looking RBS framework for early detection of risks, timely and appropriate supervisory interventions and more generally for improving the quality of supervisory processes in line with global best practices. Two more banks were brought under RBS in 2014-15, taking the total to 30 major banks. Six more banks have been migrated to RBS framework from 2015-16 assessment cycle.The RBS model was also optimised, fi ne-tuning data collection from commercial banks. The need for preparedness at the banks’ level, including a robust management information system for RBS was highlighted.
Oversight of Financial Conglomerates (FCs)
VI.53 The Reserve Bank, in coordination with other domestic regulators, concluded discussion
Box VI.4Micro Units Development Refi nance Agency (MUDRA) Ltd.
Union Budget, 2015-16 announced the establishment of MUDRA Ltd. that will be responsible for both regulating and refi nancing all micro-fi nance institutions (MFIs) which are in the business of lending to micro/ small business entities engaged in manufacturing, trading and service activities and also partner with state level/ regional level coordinators to provide fi nance to last mile fi nancers of small/ micro business enterprises. The government will allocate a sum of `200 billion to MUDRA from the shortfall in priority sector lending for creating a refi nance fund to provide refi nance to last mile fi nancers. Another `300 billion will be provided to MUDRA from the Budget to create a credit guarantee corpus for
guaranteeing loans provided to micro-enterprises.
Appropriate legislation is being drafted by the central government for setting up MUDRA. Pending legislative approval, MUDRA Ltd. was incorporated on March 18, 2015, under the Companies Act, 2013, as a wholly owned subsidiary of the Small Industries Development Bank of India (SIDBI) to carry out activities relating to development and fi nancing of small micro-enterprises, and was registered with the Reserve Bank as a non-deposit taking NBFC on April 6, 2015. SIDBI has been exempted for its proposed investment of `7.5 billion in MUDRA from the cross-holding of capital among banks/ FIs.
ANNUAL REPORT
94
meetings with two bank-led FCs and participated in a discussion meeting of one insurance company-led FC organised by Insurance Regulatory Development Authority (IRDA), to review group level and inter-regulatory issues in the operations of these FCs.
Early Warning System (EWS) and Prompt Corrective Action (PCA)
VI.54 A framework on EWS to track deviation of critical fi nancial indicators triggering granular investigations has since been fi nalised and its details are being worked out. Alongside, the existing PCA framework for banks, fi rst introduced in 2002 is being revamped. This will subsequently be extended to FCs in coordination with other domestic regulators.
Global Supervisory Cooperation
VI.55 As part of cross-border supervisory cooperation and exchange of information, the Reserve Bank signed MoUs with six overseas banking supervisory authorities in 2014-15 - Hong Kong Monetary Authority; Central Bank of Kenya; Banco Central do Brasil; Bank of Uganda; Central Bank of Seychelles and Maldives Monetary Authority. A statement of cooperation with three US fi nancial regulators, viz., Board of Governors of the Federal Reserve System, Offi ce of the Comptroller of Currency and Federal Deposits Insurance Corporation has also been established. Till date, the Reserve Bank has executed 26 MoUs, one letter for supervisory cooperation and one statement of cooperation with overseas supervisors/ regulators.
VI.56 In line with the BCBS principles on cross-border consolidated supervision, the Reserve Bank is instituting supervisory colleges for Indian banks with considerable overseas presence. Supervisory colleges have been set up for State Bank of India, ICICI Bank Ltd., Bank of Baroda,
Bank of India, Punjab National Bank and Axis Bank Ltd.
Agenda for 2015-16
VI.57 Going forward, all small foreign banks operating in India are set to be brought into RBS. While a new format is being devised for inspection of the AIFIs - National Bank for Agriculture and Rural Development (NABARD), SIDBI, Export-Import (EXIM) Bank of India and the National Housing Bank (NHB), the revised format for CRILC reporting, including improved analytics is expected to be rolled out soon. In coordination with the IRDA, it is proposed to collect CRILC data from insurance companies as well.
VI.58 All Off-site Monitoring and Surveillance System (OSMOS) returns are planned to migrate to an eXtensible Business Reporting Language (XBRL)/ data warehouse environment towards developing a single information system for supervisory purposes. A new framework for fraud detection, reporting and monitoring has been rolled out on May 7, 2015. Further, a central fraud registry for use by banks is also under preparation. Though disparate systems used by the regulated entities hinder the process of automated data fl ow, the Reserve Bank will continue to encourage banks to switch over to entirely automated modes of data submission.
VI.59 Capacity building, with particular focus on RBS processes, system audit and information technology vulnerability/ penetration testing, is planned to be rolled out in 2015-16. The EWS as well as the revamped PCA framework for banks are likely to be fi nalised in 2015-16. Work relating to developing a PCA framework for FCs is expected to be initiated in coordination with other domestic regulators. The Reserve Bank is also exploring ways, including appropriate penal measures towards improving the compliance culture amongst regulated entities.

REGULATION, SUPERVISION AND FINANCIAL STABILITY
95
Cooperative Banks: Department of Cooperative Bank Supervision (DCBS)
VI.60 DCBS was carved out of the erstwhile Urban Banks Department (UBD) and it is primarily focused on ensuring the fi nancial soundness of individual UCBs as well as the sector as a whole.
Agenda for 2014-15: Implementation Status
VI.61 During the year, 968 UCBs, comprising all scheduled UCBs, C and D rated non-scheduled UCBs, and A and B rated non-scheduled UCBs due for inspection, were subjected to on-site inspections and appropriate supervisory action. While the licences of nine UCBs were cancelled, two UCBs were merged with other UCBs and ‘All Inclusive Directions’ were imposed on seven UCBs. All the 1,589 UCBs were supervised through off-site surveillance system. Towards developing a single point platform for data collection, processing and dissemination, 13 returns for UCBs have been migrated to the XBRL-based reporting system from the existing off-site surveillance reporting system. Training programmes to improve professionalism and governance in UCBs were also organised by the Reserve Bank.
Agenda for 2015-16
VI.62 While ensuring effective supervision of UCBs, further reduction in the number of UCBs with negative net worth has been envisaged for 2015-16. The migration of all the returns to the XBRL-based reporting platform will be completed in the coming year. The initiatives for capacity building in the UCB sector will be carried forward in the coming year too.
NBFCs: Department of Non-Banking Supervision (DNBS)
VI.63 This department is the supervisory wing of NBFCs and it aims at establishing an enabling environment for a healthy and sound NBFC sector while protecting the interests of depositors,
customers and other stakeholders as also safeguarding the country’s fi nancial system from contagion risks out of this sector. The department also endeavours to increase public awareness on the legal/ regulatory framework for entities engaged in various types of fi nancial activities.
Agenda for 2014-15: Implementation Status
VI.64 Deposit taking and systemically important’ non-deposit taking NBFCs continued to be the focus of on-site inspections. During 2014-15, 72 deposit taking companies and 182 non-deposit taking companies were inspected. To deal with delinquent and unauthorised entities, SLCCs were reconstituted in May 2014 with the Chief Secretary to the State Government as the Chairman and the Reserve Bank as the secretariat to facilitate regular sharing of market intelligence (MI) and taking coordinated timely action. The Reserve Bank also hosted two conferences of Chief Secretaries/ Administrators of the states/ union territories (UTs) during the year to deliberate on issues concerning fund mobilisations by unauthorised entities. MI cells were also created across 16 regional offi ces of the Reserve Bank.
Securitisation/ Asset Reconstruction
VI.65 Asset Reconstruction Companies (ARCs) have been steadily increasing their presence in the debt recovery process (Table VI.1). At the end of March 2015, there were 15 securitisation companies (SCs)/ reconstruction companies (RCs) registered with the Reserve Bank. At end-March 2015, the book value of assets acquired by the ARCs stood at around `508 billion. While the ARCs are already under off-site surveillance, they will be supervised through on-site inspections in the coming year in view of their increasing importance.
Agenda for 2015-16
VI.66 Small NBFCs which have so far been exempted from regulatory returns will be covered
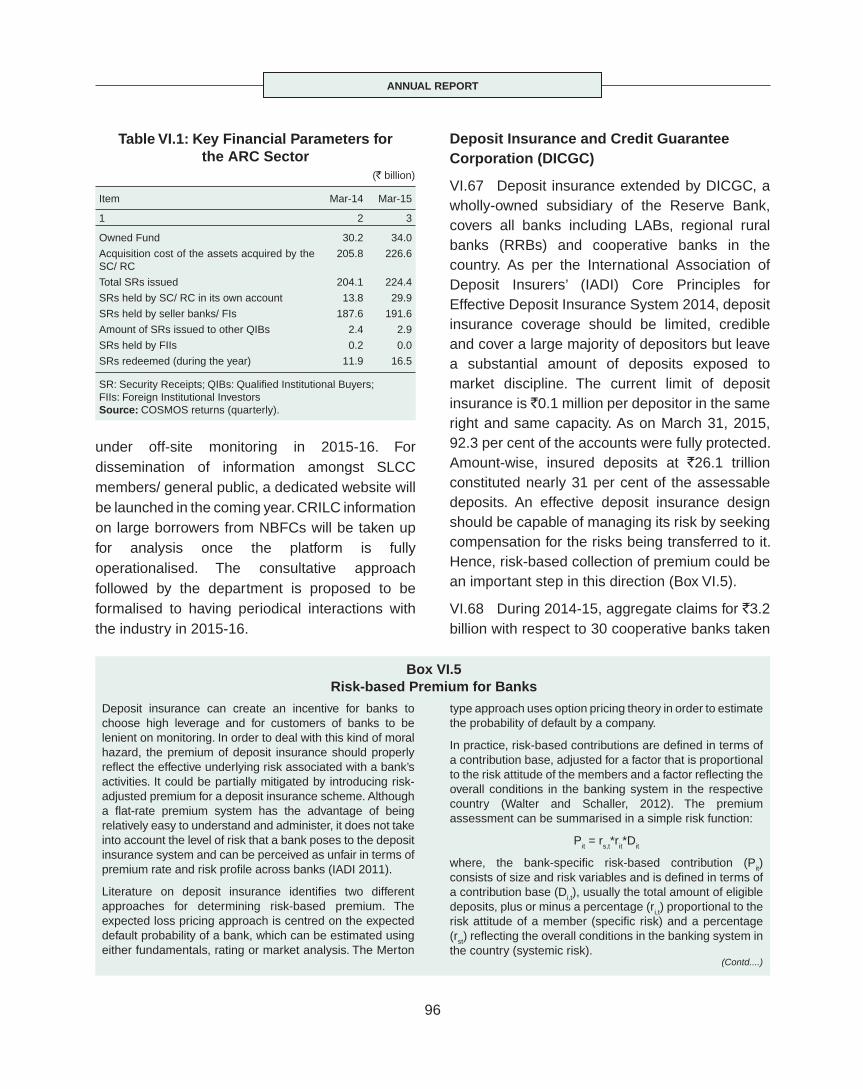
ANNUAL REPORT
96
under off-site monitoring in 2015-16. For dissemination of information amongst SLCC members/ general public, a dedicated website will be launched in the coming year. CRILC information on large borrowers from NBFCs will be taken up for analysis once the platform is fully operationalised. The consultative approach followed by the department is proposed to be formalised to having periodical interactions with the industry in 2015-16.
Deposit Insurance and Credit Guarantee Corporation (DICGC)
VI.67 Deposit insurance extended by DICGC, a wholly-owned subsidiary of the Reserve Bank, covers all banks including LABs, regional rural banks (RRBs) and cooperative banks in the country. As per the International Association of Deposit Insurers’ (IADI) Core Principles for Effective Deposit Insurance System 2014, deposit insurance coverage should be limited, credible and cover a large majority of depositors but leave a substantial amount of deposits exposed to market discipline. The current limit of deposit insurance is `0.1 million per depositor in the same right and same capacity. As on March 31, 2015, 92.3 per cent of the accounts were fully protected. Amount-wise, insured deposits at `26.1 trillion constituted nearly 31 per cent of the assessable deposits. An effective deposit insurance design should be capable of managing its risk by seeking compensation for the risks being transferred to it. Hence, risk-based collection of premium could be an important step in this direction (Box VI.5).
VI.68 During 2014-15, aggregate claims for `3.2 billion with respect to 30 cooperative banks taken
Table VI.1: Key Financial Parameters for the ARC Sector
(` billion)
Item Mar-14 Mar-15
1 2 3
Owned Fund 30.2 34.0
Acquisition cost of the assets acquired by the SC/ RC
205.8 226.6
Total SRs issued 204.1 224.4
SRs held by SC/ RC in its own account 13.8 29.9
SRs held by seller banks/ FIs 187.6 191.6
Amount of SRs issued to other QIBs 2.4 2.9
SRs held by FIIs 0.2 0.0
SRs redeemed (during the year) 11.9 16.5
SR: Security Receipts; QIBs: Qualifi ed Institutional Buyers; FIIs: Foreign Institutional InvestorsSource: COSMOS returns (quarterly).
Box VI.5Risk-based Premium for Banks
Deposit insurance can create an incentive for banks to choose high leverage and for customers of banks to be lenient on monitoring. In order to deal with this kind of moral hazard, the premium of deposit insurance should properly refl ect the effective underlying risk associated with a bank’s activities. It could be partially mitigated by introducing risk-adjusted premium for a deposit insurance scheme. Although a fl at-rate premium system has the advantage of being relatively easy to understand and administer, it does not take into account the level of risk that a bank poses to the deposit insurance system and can be perceived as unfair in terms of premium rate and risk profi le across banks (IADI 2011).
Literature on deposit insurance identifi es two different approaches for determining risk-based premium. The expected loss pricing approach is centred on the expected default probability of a bank, which can be estimated using either fundamentals, rating or market analysis. The Merton
type approach uses option pricing theory in order to estimate the probability of default by a company.
In practice, risk-based contributions are defi ned in terms of a contribution base, adjusted for a factor that is proportional to the risk attitude of the members and a factor refl ecting the overall conditions in the banking system in the respective country (Walter and Schaller, 2012). The premium assessment can be summarised in a simple risk function:
Pit = rs,t*rit*Dit
where, the bank-specifi c risk-based contribution (Pit) consists of size and risk variables and is defi ned in terms of a contribution base (Di,t), usually the total amount of eligible deposits, plus or minus a percentage (ri,t) proportional to the risk attitude of a member (specifi c risk) and a percentage (rst) refl ecting the overall conditions in the banking system in the country (systemic risk).
(Contd....)

REGULATION, SUPERVISION AND FINANCIAL STABILITY
97
The practice in the European Union (EU) suggests that key fi nancial ratios currently applied in assessment of a member institution’s risk across member states are quite heterogeneous and the variables taken into account to defi ne them are not identical. The 2014 EU Directive on Deposit Insurance Schemes gives only broad guidance for a risk measure but leaves the fi ne details to the wisdom of member states. In the US, new rules for risk-based assessment were issued in November 2006 and signifi cant refi nements were made to risk-related premium pursuant to fi nancial reform legislation enacted in 2010. For small banks, supervisory CAMELS ratings are combined with fi nancial ratios to determine risk-based assessment rates against deposits. For large banks, in 2011, the US Federal Deposit Insurance Corporation (FDIC) adopted a risk differentiation scheme that combines CAMELS rating and forward looking fi nancial measures of risk.
In India, there have been periodic recommendations for the application of risk-based premium for banks. The Narasimham Committee Report on Banking Sector Reforms (1998), while focusing on structural issues recommended introduction of a risk-based premium system in lieu of the fl at-rate premium system. This view was echoed by the Reserve Bank’s Capoor Committee on Reforms in Deposit Insurance in India (1999). The Committee on Credit Risk Model (2006) constituted by DICGC also recommended the introduction of risk-based premium, to begin with for SCBs and UCBs.
Notwithstanding the recommendations of various committees in the past, the implementation of risk-based premium could not be operationalised, inter alia, due to cooperative banks and RRBs (forming over 90 per cent of insured banks) being under restructuring until recently and lack of a robust supervisory rating for all insured banks, especially cooperative banks which serves as an important input for the rating model. However, there has been a persistent demand from stakeholders and public representatives for a hike in the deposit insurance cover from the current level of `0.1 million. A hike in cover without calibrating premium rates to the risk profi les of insured banks covered only exacerbates the risks of an inherent moral hazard. Keeping this in view, a Committee on Differential Premium for Banks (Chairman: Shri Jasbir Singh) was constituted in March 2015 to make recommendations for the introduction of risk-based premium in India.
References:
International Association of Deposit Insurers (IADI) (2011), ‘General Guidance for Developing Differential Premium Systems’.
Walter and Schaller (2012), ‘An Alternative Way of Calculating Risk Based Premium’ in New Paradigms in Banking, Financial Markets and Regulation? ed Balling et al., SUERF.
European Commission (2008), ‘Risk-based Contributions in EU Deposit Guarantee Schemes: Current Practices’, Joint Research Centre.
into liquidation/ reconstruction/ amalgamation were settled as compared to `1.0 billion in the previous year. The size of the deposit insurance fund (DIF) stood at `504.5 billion as at end-March 2015, yielding a reserve ratio (DIF/ insured deposits) of 1.9 per cent.
National Housing Bank (NHB)
VI.69 NHB, a wholly owned subsidiary of the Reserve Bank, was set up on July 9, 1988, under the National Housing Bank Act, 1987, to operate as a principal agency to promote housing fi nance institutions both at local and regional levels and to provide fi nancial and other support incidental to such institutions.
VI.70 As the apex institution for housing fi nance, NHB registers, regulates and supervises housing fi nance companies (HFCs). As on June
30, 2015, there were 65 HFCs registered with NHB. NHB is focused on promoting innovative market based solutions for affordable housing fi nance to low income housing segments. NHB extends refi nance to HFC, scheduled commercial banks (SCBs) and cooperative sector institutions, against their housing loans. It also provides project lending to a range of borrowers in public and public-private partnerships, MFIs, state level housing boards and area development authorities for large scale integrated housing projects and slum redevelopment projects. The cumulative disbursements in 2014-15 stood around `218.5 billion of which 25.4 per cent (`55.4 billion) was made for rural housing loans under the Rural Housing Fund (RHF) and the Golden Jubilee Rural Housing Refi nance Scheme (GJRHRS).

ANNUAL REPORT
98
VI.71 The government has identifi ed NHB as one of the central nodal agencies to channelise subsidy to lending institutions and monitoring the progress of the component under the Credit Linked Subsidy Scheme (CLSS). CLSS will be implemented across the country in all 4,041 statutory towns (as per Census 2011) and is part of the Pradhan Mantri Awas Yojana - Housing for All (HFA) mission, which seeks to address the housing requirements of urban poor, including of slum dwellers. NHB has also been a nodal agency for government schemes, such as the Interest Subsidy Scheme for Housing the Urban Poor (ISHUP), 1 per cent Interest Subvention scheme and the Solar Capital Subsidy scheme.
VI.72 NHB also manages the Credit Risk Guarantee Fund Trust for low income housing set up by the Government of India to ensure better fl ow of institutional credit for housing in urban areas. NHB launched RESIDEX in July 2007 for tracking residential property prices across 26 cities in India on a quarterly basis. The central government enhanced allocations for NHB from `40 billion to `80 billion in 2014-15 to expand and support rural housing in the country.
CONSUMER EDUCATION AND PROTECTION
Consumer Education and Protection Department (CEPD)
VI.73 CEPD focuses on pursuing public interest,
providing a level playing fi eld between suppliers
and consumers of fi nancial services by reducing
the imbalances emanating from information
asymmetries, limited product choices, inadequate
disclosures, etc. Consumer protection is a key to
promoting fi nancial inclusion.
Agenda for 2014-15: Implementation Status
Charter of Customer Rights
VI.74 As a structured measure towards protection
of bank customers and setting standards of
customer service, a Charter of Customer Rights
as broad, over-arching principles for protecting
bank customers was formulated by the Reserve
Bank in 2014-15 (Box VI.6). The Indian Banks’
Association (IBA) and Banking Codes and
Standards Board of India (BCSBI) have since
jointly formulated a model customer rights policy/
Box VI.6Charter of Customer Rights
The Charter of Customer Rights released on December 3, 2014, enshrines broad, over-arching principles for protection of bank customers and enunciates fi ve basic rights for bank cus tomers as:
(i) Right to Fair Treatment: Both the customer and the fi nancial services provider have a right to be treated with courtesy. The customer should not be unfairly discriminated against on grounds such as gender, age, religion, caste and physical ability when offering and delivering fi nancial products.
(ii) Right to Transparency, Fair and Honest Dealing: The fi nancial services provider should make every effort to ensure that the contracts or agreements it frames are transparent, easily understood and well communicated to the common person. The product’s price, associated risks, customer’s responsibilities and the terms and conditions that govern its use over the product’s life-
cycle, should be clearly disclosed. The customer should not be subject to unfair business or marketing practices, coercive contractual terms or misleading representations. Over the course of their relationship, the fi nancial services provider cannot threaten the customer with physical harm, exert undue infl uence or engage in blatant harassment.
(iii) Right to Suitability: The products offered should be appropriate to the needs of the customer and based on an assessment of the customer’s fi nancial circumstances and understanding.
(iv) Right to Privacy: Customers’ personal information should be kept confi dential unless they have offered specifi c consent to the fi nancial services provider or such information is required to be provided under the law or it is provided for a mandated business purpose
(Contd....)
REGULATION, SUPERVISION AND FINANCIAL STABILITY
99
code based on the Charter of Customer Rights. Banks were advised to formulate board approved customer rights policies by July 31, 2015 incorporating the Charter of Customer Rights, and periodically review its implementation internally.
Internal Ombudsman in Banks
VI.75 For strengthening the grievance redressal mechanism available to bank customers, all PSBs, select private sector and foreign banks were advised to appoint Chief Customer Service Offi cers as Internal Ombudsman in banks who should examine complaints, which remained unresolved/ partially resolved by the internal grievance redressal mechanism of the bank.
Ascertaining Field Level Feedback and Enhancing Awareness
VI.76 For initiating appropriate corrective action, incognito visits of select bank branches were
(for example, to credit information companies). The customer should be informed upfront about likely mandated business purposes. Customers have the right to protection from all kinds of communications, electronic or otherwise, which infringe upon their privacy.
(v) Right to Grievance Redress and Compensation: The customer has a right to hold the fi nancial services provider accountable for the products offered and to have a clear and easy way to have any valid grievances redressed. The provider should also facilitate the redress of grievances stemming from the sale of third
party products. The fi nancial services provider must communicate its compensation policy for mistakes, lapses in conduct, as well as non-performance or delays in performance, whether caused by the provider or otherwise. The policy must lay out the rights and duties of the customer when such events occur.
These rights aim to protect the customer against unfair discrimination, unfair business or marketing practices, coercive contractual terms or misleading representations and aim to promote appropriate need warranted fi nancial products with a better understanding of the various risks and charges involved therein.
undertaken to ascertain fi eld level feedback on complaints regarding mis-selling of third party products by banks like insurance and mutual funds. The feedback received was forwarded to all stakeholders. Further, in view of the large number of complaints on fi ctitious offers of money, public awareness campaigns about such fi ctitious offers, including the availability of the Banking Ombudsman (BO) scheme were conducted, particularly in rural and semi-urban areas.
Agenda for 2015-16
VI.77 The Reserve Bank will focus on full-fl edged operationalisation of the Charter of Customer Rights in banks. The BO scheme is also being taken up for a complete review in 2015-16. Focused fi eld visits/ study on mis-selling by banks in semi-urban areas and non-functioning/ mal-functioning ATMs across various parts of the country have also been planned.
ANNUAL REPORT
100
PUBLIC DEBT MANAGEMENTVII
The Reserve Bank successfully completed the borrowing programme of the Government of India and the state governments during 2014-15 despite several challenges, such as scaling up of the size of borrowing and elevated yields in the first half of the year. It continued the strategy of elongating the maturity, consolidating the debt portfolio and imparting more liquidity to the secondary market. In pursuance of the objective of minimising the rollover risk, the maturity profile of the debt portfolio was elongated during the year with a resultant marginal increase in weighted cost. Leveraging on increased appetite for longer maturity debt, the Reserve Bank announced issuance of 40-year security during 2015-16 to extend the yield curve beyond 30 years. A medium term debt management strategy in line with sound international practices, regular quarterly calendar for state borrowings, review of the WMA scheme for the states, an efficient market infrastructure to aid a deeper and wider government debt market and expanding the investors’ base, are some of the important agenda items slated for 2015-16.
VII.1 In terms of Sections 20 and 21 of the
Reserve Bank of India Act, 1934, the Reserve Bank
has the obligation and right to transact Central
Government business in India and manage its
public debt. Similarly, the Reserve Bank is the debt
manager for all the 29 state governments and the
union territory of Puducherry as also a banker to
them except the Government of Sikkim in terms of
their agreement with the Reserve Bank under
Section 21A of the RBI Act, 1934. Further, the
Reserve Bank makes advances to the Central and
state governments to tide over temporary mismatch
in the cash fl ows. Such advances are termed as
‘ways and means advances’ (WMA), which are
repayable in each case not later than three months
from the date of making the advances in terms of
Section 17 (5) of the RBI Act.
VII.2 The Reserve Bank has set for itself a
medium-term agenda of transforming the fi nancial
sector into a stronger, deeper, more effi cient and
inclusive system. Within this broader agenda, the
approach for debt management as entrusted to the
Internal Debt Management Department (IDMD)
encompasses: a comprehensive debt management
strategy in alignment with sound international
practices, minimising the borrowing cost, extending maturities to cater to the requirements of diverse investors, consolidation of public debt and reduction in the rollover risk through active switch/buyback operations.
Agenda and Implementation Status in 2014-15
VII.3 In 2014-15, the debt management strategy aimed to:
i. conduct debt management operations in an orderly manner and successfully meet the market borrowing programmes in a smooth and non-disruptive manner while minimising the cost of borrowing;
ii. ensure reasonable distribution in issuances over the fi rst half and the second half with issuance of new bonds coupled with bonds of non-standard maturity to avoid concentration of redemptions in the fi rst half of the year;
iii. smoothen the maturity profi le of GoI securities to reduce redemption pressures in 2014-15 through buybacks/switches;
iv. ensure quicker and wider dissemination of auction related information to market participants and other stakeholders;

PUBLIC DEBT MANAGEMENT
101
v. promote liquidity in government securities (G-secs) through a scheme for market making by PDs in semi-liquid and illiquid G-secs; and
vi. improve effi ciency of cash management and ensure reasonable returns on the CSF/GRF (consolidated sinking fund/guarantee redemption fund) of the states.
DEBT MANAGEMENT OF THE CENTRAL GOVERNMENT
VII.4 The gross market borrowings of `5,920 billion (BE ̀ 6,000 billion) and net market borrowings of ̀ 4,532 billion, which funded 90.3 per cent of the gross fi scal defi cit (GFD), were successfully raised in 2014-15 (Table VII.1). With relatively comfortable liquidity and stable market conditions during 2014-15, there was lower devolvement of `53 billion on primary dealers (PDs) on three occasions as compared with 26 instances amounting to `175 billion in 2013-14.
VII.5 Debt management operations faced several challenges during 2014-15. First, the combined market borrowings of the Centre and the states increased over the level in the preceding year in both gross and net terms (that is, net of repayments) resulting in a sizeable scaling up of debt issuances in the primary market, particularly for the states. The Reserve Bank held auctions of government securities (including T-bills and SDLs or state development loans) on 118 days, leading to a total
of 548 issuances and 41 underwriting auctions. Second, elevated level of yields in the fi rst half of the year when the borrowing programme was front-loaded posed challenges for the cost of borrowing. Under these testing conditions, the effi cacy of debt management can be gauged from the modest 12 bps increase in the weighted average yield of dated securities issued by the Centre during the year to 8.51 per cent (Table VII.2) despite a lengthening of maturity. Third, the Reserve Bank continued debt consolidation through reissuances and eased redemption pressures through buybacks/switches during the year and also elongated the maturity profile of government debt, thereby mitigating rollover risks.
VII.6 Although yields on government dated securities gradually declined during the course of the year from relatively higher levels in the early months (Chart VII.1), the weighted average yield of dated securities issued during 2014-15 was somewhat higher than in the previous year. Higher issuances of long dated securities lengthened the average maturity of outstanding debt (Table VII.3).
VII.7 As part of the consolidation of Government debt, 95 per cent of the securities were reissued. Buybacks/switches were conducted to smoothen the maturity profi le of GoI securities and reduce redemption pressures. Buyback of short-term securities amounting to ̀ 188 billion from the market was completed through reverse auctions in
Table VII.1: Gross and Net Market Borrowings of the Central Government#
(` billion)
Item 2004-05 2012-13 2013-14 2014-15 2015-16*
1 2 3 4 5 6
Net Borrowings 460 4,674 4,686 4,532 1,757(4,564)
Gross Borrowings 803 5,580 5,636 5,920 2,670(6,000)
Note: 1. Figures in brackets are budget estimates. 2. Figures excluding buyback/ switches. #: Issuance through dated securities; * : upto August 14, 2015.

ANNUAL REPORT
102
September 2014 and switches of `88 billion were conducted in February 2015. A conversion operation of securities from the Reserve Bank’s portfolio amounting to `302 billion was conducted in March 2015. By these measures, the Reserve Bank ensured the elongation of maturity of the outstanding debt while containing the rollover risk for GoI.
VII.8 Commercial banks remained predominant
investors in dated government securities, holding
around 43 per cent at end-March 2015, followed
by insurance companies and provident funds at
around 21 and 8 per cent, respectively. The share
of the Reserve Bank’s holding declined to 14 per
cent from a high of 16 per cent in the previous two
years. The share of foreign portfolio investors
(FPIs), which have emerged as active market
players in the recent period, more than doubled to
3.7 per cent from a year ago.
VII.9 Net market borrowings of the Centre
through treasury bills and dated securities stood at
`4,779 billion in 2014-15, 6 per cent lower than
those in 2013-14. Yields on treasury bills also
softened at the shorter end in 2014-15 refl ecting
comfortable liquidity conditions. Continuing its
pursuit of the market development strategy, the
Reserve Bank ensured quicker and wider
dissemination of auction related information among
market participants and other stakeholders. The system of displaying primary auction results of treasury bills, SDLs and GoI dated securities in e-Kuber and NDS-OM along with publication of the
Table VII.2: Central Government’s Market Loans-A Profi le#
(yield in per cent / maturity in years)
Year Range of YTMs at Primary Issues Issued during the year Outstanding Stock (As at end-March)
under 5 years 5-10 years Over 10 years
Weighted average
yield
Tenor of securities
(range)
Weighted average maturity
Weighted average maturity
Weighted average coupon
1 2 3 4 5 6 7 8 9
2008-09 7.71-8.42 7.69-8.77 7.77-8.81 7.69 6-30 13.80 10.45 8.23
2009-10 6.09-7.25 6.07-7.77 6.85-8.43 7.23 5-15 11.16 9.82 7.89
2010-11 5.98-8.67 7.17-8.19 7.64-8.63 7.92 5-30 11.62 9.78 7.81
2011-12 8.21-8.49 7.80-10.01 8.25-9.28 8.52 5-30 12.66 9.60 7.88
2012-13 8.82-8.21 7.86-8.76 7.91-8.06 8.36 5-30 13.50 9.67 7.97
2013-14* 7.22-9.00 7.16-9.40 7.36-9.40 8.39 6-30 14.22 10.00 7.99
2014-15* - 7.66-9.28 7.65-9.42 8.51 6-30 14.67 10.23 8.08
#: Excludes issuances under market stabilisation scheme; YTM: Yield to maturity; *: Excluding infl ation linked bonds and buyback/switch in GoI securities.

PUBLIC DEBT MANAGEMENT
103
results on the Reserve Bank’s website has been implemented.
Cash Management
VII.10 The Government started the fi scal year with a cash build-up of `1,284 billion and the cash position remained comfortable until the third week of May 2014 (Chart VII.2). Following spending by
the Government, cash balance declined and the
Government intermittently availed WMA for 61 days
altogether vis-à-vis 42 days during the previous
year. It also issued cash management bills (CMBs) for `100 billion in November 2014.
VII.11 From December 16, 2014 onwards, the Government’s cash balance held with the Reserve Bank is being reckoned for auction through variable rate repo as part of the Reserve Bank’s revised liquidity management framework. The Government ended the fi scal year with a cash balance of ̀ 1,573 billion.
VII.12 WMA limits for the fi rst half (April-September) and the second half (October-March) of 2014-15 were fixed at `350 billion and `200 billion, respectively, for the Central Government. The WMA limit for the fi rst half of 2015-16 was raised to `450 billion.
DEBT MANAGEMENT OF STATE GOVERNMENTS
Market Borrowings
VII.13 The Reserve Bank entered into an agreement with the Government of Telangana for carrying out its cash and debt management operations effective June 2, 2014, under Section 21A of the Reserve Bank of India Act, 1934.With this, the Reserve Bank is now the debt manager for all the 29 states and for the union territory (UT) of Puducherry. All of them participated in market borrowing programme in 2014-15, with the net borrowing rising by 26 per cent (Table VII.4).
VII.14 Despite higher market borrowings, the weighted average yeild of state government securities issued during the year stood lower at
Table VII.3: Issuance of the Central Government Dated Securities - Maturity Pattern(Amount in ` billion)
Residual Maturity 2012-13 2013-14 2014-15
Amount raised
Percentage to total
Amount raised
Percentage to total
Amount raised
Percentage to total
1 2 3 4 5 6 7
Less than 5 years 470 8.42 110 1.95 - -
5 -9.99 years 1,910 34.23 2,305 40.91 2,350 39.69
10-14.99 years 1,730 31.00 1,340 23.78 1,510 25.51
15 -19.99 years 270 4.84 930 16.50 960 16.22
20 years & above 1,200 21.51 950 16.86 1,100 18.58
Total 5,580 100.00 5,635 100.00 5,920 100.00
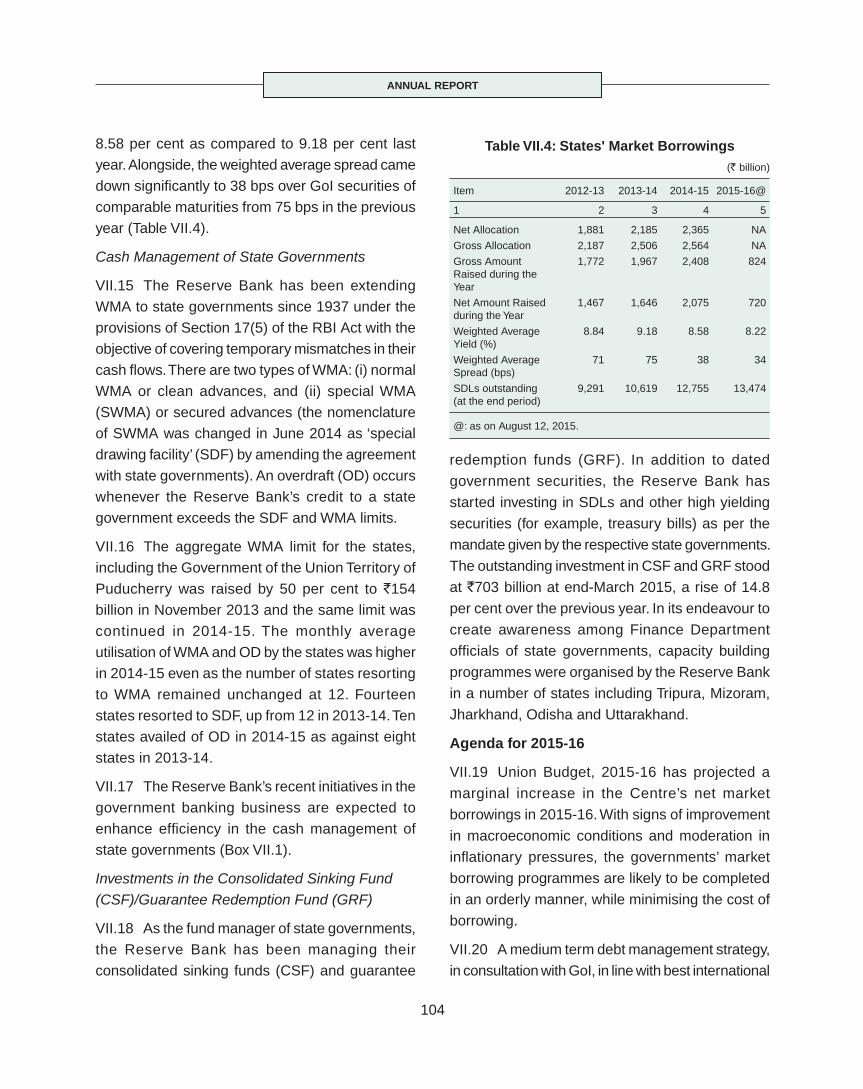
ANNUAL REPORT
104
8.58 per cent as compared to 9.18 per cent last year. Alongside, the weighted average spread came down signifi cantly to 38 bps over GoI securities of comparable maturities from 75 bps in the previous year (Table VII.4).
Cash Management of State Governments
VII.15 The Reserve Bank has been extending WMA to state governments since 1937 under the provisions of Section 17(5) of the RBI Act with the objective of covering temporary mismatches in their cash fl ows. There are two types of WMA: (i) normal WMA or clean advances, and (ii) special WMA (SWMA) or secured advances (the nomenclature of SWMA was changed in June 2014 as ‘special drawing facility’ (SDF) by amending the agreement with state governments). An overdraft (OD) occurs whenever the Reserve Bank’s credit to a state government exceeds the SDF and WMA limits.
VII.16 The aggregate WMA limit for the states, including the Government of the Union Territory of Puducherry was raised by 50 per cent to `154 billion in November 2013 and the same limit was continued in 2014-15. The monthly average utilisation of WMA and OD by the states was higher in 2014-15 even as the number of states resorting to WMA remained unchanged at 12. Fourteen states resorted to SDF, up from 12 in 2013-14. Ten states availed of OD in 2014-15 as against eight states in 2013-14.
VII.17 The Reserve Bank’s recent initiatives in the government banking business are expected to enhance effi ciency in the cash management of state governments (Box VII.1).
Investments in the Consolidated Sinking Fund (CSF)/Guarantee Redemption Fund (GRF)
VII.18 As the fund manager of state governments, the Reserve Bank has been managing their consolidated sinking funds (CSF) and guarantee
redemption funds (GRF). In addition to dated
government securities, the Reserve Bank has
started investing in SDLs and other high yielding
securities (for example, treasury bills) as per the
mandate given by the respective state governments.
The outstanding investment in CSF and GRF stood
at `703 billion at end-March 2015, a rise of 14.8
per cent over the previous year. In its endeavour to
create awareness among Finance Department
offi cials of state governments, capacity building
programmes were organised by the Reserve Bank
in a number of states including Tripura, Mizoram,
Jharkhand, Odisha and Uttarakhand.
Agenda for 2015-16
VII.19 Union Budget, 2015-16 has projected a
marginal increase in the Centre’s net market
borrowings in 2015-16. With signs of improvement
in macroeconomic conditions and moderation in
infl ationary pressures, the governments’ market
borrowing programmes are likely to be completed
in an orderly manner, while minimising the cost of
borrowing.
VII.20 A medium term debt management strategy,
in consultation with GoI, in line with best international
Table VII.4: States' Market Borrowings (` billion)
Item 2012-13 2013-14 2014-15 2015-16@
1 2 3 4 5
Net Allocation 1,881 2,185 2,365 NA
Gross Allocation 2,187 2,506 2,564 NA
Gross Amount Raised during the Year
1,772 1,967 2,408 824
Net Amount Raised during the Year
1,467 1,646 2,075 720
Weighted Average Yield (%)
8.84 9.18 8.58 8.22
Weighted Average Spread (bps)
71 75 38 34
SDLs outstanding (at the end period)
9,291 10,619 12,755 13,474
@: as on August 12, 2015.

PUBLIC DEBT MANAGEMENT
105
practices will be placed in the public domain during
2015-16. In order to manage GoI’s maturity profi le
and also to reduce the rollover risk, it is planned
that buybacks and switches will be part of the
regular calendar of issuance from the second half
of 2015-16. To cater to the demand from long term
investors like insurance companies and pension
funds, a 40-year security is proposed to be issued
Box VII.1New Initiatives in Government Banking
Internationally, arrangements for the government banking business vary across countries. For instance, it is performed by the central banks in France and Russia while in the UK and Australia it is performed by commercial banks. The payment processing is centralised in France and Russia but decentralised in South Africa. Larger countries, such as the US, China and India have adopted a mixed approach, depending on the nature and type of transactions (Chart 1).
As part of its initiatives to improve effi ciency in government banking services, the Reserve Bank constituted a Working Group to Bring in Uniformity and Standardisation in Procedures/Data Structure of e-Receipt/e-Transactions of State Governments. The group submitted its report in April 2014. Its recommendations focus on migrating to a broadly uniform model for receipts and payments for all the states and integration with e-Kuber, the core banking solution of the Reserve Bank. As discussed in the State Finance Secretaries Conference organised by the Reserve Bank in May 2015, it was decided to implement the recommendations of the report on a pan-India basis. Accordingly, a task force has been constituted for monitoring the implementation process. Till date, 15 states have started this process and are at various stages of implementation. Efforts are on to bring the remaining states on board.
E-receipt and e-payment functions have been developed in e-Kuber to provide enhanced operational effi ciency and facilitate better fund management of governments.The e-receipts system envisages revenue collection through agency banks, fl ow of information to the Reserve Bank and
fi nal transfer of funds to the respective state government’s accounts. The system is designed for faster processing without giving rise to any reconciliation issues. The agency banks participating in the revenue collection of a state are required to prepare details of daily receipts in a standardised ISO 20022 format fi le and upload it on the e-Kuber portal which is used by banks for their interface with the Reserve Bank. After processing the fi les, e-scrolls with all relevant information are transmitted electronically to the state governments in a straight-through-processing (STP) manner. The interface of e-Kuber with the public fi nance management system (PFMS) of the Central Government has been scaled up to serve all central ministries for effecting inter-government transactions on a STP basis.
For e-payments, wherever a state has a centralised treasury system, integration of its IT system with e-Kuber will be done and the details of payments to be effected by the government will be directly received, processed and transmitted to the National Electronic Funds Transfer (NEFT) system for effecting payments, with no manual intervention. Transaction-wise e-scrolls will be sent on the same day, duly indicating status of payments (whether successful, or returned). This will ensure that all payments are processed effi ciently and benefi ciaries receive the payments without delay.
With a view to maximising benefits from technological developments, a Working Group on Business Process Re-engineering with participation from government agencies, banks and the Reserve Bank has been set up. The group will examine the workfl ows, systems and processes for handling government business, related institutional infrastructure and reporting structures. The group is expected to submit its report by October 2015. With these initiatives, banking arrangements of the governments including their cash management are set to witness signifi cant effi ciencies in the years to come.
References:
Pessoa, M. and M. Williams (2012), ‘Government Cash Management: Relationship between the Treasury and the Central Government’, International Monetary Fund.
Pattanayak, S. and I. Fainboim (2011), ‘Treasury Single Account: An Essential Tool for Government Cash Management’, International Monetary Fund.
ANNUAL REPORT
106
during 2015-16, taking in view a relatively fl at yield curve.
VII.21 Market borrowings of state governments have been budgeted higher for 2015-16 than the previous year. To improve predictability of market borrowings, all the states will be encouraged to move over to a quarterly calendar of issuances with effect from 2015-16 and the fi rst of this calendar has been announced for the second quarter of 2015-16. The states have also been advised to actively engage with investors within their states to diversify the investor base.
VII.22 The report of the Advisory Committee on Ways and Means Advance to State Governments (Chairman: Sumit Bose) is expected to be fi nalised and will be taken up for implementation.
VII.23 The Reserve Bank will continue with the agenda of enabling easier and increased access to retail investors. As part of this, a web-based solution on the e-Kuber platform for participation of all mid-segment/retail investors having gilt accounts
is being implemented. To develop a more liquid government securities market, a scheme of market making in select semi-liquid securities by PDs will be implemented. The non-competitive bidding facility available to retail investors is currently applicable only to auctions of dated securities. It is proposed to allow the non-competitive bidding facility in treasury bills to individuals as well. The Reserve Bank in consultation with all stakeholders will enable seamless movement of securities from the subsidiary general ledger (SGL) form to demat form and vice versa to promote trading of G-secs on stock exchanges. The Reserve Bank will work to put in place a more predictable framework on the size and scope of investments in G-secs by foreign portfolio in vestors taking into account the risks and benefi ts associated with such fl ows into the debt market.
VII.24 The Reserve Bank will closely work with the Government of India in the preparatory arrangements for the establishment of the Public Debt Management Agency (PDMA).
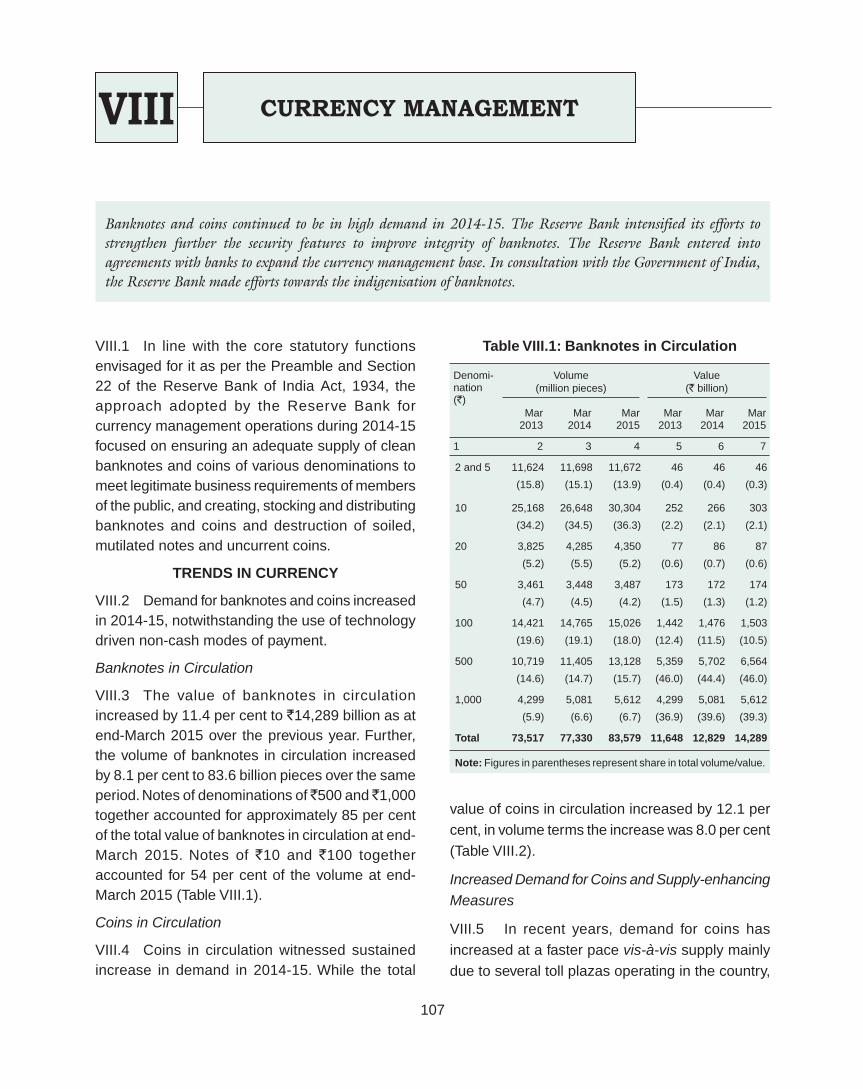
CURRENCY MANAGEMENT
107
CURRENCY MANAGEMENTVIII
VIII.1 In line with the core statutory functions envisaged for it as per the Preamble and Section 22 of the Reserve Bank of India Act, 1934, the approach adopted by the Reserve Bank for currency management operations during 2014-15 focused on ensuring an adequate supply of clean banknotes and coins of various denominations to meet legitimate business requirements of members of the public, and creating, stocking and distributing banknotes and coins and destruction of soiled, mutilated notes and uncurrent coins.
TRENDS IN CURRENCY
VIII.2 Demand for banknotes and coins increased in 2014-15, notwithstanding the use of technology driven non-cash modes of payment.
Banknotes in Circulation
VIII.3 The value of banknotes in circulation increased by 11.4 per cent to `14,289 billion as at end-March 2015 over the previous year. Further, the volume of banknotes in circulation increased by 8.1 per cent to 83.6 billion pieces over the same period. Notes of denominations of ̀ 500 and ̀ 1,000 together accounted for approximately 85 per cent of the total value of banknotes in circulation at end-March 2015. Notes of `10 and `100 together accounted for 54 per cent of the volume at end-March 2015 (Table VIII.1).
Coins in Circulation
VIII.4 Coins in circulation witnessed sustained increase in demand in 2014-15. While the total
value of coins in circulation increased by 12.1 per cent, in volume terms the increase was 8.0 per cent (Table VIII.2).
Increased Demand for Coins and Supply-enhancing Measures
VIII.5 In recent years, demand for coins has increased at a faster pace vis-à-vis supply mainly due to several toll plazas operating in the country,
Banknotes and coins continued to be in high demand in 2014-15. The Reserve Bank intensified its efforts to strengthen further the security features to improve integrity of banknotes. The Reserve Bank entered into agreements with banks to expand the currency management base. In consultation with the Government of India, the Reserve Bank made e fforts towards the indigenisation of banknotes.
Table VIII.1: Banknotes in Circulation
Denomi-nation (`)
Volume (million pieces)
Value (` billion)
Mar 2013
Mar 2014
Mar 2015
Mar 2013
Mar 2014
Mar 2015
1 2 3 4 5 6 7
2 and 5 11,624 11,698 11,672 46 46 46
(15.8) (15.1) (13.9) (0.4) (0.4) (0.3)
10 25,168 26,648 30,304 252 266 303
(34.2) (34.5) (36.3) (2.2) (2.1) (2.1)
20 3,825 4,285 4,350 77 86 87
(5.2) (5.5) (5.2) (0.6) (0.7) (0.6)
50 3,461 3,448 3,487 173 172 174
(4.7) (4.5) (4.2) (1.5) (1.3) (1.2)
100 14,421 14,765 15,026 1,442 1,476 1,503
(19.6) (19.1) (18.0) (12.4) (11.5) (10.5)
500 10,719 11,405 13,128 5,359 5,702 6,564
(14.6) (14.7) (15.7) (46.0) (44.4) (46.0)
1,000 4,299 5,081 5,612 4,299 5,081 5,612
(5.9) (6.6) (6.7) (36.9) (39.6) (39.3)
Total 73,517 77,330 83,579 11,648 12,829 14,289
Note: Figures in parentheses represent share in total volume/value.

ANNUAL REPORT
108
Table VIII.2: Coins in Circulation
Denomina-tion
Volume (million pieces)
Value ( ` billion)
Mar 2013
Mar 2014
Mar 2015
Mar 2013
Mar 2014
Mar 2015
1 2 3 4 5 6 7
Small Coin 14,788 14,788 14,788 7 7 7
(17.4) (16.1) (14.9) (4.6) (4.1) (3.6)
`1 35,884 38,424 41,627 36 38 42
(42.4) (41.9) (42.1) (23.5) (21.9) (21.7)
`2 22,113 24,823 27,038 44 50 54
(26.1) (27.1) (27.3) (28.8) (28.9) (27.8)
`5 10,675 11,577 12,761 53 58 64
(12.6) (12.7) (12.9) (34.6) (33.5) (33.0)
`10 1,267 2,017 2,750 13 20 27
(1.5) (2.2) (2.8) (8.5) (11.6) (13.9)
Total 84,727 91,629 98,964 153 173 194
Note: Figures in parentheses represent the percentage share in total.
structure of bus/auto/train/taxi fares, rising affl uence of rural and urban poor, especially in view of Government sponsored schemes like Mahatma Gandhi National Rural Employment Guarantee Scheme and increased use of fast-moving consumer goods (FMCG) in small sachets. Mismatch in indent and supply of coins during the past few years is given in Table VIII.3.
VIII.6 To meet the enhanced demand, the Reserve Bank has increased the indent with the Government of India mints and taken the following additional steps to further streamline distribution:
(i) Shopkeepers and other business establish-ments, tollgate agencies, etc., have been linked to the nearest currency chest for their requirements of coins;
(ii) Banks were advised to organise coin melas for issue of coins directly to members of the public;
(iii) Bulk users of coins, such as large retailers and toll plazas have been advised to increase the usage of point of sale (POS) terminals/cards/e-tokens in order to reduce their dependence on coins; and
(iv) Banks were being incentivised for establishing coin vending machines (CVMs) and machines which extend cash related services to the public.
VIII.7 The Reserve Bank has suggested to the Central Government to permit import of coins as a short term measure till the production capacity of the mints is augmented; consider allowing minting of coins by private parties as enabled under the Coinage Act, 2011; and increase the present production capacity of mints/ set up new mints as a medium term measure. The Reserve Bank is also working on ways to encourage recirculation of coins by members of the public.
CURRENCY MANAGEMENT INFRASTRUCTURE
VIII.8 Currency management infrastructure consists of a network of 19 issue offi ces, 4,132 currency chests (including sub-treasury offi ces and a currency chest of the Reserve Bank at Kochi) and 3,813 small coin depots of commercial, cooperative and regional rural banks spread across the country (Table VIII.4). The procedure for opening currency chests was simplifi ed during the year by introducing a single layer approval system instead of the multiple layers of approvals.
Lead Bank Scheme
VIII.9 The Lead Bank Scheme for currency management was introduced on a pilot basis in 2013 by identifying one district of each state and
Table VIII.3: Indent and Supply of coins(pieces in million)
Year Indent Supply
1 2 3
2012-13 9,554 6,878
2013-14 12,033 7,677
2014-15 13,840 7,907
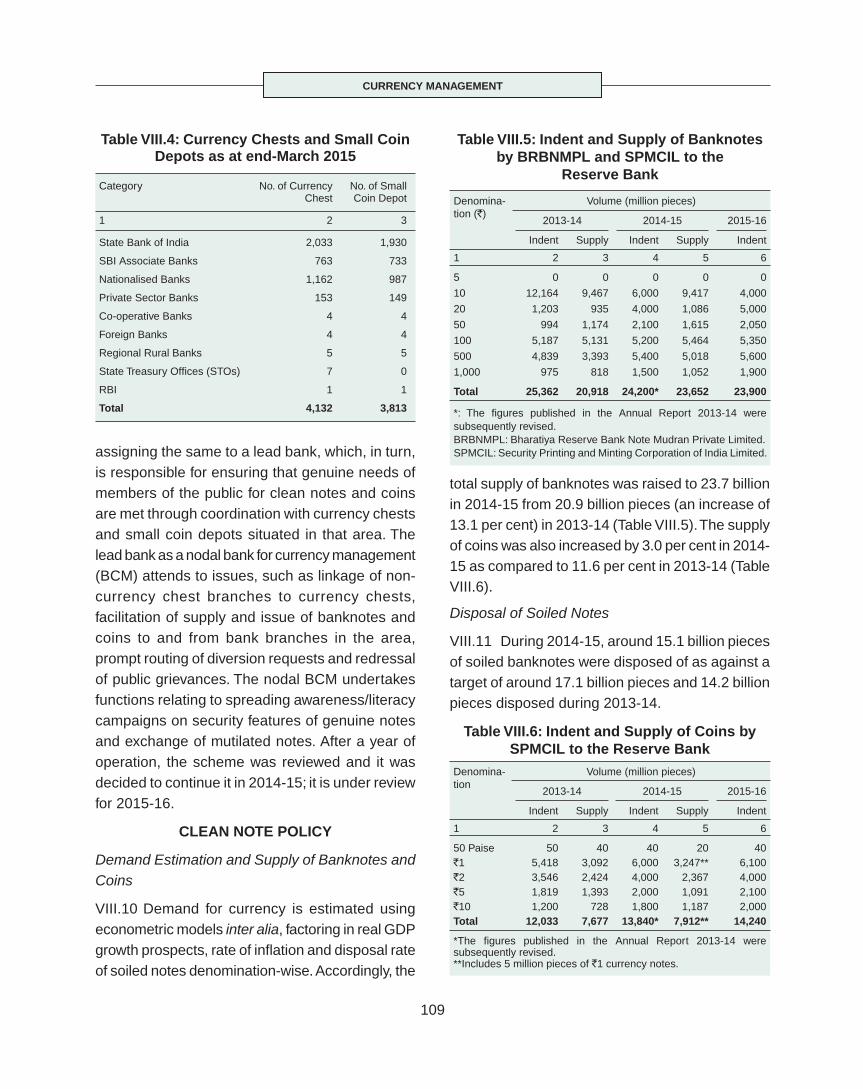
CURRENCY MANAGEMENT
109
Table VIII.6: Indent and Supply of Coins by SPMCIL to the Reserve Bank
Denomina-tion
Volume (million pieces)
2013-14 2014-15 2015-16
Indent Supply Indent Supply Indent
1 2 3 4 5 6
50 Paise 50 40 40 20 40`1 5,418 3,092 6,000 3,247** 6,100`2 3,546 2,424 4,000 2,367 4,000`5 1,819 1,393 2,000 1,091 2,100`10 1,200 728 1,800 1,187 2,000Total 12,033 7,677 13,840* 7,912** 14,240
*The fi gures published in the Annual Report 2013-14 were subsequently revised.**Includes 5 million pieces of `1 currency notes.
assigning the same to a lead bank, which, in turn, is responsible for ensuring that genuine needs of members of the public for clean notes and coins are met through coordination with currency chests and small coin depots situated in that area. The lead bank as a nodal bank for currency management (BCM) attends to issues, such as linkage of non-currency chest branches to currency chests, facilitation of supply and issue of banknotes and coins to and from bank branches in the area, prompt routing of diversion requests and redressal of public grievances. The nodal BCM undertakes functions relating to spreading awareness/literacy campaigns on security features of genuine notes and exchange of mutilated notes. After a year of operation, the scheme was reviewed and it was decided to continue it in 2014-15; it is under review for 2015-16.
CLEAN NOTE POLICY
Demand Estimation and Supply of Banknotes and Coins
VIII.10 Demand for currency is estimated using econometric models inter alia, factoring in real GDP growth prospects, rate of infl ation and disposal rate of soiled notes denomination-wise. Accordingly, the
total supply of banknotes was raised to 23.7 billion in 2014-15 from 20.9 billion pieces (an increase of 13.1 per cent) in 2013-14 (Table VIII.5). The supply of coins was also increased by 3.0 per cent in 2014-15 as compared to 11.6 per cent in 2013-14 (Table VIII.6).
Disposal of Soiled Notes
VIII.11 During 2014-15, around 15.1 billion pieces of soiled banknotes were disposed of as against a target of around 17.1 billion pieces and 14.2 billion pieces disposed during 2013-14.
Table VIII.5: Indent and Supply of Banknotes by BRBNMPL and SPMCIL to the
Reserve Bank
Denomina-tion (`)
Volume (million pieces)
2013-14 2014-15 2015-16
Indent Supply Indent Supply Indent
1 2 3 4 5 6
5 0 0 0 0 0
10 12,164 9,467 6,000 9,417 4,000
20 1,203 935 4,000 1,086 5,000
50 994 1,174 2,100 1,615 2,050
100 5,187 5,131 5,200 5,464 5,350
500 4,839 3,393 5,400 5,018 5,600
1,000 975 818 1,500 1,052 1,900
Total 25,362 20,918 24,200* 23,652 23,900
*: The fi gures published in the Annual Report 2013-14 were subsequently revised.BRBNMPL: Bharatiya Reserve Bank Note Mudran Private Limited.SPMCIL: Security Printing and Minting Corporation of India Limited.
Table VIII.4: Currency Chests and Small Coin Depots as at end-March 2015
Category No. of Currency Chest
No. of Small Coin Depot
1 2 3
State Bank of India 2,033 1,930
SBI Associate Banks 763 733
Nationalised Banks 1,162 987
Private Sector Banks 153 149
Co-operative Banks 4 4
Foreign Banks 4 4
Regional Rural Banks 5 5
State Treasury Offi ces (STOs) 7 0
RBI 1 1
Total 4,132 3,813
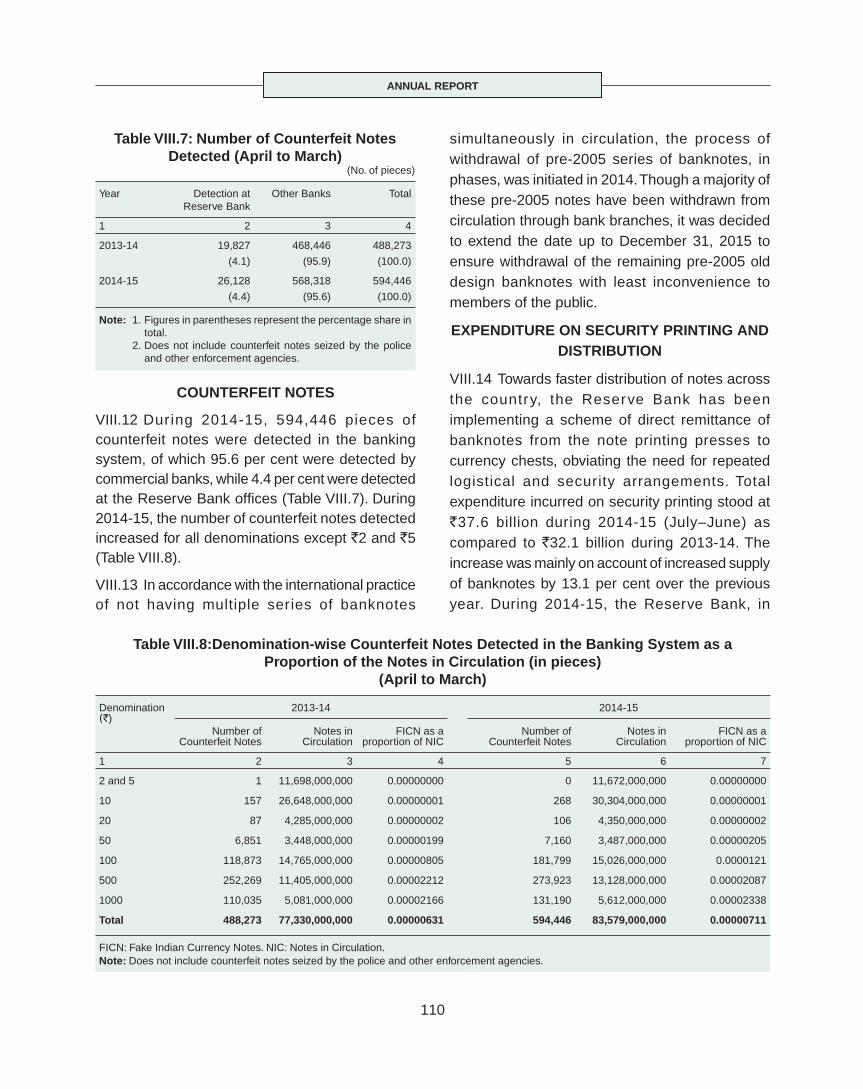
ANNUAL REPORT
110
simultaneously in circulation, the process of withdrawal of pre-2005 series of banknotes, in phases, was initiated in 2014. Though a majority of these pre-2005 notes have been withdrawn from circulation through bank branches, it was decided to extend the date up to December 31, 2015 to ensure withdrawal of the remaining pre-2005 old design banknotes with least inconvenience to members of the public.
EXPENDITURE ON SECURITY PRINTING AND DISTRIBUTION
VIII.14 Towards faster distribution of notes across the country, the Reserve Bank has been implementing a scheme of direct remittance of banknotes from the note printing presses to currency chests, obviating the need for repeated logistical and security arrangements. Total expenditure incurred on security printing stood at `37.6 billion during 2014-15 (July–June) as compared to `32.1 billion during 2013-14. The increase was mainly on account of increased supply of banknotes by 13.1 per cent over the previous year. During 2014-15, the Reserve Bank, in
COUNTERFEIT NOTES
VIII.12 During 2014-15, 594,446 pieces of counterfeit notes were detected in the banking system, of which 95.6 per cent were detected by commercial banks, while 4.4 per cent were detected at the Reserve Bank offi ces (Table VIII.7). During 2014-15, the number of counterfeit notes detected increased for all denominations except `2 and `5 (Table VIII.8).
VIII.13 In accordance with the international practice of not having multiple series of banknotes
Table VIII.8:Denomination-wise Counterfeit Notes Detected in the Banking System as a Proportion of the Notes in Circulation (in pieces)
(April to March)
Denomination (`)
2013-14 2014-15
Number of Counterfeit Notes
Notes in Circulation
FICN as a proportion of NIC
Number of Counterfeit Notes
Notes in Circulation
FICN as a proportion of NIC
1 2 3 4 5 6 7
2 and 5 1 11,698,000,000 0.00000000 0 11,672,000,000 0.00000000
10 157 26,648,000,000 0.00000001 268 30,304,000,000 0.00000001
20 87 4,285,000,000 0.00000002 106 4,350,000,000 0.00000002
50 6,851 3,448,000,000 0.00000199 7,160 3,487,000,000 0.00000205
100 118,873 14,765,000,000 0.00000805 181,799 15,026,000,000 0.0000121
500 252,269 11,405,000,000 0.00002212 273,923 13,128,000,000 0.00002087
1000 110,035 5,081,000,000 0.00002166 131,190 5,612,000,000 0.00002338
Total 488,273 77,330,000,000 0.00000631 594,446 83,579,000,000 0.00000711
FICN: Fake Indian Currency Notes. NIC: Notes in Circulation.Note: Does not include counterfeit notes seized by the police and other enforcement agencies.
Table VIII.7: Number of Counterfeit Notes Detected (April to March)
(No. of pieces)
Year Detection atReserve Bank
Other Banks Total
1 2 3 4
2013-14 19,827 468,446 488,273
(4.1) (95.9) (100.0)
2014-15 26,128 568,318 594,446
(4.4) (95.6) (100.0)
Note: 1. Figures in parentheses represent the percentage share in total.
2. Does not include counterfeit notes seized by the police and other enforcement agencies.
CURRENCY MANAGEMENT
111
consultation with the Government of India, made concerted efforts towards indigenisation of currency printing (Box VIII.1), elongation of the life of banknotes and resolution of issues associated with the shape and size of coins.
DEPARTMENT OF CURRENCY MANAGEMENT
VIII.15 On issues in currency management, the Department of Currency Management (DCM) plays a pivotal role in ensuring continuous supply and circulation of adequate quantities of clean banknotes and good coins of various denominations across the country. During 2014-15, the goals set for the Reserve Bank included field trial of plastic banknotes, exploring alternatives for extending the life of banknotes, harnessing technological advancements in the area of storage, transport, distribution; setting up a fully automated cash processing centre (CPC) on a pilot basis, introduction of new series of banknotes to leverage the latest innovations of currency note printing technology to
stay ahead of counterfeiters, redesigning coins to make them user friendly and long lasting, and improving banknote packaging to facilitate handling and making operational processes more labour friendly.
Agenda for 2014-15: Implementation Status
Field Trial of Plastic Banknotes
VIII.16 The request for proposal for supply of plastic Indian banknotes in the denomination of `10 was issued and its technical evaluation undertaken. However, certain technical infi rmities emerged and the process could not be taken further.
Exploring Alternatives for Extending the Life of Banknotes
VIII.17 A committee comprising stakeholders and research institutions was constituted to evaluate means to elongate the life of banknotes. A study on the subject has been taken up and is expected to be completed in 2015-16.
Box VIII.1 Efforts for Indigenisation of Currency Printing
India is the largest producer and consumer of currency notes, next only to China. Currency continues to be the dominant means of payment with the banknotes in circulation (in value terms) placed at `14.3 trillion as of end March 2015.
Sustained increase in demand for currency notes, exceeded the capacity of government note presses (at Nashik and Dewas) by the late 1980s. The Reserve Bank established two currency presses in 1996 at Mysore and Salboni through a wholly owned subsidiary of the Reserve Bank, the Bharatiya Reserve Bank Note Mudran Pvt. Ltd. (BRBNMPL), making the country self-reliant in currency note printing by 1999. Currently, more than 40 per cent of the currency notes circulated in India are printed by government presses while the remaining 60 per cent emanate from Reserve Bank currency presses. However, the Reserve Bank depends largely on imports for the main ingredients required for printing currency. In case of inks, India produces Offset and Intaglio ink while Optically Variable Ink is imported. Some of the security features, such as security thread and water mark used in the current series of banknotes are also imported. With regard to the paper used for banknotes, India produces
only 5 per cent of the paper required annually for currency note printing, necessitating import of the rest. Dependence on imports makes the printing process of currency vulnerable in terms of price, quantity and timeliness.
The Reserve Bank has embarked on a multi-pronged strategy for the indigenisation of currency note printing, keeping in view the associated benefi ts of backward integration in the form of assured, smooth and timely supply, cost saving (by way of reduction in the import bill), employment generation and effective deterrent to counterfeiting. To enhance the pace of indigenisation, a paper mill is being set up in Mysore, with an annual capacity of 12,000 MT which will substantially meet the paper requirement for currency printing. The Reserve Bank is also making efforts to develop domestic capabilities in the area of security features of banknotes. In order to have a time-bound programme for indigenisation of security features, the Reserve Bank, in consultation with the Government of India has set up a high level steering committee (Chairman: Shri R. Gandhi) which will identify agencies/institutions that could be encouraged to develop indigenous security features over the next few years.

ANNUAL REPORT
112
Fully Automated Cash Processing Centres
VIII.18 It was felt that a hub and spoke model would lead to greater effi ciency. Accordingly, commercial banks were encouraged to set up such processing centres and two banks have commenced establishment of CPCs.
Staying Ahead of Counterfeiters
VIII.19 Banknotes in the denomination of ̀ 100 with a new numbering pattern were introduced during the year. The new numbering pattern will be introduced in a phased manner in all other denominations. In June 2015, the process of introduction of new security features was taken forward through issuance of a global pre-qualifi cation bid for supply of security features.
Redesigning Coins and Improving Banknote Packaging
VIII.20 The Government of India has decided to constitute a committee to look into the shape and size of coins. The Reserve Bank will be associated with the same. It was decided, in consultation with stakeholders, to introduce corrugated fi bre boxes for packing of banknotes in accordance with the International Labour Organisation (ILO) Convention 127 and recommendation 128 (wherein, maximum weight to be carried by an adult workman should not exceed 55 kg). Such boxes will be more environment friendly than wooden boxes which are presently in use. Two of the printing presses have commenced supplies of banknotes in the new corrugated fi bre boxes.
Agenda for 2015-16
VIII.21 Taking forward the activities initiated in 2014-15 in the areas of introduction of new series of banknotes, new numbering pattern, braille like signs for the differently abled, and clean note policy, the Reserve Bank plans the following initiatives during 2015-16: towards elongating the life of
banknotes, a development tender on plastic banknotes will be considered. Further, the project of exploring other alternatives for increasing the life of banknotes will be taken forward.
Customer Service
VIII.22 The scheme of incentives and penalties for banks for provision of banknotes and coin related services will be rationalised. The distribution network of banknotes and coins will be strengthened by encouraging alternate means, including leveraging technology. Further, note refund rules which were last reviewed in 2009, will be taken up for further refinement. The Reserve Bank will continue with its medium/long term objective of indigenisation of security features for Indian banknotes.
BHARATIYA RESERVE BANK NOTE MUDRAN PRIVATE LIMITED (BRBNMPL)
VIII.23 To augment the production of banknotes and to bridge the gap between their demand and supply in the country, BRBNMPL was established by the Reserve Bank as its wholly owned subsidiary on February 3, 1995. The company manages two presses, one in Mysore in Karnataka and the other in Salboni in West Bengal.
VIII.24 BRBNMPL produces 60 per cent of the annual requirement of banknotes and had supplied 15,515.88 million banknotes to the Reserve Bank as at end-March, 2015. It recorded a net profi t after tax of ̀ 1.38 billion during 2014-15 as against a net profi t after tax of `1.33 billion in the previous year.
VIII.25 The company has been continually enhancing product iv i ty and operat ional efficiency through research and development activities and process innovations. It has established testing and research facilities at its laboratories in Mysore and Salboni for ensuring strict quality controls. These laboratories are currently focused on enhancing the life of banknotes, selection and

CURRENCY MANAGEMENT
113
evaluation of substrates for banknotes, comparison
of various materials and their properties, and
evaluation of security features.
VIII.26 The Bank Note Paper Mill India Private
Limited (BNPMIPL) in Mysore, with a capacity of
12,000 tonnes per annum was established in
October 2010 as an equal joint venture between
the Government of India owned SPMCIL and the
Reserve Bank subsidiary BRBNMPL. However,
glitches arising out of the processes and modalities
of securing statutory approvals from the concerned
agencies impeded operationalisation of the facility.
It is expected to commence production in 2015-16.
This facility is expected to lead to self-suffi ciency
in manufactur ing of paper for banknotes,
substantially reducing imports.
PAYMENT AND SETTLEMENT SYSTEMSAND INFORMATION TECHNOLOGYIX
DEPARTMENT OF PAYMENT AND SETTLEMENT SYSTEMS
IX.1 Eff ic ient and secure payment and
settlement systems are essential components of
a well-developed fi nancial system. The department
being the nodal wing of the Reserve Bank in
matters of payment and settlement systems,
focused towards migrating to a less cash society
and on enhancing the effi ciency and security of
electronic transactions, while at the same time
improving convenience of operations. Another key
area of focus was enhancing access to fi nance
through strengthening the inter-operable payment
system infrastructure and putting in place a fi rm
legal basis for payment system activities in
conformity with international standards. With a
view to ensuring seamless fi nancial transactions,
the Reserve Bank has been leveraging technology
to upgrade the payment and settlement systems
on a continuous basis over the years, resulting in
a gradual shift from cash and paper based
transactions to electronic modes of payments. The
Reserve Bank while taking all these steps,
recognised developments in technology and
provided a facilitating environment for innovations
in the payments sphere.
TREND AND PROGRESS INPAYMENT SYSTEMS
IX.2 The electronic payment systems registered high volumes in 2014-15, following the determined efforts made by the Reserve Bank for migration to electronic payments (Table IX.1). Correspondingly, transactions processed by the paper-based clearing systems have shown a continuous decline both in volume and value terms. Overall, the payment and settlement systems posted a higher growth of 27.1 per cent in volume and a lower growth of 5.4 per cent in value in 2014-15 in relation to the previous year.
Paper clearing
IX.3 The share of paper-based transactions in total transactions continued to show a declining trend over the years. In volume terms, paper-based transactions accounted for 25.4 per cent of the total transactions during 2014-15, down from 33.9 per cent in the previous year. Their share in value terms also declined to 5.4 per cent from 6.2 per cent.
Retail electronic payments
IX.4 The growth in retail electronic payments has been encouraging both in terms of coverage and usage. As on March 31, 2015, the national
In pursuance of the vision of encouraging electronic payments and achieving a less cash society, the Reserve Bank continued its endeavour to have safe, inclusive and efficient payment systems in the country. Initiatives in this direction included rationalisation of policies relating to ATM transactions, prepaid payment instruments, white label ATMs and relaxation of additional factor of authentication for small value contact-less card present payments. In addition, the Reserve Bank also initiated the process of infrastructure enhancement in bill payments and MSME bill discounting segments by putting in place policy framework for setting up of Bharat Bill Payment System (BBPS) and Trade Receivables Discounting System (TReDS). The Reserve Bank also undertook a slew of in-house IT initiatives to brace up with the emerging challenges.
114
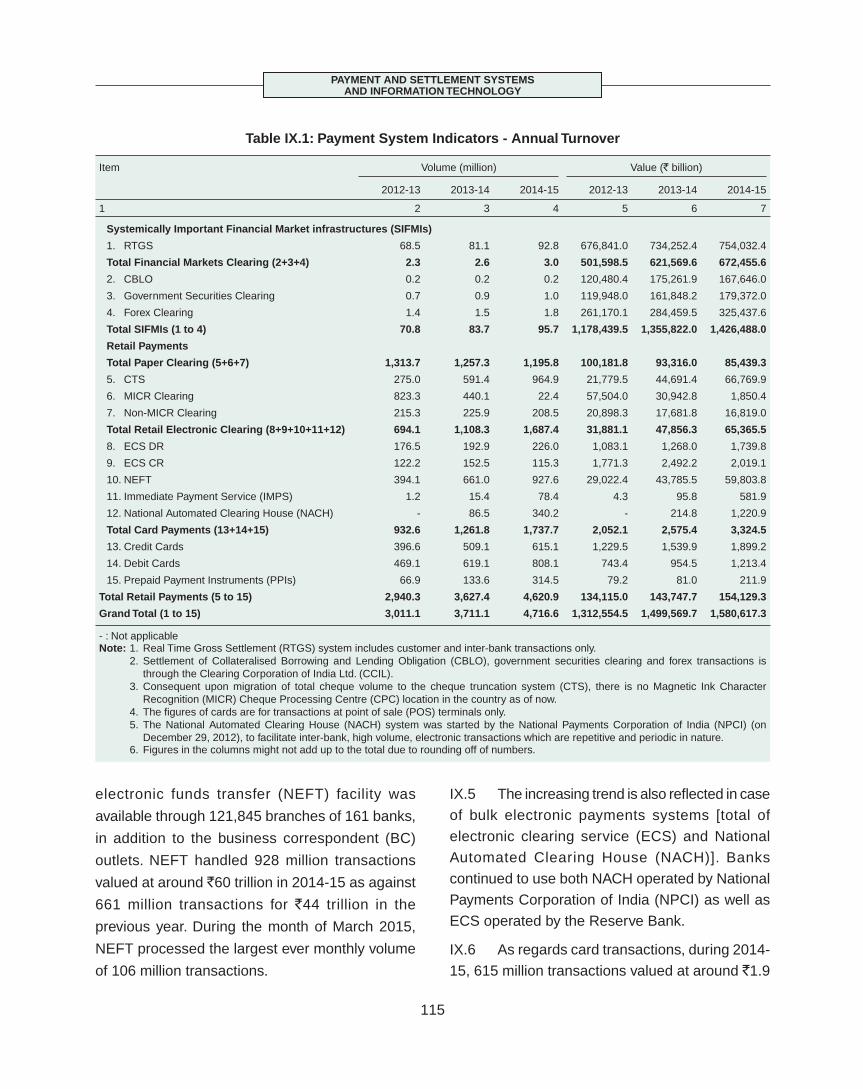
PAYMENT AND SETTLEMENT SYSTEMSAND INFORMATION TECHNOLOGY
115
electronic funds transfer (NEFT) facility was
available through 121,845 branches of 161 banks,
in addition to the business correspondent (BC)
outlets. NEFT handled 928 million transactions
valued at around `60 trillion in 2014-15 as against
661 million transactions for `44 trillion in the
previous year. During the month of March 2015,
NEFT processed the largest ever monthly volume
of 106 million transactions.
IX.5 The increasing trend is also refl ected in case
of bulk electronic payments systems [total of
electronic clearing service (ECS) and National
Automated Clearing House (NACH)]. Banks
continued to use both NACH operated by National
Payments Corporation of India (NPCI) as well as
ECS operated by the Reserve Bank.
IX.6 As regards card transactions, during 2014-
15, 615 million transactions valued at around `1.9
Table IX.1: Payment System Indicators - Annual Turnover
Item Volume (million) Value (` billion)
2012-13 2013-14 2014-15 2012-13 2013-14 2014-15
1 2 3 4 5 6 7
Systemically Important Financial Market infrastructures (SIFMIs)
1. RTGS 68.5 81.1 92.8 676,841.0 734,252.4 754,032.4
Total Financial Markets Clearing (2+3+4) 2.3 2.6 3.0 501,598.5 621,569.6 672,455.6
2. CBLO 0.2 0.2 0.2 120,480.4 175,261.9 167,646.0
3. Government Securities Clearing 0.7 0.9 1.0 119,948.0 161,848.2 179,372.0
4. Forex Clearing 1.4 1.5 1.8 261,170.1 284,459.5 325,437.6
Total SIFMIs (1 to 4) 70.8 83.7 95.7 1,178,439.5 1,355,822.0 1,426,488.0
Retail Payments
Total Paper Clearing (5+6+7) 1,313.7 1,257.3 1,195.8 100,181.8 93,316.0 85,439.3
5. CTS 275.0 591.4 964.9 21,779.5 44,691.4 66,769.9
6. MICR Clearing 823.3 440.1 22.4 57,504.0 30,942.8 1,850.4
7. Non-MICR Clearing 215.3 225.9 208.5 20,898.3 17,681.8 16,819.0
Total Retail Electronic Clearing (8+9+10+11+12) 694.1 1,108.3 1,687.4 31,881.1 47,856.3 65,365.5
8. ECS DR 176.5 192.9 226.0 1,083.1 1,268.0 1,739.8
9. ECS CR 122.2 152.5 115.3 1,771.3 2,492.2 2,019.1
10. NEFT 394.1 661.0 927.6 29,022.4 43,785.5 59,803.8
11. Immediate Payment Service (IMPS) 1.2 15.4 78.4 4.3 95.8 581.9
12. National Automated Clearing House (NACH) - 86.5 340.2 - 214.8 1,220.9
Total Card Payments (13+14+15) 932.6 1,261.8 1,737.7 2,052.1 2,575.4 3,324.5
13. Credit Cards 396.6 509.1 615.1 1,229.5 1,539.9 1,899.2
14. Debit Cards 469.1 619.1 808.1 743.4 954.5 1,213.4
15. Prepaid Payment Instruments (PPIs) 66.9 133.6 314.5 79.2 81.0 211.9
Total Retail Payments (5 to 15) 2,940.3 3,627.4 4,620.9 134,115.0 143,747.7 154,129.3
Grand Total (1 to 15) 3,011.1 3,711.1 4,716.6 1,312,554.5 1,499,569.7 1,580,617.3
- : Not applicable Note: 1. Real Time Gross Settlement (RTGS) system includes customer and inter-bank transactions only. 2. Settlement of Collateralised Borrowing and Lending Obligation (CBLO), government securities clearing and forex transactions is
through the Clearing Corporation of India Ltd. (CCIL). 3. Consequent upon migration of total cheque volume to the cheque truncation system (CTS), there is no Magnetic Ink Character
Recognition (MICR) Cheque Processing Centre (CPC) location in the country as of now. 4. The fi gures of cards are for transactions at point of sale (POS) terminals only. 5. The National Automated Clearing House (NACH) system was started by the National Payments Corporation of India (NPCI) (on
December 29, 2012), to facilitate inter-bank, high volume, electronic transactions which are repetitive and periodic in nature. 6. Figures in the columns might not add up to the total due to rounding off of numbers.
ANNUAL REPORT
116
trillion were carried out through credit cards, while 808 million transactions valued at ̀ 1.2 trillion were carried out through debit cards. Transactions through prepaid payment instruments (PPIs) also grew substantially, recording 314 million transactions valued at `212 billion. Mobile banking service, which is a relatively newer entrant among the payment options, has shown encouraging growth and handled 171 million transactions valued at `1 trillion during the year.
Agenda for 2014-15: Implementation Status
Mobile banking
IX.7 As part of the agenda for 2014-15, it was planned that efforts would be made to provide a fi llip to mobile banking and undertake necessary groundwork to put in place standards for customer on-boarding, security of transactions and redressal of customer grievances, besides engaging with stakeholders to explore the feasibility of having a standardised application for mobile banking across banks. The Reserve Bank issued necessary guidelines to banks in December 2014 to enhance the usage of mobile banking in the country. Banks were advised to provide their customers options for easy registration for mobile banking services, through multiple channels, including ATMs, thereby minimising the need for branch visit to avail such services. NPCI is in the process of facilitating mobile banking registration at ATMs on the National Financial Switch (NFS) network. Similarly, NPCI was advised with regard to setting standards for industry agreements between banks and mobile network operators (MNOs) for handling customer grievances, particularly in the context of the Na t i ona l Un i f i ed USSD (Uns t r uc tu red Supplementary Service Data) Platform (NUUP).
Trade Receivables Discounting System (TReDS)
IX.8 In order to provide quick and efficient fi nancing options for the micro, small and medium
enterprises (MSME) segment, it was proposed to set up an electronic TReDS to bring together the MSME, their corporate buyers as well as fi nanciers and reduce the constraints faced by the MSME segment in liquidity management. The participants in the TReDS will be corporate buyers, including government departments and public sector undertakings (PSUs). The system will also facilitate factoring of both receivables as well as payables. Accordingly, policy measures were taken towards setting up of TReDS. Seven applications received to set up TReDS are being scrutinised for consideration of their authorisation during 2015-16 under the Payment and Settlement Systems (PSS) Act, 2007.
Bharat Bill Payment Systems (BBPS)
IX.9 The guidelines for BBPS were issued in November 2014 as per the agenda for 2014-15. BBPS is being set up by NPCI as a pan-India integrated bill payment system under the PSS Act, 2007 offering inter-operable and accessible bill payment services to customers through a network of agents. It is expected to address the problems faced by consumers who are required to use multiple options (as put in place by respective billers) to meet their bills payment requirements. The process of authorisation of NPCI to act as a Bharat Bill Payment Central Unit (BBPCU) and authorisation of Bharat Bill Payment Operating Unit (BBPOU) will be completed during 2015-16.
Consolidation of Payment Systems
IX.10 The ECS suite and NACH provide similar services. As envisaged in the agenda for 2014-15, consolidation of these payment systems has commenced from December 2014 with migration of volume from the ECS suite to NACH and thus, almost all participants are on board in the NACH system.

PAYMENT AND SETTLEMENT SYSTEMSAND INFORMATION TECHNOLOGY
117
Other developments during 2014-15
IX.11 In line with the objective of the department to enhance greater acceptance of electronic payments, the following policy changes were introduced during the year.
Expansion of infrastructure / service providers
IX.12 For ensuring availability of additional payment options, authorisation was issued to nine entities, increasing the number of authorised payment system operators to 63 in 2014-15. The number of entities authorised for operating PPIs increased to 34 with fi ve entities authorised during 2014-15. The remaining four entities were authorised for the money transfer service scheme (MTSS) (cross-border inward remittances), white label ATMs (WLAs) and instant money transfer. As on March 31, 2015, there were 7,881 WLAs installed across the country, out of which 4,932 were in Tier III to VI centres.
IX.13 With expanding infrastructure and service providers, it is equally important that they operate as per the norms set out by the Reserve Bank. The Reserve Bank has accordingly devised an assessment template for retail payment systems. Non-bank entities were asked to submit a self-assessment as per the template.
Security and effi ciency
IX.14 Security and effi ciency of payment system infrastructure being critical in development of payment systems, the NEFT platform was migrated to UNIX platform under the data centre architecture, which not only enhanced the processing capacity but also addressed the concerns of business continuity. Similarly, in case of large value payment
systems, activation of hybrid features in the revamped real time gross settlement (RTGS) system has facilitated the settlement of transactions on a gross basis as well as through multilateral off-setting. Further, to enhance the effi ciency and customer service aspects, acceptance of future value-dated transactions for settlement (up to three business days) has been activated, and the business hours of RTGS have been extended.
IX.15 With a view to mitigating certain risks in large value payment systems, the Clearing Corporation of India Limited (CCIL) took several initiatives. CCIL migrated its USD-INR settlement of inter-bank forex transactions to a payment versus payment (PvP) mode in April 2015 addressing the Herstatt risk1. It has carried out the fi rst cycle of portfolio compression in the forex forward segment, achieving a compression of about 62 per cent and thereby, reducing counterparty exposure. CCIL is also carrying out exposure checks in the forex forward rupee derivatives segment on an online basis for interest rate swap (IRS)/forward rate agreement (FRA) trades which facilitate checking the adequacy of margins in advance and thereby, mitigating the risk of rejection of trades by CCIL.
Customer convenience and innovations
IX.16 With the objective of ensuring convenience in the use of the payment system and also to facilitate the migration to electronic payments, the policy guidelines related to PPIs, mobile banking, usage of ATMs and additional factor of authentication (AFA2) were amended.
IX.17 The guidelines for issuance of PPIs were rationalised in December 2014 to ensure its
1 The risk that one party in a foreign exchange trade pays out the currency it sold but does not receive the currency it bought, is called foreign exchange settlement risk or “Herstatt” risk.
2 AFA is a security process in which the user provides additional means of identifi cation, one of which is typically a physical token, such as a card, and the other of which is typically something memorised, such as a security code.
ANNUAL REPORT
118
increased usage. The limit for full-KYC semi-closed PPIs was enhanced from ̀ 50,000 to ̀ 100,000; the validity of gift cards was increased from one year to three years; banks were allowed to issue multiple PPIs for dependent family members from full-KYC compliant bank accounts. In order to provide convenience to visiting foreign nationals and NRIs and also to reduce cash transactions emanating from this segment, banks were allowed to issue rupee denominated open system non-reloadable PPIs to visiting foreign nationals and NRIs during their stay in India, with the permissible ceiling on such PPIs being `200,000 with cash withdrawal restricted to `50,000 per month.
IX.18 The guidelines on WLAs were reviewed to allow for acceptance of international credit/debit/prepaid cards, besides the facility of dynamic currency conversion (DCC). WLA operators are now permitted to tie up with other commercial banks, besides the sponsor bank for supply of cash to the WLAs.
IX.19 Recognising the need for balancing aspects of security and convenience of card transactions, the requirement of AFA, which was earlier introduced for security of operations, was relaxed for small value card present transactions using contact-less EMV (i.e., Europay, Mastercard and Visa) chip cards. Banks have also been advised to put in place suitable velocity checks while at the same time clearly indicate the maximum liability, if any, devolving on the customer.
Moving towards less cash
IX.20 Keeping in view the interoperable ATM infrastructure and the geographical dispersion of ATMs, the number of mandated free transactions at ATMs was rationalised in big cities. The minimum number of free transactions for savings bank account holders at other bank’s ATMs was reduced to three per month from fi ve in six metro centres. Further, banks were advised to provide their
savings bank account holders with at least fi ve free transactions per month at their own ATMs. Beyond the mandatory free ATM transactions, banks were permitted to charge their customers up to a maximum of ̀ 20 (plus service tax) per transaction. However, banks can put in place their own policies offering more number of free transactions at ATMs.
Sound legal framework and compliance with international standards
IX.21 A fi rm legal framework for payment systems is equally critical and hence, in conformity with the international standards, certain amendments to the PSS Act 2007 were introduced during the year.
IX.22 Following the global fi nancial crisis, trade repositories (TR) and legal entity identifi er (LEI) system have gained importance for strengthening the over the counter (OTC) derivatives markets. Further, the functioning of a central counter party (CCP) and legal certainty in the event of its insolvency is critical. In order to provide specifi c legal backing to close out netting in the event a CCP goes insolvent, as also for regulation and supervision of TR and local operating unit (LOU - an entity issuing LEI) by the Reserve Bank, after extensive deliberations by the Select Committee of the Rajya Sabha in which the Reserve Bank participated actively, amendments to the PSS Act, 2007 were carried out. This provides legal backing/clarity to various issues like close-out netting in the event of insolvency of a CCP; regulating and supervising TR; LOU under the LEI system; and protection of customer funds for systems operated by authorised non-bank entities.
IX.23 In terms of focus areas in large value payment systems, effor ts were directed at compliance with the Principles for Financial Market Infrastructures (PFMIs) by Financial Market Infrastructures (FMIs). Towards this end, the Committee on Payments and Market Infrastructures-
PAYMENT AND SETTLEMENT SYSTEMSAND INFORMATION TECHNOLOGY
119
Internat ional Organisat ion of Secur i t ies Commissions (CPMI-IOSCO) which has been carrying out the Level 1 assessment3 against PFMIs, has rated the Indian jurisdiction as “4”4, i.e., fi nal implementation measures are fully in force.
Other initiatives
IX.24 The Reserve Bank organised an international seminar in November 2014 at Kovalam, Kerala, with a focus on the evolving role of central banks in retail payments, cash to cashless, role of non-banks in retail payments, innovations in retail payments, government payments and remittances, risk management and security and financial inclusion. A ‘Payment Systems Innovations Day’ was organised in December 2014 to provide a platform for presenting the various innovations taking place in payment systems. The Reserve Bank hosted the 14th SEACEN Advanced Course on Payment and Settlement Systems for Emerging Economies during May 2015 with a special focus on ‘Resilience of Payment Systems to Cyber Crime’.
Agenda for 2015-16
IX.25 The Reserve Bank would continue to encourage innovation in payment systems and play the role of a facilitator keeping the focus on safety and effi ciency of payment systems. Given the fast changing payment landscape, the Reserve Bank will prepare a vision document for a 2/3 years horizon. The work with respect to authorisation of entities for operating TReDS and BBPS will be completed in 2015-16.
IX.26 In line with the endeavour to disincentivise cash transactions and incentivise card transactions,
measures for enhancing card acceptance
infrastructure by acquiring banks will be examined
and policy framework on ATMs and cash at POS
will be reviewed along with the interchange/
merchant discount rate (MDR) structure in
consultation with all the stakeholders.
IX.27 With the growing e-commerce segment in
the country, the role of payment aggregators and
intermediaries is also increasing signifi cantly. The
Reserve Bank will engage with stakeholders to
explore the need/feasibility of having a direct/
indirect regulatory framework for these entities. An
assessment of RTGS against PFMIs would be
undertaken in 2015-16 by the Reserve Bank.
IX.28 CCIL has been identifi ed as LOU for issuing LEI and endorsed as pre-LOU by the Regulatory Oversight Committee (ROC). It has since commenced issuance of LEI in India. A roadmap for use of LEI will be drawn in consultation with the Securities and Exchange Board of India (SEBI).
DEPARTMENT OF INFORMATION TECHNOLOGY
IX.29 The department continued to focus on the Reserve Bank’s IT vision of enabling the use of information technology (IT) as a strategic resource
for bringing about overall effi ciency in the Reserve Bank’s operations, improving standards of services being provided to its customers, strengthening
governance and facilitating analytical and
information based decision making in a safe and secure IT based environment. Information
Technology Sub Committee (ITSC) of the Central
Board continued to provide guidance in furthering this vision. ITSC met three times during 2014-15
3 Whether jurisdictions have completed the process of adopting the legislation and other policies implementing the 24 Principles for FMIs and four of the fi ve Responsibilities for authorities within the regulatory framework that applies to FMIs.
4 Rating Level 1: Draft implementation measures not published; Rating Level 2: Draft implementation measures published; Rating Level 3: Final implementation measures published; Rating Level 4: Final implementation measures fully in force; Rating Level NA: No implementation measures needed (i.e., not applicable).
ANNUAL REPORT
120
and discussed major issues relating to IT projects and information security in the Reserve Bank; data warehouse; audits pertaining to information security; operations of the data centres (DCs); effi cacy of disaster recovery drills; and working of the offi ce of the chief information security offi cer (CISO).
Agenda in 2014-15: Implementation Status
Enterprise knowledge portal (EKP)
IX.30 The revamped EKP, launched in November 2013 provides a knowledge sharing platform within the Reserve Bank. During 2014-15, the portal was further enhanced with features like e-learning modules and improved search options. They were well received by users resulting in increased usage of the portal.
Video conferencing (VC) system
IX.31 The VC within the Reserve Bank which was upgraded in 2013-14 witnessed large scale usage; 532 VC sessions involving multiple locations were held during 2014-15, in addition to point-to-point user-based sessions. This has reduced the need for physical meetings.
Mail messaging system (MMS)
IX.32 The Reserve Bank’s corporate mail messaging system was reinforced with advanced archival solutions which ushered in ease of usage and enhanced security. The up-gradation work on hardware commenced during the year and after its installation, the migration process to the new system is expected to be completed by the end of September 2015.
Committee on data standardisation
IX.33 A Committee on Data Standardisation (Convener: Shri P. Parthasarathi) which was constituted to bring about synergy and uniformity in the efforts being undertaken in the areas of data reporting and data standardisation, placed its draft
report in the public domain for feedback. Based on the inputs received, the committee has fi nalised its repor t . Work on implementat ion o f the recommendations has since commenced.
Enhancements in core banking system (CBS) and stabilisation of e-treasury
IX.34 E-Kuber, the CBS of the Reserve Bank was introduced in 2012 for banks to participate in government borrowing programmes, liquidity adjustment operations and current account operations. During 2014-15, changes were made to e-Kuber to provide for the deployment of cash balances of the government (also see chapter VII). The Depositor’s Education and Awareness (DEA) Fund scheme was implemented in e-Kuber at the very outset, enabling a fl ow of around `45 billion into the fund within two days. Treasury operations of the Department of External Investments and Operations of the Reserve Bank were successfully migrated from a legacy system to e-Kuber. This implementation, the fi rst of its kind amongst central banks worldwide has brought in operational effi ciency and unifi cation of accounting processes.
Agenda for 2015-16
IX.35 The major initiatives planned for 2015-16 are discussed below.
Establishment of an IT subsidiary of the reserve bank
IX.36 Central banking operations have undergone a sea change thanks to the large scale integration of IT processes in banking. To handle the ever increasing complexities in a changing environment and to address cyber security and other related challenges, it is essential that a fully dedicated team of technical experts be continuously associated with this work. To this end, the Central Board of the Reserve Bank has approved the setting up of its IT Subsidiary. This initiative is being taken forward with guidance from experts in the industry.
PAYMENT AND SETTLEMENT SYSTEMSAND INFORMATION TECHNOLOGY
121
Implementation of the electronic document
management system (EDMS) within the Reserve
Bank
IX.37 As a means towards la rge sca le
electronification of work processes within the
Reserve Bank and to move towards a ‘less paper’
offi ce environment, initiatives were undertaken to
set up an electronic work flow and document
management system along with data storage. The
EDMS project, which commenced last year, is
under progress. Given the enormous potential of
the EDMS system on the overall effi ciency of the
Reserve Bank and its role in empowering its staff
with knowledge, a comprehensive business process
re-engineering (BPR) is being undertaken apart
from evaluating the various software products
available in the market. It is expected that a pilot
implementation would commence during the fi rst
half of 2016.
Revamping of IT Infrastructure at DCs
IX.38 With the increased application systems
operating from DCs and higher requirement of
electric power, it is essential to improve the existing
infrastructure at the DCs. Keeping in view the need
to be environment friendly, work on virtualisation
of hardware servers has commenced. As a fi rst
step, the migration of the RTGS system to a new
IBM mainframe system was completed during the
year.
Implementation of information security operating centre (ISOC)
IX.39 To handle enterprise wide IT security, ISOC is being set up. The project commenced with the issue of expression of interest (EOI) followed by the shortlisting of potential bidders. The tendering process has commenced and the project is expected to be completed by April 2016.
Extension of e-receipts and e-payments across all States using e-Kuber CBS
IX.40 The standardised e-receipt and e-payment functionalities using e-Kuber was demonstrated to most of the States, as well as in the recently held Conference of the State Finance Secretaries. In sequel, State Governments of West Bengal, Uttarakhand, Tamil Nadu and Kerala started using the system in 2014-15. The other states are at different stages of implementation. Efforts will be focussed on scaling up use of the system across all the major states in 2015-16.
Integrating currency management functions with CBS
IX.41 Accounting of currency movement and reporting is a potential area for integration with e-Kuber. A study of the system requirements, reverse presentation, discussions, design, development, testing and rollout of the modules will be undertaken during 2015-16 to facilitate its integration.

ANNUAL REPORT
122
GOVERNANCE, HUMAN RESOURCES AND ORGANISATIONAL
MANAGEMENTX
X.1 This chapter discusses three critical ingredients of the Reserve Bank - governance, human resources and organisational management apart from covering the activities of a number of depar tments dealing with communication, international relations, banking services to the government and banks, forex reserves management, economic research, statistics, legal matters, corporate strategy and budgeting, corporate support services, Rajbhasha and premises. During 2014-15, the Reserve Bank sought to further improve its governance, management and operational framework through re-articulation of its core purpose, values and vision. The organisational structure was streamlined further to create functional synergies and optimise the delivery of output both in terms of quantity and quality keeping in view the evolving operating environment. Developing human resources through an appropriate incentive structure, including training, exposure and rotation to harness the potential of its staff members for effective delivery was a major area of focus. Through its communication policy, the Reserve Bank sought to reach out to the wider public in pursuance of transparency, knowledge sharing and creating awareness about fi nancial risks faced by the public in day-to-day life. Risk management and audit operations of the Reserve Bank placed a greater focus on a holistic approach to ensure business continuity.
GOVERNANCE STRUCTURE
X.2 The Reserve Bank seeks to uphold the
highest standards in corporate governance,
independence and quality of decision making while
discharging its core functions and staying committed
to its values in terms of a corporate code of ethics.
The governance structure of the Reserve Bank
ensures that i ts general pol icy, strategy,
administration and business are aligned with its
core purpose and that the processes followed are
compliant with its shared values. The Secretary’s
Department which acts as the secretariat to the
Central Board provides support services to the top
management.
X.3 The Central Board of Directors is the apex
body in the governance structure. With the Governor
in the chair, it comprises of four Deputy Governors
of the Reserve Bank, Government nominees and
independent directors, who are eminent achievers
in different fi elds commensurate with the Reserve
Bank’s objectives. There are four Local Boards for
the Northern, Southern, Eastern and Western areas
of the country to take care of local interests. The
Government of India appoints/nominates directors
to the Central Board and members to Local Boards
in accordance with the Reserve Bank of India (RBI)
Act, 1934. The Central Board is assisted by three
committees - Committee of the Central Board
At the onset of its 81st year, the Reserve Bank rearticulated its core purpose, values and vision in 2014-15. The organisational structure was fine-tuned to create synergies and improve the effectiveness of the delivery mechanism. It continued to place focus on upgrading its human resources through training and providing diverse exposures. It also organised conferences, seminars and outreach programmes during the year to disseminate research and promote knowledge sharing. The Reserve Bank adopted an enterprise-wide risk management framework to ensure business continuity and for effectively managing various risks that it faces in its operations and functioning. It also took steps to focus on international financial diplomacy and participation in global regulatory standards.
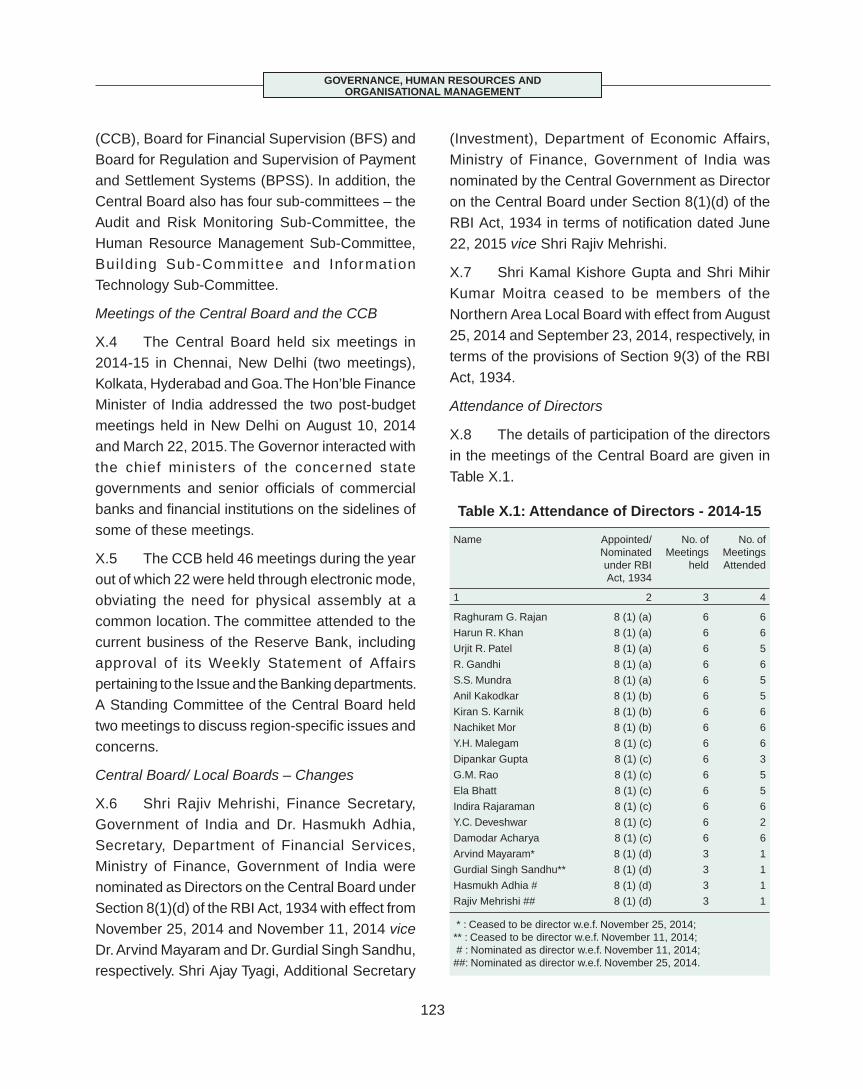
GOVERNANCE, HUMAN RESOURCES AND ORGANISATIONAL MANAGEMENT
123
(CCB), Board for Financial Supervision (BFS) and Board for Regulation and Supervision of Payment and Settlement Systems (BPSS). In addition, the Central Board also has four sub-committees – the Audit and Risk Monitoring Sub-Committee, the Human Resource Management Sub-Committee, Bui lding Sub-Committee and Information Technology Sub-Committee.
Meetings of the Central Board and the CCB
X.4 The Central Board held six meetings in 2014-15 in Chennai, New Delhi (two meetings), Kolkata, Hyderabad and Goa. The Hon’ble Finance Minister of India addressed the two post-budget meetings held in New Delhi on August 10, 2014 and March 22, 2015. The Governor interacted with the chief ministers of the concerned state governments and senior offi cials of commercial banks and fi nancial institutions on the sidelines of some of these meetings.
X.5 The CCB held 46 meetings during the year out of which 22 were held through electronic mode, obviating the need for physical assembly at a common location. The committee attended to the current business of the Reserve Bank, including approval of its Weekly Statement of Affairs pertaining to the Issue and the Banking departments. A Standing Committee of the Central Board held two meetings to discuss region-specifi c issues and concerns.
Central Board/ Local Boards – Changes
X.6 Shri Rajiv Mehrishi, Finance Secretary, Government of India and Dr. Hasmukh Adhia, Secretary, Department of Financial Services, Ministry of Finance, Government of India were nominated as Directors on the Central Board under Section 8(1)(d) of the RBI Act, 1934 with effect from November 25, 2014 and November 11, 2014 vice Dr. Arvind Mayaram and Dr. Gurdial Singh Sandhu, respectively. Shri Ajay Tyagi, Additional Secretary
(Investment), Department of Economic Affairs, Ministry of Finance, Government of India was nominated by the Central Government as Director on the Central Board under Section 8(1)(d) of the RBI Act, 1934 in terms of notifi cation dated June 22, 2015 vice Shri Rajiv Mehrishi.
X.7 Shri Kamal Kishore Gupta and Shri Mihir Kumar Moitra ceased to be members of the Northern Area Local Board with effect from August 25, 2014 and September 23, 2014, respectively, in terms of the provisions of Section 9(3) of the RBI Act, 1934.
Attendance of Directors
X.8 The details of participation of the directors in the meetings of the Central Board are given in Table X.1.
Table X.1: Attendance of Directors - 2014-15
Name Appointed/Nominated under RBI Act, 1934
No. of Meetings
held
No. of Meetings Attended
1 2 3 4
Raghuram G. Rajan 8 (1) (a) 6 6
Harun R. Khan 8 (1) (a) 6 6
Urjit R. Patel 8 (1) (a) 6 5
R. Gandhi 8 (1) (a) 6 6
S.S. Mundra 8 (1) (a) 6 5
Anil Kakodkar 8 (1) (b) 6 5
Kiran S. Karnik 8 (1) (b) 6 6
Nachiket Mor 8 (1) (b) 6 6
Y.H. Malegam 8 (1) (c) 6 6
Dipankar Gupta 8 (1) (c) 6 3
G.M. Rao 8 (1) (c) 6 5
Ela Bhatt 8 (1) (c) 6 5
Indira Rajaraman 8 (1) (c) 6 6
Y.C. Deveshwar 8 (1) (c) 6 2
Damodar Acharya 8 (1) (c) 6 6
Arvind Mayaram* 8 (1) (d) 3 1
Gurdial Singh Sandhu** 8 (1) (d) 3 1
Hasmukh Adhia # 8 (1) (d) 3 1
Rajiv Mehrishi ## 8 (1) (d) 3 1
* : Ceased to be director w.e.f. November 25, 2014; ** : Ceased to be director w.e.f. November 11, 2014; # : Nominated as director w.e.f. November 11, 2014; ##: Nominated as director w.e.f. November 25, 2014.
ANNUAL REPORT
124
Executive Directors - Changes
X.9 Shri B. Mahapatra and Shri G. Padmanabhan,
Executive Directors retired on August 31, 2014 and May 31, 2015, respectively. Dr. Michael D. Patra, Shri K.K. Vohra and Shri G. Mahalingam were promoted as Executive Directors effective October 7, 2014. Smt. Meena Hemachandra was promoted as Executive Director effective June 1, 2015.
Obituary
X.10 Shri Suresh Neotia, Director of the Central Board from June 27, 2006 to September 23, 2011, passed away in Kolkata on May 7, 2015. Dr. A.P.J. Abdul Kalam, Director of the Central Board from November 27, 2000 to June 14, 2002 passed away in Shillong on July 27, 2015.
Visits of Foreign Dignitaries/Delegations
X.11 Twenty delegations from 12 countries visited the Reserve Bank during the year. They interacted with the top management on a wide range of bilateral and global issues and on the Reserve Bank’s policy initiatives in different areas of its
functioning. Foreign dignitaries who visited the Reserve Bank during 2014-15 included H.M. Queen Maxima of the Netherlands, United Nations’ Secretary-General’s Special Advocate for Inclusive Finance for Development; Rt. Hon. George Osborne, Chancellor of Exchequer, UK; Ms. Penny Pritzker, US Secretary of Commerce; Mr. Bill Gates and his team; Dr. Valiollah Seif, Governor, Central Bank of Iran; Rt. Hon. Alan Yarrow, Lord Mayor of the City of London; Hon. Andrew Robb, MP, Australian Minister for Trade and Investment; Mr. Jacob J. Lew, US Treasury Secretary; Mr. Stanley Fischer, Vice-Chairman, Central Board of Governors, Federal Reserve System and Ms. Christine Lagarde, Managing Director, IMF.
Measures to Improve Governance
X.12 Measures were taken during the year to enhance the quality of corporate governance while simultaneously reducing its cost. The Reserve Bank, as it entered the 81st year of its establishment, rearticulated, in contemporary terms, its core purpose as given in the preamble to the RBI Act, 1934 (Box X.1).
Box X.1Reserve Bank of India: Core Purpose, Values and Vision Statement
As the Reserve Bank entered the 80th year of its existence, a need was felt to rearticulate in contemporary terms its core purpose as given in the preamble to the RBI Act, 1934, the founding statute of the Reserve Bank. The purpose was to delineate the Reserve Bank’s strategic objectives and provide a framework and backdrop within and against which the Reserve Bank’s policies will be formulated and the direction that it will chart. Accordingly, the Reserve Bank issued its ‘Core Purpose, Values and Vision’ statement in April 2015, which is available at the Bank’s website.
Core Purpose
To foster monetary and fi nancial stability conducive to sustainable economic growth and to ensure the development of an effi cient and inclusive fi nancial system.
The Core Purpose refl ects the Reserve Bank’s commitment to the nation:
To foster confi dence in the internal and external value of the rupee, and contribute to macro-economic stability;
To regulate markets and institutions under its ambit to ensure fi nancial system stability and consumer protection;
To promote the integrity, effi ciency, inclusiveness and competitiveness of the fi nancial and payments system;
To ensure effi cient management of currency as well as banking services to the government and banks; and
To support the balanced, equitable and sustainable economic development of the country.
Values
The Reserve Bank of India commits itself to the following shared values that guide organisational decisions and employee actions in pursuit of the Reserve Bank’s core purpose:
(Contd....)
GOVERNANCE, HUMAN RESOURCES AND ORGANISATIONAL MANAGEMENT
125
X.13 Important items to be placed before the Board are now brainstormed in an informal pre-Board meeting so as to improve the quality of decision making by the Board. The Reserve Bank of India General Regulations were amended during the year to enable fortnightly meetings of CCBs, if felt necessary in the future, in place of weekly meetings. In the forthcoming year, the Reserve Bank will continue to look for ways to further streamline the decision making process.
COMMUNICATION PROCESSES
X.14 The Reserve Bank has been pursuing a dynamic communication policy enabling swift response to domest ic and internat ional developments. The Department of Communication (DoC) as the nodal wing has endeavoured to build and nurture a fruitful partnership between the Reserve Bank and the public through a two-way communication: transparent, timely and credible dissemination and feedback.
Agenda for 2014-15: Implementation Status
Refurbishing the Website
X.15 In April 2015, a refurbished website of the Reserve Bank was launched providing a more user friendly access to function-wise information, search facility and an accessibility toolbar for users with disabilities. The website is now integrated with two social media sites, Twitter and YouTube.
Accordingly, the Governor’s post monetary policy conferences were disseminated via YouTube this year in addition to usual live streaming media.
Awareness Campaigns and Outreach Programmes
X.16 In view of increasing public victimisation to fi ctitious offers, the Reserve Bank undertook a campaign jointly with the Ministry of Consumer Affairs under its ‘Jago Grahak Jago’ initiative to caution the public about the menace of fi ctitious mails. The public awareness drive was conducted in the print media. Besides, an awareness campaign was also carried out on security features of currency notes.
Workshops for Top Management, Officers and Media
X.17 During the year, two workshops on effective media management, one each for the top executives, and the newly appointed regional directors and chief general managers were conducted. A workshop on writing skills for managers and assistant general managers was also conducted. Besides, several informal briefi ngs/workshops were arranged for the media on the Reserve Bank’s reports and releases.
Review of Communication Policy
X.18 With the adoption of flexible inflation targeting, the role of communication has assumed further importance, particularly for anchoring
Public Interest
The Reserve Bank of India, in its actions and policies, seeks to promote public interest and the common good.
Integrity and Independence of Views
The Reserve Bank of India seeks to maintain the highest standards of integrity and independence of views through openness, trust and accountability.
Responsiveness and Innovation
The Reserve Bank of India seeks to be a dynamic organisation responsive to public needs and encourages innovation and a spirit of enquiry.
Diversity and Inclusiveness
The Reserve Bank of India cherishes and supports diversity and inclusiveness.
Introspection and Pursuit of Excellence
The Reserve Bank of India is committed to self-appraisal, introspection and professional excellence.
Vision
The Reserve Bank of India is committed to pursue public interest and common good as a leading central bank that is recognised for its credible, transparent and proactive policies.
ANNUAL REPORT
126
infl ation expectations. In this backdrop as also in view of several external and internal developments, the communication policy of the Reserve Bank is currently being reviewed by a Committee (Chairman: Dr. Michael D. Patra) which is expected to submit its report during 2015-16. Towards improving internal communication in the Reserve Bank, two Banking Hall events for Reserve Bank employees were arranged with the Governor, one in Bangalore and the other in Chandigarh in 2015.
Agenda for 2015-16
X.19 D u r i n g 2 0 1 5 - 1 6 , m u l t i - p r o n g e d e n g a g e m e n t / o u t r e a c h / c a m p a i g n s w i t h stakeholders along those held last year will be continued. It is planned to add social media like Facebook and LinkedIn to the Reserve Bank website, making it accessible to youth. A workshop for media in Nepal is scheduled to be conducted during 2015-16. Follow up steps will also be taken in the light of the forthcoming report of the Committee to Review the Communication Policy of the Reserve Bank.
HUMAN RESOURCE INITIATIVES
X.20 The Reserve Bank has a wide canvas of
operations, requiring a robust set of internal
capabilities to fulfill its mandate. The human
resource strategies and initiatives led by the Human
Resource Management Department (HRMD) are,
therefore, designed and developed as a two-way
interface between the environment, the internal
capacities, the setting of goals at the corporate level
as well as at the department and functional levels.
Agenda for 2014-15: Implementation Status
X.21 In 2014-15, organisational restructuring was
carried out by the Reserve Bank following a cluster
approach, that is, by clubbing closely related work
areas to better serve the evolving fi nancial sector
(Box X.2).
Training
X.22 The skill and knowledge development
initiatives focused on strengthening technical and
Box X.2Organisational Restructuring of the Reserve Bank
The Reserve Bank has, in the recent past, been deliberating on a range of strategic considerations for adopting a more fl exible and responsive organisational structure for enhanced performance in an increasingly dynamic business environment. As part of this process, a Committee on Organisational Restructuring of the Reserve Bank (Chairman: Shri Deepak Mohanty; Co-Chairman: Shri B. Mahapatra) was set up. Broadly based on the recommendations of the committee and the outcomes of an
(Contd....)
Table 1: Renaming of the departments
Old Nomenclature New nomenclature
Department of Banking Operations and Development (DBOD) Department of Banking Regulation (DBR)
Rural Planning and Credit Department (RPCD) Financial Inclusion and Development Department (FIDD)
Customer Services Department (CSD) Consumer Education and Protection Department (CEPD)
Department of Expenditure and Budgetary Control (DEBC) Corporate Strategy and Budget Department (CSBD)
elaborate internal consultative process, the organisational restructuring of the Reserve Bank was effected from November 3, 2014.
As part of the restructuring exercise, two new departments have been constituted in the Reserve Bank: (i) Department of Corporate Services, and (ii) International Department. Alongside, some of the existing departments have been rechristened and new units set up/being set up within some departments as detailed in Tables 1-3.

GOVERNANCE, HUMAN RESOURCES AND ORGANISATIONAL MANAGEMENT
127
behavioural skills so as to facilitate personal growth
and improve effectiveness at work. Six training
establishments of the Reserve Bank catered to its
training requirements (Table X.2).
Similarly the regional offi ces (ROs) of the Reserve Bank have been categorised into three tiers. Tier-I or Metro ROs will now comprise of four offi ces of the Reserve Bank in Mumbai, New Delhi, Kolkata and Chennai. Tier-II or Non-Metro ROs will comprise 14 ROs; (i) Ahmedabad; (ii) Bengaluru; (iii) Bhopal; (iv) Bhubaneswar; (v) Chandigarh; (vi) Guwahati; (vii) Hyderabad; (viii) Jaipur; (ix) Jammu; (x) Kanpur; (xi) Lucknow; (xii) Nagpur; (xiii) Patna; and (xiv) Thiruvananthapuram. Tier-III ROs will comprise of 10 small offi ces: (i) Agartala;
(ii) Belapur; (iii) Dehradun; (iv) Gangtok; (v) Kochi; (vi) Panaji; (vii) Raipur; (viii) Ranchi; (ix) Shillong; and (x) Shimla.
The restructured ROs depending on size and volume of work will have the following clusters:
Tier I and II will have four clusters: (i) Supervision, Market Intelligence and Research; (ii) Currency and Banking Services; (iii) Financial Inclusion and Customer Service; and (iv) Human Resources Management (HRM) and Infrastructure.
Tier III will have three clusters: (i) Supervision and Market Intelligence; (ii) Financial Inclusion/Financial Literacy, Public Awareness, Customer Service, and Research; and (iii) HRM and Infrastructure.
It is expected that this organisational restructuring will bring greater managerial synergies and also allow the Reserve Bank staff members to better develop their expertise in various key work areas.
Table 3: Creation of new units
Existing department Name of the new unit
Department of Statistics and Information Management (DSIM)
Data and Information Management Unit (DIMU) within DSIM.
Monetary Policy Department (MPD)
Forecasting and Modelling Unit within MPD.
Human Resource Management Department (HRMD)
HR Operations Unit within HRMD.
Financial Markets Regulation Department (FMRD)
Market Intelligence Unit within FMRD.
Table 2: Creation/carving out of new departments
Existing department Name of the new department Remarks
Urban Banks Department (UBD) Department of Cooperative Bank Regulation (DCBR)UBD will cease to exist
Department of Cooperative Bank Supervision (DCBS)
Financial Markets Department (FMD) Financial Markets Regulation Department (FMRD)FMD will cease to exist
Financial Markets Operations Department (FMOD)
Department of Non-Banking Supervision (DNBS) Department of Non-Banking Regulation (DNBR)Regulation hived off from DNBSDepartment of Non-Banking Supervision (DNBS)
Table X.2: Reserve Bank Training Establishments: Number of Programmes Conducted (July-June)
Training Establishment 2012-13 2013-14 2014-15
Programmes Participants Programmes Participants Programmes Participants
1 2 3 4 5 6 7
RBSC, Chennai 126 2,676 105 2,560 141 2,626*
CAB, Pune 164 5,105 127 3,909 215 7,183@
4 ZTCs (Class I) 116 2,526 99 2,222 104 2,215
4 ZTCs (Class III) 64 1,492 70 1,510 98 2,036
4 ZTCs (Class IV) 58 1,184 37 725 53 1,041
*: Includes 30 foreign participants; @: Includes 63 foreign participants; RBSC: Reserve Bank Staff College, Chennai; ZTC: Zonal Training Centre.
Training at External Institutions
X.23 During 2014-15, a number of offi cers were deputed to participate in training programmes, seminars and conferences organised by external

ANNUAL REPORT
128
management/banking institutions in India and
abroad (Table X.3). Further, a number of Class III
and Class IV employees were trained in external
institutions in India.
Golden Jubilee Scholarship and Study Leave
X.24 Under the Golden Jubilee Scholarship
Scheme, six officers were selected to pursue
higher studies in reputed universities abroad. Ten
officers availed study leave under different
schemes for pursuing higher studies during the
year. Further, 599 employees pursued select part-
time/distance education courses under the
Reserve Bank’s incentive scheme.
Grants and Endowments
X.25 Towards promoting research, training and
consultancy in the banking and fi nancial sector,
the Reserve Bank provided financial support
of `300 million to the Indira Gandhi Institute of
Development Research (IGIDR), Mumbai; `140
million to the Centre for Advanced Financial
Research and Learning (CAFRAL), Mumbai; ̀ 18.4
million to the National Institute of Bank Management
(NIBM), Pune; `6.9 million to the Indian Institute
of Bank Management (IIBM), Guwahati; and `10
million to the London School of Economics (LSE)
India observatory and the IG Patel Chair.
RBIQ
X.26 Almost 5,000 schools and 10,000 students
participated in RBIQ 2014, an all-India inter-school
quiz launched by the Reserve Bank in 2012. It was
held at 62 different locations all over India. The
zonal and national finals were conducted in
Mumbai and telecast on Doordarshan’s National
Channel.
Industrial Relations
X.27 Industrial relations remained by and large
peaceful during 2014-15. Periodic meetings were
held with recognised associations of offi cers and
employees/workmen on various issues relating to
service conditions and welfare of employees.
Superannuation Benefi ts
X.28 In 2003, the Reserve Bank, with the
approval of the Central Board, had made some
improvements in the monthly pension paid to
employees who retired prior to November 1, 1997.
However, the government had observed that the
improvements in the pension scheme could not be
effected without suitably amending Regulation 2(2)
of the RBI Pension Regulations, 1990 and
requested the Reserve Bank for their withdrawal.
In October 2008, these improvements in monthly
pension were withdrawn by the Central Board. This
was, however, challenged in the High Court of
Judicature in Bombay, where the Hon’ble High
Court set aside the Reserve Bank’s circular
regarding withdrawal of improvements. Since then,
there has been persistent demand from all the
pensioners/retirees for improvements in pensions.
However, the matter remains unresolved till date,
though the Reserve Bank and the Government are
fully engaged with the issue.
Recruitment and Staff Strength
X.29 With the recruitment of 784 employees in
2014, the total staff strength as on December 31,
2014, stood at 16,794 as compared with 17,360 a
Table X.3: Number of Offi cers Trained in External Training Institutions in India
and Abroad
Year Trained in India Trained abroad
1 2 3
2012-13 874 510
2013-14 798 530
2014-15 913 562
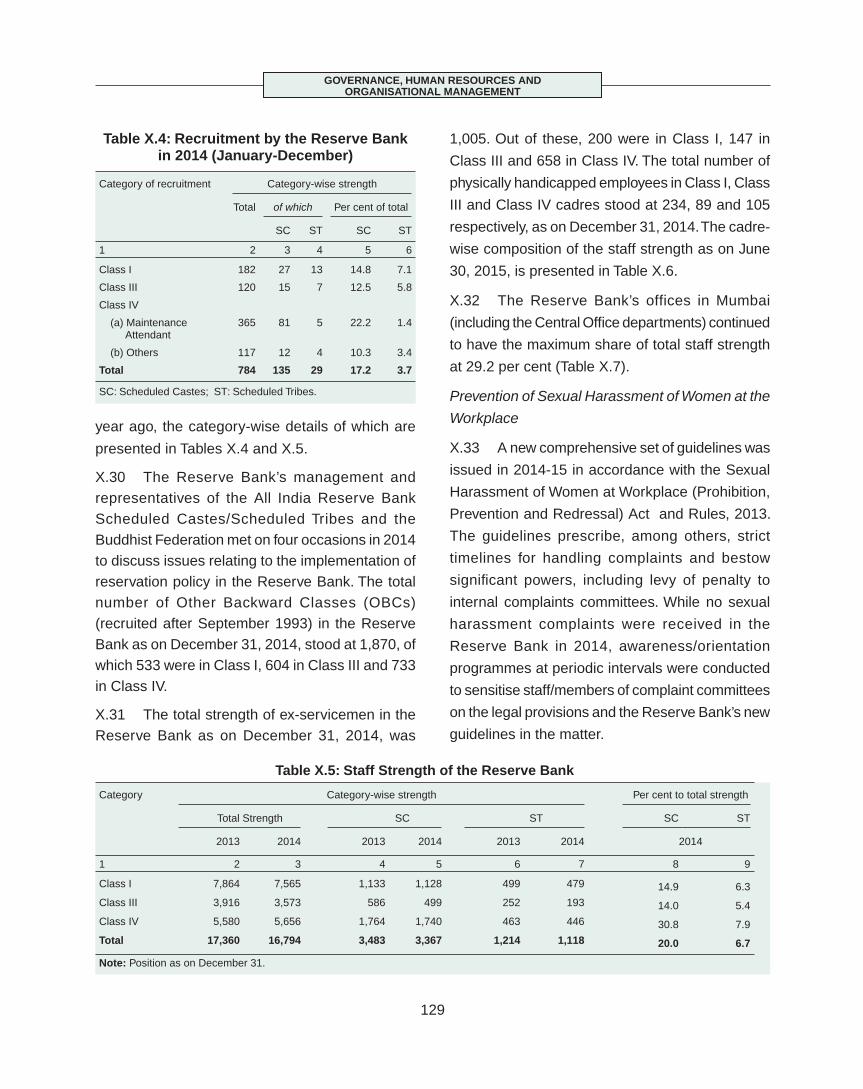
GOVERNANCE, HUMAN RESOURCES AND ORGANISATIONAL MANAGEMENT
129
year ago, the category-wise details of which are
presented in Tables X.4 and X.5.
X.30 The Reserve Bank’s management and representatives of the All India Reserve Bank Scheduled Castes/Scheduled Tribes and the Buddhist Federation met on four occasions in 2014 to discuss issues relating to the implementation of reservation policy in the Reserve Bank. The total number of Other Backward Classes (OBCs) (recruited after September 1993) in the Reserve Bank as on December 31, 2014, stood at 1,870, of which 533 were in Class I, 604 in Class III and 733 in Class IV.
X.31 The total strength of ex-servicemen in the Reserve Bank as on December 31, 2014, was
1,005. Out of these, 200 were in Class I, 147 in
Class III and 658 in Class IV. The total number of
physically handicapped employees in Class I, Class
III and Class IV cadres stood at 234, 89 and 105
respectively, as on December 31, 2014. The cadre-
wise composition of the staff strength as on June
30, 2015, is presented in Table X.6.
X.32 The Reserve Bank’s offices in Mumbai
(including the Central Offi ce departments) continued
to have the maximum share of total staff strength
at 29.2 per cent (Table X.7).
Prevention of Sexual Harassment of Women at the
Workplace
X.33 A new comprehensive set of guidelines was
issued in 2014-15 in accordance with the Sexual
Harassment of Women at Workplace (Prohibition,
Prevention and Redressal) Act and Rules, 2013.
The guidelines prescribe, among others, strict
timelines for handling complaints and bestow
signifi cant powers, including levy of penalty to
internal complaints committees. While no sexual
harassment complaints were received in the
Reserve Bank in 2014, awareness/orientation
programmes at periodic intervals were conducted
to sensitise staff/members of complaint committees
on the legal provisions and the Reserve Bank’s new
guidelines in the matter.
Table X.4: Recruitment by the Reserve Bank in 2014 (January-December)
Category of recruitment Category-wise strength
Total of which Per cent of total
SC ST SC ST
1 2 3 4 5 6
Class I 182 27 13 14.8 7.1
Class III 120 15 7 12.5 5.8
Class IV
(a) Maintenance Attendant
365 81 5 22.2 1.4
(b) Others 117 12 4 10.3 3.4
Total 784 135 29 17.2 3.7
SC: Scheduled Castes; ST: Scheduled Tribes.
Table X.5: Staff Strength of the Reserve Bank
Category Category-wise strength Per cent to total strength
Total Strength SC ST SC ST
2013 2014 2013 2014 2013 2014 2014
1 2 3 4 5 6 7 8 9
Class I 7,864 7,565 1,133 1,128 499 479 14.9 6.3
Class III 3,916 3,573 586 499 252 193 14.0 5.4
Class IV 5,580 5,656 1,764 1,740 463 446 30.8 7.9
Total 17,360 16,794 3,483 3,367 1,214 1,118 20.0 6.7
Note: Position as on December 31.

ANNUAL REPORT
130
Right to Information (RTI)
X.34 The Reserve Bank received 8,044 requests
for information and 1,021 fi rst appeals under the
RTI Act during 2014-15, all of which were attended
to. Effective February 27, 2015, the Reserve Bank
has aligned with the RTI online portal of the
Government enabling the public to fi le online RTI
applications and fi rst appeals with the Reserve
Bank. Four training programmes on the RTI Act for
employees were conducted at the Reserve Bank’s
training centres.
Samadhan and Other Initiatives
X.35 The Reserve Bank has undertaken a HR
transformation project, named Samadhan, to
deliver uniform, automated and rule-based HR
services to its employees, including payroll and
employee benefi ts. The Samadhan application,
based on SAP will be available to employees on
desktop, mobile and tablet platforms on a 24x7x365
basis irrespective of location. The workfl ows of
Samadhan will have minimum human intervention
for expeditious delivery of services. With the launch
of Samadhan, an HR Operations Unit has been set
up at Bengaluru to centrally process establishment
Table X.6: Reserve Bank's Staff Strength(as on June 30, 2015)
Grade Staff Strength
1 2
Grade A 4,077
Grade B 1,552
Grade C 1,025
Grade D 271
Grade E 353
Grade F 101
Total in class I 7,379
Special Assistant 815
Senior Assistant 247
Assistant 2,381
Word Processor Assistant 173
Secretarial Assistant 32
Others 272
Total in class III 3,920
Maintenance Staff 1,395
Technical Staff 135
Service Staff 3,127
Others 715
Total in class IV 5,372
Total Staff Strength 16,671
Table X.7 : Reserve Bank's Offi ce-wise Staff Strength
(As on June 30, 2015)
Offi ce (including sub-offi ces)
Class I Class III Class IV Total
1 2 3 4 5
Agartala 10 5 0 15Ahmedabad 275 168 231 674Belapur 132 53 178 363Bengaluru 460 185 220 865Bhopal 153 126 123 402Bhubaneswar 148 115 170 433Chandigarh 195 105 117 417Chennai 433 340 354 1,127Dehradun 19 6 2 27Gangtok 8 0 0 8Guwahati 195 136 187 518Hyderabad 311 158 243 712Jaipur 216 148 181 545Jammu @ 97 56 59 212Kanpur 215 164 267 646Kochi 33 34 29 96Kolkata 482 427 442 1,351Lucknow 150 106 146 402Mumbai 609 325 959 1,893Nagpur 240 205 234 679New Delhi 501 236 294 1,031Panaji, Goa 16 3 3 22Patna 181 144 218 543Pune-CAB-CRDC-ITP 66 37 69 172Raipur 20 6 0 26Ranchi 16 7 0 23Shillong 9 5 0 14Shimla 14 6 0 20Thiruvananthapuram 209 115 131 455Total 5,413 3,421 4,857 13,691CODs # 1,966 499 515 2,980Grand Total 7,379 3,920 5,372 16,671
CAB : College of Agricultural Banking;CRDC: Central Records and Documentation Centre;ITP : IMF Training Programme, Pune.@ : Includes Srinagar Sub-Offi ce. # : Central offi ce departments including DICGC.
GOVERNANCE, HUMAN RESOURCES AND ORGANISATIONAL MANAGEMENT
131
transactions of all employees. It has also been
decided to set up a business continuity site in New
Delhi. With a view to rationalising administrative
costs, a Centralised Administrative Unit in Mumbai
has been established to cater to the needs of all
Central Offi ce departments in Mumbai.
Performance Management System (PMS) and Job
Profi les
X.36 Key Result Area (KRA)-based PMS is in
vogue from 2013-14 coupled with a ranking model
from the fi rst cycle of review. Further, job profi les
across work areas are being compiled for identifying
required competencies, developing these
competencies and standardising for similar
positions across regional offi ces. The job profi les
for senior offi cers will be fi nalised by September
2015 and for offi cers in Grade ‘B’ and ‘C’ by March
2016.
Senior Management Retreat and Other
Developments
X.37 The Reserve Bank’s Senior Management
Retreat for 2014 was held in Mussoorie with the
broad theme, ‘RBI @80: Looking Back, Looking
Ahead’. As part of inter-institutional arrangement
for knowledge sharing, a joint international seminar,
‘Financial Stability: Issues and Concerns’ was held
in collaboration with the E uropean Central Bank
(ECB) at the College of Agricultural Banking, Pune
in May 2015.
Agenda for 2015-16
X.38 Taking forward the efforts to evaluate
capabilities available within the organisation, HRMD
plans to work in 2015-16 on all associated HR areas
like recruitment, placement mechanisms, fine-
tuning the internal processes post organisational
restructuring, talent spotting, talent management
and continuous capacity building. These initiatives
are likely to contribute towards more open and
transparent HR and administration processes and procedures.
RBI Academy
X.39 The Reserve Bank plans to set up an Academy as a residential facility with state-of-the-art infrastructure in Navi Mumbai, primarily for integrated learning and development of its staff including e-learning. Going forward, the Academy will also conduct training for foreign central banks including those from South Asian Association for Regional Cooperation (SAARC) and other regions to promote external cooperation and cross learning.
A Competency based HR Framework
X.40 Going forward, the HR framework is envisaged to be competency based for career planning, placement, targeted learning and succession planning, leading to integrated HR processes. Therefore, a functional and behavioural competency set for each job role needs to be assessed coupled with the evaluation of competencies of the available human resources. Assessment centres will be set up for assessing the behavioural competency mapping of the staff.
Structured e-learning
X.41 The Reserve Bank is introducing structured e-learning for its staff. In the fi rst phase, e-learning modules will primarily be umbrella courses targeted at larger groups of staff members and specifi c courses positioned as complementary to classroom courses. In addition, webinars will be used for wider dissemination of knowledge.
Common Cadre Recruitment
X.42 There will be a common recruitment process for offi cers in Grade B from 2015 onwards. For this purpose, a new scheme of selection is being framed in consultation with the Reserve Bank of India Services Board and the Institute of Banking Personnel Selection. The recruitment cycle is
ANNUAL REPORT
132
expected to shorten with the forthcoming new scheme of selection. Phase I examination for common recruitment is likely to be held in November 2015.
ENTERPRISE-WIDE RISK MANAGEMENT IN THE BANK
X.43 The adoption of the Enterprise-wide Risk Management (ERM) framework in February 2012 by the Reserve Bank marked a move from a ‘silo-based’ approach to a ‘whole-of-business’ perspective to risk management. Accordingly, the Risk Monitoring Department (RMD) envisaged a three-phased ERM rollout plan for the Reserve Bank.
X.44 As per the three-lines-of-defence approach to ERM adopted by the Reserve Bank, the Business
Areas (BAs) represent the fi rst line of defence as
the BAs identify and manage their respective risks,
while the Risk Monitoring Department (RMD) as
the second line supports all BAs in the identifi cation
of signifi cant risks, formulates risk policies, provides
a risk assessment methodology, reports the risks
to the Risk Governance Structure (RGS) and works
to foster a risk culture in the Reserve Bank (Box
X.3). Finally, the Internal Audit function which
constitutes the third line of defence provides risk
assurance to RGS through the risk-based audit
process.
Agenda for 2014-15: Implementation Status
X.45 The risk-reporting structure was put in place
in 2013-14 with the development of guidelines and
Box X.3Operational Risk Monitoring Framework in Central Banks
The Basel Committee on Banking Supervision defi nes operational risk (OR) as ‘the risk of loss resulting from inadequate or failed internal processes, people and systems or from external events’. Central banks too are exposed to operational risks and, being risk-sensitive institutions, closely monitor their actual and potential operational risk exposures. However, there are no international benchmarks for monitoring operational risks in central banks. The International Operational Risk Working Group (IORWG) of over 61 central banks, including the Reserve Bank of India and the Bank for International Settlements acts as a centre of competence on Operational Risk Management (ORM). The ORM framework adopted by most of the central banks typically includes a risk assessment methodology, risk repositories and heat map(s), apart from incident reporting systems and periodic risk surveys.
Risk assessment methodology generally uses a combination of the likelihood of occurrence and severity of impact of a risk event to rate its riskiness on a graduated scale (say, high, signifi cant or acceptable). The likelihood of occurrence of a risk event could be derived from both quantitative and qualitative factors. The impact of occurrence of an operational risk event on an organisation could be classifi ed as fi nancial impact, disruption in business operations / customer service, (negative) impact on reputation of the entity, or a combination of any of the three.
Risk Repository, also called Risk Register, contains the enumeration of each process/activity of an entity, the description of its associated risks at the inherent level, the controls in place to mitigate the inherent risks and the remaining, that is, Residual Risk after taking the controls into account.
Heat Map is a visual representation of the risk profi le of a business area as it provides a colour-coded presentation of various risks. The heat map also depicts the migration of processes across risk zones on account of application of controls. The Incident Reporting System creates institutional memory on OR incidents with a view to promoting organisational learning and quantifi cation of OR for building capital buffers. Risk surveys, on the other hand, enable on-going updating of the risk profi le of the organisation by capturing existing as well as emerging risks in the operating environment.
As the risk culture of an organisation impacts the very identifi cation and, thus, the articulation of its risks, a campaign has been launched by the Reserve Bank to enhance risk awareness among its staff so as to deepen and widen the risk culture in the institution. This will be reinforced by providing a computerised environment for risk monitoring to enable access to a risk database by Business Areas. Also, work is underway for implementing a consistent approach to rating of risks in the Reserve Bank. Risk surveys will continue to be used as a tool for identifi cation and monitoring of emerging risks in Business Areas as well as for the Reserve Bank as a whole.
GOVERNANCE, HUMAN RESOURCES AND ORGANISATIONAL MANAGEMENT
133
templates for preparation of risk registers for generating risk profi les of the BAs along with the establishment of an Incident Reporting System for building an institutional memory of actual and near-miss incidents. Five of the identifi ed BAs have completed the Risk Registers and work is in progress in 27 other BAs. A vigorous risk management awareness campaign for strengthening
the risk culture in the Reserve Bank was initiated during the year.
X.46 A draft Economic Capital Framework (ECF) for the Reserve Bank was formulated during the year to assess the Reserve Bank’s capital and internal reserves position in a structured and systematic manner (Box X.4). Besides, designing and implementing a Risk Appetite Framework
Box X.4Risk Management and Economic Capital in Central Banks
The public policy mandate of central banks makes the context of their risk management materially different from that of commercial entities, and necessitates the focus of their risk management to be on preserving and facilitating their policy effi cacy, rather than profi t maximisation. This principle of ‘policy predominance’ in pursuit of public interest often requires central banks to assume considerable fi nancial risks on their balance sheets. For instance, the Reserve Bank of India maintains national forex reserves, constituting almost three-fourth of its balance sheet, in fulfi lling its core purpose of fostering confi dence in the external value of the rupee. While the reserves do buffer the country against external shocks, they also expose the Reserve Bank to considerable exchange rate risks. Such risks, which cannot be hedged, have to be carried by the Reserve Bank.
A central bank’s role in fostering monetary and fi nancial stability also exposes it to a wider range of risks, including losses arising from market interventions, lender of last resort (LOLR) role, market maker of last resort (MMLR) role and quasi-fi scal operations. Importantly, these mandates can at times require central banks to adopt a counter-intuitive approach to risk and assume increased risk on to their balance sheet, during times of systemic fi nancial stress in order to de-risk the fi nancial system.
A central bank’s risks can be substantial and, consequently, its losses are neither as rare nor insignifi cant as is usually assumed. In the recent period, while a number of central banks in developed economies have suffered losses, central banks in emerging/developing economies suffered losses through the 1980s and 1990s also. Interestingly, this happened despite the seigniorage income accruing all along to these central banks, which is an important source of their fi nancial strength.
Given these unique challenges, the general approach towards fi nancial risk management in central banks is that while they do not actively manage risks arising from policy
(Contd....)
actions, they seek to ensure that their balance sheets have suffi cient fi nancial resilience to absorb these risks. Thus, they maintain suffi cient economic capital, supplemented by risk-transfer/dividend-smoothening mechanisms.
Central banks as providers of domestic liquidity require capital not to remain going concerns but to ensure policy effi cacy and credibility with regard to the ability to achieve their objectives. Weak fi nances can move central banks to either rely on generating excessive seigniorage income, which may come in confl ict with their price-stability objective, or seek recapitalisation from the government, which could impact their autonomy.
The capital requirements of a central bank can vary considerably depending on a number of factors, inter alia:
The size of shocks and scope of a central bank’s mandate: The wider the area of responsibilities of a central bank, greater the risks and, hence, higher the requirement of capital.
The accounting policy framework adopted by central banks: Central banks which periodically recognise changes in valuation of assets will see greater variability in their fi nancial positions, which increases capital requirements.
Institutional arrangements: Statutory provisions for a central bank’s recapitalisation as well as risk transfer mechanisms can reduce its capital requirements, though not eliminate them.
The fi scal space available with the sovereign: A central bank may require recapitalisation, precisely at a time when the fi scal position is under strain, say, due to a fi nancial crisis. This strengthens the case for ex ante capitalisation of a central bank, rather than ex post recapitalisation.
The European Central Bank and the central banks of Australia, Austria, Belgium, France, Finland, Germany,

ANNUAL REPORT
134
(RAF) for the Reserve Bank was also envisaged during the year.
Agenda for 2015-16
X.47 In the coming year, ECF is expected to be refi ned and implemented in the Reserve Bank. RAF, which is under development, is also planned for induction. The fi nalisation of risk registers of all BAs will bring out the risk profi le/heat map of each BA, regional offi ce and the organisation as a whole. The Incident Reporting System will help identify patterns across incidents with a view to effectively preventing/managing such events in the future. Risk surveys will be conducted to support the monitoring of the emerging risks as also to review top risks. Efforts for creating risk awareness at all levels and across all locations will continue to be pursued for deepening the risk culture in the organisation.
INTERNAL AUDIT/INSPECTION IN THE RESERVE BANK
X.48 Internal audit/inspection undertaken by the Inspection Department of the Reserve Bank examines and reports on the adequacy and reliability of its risk management, internal controls and governance processes under a robust risk based internal audit (RBIA) framework and provides regular feedback to the Audit and Risk Management Sub-Committee (ARMS) of the Central Board.
Agenda for 2014-15: Implementation Status
X.49 The audit plan for January-December 2014 was fully implemented. A panel of information system (IS) auditors was prepared, training imparted and IS audits are being carried out by these empanelled auditors as part of RBIAs. A seminar on ‘Internal Audit and Enterprise-wide Risk Management for Central Bankers in the SAARC Region’ was held in February 2015. The plan for a comprehensive Audit Management System (AMS) could not materialise as the risk registers were being prepared in various central offi ce departments (CODs). As regards vulnerability assessment and penetration testing (VAPT), a Technical Advisory Group (TAG) has been constituted to empanel external auditors for carrying out VAPT.
Agenda for 2015-16
X.50 For 2015-16, the department will focus on: i) ensuring a smooth and seamless transition from a largely compliance based audit to RBIA on the basis of risk registers in CODs/regional offi ces (ROs); ii) identifying an appropriate AMS application suitable for the Reserve Bank which will provide an integrated solution for audit process; iii) undertaking VAPT of corporate e-mail and real time gross settlement (RTGS) applications; iv) appointing concurrent auditors as per the revised procedure /parameters; and v) developing appropriate guidelines for project audits with respect to all new
Italy, Netherlands, Norway, New Zealand, Singapore and Sweden use methodologies, such as value-at-risk, expected shortfall, stress tests and other risk models to determine their adequacy of reserves/risk provisions. The central bank of New Zealand has in place a well-developed economic capital framework to model its capital requirements. The Reserve Bank of India is also seeking to put in place an economic capital framework. The exercise is a challenging one as the Reserve Bank plans to cover not only the risks in its balance sheet but also its ‘contingent risks’ which arise from its public policy role in fostering monetary and fi nancial stability.
References:
Bascand, Geoff (2015), ‘Central bank performance, fi nancial management and institutional design’, Speech at the National Asset-Liability Management Europe Conference, London, March 12.
Cukierman A. (2011), ‘Central Bank Finances and Independence – How Much Capital Should a Central Bank Have?’ in S. Milton and P. Sinclair (eds), The Capital Needs of Central Banks.
Schobert, F. (2008), ‘Why do central banks make losses?’ Central Banking Journal, February.
GOVERNANCE, HUMAN RESOURCES AND ORGANISATIONAL MANAGEMENT
135
estate, IT related and other projects and also assisting the respective user departments in their implementation.
INTERNATIONAL RELATIONS
X.51 In the aftermath of the global fi nancial crisis and growing engagement with multilateral institutions, the Reserve Bank constituted a dedicated International Department as in many other central banks. The department acts as the nodal point for international fi nancial diplomacy to further India’s national interests and seeks to play a pivotal role in international macroeconomic coordination and global regulatory standard-setting.
Agenda for 2014-15: Implementation Status
Central Bank Swap Arrangements
X.52 The depar tment carried forward the background work on the BRICS (Brazil, Russia, India, China and South Africa) Contingent Reserve Arrangement (CRA). This contributed to the signing of the CRA Treaty on July 15, 2014 in Fortaleza, and the Inter-Central Bank Agreement (ICBA) on July 7, 2015 in Moscow. The Reserve Bank provided US$ 400 million support to the Central Bank of Sri Lanka under the SAARC swap arrangement and a further US$ 1.1 billion facility under a special/ad hoc swap agreement.
Engagement with Multilateral Institutions
X.53 As the nodal agency, the department coordinated the work relating to the Basel Committee of Banking Supervision (BCBS), Committee of Global Financial System (CGFS) and Committee on Payments and Market Infrastructures (CPMI). The department also coordinated with various standing committees/groups of the Financial Stability Board (FSB). In the G20 forum, work relating to the Framework Working Group (FWG) and the Investment and Infrastructure Working Group (IIWG) were attended to. The department coordinated the Article IV consultation with International Monetary Fund (IMF) and has
also been engaged in issues of the General Review of Quotas.
SAARCFINANCE (SF)
X.54 Amongst the SF initiatives, the Reserve Bank and the State Bank of Pakistan have initiated, along with other SAARC countries, a collaborative study on capital fl ows. The SF scholarship scheme, implemented through the department, awarded four scholarships for the academic year 2015-16. In the second half of 2014-15, after the constitution of the department, it handled visits by 23 foreign groups/ delegations to the Reserve Bank.
Agenda for 2015-16
X.55 In 2015-16, the department will work towards operationalisation of CRA, creation of a SF database, preparing position papers on key issues of negotiations in the global fora, coordination of the FSB Peer Review, Financial Sector Assessment Programme (FSAP) by the Fund-Bank and Article IV consultations with IMF. India will be assuming the BRICS chairmanship in 2016. Working out meetings, agendas and plans for this in coordination with the Government, will also occupy the attention of the department.
GOVERNMENT AND BANK ACCOUNTS
X.56 The Department of Government and Bank Accounts (DGBA) looks after the accounts of the governments as well as the Reserve Bank. In the area of accounting and its presentation, the Reserve Bank has been moving towards greater transparency through its annual accounts/fi nancial statements. For transparent conduct of government banking business and its own internal accounting processes, the Reserve Bank has been leveraging on IT resources to provide better and more effi cient services.
Agenda for 2014-15: Implementation Status
X.57 Some of the accounting policy changes as suggested by statutory auditors and Technical
ANNUAL REPORT
136
Committees (I and II) were implemented. Accordingly, repo and reverse repo transactions are now being treated as lending and deposit transactions respectively as against sale and purchase transactions earlier. Further, changes in policies on capitalisation/depreciation of building and machinery, impaired assets and recognition of accrued dividend were effected.
Agenda for 2015-16
X.58 In line with the recommendations of Technical Committee-I, the formats of weekly accounts, balance sheet and profi t and loss account were revised with effect from July 17, 2015, in consultation with the Government, by amending the RBI Act, 1934 and the RBI General Regulations, 1949. Technical Committee-I had recommended that rupee securities be carried at fair value and any unrealised gain or loss be transferred to the Investment Revaluation Account. This will be made applicable from 2015-16.
X.59 A Working Group constituted in February 2015 to review the system of inspection of government business in agency banks is expected to submit its report by end-August 2015. Accordingly, inspection of government business in agency banks is set to be revamped. A Working Group on Business Process Reengineering (BPR) of government business comprising members from concerned government agencies, the Reserve Bank and agency banks is expected to submit its report by October 2015. BPR for government business will be undertaken subsequently.
MANAGING FOREIGN EXCHANGE RESERVES
X.60 The Department of External Investments and Operations (DEIO) manages the country’s foreign exchange reserves. With its increasing size, it has become imperative to strengthen the accounting, valuation methods, risk management practices and IT infrastructure including disaster
management for the purpose of managing the foreign exchange reserves.
Agenda for 2014-15: Implementation Status
X.61 During the year, market and asset class diversifi cation was pursued within the over-arching framework of safety, liquidity and returns, under the overall guidance of the high level and internal strategy committees. In line with Technical Committee-II’s recommendations, the accounting refi nements were carried out by June 30, 2014, for forward contracts, entered into by the Reserve Bank for intervention operations, and swaps at off-market rates that are in the nature of repos. The existing treasury system was replaced by a new state-of-the-art system in October 2014 and integrated into the Reserve Bank’s Core Banking Solution. Certain international best practices for managing credit, market and operational risks were implemented during the year and documented. A more robust disaster recovery mechanism with a focus on regular drills has been put in place.
Agenda for 2015-16
X.62 The remaining recommendations of Technical Committee-II, particularly relating to valuation changes in foreign currency assets (FCA) and gold, are on the agenda for 2015-16. The Reserve Bank aims to stabilise live operations from alternate locations towards mitigating the impact of disaster induced disruptions. The Reserve Bank will continue its efforts at refi ning the strategy and tactics of portfolio management to enhance returns in a low earning environment without sacrifi cing the objectives of liquidity and safety.
ECONOMIC AND POLICY RESEARCH
X.63 Research is a critical activity in central banks. In the Reserve Bank, the Department of Economic and Policy Research (DEPR) is entrusted with the task of providing research inputs and MIS (management information system) services in economic and policy related issues. The department
GOVERNANCE, HUMAN RESOURCES AND ORGANISATIONAL MANAGEMENT
137
is envisaged to evolve and establish itself as a knowledge centre in policy-oriented research in macroeconomics and monetary policy issues. The department pursues an issue-based medium-term research agenda.
Agenda for 2014-15: Implementation Status
X.64 The department brought out its fl agship publications - Annual Report, Study on State Finances and RBI Bulletin. Four outreach seminars were held at various centres, mostly universities, during the year to disseminate the main messages of the Annual Report 2013-14 of the Reserve Bank. The print-version of the Weekly Statistical Supplement (WSS) was discontinued from January 2015 while ensuring its online availability. There was regular compilation and dissemination of primary statistics on monetary aggregates, balance of payments, external debt, household fi nancial savings and fl ow of funds. During the year, work relating to the Reserve Bank’s history Volume V covering the period 1997-2007 was initiated.
X.65 During 2014-15, 40 research papers were completed, of which nine were published in external domestic and foreign journals. Besides, the Reserve Bank Occasional Papers (the research journal of the Reserve Bank) carried seven research papers. The research papers covered multiple areas of interest: infl ation dynamics, exchange rate, asset quality in the banking sector, monetary policy transmission, fi nancial stability and impact of taper talk. Towards promoting research, several initiatives were undertaken in 2014-15, such as instituting best research paper award, allowing co-authorship by the Reserve Bank staff with outside researchers/ experts for the Reserve Bank Working Papers and Occasional Papers and outlining a code of conduct for the researchers.
X.66 Notable events organised by the department included a seminar on ‘Economic Outlook and Monetary Policy in the United States’ by Mr Stanley Fischer, Vice Chairman, US Federal Reserve on February 11, 2015. Another significant event,
‘Conversation with Ms Christine Lagarde, MD, International Monetary Fund (IMF)’ was organised on March 17, 2015. The 3rd RBI Chair Professors’ and DEPR Researchers’ Joint Conference was held during the year, which involved presentations of papers on a range of issues under the broad theme ‘Managing Risks and Macro-imbalances’. Besides, several seminars on diverse themes were organised as part of the DEPR study circle with the participation of external experts.
Agenda for 2015-16
X.67 Going forward, the research areas envisaged to be covered during 2015-16 include growth and investment, exchange rate, monetary policy transmission lags, issues in financial markets, potential output, optimal monetary policy rule, pass-through of international prices to domestic prices and pass-through of food and fuel infl ation to core infl ation. The department proposes to organise a number of seminars/ lectures during 2015-16. MIS is proposed to be modifi ed and the publications will be rationalised. The drafting of history Volume V will be taken up with the constitution of a full fl edged History Cell.
STATISTICS AND INFORMATION MANAGEMENT
X.68 The Department of Statistics and Information Management (DSIM) makes available macro-financial statistics to the public and provides statistical support and analytical inputs to the policy and operational needs of the Reserve Bank by managing comprehensive statistical systems relating to banking, corporate and the external sectors, undertaking structured surveys, maintaining the Reserve Bank’s data warehouse, engaging in statistical analyses and forecasting.
Agenda for 2014-15: Implementation Status
Data Management, Dissemination and Publications
X.69 The department released statistics relating to banking, corporate and external sectors as per
ANNUAL REPORT
138
the time schedule and with reduction in time-lag wherever possible. Data from corporate regulatory fi ling with the Ministry of Corporate Affairs was used for estimating saving and capital formation and private corporate performance analyses. The periodicity of the Co-ordinated Portfolio Investment Survey (CPIS) was increased from annual to bi-annual. Banks were involved in implementation of Stage-2 enhancements in international banking statistics (IBS) through workshops and a pilot survey.
X.70 Quarterly BSR-1 data covering individual bank accounts was released for the fi rst time. The scope of eXtensible Business Reporting Language (XBRL)-based return submission was broadened with 23 new returns and developmental work for another 23 returns is at an advanced stage. Harmonisation of banking statistics, guiding banks in proper implementation of the automated data fl ow (ADF) system and linking the XBRL system to it was taken up during the year. A Credit Repository has been developed on the basis of the Report on Large Credit, wherein as part of system-wide standardisation efforts, Income Tax-Permanent Account Number (IT-PAN) has been introduced for borrower identifi cation.
Surveys and Research
X.71 The periodicity of a few surveys designed for providing inputs to monetary policy formulation was synchronised with the policy announcement cycle. Efforts were made to impart methodological improvements in surveys under the guidance of the Technical Advisory Committee on Surveys (TACS). An article based on the salient results of the Residential Asset Price Monitoring Survey was also released. The framework for forecasting has been updated and a quarterly macro-econometric model has been operationalised. Several research studies were contributed to the Reserve Bank Working Paper Series/other publications/ academic conferences.
Agenda for 2015-16
X.72 DSIM will move towards the implementation of Bank for International Settlements-Committee on the Global Financial System recommended Stage-2 enhancements to IBS. A comprehensive guide for the current statistics section of the Reserve Bank of India Bulletin will be released. Phase III of the XBRL project will be launched to ensure standardised reporting for more returns where banks will be persuaded to orient their ADF systems to XBRL reporting. Work relating to harmonisation of banking statistics will be pursued. The database on Indian economy (DBIE) infrastructure will be used for developing a SAARCFINANCE regional statistical database and compilation of ‘Handbook of SAARCFINANCE’. Research studies will be undertaken in the area of corporate sector performance, expectation channel and forecasting of macro variables.
LEGAL MATTERS
X.73 The Legal Department of the Reserve Bank provides counsel and support to other departments ensuring that the policy decisions, actions and position taken by the Reserve Bank in various fora are legally sound and defensible. The department also guides the Reserve Bank in matters relating to the RTI Act.
Agenda for 2014-15: Implementation Status
X.74 During the year, a large number of appeals and writ petitions were fi led before the Supreme Court against the judgments rendered by the Gujarat and Madras High Courts, challenging the constitutional validity of Section 2(1) (o) of the Securitisation and Reconstruction of Financial Assets and Enforcement of Security Interest Act, 2002 relating to classifi cation of non-performing assets. The Supreme Court has since declared the provision as constitutionally valid.
X.75 The High Court of Gujarat in the case of Ionic Metalliks vs. Union of India had to deal with a case which, inter alia, challenged the Reserve

GOVERNANCE, HUMAN RESOURCES AND ORGANISATIONAL MANAGEMENT
139
Bank’s Master Circular on Wilful Defaulters and the action taken by certain banks on the basis of that circular. While upholding the authority of the Reserve Bank to issue the circular, the Court, however, held that making the circular applicable to all directors, irrespective of their involvement and responsibility, would neither be appropriate nor reasonable.
Agenda for 2015-16
X.76 Going forward, issues pertaining to the recommendations of Financial Sector Legislative Reforms Commission (FSLRC) and the enactment of the Indian Financial Code (IFC) are likely to be focused. Besides, certain amendments to the various Acts administered by the Reserve Bank need to be pursued in order to meet certain international commitments and standards and to clarify and clean up some provisions.
CORPORATE STRATEGY AND BUDGETING
X.77 The Corporate Strategy and Budget Department (CSBD) was carved out of the erstwhile Department of Expenditure and Budgetary Control as part of organisational restructuring in 2014. A key function of CSBD is formulating the budget of the Reserve Bank by adopting activity based and zero based budgeting, as also the need for allocating resources optimally. Expenditure is monitored through a quarterly review to the CCB. During 2014-15, CSBD held several rounds of interaction with Regional Directors (RDs), budget offi cers of ROs and CODs to sensitise them to use the budget process as a tool for expenditure monitoring and to focus on activities planned.
Agenda for 2015-16
X.78 The remit of the department going forward, is to identify the Reserve Bank’s strategic priorities and allocate resources accordingly. With respect to funded external institutes, CSBD’s focus will be to minimise funding of their revenue expenditure over a period of three years while supporting their research and capital expenditure. CSBD is
formulating a business continuity management (BCM) policy by June 2016. Payment of salaries and staff-related payments, a core function of the department, is in the process of being taken over by HRMD.
CORPORATE SERVICES
X.79 With a view to enabling the specialised departments to focus on their core functions, the Department of Corporate Services (DCS) has been set up as part of the reorganisation. It has a mandate to provide corporate support services by way of management of events/meetings/hospitality; framing guidelines for award of rate contracts; centralised procurement of office stationery, electronic document management; and protocol services to the top management.
RAJBHASHA
X.80 The Reserve Bank continued to ensure compliance of statutory provisions of the Offi cial Language Act to promote the use of Hindi in its working during 2014-15. The Rajbhasha Department of the Reserve Bank acts as the nodal department for this purpose.
Agenda for 2014-15: Implementation Status
X.81 Al l the Regional Off ices obtained membership of the Town Official Language Implementation Committee (TOLIC) during the year. Six offi ces of the Reserve Bank were notifi ed in terms of Rule 10(4) of The Offi cial Languages Rules, 1976. A number of Hindi competitions as well as functions in Hindi were organised during the year, including a two-day conference of Rajbhasha Offi cers in May 2015. Towards enhancing the use of Hindi in a computerised environment, intensive Hindi typing training programmes were conducted for offi cers and staff and 156 trainees passed the examination conducted by the Government.
X.82 Besides statutory publications, other publications were also brought out in a bilingual form. Banking Chintan-Anuchintan, the quarterly
ANNUAL REPORT
140
Hindi magazine dedicated to banking and fi nance, is being published. The fi rst issue of a half yearly e-newsletter Rajbhasha Samachar was released in January 2015.
X.83 The Parliamentary Committee on Offi cial Language visited the Reserve Bank’s Kochi offi ce in 2015 and released the e-Banking Glossary. The glossary has since been uploaded on the Reserve Bank’s website with various advanced features, such as search options in both Hindi and English. The Parliamentary Committee also visited the Delhi and Kolkata offices of the Reserve Bank. The committee suggested a few corrective actions for furthering the use of Hindi in the Reserve Bank like increasing the number of workshops and increasing the expense on Hindi advertisements.
Agenda for 2015-16
X.84 The work plan for 2015-16 has taken on board the concerns expressed by the Parliamentary Committee on Official Language. It has been decided to celebrate 2015-16 as the Rajbhasha Golden Jubilee Year in the Reserve Bank for which an action plan has been prepared covering various activities to be held during the year. A Hindi workshop for Regional Directors and heads of Central Offi ce departments, region-wise seminars, various Hindi functions marking important linguistic events like Translation Day and International Mother Language Day have been planned to raise the level of implementation of the Rajbhasha policy.
PREMISES
X.85 The Premises Department is engaged in creating and maintaining the Reserve Bank’s building infrastructure. In 2014-15, the department brought some of the stalled projects on track. Projects under the design and build (DB) mode were taken up for residential colonies at Anna Nagar, Chennai; Dadar-Parel, Mumbai and Ameerpet, Hyderabad; additional hostels at the Indira Gandhi Institute of Development Research (IGIDR), Mumbai and the Reserve Bank Staff College (RBSC), Chennai. The process of
acquisition of land for a sub-offi ce and residences in Imphal was initiated. The existing physical infrastructure for dealing room for fi nancial market operations in Mumbai and for comprehensive human resource system (CHRS) in Bengaluru was upgraded.
Green Initiative
X.86 As part of its Green Policy, grid interactive solar power plants are under installation at all Reserve Bank’s offices. To utilise the waste generated, organic waste convertors have been installed in Kanpur, Thiruvananthapuram, New Delhi, Bengaluru and CAB, Pune.
Swachh Bharat - Sanitation Audit
X.87 A third party sanitation audit was carried out on a pilot basis for the Central Offi ce Building (COB), Fort and Bandra Kurla Complex offi ces, Mumbai and Mumbai Central Colony. The fi ndings have been taken up for rectifi cation and redressal.
Agenda for 2015-16
X.88 The focus during 2015-16 will be on consolidating the existing physical resources of land and buildings, so as to ensure optimum utilisation and reduction in maintenance costs over the next two to three years. It is proposed to take up construction of the Reserve Bank’s offices in Dehradun and Raipur. The redevelopment of Hauz Khas Colony, New Delhi; Chembur Colony, Mumbai under the DB mode, and construction of the CAFRAL building in Mumbai were impeded due to delays in securing requisite statutory approvals. With closer follow-up, the projects are expected to commence in 2015-16.
X.89 The Internet Protocol CCTV project is being implemented replacing the existing analog CCTV systems in 20 offi ces and is likely to be completed by October 2015. The provision of an integrated security system in the COB is expected to be completed by December 2015. The access control card based turnstile system installed at COB, is being replicated in the Regional Offi ces.
THE RESERVE BANK’S ACCOUNTS FOR 2014-15XI
The balance sheet size of the Reserve Bank increased by 10.09 per cent for the year ended June 30, 2015 primarily due to increase in foreign currency assets on the asset side which rose by 21.50 per cent and increase in notes in circulation and deposits which rose by 9.57 per cent and 37.60 per cent respectively on the liability side. While gross income for the year 2014-15 increased sharply by 22.66 per cent, the total expenditure increased by 11.92 per cent. The year ended with an overall surplus of `658.96 billion as against `526.79 billion in the previous year, representing an increase of 25.09 per cent.
XI.1 The balance sheet of the Reserve Bank is largely a refl ection of the activities carried out in pursuance of its currency issue function as well as monetary policy and reserve management objectives. The key fi nancial results of the Reserve Bank’s operations during the year 2014-15 along with comments are set out in the following paragraphs.
XI.2 The year 2014-15 witnessed an overall increase in the size of the balance sheet by `2,647.92 billion, i.e., 10.09 per cent from ̀ 26,243.67 billion as on June 30, 2014 to ̀ 28,891.59 billion as on June 30, 2015. The increase on the asset side was mainly due to increase in Foreign Currency Assets (FCA). The increase on the liability side was mainly due to a rise in notes in circulation and deposits. As on June 30, 2015 domestic assets (including gold) constituted 26.07 per cent while the FCA constituted 73.93 per cent of total assets as against 33.0 per cent and 67.0 per cent, respectively as on June 30, 2014.
XI.3 As in the previous year, no amount has been transferred to the Contingency Fund. An amount of `10.00 billion has been provided for and transferred to the Asset Development Fund specifi cally towards capital contribution to the National Housing Bank (NHB) and the surplus of `658.96 billion has been transferred to the Central Government. The balances in the Contingency Fund and the Asset
Development Fund and the surplus transferred to
the Central Government during the last fi ve years
have been given in Tables XI.1 & XI.2 respectively.
XI.4 For better comparability and transparency,
the Reserve Bank has been progressively moving
towards greater disclosures in its financial
statements. A Technical Committee constituted in
2012-13 to review the Form of Presentation of the
Balance Sheet and Profi t & Loss Account [Chairman:
Shri Y.H. Malegam (Technical Committee I)] had
made several recommendations relating to the
format and contents of the Balance Sheet and Profi t
& Loss Account of the Reserve Bank and also to
change the nomenclature of the Profi t and Loss
Account to Income Statement. Further, the
141
Table XI.1: Balances in Contingency Fund (CF) and Asset Development Fund (ADF)
(` billion)
As on June 30
Balance in CF
Balance in ADF
Total CF and ADF as percentage to total assets
1 2 3 4=(2+3) 5
2011 1707.28 158.66 1865.94 10.3
2012 1954.05 182.14 2136.19 9.7
2013
2014
2216.52
2216.52
207.61
207.61
2424.13
2424.13
10.1
9.2
2015 2216.14* 217.61 2433.75 8.4
* The decline in the CF is due to adjustment of the debit balance in the FCVA on account of MTM loss on forward contracts on June 30, 2015.

ANNUAL REPORT
142
Committee had also recommended a few changes
in the accounting policy. The Board of the Reserve
Bank has accepted these recommendations for
implementation. In order to effect the change
relating to the format and contents of the Balance
Sheet and Profi t and Loss Account, Government
of India has notifi ed the format of weekly accounts
of the Bank on July 15, 2015 in the Gazette of India
and amendments in relevant sections of RBI
General Regulations, 1949 have been notifi ed by
the Bank on July 6 and July 15, 2015 in the Gazette
of India for changes in the format of the Balance
Sheet and Profi t and Loss Account of the Bank.
Accordingly, the accounts of the Bank for the year
2014-15 have been drawn up in the new format.
XI.5 The major changes in the format and
contents of the Balance Sheet and the Profi t and
Loss account are as under:
Balance Sheets of Issue and Banking
Departments have been merged and each
item of asset and liability is shown as line items
supported by schedules.
‘Gold Coin and Bullion’ which earlier formed
part of ‘Other Assets’, and ‘Investment in
Subsidiaries and Associates’, which formed part of ‘Investments’ in the Banking Department balance sheet, are now shown as distinct balance sheet heads.
The Profit and Loss Account has been renamed as ‘Income Statement’ and the income head has been bifurcated into two major sub heads viz. ‘Interest’ and ‘Others’ supported by schedules.
A new head ‘Provisions’ has been added under expenditure for accounting of transfers to the Contingency Fund (CF) and the Asset Development Fund (ADF).
The unit of reporting has been changed from ‘Rupee Thousands’ to ‘Rupee billions’.
XI.6 For better readability and presentation, investments have been bifurcated into four major categories. ‘Balances Held Abroad’ and ‘Investments’ held as part of Banking Department balance sheet are shown as ‘Investments–Foreign-BD’ and ‘Investments- Domestic-BD’, respectively. ‘Foreign Securities’ and ‘GoI Rupee Securities’ forming part of ‘Issue Department Assets’ have been shown as ‘Investments- Foreign-ID’ and ‘Investments-
Table XI.2:Trends in Gross Income, Expenditure and Net Disposable Income(` billion)
Item 2010-11 2011-12 2012-13 2013-14 2014-15
1 2 3 4 5 6
a) Gross Income 370.70 531.76 743.58 646.17 792.56
b) Transfers to Internal Reserves (i+ii) 134.02 270.25 287.94 0.00 0.00
(i) Contingency Fund 121.67 246.77 262.47 0.00 0.00
(ii) Asset Development Fund@ 12.35 23.48 25.47 0.00 0.00
c) Net Income (a-b) 236.68 261.51 455.63 646.17 792.56
d) Total Expenditure 86.55 101.37 125.49 119.34 133.56
e) Net Disposable Income (c-d) 150.13 160.14 330.14 526.83 659.00
f) Transfer to funds* 0.04 0.04 0.04 0.04 0.04
g) Surplus transferred to the Government (e-f) 150.09 160.10 330.10 526.79 658.96
Transfer of Surplus to Government as per cent of Gross Income less Total Expenditure 52.8 37.2 53.4 99.99 99.99
*: An amount of `10 million each has been transferred to the National Industrial Credit (Long Term Operations) Fund, the National Rural Credit (Long Term Operation) Fund, the National Rural Credit (Stabilisation) Fund and the National Housing Credit (Long Term Operations) Fund during each of the fi ve years.
@For 2014-15 not shown as it is included in total expenditure.
THE RESERVE BANK’S ACCOUNTS FOR 2014-15
143
Domestic-ID’ respectively. Contingency Reserve and Asset Development Reserve have been renamed as ‘Contingency Fund’ and ‘Asset Development Fund’.
XI.7 Based on the recommendations made by the Technical Committee I certain changes in accounting policies were also effected in 2014-15. Repo and Reverse Repo transactions, were earlier treated as purchase and sale of securities. As the substance of the transaction is lending and deposit of funds and securities only represent the collateral for the transaction, Repo under Liquidity Adjustment Facility (LAF) and Marginal Standing Facility (MSF) is now being treated as lending and Reverse Repo being treated as deposit of funds with RBI. The Technical Committee I had also recommended that rupee securities be carried at fair value and any unrealised gain or loss may be transferred to the Investment Revaluation Account (IRA). This will be implemented in 2015-16.
XI.8 Another Technical Committee [Chairman: Shri Y.H.Malegam (Technical Committee II)] was constituted during 2013-14 to review the Level and
Adequacy of Internal Reserves and Surplus Distribution Policy of the Reserve Bank of India. Based on the recommendations of the Technical Committee II, the forward contracts entered into by the Bank as part of its intervention operations are being marked to market on yearly basis as on the balance sheet date from the year 2013-14. Further, as against the earlier policy of ignoring gain and accounting for loss only, now both gain or loss are accounted for.
XI.9 The other major recommendations of the Technical Committee II, which will be implemented in 2015-16 are: (i) change in the method of revaluation of the rupee securities from Lower of Book or Market Value (LOBOM) to fair valuation, and (ii) bifurcation of Currency and Gold Revaluation Account (CGRA) into Gold Revaluation Account (GRA) and Foreign Currency Revaluation Account (FCRA).
XI.10 The Balance Sheet and the Income Statement prepared for the year 2014-15 in the new formats along with the schedules, statement of signifi cant accounting policies and supporting notes to the accounts are furnished below:

ANNUAL REPORT
144
RESERVE BANK OF INDIABALANCE SHEET AS ON JUNE 30, 2015
(Amount in ` billion)
Liabilities Schedules 2013-14 2014-15 Assets Schedules 2013-14 2014-15
Capital 0.05 0.05 Assets of Banking Department (BD)
Reserve Fund 65.00 65.00 Notes, rupee coin, small coin 5 0.11 0.11
Other Reserves 1 2.20 2.22 Gold Coin and Bullion 6 590.24 578.84
Deposits 2 3769.45 5186.86 Investments-Foreign-BD 7 4,796.21 7,276.29
Other Liabilities and Provisions 3 8961.70 8905.03 Investments-Domestic-BD 8 6,684.68 5,174.97
Bills Purchased and Discounted 0.00 0.00
Loans and Advances 9 370.83 802.32
Investment in Subsidiaries 10 13.20 13.20
Other Assets 11 343.13 313.43
Liabilities of Issue Department Assets of Issue Department (ID)
Notes issued 4 13,445.27 14,732.43 Gold Coin and Bullion (as backing for Note issue)
6 649.78 637.23
Rupee coin 1.72 1.99
Investment-Foreign-ID 7 12,783.31 14,082.75
Investment-Domestic-ID 8 10.46 10.46
Domestic Bills of Exchange and other Commercial Papers
0.00 0.00
Total Liabilities 26,243.67 28,891.59 Total Assets 26,243.67 28,891.59
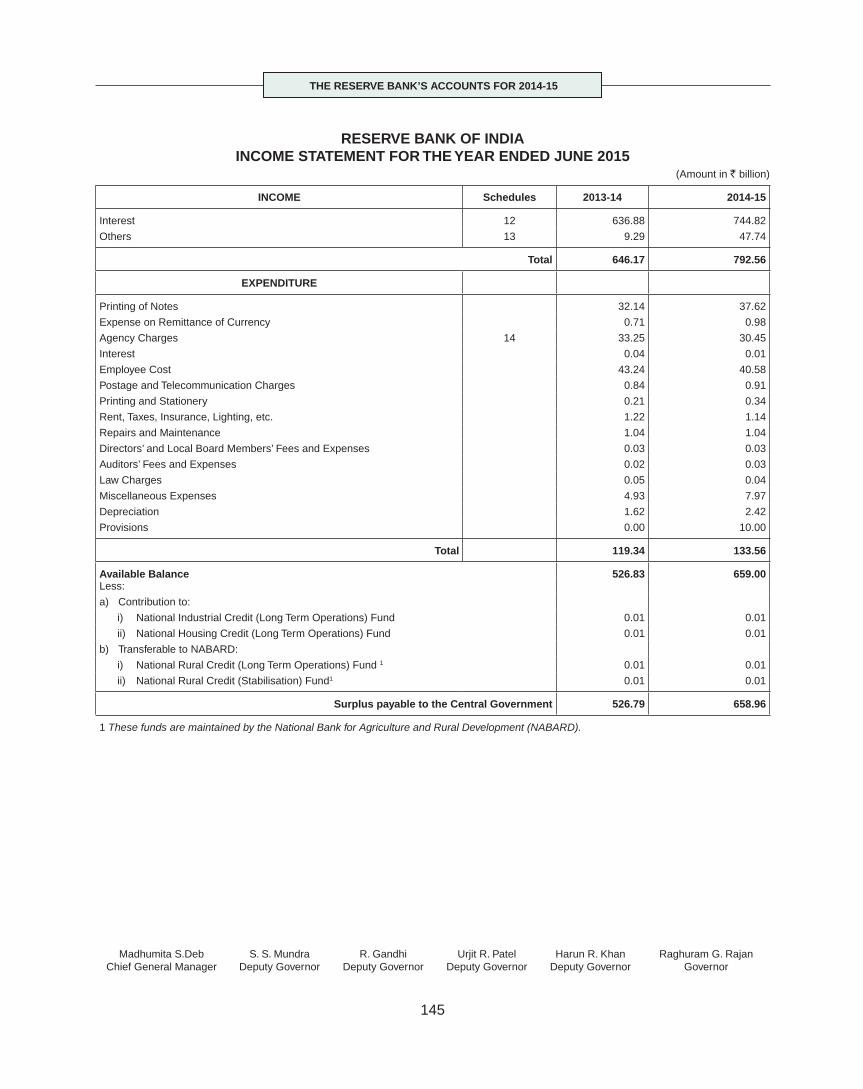
THE RESERVE BANK’S ACCOUNTS FOR 2014-15
145
RESERVE BANK OF INDIAINCOME STATEMENT FOR THE YEAR ENDED JUNE 2015
(Amount in ` billion)
INCOME Schedules 2013-14 2014-15
Interest 12 636.88 744.82
Others 13 9.29 47.74
Total 646.17 792.56
EXPENDITURE
Printing of Notes 32.14 37.62
Expense on Remittance of Currency 0.71 0.98
Agency Charges 14 33.25 30.45
Interest 0.04 0.01
Employee Cost 43.24 40.58
Postage and Telecommunication Charges 0.84 0.91
Printing and Stationery 0.21 0.34
Rent, Taxes, Insurance, Lighting, etc. 1.22 1.14
Repairs and Maintenance 1.04 1.04
Directors’ and Local Board Members’ Fees and Expenses 0.03 0.03
Auditors’ Fees and Expenses 0.02 0.03
Law Charges 0.05 0.04
Miscellaneous Expenses 4.93 7.97
Depreciation 1.62 2.42
Provisions 0.00 10.00
Total 119.34 133.56
Available Balance 526.83 659.00Less:
a) Contribution to:
i) National Industrial Credit (Long Term Operations) Fund 0.01 0.01
ii) National Housing Credit (Long Term Operations) Fund 0.01 0.01
b) Transferable to NABARD:
i) National Rural Credit (Long Term Operations) Fund 1 0.01 0.01
ii) National Rural Credit (Stabilisation) Fund1 0.01 0.01
Surplus payable to the Central Government 526.79 658.96
1 These funds are maintained by the National Bank for Agriculture and Rural Development (NABARD).
Madhumita S.DebChief General Manager
S. S. MundraDeputy Governor
R. GandhiDeputy Governor
Urjit R. PatelDeputy Governor
Harun R. KhanDeputy Governor
Raghuram G. RajanGovernor

ANNUAL REPORT
146
2013-14 2014-15
Schedule 1: Other Reserves(i) National Industrial Credit (Long Term Operations) Fund 0.23 0.24
(ii) National Housing Credit (Long Term Operations) Fund 1.97 1.98
Total 2.20 2.22
Schedule 2: Deposits(a) Government (i) Central Government 1.00 1.01
(ii) State Governments 0.42 0.43
Sub total 1.42 1.44
(b) Banks (i) Scheduled Commercial Banks 3,469.16 3,711.94
(ii) Scheduled State Co-operative Banks 37.29 32.22
(iii) Other Scheduled Co-operative Banks 63.31 69.97
(iv) Non-Scheduled Co-operative Banks 4.81 10.71
(v) Other Banks (RRB, LDB, etc) 102.67 122.01
Sub total 3,677.24 3,946.85
(c) Others (i) Administrators of RBI Employee PF A/c 38.62 40.75
(ii) Depositors’ Education and Awareness Fund 27.95 78.75
(iii) Balances of Foreign Central Banks 10.13 14.71
(iv) Balances of Indian Financial Institutions 2.53 4.33
(v) Balances of International Financial Institutions 1.43 1.45
(vi) Mutual Fund 0.01 0.01
(vii) Others 10.12 1098.57
Sub total 90.79 1,238.57
Total 3,769.45 5,186.86
Schedule 3: Other Liabilities and Provisions(i) Gratuity and Superannuation Fund 123.10 140.05
(ii) Contingency Fund (CF) 2,216.52 2,216.14
(iii) Asset Development Fund (ADF) 207.61 217.61
(iv) Currency and Gold Revaluation Account (CGRA) 5,721.63 5,591.93
(v) Investment Revaluation Account (IRA) 37.91 32.14
(vi) Foreign Exchange Forward Contracts Valuation Account (FCVA) 42.98 0.00
(vii) Provision for Forward Contracts Valuation Account (PFCVA) 0.00 0.39
(viii) Provision for Payables 16.55 16.81
(ix) Surplus Transferable to the Government of India 526.79 658.96
(x) Bills Payable 0.37 0.17
(xi) Miscellaneous 68.24 30.83
Total 8,961.70 8,905.03
Schedule 4: Notes Issued(i) Notes held in the Banking Department 0.11 0.11
(ii) Notes in Circulation 13,445.16 14,732.32
Total 13,445.27 14,732.43
SCHEDULES FORMING PART OF BALANCE SHEET AND INCOME STATEMENT(Amount in ` billion)
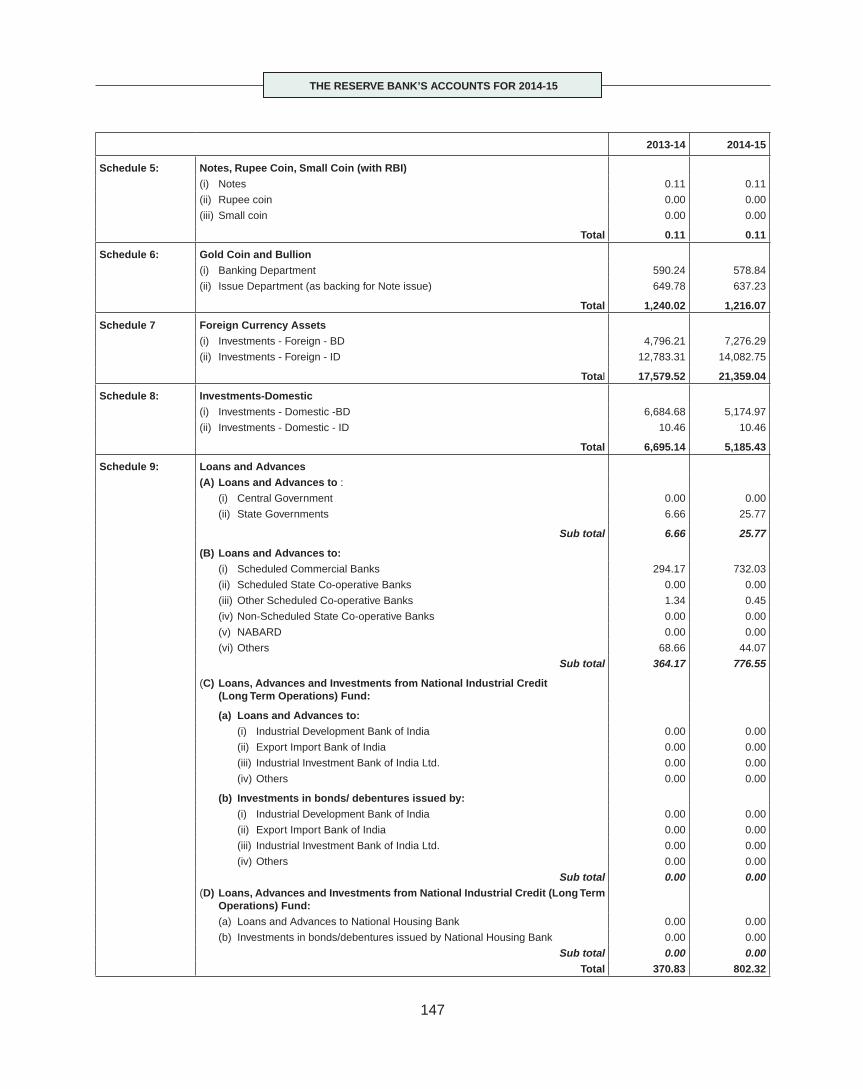
THE RESERVE BANK’S ACCOUNTS FOR 2014-15
147
2013-14 2014-15
Schedule 5: Notes, Rupee Coin, Small Coin (with RBI) (i) Notes 0.11 0.11
(ii) Rupee coin 0.00 0.00
(iii) Small coin 0.00 0.00
Total 0.11 0.11
Schedule 6: Gold Coin and Bullion(i) Banking Department 590.24 578.84
(ii) Issue Department (as backing for Note issue) 649.78 637.23
Total 1,240.02 1,216.07
Schedule 7 Foreign Currency Assets(i) Investments - Foreign - BD 4,796.21 7,276.29
(ii) Investments - Foreign - ID 12,783.31 14,082.75
Total 17,579.52 21,359.04
Schedule 8: Investments-Domestic(i) Investments - Domestic -BD 6,684.68 5,174.97
(ii) Investments - Domestic - ID 10.46 10.46
Total 6,695.14 5,185.43
Schedule 9: Loans and Advances(A) Loans and Advances to :
(i) Central Government 0.00 0.00
(ii) State Governments 6.66 25.77
Sub total 6.66 25.77
(B) Loans and Advances to: (i) Scheduled Commercial Banks 294.17 732.03
(ii) Scheduled State Co-operative Banks 0.00 0.00
(iii) Other Scheduled Co-operative Banks 1.34 0.45
(iv) Non-Scheduled State Co-operative Banks 0.00 0.00
(v) NABARD 0.00 0.00
(vi) Others 68.66 44.07
Sub total 364.17 776.55
(C) Loans, Advances and Investments from National Industrial Credit (Long Term Operations) Fund:
(a) Loans and Advances to: (i) Industrial Development Bank of India 0.00 0.00
(ii) Export Import Bank of India 0.00 0.00
(iii) Industrial Investment Bank of India Ltd. 0.00 0.00
(iv) Others 0.00 0.00
(b) Investments in bonds/ debentures issued by: (i) Industrial Development Bank of India 0.00 0.00
(ii) Export Import Bank of India 0.00 0.00
(iii) Industrial Investment Bank of India Ltd. 0.00 0.00
(iv) Others 0.00 0.00
Sub total 0.00 0.00(D) Loans, Advances and Investments from National Industrial Credit (Long Term
Operations) Fund: (a) Loans and Advances to National Housing Bank 0.00 0.00
(b) Investments in bonds/debentures issued by National Housing Bank 0.00 0.00
Sub total 0.00 0.00Total 370.83 802.32
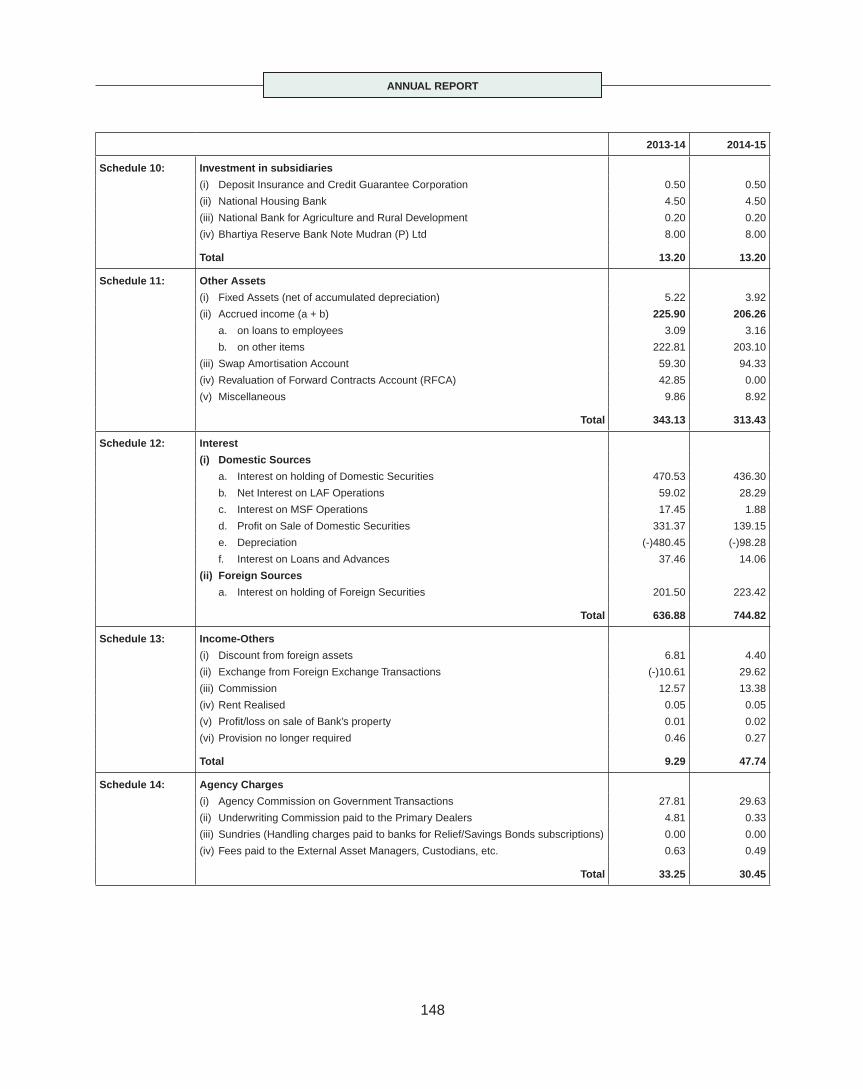
ANNUAL REPORT
148
2013-14 2014-15
Schedule 10: Investment in subsidiaries
(i) Deposit Insurance and Credit Guarantee Corporation 0.50 0.50
(ii) National Housing Bank 4.50 4.50
(iii) National Bank for Agriculture and Rural Development 0.20 0.20
(iv) Bhartiya Reserve Bank Note Mudran (P) Ltd 8.00 8.00
Total 13.20 13.20
Schedule 11: Other Assets
(i) Fixed Assets (net of accumulated depreciation) 5.22 3.92
(ii) Accrued income (a + b) 225.90 206.26
a. on loans to employees 3.09 3.16
b. on other items 222.81 203.10
(iii) Swap Amortisation Account 59.30 94.33
(iv) Revaluation of Forward Contracts Account (RFCA) 42.85 0.00
(v) Miscellaneous 9.86 8.92
Total 343.13 313.43
Schedule 12: Interest
(i) Domestic Sources
a. Interest on holding of Domestic Securities 470.53 436.30
b. Net Interest on LAF Operations 59.02 28.29
c. Interest on MSF Operations 17.45 1.88
d. Profi t on Sale of Domestic Securities 331.37 139.15
e. Depreciation (-)480.45 (-)98.28
f. Interest on Loans and Advances 37.46 14.06
(ii) Foreign Sources
a. Interest on holding of Foreign Securities 201.50 223.42
Total 636.88 744.82
Schedule 13: Income-Others
(i) Discount from foreign assets 6.81 4.40
(ii) Exchange from Foreign Exchange Transactions (-)10.61 29.62
(iii) Commission 12.57 13.38
(iv) Rent Realised 0.05 0.05
(v) Profi t/loss on sale of Bank’s property 0.01 0.02
(vi) Provision no longer required 0.46 0.27
Total 9.29 47.74
Schedule 14: Agency Charges
(i) Agency Commission on Government Transactions 27.81 29.63
(ii) Underwriting Commission paid to the Primary Dealers 4.81 0.33
(iii) Sundries (Handling charges paid to banks for Relief/Savings Bonds subscriptions) 0.00 0.00
(iv) Fees paid to the External Asset Managers, Custodians, etc. 0.63 0.49
Total 33.25 30.45
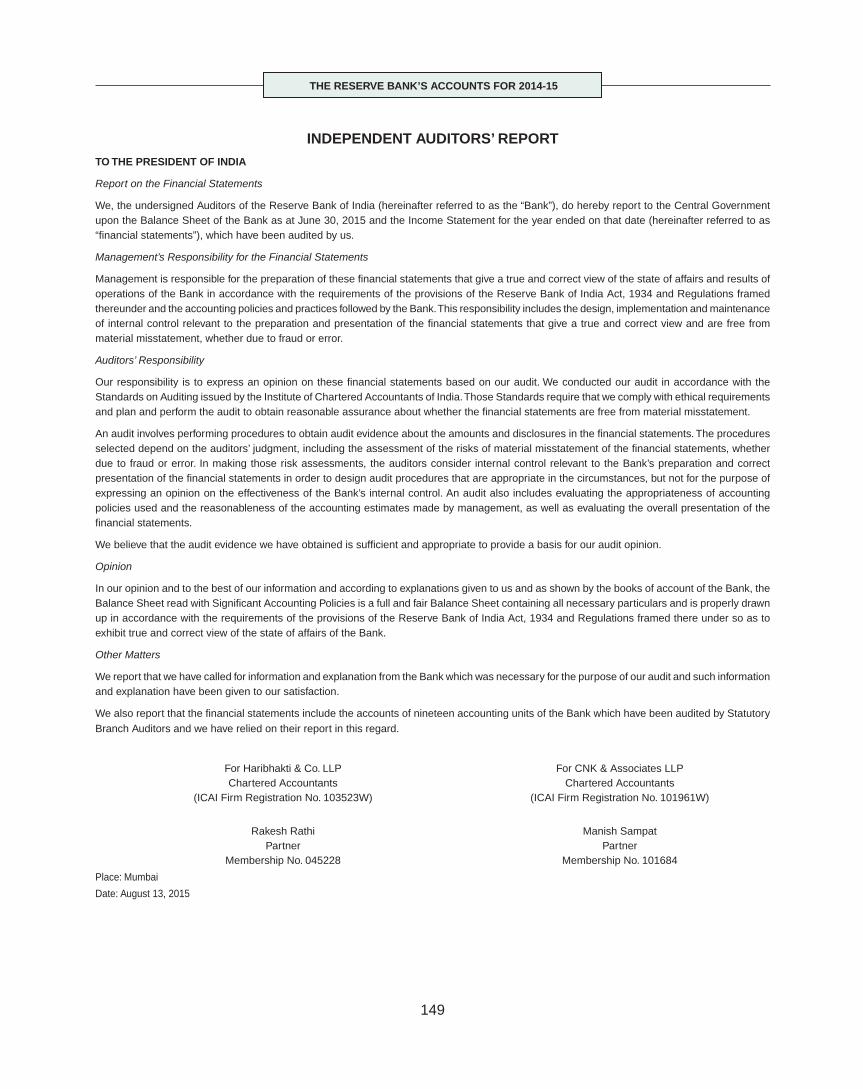
THE RESERVE BANK’S ACCOUNTS FOR 2014-15
149
INDEPENDENT AUDITORS’ REPORT
TO THE PRESIDENT OF INDIA
Report on the Financial Statements
We, the undersigned Auditors of the Reserve Bank of India (hereinafter referred to as the “Bank”), do hereby report to the Central Government upon the Balance Sheet of the Bank as at June 30, 2015 and the Income Statement for the year ended on that date (hereinafter referred to as “fi nancial statements”), which have been audited by us.
Management’s Responsibility for the Financial Statements
Management is responsible for the preparation of these fi nancial statements that give a true and correct view of the state of affairs and results of operations of the Bank in accordance with the requirements of the provisions of the Reserve Bank of India Act, 1934 and Regulations framed thereunder and the accounting policies and practices followed by the Bank. This responsibility includes the design, implementation and maintenance of internal control relevant to the preparation and presentation of the fi nancial statements that give a true and correct view and are free from material misstatement, whether due to fraud or error.
Auditors’ Responsibility
Our responsibility is to express an opinion on these fi nancial statements based on our audit. We conducted our audit in accordance with the Standards on Auditing issued by the Institute of Chartered Accountants of India. Those Standards require that we comply with ethical requirements and plan and perform the audit to obtain reasonable assurance about whether the fi nancial statements are free from material misstatement.
An audit involves performing procedures to obtain audit evidence about the amounts and disclosures in the fi nancial statements. The procedures selected depend on the auditors’ judgment, including the assessment of the risks of material misstatement of the fi nancial statements, whether due to fraud or error. In making those risk assessments, the auditors consider internal control relevant to the Bank’s preparation and correct presentation of the fi nancial statements in order to design audit procedures that are appropriate in the circumstances, but not for the purpose of expressing an opinion on the effectiveness of the Bank’s internal control. An audit also includes evaluating the appropriateness of accounting policies used and the reasonableness of the accounting estimates made by management, as well as evaluating the overall presentation of the fi nancial statements.
We believe that the audit evidence we have obtained is suffi cient and appropriate to provide a basis for our audit opinion.
Opinion
In our opinion and to the best of our information and according to explanations given to us and as shown by the books of account of the Bank, the Balance Sheet read with Signifi cant Accounting Policies is a full and fair Balance Sheet containing all necessary particulars and is properly drawn up in accordance with the requirements of the provisions of the Reserve Bank of India Act, 1934 and Regulations framed there under so as to exhibit true and correct view of the state of affairs of the Bank.
Other Matters
We report that we have called for information and explanation from the Bank which was necessary for the purpose of our audit and such information and explanation have been given to our satisfaction.
We also report that the fi nancial statements include the accounts of nineteen accounting units of the Bank which have been audited by Statutory Branch Auditors and we have relied on their report in this regard.
For Haribhakti & Co. LLPChartered Accountants
(ICAI Firm Registration No. 103523W)
Rakesh RathiPartner
Membership No. 045228
For CNK & Associates LLP Chartered Accountants
(ICAI Firm Registration No. 101961W)
Manish SampatPartner
Membership No. 101684
Place: Mumbai
Date: August 13, 2015
ANNUAL REPORT
150
STATEMENT OF SIGNIFICANT ACCOUNTING POLICIES FOR THE YEAR ENDED
JUNE 30, 2015
1. General
1.1 The Reserve Bank of India was established under the Reserve Bank of India Act, 1934 ( the Act) “to regulate the issues of Bank notes and the keeping of reserves with a view to securing monetary stability in India and generally to operate the currency and credit system of the country to its advantage”.
1.2 The main functions of the Bank are:-
a) Issue of Bank notes.
b) Management of the monetary system.
c) Regulation and supervision of banks and Non –Banking Finance Companies (NBFCs).
d) Acting as the lender of last resort.
e) Regulation and supervision of the Payment and Settlement Systems.
f) Maintaining and managing the country’s foreign exchange reserves.
g) Acting as the banker to banks and the Governments
h) Acting as the debt manager of the Governments.
i) Regulation and development of foreign exchange market.
j) Developmental functions including in the areas of rural credit and fi nancial inclusion.
1.3 The Act requires that the issue of Bank notes should be conducted by the Bank in the Issue Department which shall be separate and kept wholly distinct from the Banking Department and the assets of the Issue Department shall not be subject to any liability other than the liabilities of the
Issue Department. The Act requires that the assets of the Issue Department shall consist of gold coins, gold bullion, foreign securities, rupee coins and rupee securities to such aggregate amount as is not less than the total of the liabilities of the Issue Department. The Act requires that the liabilities of the Issue Department shall be an amount equal to the total of the amount of the currency notes of the Government of India and Bank notes for the time being in circulation.
2. Signifi cant Accounting Policies
2.1 Convention
The fi nancial statements are prepared in accordance with the Reserve Bank of India Act, 1934 and the notifi cations issued thereunder and in the form prescribed by the Reserve Bank of India General Regulations, 1949. These are based on historical cost except where it is modifi ed to refl ect revaluation. The accounting policies followed in preparing the financial statements are consistent with those followed in the previous year unless otherwise stated.
2.2 Revenue Recognition
(a) Income and expenditure are recognised on accrual basis except penal interest which is accounted for only when there is certainty of realisation. Policy on dividend income on shares has been revised during the year and is now recognised on accrual basis when the right to receive the same is established as against the earlier policy of recognising it on cash basis.
(b) Balances unclaimed and outstanding for more than three clear consecutive years in certain transit accounts including Drafts Payable Account, Payment Orders Account, Sundry Deposits Account, Remittance Clearance Account and Earnest Money Deposit Account are reviewed and written back to income.
THE RESERVE BANK’S ACCOUNTS FOR 2014-15
151
Claims, if any, are considered and charged against income in the year of payment.
(c) Income and expenditure in foreign currency are recorded at the exchange rates prevailing on the last business day of the week/month/ year as applicable.
2.3 Gold & Foreign Currency Assets and Liabilities
Transactions in gold and foreign currency assets are accounted for on settlement date basis.
(a) Gold
Gold is revalued on the last business day of the month at 90 per cent of the daily average price quoted by the London Bullion Market Association (LBMA) for the month. The rupee equivalent is determined on the basis of the exchange rate prevailing on the last business day of the month. Unrealised gains/ losses are credited/debited to the Currency and Gold Revaluation Account (CGRA).
(b) Foreign Currency Assets and Liabilities
All foreign currency assets and liabilities (excluding foreign currency received under the swaps that are in the nature of repos and contracts where the rates are fi xed contractually) are translated at the exchange rates prevailing on the last business day of the week/month/year as applicable. Gains and losses arising from such translation of foreign currency assets and liabilities are accounted for in CGRA and remain adjusted therein. Foreign securities other than Treasury Bills, Commercial Papers, and certain “held to maturity” securities (such as investments in notes issued by the International Monetary Fund and bonds issued by India Infrastructure Finance Company (IIFC), UK) which are valued at cost, are marked to market as on the last business day of each month. Appreciation or depreciation is recorded in the Investment Revaluation
Account (IRA). Credit balance is carried forward to the subsequent year. Debit balance, if any, at the end of the year in IRA is required to be charged to the Contingency Fund and the same is to be reversed to the credit of the Contingency Fund on the fi rst working day of the succeeding fi nancial year. Till 2013 -14, the policy was to charge such debit balance in the IRA to the Profi t and Loss Account. Foreign Treasury Bills and Commercial Papers are carried at cost as adjusted by amortisation of discount. Premium or discount on foreign securities is amortised daily. Profi t/loss on sale of foreign currency assets is recognised with respect to the book value. On sale/redemption of foreign dated securities valuation gain/loss in respect of the securities sold, lying in IRA, is transferred to the Income account.
(c) Forward/Swap Contracts
Forward contracts entered into by the Reserve Bank as part of its intervention operations are revalued on a yearly basis on June 30. While the marked to market gain is credited to the ‘Foreign Exchange Forward Contracts Valuation Account’ (FCVA) with contra debit to Revaluation of Forward Contracts Account (RFCA), marked to market loss is debited to the FCVA with contra credit to the Provision for Forward Contracts Valuation Account (PFCVA). Debit balance in FCVA, if any, on June 30, is required to be charged to the Contingency Fund and reversed on the fi rst working day of the following year. On maturity of the contract, the actual gain or loss is required to be recognised in the Income Account and the unrealised gains/losses previously recorded in the FCVA, RFCA and PFCVA are required to be reversed. The balance in the RFCA and PFCVA represent the net unrealised gains and losses on valuat ion of such forward contracts respectively.

ANNUAL REPORT
152
In the case of swaps entered at off-market rates that are in the nature of repo, the difference between the future contract rate and the rate at which the contract is entered into is amortised over the period of the contract and recorded in the Income Account with contra entry in the Swap Amortisation Account (SAA). The amounts recorded in the SAA are reversed on maturity of the underlying contracts. Further, the amounts received under these swaps are not subject to periodic revaluation.
While FCVA and PFCVA form part of ‘Other Liabilities’, RFCA and SAA form part of ‘Other Assets’.
2.4 Domestic Investments
(a) Rupee Securities
Rupee securities, held as part of Bank’s domestic investments, are valued at lower of book value or market value (LOBOM). Where the market price for such securities is not available, the rates are derived based on the yield curve prevailing on the last business day of the month as notifi ed by the Fixed Income Money Market and Derivatives Association of India (FIMMDA). Depreciation, if any, is adjusted against current year’s interest income. Non- interest bearing rupee securities held as backing for note issue and securities which are earmarked against funds, such as, Gratuity and Superannuation, Provident Fund, Leave Encashment, Medical Assistance Fund, and Depositors’ Education and Awareness (DEA) Fund are, however, categorised as held to maturity (HTM) and therefore not marked to market.
(b) Treasury Bills
Treasury bills are valued at cost.
(c) Shares Investments in shares are valued at cost.
2.5 Liquidity Adjustment Facility (LAF) Repo/Reverse Repo and Marginal Standing Facility (MSF)
From the year 2014-15 onwards Repo under LAF and Marginal Standing Facility (MSF) is being treated as lending and is being shown under ‘Loans and Advances’ whereas ‘Reverse Repo’ is being treated as deposits and is being shown under ‘Deposit-Others’. Till last year, Repo under LAF and MSF were being accounted for as purchase of rupee securities and Reverse Repo as sale of rupee securities.
2.6 Fixed Assets
a. Fixed Assets are stated at cost less depreciation.
b. Depreciation on computers, microprocessors, software (costing `0.1 million and above), motor vehicles, furniture, etc. is provided on straight-line basis at the following rates.
Asset Category Rate of Depreciation
Motor vehicles, Furniture, etc. 20 per cent
Computers, Microprocessors,
Software, etc.
33.33 per cent
c. Amortisation of premium on leasehold land and depreciation on building is provided on written-down value basis at the following rates.
Asset Category Rate of Depreciation/Amortisation
Leasehold Land and Building(s) constructed thereon
Proportionate to lease period but not less than 5 per cent
Building(s) constructed on Freehold Land
10 per cent
d. Fixed Assets, costing less than `0.1 million (except easily portable electronic assets) are charged to income in the year of acquisition. Easily portable electronic assets, such as laptops, etc. costing more than `10,000 are capitalised and depreciation is calculated at applicable rates.

THE RESERVE BANK’S ACCOUNTS FOR 2014-15
153
e. Individual items of computer software costing `0.1million and above are capitalised and depreciation is calculated at the applicable rates.
f. Depreciation is provided on year-end balances of the Fixed Assets.
g. For assessment of impairment/ re-statement of carrying value, buildings are classifi ed into two categories as under:
(i) Buildings which are in use but have been identifi ed for demolition in future/will be discarded in future: The value in use of such buildings is the aggregate of depreciation for the future period up to the date it is expected to be discarded/demolished. The difference between the book value and aggregate of depreciation so arrived at is required to be charged as depreciation.
(ii) Buildings which have been discarded/vacated: These buildings are to be shown at realisable value (net selling price, if the asset is likely to be sold in future) / scrap value less demolition cost (if it is to be demolished). If the amount is negative, then the carrying value of such buildings has to be shown at `1. The difference between the book value and realisable value (i.e., the net sel l ing pr ice) / scrap value less demoli t ion cost is required to be charged as depreciation. The asset is required to be shown under the head “Other assets” - “Miscellaneous”.
2.7 Employee Benefi ts
The liability on account of long term employee benefi ts is provided based on an actuarial valuation under the ‘Projected Unit Credit’ method.
NOTES TO THE ACCOUNTS
XI.11 Liabilities and Assets of the Bank
XI.11.1 LIABILITIES
i) Capital
The Reserve Bank was constituted as a private shareholders’ bank in 1935 with an initial paid-up capital of `0.05 billion. The Bank was nationalised with effect from January 1, 1949 and its entire ownership remains vested in the Government of India. The paid-up capital continues to be `0.05 billion as per section 4 of the Reserve Bank of India Act,1934.
ii) Reserve Fund
The original Reserve Fund of ̀ 0.05 billion was created in terms of section 46 of the Reserve Bank of India Act,1934 as contribution from the Central Government for the currency liability of the then sovereign government taken over by the Reserve Bank. Thereafter, an amount of `64.95 billion was credited to this Fund from out of gains on periodic revaluation of gold up to October 1990, taking it to `65 billion. The fund has been static since then and gain/loss on account of valuation of gold and foreign currency is booked in the Currency and Gold Revaluation Account (CGRA) which is part of the balance sheet head ‘Other Liabilities’ and provisions.
iii) Other Reserves
This includes National Industrial Credit (Long Term Operations) Fund and National Housing Credit (Long Term Operations) Fund.
a. National Industrial Credit (Long Term Operations) Fund
This fund was created in July 1964, under section 46C of the Reserve Bank of India Act, 1934 with an initial corpus of `100

ANNUAL REPORT
154
million. The fund witnessed annual contributions from the Reserve Bank for fi nancial assistance to eligible fi nancial institutions. Since 1992-93, a token amount of ̀ 10 million is being contributed each year to the Fund from the Bank’s income. The balance in the fund stood at `0.24 billion as on June 30, 2015.
b. National Housing Credit (Long Term Operations) Fund
This fund was set up in January 1989 under section 46D of the Reserve Bank of India Act,1934 for extending fi nancial accommodation to the National Housing Bank. The initial corpus of `500 million has been enhanced by annua l contributions from the Reserve Bank thereafter. From the year 1992-93, only a token amount of ̀ 10 million is contributed each year from the Bank’s income. The balance in the fund stood at `1.98 billion as on June 30, 2015.
c. Contribution to other Funds
There are two other Funds constituted under section 46A of the Reserve Bank of India Act,1934 viz., National Rural Credit (Long Term Operations) Fund and National Rural Credit (Stabilisation) Fund which are maintained by the National Bank fo r Agr icu l tu re and Rura l Development (NABARD) for which a token amount of `10 million each is transferred to NABARD every year.
iv) Deposits
These represent the balances maintained with the Reserve Bank by banks, the Central and State Governments, All India Financial Institutions, such as, Export Import Bank of India (EXIM Bank) and NABARD, Foreign
Central Banks, International Financial Institutions, balance in different accounts relating to the Employees’ Provident Fund, and balance in the Depositors’ Education and Awareness Fund (DEA Fund). DEA Fund was created in the year 2013-14 for promotion of depositors’ interest and for such other related purposes. Total deposits stood at `5,186.86 billion as on June 30, 2015 as compared with `3,769.45 billion as on June 30, 2014, registering an increase of 37.60 per cent.
a. Deposits – Government
The Reserve Bank acts as banker to the central government in terms of sections 20 and 21 and as banker to the state governments by mutual agreement in terms of section 21(A) of the Reserve Bank of India Act, 1934. Accordingly, the central and the state governments maintain deposits with the Reserve Bank. The balances held by the central and state governments were ̀ 1.01 billion and ̀ 0.43 billion respectively as on June 30, 2015, totalling `1.44 billion.
b. Deposits – Banks
Banks maintain balances in their current accounts with the Reserve Bank to provide for the Cash Reserve Ratio (CRR) requirements and for working funds to meet payment and settlement obligations. The amount of deposits in the current account of banks as on June 30, 2015 stood at `3,946.85 billion as compared with `3,677.24 billion as on June 30, 2014, registering an increase of 7.33 per cent during the year.
c. Deposits - Others
‘Deposits- Others’ consists of balances of Administrator of the RBI Employees’
THE RESERVE BANK’S ACCOUNTS FOR 2014-15
155
Prov ident Fund, ba lance in the Depositors’ Education and Awareness Fund (DEA Fund), balances in accounts of Foreign Central Banks, Indian and International Financial Institutions and outstanding Reverse Repo. From 2014-15, Reverse Repo transactions are being treated as deposit of funds with the Bank and therefore the outstanding Reverse Repo now forms par t of ‘Deposit-Others’. The amount under Deposits-Others increased by 1264.21 per cent from `90.79 billion as on June 30, 2014 to ̀ 1,238.57 billion as on June 30, 2015 primarily due to amounts held by the Bank under reverse repo transactions.
v) Other Liabilities and Provisions
The major components of ‘Other Liabilities and Provisions’ are provisions under different heads and Gratuity and Superannuation Fund. Till 2013-14 balances held in Gratuity and Superannuation Funds were shown under ‘Deposits’-Others’. These are now shown under ‘Other Liabilities and Provisions’. Whi le Cont ingency Fund and Asset Development Fund represent provisions made for unforeseen contingencies and internal capital expenditure respectively, the remaining components of ‘Other Liabilities and Provisions’, such as, Currency and Gold revaluation account (CGRA), Investment Revaluation Account (IRA) and Foreign Exchange Forward Contracts Valuation Account (FCVA), represent unrealised marked to market gains/losses. Other Liabilities and Provisions declined by 0.63 per cent from `8,961.70 billion as on June 30, 2014 to `8,905.03 billion as on June 30, 2015, primarily due to decline in the balance held in CGRA.
a. Contingency Fund
The Cont ingency Fund ( former ly Contingency Reserve) represents the amount set aside on a year-to-year basis for meeting unexpected and unforeseen contingencies, including depreciation in the value of securities, risks arising out of monetary/exchange rate policy operations, systemic risks and any risk arising on account of the special responsibilities enjoined upon the Bank.
b. Asset Development Fund
The Asset Development Fund (formerly Asset Development Reserve) created in 1997-98, represents the amounts provided out of income each year to meet internal capital expenditure and make investments in subsidiaries and associated institutions. During the year, there has been an addition of ̀ 10 billion to provide for further investment as capital in the National Housing Bank.
c. Currency and Gold Revaluation Account (CGRA)
Following the best international practices, unrealised gains/losses on valuation of Foreign Currency Assets (FCA) and Gold are not taken to the Income Account but instead recorded under a balance sheet head named as the Currency and Gold Revaluation Account (CGRA). CGRA represents accumulated net balance of unrealised gains arising out of valuation of FCA and Gold and, therefore, its balance varies with the size of the asset base, movement in the exchange rate and price of gold. During 2014-15, the balances in CGRA decreased by 2.27 per cent from ̀ 5,721.63 billion as on

ANNUAL REPORT
156
June 30, 2014 to `5,591.93 billon as on June 30, 2015 mainly due to appreciation of US Dollar against other major currencies and fall in the price of Gold.
d. Investment Revaluation Account (IRA)
The foreign dated securities are marked to market on the last business day of each month and the unrealised gains/losses arising therefrom are transferred to the IRA. The balance in the IRA as on June 30, 2015 was `32.14 billion as compared with ̀ 37.91 billion as on June 30, 2014.
e. Foreign Exchange Forward Contracts Valuation Account (FCVA) & Provision for Forward Contracts Valuation Account (PFCVA)
MTM of outstanding forward contracts as on June 30, 2015 resulted in a net loss of `0.39 billion, which was debited to the FCVA with contra credit to the PFCVA. As per the extant policy, the debit balance of `0.39 billion in FCVA was adjusted against the Contingency Fund on June 30, 2015 and reversed on July 1, 2015. Accordingly, the balance in FCVA and PFCVA as on June 30, 2015 was n i l and `0 .39 b i l l i on respectively, as against a balance of `.42.98 billion and nil respectively as on June 30, 2014.
The position of balances in CGRA, IRA, FCVA and PFCVA for the last fi ve years is given in Table XI.3.
f. Surplus transferable to the Government of India
Under Section 47 of the Reserve Bank of India Act, 1934 after making provisions for bad and doubtful debts, depreciation
in assets, contribution to staff and
superannuation fund and for all matters
for which provisions are to be made by
or under the Act or that are usually
provided by bankers, the balance of the
profi ts of the Bank is required to be paid
to the Central Government. Under
Section 48 of the Reserve Bank Act,
1934 the Bank is not liable to pay income
tax or super tax or any other tax on any
of its income, profi ts or gains and is also
exempt from payment of wealth tax.
Accordingly, after adjusting expenditure,
the contribution of an amount of `0.04
bil l ion to the statutory funds, and
necessary provisions, the surplus
transferable to the Government of India
for the year 2014-15 amounted to
`658.96 billion, (including `11.46 billion
as against `12.69 billion in the previous
year payable towards the difference in
interest expenditure borne by the
Government consequent on conversion
of special securities into marketable
securities).
Table XI.3: Balances in Currency and Gold Revaluation Account (CGRA), Foreign Exchange Forward Contracts Valuation Account (FCVA), Provision for Forward Contracts Valuation Account (PFCVA) and Investment Revaluation Account (IRA)
(` billion)
As on June 30 CGRA FCVA# PFCVA@ IRA
1 2 3 4 5
2011 1,822.86 0.01 -- 42.69
2012 4,731.72 24.05 -- 122.22
2013 5,201.13 16.99 -- 24.85
2014 5,721.63 42.98 0.00 37.91
2015 5,591.93 0.00 0.39 32.14
# The equivalent account was Exchange Equalisation Account (EEA) till 2012-13.
@ Opened during 2013-14.
THE RESERVE BANK’S ACCOUNTS FOR 2014-15
157
g. Bills Payable
The Reserve Bank provides remittance facilities for its constituents and also meets its own payments requirements through issue of Demand Drafts (DDs) and Payment Orders (POs) (besides electronic payments mechanisms). The balance under this head represents the unclaimed DDs/ POs . The total amount outstanding under this head decreased from `0.37 billion as on June 30, 2014 to `0.17 billion as on June 30, 2015 mainly due to lesser use of DDs/POs.
h. Miscellaneous
This is a residual category representing items such as interest earned on earmarked securities, amounts payable on leave encashment, etc. Till 2013-14 this category included margin maintained on Repo transactions, which has since been discontinued following the change in accounting treatment of Repo under LAF and MSF. The decrease in balance under this category from `68.24 billion as on June 30, 2014 to `30.83 billion as on June 30, 2015 was mainly on account of discontinuation of accounting of margins in respect of Repo under LAF and MSF.
vi Liabilities of Issue Department- Notes Issued
The liabilities of the Issue Department refl ect the quantum of currency notes in circulation. Section 34 (l) of the Reserve Bank of India Act requires that all bank notes issued by the Reserve Bank since April 1, 1935 and the currency notes issued by the Government of India before the commencement of operations of the Reserve Bank be part of the liabilities of the Issue
Department. The currency notes in circulation increased by 9.57 per cent from ̀ 13,445.16 billion as on June 30, 2014 to `14,732.43 billion as on June 30, 2015.
XI.11.2 ASSETS
11.2.1 Assets of Banking Department (BD)
The assets comprise Notes, Rupee Coin and Small Coin, Gold Coin and Bullion, Foreign Currency Assets, investments in Rupee Securities, Bills Purchased and Discounted, Loans and Advances, Investment in Subsidiaries, Other Assets. The details are as under:
i) Notes, Rupee Coin and Small Coin
This is the balance of bank notes, one rupee notes, rupee coins of ̀ 1, 2, 5 and 10 and small coins kept in the vaults of the Banking Department to meet the day to day requirements of the banking functions conducted by the Reserve Bank. The balance as on June 30, 2015 was `0.11 billion, which was the same as on June 30, 2014.
ii) Gold Coin and Bullion
Bank holds 557.75 metric tonnes of gold, of which 292.26 metric tonnes are held as backing for notes issued and shown separately as an asset of Issue Department. The balance 265.49 metric tonnes is treated as an asset of Banking Department. The value of gold held as asset of Banking Department declined by 1.93 per cent from `590.24 billion as on June 30, 2014 to `578.84 billion as on June 30, 2015 on account of decline in international gold prices.
iii) Bills Purchased and Discounted
Though the Reserve Bank can undertake purchase and discounting of commercial bills under the Reserve Bank of India Act,1934, no such activity has been undertaken in 2014-15;
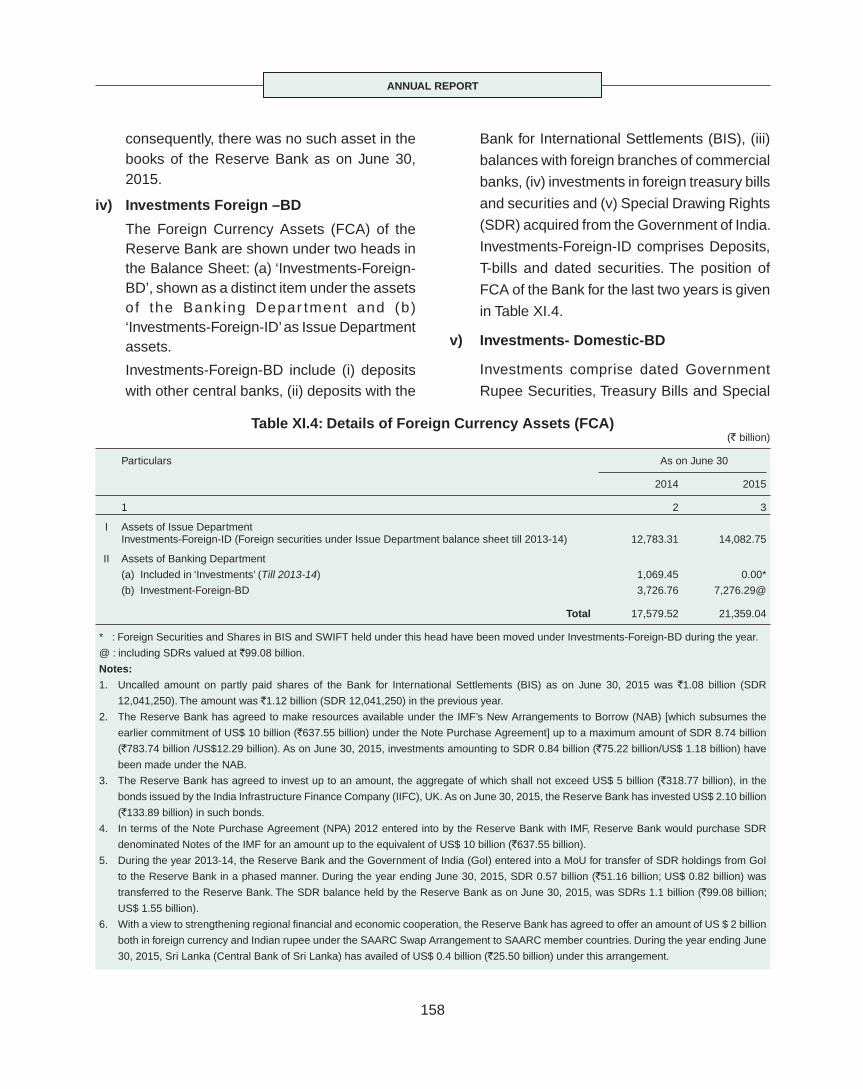
ANNUAL REPORT
158
consequently, there was no such asset in the books of the Reserve Bank as on June 30, 2015.
iv) Investments Foreign –BD
The Foreign Currency Assets (FCA) of the Reserve Bank are shown under two heads in the Balance Sheet: (a) ‘Investments-Foreign-BD’, shown as a distinct item under the assets of the Banking Depar tment and (b) ‘Investments-Foreign-ID’ as Issue Department assets.
Investments-Foreign-BD include (i) deposits with other central banks, (ii) deposits with the
Bank for International Settlements (BIS), (iii)
balances with foreign branches of commercial
banks, (iv) investments in foreign treasury bills
and securities and (v) Special Drawing Rights
(SDR) acquired from the Government of India.
Investments-Foreign-ID comprises Deposits,
T-bills and dated securities. The position of
FCA of the Bank for the last two years is given
in Table XI.4.
v) Investments- Domestic-BD
Investments comprise dated Government
Rupee Securities, Treasury Bills and Special
Table XI.4: Details of Foreign Currency Assets (FCA)(` billion)
Particulars As on June 30
2014 2015
1 2 3
I Assets of Issue DepartmentInvestments-Foreign-ID (Foreign securities under Issue Department balance sheet till 2013-14) 12,783.31 14,082.75
II Assets of Banking Department
(a) Included in ‘Investments’ (Till 2013-14) 1,069.45 0.00*
(b) Investment-Foreign-BD 3,726.76 7,276.29@
Total 17,579.52 21,359.04
* : Foreign Securities and Shares in BIS and SWIFT held under this head have been moved under Investments-Foreign-BD during the year.
@ : including SDRs valued at `99.08 billion.
Notes:
1. Uncalled amount on partly paid shares of the Bank for International Settlements (BIS) as on June 30, 2015 was `1.08 billion (SDR
12,041,250). The amount was `1.12 billion (SDR 12,041,250) in the previous year.
2. The Reserve Bank has agreed to make resources available under the IMF’s New Arrangements to Borrow (NAB) [which subsumes the
earlier commitment of US$ 10 billion (`637.55 billion) under the Note Purchase Agreement] up to a maximum amount of SDR 8.74 billion
(`783.74 billion /US$12.29 billion). As on June 30, 2015, investments amounting to SDR 0.84 billion (`75.22 billion/US$ 1.18 billion) have
been made under the NAB.
3. The Reserve Bank has agreed to invest up to an amount, the aggregate of which shall not exceed US$ 5 billion (`318.77 billion), in the
bonds issued by the India Infrastructure Finance Company (IIFC), UK. As on June 30, 2015, the Reserve Bank has invested US$ 2.10 billion
(`133.89 billion) in such bonds.
4. In terms of the Note Purchase Agreement (NPA) 2012 entered into by the Reserve Bank with IMF, Reserve Bank would purchase SDR
denominated Notes of the IMF for an amount up to the equivalent of US$ 10 billion (`637.55 billion).
5. During the year 2013-14, the Reserve Bank and the Government of India (GoI) entered into a MoU for transfer of SDR holdings from GoI
to the Reserve Bank in a phased manner. During the year ending June 30, 2015, SDR 0.57 billion (`51.16 billion; US$ 0.82 billion) was
transferred to the Reserve Bank. The SDR balance held by the Reserve Bank as on June 30, 2015, was SDRs 1.1 billion (`99.08 billion;
US$ 1.55 billion).
6. With a view to strengthening regional fi nancial and economic cooperation, the Reserve Bank has agreed to offer an amount of US $ 2 billion
both in foreign currency and Indian rupee under the SAARC Swap Arrangement to SAARC member countries. During the year ending June
30, 2015, Sri Lanka (Central Bank of Sri Lanka) has availed of US$ 0.4 billion (`25.50 billion) under this arrangement.

THE RESERVE BANK’S ACCOUNTS FOR 2014-15
159
Oil bonds. However, as on June 30, 2015 the Bank did not hold any treasury bills. The Reserve Bank’s holdings of domestic securities held as part of Bank’s investments came down by 22.58 per cent, from ̀ 6,684.68 billion as on June 30, 2014 to `5174.97 billion as on June 30, 2015.The decrease was on account of (a) change in accounting treatment of Repo/Reverse Repo under LAF and MSF (b) liquidity management operations conducted by the Bank, and (c) GoI securities maturing during the year 2014-15.
vi) Loans and Advances
a) Central and State Governments
These loans are extended in the form of Ways and Means Advances (WMA) in terms of Section 17(5) of the Reserve Bank of India Act and the limit in case of central government is fi xed from time to time in consultation with them and in case of state governments, the limits are fi xed based on the recommendations of Advisory Committee/Group constituted for this purpose. No loans and advances to the centra l government were outstanding as on June 30, 2015 and June 30, 2014. Loans and advances to the state governments as on June 30, 2015 stood at ̀ 25.77 billion as compared with `6.66 billion as on June 30, 2014.
b) Loans and advances to Commercial and Co-operative banks
These mainly include refi nance availed from the Reserve Bank under the export credit refi nance (ECR) facility against eligible outstanding export credit and amounts outstanding under Repo under Liquidity Adjustment facility (LAF)and Marginal Standing Facility (MSF). From the year 2014-15, Repo under LAF and
MSF are being treated as lending and refl ected under this head, as a result of which, the balance under this head, increased by 147.87 per cent from `295.51 billion as on June 30, 2014 to `732.48 billion as on June 30, 2015.
c) Loans and advances to NABARD
The Reserve Bank can extend loans to NABARD under section 17 (4E) of the Reserve Bank of India Act,1934. As on June 30, 2015 no loan is outstanding.
d) Loans and advances to others
The balance under this head represents loans and advances to National Housing B a n k ( N H B ) , S m a l l I n d u s t r i e s Development Bank of India (SIDBI), liquidity support provided to Primary Dealers (PDs) and outstanding Repo/Term Repo conducted with the PDs amounting to `44.07 billion. The balance under this head decreased by 35.81 per cent from `68.66 billion as on June 30, 2014 to ̀ 44.07 billion as on June 30, 2015 primarily on account of repayment of loans by SIDBI.
vii) Investment in Subsidiaries
The details of holdings in subsidiaries institutions as on June 30, 2015 are given in Table XI.5.
Table XI 5: Holdings in subsidiaries(Amount in ` billion)
Cost % holding
1 2 3
a) Deposit Insurance and Credit Guarantee Corporation (DICGC)
0.50 100
b) National Bank for Agriculture and Rural Development( NABARD)
0.20 1
c) National Housing Bank ( NHB) 4.50 100
d) Bharatiya Reserve Bank Note MudranPvt. Ltd. (BRBNMPL)
8.00 100
Total 13.20

ANNUAL REPORT
160
viii) Other Assets
a. ‘Other Assets’ comprise fi xed assets (net of depreciation), accrued income on domestic and foreign investments, balances held in Swap Amortisation Account (SAA), Revaluation of Forward Contracts Account (RFCA) and Miscellaneous Assets. Miscellaneous Assets comprise mainly loans and advances to staff, amount spent on projects pending completion, security deposit paid etc. The amount outstanding under ‘Other Assets’ decreased by 8.66 per cent from `343.13 billion as on June 30, 2014 to `313.43 billion as on June 30, 2015 primarily on account of marked to market loss on forward contracts as on June 30, 2015 as against marked to market gain as on June 30, 2014.
b. Swap Amortisation Account (SAA)
In the case of swaps that are in the nature of repo at off-market rates, the difference between the future contract rate and the rate at which the contract is entered is amortised over the period of the contract and held in the SAA. The balance in this account increased by 59 per cent from `59.30 billion as on June 30, 2014 to ̀ 94.33 billion as on June 30, 2015. The amounts held in this account will be reversed on maturity of the underlying contracts.
c. Revaluation of Forward Contracts Account (RFCA)
Forward contracts which are entered into as part of intervention operations are marked to market on June 30. The net gain is required to be recorded in the RFCA, and reversed on the maturity of the underlying contracts. The balance in this account as on June 30, 2015 was nil on account of marked to market loss on forward contracts.
11.2.2 Assets of Issue Department
The eligible assets of the Issue Department held as backing for notes issued consist of Gold Coin and Bullion, Rupee Coin, Foreign Currency Assets, Government of India non-interest bearing Rupee Securities and Domestic Bills of Exchange and other Commercial Papers. The Reserve Bank holds 557.75 metric tonnes of gold, of which 292.26 metric tonnes are held in India as backing for notes issued (Table XI.6). The value of gold held as backing for notes issued decreased by 1.93 per cent from `649.78 billion as on June 30, 2014 to `637.23 billion as on June 30, 2015, refl ecting declining international bullion prices. Consequent upon an increase in notes issued, foreign currency assets held as backing for notes issued increased by 10.17 per cent from `12,783.31 billion as on June 30, 2014 to ̀ 14,082.75 billion as on June 30, 2015. The balance of Rupee coins held by Issue Department increased by 15.70 per cent from `1.72 billion as on June 30, 2014 to `1.99 billion as on June 30, 2015. The amount of non-interest bearing rupee securities remained unchanged at `10.46 billion.
XI.12 Foreign Currency Assets and Foreign Exchange Reserves
The Foreign Exchange Reserves (FER) predominantly comprises FCA, besides gold,
Table XI.6: Physical holding of Gold
As on June 30, 2014
As on June 30, 2015
Volume in metric tonnes
Volume in metric tonnes
1 2 3
Gold held for backing note issue (held in India)
292.26 292.26
Gold held as asset of Banking Department (held abroad)
265.49 265.49
Total 557.75 557.75
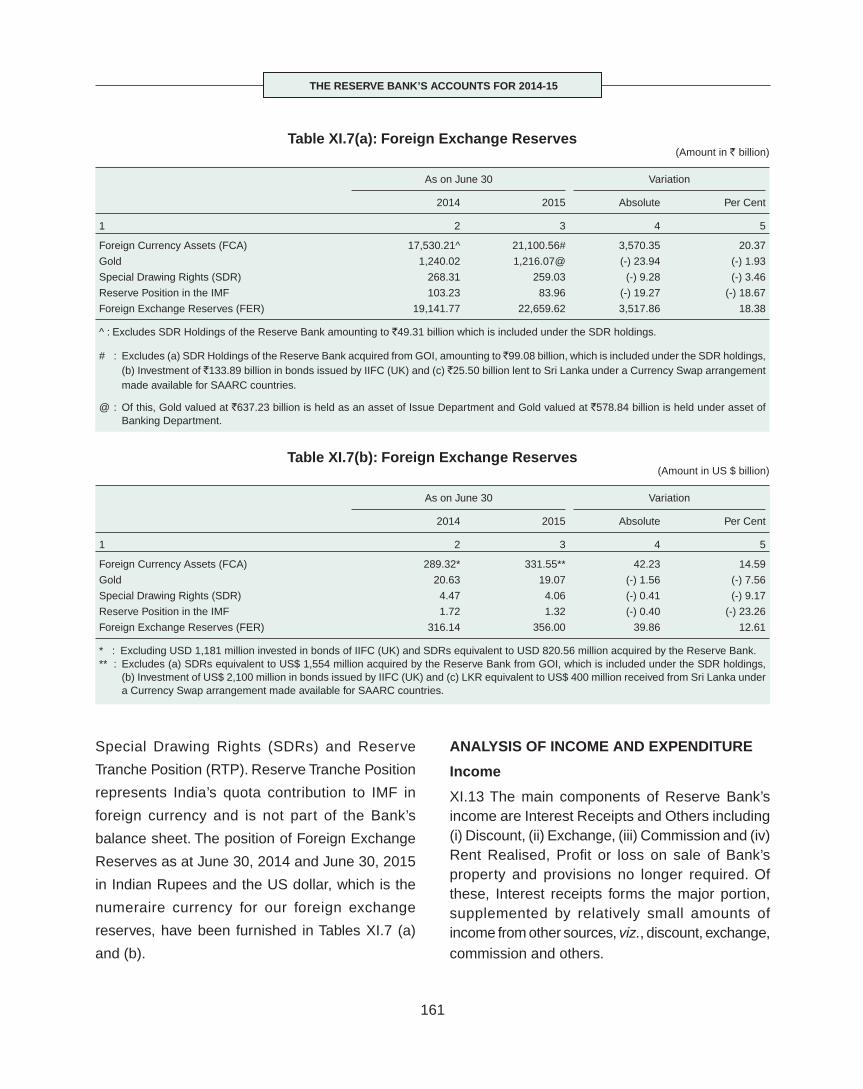
THE RESERVE BANK’S ACCOUNTS FOR 2014-15
161
Special Drawing Rights (SDRs) and Reserve
Tranche Position (RTP). Reserve Tranche Position
represents India’s quota contribution to IMF in
foreign currency and is not part of the Bank’s
balance sheet. The position of Foreign Exchange
Reserves as at June 30, 2014 and June 30, 2015
in Indian Rupees and the US dollar, which is the
numeraire currency for our foreign exchange
reserves, have been furnished in Tables XI.7 (a)
and (b).
ANALYSIS OF INCOME AND EXPENDITURE
Income
XI.13 The main components of Reserve Bank’s income are Interest Receipts and Others including (i) Discount, (ii) Exchange, (iii) Commission and (iv) Rent Realised, Profi t or loss on sale of Bank’s property and provisions no longer required. Of these, Interest receipts forms the major portion, supplemented by relatively small amounts of income from other sources, viz., discount, exchange, commission and others.
Table XI.7(a): Foreign Exchange Reserves(Amount in ` billion)
As on June 30 Variation
2014 2015 Absolute Per Cent
1 2 3 4 5
Foreign Currency Assets (FCA) 17,530.21^ 21,100.56# 3,570.35 20.37
Gold 1,240.02 1,216.07@ (-) 23.94 (-) 1.93
Special Drawing Rights (SDR) 268.31 259.03 (-) 9.28 (-) 3.46
Reserve Position in the IMF 103.23 83.96 (-) 19.27 (-) 18.67
Foreign Exchange Reserves (FER) 19,141.77 22,659.62 3,517.86 18.38
^ : Excludes SDR Holdings of the Reserve Bank amounting to `49.31 billion which is included under the SDR holdings.
# : Excludes (a) SDR Holdings of the Reserve Bank acquired from GOI, amounting to ̀ 99.08 billion, which is included under the SDR holdings, (b) Investment of `133.89 billion in bonds issued by IIFC (UK) and (c) `25.50 billion lent to Sri Lanka under a Currency Swap arrangement made available for SAARC countries.
@ : Of this, Gold valued at `637.23 billion is held as an asset of Issue Department and Gold valued at `578.84 billion is held under asset of Banking Department.
Table XI.7(b): Foreign Exchange Reserves(Amount in US $ billion)
As on June 30 Variation
2014 2015 Absolute Per Cent
1 2 3 4 5
Foreign Currency Assets (FCA) 289.32* 331.55** 42.23 14.59
Gold 20.63 19.07 (-) 1.56 (-) 7.56
Special Drawing Rights (SDR) 4.47 4.06 (-) 0.41 (-) 9.17
Reserve Position in the IMF 1.72 1.32 (-) 0.40 (-) 23.26
Foreign Exchange Reserves (FER) 316.14 356.00 39.86 12.61
* : Excluding USD 1,181 million invested in bonds of IIFC (UK) and SDRs equivalent to USD 820.56 million acquired by the Reserve Bank.** : Excludes (a) SDRs equivalent to US$ 1,554 million acquired by the Reserve Bank from GOI, which is included under the SDR holdings,
(b) Investment of US$ 2,100 million in bonds issued by IIFC (UK) and (c) LKR equivalent to US$ 400 million received from Sri Lanka under a Currency Swap arrangement made available for SAARC countries.

ANNUAL REPORT
162
Earnings from Foreign Sources
XI.14 The income from foreign sources, increased
by 30.2 per cent from `197.68 billion in 2013-14 to
`257.44 billion in 2014-15 mainly on account of
increase in the size of foreign currency assets which
increased from `17,579.52 billion rupees as on
June 30, 2014 to `21, 359.03 billion rupees as on
June 30, 2015. The rate of earnings on foreign
currency assets was higher at 1.36 per cent in
2014-15 as compared with 1.21 per cent in 2013-14
(Table XI.8).
Earnings from Domestic Sources
XI.15 The net income from domestic sources
increased by 19.29 per cent from `448.49 billion
in 2013-14 to `535.00 billion in 2014-15, mainly
on account of lower depreciation on rupee
securities as the prices of Government securities
stayed in a narrow range throughout the year. The
substantial decline in depreciation by `382.17
billion was offset to a large extent by lower profi ts
realised on sales of securities as the central
government is now being compensated based on
the weighted average rate of the term auctions
conducted by the Reserve Bank during the year
as against the earlier system of investing in
government securities from out of the Bank’s
holdings. The details of earnings from domestic
sources are given in Table XI.9.
XI.16 The coupon receipts was slightly lower at
`436.30 billion in 2014-15 as compared to ̀ 470.53
billion as the Reserve Bank’s holding of rupee
securities came down on account of Open Market
Operations (OMO) sales (including the sales on
NDS-OM) and redemption of securities on maturity.
No OMO purchases were conducted during the
year.
XI.17 The net interest income from LAF and MSF
(Interest on Repo and MSF less interest paid by
the Bank on Reverse Repo) decreased by 60.53
per cent from `76.47 billion in 2013-14 to `30.17
billion in 2014-15 largely on account of lower
Average Daily Net Liquidity Injection through RBI
windows (Repo, Reverse Repo, MSF, Term Repo
& Term Reverse Repo).
XI.18 Interest income on Ways and Means
Advances (WMA)/Overdraft (OD) from the Centre
and States increased by 21.91 per cent from ̀ 3.88
billion as on June 30, 2014 to `4.73 billion as on
June 30, 2015. The interest received on account of
WMA/OD from the central government during 2014-
15 was `3.57 billion as compared to `3.22 billion
during 2013-14 due to higher average utilisation of
OD for 19 days by the central government as
compared to lower utilisation of OD for 9 days in
the previous year. The interest received on WMA/
OD/Special Drawing Fund (SDF) from states during
the year 2014-15 was ̀ 1.16 billion as compared to
Table XI.8: Earnings from Foreign Sources(` billion)
Item As on June 30 Variation
2014 2015 Absolute Per Cent
1 2 3 4 5
Foreign Currency Assets (FCA) 17,579.52 21,359.04 3,779.51 21.50
Average FCA 16,368.93 18,909.29 2,540.36 15.52
Earnings from FCA (interest, discount, exchange gain/loss, capital gain/loss on securities) 197.68 257.44 59.76 30.23
Earnings from FCA as per cent of average FCA 1.21 1.36 0.15 12.40

THE RESERVE BANK’S ACCOUNTS FOR 2014-15
163
`0.66 billion for the year 2013 –14. This is attributable to signifi cantly higher daily average utilisation of WMA/OD/SDF by the States at ̀ 14.46 billion in 2014-15 as against `8.51 billion during 2013-14.
Expenditure
XI.19 The Reserve Bank incurs expenditure in the course of performing its statutory functions by way of agency charges/commission, printing of notes, expenses on remittance of treasure besides staff related and other expenses. The total expenditure of the Reserve Bank increased by 11.92 per cent from `119.34 billion in 2013-14 to `133.56 billion in 2014-15.
i) Interest Payment
During 2014-15 interest of `0.01 billion was
credited to Dr B.R.Ambedkar Fund that was
set up for giving scholarship to wards of staff.
ii) Employee cost
The employee cost decreased by 6.15 per cent
from ̀ 43.24 billion in 2013-14 to ̀ 40.58 billion
in 2014-15. The major component of employee
cost is gratuity and superannuation. The
decrease is mainly due to the decrease in the
contribution towards accrued liabilities of the
Gratuity and Superannuation Fund and other
funds based on the actuarial valuation. The
Table XI.9: Earnings from Domestic Sources(` billion)
Item Year ended Variation
June 30, 2014 June 30, 2015 Absolute Per cent
1 2 3 4 5
Domestic Assets 8664.04 7656.01 (-)1008.03 (-)11.63Weekly Average of Domestic Assets 8694.77 7828.99 (-)865.78 (-)9.96Earnings (I + II+III) 448.49 535.00 86.51 19.29
I. Interest and other Securities Related Incomei) Profi t on Sale of Securities 331.37 139.15 (-)192.22 (-)58.01
ii) Net Interest on LAF Operations 59.02 28.30 (-)30.72 (-)52.05
iii) Interest on MSF operations 17.45 1.88 (-)15.57 (-)89.23
iv) Interest on holding of Domestic Securities 470.53 436.30 (-)34.23 (-)7.27
v) Depreciation (-)480.45 (-)98.28 382.17 79.54
Sub total (i+ii+iii+iv+v) 397.92 507.35 109.43 27.50
II. Interest on Loans and Advancesi) To Government (Central & States) 3.88 4.73 0.85 21.91
ii) To Banks & Financial Institutions 33.10 8.87 (-)24.23 (-)73.20
iii) To Employees 0.48 0.46 (-)0.02 (-)4.17
Sub total (i+ii+iii) 37.46 14.06 (-)23.40 (-)62.47
III. Other Earningsi) Discount 0.01 0.00 (-)0.01 (-)100
ii) Exchange 0.00 0.00 0.00 0.00
iii) Commission 12.57 13.38 0.81 6.44
iv) Rent realised, Profi t or Loss on sale of Bank’s property and Provisions no longer required.
0.53 0.21 (-)0.32 (-)60.38
Sub total (i+ii+iii+iv) 13.11 13.59 0.48 3.66

ANNUAL REPORT
164
contribution for the year 2014-15 was `14.83 billion as against ̀ 18.09 billion in the previous year. GoI dated rupee securities, equivalent to the balances in Provident Fund, Gratuity & Superannuation Fund, Leave Encashment Fund and Medical Assistance Fund, held by the Bank have been specifi cally ear-marked for these Funds.
iii) Agency Charges
a. Agency Commission on Government Transactions
The Reserve Bank discharges the function of banker to the government through a large network of agency bank branches that serve as retail outlets for government transactions. The Reserve Bank pays commission to these agency banks at prescribed rates which were last revised with effect from July 01, 2012. The agency commission paid to these banks on account of government business for the year 2014-15 was `29.63 billion as compared with `27.81 billion for the year 2013-14, registering an increase of 6.54 per cent. The increase in agency commission could be attributed to the growth in number of transactions and amount involved in government receipts and payments.
b. Underwriting Commission paid to the Primary Dealers (PDs)
Reserve Bank paid total underwriting commission of `0.33 billion to PDs during 2014-15 as compared to `4.81 billion during 2013-14. Underwriting commission was on the lower side as compared to last year due to softening of yields during the year (10 year benchmark yield decreased by around
86 bps) on account of various reasons like RBI rate cut by 75 bps, softening of crude prices; fall in CPI and WPI etc. As the market conditions were benign and r isk of devolvement reduced, PDs d e m a n d e d l e s s e r u n d e r w r i t i n g commission as compared to last year when market conditions turned volatile after taper tantrum by US Fed in May 2013.
c. Fees paid to the External Asset Managers, custodians, etc.
Fees amounting to ̀ 0.49 billion were paid during the year July-June 2015 as compared to `0.63 billion in 2013-14 to the external asset managers who are entrusted with the management of a small portion of the Reserve Bank’s foreign exchange reserves and to custodians who hold the foreign assets of the Reserve Bank.
iv) Printing of notes
The expenditure incurred on printing of notes increased by 17.05 per cent from ̀ 32.14 billion in 2013-14 to `37.62 billion in 2014-15 mainly on account of increase in the supply of banknotes.
v) Other expenses
Other expenses consisting of expenditure on remittance of treasure, printing and stationery, a u d i t fe e s a n d r e l a t e d ex p e n s e s , miscellaneous expenses, etc. increased by 39.74 per cent from ̀ 10.67 billion as on June 30, 2014 to `14.91 billion as on June 30, 2015. This is primarily on account of increase in expenditure on Banking Development Scheme from `0.53 billion in 2013-14 to `3.03 billion in 2014-15.

THE RESERVE BANK’S ACCOUNTS FOR 2014-15
165
vi) Provisions
This represents an amount of `10 billion transferred to the ADF for the investment to be
made in the share capital of NHB.
Previous Year’s Figures
XI.20 Figures for the previous year have been
rearranged to make them comparable with the
current year.
Auditors
XI.21 The statutory auditors of the Bank are appointed by the Central Government in terms of Section 50 of the RBI Act, 1934. The accounts of the Reserve Bank for the year 2014-15 were audited by M/s Haribhakti & Co. LLP, Mumbai and M/s CNK & Associates LLP, Mumbai as the Statutory Central Auditors and M/s M Choudhury and Co., M/s Sundaram & Srinivasan and M/s V K Verma & Co. as Statutory Branch Auditors.

ANNUAL REPORT
166
ANNEXCHRONOLOGY OF
MAJOR POLICY ANNOUNCEMENTS: JULY 2014 TO JUNE 2015*
Date of Announcement
Policy Initiative
Monetary Policy Department
August 5, 2014 SLR was reduced by 50 bps to 22.0 per cent of NDTL effective August 9, 2014.
September 30 ECR liquidity was reduced from 32 per cent of eligible export credit outstanding to 15 per cent effective October 10, 2014.
January 15, 2015 Policy repo rate was reduced by 25 bps to 7.75 per cent.
February 3 SLR was reduced by 50 bps to 21.5 per cent of NDTL effective February 7, 2015. ECR facility was replaced by the system level liquidity effective February 7, 2015.
February 20 The Government and the Reserve Bank entered into an agreement on the Monetary Policy framework introducing fl exible infl ation targeting.
March 4 Policy repo rate was reduced by 25 bps to 7.5 per cent.
June 2 Policy repo rate was reduced by 25 bps to 7.25 per cent.
Financial Inclusion and Development Department
August 14, 2014 The operational guidelines of the Self Employment Programme (SEP) component of National Urban Livelihoods Mission (NULM) were issued in line with restructuring of the existing Swarna Jayanti Shahari Rozgar Yojana (SJSRY) as NULM.
November 13 Guidelines were issued on fi nancing of 0.5 million Joint Liability Groups of ‘Bhoomi Heen Kisan’ through NABARD.
December 3 Instructions on credit facilities to minority communities were made applicable to the Jain community in view of its notifi cation as minority community under Section 2(c) of the National Commission for Minorities (NCM) Act, 1992.
December 9 Revised guidelines were issued for 2014-15 on Interest Subvention Scheme under the National Rural Livelihoods Mission (NRLM).
December 10 Classifi cation of priority sector lending shortfall and interest payable to banks falling in such categories on deposits placed by them in the Rural Infrastructure Development Fund (RIDF) and other funds, were restructured. The revised deposit rates were linked to shortfall in overall priority sector lending targets.
January 2, 2015 SLBC convenor banks and lead banks were advised to complete the process of providing banking services to unbanked villages with population below 2,000 by August 14, 2015 in line with PMJDY instead of March 2016 as prescribed earlier.
January 28 Banks were advised to dispense with obtaining ‘No Due Certifi cate’ from individual borrowers (including SHGs and JLGs) for all types of loans, including loans under Government sponsored schemes, irrespective of the amount involved unless the Government sponsored scheme itself provides for obtention of ‘No Due Certifi cate’.
February 25 Overdrafts extended by banks up to ` 5,000 in PMJDY accounts were made eligible for classifi cation under priority sector advances (‘others’ category) as also weaker sections, provided the borrower’s household annual income did not exceed ` 60,000 for rural areas and ` 1,20,000 for non-rural areas.
March 13 Priority sector loans to persons with disabilities were made eligible for classifi cation under the weaker sections category.
*: Indicative in nature and details available on the Reserve Bank’s website.
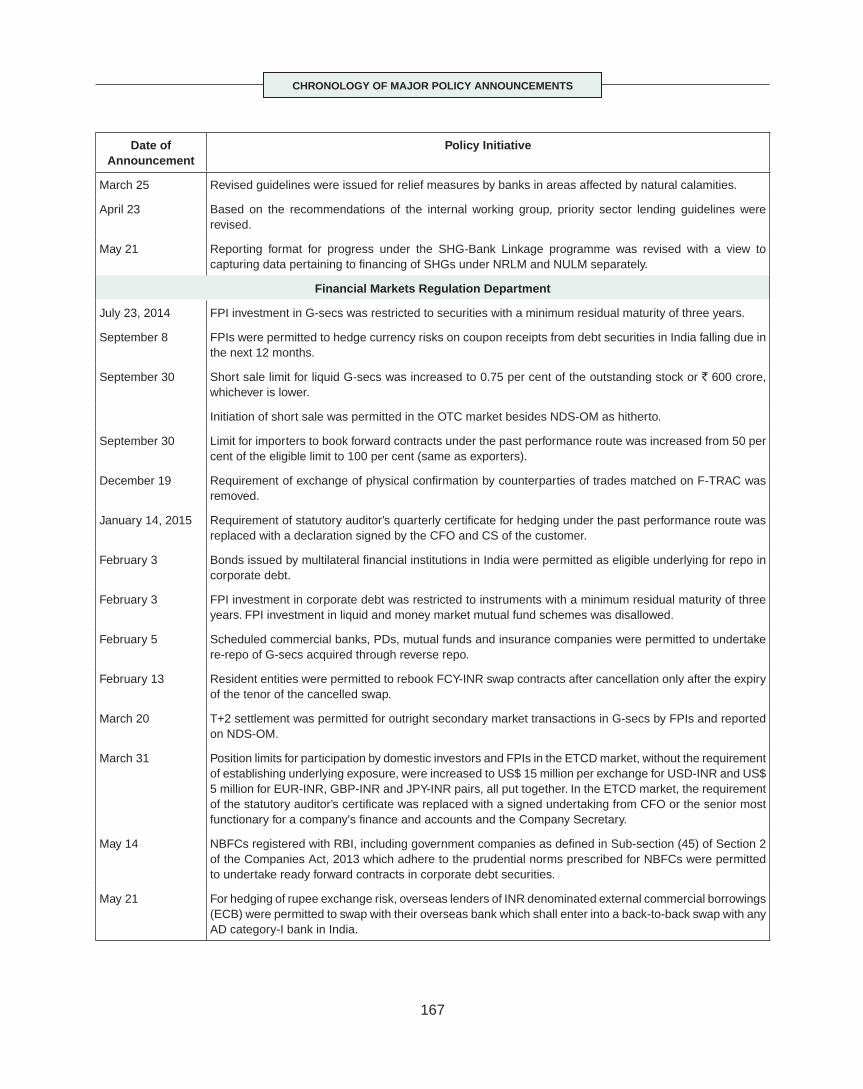
167
CHRONOLOGY OF MAJOR POLICY ANNOUNCEMENTS
Date of Announcement
Policy Initiative
March 25 Revised guidelines were issued for relief measures by banks in areas affected by natural calamities.
April 23 Based on the recommendations of the internal working group, priority sector lending guidelines were revised.
May 21 Reporting format for progress under the SHG-Bank Linkage programme was revised with a view to capturing data pertaining to fi nancing of SHGs under NRLM and NULM separately.
Financial Markets Regulation Department
July 23, 2014 FPI investment in G-secs was restricted to securities with a minimum residual maturity of three years.
September 8 FPIs were permitted to hedge currency risks on coupon receipts from debt securities in India falling due in the next 12 months.
September 30 Short sale limit for liquid G-secs was increased to 0.75 per cent of the outstanding stock or ` 600 crore, whichever is lower.
Initiation of short sale was permitted in the OTC market besides NDS-OM as hitherto.
September 30 Limit for importers to book forward contracts under the past performance route was increased from 50 per cent of the eligible limit to 100 per cent (same as exporters).
December 19 Requirement of exchange of physical confi rmation by counterparties of trades matched on F-TRAC was removed.
January 14, 2015 Requirement of statutory auditor’s quarterly certifi cate for hedging under the past performance route was replaced with a declaration signed by the CFO and CS of the customer.
February 3 Bonds issued by multilateral fi nancial institutions in India were permitted as eligible underlying for repo in corporate debt.
February 3 FPI investment in corporate debt was restricted to instruments with a minimum residual maturity of three years. FPI investment in liquid and money market mutual fund schemes was disallowed.
February 5 Scheduled commercial banks, PDs, mutual funds and insurance companies were permitted to undertake re-repo of G-secs acquired through reverse repo.
February 13 Resident entities were permitted to rebook FCY-INR swap contracts after cancellation only after the expiry of the tenor of the cancelled swap.
March 20 T+2 settlement was permitted for outright secondary market transactions in G-secs by FPIs and reported on NDS-OM.
March 31 Position limits for participation by domestic investors and FPIs in the ETCD market, without the requirement of establishing underlying exposure, were increased to US$ 15 million per exchange for USD-INR and US$ 5 million for EUR-INR, GBP-INR and JPY-INR pairs, all put together. In the ETCD market, the requirement of the statutory auditor’s certifi cate was replaced with a signed undertaking from CFO or the senior most functionary for a company's fi nance and accounts and the Company Secretary.
May 14 NBFCs registered with RBI, including government companies as defi ned in Sub-section (45) of Section 2 of the Companies Act, 2013 which adhere to the prudential norms prescribed for NBFCs were permitted to undertake ready forward contracts in corporate debt securities.
May 21 For hedging of rupee exchange risk, overseas lenders of INR denominated external commercial borrowings (ECB) were permitted to swap with their overseas bank which shall enter into a back-to-back swap with any AD category-I bank in India.
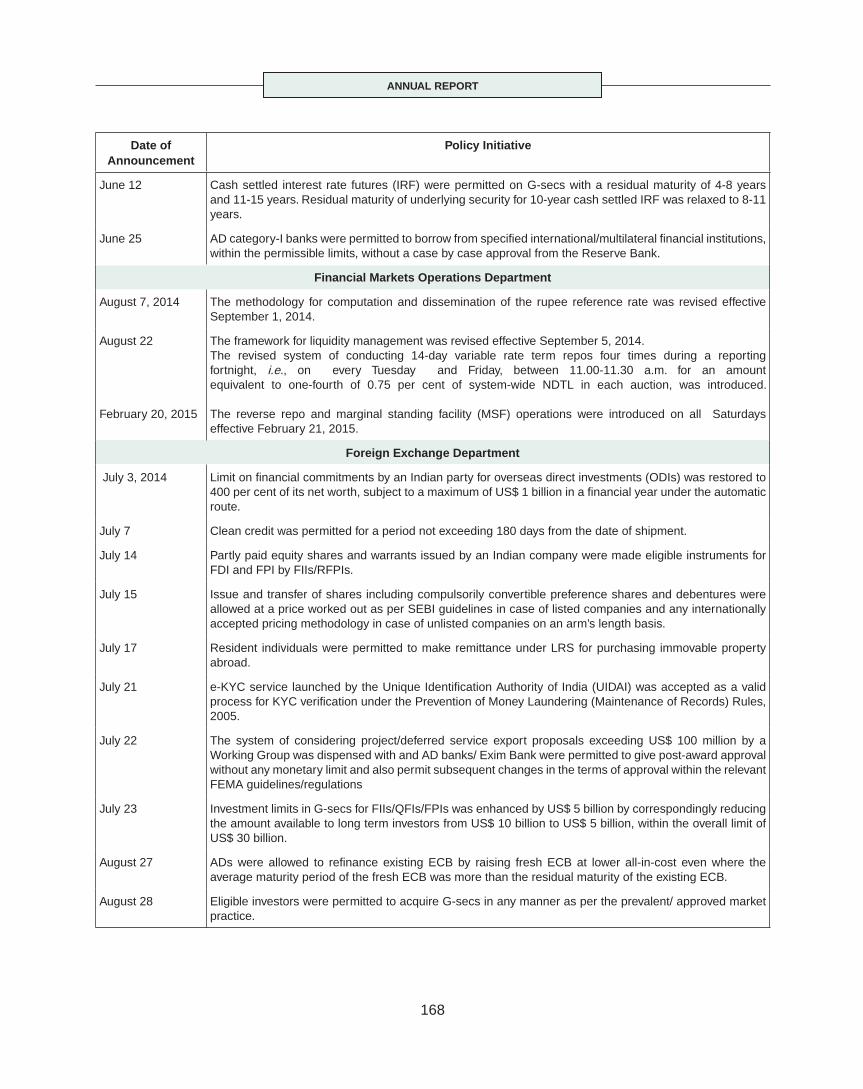
ANNUAL REPORT
168
Date of Announcement
Policy Initiative
June 12 Cash settled interest rate futures (IRF) were permitted on G-secs with a residual maturity of 4-8 years and 11-15 years. Residual maturity of underlying security for 10-year cash settled IRF was relaxed to 8-11 years.
June 25 AD category-I banks were permitted to borrow from specifi ed international/multilateral fi nancial institutions, within the permissible limits, without a case by case approval from the Reserve Bank.
Financial Markets Operations Department
August 7, 2014 The methodology for computation and dissemination of the rupee reference rate was revised effective September 1, 2014.
August 22
February 20, 2015
The framework for liquidity management was revised effective September 5, 2014. The revised system of conducting 14-day variable rate term repos four times during a reporting fortnight, i.e., on every Tuesday and Friday, between 11.00-11.30 a.m. for an amount equivalent to one-fourth of 0.75 per cent of system-wide NDTL in each auction, was introduced.
The reverse repo and marginal standing facility (MSF) operations were introduced on all Saturdays effective February 21, 2015.
Foreign Exchange Department
July 3, 2014 Limit on fi nancial commitments by an Indian party for overseas direct investments (ODIs) was restored to 400 per cent of its net worth, subject to a maximum of US$ 1 billion in a fi nancial year under the automatic route.
July 7 Clean credit was permitted for a period not exceeding 180 days from the date of shipment.
July 14 Partly paid equity shares and warrants issued by an Indian company were made eligible instruments for FDI and FPI by FIIs/RFPIs.
July 15 Issue and transfer of shares including compulsorily convertible preference shares and debentures were allowed at a price worked out as per SEBI guidelines in case of listed companies and any internationally accepted pricing methodology in case of unlisted companies on an arm’s length basis.
July 17 Resident individuals were permitted to make remittance under LRS for purchasing immovable property abroad.
July 21 e-KYC service launched by the Unique Identifi cation Authority of India (UIDAI) was accepted as a valid process for KYC verifi cation under the Prevention of Money Laundering (Maintenance of Records) Rules, 2005.
July 22 The system of considering project/deferred service export proposals exceeding US$ 100 million by a Working Group was dispensed with and AD banks/ Exim Bank were permitted to give post-award approval without any monetary limit and also permit subsequent changes in the terms of approval within the relevant FEMA guidelines/regulations
July 23 Investment limits in G-secs for FIIs/QFIs/FPIs was enhanced by US$ 5 billion by correspondingly reducing the amount available to long term investors from US$ 10 billion to US$ 5 billion, within the overall limit of US$ 30 billion.
August 27 ADs were allowed to refi nance existing ECB by raising fresh ECB at lower all-in-cost even where the average maturity period of the fresh ECB was more than the residual maturity of the existing ECB.
August 28 Eligible investors were permitted to acquire G-secs in any manner as per the prevalent/ approved market practice.
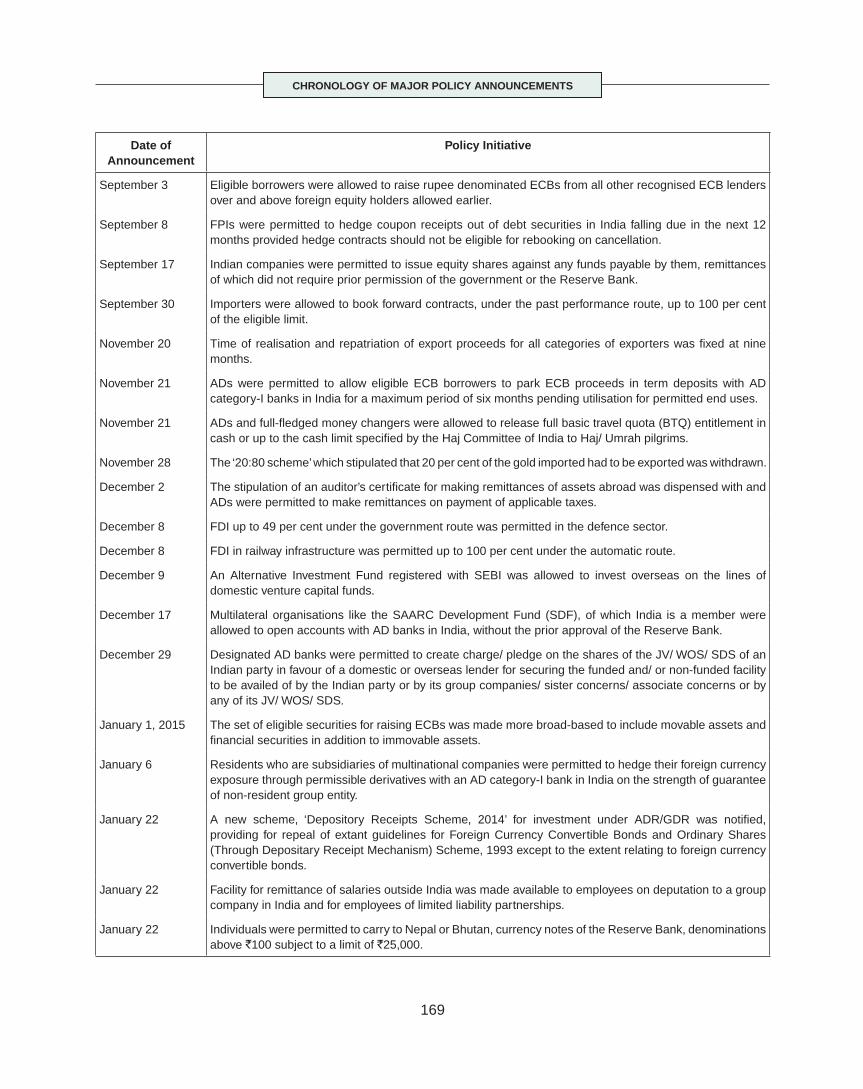
169
CHRONOLOGY OF MAJOR POLICY ANNOUNCEMENTS
Date of Announcement
Policy Initiative
September 3 Eligible borrowers were allowed to raise rupee denominated ECBs from all other recognised ECB lenders over and above foreign equity holders allowed earlier.
September 8 FPIs were permitted to hedge coupon receipts out of debt securities in India falling due in the next 12 months provided hedge contracts should not be eligible for rebooking on cancellation.
September 17 Indian companies were permitted to issue equity shares against any funds payable by them, remittances of which did not require prior permission of the government or the Reserve Bank.
September 30 Importers were allowed to book forward contracts, under the past performance route, up to 100 per cent of the eligible limit.
November 20 Time of realisation and repatriation of export proceeds for all categories of exporters was fi xed at nine months.
November 21 ADs were permitted to allow eligible ECB borrowers to park ECB proceeds in term deposits with AD category-I banks in India for a maximum period of six months pending utilisation for permitted end uses.
November 21 ADs and full-fl edged money changers were allowed to release full basic travel quota (BTQ) entitlement in cash or up to the cash limit specifi ed by the Haj Committee of India to Haj/ Umrah pilgrims.
November 28 The ‘20:80 scheme’ which stipulated that 20 per cent of the gold imported had to be exported was withdrawn.
December 2 The stipulation of an auditor’s certifi cate for making remittances of assets abroad was dispensed with and ADs were permitted to make remittances on payment of applicable taxes.
December 8 FDI up to 49 per cent under the government route was permitted in the defence sector.
December 8 FDI in railway infrastructure was permitted up to 100 per cent under the automatic route.
December 9 An Alternative Investment Fund registered with SEBI was allowed to invest overseas on the lines of domestic venture capital funds.
December 17 Multilateral organisations like the SAARC Development Fund (SDF), of which India is a member were allowed to open accounts with AD banks in India, without the prior approval of the Reserve Bank.
December 29 Designated AD banks were permitted to create charge/ pledge on the shares of the JV/ WOS/ SDS of an Indian party in favour of a domestic or overseas lender for securing the funded and/ or non-funded facility to be availed of by the Indian party or by its group companies/ sister concerns/ associate concerns or by any of its JV/ WOS/ SDS.
January 1, 2015 The set of eligible securities for raising ECBs was made more broad-based to include movable assets and fi nancial securities in addition to immovable assets.
January 6 Residents who are subsidiaries of multinational companies were permitted to hedge their foreign currency exposure through permissible derivatives with an AD category-I bank in India on the strength of guarantee of non-resident group entity.
January 22 A new scheme, ‘Depository Receipts Scheme, 2014’ for investment under ADR/GDR was notifi ed, providing for repeal of extant guidelines for Foreign Currency Convertible Bonds and Ordinary Shares (Through Depositary Receipt Mechanism) Scheme, 1993 except to the extent relating to foreign currency convertible bonds.
January 22 Facility for remittance of salaries outside India was made available to employees on deputation to a group company in India and for employees of limited liability partnerships.
January 22 Individuals were permitted to carry to Nepal or Bhutan, currency notes of the Reserve Bank, denominations above `100 subject to a limit of `25,000.

ANNUAL REPORT
170
Date of Announcement
Policy Initiative
January 23 AD banks were authorised to make changes in the amount of ECB, its draw-down, repayment schedules, average maturity period and all-in-cost.
February 12 Requirement of submission in Form A-1 to ADs for making payments towards imports was dispensed with.
February 12 Filing of the following returns was enabled on the e-Biz platform: Advance Remittance Form (ARF) used by companies to report FDI infl ow; and FCGPR Form for reporting the issue of instruments to the overseas investor against the above FDI infl ow.
March 11 Citizens of Macau and Hong Kong were prohibited from acquiring/ transferring immovable property in India akin to the prohibition for citizens of China.
March 31 A fi nancial institution or a branch of a fi nancial institution set up in IFSC will be treated as a person resident outside India.
April 8 FDI in the insurance sector was allowed up to 49 per cent.
April 30 Goods consigned to the importers of Nepal and Bhutan from third countries under merchant trade from India will qualify as traffi c-in-transit if the goods are otherwise compliant with the provisions of the India-Nepal Treaty of Transit and the Indo-Bhutan Treaty of Transit respectively.
May 14 Requirement of declaring export of goods/software in the statutory declaration form (SDF) in case of exports through the Electronic Data Interchange (EDI) ports was dispensed with as the mandatory statutory requirements contained in the SDF were subsumed in the shipping bill format.
May 21 ADs were advised not to insist on form A2 and physical presence of the account holder at the time of closure of FCNR (B) deposits.
May 21 Under the rupee drawing arrangements, the limit of trade transactions was increased to `15,00,000 per transaction from `5,00,000.
June 1 Limit of remittances under the liberalised remittance scheme (LRS) was increased to an umbrella limit of US$ 2,50,000/- subsuming various limits under Schedule III of the Foreign Exchange Management (Current Account Transaction) Rules, 2000.
June 11 NRIs were permitted to subscribe to chit funds, without limit, on a non-repatriation basis, provided the Registrar of Chits permitted any chit fund accordingly and the subscription was brought in through the normal banking channel, including through an account maintained with a bank in India.
June 18 From the half year ending June 2015, BEF submission will be online and bank-wise.
Department of Banking Regulation
July 15, 2014 Banks were allowed to extend structured long term project loans with periodic refi nancing option to new projects in infrastructure and core industries sectors.
July 15 Banks were allowed to issue long term bonds (minimum 7 years) for fi nancing their infrastructure and affordable housing loans, with exemptions from CRR/SLR and computing of ANBC for priority sector obligations.
July 17 Banks were advised on the list of offi cially valid documents (OVD) for KYC. Procedure for opening of accounts by low risk customers was also simplifi ed.
July 22 Banks were allowed to decide on the quantum of loans against the pledge of gold jewellery and ornaments for non-agricultural end uses with bullet repayment of principal and interest.
August 7 Banks were allowed to refi nance existing project loans, even without a pre-determined agreement with other banks/ FIs, and fi x a longer repayment period, and this will not be considered as restructuring in the books of the existing as well as taking over lenders.
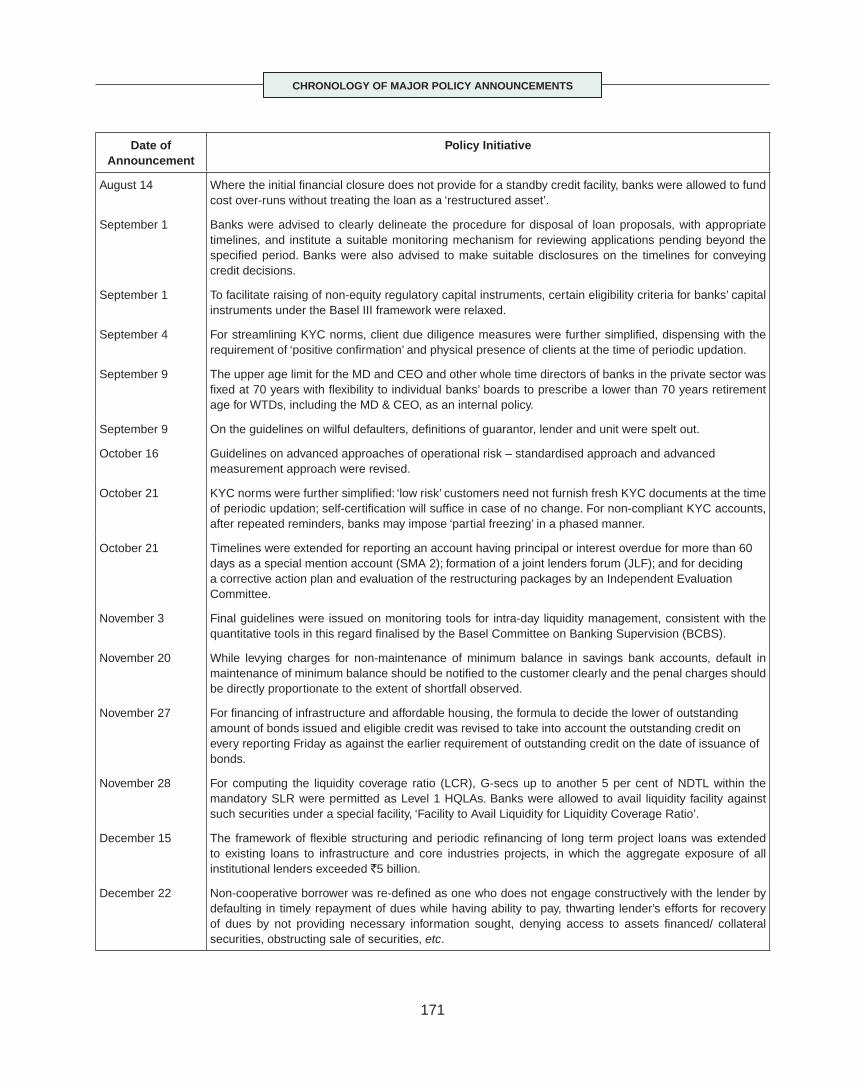
171
CHRONOLOGY OF MAJOR POLICY ANNOUNCEMENTS
Date of Announcement
Policy Initiative
August 14 Where the initial fi nancial closure does not provide for a standby credit facility, banks were allowed to fund cost over-runs without treating the loan as a ‘restructured asset’.
September 1 Banks were advised to clearly delineate the procedure for disposal of loan proposals, with appropriate timelines, and institute a suitable monitoring mechanism for reviewing applications pending beyond the specifi ed period. Banks were also advised to make suitable disclosures on the timelines for conveying credit decisions.
September 1 To facilitate raising of non-equity regulatory capital instruments, certain eligibility criteria for banks’ capital instruments under the Basel III framework were relaxed.
September 4 For streamlining KYC norms, client due diligence measures were further simplifi ed, dispensing with the requirement of ‘positive confi rmation’ and physical presence of clients at the time of periodic updation.
September 9 The upper age limit for the MD and CEO and other whole time directors of banks in the private sector was fi xed at 70 years with fl exibility to individual banks’ boards to prescribe a lower than 70 years retirement age for WTDs, including the MD & CEO, as an internal policy.
September 9 On the guidelines on wilful defaulters, defi nitions of guarantor, lender and unit were spelt out.
October 16 Guidelines on advanced approaches of operational risk – standardised approach and advanced measurement approach were revised.
October 21 KYC norms were further simplifi ed: ‘low risk’ customers need not furnish fresh KYC documents at the time of periodic updation; self-certifi cation will suffi ce in case of no change. For non-compliant KYC accounts, after repeated reminders, banks may impose ‘partial freezing’ in a phased manner.
October 21 Timelines were extended for reporting an account having principal or interest overdue for more than 60 days as a special mention account (SMA 2); formation of a joint lenders forum (JLF); and for deciding a corrective action plan and evaluation of the restructuring packages by an Independent Evaluation Committee.
November 3 Final guidelines were issued on monitoring tools for intra-day liquidity management, consistent with the quantitative tools in this regard fi nalised by the Basel Committee on Banking Supervision (BCBS).
November 20 While levying charges for non-maintenance of minimum balance in savings bank accounts, default in maintenance of minimum balance should be notifi ed to the customer clearly and the penal charges should be directly proportionate to the extent of shortfall observed.
November 27 For fi nancing of infrastructure and affordable housing, the formula to decide the lower of outstanding amount of bonds issued and eligible credit was revised to take into account the outstanding credit on every reporting Friday as against the earlier requirement of outstanding credit on the date of issuance of bonds.
November 28 For computing the liquidity coverage ratio (LCR), G-secs up to another 5 per cent of NDTL within the mandatory SLR were permitted as Level 1 HQLAs. Banks were allowed to avail liquidity facility against such securities under a special facility, ‘Facility to Avail Liquidity for Liquidity Coverage Ratio’.
December 15 The framework of fl exible structuring and periodic refi nancing of long term project loans was extended to existing loans to infrastructure and core industries projects, in which the aggregate exposure of all institutional lenders exceeded `5 billion.
December 22 Non-cooperative borrower was re-defi ned as one who does not engage constructively with the lender by defaulting in timely repayment of dues while having ability to pay, thwarting lender’s efforts for recovery of dues by not providing necessary information sought, denying access to assets fi nanced/ collateral securities, obstructing sale of securities, etc.
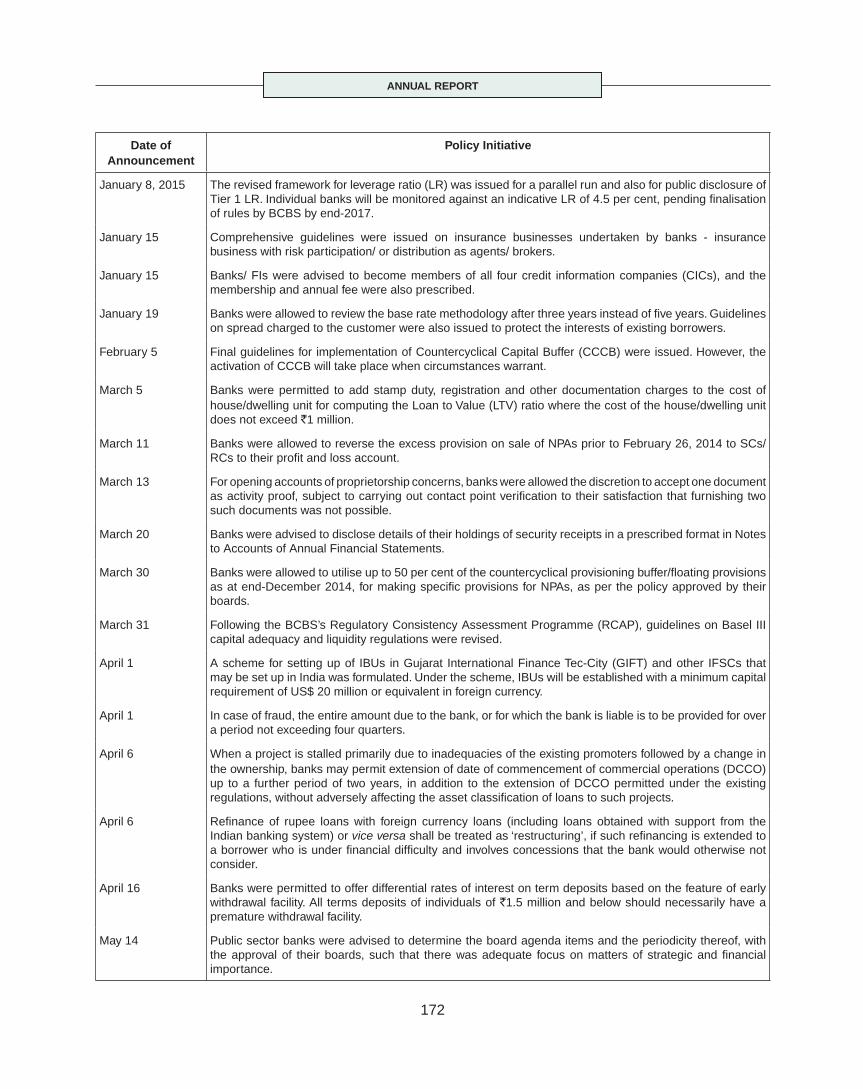
ANNUAL REPORT
172
Date of Announcement
Policy Initiative
January 8, 2015 The revised framework for leverage ratio (LR) was issued for a parallel run and also for public disclosure of Tier 1 LR. Individual banks will be monitored against an indicative LR of 4.5 per cent, pending fi nalisation of rules by BCBS by end-2017.
January 15 Comprehensive guidelines were issued on insurance businesses undertaken by banks - insurance business with risk participation/ or distribution as agents/ brokers.
January 15 Banks/ FIs were advised to become members of all four credit information companies (CICs), and the membership and annual fee were also prescribed.
January 19 Banks were allowed to review the base rate methodology after three years instead of fi ve years. Guidelines on spread charged to the customer were also issued to protect the interests of existing borrowers.
February 5 Final guidelines for implementation of Countercyclical Capital Buffer (CCCB) were issued. However, the activation of CCCB will take place when circumstances warrant.
March 5 Banks were permitted to add stamp duty, registration and other documentation charges to the cost of house/dwelling unit for computing the Loan to Value (LTV) ratio where the cost of the house/dwelling unit does not exceed `1 million.
March 11 Banks were allowed to reverse the excess provision on sale of NPAs prior to February 26, 2014 to SCs/RCs to their profi t and loss account.
March 13 For opening accounts of proprietorship concerns, banks were allowed the discretion to accept one document as activity proof, subject to carrying out contact point verifi cation to their satisfaction that furnishing two such documents was not possible.
March 20 Banks were advised to disclose details of their holdings of security receipts in a prescribed format in Notes to Accounts of Annual Financial Statements.
March 30 Banks were allowed to utilise up to 50 per cent of the countercyclical provisioning buffer/fl oating provisions as at end-December 2014, for making specifi c provisions for NPAs, as per the policy approved by their boards.
March 31 Following the BCBS’s Regulatory Consistency Assessment Programme (RCAP), guidelines on Basel III capital adequacy and liquidity regulations were revised.
April 1 A scheme for setting up of IBUs in Gujarat International Finance Tec-City (GIFT) and other IFSCs that may be set up in India was formulated. Under the scheme, IBUs will be established with a minimum capital requirement of US$ 20 million or equivalent in foreign currency.
April 1 In case of fraud, the entire amount due to the bank, or for which the bank is liable is to be provided for over a period not exceeding four quarters.
April 6 When a project is stalled primarily due to inadequacies of the existing promoters followed by a change in the ownership, banks may permit extension of date of commencement of commercial operations (DCCO) up to a further period of two years, in addition to the extension of DCCO permitted under the existing regulations, without adversely affecting the asset classifi cation of loans to such projects.
April 6 Refi nance of rupee loans with foreign currency loans (including loans obtained with support from the Indian banking system) or vice versa shall be treated as ‘restructuring’, if such refi nancing is extended to a borrower who is under fi nancial diffi culty and involves concessions that the bank would otherwise not consider.
April 16 Banks were permitted to offer differential rates of interest on term deposits based on the feature of early withdrawal facility. All terms deposits of individuals of `1.5 million and below should necessarily have a premature withdrawal facility.
May 14 Public sector banks were advised to determine the board agenda items and the periodicity thereof, with the approval of their boards, such that there was adequate focus on matters of strategic and fi nancial importance.

173
CHRONOLOGY OF MAJOR POLICY ANNOUNCEMENTS
Date of Announcement
Policy Initiative
May 21 The dispensation to amortise the loss on sale of NPAs to Securitisation Companies/Reconstruction Companies (SCs/RCs) over a period of two years was extended to assets sold up to March 31, 2016.
May 28 Private sector banks were advised to adhere to the Reserve Bank’s instructions of May 14, 2015 on calendar of reviews by PSB boards to the extent applicable.
May 28 Banks were advised to encourage and educate large agricultural borrowers, such as agricultural commodity processors, traders, millers and aggregators to hedge their risks related to agricultural commodity prices.
June 1 Private sector banks were advised to put in place board approved comprehensive compensation policies for the non-executive directors (other than part time chairman), covering compensation in the form of profi t related commission, not exceeding `1 million per annum for each of the non-executive directors.
June 1 Cross holding of long-term bonds issued for fi nancing infrastructure and affordable housing was allowed amongst banks.
June 8 A Strategic Debt Restructuring (SDR) scheme was issued, allowing conversion of bank loan dues into equity shares at a ‘fair price’ as per a prescribed pricing formula, which is exempted from the SEBI’s related regulations.
June 11 All-India Term Lending and Refi nancing Institutions were permitted to reverse the excess provision on sale of NPAs (sold prior to February 26, 2014 to SCs/RCs) to their profi t and loss accounts.
June 11 For KYC purposes, banks were advised to accept from low-risk customers additional documents as OVDs for proof of address, such as utility bills, municipal tax receipt, bank account statement and pension payment orders.
Department of Cooperative Bank Regulation
August 20, 2014 CBS-enabled UCBs having minimum assessed net worth of `500 million, satisfying Financially Sound and Well Managed (FSWM) criteria and having track record of regulatory compliance were permitted to open on-site/off-site/mobile ATMs without prior permission of the Reserve Bank.
September 3 The acquiring commercial banks should not incur any loss out of merger/transfer of assets and liabilities of UCBs and big depositors holding in excess of `0.1 million each will be required to sacrifi ce in proportion to the deposit erosion of the target bank.
October 13 Internet banking (view only) facility was permitted to all UCBs which have implemented CBS and migrated to IPv6.
October 13 FSWM criteria for UCBs was revised to include CBS as an additional condition for opening of on-site/off-site/mobile ATMs, approval of annual business plans (ABP), extension of area of operation and shifting of premises.
October 29 Scheduled UCBs which were CBS-enabled with 9 per cent CRAR and fully compliant with the Reserve Bank’s eligibility criteria, have been extended Liquidity Adjustment Facility (LAF) with effect from November 28, 2014.
October 29 UCBs were permitted to act as PAN Service Agents (PSAs) by entering into a tie-up with any agency authorised by the Income Tax Department, Government of India.
October 30 The ceiling on quantum of gold loans granted under the Bullet Repayment Scheme by UCBs was raised from `0.1 million to `0.2 million.
October 30 UCBs were advised to prominently display the full name of the bank as authorised by the Reserve Bank wherever abbreviated/abridged version of the name of UCB is used for logo/ brand building.
November 5 For compliance with the obligations under the PML Amendment Act, 2012, UCBs could also designate a person who holds the position of senior management or equivalent as a ‘Designated Director’. However, in no case, the Principal Offi cer should be nominated as ‘Designated Director’.
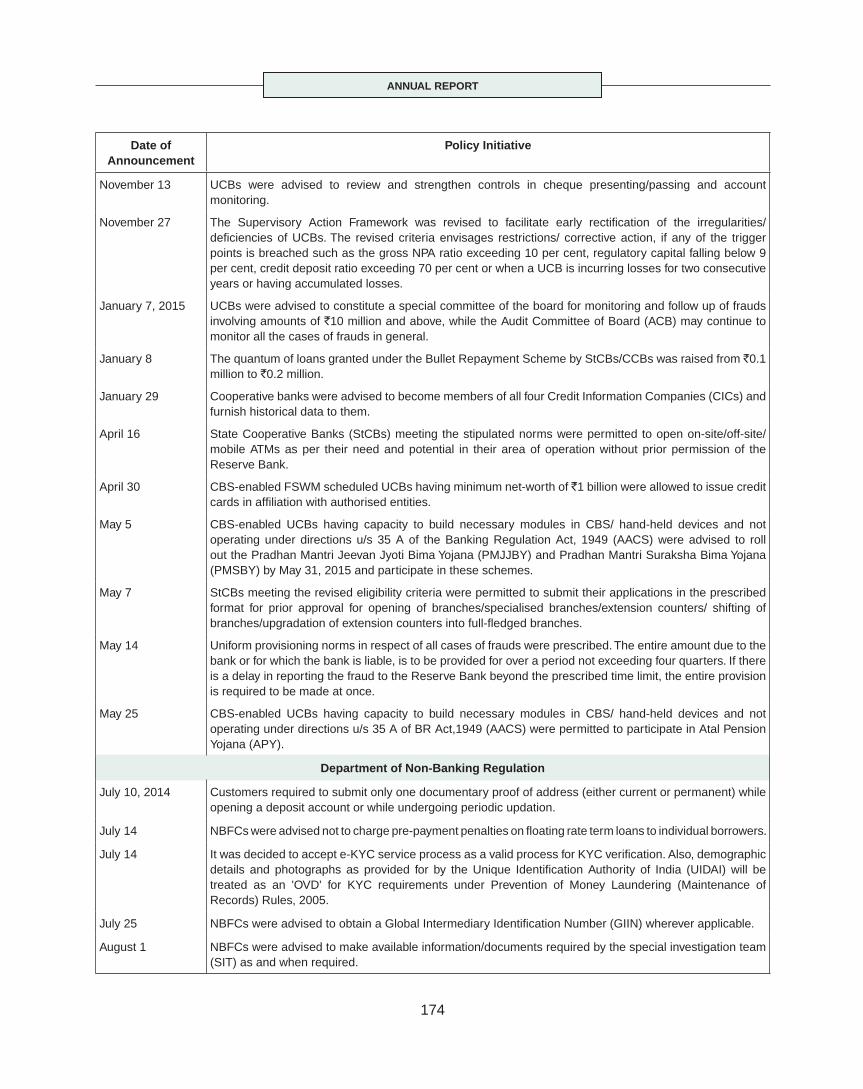
ANNUAL REPORT
174
Date of Announcement
Policy Initiative
November 13 UCBs were advised to review and strengthen controls in cheque presenting/passing and account monitoring.
November 27 The Supervisory Action Framework was revised to facilitate early rectifi cation of the irregularities/ defi ciencies of UCBs. The revised criteria envisages restrictions/ corrective action, if any of the trigger points is breached such as the gross NPA ratio exceeding 10 per cent, regulatory capital falling below 9 per cent, credit deposit ratio exceeding 70 per cent or when a UCB is incurring losses for two consecutive years or having accumulated losses.
January 7, 2015 UCBs were advised to constitute a special committee of the board for monitoring and follow up of frauds involving amounts of `10 million and above, while the Audit Committee of Board (ACB) may continue to monitor all the cases of frauds in general.
January 8 The quantum of loans granted under the Bullet Repayment Scheme by StCBs/CCBs was raised from `0.1 million to `0.2 million.
January 29 Cooperative banks were advised to become members of all four Credit Information Companies (CICs) and furnish historical data to them.
April 16 State Cooperative Banks (StCBs) meeting the stipulated norms were permitted to open on-site/off-site/mobile ATMs as per their need and potential in their area of operation without prior permission of the Reserve Bank.
April 30 CBS-enabled FSWM scheduled UCBs having minimum net-worth of `1 billion were allowed to issue credit cards in affi liation with authorised entities.
May 5 CBS-enabled UCBs having capacity to build necessary modules in CBS/ hand-held devices and not operating under directions u/s 35 A of the Banking Regulation Act, 1949 (AACS) were advised to roll out the Pradhan Mantri Jeevan Jyoti Bima Yojana (PMJJBY) and Pradhan Mantri Suraksha Bima Yojana (PMSBY) by May 31, 2015 and participate in these schemes.
May 7 StCBs meeting the revised eligibility criteria were permitted to submit their applications in the prescribed format for prior approval for opening of branches/specialised branches/extension counters/ shifting of branches/upgradation of extension counters into full-fl edged branches.
May 14 Uniform provisioning norms in respect of all cases of frauds were prescribed. The entire amount due to the bank or for which the bank is liable, is to be provided for over a period not exceeding four quarters. If there is a delay in reporting the fraud to the Reserve Bank beyond the prescribed time limit, the entire provision is required to be made at once.
May 25 CBS-enabled UCBs having capacity to build necessary modules in CBS/ hand-held devices and not operating under directions u/s 35 A of BR Act,1949 (AACS) were permitted to participate in Atal Pension Yojana (APY).
Department of Non-Banking Regulation
July 10, 2014 Customers required to submit only one documentary proof of address (either current or permanent) while opening a deposit account or while undergoing periodic updation.
July 14 NBFCs were advised not to charge pre-payment penalties on fl oating rate term loans to individual borrowers.
July 14 It was decided to accept e-KYC service process as a valid process for KYC verifi cation. Also, demographic details and photographs as provided for by the Unique Identifi cation Authority of India (UIDAI) will be treated as an 'OVD' for KYC requirements under Prevention of Money Laundering (Maintenance of Records) Rules, 2005.
July 25 NBFCs were advised to obtain a Global Intermediary Identifi cation Number (GIIN) wherever applicable.
August 1 NBFCs were advised to make available information/documents required by the special investigation team (SIT) as and when required.

175
CHRONOLOGY OF MAJOR POLICY ANNOUNCEMENTS
Date of Announcement
Policy Initiative
August 5 SCs/RCs were required to invest minimum 15 per cent of Security Receipts (SRs) of each class and each scheme issued by them on an on-going basis till redemption of SRs. Management fees should be calculated and charged as percentage of the minimum net asset value (NAV) specifi ed by a credit rating agency (rather than percentage of outstanding SRs at present) provided the same is not more than the acquisition value of the underlying asset. Asset Reconstruction Companies (ARCs) should also be members of a JLF. ARCs should put up on their websites at quarterly intervals the list of suit fi led accounts of wilful defaulters.
August 7 Every SC/RC was required to become a member of at least one CIC and provide to the CIC periodically accurate data / history of the borrowers.
August 8 Amendments were made to the regulatory framework pertaining to Mortgage Guarantee Companies.
August 12 All non-deposit taking NBFCs with asset size of `10 billion and above were allowed to participate in the interest rate futures market as trading members.
September 25 NBFCs were allowed to use the ratings of SMERA for the purpose of rating their fi xed deposits.
November 10 Threshold for defi ning systemic signifi cance for NBFCs-ND was revised to `5 billion from `1 billion. Tighter prudential norms were prescribed for NBFCs-ND-SI and all NBFCs-D.
November 10 Principal business criteria for NBFC-Factors revised to 50:50 from 75:75, in line with the Factoring Regulation Act, 2011.
December 1 Following the Prevention of Money-Laundering (Maintenance of Records) Amendment Rules, 2013, changes were carried out in KYC/AML guidelines.
January 2, 2015 Due diligence process/updation for KYC compliance was revised for various categories of customers, allowing third party verifi cation.
January 16 Revisions of the DCCO and consequential shift in repayment schedules will not be treated as restructuring if the revised DCCO falls within a period of two years and one year from the original DCCO for infrastructure and non-infrastructure projects respectively.
January 19 Flexible structuring and refi nancing of fresh term loans were allowed to long term project loans to infrastructure and core industries.
January 28 NBFCs registered as core investment companies, primary dealers and those purely into investment activities without any customer interface were exempt from the requirement of becoming members of CIC.
February 6 Minimum investment grade for long term fi xed deposit products provided by Brickwork Ratings India Pvt. Ltd. was advised to be equivalent to FBBB.
February 6 Credit institutions were mandated to become members of all CICs.
February 20 Guidelines on private placements were revised with the issue of non-convertible debentures (NCDs) categorised into two groups: (a) a subscription of `20,000 to `10 million per investor with a maximum of 200 subscribers in a fi nancial year and the issue being fully secured; and (b) a minimum subscription of `10 million and above with no limit on the number of subscribers and the need for the creation of security should be as approved by their boards.
February 24 The following changes in the shareholding pattern of a SC/RC will require the Reserve Bank’s prior approval: transfer of shares by which the transferee becomes a sponsor; transfer of shares by which the transfer or ceases to be a sponsor; and an aggregate transfer of 10 per cent or more of the total paid up share capital by a sponsor in fi ve years from the date of certifi cate of registration.
March 16 NBFCs could also designate a person who holds the position of senior management or equivalent, as a Designated Director.

ANNUAL REPORT
176
Date of Announcement
Policy Initiative
April 8 For NBFC-MFIs, limit on the total indebtedness of a borrower, excluding educational/medical expenses was raised to `100,000 from `50,000. Loans disbursed to a borrower with a rural household annual income not exceeding `100,000 or urban and semi-urban household income not exceeding `160,000 were included as qualifying assets.
April 10 NBFCs lending against collateral of listed shares were advised to maintain an LTV ratio of 50 per cent, accept only Group 1 securities (as specifi ed by SEBI) as collateral for loans of value more than `0.5 million where the lending is done for investment in the capital market.
April 10 Enhanced corporate governance guidelines were made applicable to NBFCs-ND-SIs and deposit taking NBFCs.
April 30 It was decided to dispense with the requirement of prior approval from the Reserve Bank for NBFCs to distribute mutual fund products.
April 30 While opening accounts of sole proprietary fi rms, NBFCs were given the discretion to accept only one of the prescribed documents as activity proof.
May 7 For restructuring proposals approved / to be approved by BIFR/CDR/JLF, SC/RCs were permitted to accept a resolution period co-terminus with other secured lenders.
May 14 Directions issued to infrastructure debt funds (IDFs) were amended to allow entry of IDF-NBFCs into sectors where there is no presence of a project authority. Risk weight as applicable to bonds held by IDF-NBFCs and assets of infrastructure fi nance companies were made applicable to all NBFCs.
May 21 Besides the Bombay Bullion Association Ltd. (BBA), rates of a commodity exchange regulated by the Forward Markets Commission were allowed to be used for valuation of gold jewellery for computing the LTV ratio.
June 25 NBFCs-ND were permitted to act as sub-agents under MTSS without requirement of prior approval from the Reserve Bank.
Department of Banking Supervision
July 1, 2014 Classifi cation and reporting system for frauds was prescribed, consolidating and updating earlier instructions.
September 5 Liquidity returns were prescribed for banks to monitor their resilience to potential liquidity disruptions under stress scenarios.
November 5 Preventive measures laid down for cheque related frauds.
December 15 Banks were advised to employ ‘decoy customers’ and conduct surprise checks for compliance with KYC/ AML/CFT norms.
March 4, 2015 Banks were advised to implement a comprehensive compliance plan with compliance testing and review structures in view of focus on compliance review in the Reserve Bank supervisory processes.
May 7 Banks were advised to follow a framework for fraud risk management, based on the recommendations of the Internal Working Group that looked into issues relating to prevention, early detection and reporting of fraud, penal measures for fraudulent borrowers, introducing, inter alia, the concepts of early warning signals and red fl agged accounts.
June 4 Banks were advised that henceforth concurrent auditors, who are chartered accountants, of branches below the cut-off point will submit Long Form Audit Reports (LFARs) only to the Chairman of the bank and the bank in turn will consolidate all such LFARs and submit to the Statutory Central Auditor as an internal document of the bank.

177
CHRONOLOGY OF MAJOR POLICY ANNOUNCEMENTS
Date of Announcement
Policy Initiative
Consumer Education and Protection Department
December 3, 2014 A Charter of Customer Rights was issued covering fi ve basic rights of bank customers.
February 11, 2015 The status on implementation of the charter will be monitored by the Reserve Bank in addition to a review by the bank’s board.
May 11 Public sector banks, select private and foreign banks were advised to appoint chief customer service offi cers, i.e., internal ombudsman.
Internal Debt Management Department
December 15, 2014 The quantum of securities classifi ed under HTM was restored to 100 per cent of audited NOF for the standalone PDs as at the end of the preceding fi nancial year, effective December 31, 2014. It was raised to 200 per cent in September 2013 due to excessive market volatility.
Department of Currency Management
December 31, 2014 The deadline for exchange of banknotes printed before 2005 was extended from December 31, 2014 to June 30, 2015.
February 3, 2015 The Regional Offi ces of the Reserve Bank were advised to continue with the Lead Bank Scheme for currency management in the identifi ed districts on a pilot basis for one more year and guide the nodal banks suitably.
April 17 The process of approval by the Reserve Bank for opening of currency chests by banks has been rationalised / simplifi ed from a multi-layered approval process to only one fi nal approval subject to certain conditions.
June 26 The deadline for exchange of banknotes printed before 2005 was extended from June 30, 2015 to December 31, 2015.
Department of Payment and Settlement Systems
August 14, 2014 The minimum number of free transactions at other banks ATMs was rationalised from fi ve to three at six metros and for own bank ATMs to fi ve.
August 22 Where cards issued by banks in India are used for making card not present payments within the country, such transactions have to be through a bank in India and settled only in Indian currency.
November 28 Guidelines on the Bharat Bill Payment System were issued, enabling the creation of pan-India touch points for bill payments by customers, irrespective of location.
December 3 PPI guidelines were revised, enhancing value of PPI with full KYC, increasing the validity period of gift cards, allowing issue of multiple PPIs for dependent/family members and rupee denominated PPIs for visiting foreign nationals/NRIs.
December 3 Guidelines for setting up of TReDS were issued to provide quick and effi cient fi nancing options for MSMEs.
December 4 Guidelines on mobile banking transactions were issued for adoption of best practices, such as greater degree of standardisation in procedures; registration options and timing, adoption of various channels/methods for quickening the process of MPIN generation, and customer education and awareness programme.
December 5 WLAs were permitted to accept international credit/debit/prepaid cards, facility of dynamic currency conversion for international cards at WLAs and also to enable tie-ups with other commercial banks for cash supply.
December 15 RTGS business hours were extended: 8:00 to 20:00 hours on weekdays and 8:00 to 15:30 hours on Saturdays.
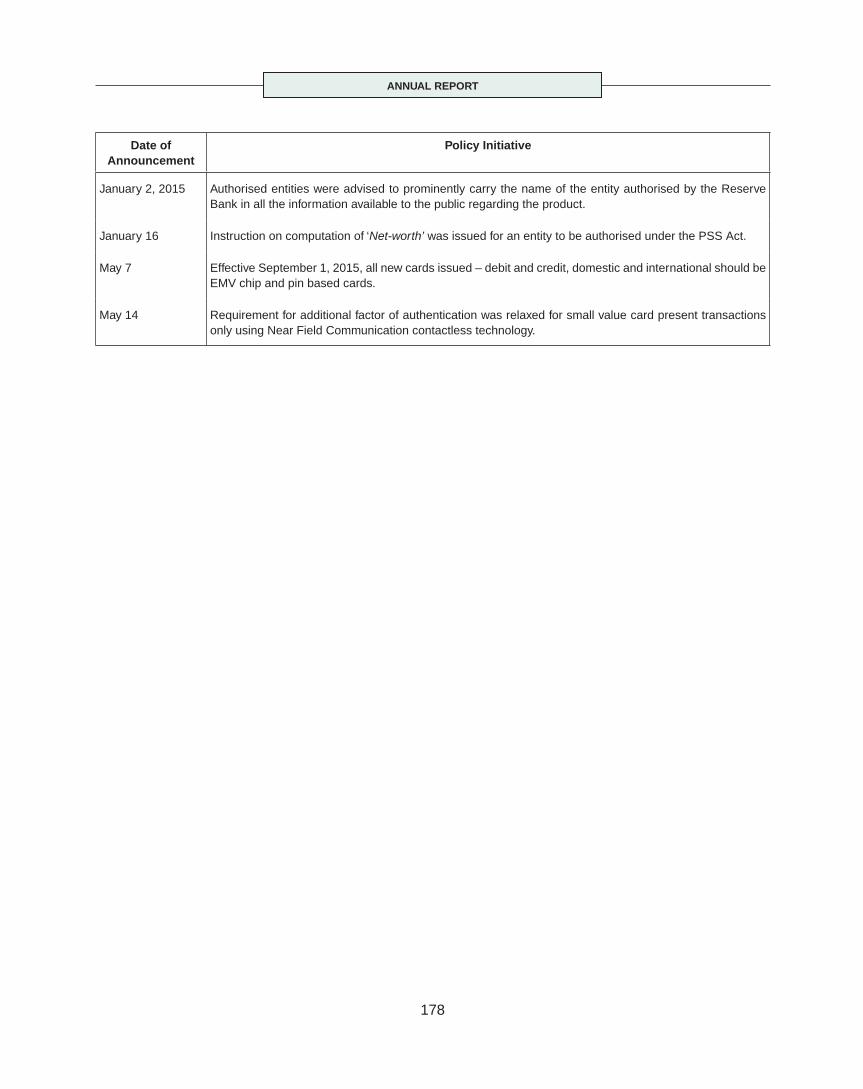
ANNUAL REPORT
178
Date of Announcement
Policy Initiative
January 2, 2015 Authorised entities were advised to prominently carry the name of the entity authorised by the Reserve Bank in all the information available to the public regarding the product.
January 16 Instruction on computation of ‘Net-worth’ was issued for an entity to be authorised under the PSS Act.
May 7 Effective September 1, 2015, all new cards issued – debit and credit, domestic and international should be EMV chip and pin based cards.
May 14 Requirement for additional factor of authentication was relaxed for small value card present transactions only using Near Field Communication contactless technology.
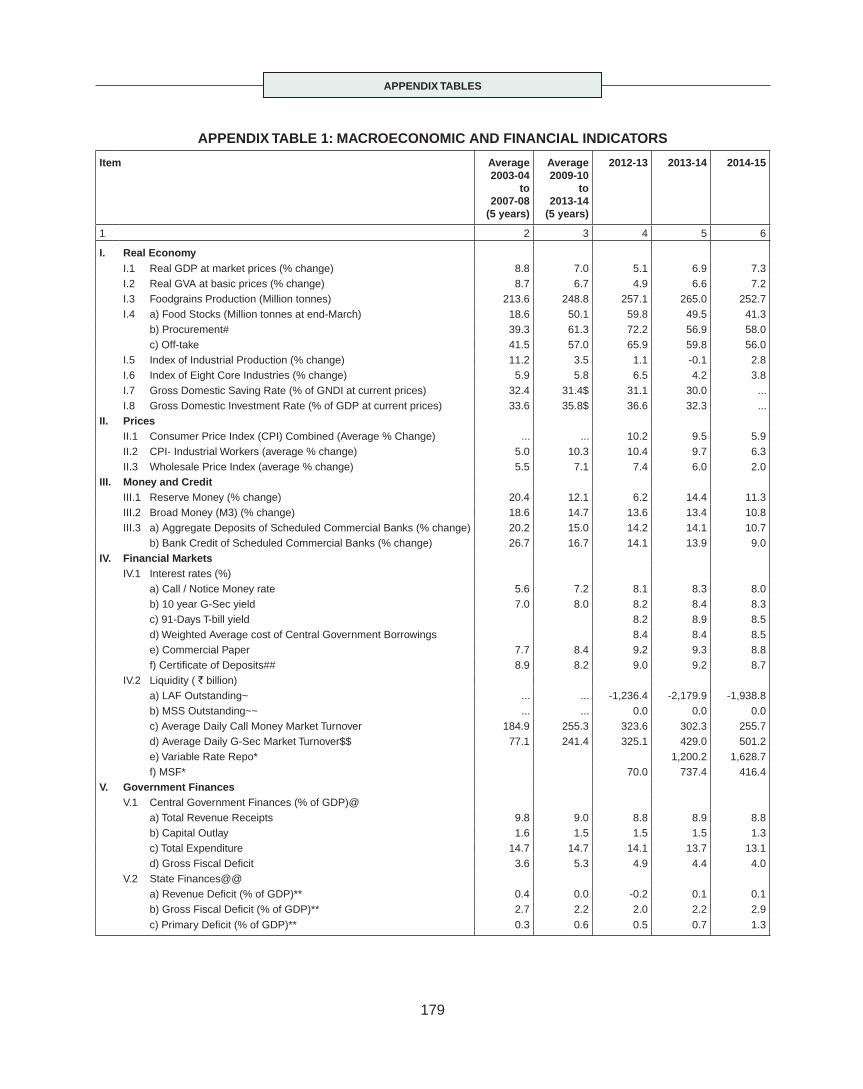
APPENDIX TABLES
179
APPENDIX TABLE 1: MACROECONOMIC AND FINANCIAL INDICATORS
Item Average 2003-04
to 2007-08
(5 years)
Average 2009-10
to 2013-14
(5 years)
2012-13 2013-14 2014-15
1 2 3 4 5 6
I. Real EconomyI.1 Real GDP at market prices (% change) 8.8 7.0 5.1 6.9 7.3I.2 Real GVA at basic prices (% change) 8.7 6.7 4.9 6.6 7.2I.3 Foodgrains Production (Million tonnes) 213.6 248.8 257.1 265.0 252.7I.4 a) Food Stocks (Million tonnes at end-March) 18.6 50.1 59.8 49.5 41.3
b) Procurement# 39.3 61.3 72.2 56.9 58.0c) Off-take 41.5 57.0 65.9 59.8 56.0
I.5 Index of Industrial Production (% change) 11.2 3.5 1.1 -0.1 2.8I.6 Index of Eight Core Industries (% change) 5.9 5.8 6.5 4.2 3.8I.7 Gross Domestic Saving Rate (% of GNDI at current prices) 32.4 31.4$ 31.1 30.0 ...I.8 Gross Domestic Investment Rate (% of GDP at current prices) 33.6 35.8$ 36.6 32.3 ...
II. PricesII.1 Consumer Price Index (CPI) Combined (Average % Change) ... ... 10.2 9.5 5.9II.2 CPI- Industrial Workers (average % change) 5.0 10.3 10.4 9.7 6.3II.3 Wholesale Price Index (average % change) 5.5 7.1 7.4 6.0 2.0
III. Money and CreditIII.1 Reserve Money (% change) 20.4 12.1 6.2 14.4 11.3III.2 Broad Money (M3) (% change) 18.6 14.7 13.6 13.4 10.8III.3 a) Aggregate Deposits of Scheduled Commercial Banks (% change) 20.2 15.0 14.2 14.1 10.7
b) Bank Credit of Scheduled Commercial Banks (% change) 26.7 16.7 14.1 13.9 9.0IV. Financial Markets
IV.1 Interest rates (%)a) Call / Notice Money rate 5.6 7.2 8.1 8.3 8.0b) 10 year G-Sec yield 7.0 8.0 8.2 8.4 8.3c) 91-Days T-bill yield 8.2 8.9 8.5d) Weighted Average cost of Central Government Borrowings 8.4 8.4 8.5e) Commercial Paper 7.7 8.4 9.2 9.3 8.8f) Certifi cate of Deposits## 8.9 8.2 9.0 9.2 8.7
IV.2 Liquidity ( ` billion)a) LAF Outstanding~ ... ... -1,236.4 -2,179.9 -1,938.8b) MSS Outstanding~~ ... ... 0.0 0.0 0.0c) Average Daily Call Money Market Turnover 184.9 255.3 323.6 302.3 255.7d) Average Daily G-Sec Market Turnover$$ 77.1 241.4 325.1 429.0 501.2e) Variable Rate Repo* 1,200.2 1,628.7f) MSF* 70.0 737.4 416.4
V. Government FinancesV.1 Central Government Finances (% of GDP)@
a) Total Revenue Receipts 9.8 9.0 8.8 8.9 8.8b) Capital Outlay 1.6 1.5 1.5 1.5 1.3c) Total Expenditure 14.7 14.7 14.1 13.7 13.1d) Gross Fiscal Defi cit 3.6 5.3 4.9 4.4 4.0
V.2 State Finances@@a) Revenue Defi cit (% of GDP)** 0.4 0.0 -0.2 0.1 0.1b) Gross Fiscal Defi cit (% of GDP)** 2.7 2.2 2.0 2.2 2.9
c) Primary Defi cit (% of GDP)** 0.3 0.6 0.5 0.7 1.3

APPENDIX TABLES
180
APPENDIX TABLE 1: MACROECONOMIC AND FINANCIAL INDICATORS (Concld.)
Item Average 2003-04
to 2007-08
(5 years)
Average 2009-10
to 2013-14
(5 years)
2012-13 2013-14 2014-15
1 2 3 4 5 6
VI. External Sector
VI.1 Balance of Payments
a) Merchandise Exports (% change) 25.3 12.2 -1.0 3.9 -0.6
b) Merchandise Imports (% change) 32.3 9.7 0.5 -7.2 -1.1
c) Trade Balance/GDP (%) -5.4 -8.9 -10.7 -7.9 -7.0
d) Invisible Balance/GDP (%) 5.1 5.7 5.9 6.1 5.7
e) Current Account Balance/GDP (%) -0.3 -3.2 -4.8 -1.7 -1.3
f) Net Capital Flows /GDP (%) 4.6 3.7 4.9 2.6 4.4
g) Reserve Changes (BoP basis) (US $ billion) [(Increase (-)/Decrease (+)] -40.3 -6.6 -3.8 -15.5 -61.4
VI.2 External Debt Indicators
a) External Debt Stock (US$ billion) 156.5 359.0 409.4 446.3 475.8
b) Debt-GDP Ratio (%) 17.7 20.9 22.3 23.6 23.8
c) Import cover of Reserves (in Months) 14.0 8.5 7.0 7.8 8.9
d) Short-term Debt to Total Debt (%) 14.8 21.4 23.6 20.5 17.8
e) Short-term Debt to Total Debt (%) (residual maturity) 37.6^^ 41.9 44.2 39.6 38.9
f) Debt Service Ratio (%) 8.3 5.6 5.9 5.9 7.5
g) Reserves to Debt (%) 116.9 82.1 71.3 68.2 71.8
VI.3 Openness Indicators (%)
a) Export plus Imports of Goods/GDP 30.4 40.2 44.1 41.9 37.9
b) Export plus Imports of Goods & Services/GDP 40.8 52.2 56.4 54.1 49.4
c) Current Receipts plus Current Payments/GDP 46.6 58.3 62.6 60.6 55.4
d) Gross Capital Infl ows plus Outfl ows/GDP 36.8 49.5 46.5 52.0 49.1
e) Current Receipts & Payments plus Capital Receipts & Payments /GDP 83.5 107.7 109.1 112.6 104.4
VI.4 Exchange Rate Indicators
a) Exchange Rate (Rupee/US Dollar)
End of Period 43.1 51.1 54.4 60.1 62.6
Average 44.1 51.2 54.4 60.5 61.1
b) 36 - Currency REER (% change) 3.1^ 0.8 -4.3 -2.2 5.5
c) 36 - Currency NEER (% change) 1.7^ -4.9 -10.4 -7.7 2.4
d) 6 - Currency REER (% change) 4.4^ 1.8 -3.3 -3.7 6.4
e) 6 - Currency NEER (% change) 1.6^ -5.4 -10.5 -10.4 1.3
... : Not Available. $ : Average of four years.$$ : Outright trading turnover in Central government dated securities (based on calender days).# : Procurement of rice and wheat is based on respective marketing years.## : Data for “Column 2” pertains to April 13, 2007 to March 28, 2008~ : LAF outstanding as on March 31 (negative means injection).~~ : Outstanding as on last Friday of the fi nancial year.* : Outstanding as on March 31. ** : Data from 2013-14 onwards are provisional and pertain to budgets of 25 states. @ : Central Government fi gures for 2014-15 pertain to provisional accounts.@@ : State Government fi gures for 2014-15 pertain to revised estimates.^ : Average of period 2005-06 to 2007-08.^^ : Pertains to end-March 2008.Note : 1. In columns 2 and 3, GDP is based on the old series i.e., base: 2004-05; in other columns, the new series of GDP i.e., base: 2011-12 is
used. 2. Real Effective Exchange Rate (REER) are based on CPI.
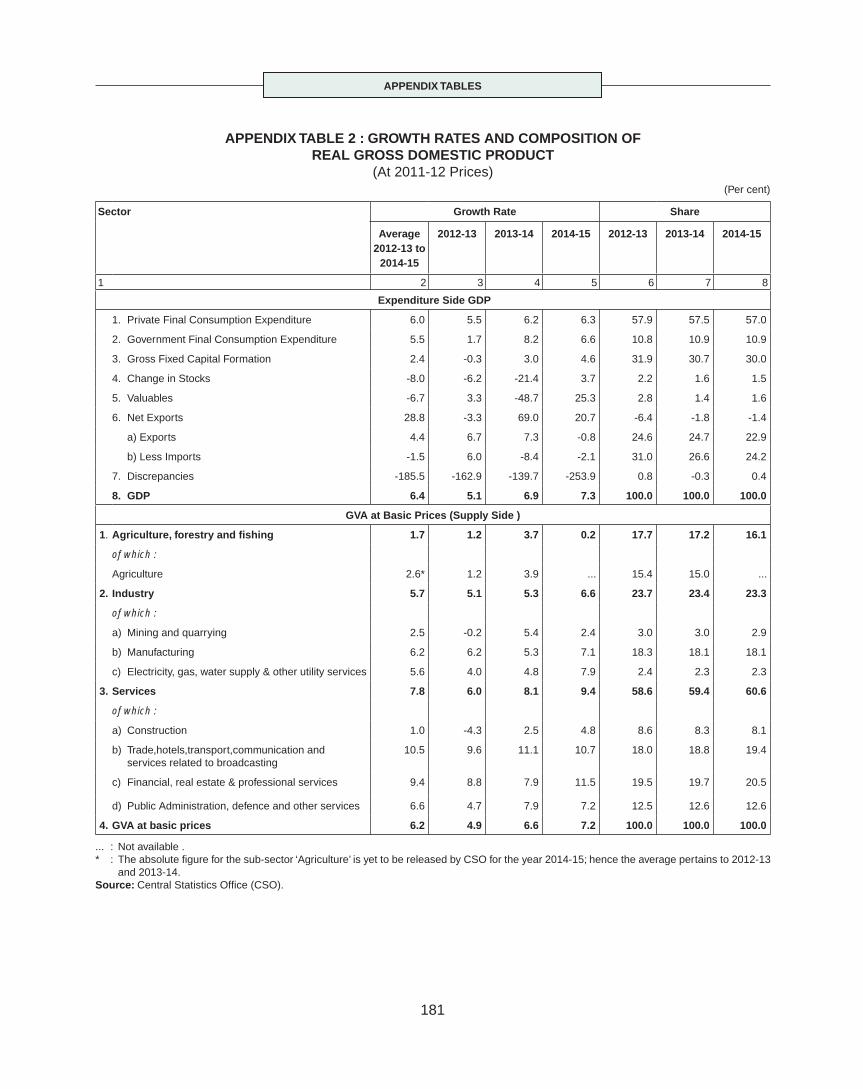
APPENDIX TABLES
181
APPENDIX TABLE 2 : GROWTH RATES AND COMPOSITION OF REAL GROSS DOMESTIC PRODUCT
(At 2011-12 Prices) (Per cent)
Sector Growth Rate Share
Average 2012-13 to
2014-15
2012-13 2013-14 2014-15 2012-13 2013-14 2014-15
1 2 3 4 5 6 7 8
Expenditure Side GDP
1. Private Final Consumption Expenditure 6.0 5.5 6.2 6.3 57.9 57.5 57.0
2. Government Final Consumption Expenditure 5.5 1.7 8.2 6.6 10.8 10.9 10.9
3. Gross Fixed Capital Formation 2.4 -0.3 3.0 4.6 31.9 30.7 30.0
4. Change in Stocks -8.0 -6.2 -21.4 3.7 2.2 1.6 1.5
5. Valuables -6.7 3.3 -48.7 25.3 2.8 1.4 1.6
6. Net Exports 28.8 -3.3 69.0 20.7 -6.4 -1.8 -1.4
a) Exports 4.4 6.7 7.3 -0.8 24.6 24.7 22.9
b) Less Imports -1.5 6.0 -8.4 -2.1 31.0 26.6 24.2
7. Discrepancies -185.5 -162.9 -139.7 -253.9 0.8 -0.3 0.4
8. GDP 6.4 5.1 6.9 7.3 100.0 100.0 100.0
GVA at Basic Prices (Supply Side )
1. Agriculture, forestry and fi shing 1.7 1.2 3.7 0.2 17.7 17.2 16.1
of which :
Agriculture 2.6* 1.2 3.9 ... 15.4 15.0 ...
2. Industry 5.7 5.1 5.3 6.6 23.7 23.4 23.3
of which :
a) Mining and quarrying 2.5 -0.2 5.4 2.4 3.0 3.0 2.9
b) Manufacturing 6.2 6.2 5.3 7.1 18.3 18.1 18.1
c) Electricity, gas, water supply & other utility services 5.6 4.0 4.8 7.9 2.4 2.3 2.3
3. Services 7.8 6.0 8.1 9.4 58.6 59.4 60.6
of which :
a) Construction 1.0 -4.3 2.5 4.8 8.6 8.3 8.1
b) Trade,hotels,transport,communication and services related to broadcasting
10.5 9.6 11.1 10.7 18.0 18.8 19.4
c) Financial, real estate & professional services 9.4 8.8 7.9 11.5 19.5 19.7 20.5
d) Public Administration, defence and other services 6.6 4.7 7.9 7.2 12.5 12.6 12.6
4. GVA at basic prices 6.2 4.9 6.6 7.2 100.0 100.0 100.0
... : Not available .* : The absolute fi gure for the sub-sector ‘Agriculture’ is yet to be released by CSO for the year 2014-15; hence the average pertains to 2012-13
and 2013-14.Source: Central Statistics Offi ce (CSO).

APPENDIX TABLES
182
APPENDIX TABLE 3: INFLATION, MONEY AND CREDIT(Per cent)
Infl ation
Consumer Price Index (All India)** Rural Urban Combined
2012-13 2013-14 2014-15 2012-13 2013-14 2014-15 2012-13 2013-14 2014-15
1 2 3 4 5 6 7 8 9 10
General Index (All Groups) 10.1 9.6 6.2 10.4 9.4 5.7 10.2 9.5 5.9
Food and beverages 11.8 11.2 6.6 12.1 11.0 6.4 11.9 11.1 6.5
Housing ... ... ... 11.3 10.4 6.9 11.3 10.4 6.9
Fuel and light 7.9 7.4 5.1 9.7 7.3 2.7 8.5 7.4 4.2
Miscellaneous 7.2 6.7 4.9 7.5 7.0 4.2 7.3 6.8 4.6
Excluding Food and Fuel 8.0 7.3 5.8 9.4 8.6 5.5 8.7 8.1 5.6
Other Price Indices 2006-07 2007-08 2008-09 2009-10 2010-11 2011-12 2012-13 2013-14 2014-15
1. Wholesale Price Index (2004-05=100)
All Commodities 6.6 4.7 8.1 3.8 9.6 8.9 7.4 6.0 2.0
Primary Articles 9.6 8.3 11.0 12.7 17.7 9.8 9.8 9.8 3.0
of which : Food Articles 9.6 7.0 9.1 15.3 15.6 7.3 9.9 12.8 6.1
Fuel and Power 6.5 0.0 11.6 -2.1 12.3 14.0 10.3 10.2 -0.9
Manufactured Products 5.7 4.8 6.2 2.2 5.7 7.3 5.4 3.0 2.4
Non-Food Manufactured Products 5.7 5.0 5.7 0.2 6.1 7.3 4.9 2.9 2.4
2. CPI- Industrial Workers (IW) (2001=100) 6.7 6.2 9.1 12.4 10.4 8.4 10.4 9.7 6.3
of which : CPI- IW Food 9.2 8.4 12.3 15.2 9.9 6.3 11.9 12.3 6.5
3. CPI- Agricultural Labourers (1986-87=100) 7.8 7.5 10.2 13.9 10.0 8.2 10.0 11.6 6.6
4. CPI- Rural Labourers (1986-87=100) 7.5 7.2 10.2 13.8 10.0 8.3 10.2 11.5 6.9
Money and Credit
2006-07 2007-08 2008-09 2009-10 2010-11 2011-12 2012-13 2013-14 2014-15
Reserve Money 23.9 31.0 6.4 17.0 19.1 3.6 6.2 14.4 11.3
Currency in Circulation 17.3 17.2 17.0 15.7 18.8 12.4 11.6 9.2 11.3
Bankers’ Deposits with RBI 45.6 66.5 -11.3 21.0 20.2 -15.9 -10.0 34.0 8.3
Narrow Money (M1) 17.1 19.4 9.0 18.2 10.0 6.0 9.2 8.5 11.3
Broad Money (M3) 21.7 21.4 19.3 16.9 16.1 13.5 13.6 13.4 10.8
Currency-Deposit Ratio 17.1 16.5 16.1 15.9 16.3 16.1 15.7 15.1 15.2
Money Multiplier* 4.7 4.3 4.9 4.8 4.7 5.2 5.5 5.5 5.5
GDP/M3*$ 1.3 1.2 1.2 1.2 1.2 1.2 1.2 1.2 1.2
Scheduled Commercial Banks
Aggregate Deposits 23.8 22.4 19.9 17.2 15.9 13.5 14.2 14.1 10.7
Bank Credit 28.1 22.3 17.5 16.9 21.5 17.0 14.1 13.9 9.0
Non-food Credit 28.6 23.0 17.8 17.1 21.3 16.8 14.0 14.2 9.3
Credit-Deposit Ratio 73.9 73.9 72.4 72.2 75.7 78.0 77.9 77.8 76.6
Credit-GDP Ratio$ 45.0 47.4 49.3 50.1 50.6 52.2 52.7 52.8 52.1
...: Not Available. *: Ratio. $:GDP data for 2011-12 onwards are based on new series i.e., base: 2011-12.**: Base 2010=100 for 2012-13 and 2013-14, and 2012=100 for 2014-15.Note: Data refer to y-o-y change in per cent unless specifi ed otherwise.
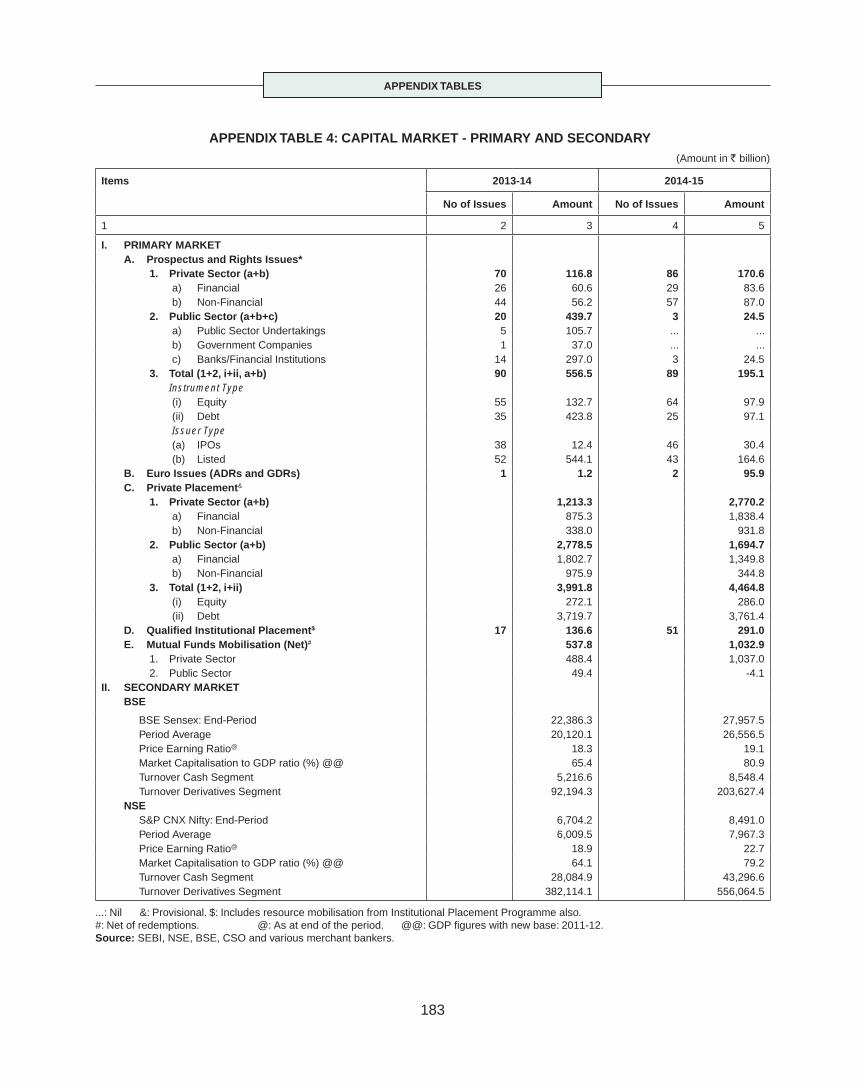
APPENDIX TABLES
183
APPENDIX TABLE 4: CAPITAL MARKET - PRIMARY AND SECONDARY (Amount in ` billion)
Items 2013-14 2014-15
No of Issues Amount No of Issues Amount
1 2 3 4 5
I. PRIMARY MARKETA. Prospectus and Rights Issues*
1. Private Sector (a+b) 70 116.8 86 170.6 a) Financial 26 60.6 29 83.6 b) Non-Financial 44 56.2 57 87.0
2. Public Sector (a+b+c) 20 439.7 3 24.5 a) Public Sector Undertakings 5 105.7 ... ... b) Government Companies 1 37.0 ... ... c) Banks/Financial Institutions 14 297.0 3 24.5
3. Total (1+2, i+ii, a+b) 90 556.5 89 195.1Instrument Type (i) Equity 55 132.7 64 97.9 (ii) Debt 35 423.8 25 97.1 Issuer Type (a) IPOs 38 12.4 46 30.4 (b) Listed 52 544.1 43 164.6
B. Euro Issues (ADRs and GDRs) 1 1.2 2 95.9C. Private Placement&
1. Private Sector (a+b) 1,213.3 2,770.2 a) Financial 875.3 1,838.4 b) Non-Financial 338.0 931.8
2. Public Sector (a+b) 2,778.5 1,694.7 a) Financial 1,802.7 1,349.8 b) Non-Financial 975.9 344.8
3. Total (1+2, i+ii) 3,991.8 4,464.8 (i) Equity 272.1 286.0 (ii) Debt 3,719.7 3,761.4
D. Qualifi ed Institutional Placement$ 17 136.6 51 291.0E. Mutual Funds Mobilisation (Net)# 537.8 1,032.9
1. Private Sector 488.4 1,037.0 2. Public Sector 49.4 -4.1
II. SECONDARY MARKETBSE
BSE Sensex: End-Period 22,386.3 27,957.5Period Average 20,120.1 26,556.5Price Earning Ratio@ 18.3 19.1Market Capitalisation to GDP ratio (%) @@ 65.4 80.9Turnover Cash Segment 5,216.6 8,548.4Turnover Derivatives Segment 92,194.3 203,627.4
NSES&P CNX Nifty: End-Period 6,704.2 8,491.0Period Average 6,009.5 7,967.3Price Earning Ratio@ 18.9 22.7Market Capitalisation to GDP ratio (%) @@ 64.1 79.2Turnover Cash Segment 28,084.9 43,296.6Turnover Derivatives Segment 382,114.1 556,064.5
...: Nil &: Provisional. $: Includes resource mobilisation from Institutional Placement Programme also. #: Net of redemptions. @: As at end of the period. @@: GDP fi gures with new base: 2011-12.Source: SEBI, NSE, BSE, CSO and various merchant bankers.

APPENDIX TABLES
184
APPENDIX TABLE 5: KEY FISCAL INDICATORS
(As per cent to GDP)
Year Primary Defi cit Revenue Defi cit Primary Revenue Defi cit
Gross Fiscal Defi cit
Outstanding Liabilities@
Outstanding Liabilities$
1 2 3 4 5 6 7
Centre
1990-91 3.9 3.2 -0.5 7.6 53.7 59.61995-96 0.8 2.4 -1.7 4.9 49.4 57.32000-01 0.9 3.9 -0.6 5.5 53.9 59.42007-08 -0.9 1.1 -2.4 2.5 56.9 58.92008-09 2.6 4.5 1.1 6.0 56.1 58.62009-10 3.2 5.2 1.9 6.5 54.5 56.32010-11 1.8 3.2 0.2 4.8 50.5 52.12011-12 2.8 4.5 1.4 5.8 51.1 52.92012-13 1.8 3.7 0.5 4.9 50.8 52.32013-14 1.1 3.1 -0.2 4.4 50.0 51.72014-15 RE 0.8 2.9 -0.4 4.1 50.1 51.72014-15 PA 0.8 2.9 -0.4 4.0 ... ...2015-16 BE 0.7 2.8 -0.4 3.9 48.9 50.3
States*
1990-91 1.7 0.9 -0.6 3.2 21.9 21.91995-96 0.7 0.7 -1.1 2.5 20.3 20.32000-01 1.7 2.5 0.2 4.0 27.3 27.32007-08 -0.5 -0.9 -2.9 1.5 26.6 26.62008-09 0.6 -0.2 -2.1 2.4 26.1 26.12009-10 1.2 0.5 -1.3 2.9 25.5 25.52010-11 0.5 0.0 -1.6 2.1 23.5 23.52011-12 0.4 -0.3 -1.8 1.9 22.6 22.62012-13 0.5 -0.2 -1.7 2.0 22.1 22.12013-14 0.7 0.1 -1.4 2.2 21.4 21.42014-15 RE 1.3 0.1 -1.4 2.9 21.8 21.82015-16 BE 0.8 -0.4 -1.9 2.3 21.6 21.6
Combined*
1990-91 4.9 4.1 -0.2 9.1 62.9 68.91995-96 1.5 3.1 -1.7 6.3 59.4 67.32000-01 3.5 6.4 0.6 9.2 68.2 73.72007-08 -1.2 0.2 -5.0 4.0 69.5 71.42008-09 3.3 4.3 -0.8 8.3 69.7 72.22009-10 4.5 5.7 2.4 9.3 68.8 70.62010-11 2.4 3.2 -1.3 6.9 64.0 65.52011-12 3.2 4.1 -0.3 7.8 64.9 66.62012-13 2.3 3.4 -1.1 6.9 64.8 66.32013-14 1.9 3.3 -1.4 6.6 64.3 66.02014-15 RE 2.2 3.0 -1.7 6.9 65.3 67.02015-16 BE 1.5 2.4 -2.3 6.3 64.6 66.1
...: Not Available. PA: Provisional Accounts. RE: Revised Estimates. BE: Budget Estimates.* : Data from 2013-14 onwards are provisional and pertains to budgets of 25 states.@: Includes external liabilities of the centre calculated at historical exchange rates.$: Includes external liabilities of the centre calculated at current exchange rates.Note: 1. Data on combined defi cit/liabilities indicators are net of inter-governmental transactions between the Centre and the State governments
viz., (a) NSSF investment in State governments special securities (b) Loans and advance by the Centre to States and (c) State governments’ investment in Centre’s treasury bills.
2. Negative sign (-) indicates surplus in defi cit indicators. 3. GDP data from 2011-12 onwards are based on new base 2011-12.Source: Budget documents of the Central and State governments.
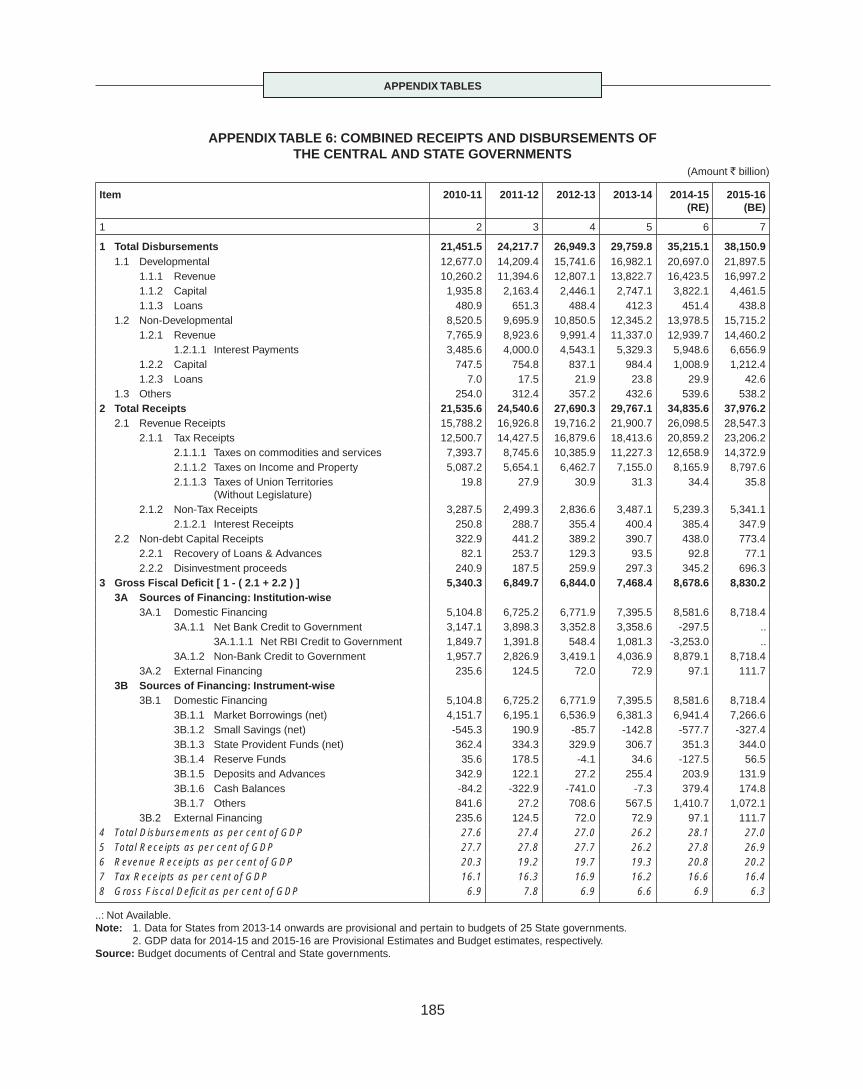
APPENDIX TABLES
185
APPENDIX TABLE 6: COMBINED RECEIPTS AND DISBURSEMENTS OF THE CENTRAL AND STATE GOVERNMENTS
(Amount ` billion)
Item 2010-11 2011-12 2012-13 2013-14 2014-15 (RE)
2015-16 (BE)
1 2 3 4 5 6 7
1 Total Disbursements 21,451.5 24,217.7 26,949.3 29,759.8 35,215.1 38,150.9 1.1 Developmental 12,677.0 14,209.4 15,741.6 16,982.1 20,697.0 21,897.5 1.1.1 Revenue 10,260.2 11,394.6 12,807.1 13,822.7 16,423.5 16,997.2 1.1.2 Capital 1,935.8 2,163.4 2,446.1 2,747.1 3,822.1 4,461.5 1.1.3 Loans 480.9 651.3 488.4 412.3 451.4 438.8 1.2 Non-Developmental 8,520.5 9,695.9 10,850.5 12,345.2 13,978.5 15,715.2 1.2.1 Revenue 7,765.9 8,923.6 9,991.4 11,337.0 12,939.7 14,460.2 1.2.1.1 Interest Payments 3,485.6 4,000.0 4,543.1 5,329.3 5,948.6 6,656.9 1.2.2 Capital 747.5 754.8 837.1 984.4 1,008.9 1,212.4 1.2.3 Loans 7.0 17.5 21.9 23.8 29.9 42.6 1.3 Others 254.0 312.4 357.2 432.6 539.6 538.22 Total Receipts 21,535.6 24,540.6 27,690.3 29,767.1 34,835.6 37,976.2 2.1 Revenue Receipts 15,788.2 16,926.8 19,716.2 21,900.7 26,098.5 28,547.3 2.1.1 Tax Receipts 12,500.7 14,427.5 16,879.6 18,413.6 20,859.2 23,206.2 2.1.1.1 Taxes on commodities and services 7,393.7 8,745.6 10,385.9 11,227.3 12,658.9 14,372.9 2.1.1.2 Taxes on Income and Property 5,087.2 5,654.1 6,462.7 7,155.0 8,165.9 8,797.6 2.1.1.3 Taxes of Union Territories (Without Legislature)
19.8 27.9 30.9 31.3 34.4 35.8
2.1.2 Non-Tax Receipts 3,287.5 2,499.3 2,836.6 3,487.1 5,239.3 5,341.1 2.1.2.1 Interest Receipts 250.8 288.7 355.4 400.4 385.4 347.9 2.2 Non-debt Capital Receipts 322.9 441.2 389.2 390.7 438.0 773.4 2.2.1 Recovery of Loans & Advances 82.1 253.7 129.3 93.5 92.8 77.1 2.2.2 Disinvestment proceeds 240.9 187.5 259.9 297.3 345.2 696.33 Gross Fiscal Defi cit [ 1 - ( 2.1 + 2.2 ) ] 5,340.3 6,849.7 6,844.0 7,468.4 8,678.6 8,830.2 3A Sources of Financing: Institution-wise 3A.1 Domestic Financing 5,104.8 6,725.2 6,771.9 7,395.5 8,581.6 8,718.4 3A.1.1 Net Bank Credit to Government 3,147.1 3,898.3 3,352.8 3,358.6 -297.5 .. 3A.1.1.1 Net RBI Credit to Government 1,849.7 1,391.8 548.4 1,081.3 -3,253.0 .. 3A.1.2 Non-Bank Credit to Government 1,957.7 2,826.9 3,419.1 4,036.9 8,879.1 8,718.4 3A.2 External Financing 235.6 124.5 72.0 72.9 97.1 111.7 3B Sources of Financing: Instrument-wise 3B.1 Domestic Financing 5,104.8 6,725.2 6,771.9 7,395.5 8,581.6 8,718.4 3B.1.1 Market Borrowings (net) 4,151.7 6,195.1 6,536.9 6,381.3 6,941.4 7,266.6 3B.1.2 Small Savings (net) -545.3 190.9 -85.7 -142.8 -577.7 -327.4 3B.1.3 State Provident Funds (net) 362.4 334.3 329.9 306.7 351.3 344.0 3B.1.4 Reserve Funds 35.6 178.5 -4.1 34.6 -127.5 56.5 3B.1.5 Deposits and Advances 342.9 122.1 27.2 255.4 203.9 131.9 3B.1.6 Cash Balances -84.2 -322.9 -741.0 -7.3 379.4 174.8 3B.1.7 Others 841.6 27.2 708.6 567.5 1,410.7 1,072.1 3B.2 External Financing 235.6 124.5 72.0 72.9 97.1 111.74 Total Disbursements as per cent of GDP 27.6 27.4 27.0 26.2 28.1 27.05 Total Receipts as per cent of GDP 27.7 27.8 27.7 26.2 27.8 26.96 Revenue Receipts as per cent of GDP 20.3 19.2 19.7 19.3 20.8 20.27 Tax Receipts as per cent of GDP 16.1 16.3 16.9 16.2 16.6 16.48 Gross Fiscal Defi cit as per cent of GDP 6.9 7.8 6.9 6.6 6.9 6.3
..: Not Available.Note: 1. Data for States from 2013-14 onwards are provisional and pertain to budgets of 25 State governments. 2. GDP data for 2014-15 and 2015-16 are Provisional Estimates and Budget estimates, respectively. Source: Budget documents of Central and State governments.

APPENDIX TABLES
186
APPENDIX TABLE 7: INDIA’S OVERALL BALANCE OF PAYMENTS(US $ million)
2010-11 2011-12 2012-13 2013-14 2014-15P
1 2 3 4 5 6
A. CURRENT ACCOUNT
1 Exports, f.o.b. 256,159 309,774 306,581 318,607 316,741
2 Imports, c.i.f. 383,481 499,533 502,237 466,216 460,920
3 Trade Balance -127,322 -189,759 -195,656 -147,609 -144,179
4 Invisibles, Net 79,269 111,604 107,493 115,212 116,242
a) ‘Non-Factor’ Services of which : 44,081 64,098 64,915 72,965 75,683
Software Services 50,905 60,957 63,504 66,958 70,400
b) Income -17,952 -15,988 -21,455 -23,028 -24,983
c) Private Transfers 53,125 63,469 64,342 65,481 66,275
5 Current Account Balance -48,053 -78,155 -88,163 -32,397 -27,937
B. CAPITAL ACCOUNT
1 Foreign Investment, Net (a+b) 42,127 39,231 46,711 26,386 73,561
a) Direct Investment 11,834 22,061 19,819 21,564 32,627
b) Portfolio Investment 30,293 17,170 26,891 4,822 40,934
2 External Assistance, Net 4,941 2,296 982 1,032 1,630
3 Commercial Borrowings, Net 12,160 10,344 8,485 11,777 2,729
4 Short Term Credit, Net 12,034 6,668 21,657 -5,044 -924
5 Banking Capital of which : 4,962 16,226 16,570 25,449 11,618
NRI Deposits, Net 3,238 11,918 14,842 38,892 14,057
6 Rupee Debt Service -68 -79 -58 -52 -81
7 Other Capital, Net @ -12,416 -6,929 -5,047 -10,761 1,426
8 Total Capital Account 63,740 67,755 89,300 48,787 89,959
C. Errors & Omissions -2,636 -2,432 2,689 -882 -616
D. Overall Balance [A(5)+B(8)+C] 13,050 -12,831 3,826 15,508 61,406
E. Monetary Movements (F+G) -13,050 12,831 -3,826 -15,508 -61,406
F. IMF, Net
G. Reserves and Monetary Gold (Increase -, Decrease +) of which : SDR allocation
-13,050 12,831 -3,826 -15,508 -61,406
Memo: As a ratio to GDP
1 Trade Balance -7.5 -10.3 -10.7 -7.9 -7.0
2 Net Services 2.6 3.5 3.5 3.9 3.7
3 Net Income -1.1 -0.9 -1.2 -1.2 -1.2
4 Current Account Balance -2.8 -4.2 -4.8 -1.7 -1.3
5 Capital Net (Excld. changes in reserves) 4.5 3.0 5.1 3.4 7.4
6 Foreign Investment, Net 2.5 2.1 2.5 1.4 3.6
P: Provisional. @: Includes delayed export receipts, advance payments against imports, net funds held abroad and advances received pending issue of shares
under FDI.Note: 1. Gold and silver brought by returning Indians have been included under imports, with a contra entry in private transfer receipts. 2. Data on exports and imports differ from those given by DGCI&S on account of differences in coverage, valuation and timing.

APPENDIX TABLES
187
APPENDIX TABLE 8: FOREIGN DIRECT INVESTMENT FLOWS TO INDIA: COUNTRY-WISE ANDINDUSTRY-WISE
(US $ million)
Source/Industry 2010-11 2011-12 2012-13 2013-14 2014-15 P
1 2 3 4 5 6
Total FDI 14,939 23,473 18,286 16,054 24,748
Country-wise Infl ows
Mauritius 5,616 8,142 8,059 3,695 5,878
Singapore 1,540 3,306 1,605 4,415 5,137
U.S.A 1,071 994 478 617 1,981
Cyprus 571 1,568 415 546 737
Japan 1,256 2,089 1,340 1,795 2,019
Netherlands 1,417 1,289 1,700 1,157 2,154
United Kingdom 538 2,760 1,022 111 1,891
Germany 163 368 467 650 942
UAE 188 346 173 239 327
France 486 589 547 229 347
Switzerland 133 211 268 356 292
Hongkong 209 262 66 85 325
Spain 183 251 348 181 401
China 2 73 148 121 505
Malaysia 40 18 238 113 219
South Korea 136 226 224 189 138
Luxembourg 248 89 34 539 204
Others 1,142 892 1,154 1,015 1,250
Sector-wise Infl ows
Manufacturing 4,793 9,337 6,528 6,381 9,613
Construction 1,599 2,634 1,319 1,276 1,640
Financial Services 1,353 2,603 2,760 1,026 3,075
Real Estate Activities 444 340 197 201 202
Electricity and other Energy Generation, Distribution & Transmission 1,338 1,395 1,653 1,284 1,284
Communication Services 1,228 1,458 92 1,256 1,075
Business Services 569 1,590 643 521 680
Miscellaneous Services 509 801 552 941 586
Computer Services 843 736 247 934 2,154
Restaurants and Hotels 218 870 3,129 361 686
Retail & Wholesale Trade 391 567 551 1,139 2,551
Mining 592 204 69 24 129
Transportation 344 410 213 311 482
Trading 156 6 140 0 228
Education, Research & Development 56 103 150 107 131
Others 506 419 43 293 232
P: Provisional.Note : Includes FDI through SIA/FIPB and RBI routes only.